
Legality Constraints: The Emergence of a Dual Market for Tropical Timber Products?


Abstract
:1. Introduction
- the state of the timber flows at global level over the 2001–2013 period, with a focus on tropical timber and timber-based products;
- the changes in timber flows to the EU, the USA, and Australian markets from 2001 to 2013, a period that includes the years of discussions, preparation, adoption, and eventual implementation of their respective legality verification systems (i.e., the EUTR of 2103, the Lacey Act amendment of 2008, and the Australian Illegal Logging Prohibition Act of 2012), and the corresponding changes in timber flows and market structure in selected emerging economies without specific legality verification regulations;
- the magnitude of the possible ensuing dual market and the potential driving forces behind it.
2. Methodology
2.1. Product Selection

| Commodity Groups and Sub-Groups | Short Description | CN Code |
|---|---|---|
| Logs or roundwood | Wood in the rough or roughly squared | 4403 |
| Meranti Red Dark | Dark Red Meranti, Light Red Meranti, and Meranti Bakau | 440341 |
| Other tropical wood not elsewhere specified (n.e.s.) | Tropical wood logs (not elsewhere specified) | 440349 |
| Sawnwood | Wood sawn, chipped lengthwise, sliced or peeled | 4407 |
| Mahogany (Swietenia spp.) | Mahogany (Swietenia spp.), sawn or chipped lengthwise, sliced or peeled | 440721 |
| Virola, Imbuia and Balsa | Virola/Imbuia and Balsa wood sawn or chipped lengthwise, sliced or peeled | 440722 |
| Baboen, Mahogany, Imbuia, Balsa | Baboen, Mahogany (Swietenia spp.), Imbuia, Balsa wood sawn or chipped lengthwise, sliced or peeled | 440723 |
| Virola, Mahogany | Virola, Mahogany (Swietenia spp.), sawn or chipped lengthwise, sliced or peeled | 440724 |
| Meranti Red Dark | Dark Red Meranti, Light Red Meranti, and Meranti Bakau, sawn or chipped lengthwise, sliced or peeled | 440725 |
| White Lauan, White Meranti, White Seraya, Yellow Meranti and Alan | White Lauan, White Meranti, White Seraya, Yellow Meranti, and Alan, sawn or chipped lengthwise, sliced or peeled | 440726 |
| Virola, Mahogany (Swietenia spp.), Imbuia and Balsa | Virola, Mahogany (Swietenia spp.), Imbuia, and Balsa, non-coniferous species, sawn or chipped lengthwise, sliced | 440727 |
| Iroko | Iroko wood sawn or chipped lengthwise, sliced or peeled, over 6 mm thick | 440728 |
| Other tropical wood n.e.s. | Tropical sawnwood (not elsewhere specified) | 440729 |
| Veneers | Veneers and sheets for plywood, etc. <6 mm thick | 4408 |
| Meranti Red Dark | Dark Red Meranti, Light Red Meranti, and Meranti Bakau, veneer or plywood sheets | 440831 |
| Other tropical wood n.e.s. | Tropical wood veneers (not elsewhere specified) | 440839 |
| Plywood | Plywood, veneered panels, and similar laminated wood | 4412 |
| Plywood, all wood | Plywood all wood, each ≤6 mm, with at least one outer ply of tropical wood | 441213 |
| Plywood, outer ply of tropical wood | Plywood not all wood and/or at least one ply >6 mm, with at least one outer ply of tropical wood | 441222 |
| Plywood n.e.s., 1-ply tropic | Plywood not all wood and/or at least one ply >6 mm, with at least one outer ply of non-coniferous tropical wood | 441229 |
| Plywood, outer ply of other tropical wood | Plywood not all wood and/or at least one ply >6 mm, with at least one outer ply of other tropical wood | 441231 |
2.2. Country Selection
| Country | Illegal Timber Import Rates (%) (i.e., % of Illegally Imported Timber over Total Imports) | Sources |
|---|---|---|
| Australia | 9 | [40] |
| China | 20–26 | [41] |
| EU-28 | 16–19 | [5] |
| India | 17 | [38] |
| USA | 10 * | [42] |
| Vietnam | 20 | [41] |
3. Results
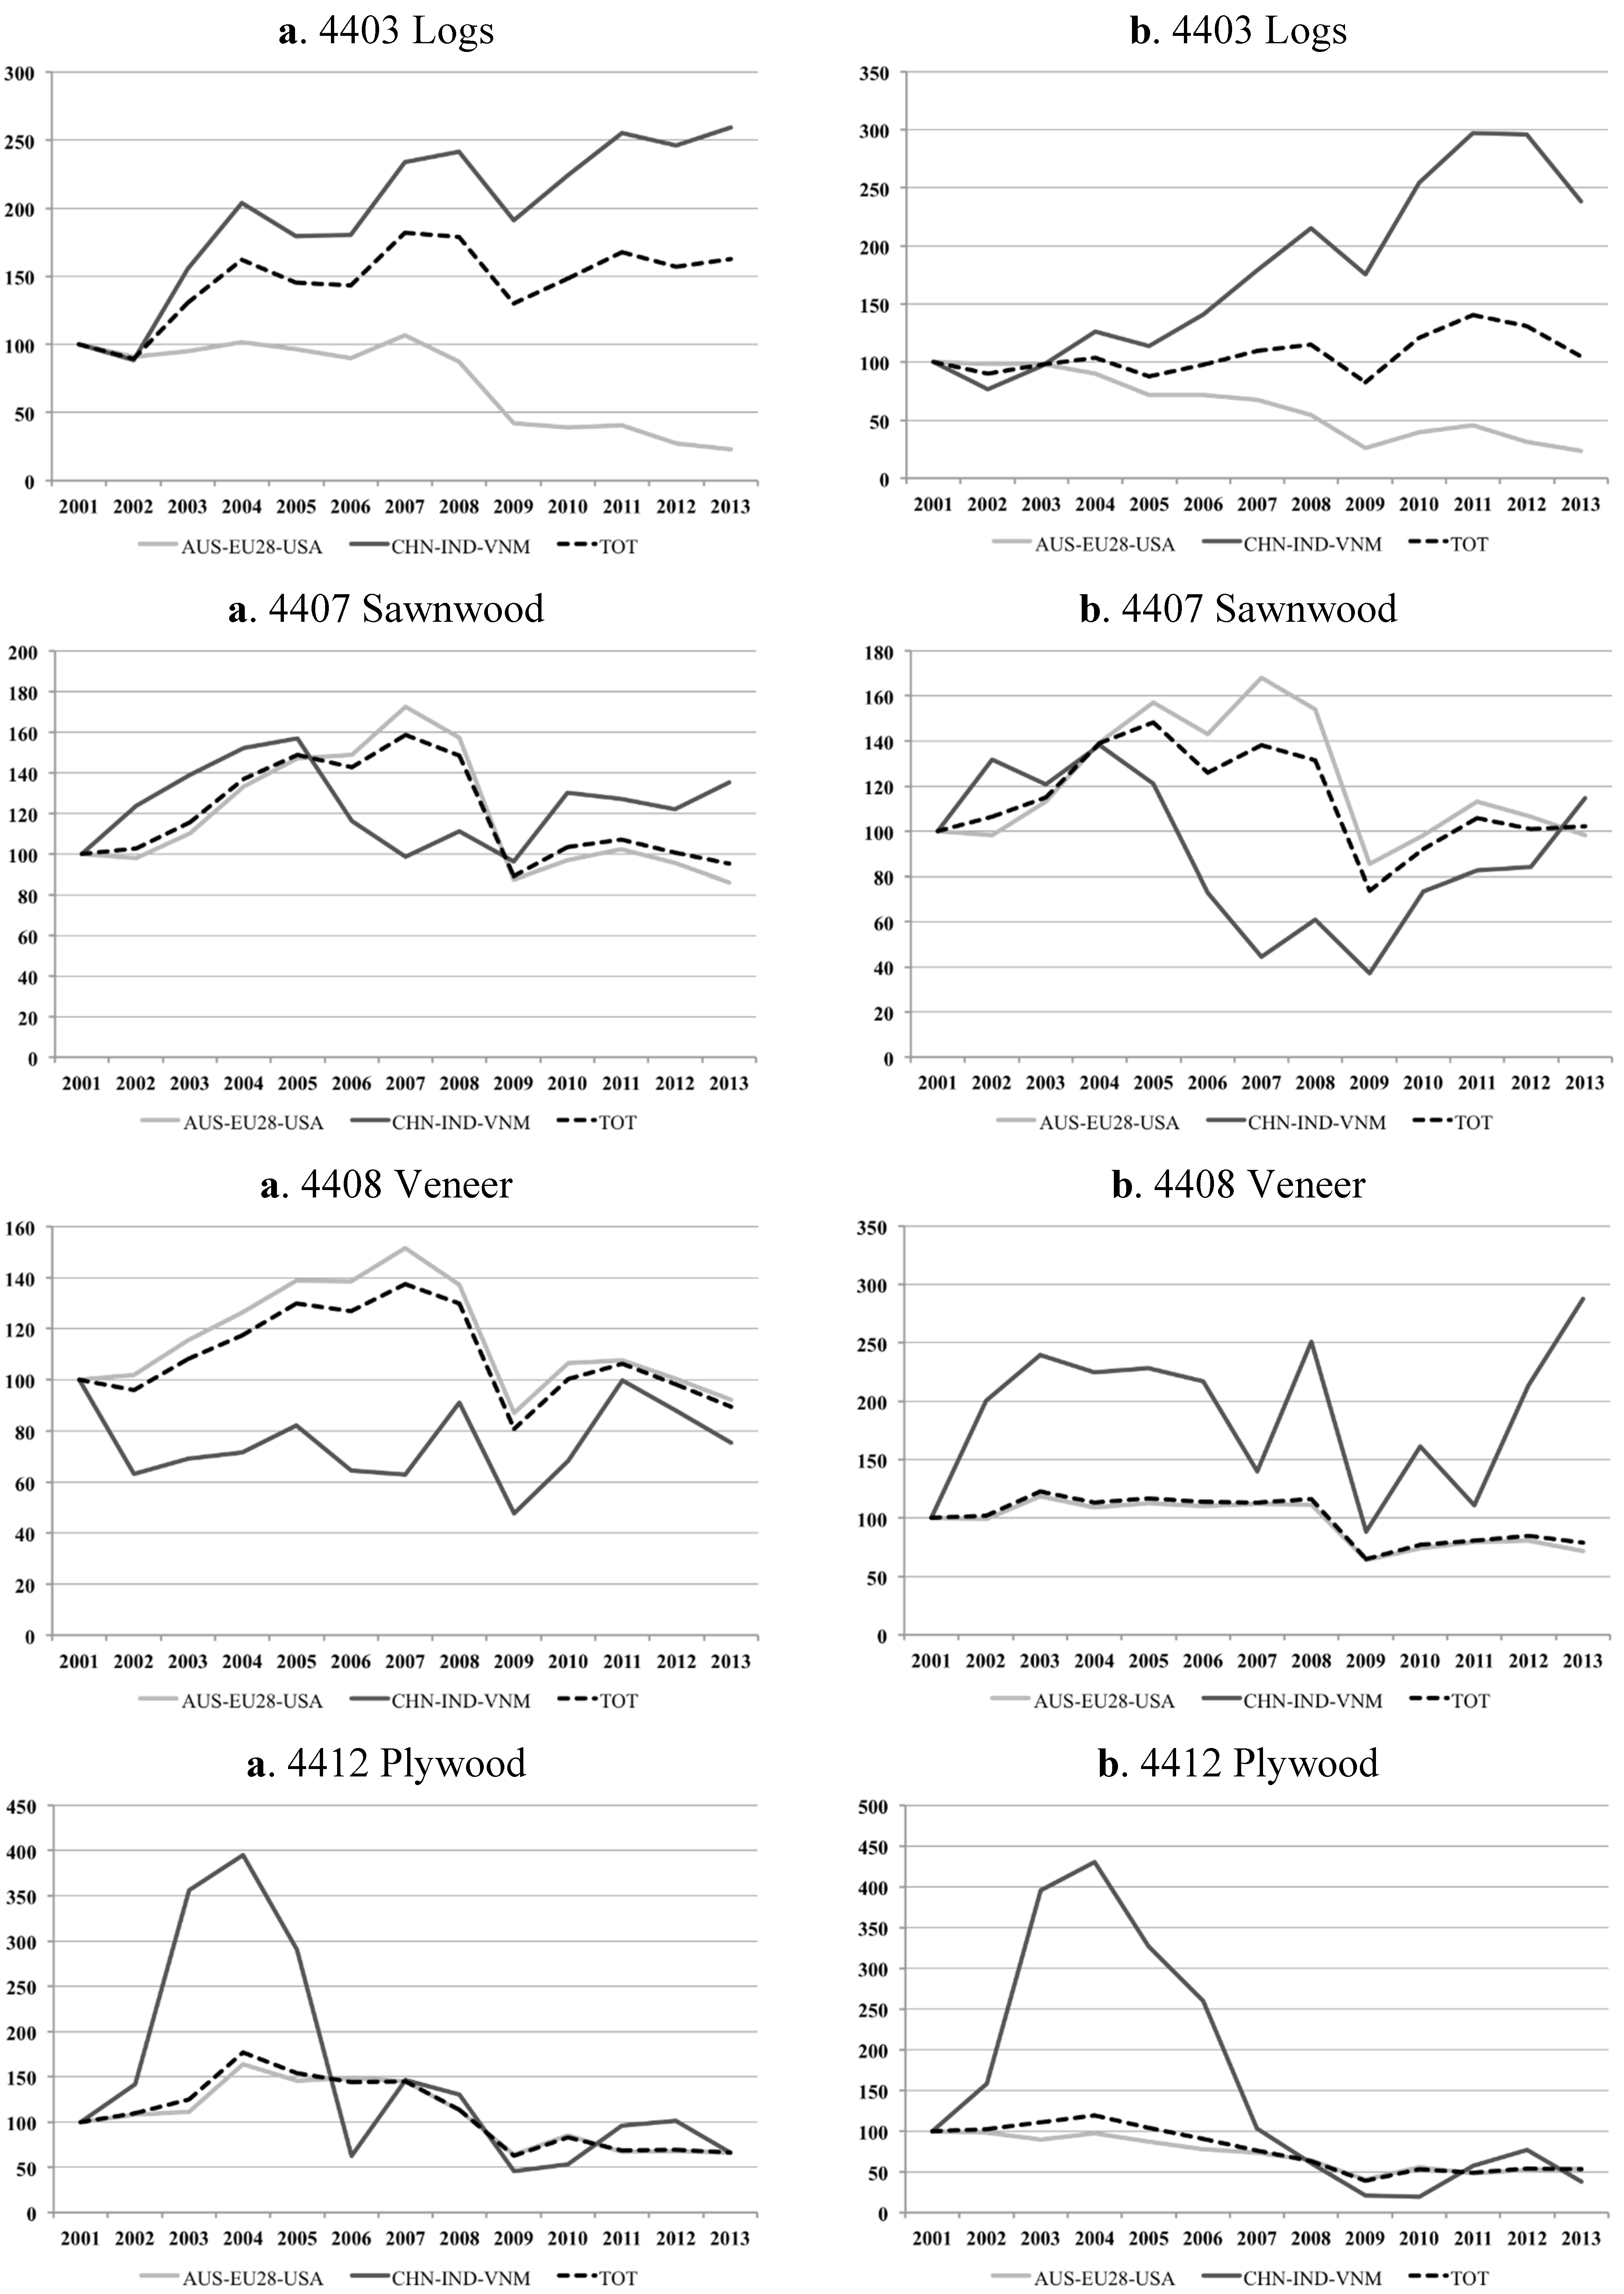
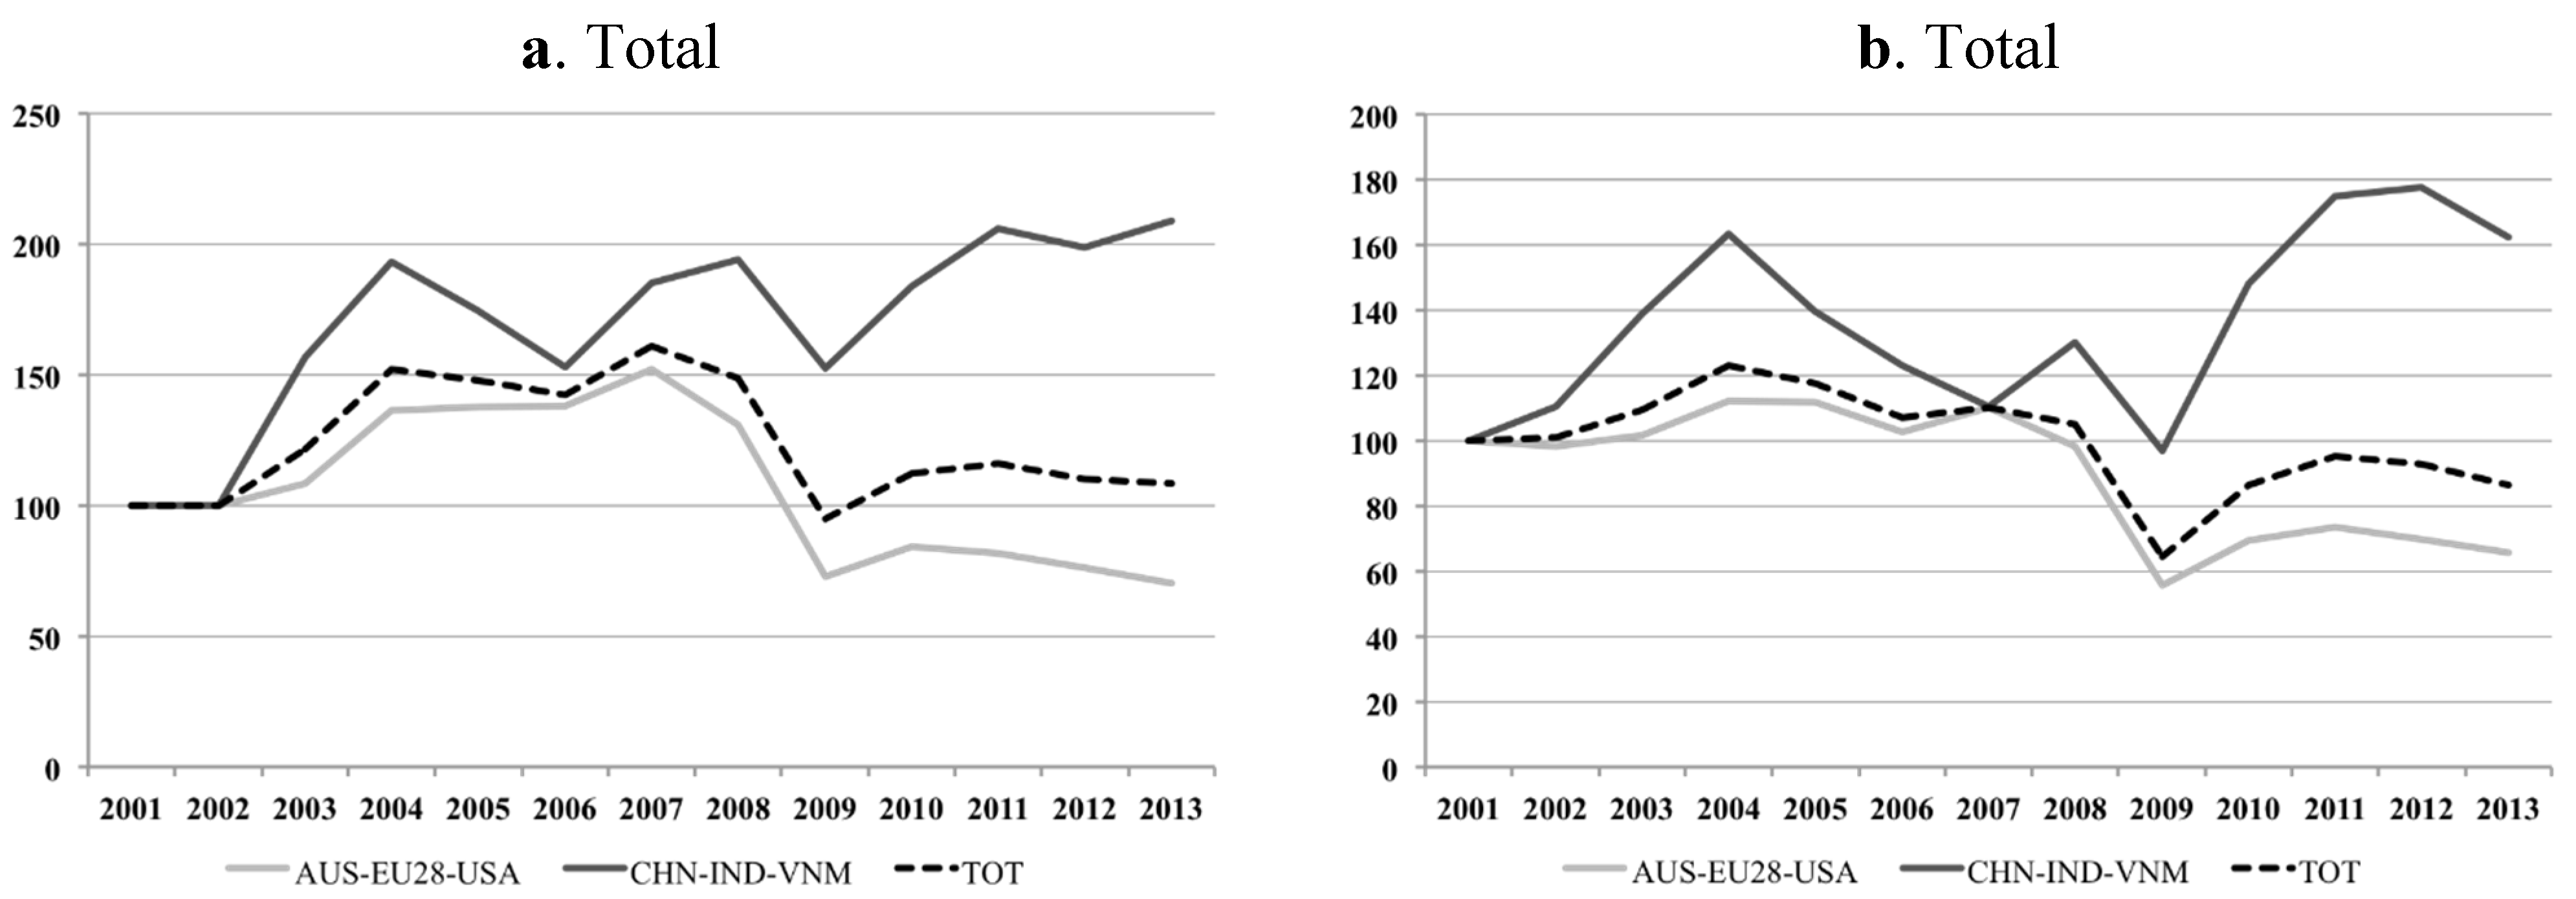
3.1. Tropical Timber Trade Trends
| CN Code | 2001 | 2013 | 2001–2013 % Variation | |||||||
|---|---|---|---|---|---|---|---|---|---|---|
| Volume (CUM *) | % on T | Value (1000 USD) | % on T | Volume (CUM) | % on T | Value (1000 USD) | % on T | Volume | Value | |
| 4403 | 7,106,094 | 29.6 | 1,436,237 | 16.8 | 5,794,423 | 27.8 | 2,115,648 | 23.6 | −18.5 | 47.3 |
| 4407 | 9,656,470 | 40.2 | 4,277,011 | 49.9 | 8,685,690 | 41.7 | 3,346,510 | 37.3 | −10.1 | −21.8 |
| 4408 | 701,386 | 2.9 | 420,014 | 4.9 | 415,078 | 2.0 | 464,118 | 5.2 | −40.8 | 10.5 |
| 4412 | 6,531,104 | 27.2 | 2,434,184 | 28.4 | 5,945,741 | 28.5 | 3,044,304 | 33.9 | −9.0 | 25.1 |
| Total (T) | 23,995,054 | 100.0 | 8,567,446 | 100.0 | 20,840,932 | 100.0 | 8,970,580 | 100.0 | −13.1 | 4.7 |
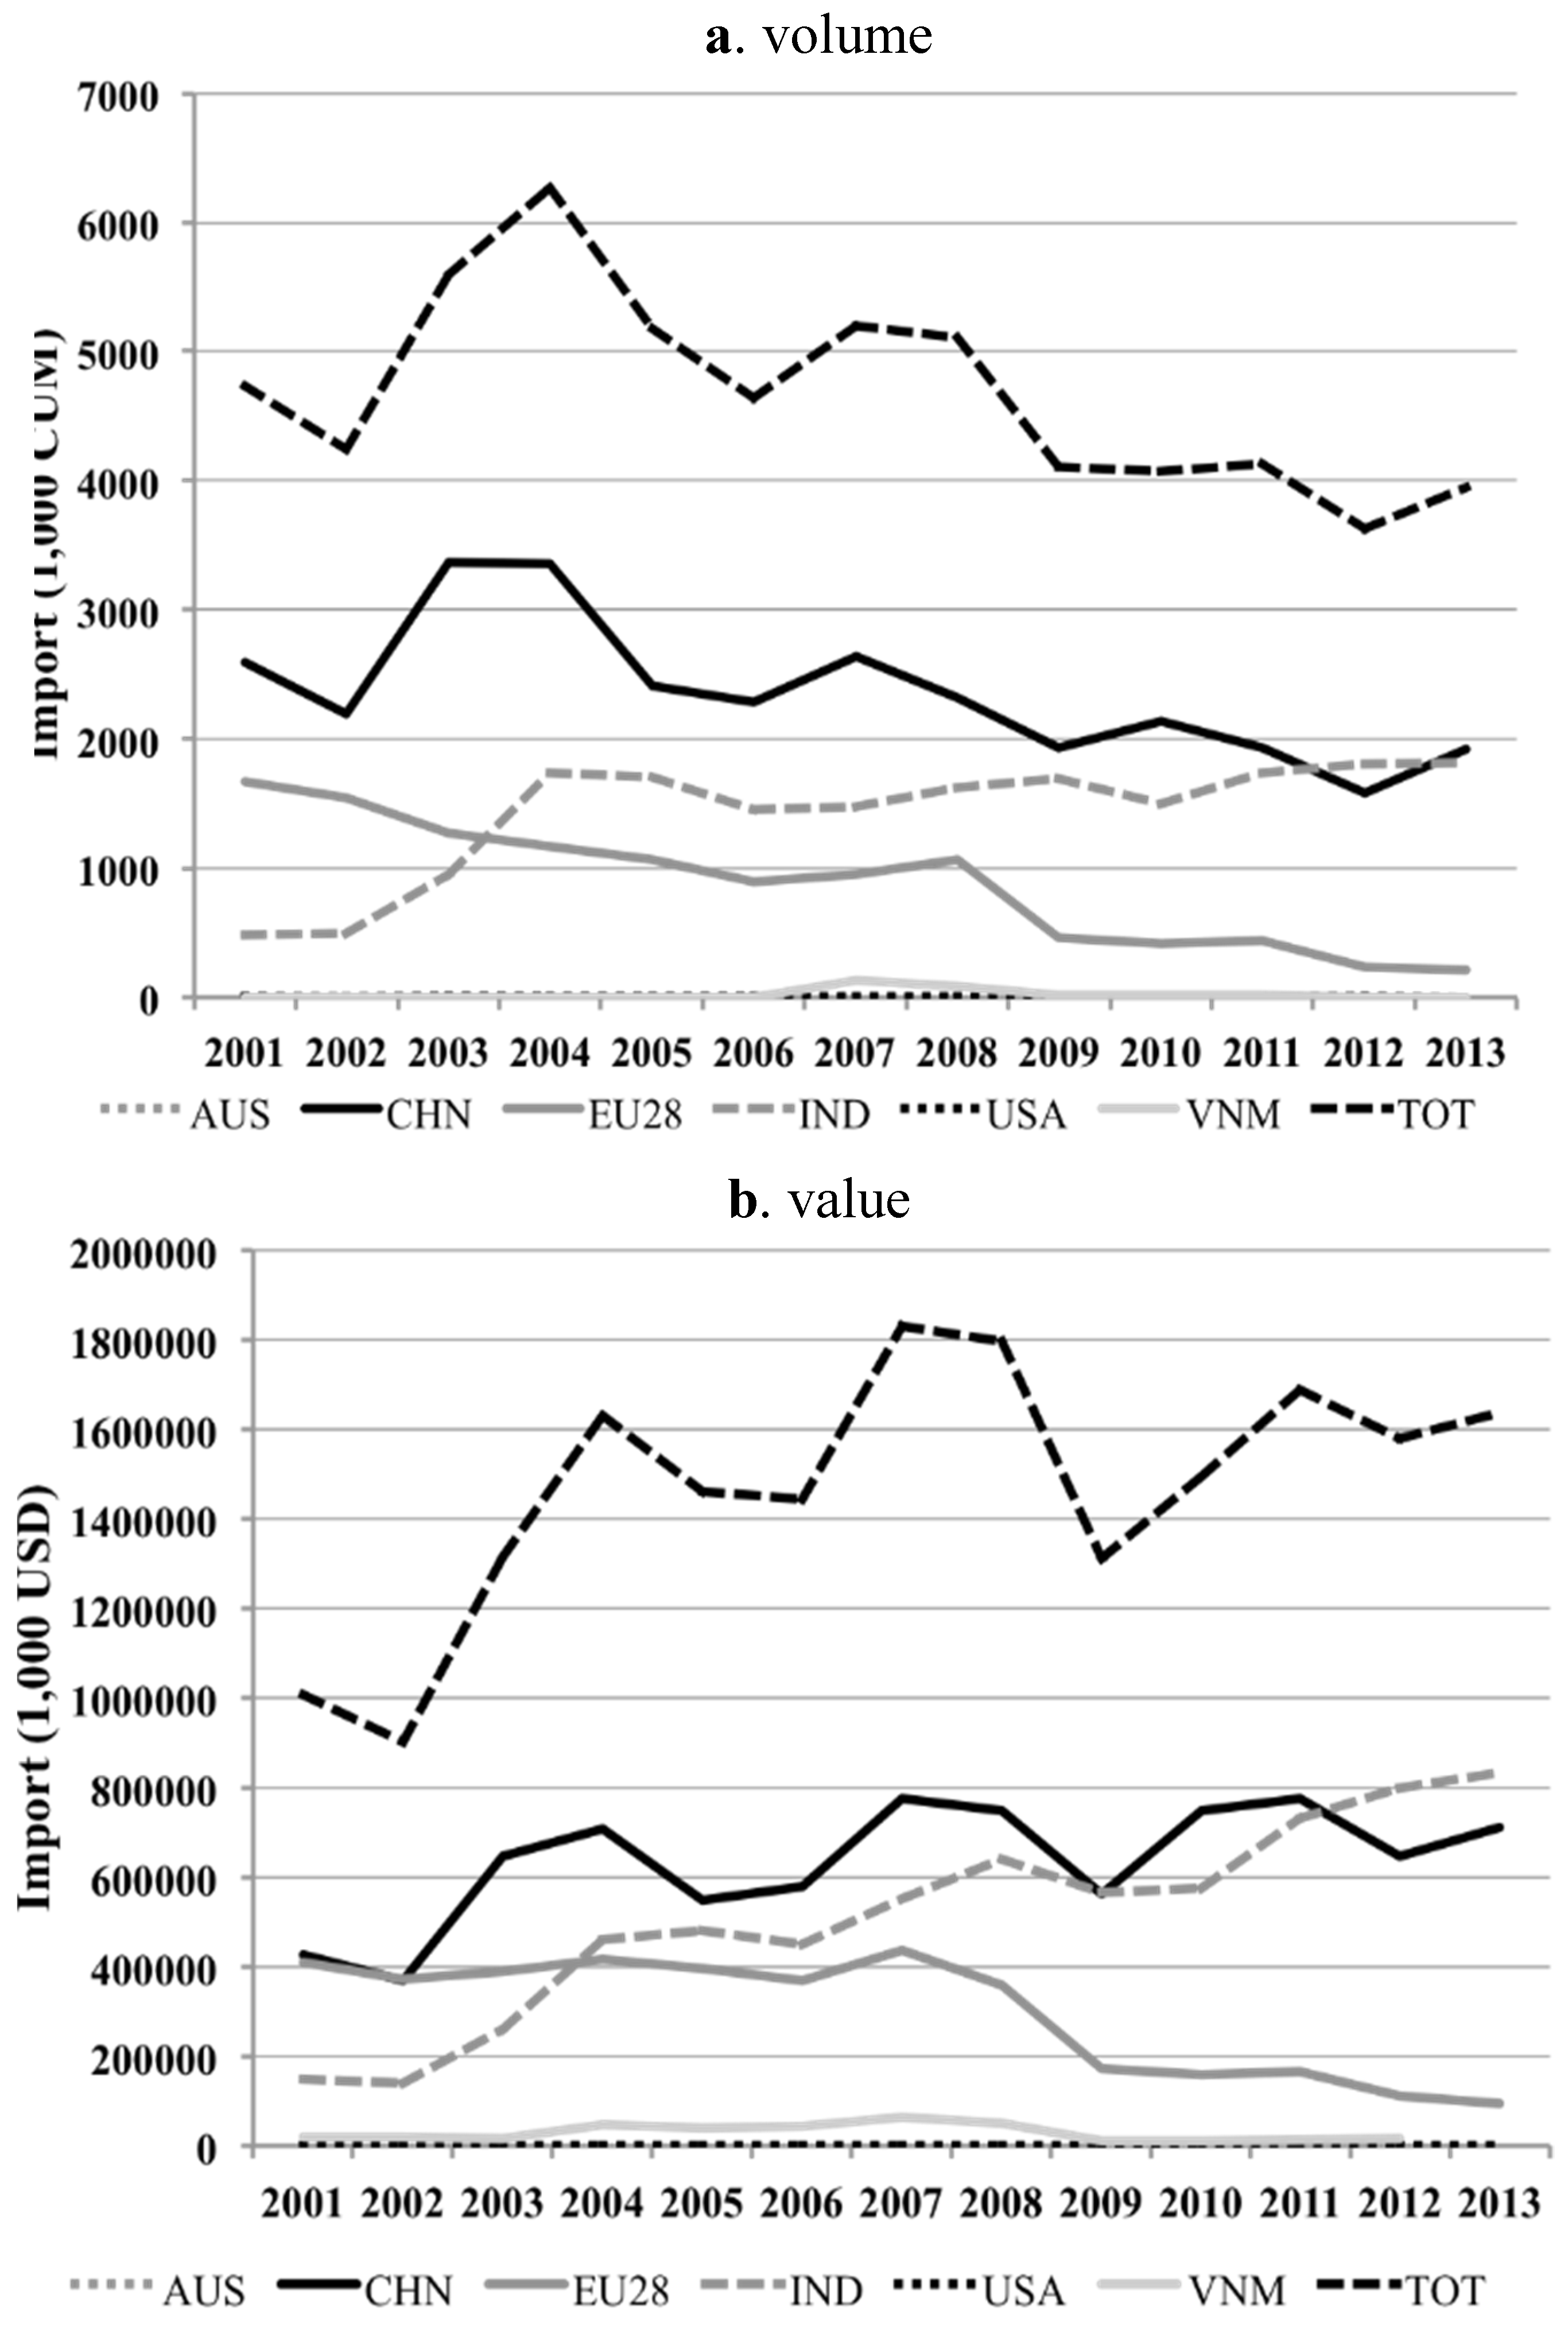
3.1.1. Logs

3.1.2. Sawnwood
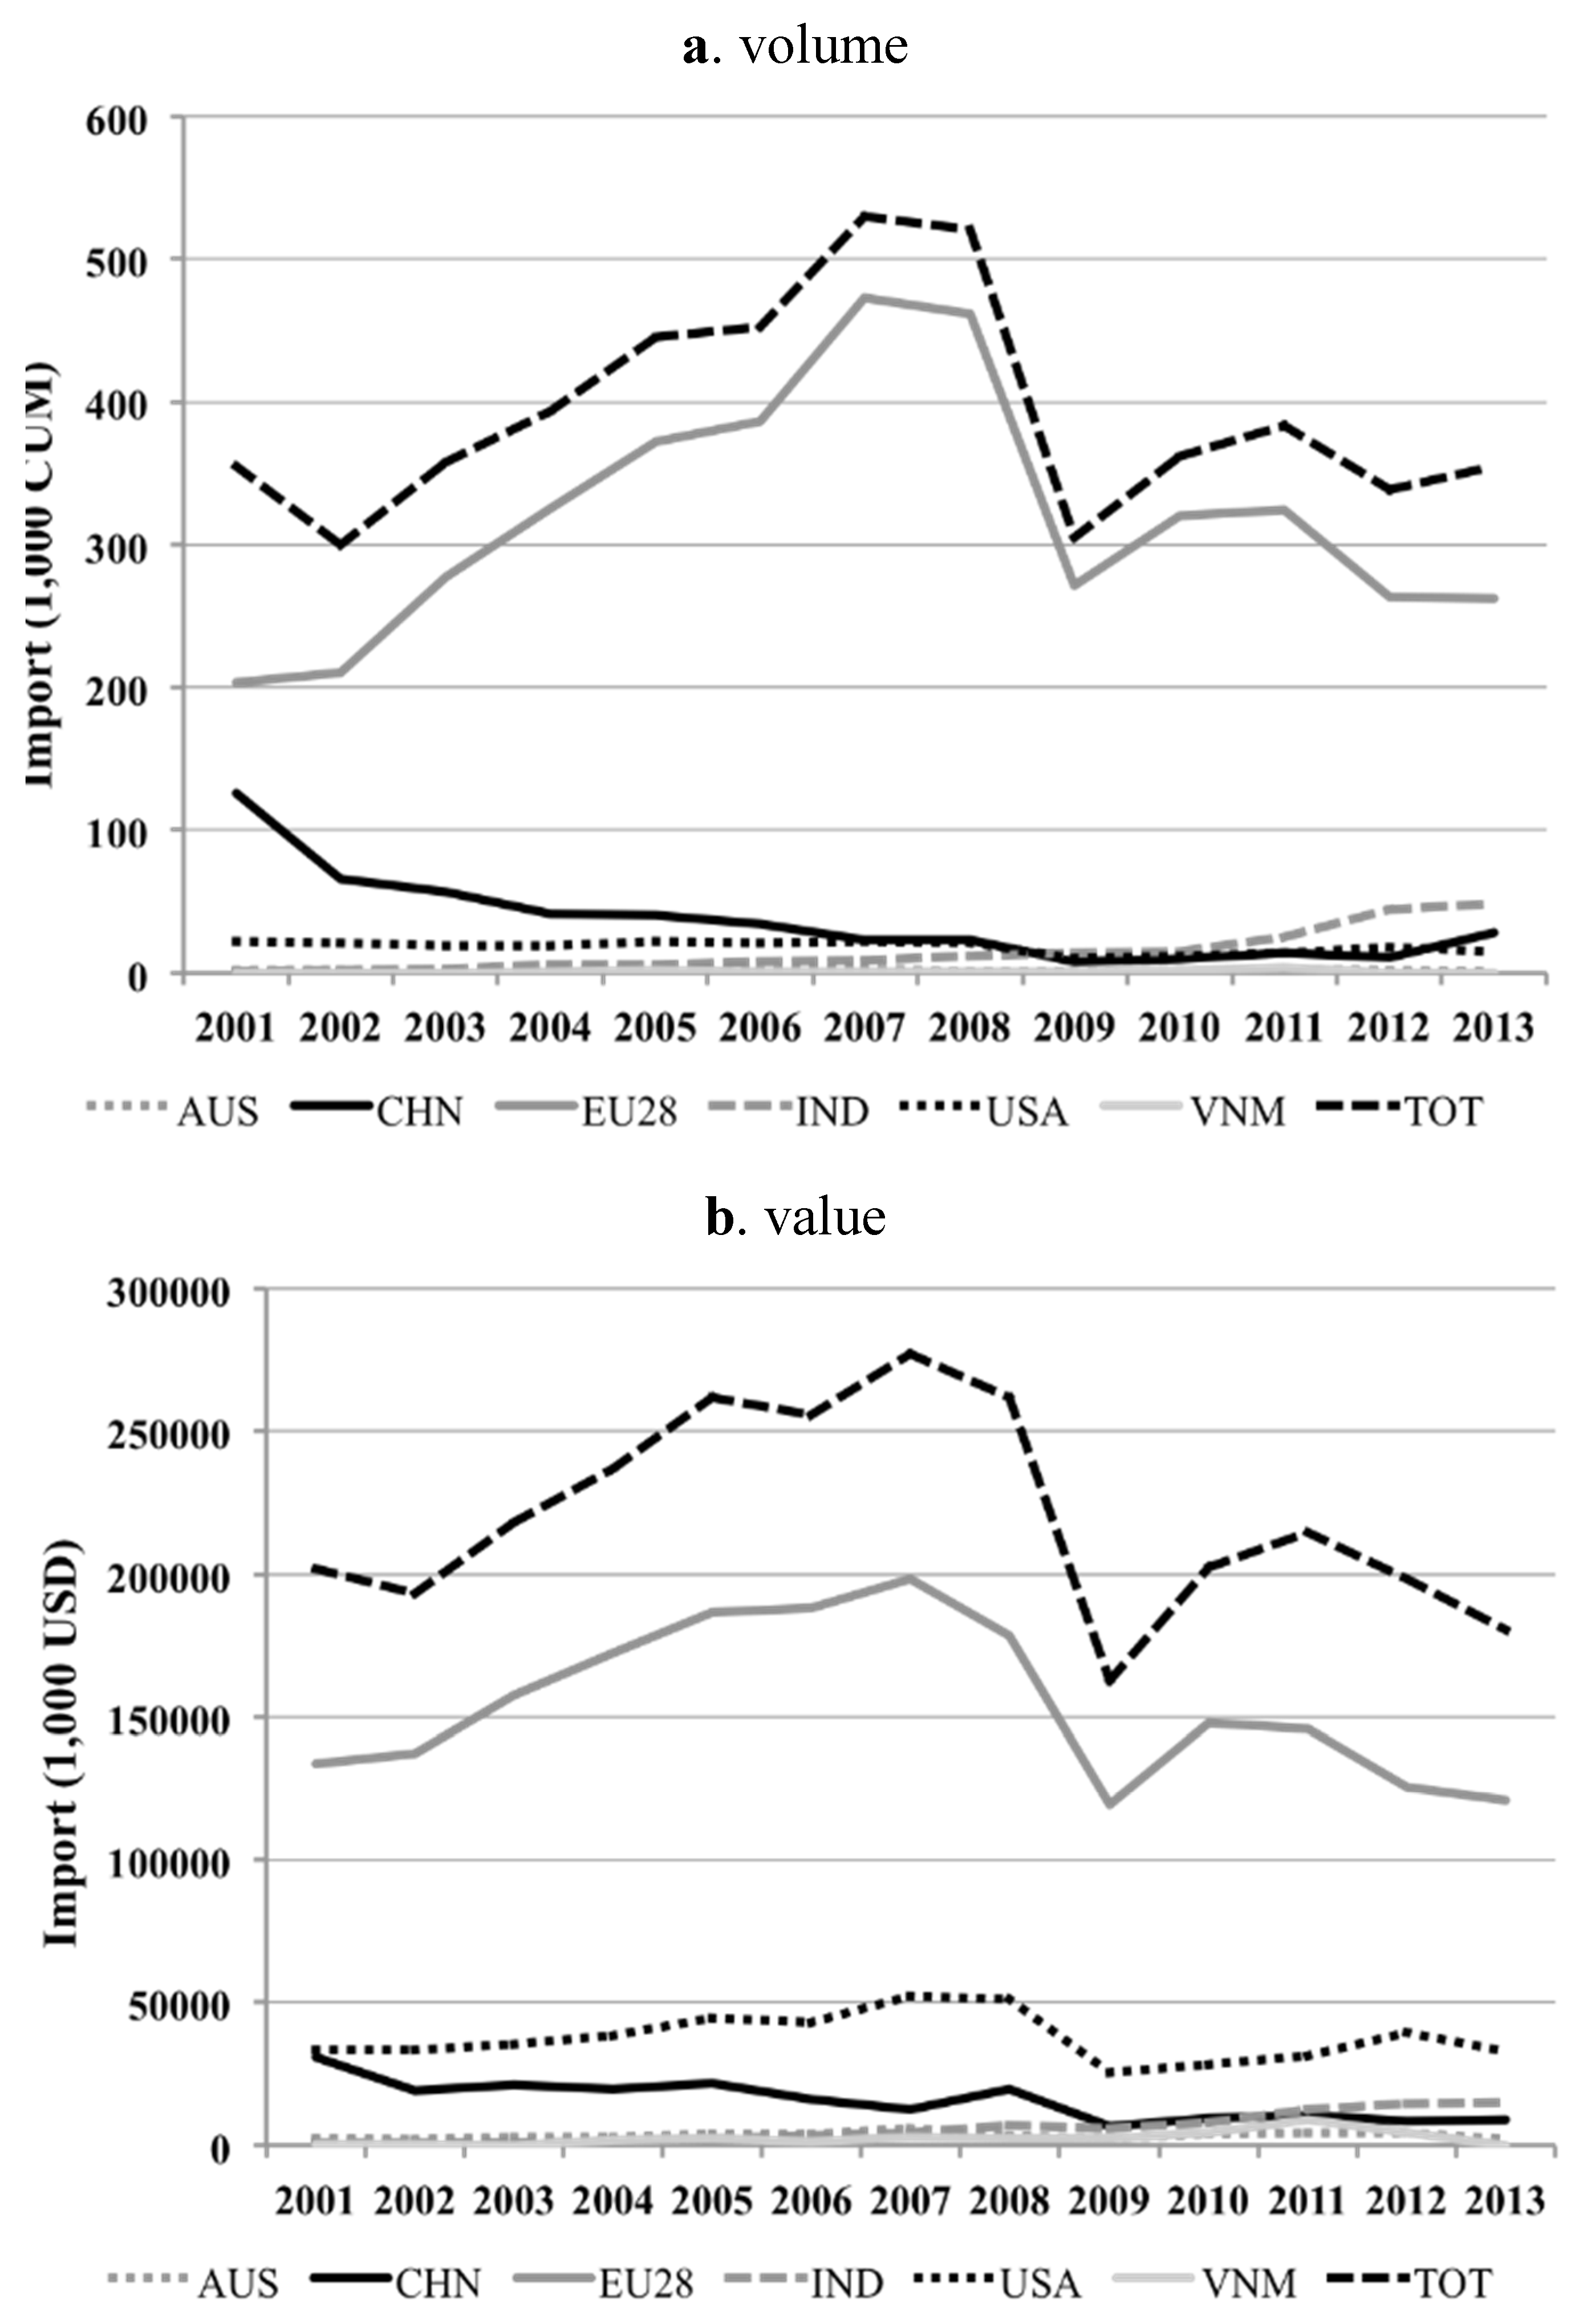
3.1.3. Veneer
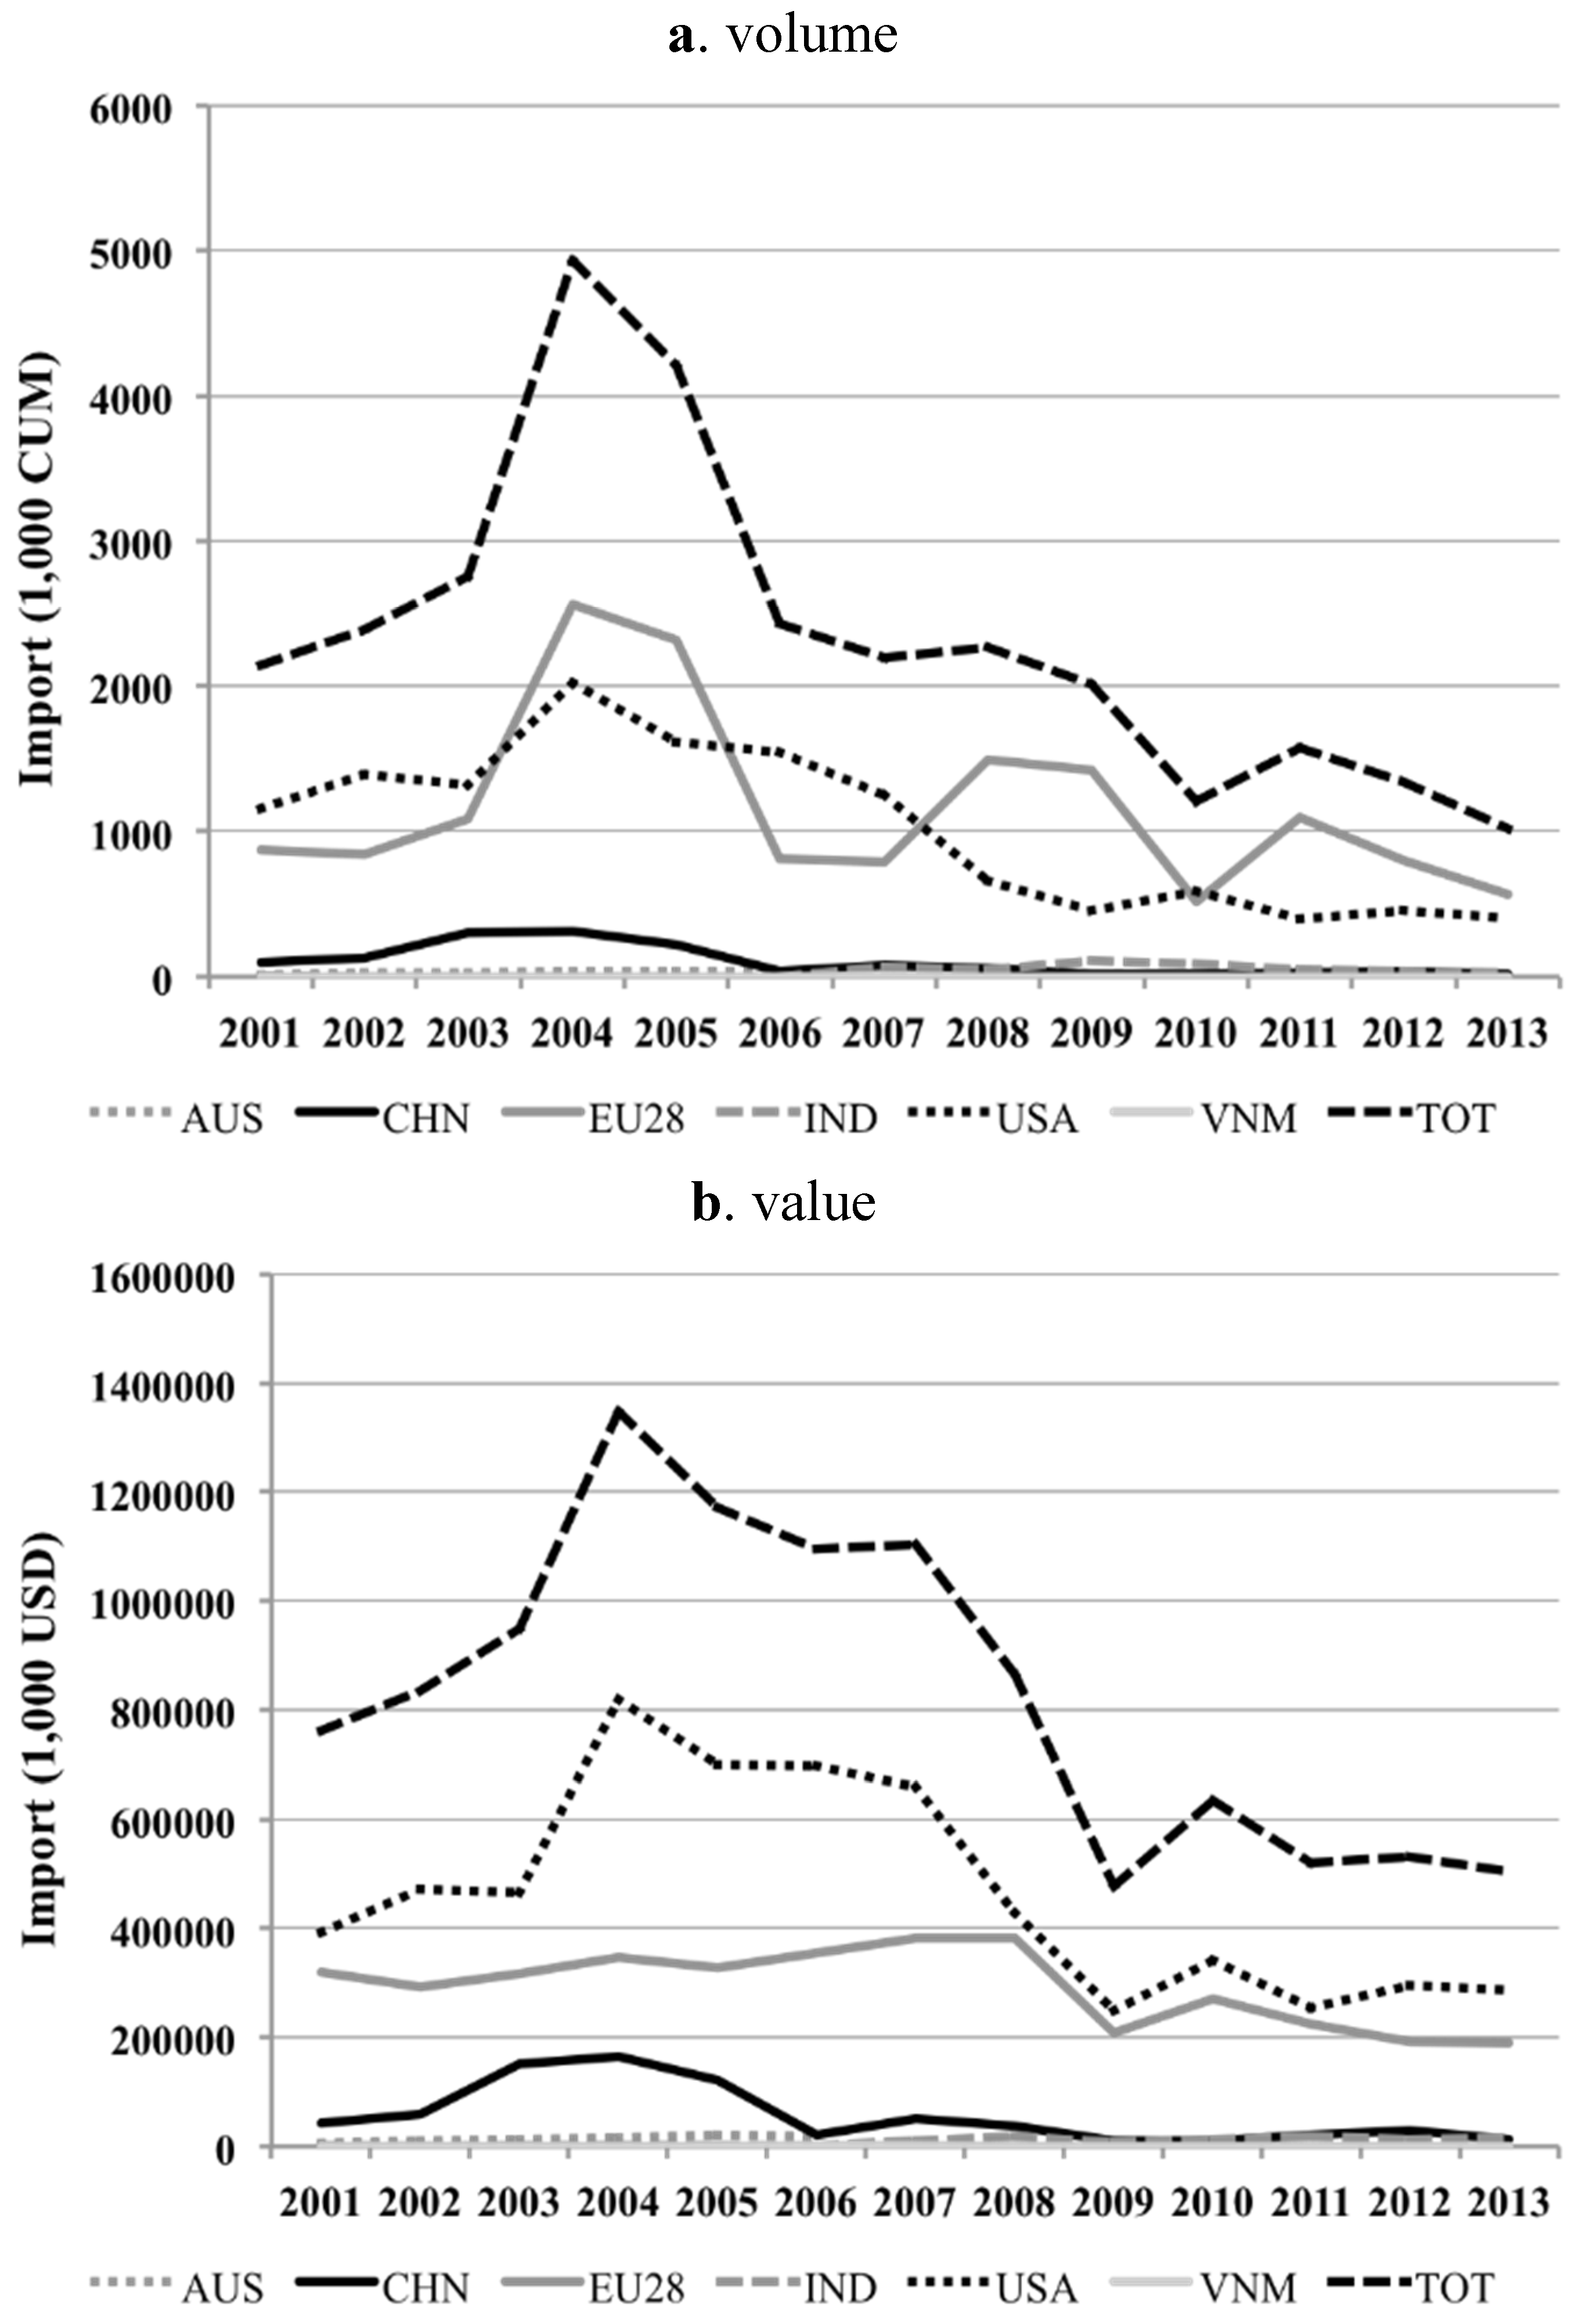
3.1.4. Plywood
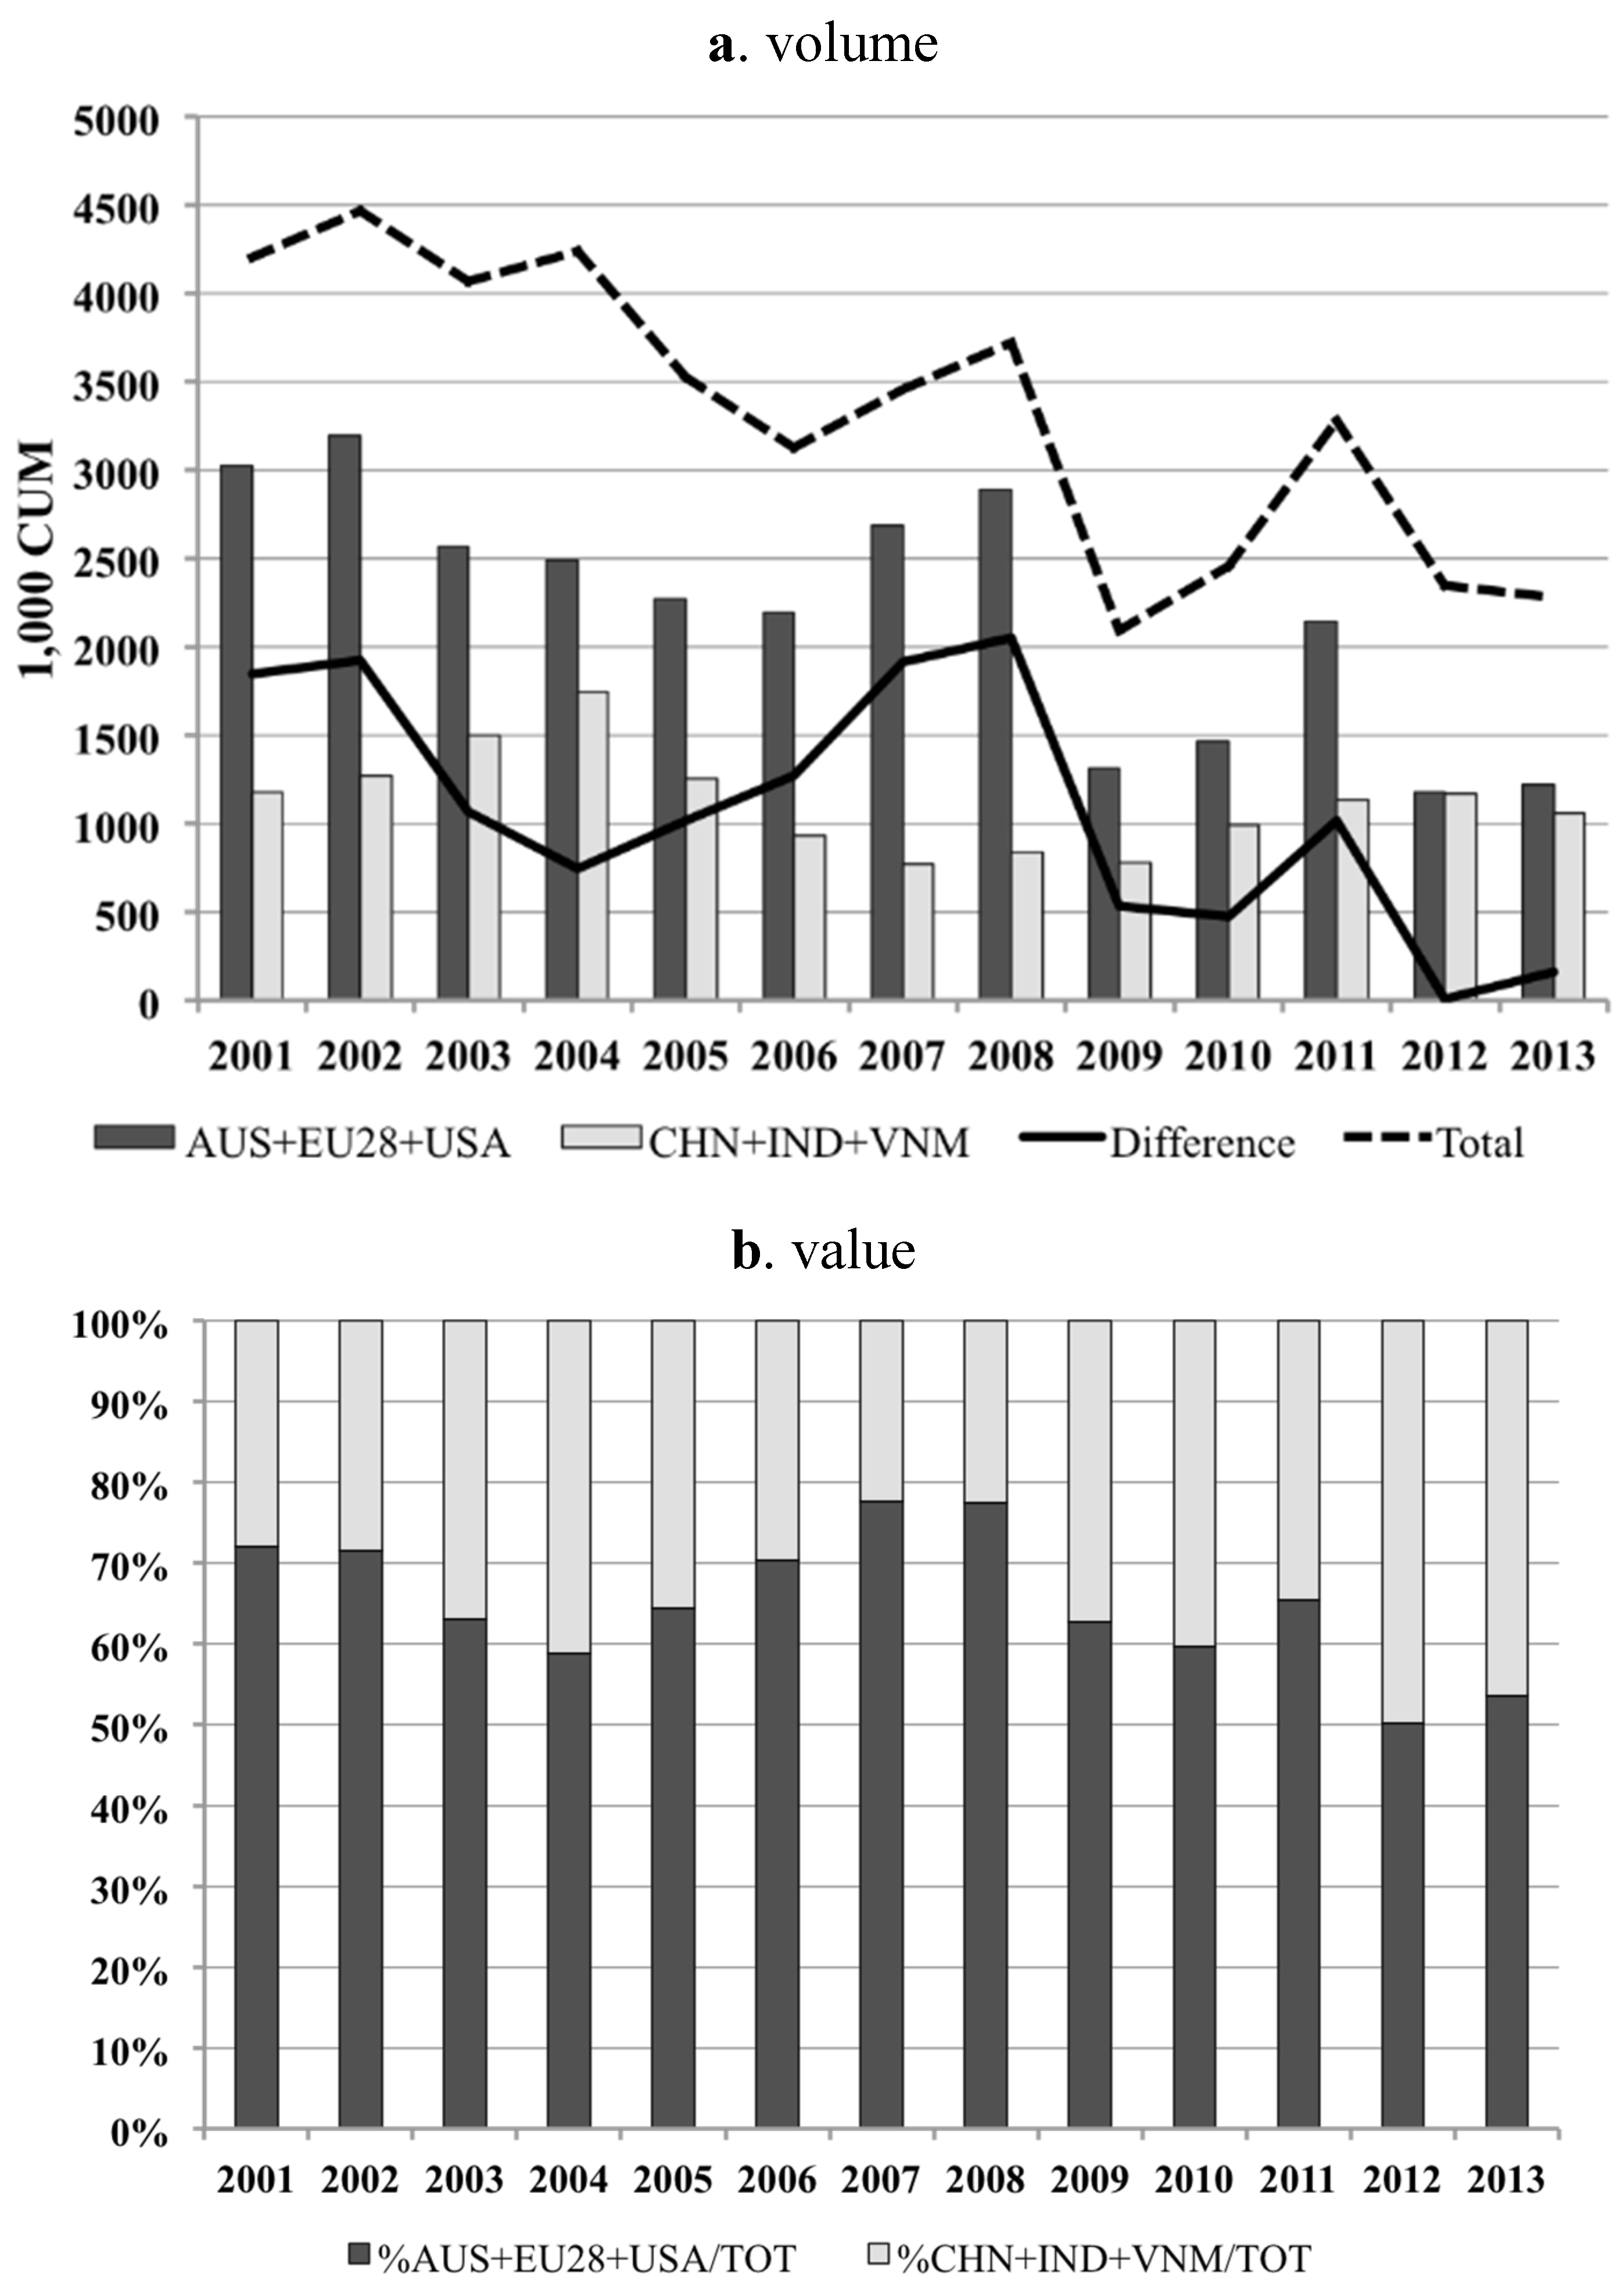
3.2. Imports by Selected Importers (Total and from VPA Countries)
3.2.1. Logs

3.2.2. Sawnwood

3.2.3. Veneer

3.2.4. Plywood

4. Discussion
5. Conclusions
Acknowledgements
Author Contributions
Conflicts of Interest
Appendix
A. Detailed Procedures Used for Data Cleaning and Elaboration
A.1. Data Shortcomings and Double Flow Reporting
A.2. Outliers
- searching for alternative data sources (i.e., normally FAOSTAT database or the import/export country’s statistical agency or portal);
- if an outlier belonged to a “double-flow record,” it was substituted with the value declared by the deleted partner (only if this corrected the value);
- after elaborating the time series between the two trade partners, we estimated the corrected value through the linear price trends;
- computing of average figure between the trade value of the previous and following year between the same trade partners;
- data were dropped.
A.3. Missing Data
A.4. Conversion Factors and Inconsistent Units
- non-coniferous tropical logs: 1.37 CUM /ton,
- non-coniferous tropical sawnwood: 1.43 CUM /ton,
- tropical veneer: 1.33 CUM /ton,
- tropical plywood: 1.54 CUM /ton.
B. Detailed Results
| Country | 2001 | 2013 | 2001–2013 % Variation | |||||||
|---|---|---|---|---|---|---|---|---|---|---|
| Volume (CUM) | % on T | Value (1000 USD) | % on T | Volume (CUM) | % on T | Value (1000 USD) | % on T | Volume | Value | |
| Australia | 74,539 | 0.7 | 36,432 | 1.4 | 36,056 | 0.5 | 4,3043 | 1.2 | −51.6 | 18.1 |
| EU-28 | 5,273,893 | 48.8 | 1,783,218 | 54.0 | 2,690,886 | 34.3 | 1,088,960 | 29.6 | −49.0 | −38.9 |
| USA | 1,458,811 | 13.5 | 631,438 | 19.4 | 641,192 | 8.2 | 586,832 | 16.0 | −56.0 | −7.1 |
| a. Sub-Total 1 | 6,807,243 | 63.0 | 2,451,088 | 74.8 | 3,368,135 | 42.9 | 1,718,835 | 46.7 | −50.5 | −29.9 |
| China | 3,496,595 | 32.4 | 741,297 | 21.2 | 2,457,090 | 31.3 | 1,033,272 | 28.1 | −29.7 | 39.4 |
| India | 489,585 | 4.5 | 152,420 | 3.8 | 2,015,226 | 25.7 | 925,283 | 25.2 | 311.6 | 507.1 |
| Vietnam | 4,884 | 0 | 44,579 | 0.2 | 5,756 (a) | 0.1 | 0 | 0 | 17.8 | −100.0 |
| b. Sub-Total 2 | 3,991,064 | 37.0 | 938,296 | 25.2 | 4,478,072 | 57.1 | 1,958,554 | 53.3 | 12.2 | 108.7 |
| Total (T = a + b) | 10,798,307 | 100.0 | 3,389,385 | 100.0 | 7,846,206 | 100.0 | 3,677,390 | 100.0 | −27.3 | 8.5 |
| Country | 2001 | 2013 | 2001–2013 % Variation | |||||||
|---|---|---|---|---|---|---|---|---|---|---|
| Volume (CUM) | % on T | Value (1000 USD) | % on T | Volume (CUM) | % on T | Value (1000 USD) | % on T | Volume | Value | |
| Australia | 16,920 | 0.4 | 8,053 | 0.6 | 11,989 | 0.5 | 18,826 | 1.6 | −29.1 | 133.8 |
| EU-28 | 2,411,550 | 57.3 | 809,335 | 61.0 | 935,038 | 41.0 | 433,581 | 37.9 | −61.2 | −46.4 |
| USA | 596,655 | 14.2 | 226,767 | 17.1 | 275,122 | 12.1 | 232,780 | 20.3 | −53.9 | 2.7 |
| a. Sub-Total 1 | 3,025,125 | 71.9 | 1,044,154 | 78.7 | 1,222,149 | 53.6 | 685,187 | 59.9 | −59.6 | −34.4 |
| China | 1,135,738 | 27.0 | 265,524 | 20.0 | 875,238 | 38.4 | 376,276 | 32.9 | −22.9 | 41.7 |
| India | 44,768 | 1.1 | 11,069 | 0.8 | 184,764 | 8.1 | 82,604 | 7.2 | 312.7 | 646.2 |
| Vietnam | 7 (a) | 0 | 5,969 | 0.4 | 0 | 0 | 0 | 0 | −100.0 | −100.0 |
| b. Sub-Total 2 | 1,180,513 | 28.1 | 282,562 | 21.3 | 1,060,002 | 46.4 | 458,879 | 40.1 | −10.2 | 62.4 |
| Total (T = a + b) | 4,205,638 | 100.0 | 1,326,717 | 100.0 | 2,282,151 | 100.0 | 1,144,066 | 100.0 | −45.7 | −13.8 |


References
- Tacconi, L. Introduction. In Illegal Logging. Law Enforcement, Livelihoods and the Timber Trade, 1st ed.; Tacconi, L., Ed.; Earthscan: London, UK, 2007; pp. 1–16. [Google Scholar]
- Contreras-Hermosilla, A. Law Compliance in the Forestry Sector: An Overview; World Bank: Washington, DC, USA, 2002; p. 40. [Google Scholar]
- Seneca Creek Associates and Wood Resources International. “Illegal” Logging and Global Wood Markets: The Competitive Impacts on the U.S. Wood Products Industry; Summary American Forest and Paper Association: Washington, DC, USA, 2004; p. 19. [Google Scholar]
- World Bank. Strengthening Forest Law Enforcement and Governance. Addressing A Systemic Constraint to Sustainable Development; Report No. 36638-GLB; World Bank; Environment and Agriculture and Rural Development Departments; Sustainable Development Network: Washington, DC, USA, 2006; p. 77. [Google Scholar]
- Hirschberger, P. Illegal Wood for the European Market. An Analysis of the EU Import and Export of Illegal Wood and Related Products; WWF: Geneva, Switzerland, 2008; p. 45. [Google Scholar]
- Lawson, S.; MacFaul, L. Illegal Logging and Related Trade: Indicators of the Global Response; Chatham House: London, UK, 2010; p. 154. [Google Scholar]
- Bosello, F.; Parrado, R.; Rosa, R. The economic and environmental effects of an EU ban on illegal logging imports. Insights from a CGE assessment. Environ. Dev. Econ. 2013, 18, 184–206. [Google Scholar] [CrossRef]
- Mukul, S.A.; Herbohn, J.; Rashid, A.Z.M.M.; Uddin, M.B. Comparing the effectiveness of forest law enforcement and economic incentive to prevent illegal logging in Bangladesh. Int. For. Rev. 2014, 16, 363–375. [Google Scholar]
- Mittermeier, R.A.; Schwitzer, C.; Rylands, A.B.; Taylor, L.A.; Chiozza, F.; Williamson, E.A.; Wallis, J. Primates in Peril: The World’s 25 Most Endangered Primates 2012–2014; IUCN/SSC Primate Specialist Group (PSG); International Primatological Society (IPS); Conservation International (CI); Bristol Conservation and Science Foundation: Arlington, VA, USA, 2014; p. 87. [Google Scholar]
- Pedroni, L.; Dutschke, M.; Streck, C.; Estrada Porrúa, M. Creating incentives for avoiding further deforestation: The nested approach. Clim. Policy 2009, 9, 207–220. [Google Scholar] [CrossRef]
- Human Rights Watch. Wild Money: The Human Rights Consequences of Corruption and Illegal Logging in Indonesia’s Forestry Sector; Human Rights Watch: New York, NY, USA, 2009; p. 75. [Google Scholar]
- Smith, J.; Obidzinski, K.K.; Subarudi, S.; Suramenggala, I. Illegal logging, collusive corruption and fragmented governments in Kalimantan, Indonesia. Int. For. Rev. 2003, 5, 293–302. [Google Scholar] [CrossRef]
- Transparency International. Analysing Corruption in the Forestry Sector. Forest Governance Integrity Programme; Transparency International: Berlin, Germany, 2010; p. 102. [Google Scholar]
- Goncalves, P.M.; Panjer, M.; Greenberg, T.S.; Magrath, W.B. Justice for Forests. Improving Criminal Justice Efforts to Combat Illegal Logging; World Bank: Washington, DC, USA, 2012; p. 56. [Google Scholar]
- Springer. Extreme Conflict and Tropical Forests, 1st ed.; de Jong, W., Donovan, D., Abe, K., Eds.; Springer: Dordrecht, The Netherlands, 2007; p. 184. [Google Scholar]
- UNEP; INTERPOL. Green Carbon, Black Trade: Illegal Logging, Tax Fraud and Laundering in the World’s Tropical Forests; United Nations Environment Programme and the International Criminal Police Organization: Nairobi, Kenya, 2012; p. 72. Available online: http://www.unep.org/pdf/RRAlogging_english_scr.pdf (accessed on 23 May 2015).
- Bisschop, L. Out of the woods: The illegal trade in tropical timber and a European trade hub. Glob. Crime 2012, 13, 191–212. [Google Scholar] [CrossRef]
- Overdevest, C.; Zeitlin, J. Constructing a transnational timber legality assurance regime: Architecture, accomplishments, challenges. For. Policy Econ. 2014, 48, 6–15. [Google Scholar] [CrossRef]
- Moiseyev, A.; Solberg, B.; Michie, B.; Kallio, A.M.I. Modeling the impacts of policy measures to prevent import of illegal wood and wood products. For. Policy Econ. 2010, 12, 24–30. [Google Scholar] [CrossRef]
- European Commission. Regulation (EU) No 995/2010 of the European Parliament and of the Council of 20 October 2010 Laying down the Obligations of Operators Who Place Timber and Timber Products on the Market; Official Journal of the European Union L 295: Brussels, Belgium, 2010; pp. 23–34. [Google Scholar]
- US Congress. Public Law 110–234. Food, Conservation, and Energy Act of 2008. Available online: www.gpo.gov/fdsys/pkg/PLAW-110publ234/pdf/PLAW-110publ234.pdf (accessed on 23 May 2015).
- Australian Government. Illegal Logging Prohibition Act 2012. No. 166, 2012. An Act to Combat Illegal Logging, and for Related Purposes. Available online: www.comlaw.gov.au/Details/C2012A00166 (accessed on 23 May 2015).
- Jonsson, R.; Giurca, A.; Masiero, M.; Pepke, E.; Pettenella, D.; Prestemon, J.; Winkel, G. Assessment of the EU Timber Regulation and FLEGT Action Plan. From Science to Policy 1; European Forest Institute: Joensu, Finland, 2015; p. 32. [Google Scholar]
- Giurca, A.; Jonsson, R.; Rinaldi, F.; Priyadi, H. Ambiguity in timber trade regarding efforts to combat illegal logging: Potential impacts on trade between South-East Asia and Europe. Forests 2014, 4, 730–750. [Google Scholar] [CrossRef]
- Prestemon, J.P. The impacts of the Lacey Act Amendment of 2008 on U.S. hardwood lumber and hardwood plywood imports. For. Policy Econ. 2015, 50, 31–44. [Google Scholar] [CrossRef]
- Bridegam, P.; Eastin, I. The effects of the 2008 Lacey Act amendment on international trade in forest products. For. Chron. 2014, 90, 643–650. [Google Scholar] [CrossRef]
- Gan, J.; Cashore, B.; Stone, M.W. Impacts of the Lacey Act Amendment and the Voluntary Partnership Agreements on illegal logging: Implications for global forest governance. J. Nat. Resour. Policy Res. 2013, 5, 209–226. [Google Scholar] [CrossRef]
- Fishman, A.; Obidzinski, K. Verified legal? Ramifications of the EU timber regulation and Indonesia’s voluntary partnership agreement for the legality of Indonesian timber. Int. For. Rev. 2015, 17, 10–19. [Google Scholar] [CrossRef]
- Carden, C.; Wijers, R.; Zambon, P. FLEGT, VPA, EUTR and Their Possible Impact on the Bolivian Timber Sector. S-FOR-S: CBI FLEGT Bolivia; Final Report 15/06/12; CBI Ministry of Foreign Affairs of the Netherlands: Amsterdam, the Netherlands, 2012; p. 44. [Google Scholar]
- Roe, B.; Eastin, I.; Ganguly, I. The impact of timber legality regulations on business practices in Vietnam. For. Chron. 2014, 90, 651–659. [Google Scholar] [CrossRef]
- Trishkin, M.; Lopatin, E.; Karjalainen, T. Exploratory assessment of a company’s due diligence system against the EU timber regulation: A case study from northwestern Russia. Forests 2015, 6, 1380–1396. [Google Scholar] [CrossRef] [Green Version]
- European Commission. Accompanying Document to the Proposal for a Regulation of the European Parliament and of the Council Determining the Obligations of Operators Who Make Timber and Timber Products Available on the Market. Impact Assessment. Available online: http://ec.europa.eu/environment/forests/pdf/impact_assessment.pdf (accessed on 23 May 2015).
- European Commission. Council Regulation (EC) No 2173/2005 of 20 December 2005 on the Establishment of a FLEGT Licensing Scheme for Imports of Timber into the European Community; Official Journal of the European Union L 347: Brussels, Belgium, 2005; pp. 1–6. [Google Scholar]
- Oldenburger, J.; van Benthem, M.; de Groot, C.; Boosten, M.; Jansen, P. Import of Secondary Timber Products by the EU-28. The Netherlands in Focus; Stichting Probos: Wageningen, the Netherlands, 2014; p. 92. [Google Scholar]
- WWF-UK. In or out? In Can the European Union’s Timber Regulation Keep out Illegal Timber? WWF-UK Working Group: London, UK, 2015; p. 39. [Google Scholar]
- Forest Trends. Timber Markets and Trade between Laos and Vietnam: A Commodity Chain Analysis of Vietnamese-Driven Timber Flows; Forest Trends: Washington, DC, USA, 2010; p. 37. [Google Scholar]
- Lawson, S. Illegal Wood Import and Re-Export: The Scale of the Problem and the Response in Thailand, South Korea and India; Energy, Environment and Resources EER PP 2014/01; Chatham House: London, UK, 2014; p. 26. [Google Scholar]
- Manoharan, T.R. Effects of the EU Timber Regulation and the Demand for Certified Legal Timber on Business and Industry in India; European Forest Institute: Joensuu, Finland, 2013; p. 52. [Google Scholar]
- Saunders, J. Trade in Illegal Timber. The Response in Vietnam. A Chatham House Assessment; Chatham House: London, UK, 2014; p. 25. [Google Scholar]
- Australian Minister for Agriculture, Fisheries and Forestry. Illegal Logging Prohibition Bill 2011. Explanatory Memorandum. Available online: http://parlinfo.aph.gov.au/parlInfo/search/display/display.w3p;query=Id%3A%22legislation%2Fems%2Fr4740_ems_40a6be3a-05c3-4c97-8211-3826d8f5a423%22 (accessed on 23 May 2015).
- Chatham House. Chatham House Illegal Logging Indicators Country Report Cards; Chatham House: London, UK, 2010. Available online: http://www.illegal-logging.info (accessed on 23 May 2015).
- Environmental Investigation Agency. US Lacey Act. Available online: http://www.eia-global.org/lacey/ (accessed on 23 May 2015).
- UN COMTRADE Database. Available online: http://comtrade.un.org (accessed on 23 May 2015).
- ITTO. Annual Review and Assessment of the World Timber Situation 2012; International Tropical Timber Organization: Yokohama, Japan, 2012; p. 196. [Google Scholar]
- Adams, M. Is this the end for thin-panel tropical plywood? ITTO Trop. For. Update 2003, 13, 18–19. [Google Scholar]
- Eastin, I.; Brose, I.; Maplesden, F.; Novoselov, I. Wood-based panel. In Forest Products Annual Market. Review 2013–2014; UNECE/FAO Timber Committee, United Nations: Geneva, Switzerland, 2014; pp. 61–72. [Google Scholar]
- EIA. Crossroads. The Illicit Timber Trade between Laos and Vietnam; Environmental Investigation Agency: London, UK, 2011; p. 21. [Google Scholar]
- UNECE/FAO. Forest Products Annual Market Review 2013–2014; UNECE/FAO Timber Committee, United Nations: Geneva, Switzerland, 2014; p. 156. [Google Scholar]
- Eastin, I.; Hendrickx, B.; Burdin, N. Wood-based panels markets, 2008–2009. In Forest Products Annual Market. Review 2008–2009; UNECE/FAO Timber Committee, United Nations: Geneva, Switzerland, 2009; pp. 75–84. [Google Scholar]
- ITTO. Riding out the storm. In Improving Resilience of the Tropical Timber Sector to the Impacts of Global and Regional Economic and Financial Crises; ITTO Technical Series No. 41; International Tropical Timber Organization: Yokohama, Japan, 2012; p. 149. [Google Scholar]
- Pepke, E.; Bowyer, J.; Bratkovich, S.; Fernholz, K.; Groot, M.F.H.; Howe, J. Impacts of Policies to Eliminate Illegal Timber Trade; Dovetail Partners Inc.: Minneapolis, MN, USA, 2015; p. 19. [Google Scholar]
- Karsenty, A.; Bayol, N. Chapter 9: 2008–2009 Economic crisis and its impact on the forestry sector in central Africa. In The Forests of the Congo Basin. State of the Forest 2010; Commission des Forêts d’Afrique Centrale, COMIFAC: Yaoundé, Cameroon, 2011; pp. 171–181. [Google Scholar]
- Dieter, M. Analysis of trade in illegally harvested timber: Accounting for trade via third party countries. For. Policy Econ. 2009, 11, 600–607. [Google Scholar] [CrossRef]
- Cerutti, P.O.; Tacconi, L.; Lescuyer, G.; Nasi, R. Cameroon’s hidden harvest: Commercial chainsaw logging, corruption and livelihoods. Soc. Nat. Resour. 2013, 26, 539–553. [Google Scholar] [CrossRef]
- Cerutti, P.O.; Lescuyer, G. The Domestic Market for Small-Scale Chainsaw Milling in Cameroon: Present Situation, Opportunities and Challenges; Series: Occasional Paper 61; CIFOR: Bogor, Indonesia, 2011; p. 39. [Google Scholar]
- European Commission. Moving Towards VPA Implementation. Preparation for the Implementation of the FLEGT Voluntary Partnership Agreement 2011–2012; Voluntary Partnership Agreement Technical Secretariat for Liberia: Monrovia, Liberia, 2013; p. 21. [Google Scholar]
- Lescuyer, G.; Ndotit, S.; Ndong, L.B.B.; Tsanga, R.; Cerutti, P.O. Policy Options for Improved Integration of Domestic Timber Markets under the Voluntary Partnership Agreement (VPA) Regime in Gabon; CIFOR Infobrief No. 82; CIFOR: Bogor, Indonesia, 2014; p. 4. [Google Scholar]
- UN. Trade Statistics in Policymaking—A Handbook of Commonly Used Trade Indices and Indicators; (Series: Studies in Trade and Investment); United Nations, Economic and Social Commission for Asia and the Pacific (UNESCAP): Bangkok, Thailand, 2011; p. 128. [Google Scholar]
- Pettenella, D.; Vidale, E.; da Re, R.; Lovric, M. NWFP in the International Market: Current Situation and Trends; StarTree Project deliverable 3.1; TeSAF Department, University of Padova: Padova, Italy, 2014; p. 31. [Google Scholar]
© 2015 by the authors; licensee MDPI, Basel, Switzerland. This article is an open access article distributed under the terms and conditions of the Creative Commons Attribution license (http://creativecommons.org/licenses/by/4.0/).
Share and Cite
Masiero, M.; Pettenella, D.; Cerutti, P.O. Legality Constraints: The Emergence of a Dual Market for Tropical Timber Products? Forests 2015, 6, 3452-3482. https://doi.org/10.3390/f6103452
Masiero M, Pettenella D, Cerutti PO. Legality Constraints: The Emergence of a Dual Market for Tropical Timber Products? Forests. 2015; 6(10):3452-3482. https://doi.org/10.3390/f6103452
Chicago/Turabian StyleMasiero, Mauro, Davide Pettenella, and Paolo Omar Cerutti. 2015. "Legality Constraints: The Emergence of a Dual Market for Tropical Timber Products?" Forests 6, no. 10: 3452-3482. https://doi.org/10.3390/f6103452