Article

Changes in Species and Functional Diversity of the Herb Layer of Riparian Forest despite Six Decades of Strict Protection

by
Kamila Reczyńska
1,*,
Anna Orczewska
2,
Valeriia Yurchenko
3,
Anna Wójcicka-Rosińska
4 and
Krzysztof Świerkosz
5,*
1
Department of Botany, Faculty of Biological Sciences, University of Wrocław, 50-328 Wrocław, Poland
2
Institute of Biology, Biotechnology and Environmental Protection, Faculty of Natural Sciences, University of Silesia, 40-007 Katowice, Poland
3
Independent Researcher, Vasnietsova 6/64, 25015 Kropyvnytskyi, Ukraine
4
Geosilva Ltd., Juliana Tuwima 11, 55-200 Oława, Poland
5
Museum of Natural History, Faculty of Biological Sciences, University of Wrocław, 50-335 Wrocław, Poland
*
Authors to whom correspondence should be addressed.
Forests 2022, 13(5), 747; https://doi.org/10.3390/f13050747
Submission received: 11 March 2022 / Revised: 24 April 2022 / Accepted: 1 May 2022 / Published: 11 May 2022

Abstract

:
The herb layer of temperate forests contributes to long-term forest ecosystem functioning and provisioning of ecosystem services. Therefore, a thorough understanding of its dynamics in the face of environmental changes is essential. This paper focuses on the species and functional diversity of the herb layer of riparian forests to verify how these two community components changed over time and under strict protection. The understory vegetation was surveyed on 42 semi-permanent plots in three time periods between 1960 and 2020. The overall pattern in vegetation changes that related to species richness and diversity, functional structure, and habitat conditions was analyzed using ordination and permutation techniques. We found significant changes in species composition and the functional structure of herbaceous vegetation over the last six decades. Forests were enriched with nutrient-demanding and alien species. A significant increase in functional diversity and the proportion of species with high SLA and canopy height was also observed, whereas changes in habitat conditions were insignificant. The observed trends indicate that the strict protection of forest communities within small and isolated reserves does not fully protect their species composition. Forest reserves should be surrounded by unmanaged forests and spatially connected to allow species mobility.

1. Introduction

In temperate forests, most of their biodiversity is concentrated in the herb layer [1]. Thus, processes taking place in this vegetation stratum may contribute to long-term forest ecosystem functioning and, at the same time, affect the ability of forests to provide ecosystem services [2,3,4]. However, currently, forests face severe threats which can act independently or synergistically and, most importantly, affect forests globally [5]. One of these risk factors is climate change, reflected by rising temperatures [6], extreme weather events such as prolonged droughts [7] or late-spring frost events [8], and intensification of evaporation [9]. These all overlap with rapid thermophilization [5,10], eutrophication [11,12], and plant invasions [13], which change the compositional and functional structure of forests at an unprecedented pace and scale.
Therefore, it is crucial to recognize the current state of forest communities and, more importantly, determine the proportion of biodiversity that can be maintained within forest ecosystems, and the role of protected areas (PAs) in this process. The latter is considered to be one of the primary and effective tools in mitigation of the consequences of rapid changes in a global environment, by reducing both a decline in biodiversity in various types of ecosystems and species extinction rates [14,15]. The protection of forest communities is considered efficient in maintaining their high biodiversity and the natural processes of forest dynamics. As such, protected forests are expected to work as barriers to the spread of invasive species across the continents [16,17,18].
On the other hand, it was already known that the current number and area of PAs is insufficient for the protection of animals [19,20], habitats [21], preservation of the capacity of forests to store carbon dioxide [22], as well as for keeping sufficient availability of natural resources across different elements of biodiversity and ecosystem services [23,24]. In many cases, strict protection is not sufficient to prevent unfavorable changes in the species structure of forest communities [25,26,27,28,29,30]. There are even forests whose species composition, despite strict, long-term protection, was dominated by invasive alien species [31,32]. These unfavorable changes were observed, even though between 2010 and 2019, the total area of PAs expanded from 14.1% up to 15.3% of global land and freshwater environments [23]. These negative alterations may be caused since PAs only partly cover essential sites for biodiversity and are not yet fully ecologically representative and effectively or equitably managed [33]. Thus, the total area of protected forests of high conservation value is essential for long-term biodiversity protection [33,34]. Their spatial configuration in the landscape, with a high level of connectivity, is crucial for the existence of many forest species, especially slow-moving ones [35]. Hence, the pressure to expand the proportion of protected areas is growing. The European Union (EU) biodiversity strategy for 2030 states that at least 30% of the terrestrial area of the EU should be protected, out of which 10% are under strict protection [36]. Moreover, the latter type of PAs is expected to mainly protect primary and old-growth forests [37], which presently cover 3.7 Mha in 32 European countries (excluding Russia) [38,39]. Most of them are located in Finland (0.9 Mha) and Eastern Europe (0.2 Mha). However, they are scarce and strongly fragmented in many countries, e.g., in Poland only 21,500 ha of primary forests were already recognized, mainly from the Carpathians and the Białowieża Forest [39]. Therefore, it should be expected that the primary forests and forests with a high level of naturalness will be the first to be designated for strict protection under the EU biodiversity strategy.
Most classical studies on forest vegetation in PAs and its temporal changes focus on the general species richness and proportion of alien and synanthropic species [25,26,30,40]. However, in order to understand the causes and effects of changes in forest communities more thoroughly, one should take into account not only their species composition but also functional structure i.e., the combination, diversity, and abundance of the distribution of plant functional traits in the community [41,42]. Plant functional traits are morphological, anatomical, physiological, phenological, or behavioral attributes, which can be measured at the individual level [43,44]. They reflect how plant species respond to the biotic and abiotic environmental factors (response traits), as well how they affect the ecosystem properties (effect traits) [43,45,46]. Although the functional diversity patterns, better than species numbers, determine ecosystem functioning and response to global and local changes in habitat conditions [2,4], they have been rarely studied in reference to PAs [47,48,49]. Therefore, the approach which combines species and functional diversity seems crucial for preserving the natural values of European forests because it enables the gaining of a deeper insight into community structure, hence planning more effective protection measures.
In this study, we plan to focus on both species and functional diversity to verify how these two community components changed under strict protection within a relatively long period of time. As a case study, we chose three nature reserves which protect riparian forest communities. Riparian forests are considered as one of the richest in species forest communities, thus can be particularly important as refugia for biodiversity conservation, especially at the local scale [50,51].
Therefore, our main objectives are: (i) to recognize possible changes in the herb layer of riparian forest, referring to its species composition and diversity, and functional structure over time; (ii) to recognize which environmental factors may be responsible for the observed changes. As the studied forests have been continuously protected as nature reserves since 1958, we may assume that they have been subjected mainly to the natural processes of forest dynamics. However, due to the observed global trends (invasions of species, warming, eutrophication) and the small area of studied reserves, we hypothesize that herbaceous vegetation’s species composition and functional structure have significantly changed over time, which is consistent with most literature sources.

2. Materials and Methods
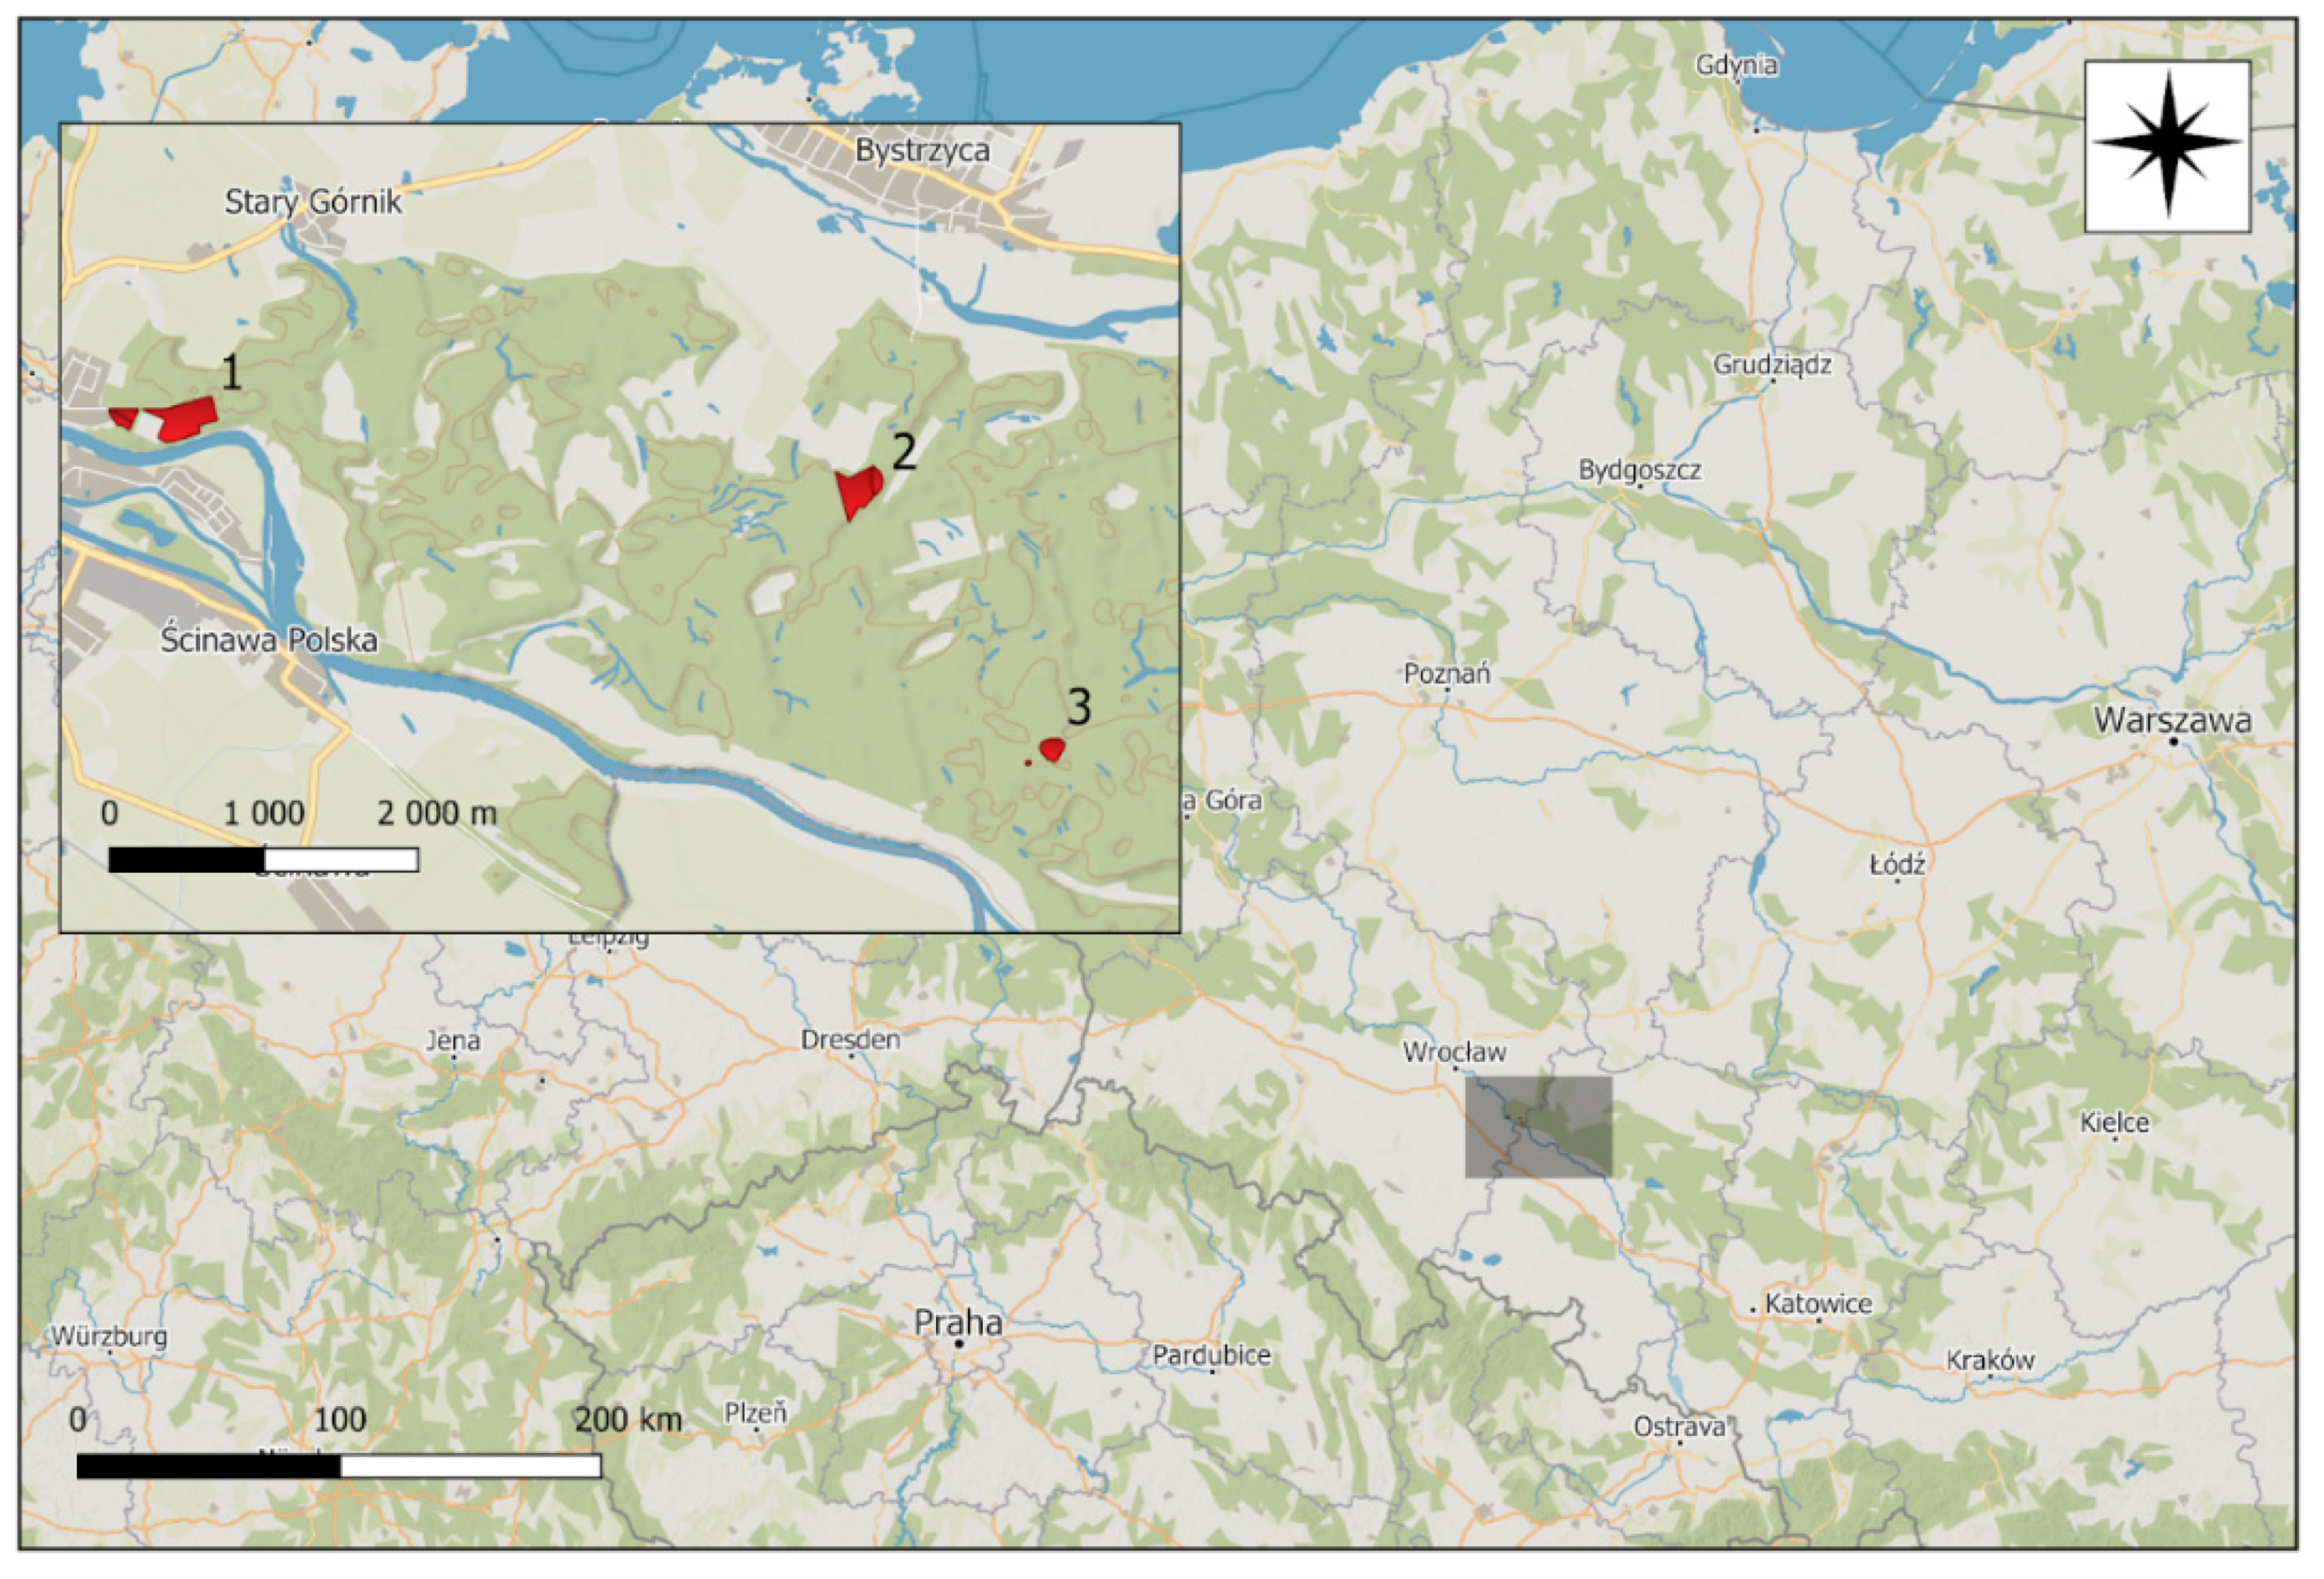
2.1. Study Area

We conducted research in three forest nature reserves established in 1958: “Kanigóra” (5.4 ha), “Grodziska Ryczyńskie” (1.82 ha), and “Zwierzyniec” (8.55 ha). They are located within a sizable riparian forest complex with an area of 2004 hectares [52], preserved in the Odra River Valley. The Odra forms the 30th longest and 17th largest river catchment area of Europe, including Russia (Figure 1), and is an ecological corridor important on the continental scale [53]. The entire area is located on the Silesian Lowland, in the southwestern part of Poland. The elevation varies between 120 and 140 m a.s.l., and the plant communities are typical of Central European lowlands.
The soils in the study area are alluvial and formed during river floods. Gley soils dominate in the northern and western parts, while brown soils occur in the central and eastern parts, showing high compactness, acidity, and high moisture [52].
The mean annual temperature is typical of the warmest region in Poland and is above 8 °C. The warmest month is July (mean 18 °C), while the coldest is January (mean 1.1 °C). The total annual rainfall varies between 560 and 580 mm. Snow cover in this region does not last long; its average durability is the lowest in Poland and amounts to less than 40 days a year. The growing season lasts more than 230 days, and it has gradually lengthened as a result of climate change [54].
The studied forests are one of the critical objects of protection in the Natura 2000 site PLH020017 “Grądy w Dolinie Odry” covering the area of 8756.34 ha [55]. Initially, a mosaic of riparian, oak-hornbeam and alder forest [56,57,58,59] were recognized here. However, recently they naturally transformed into forests of lower dampness, dominated by hornbeam stands, Stellario holosteae-Carpinetum betuli Oberdorfer 1957 [60]. Outside the area of the reserves, forests are intensively managed. Forest management in the area is carried out by the Oława Forest District, which obtains at least 92,000 m3 of wood annually, mainly coniferous wood, but also oak, ash, and alder. Tourist and recreational pressures are also intense, especially in the southern part of the area which is crossed by many forest roads.

2.2. Sampling

The previous surveys were carried out twice: in 1958–1961 [56] (hereafter 1960) and 1988–1991 (hereafter 1990) [57,58,59]. The most recent survey was conducted in 2019–2020 (hereafter 2020), covering the whole vegetation season, similar to the above-mentioned studies. The location of the most recent plots was determined based on the descriptions of the locations included in the study of Kuczyńska [56], undertaken in 1960, considered as a baseline survey (see Supplementary Materials, Table S1). Therefore, we treated the newly established plots as semi-permanent. In total, we resurveyed 42 semi-permanent plots: 20 in the Zwierzyniec, 7 in the Grodziska Ryczyńskie, and 15 in the Kanigóra reserves. The location of each plot was determined using GPS coordinates (see Supplementary Materials, Table S1). The plots’ size was normalized to 100 square meters. According to the Braun–Blanquet approach, vegetation composition was sampled in the form of phytosociological relevés [61], with abundance determined for each species in a separate vegetation layer (tree, shrub, and herb layers) on a seven-point scale. The most recent survey was conducted with permission of the Regional Directorate for Environmental Protection in Wrocław (decision number WPN.6205.58.2019.AR and WPN.6205.39.2020.MR).
The nomenclature of vascular plants follows Euro + Med PlantBase [62]. Mosses were omitted due to random data from the past periods of investigation.

2.3. Data Analysis

2.3.1. The Overall Pattern in Vegetation

The differences in species composition of the herb layer between surveys were analyzed using JUICE 7.1.21 software [63] with a modified TWINSPAN algorithm [64]. All species occurring in the herb layer, including herbaceous species and saplings of shrubs and trees, were considered in these analyses.
Differentiating species for the analyzed surveys were determined using the Φ [phi] coefficient as a measure of fidelity [65]. Species with Φ ≥ 25 (0.25 × 100), constancy ≥ 20%, constancy ratio [66] higher than 1.5 and significant concentration in a particular cluster, tested by the Fisher’s exact test (p < 0.05), were considered to be diagnostic (i.e., reaching the highest fidelity and frequency) for particular survey periods. In addition, the total number of species (species richness) and the Shannon–Wiener Index were calculated using a JUICE function for each relevé in the subsequent survey times. In this respect, differences between the surveys were tested using a Kruskal–Wallis test and Dunn’s post hoc test. Moreover, in the JUICE software, we calculated the frequency and coverage of alien species in vegetation plots referring to each studied survey. The analyses were performed jointly on the entire dataset. Alien species were determined following Tokarska-Guzik et al. [67].

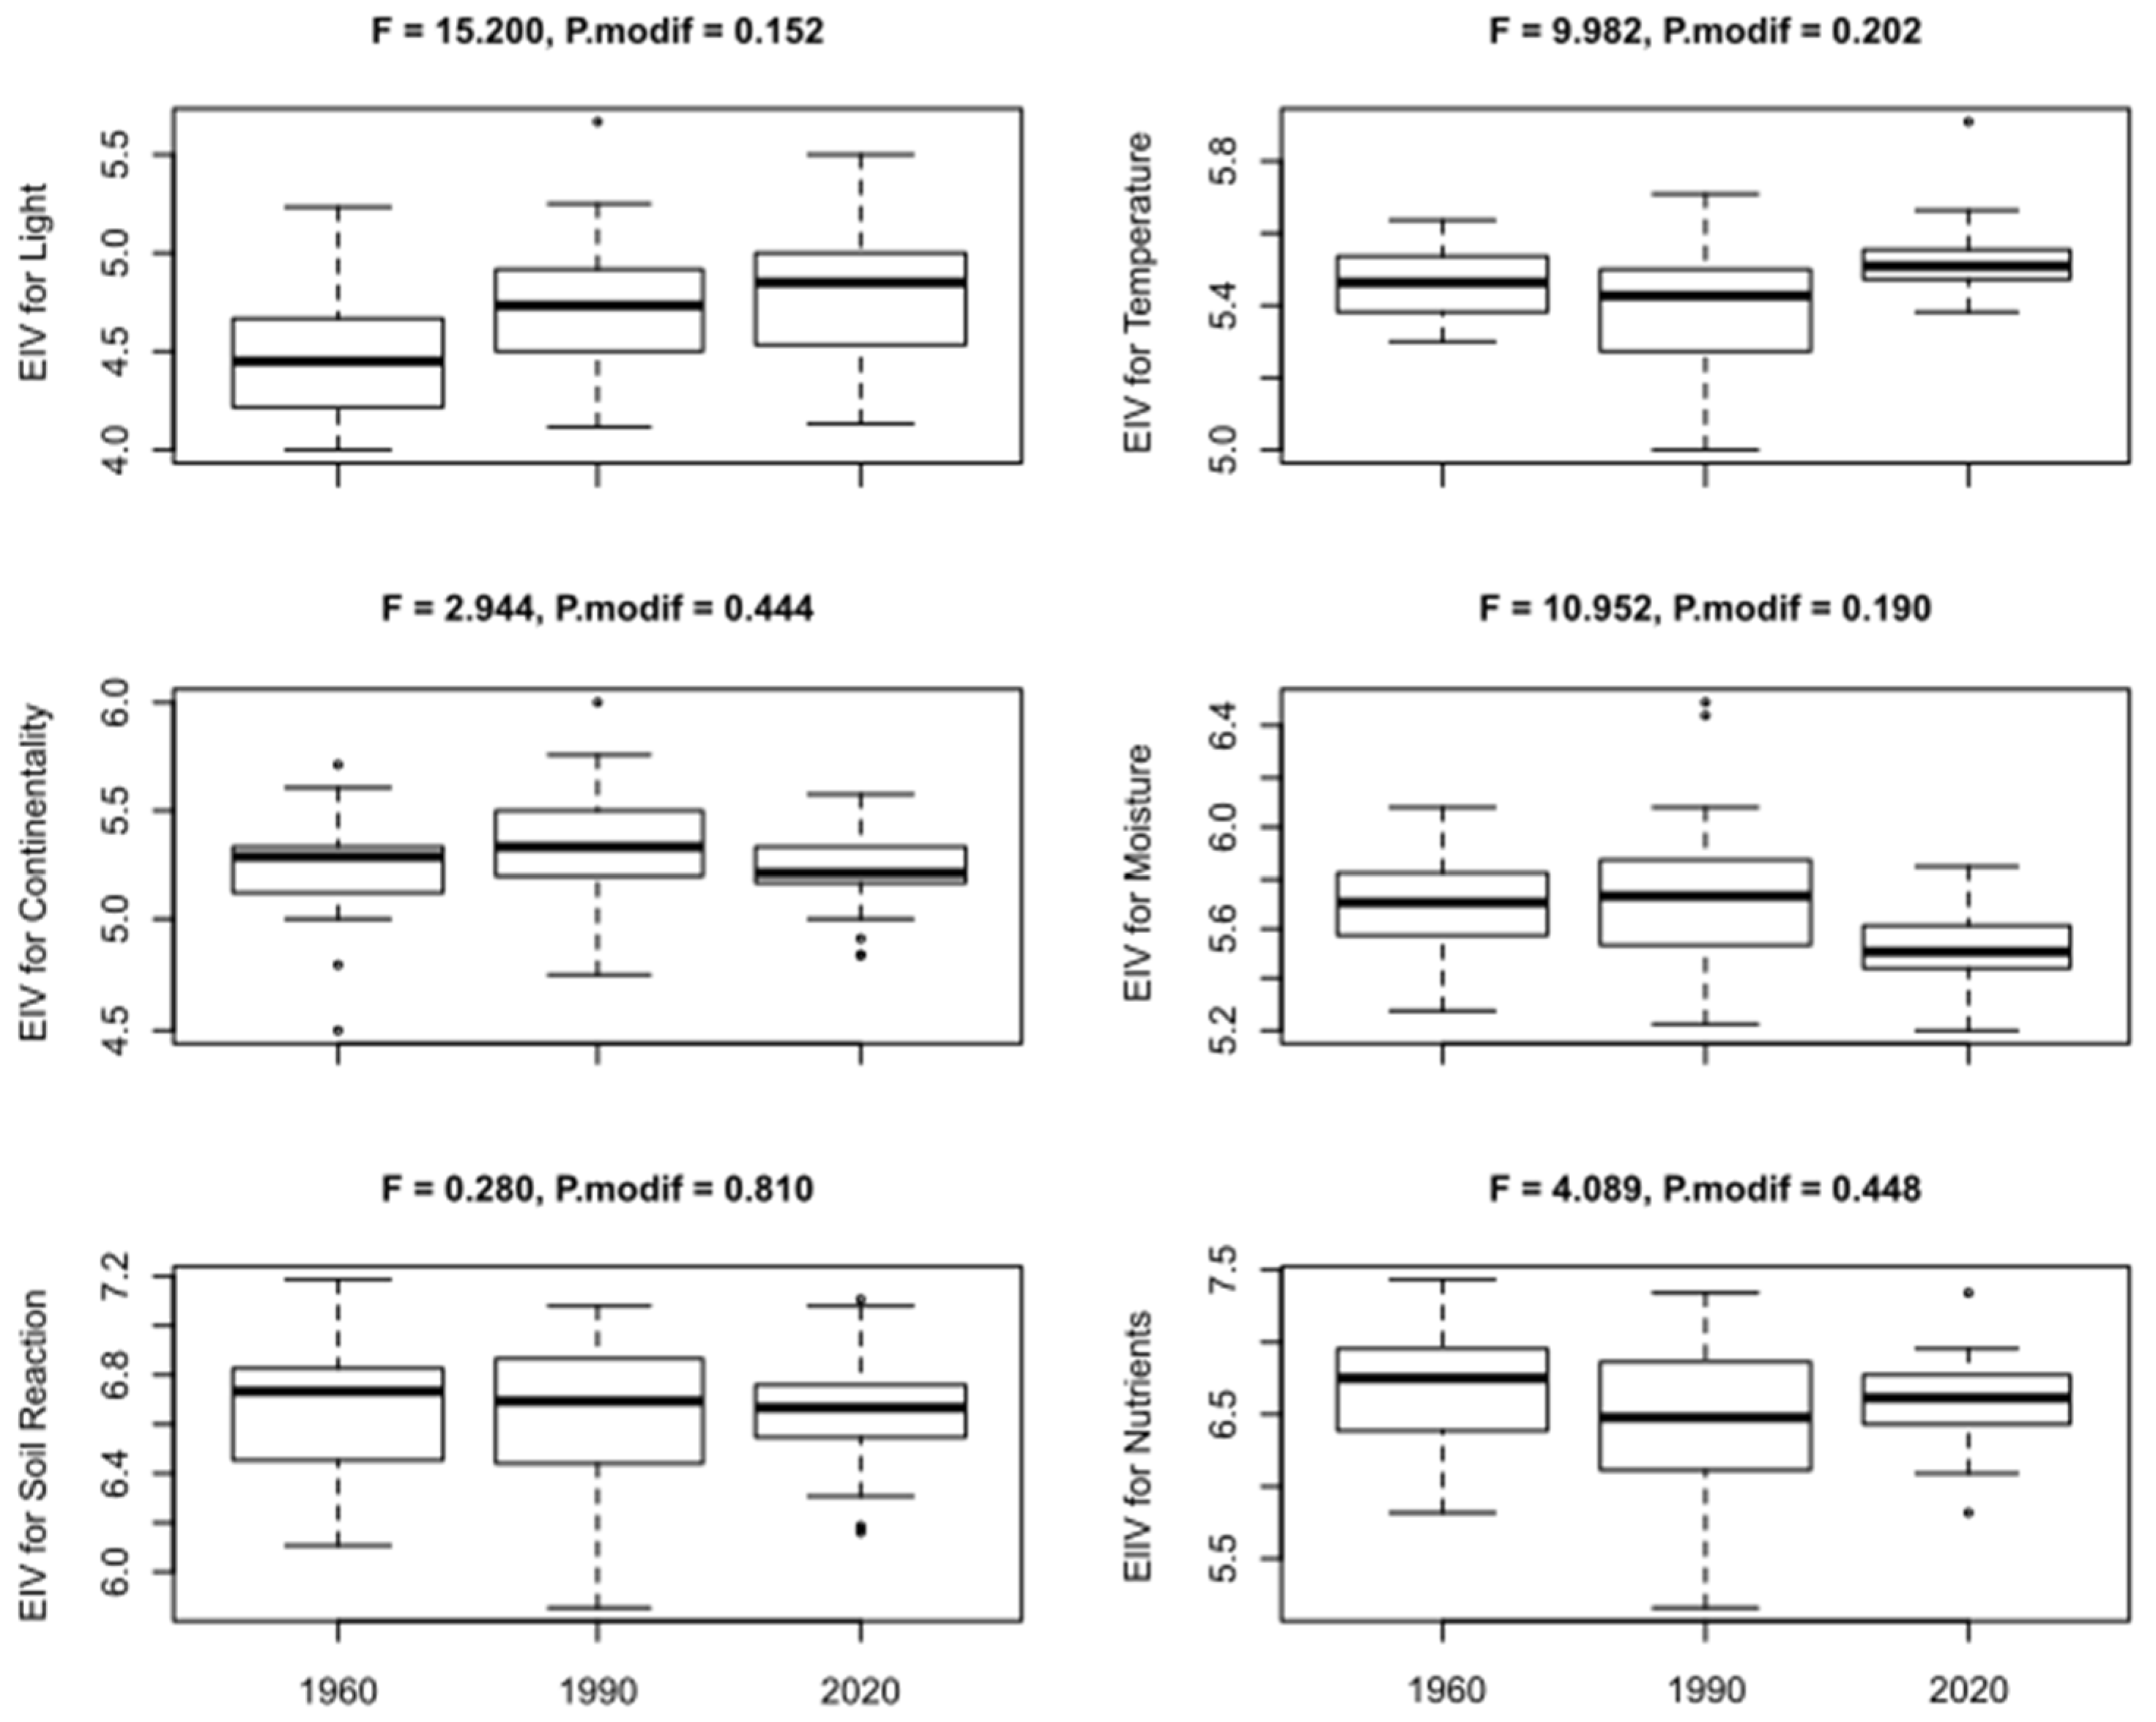
2.3.2. Habitat Conditions

Due to the lack of direct measurements of environmental conditions in the baseline and current research, we estimated habitat conditions indirectly using litter quality index (LQ) and Ellenberg’s Indicator Values (EIVs). Both measures derived from the species composition of studied plots.
The change in the composition of the canopy, including tree and shrub layers, was quantified using mean LQ. The LQ ranges from 1 (slow litter decomposition rate) to 5 (fast litter decomposition rate). Indices scores for tree and shrub species follow those used by Verheyen et al. [68] and Šipoš et al. [69] (see Supplementary Materials, Table S2). We calculated the mean value of LQ weighted by species cover for shrub (LQs) and tree (LQt) layers separately for each plot. Differences between the LQ values between subsequent surveys were tested using the Kruskal–Wallis test and Dunn’s post hoc test. The EIVs, weighted by species cover, were calculated for light, temperature, moisture, continentality, soil reaction, and nutrients. We used Ellenberg’s Indicator table [70], modified and implemented in JUICE software [71].
We conducted a detrended correspondence analysis (DCA) to explore differentiation patterns in plant species composition of plots between the subsequent surveys and to check the percentage of variation explained. For this purpose, species cover was transformed with Log (1 × X + 1) and rare species were down-weighted. The distribution of the sample groups on the DCA diagram was visualized and interpreted by the passive plotting of the Year supplementary variable. The DCA was conducted in CANOCO 5.12 software (Microcomputer Power: Ithaca, NY, USA) [72].
To identify the statistical significance of correlations between the DCA sample scores and mean randomized EIVs (treated as proxy data to environmental changes) for relevés, a modified permutation test with 499 unrestricted permutations was conducted. The test was performed with MoPeT_v1.2.r script [73] in R software [74]. The Spearman rho coefficient expressed the correlation between EIVs and sample scores. Permutational analysis of variance (one-way ANOVA on the mean randomized EIVs) and modified permutation test (with 499 unrestricted permutations) were also calculated using MoPeT_v1.2.r to determine which EIVs differentiate the subsequent surveys. Using permutational ANOVA is an alternative to other tests under non-normal conditions, because it does not operate under the assumption of normality and uses actual scores [75]. This analysis allows determining possible changes in the environmental conditions influencing the forest floor over time.

2.3.3. Plant Functional Traits

In this study we focus on the plant functional traits which are considered the core of plant life strategy [76] and belong to response traits [77]. These are specific leaf area (SLA, mm2⋅mg−1; the ratio of leaf area to leaf dry mass), leaf area (LA, mm2; one-sided or projected area of an individual leaf), plant height (H, m; plant vegetative height at maturity), and seed mass (SM, g).
Higher values of the SLA reflect higher investment in photosynthesis and fast growth. They are typical of short-lived species which do not invest in support and storage organs, and often are weakly protected against herbivores [2]. At the same time, their response to the spatial patchiness of light and soil resources may be more flexible [76]. On the other hand, most of the species with low SLA are long-lived and marked by slow growth, high investment in support and storage organs, and higher resistance to drought and herbivory [2]. Therefore, an increase in SLA values may suggest a higher level of competition, but simultaneously a lower level of stressful conditions [42,78]. Species with higher LA are expected to dominate in shadier, more humid habitats. However, any stressful condition such as heat stress, cold stress, drought stress, or nutrient stress tends to select for relatively small leaves [79]. Plant height is associated with a competitive ability and reflects trades off between avoidance and tolerance of environmental conditions (e.g., nutrient and light availability) [42,76]. Seed mass expresses the chance of species for successful dispersion and establishment in a new area [76]. Additionally, it provides information on seed bank longevity which is expected to be lower in habitats with a high level of environmental stress [80]. It has already been proved that the SM increases with the shadiness of the habitat and mean vegetation height. SM is also expected to decrease in more disturbed habitats [81].
We obtained trait values from the LEDA database [82]. We used mean species values for traits and did not consider intraspecific trait variation [43,83], (see Supplementary Materials, Table S3). We excluded all woody species (tree, shrub) from the dataset in this part of the data analysis. Therefore, only herbaceous plants (listed in Supplementary Materials, Table S4) were assigned mean trait values. Trait attributes were analyzed for 92 out of the 97 species recorded in the herb layer, whereas the remaining five species, without full representativeness of trait attributes, were removed from the dataset [84].
The functional structure of the plant community can be reflected by different metrics [85,86,87]. In this study we focused on the community weighted mean of traits (CWM) [85,88] and Rao’s quadratic entropy (FDQ) [89]. The former is widely used in vegetation ecology and is a mean of trait values present in the community weighted by the relative abundance of taxa bearing each value [85]. In other words, the CWM index reflects the trait value of the dominant species in a community [42]. The FDQ is an index of functional diversity which incorporates species abundances and a measure of the pairwise functional differences between species [89]. It quantifies how much dominant species diverge in their trait values; thus, its increased value may indicate a higher degree of niche differentiation [41,42]. Moreover, it can be calculated for more than one trait and is not affected by species richness [89]. The latter feature of this index is critical because, in this study, we analyzed vegetation within semi-permanent plots surveyed by different researchers.
Differences in CWMs and FDQ between subsequent surveys were tested using the Kruskal–Wallis test and Dunn’s post hoc test. Additionally, in CANOCO 5.12 software [72] we conducted a redundancy analysis (RDA) in which the explanatory variable was the year of each survey and CWMs were treated as response variables. All traits we used were continuous in character and log-transformed before the analyses.

3. Results

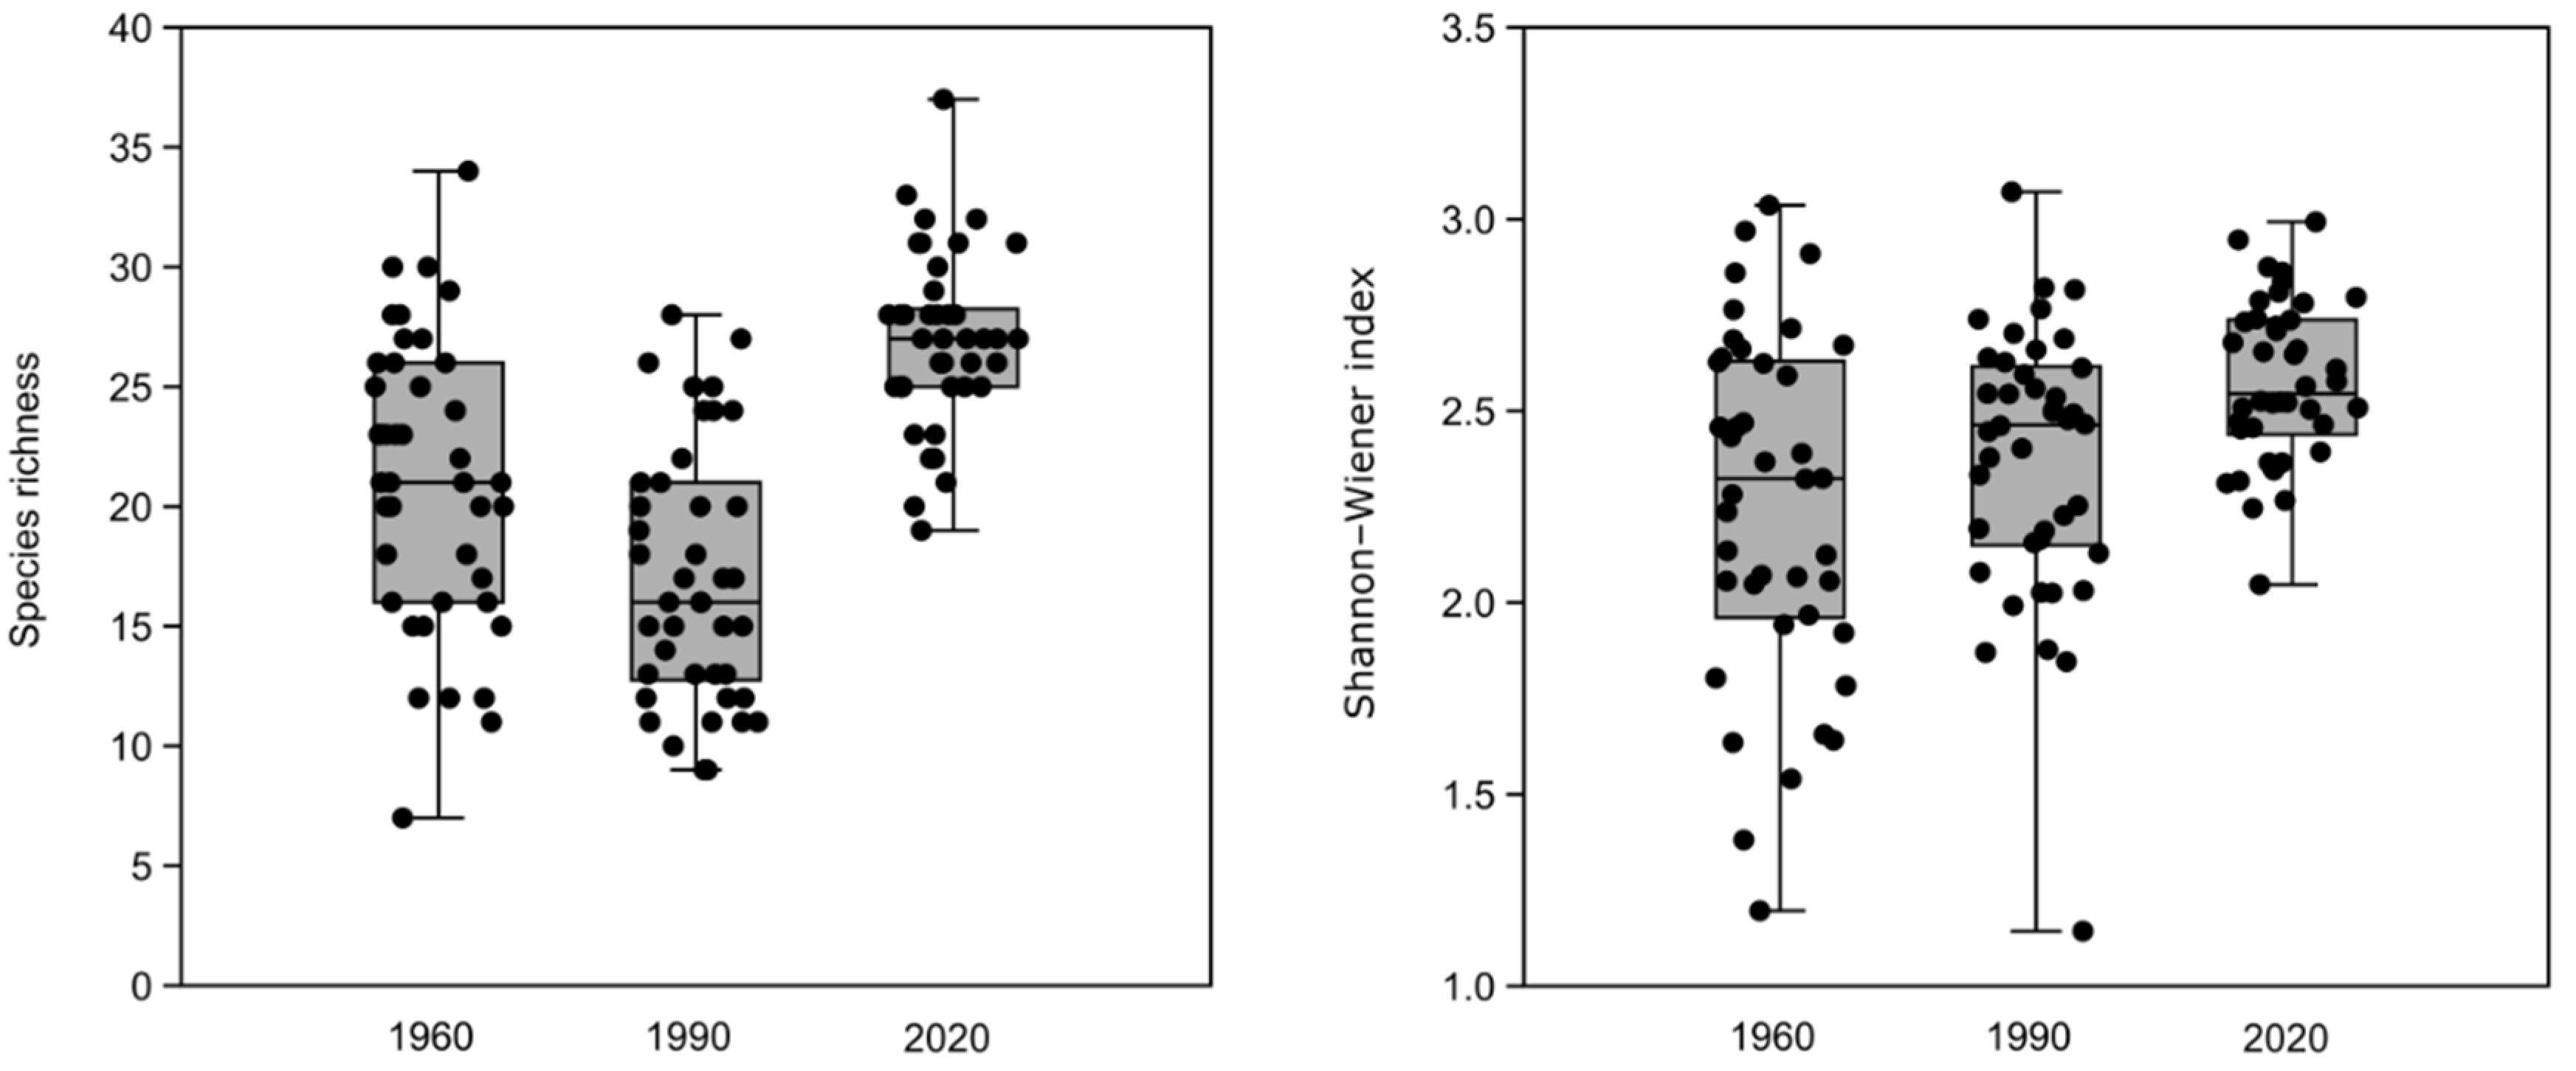
3.1. Changes in Species Diversity

In the understory of studied nature reserves, 130 species were recorded, including 32 woody and 98 non-woody species. The total species richness has slightly increased over time, from 82 (64 non-woody) in 1960, through 97 (78 non-woody) in 1990, up to 101 species (77 non-woody) in 2020. Differences in the total species number were statistically significant (H = 51.41, p < 0.001) between 1960 and 1990 (p < 0.01), between 1990–2020 (p < 0.001), as well as 1960–2020 (p < 0.001).
The median of the Shannon–Wiener index also increased from 2.26 (1960), through 2.37 (1990), up to 2.58 (2020). Differences in this species diversity metric (Figure 2) calculated for relevés were significant (H = 14.11, p < 0.001) between the following time periods: 1960–2020 (p < 0.001) and 1990–2020 (p < 0.05).

3.2. Changes in Species Composition

The analysis conducted in JUICE revealed differences in species composition between studied surveys. We identified differentiating species for each survey. The first and the second surveys were marked by species typical of riparian forests. Although these taxa were also found during the recent survey, their frequency and cover in particular plots were significantly lower (Table 1). A distinctive feature of the species composition in 2020 was the presence of the nutrient-demanding and fast-colonizing species, which currently play a diagnostic role within studied forest communities (e.g., Impatiens parviflora, Chelidonium majus, Galeopsis tetrahit, Chaerophyllum aromaticum). The latter period was also marked by the increased proportion of juveniles of Acer campestre, A. pseudoplatanus, Carpinus betulus, Crataegus monogyna, Fraxinus excelsior, Quercus robur, Sambucus nigra, and Tilia cordata.
Changes in the proportion of alien species were also clearly visible (Table 2). During the baseline survey (1960) any alien species were recorded. Since 1990 Impatiens parviflora has been observed. However, its frequency and cover (mean cover 2%) were low. In 2020, Impatiens parviflora became one of the dominant species (mean cover 14%), and six other alien species were recorded. All alien species, except for Impatiens parviflora, occur with low frequency and cover (less than 2%). However, some of them, for example Solidago gigantea, are known as highly invasive and may affect the species composition of studied forests in near future.

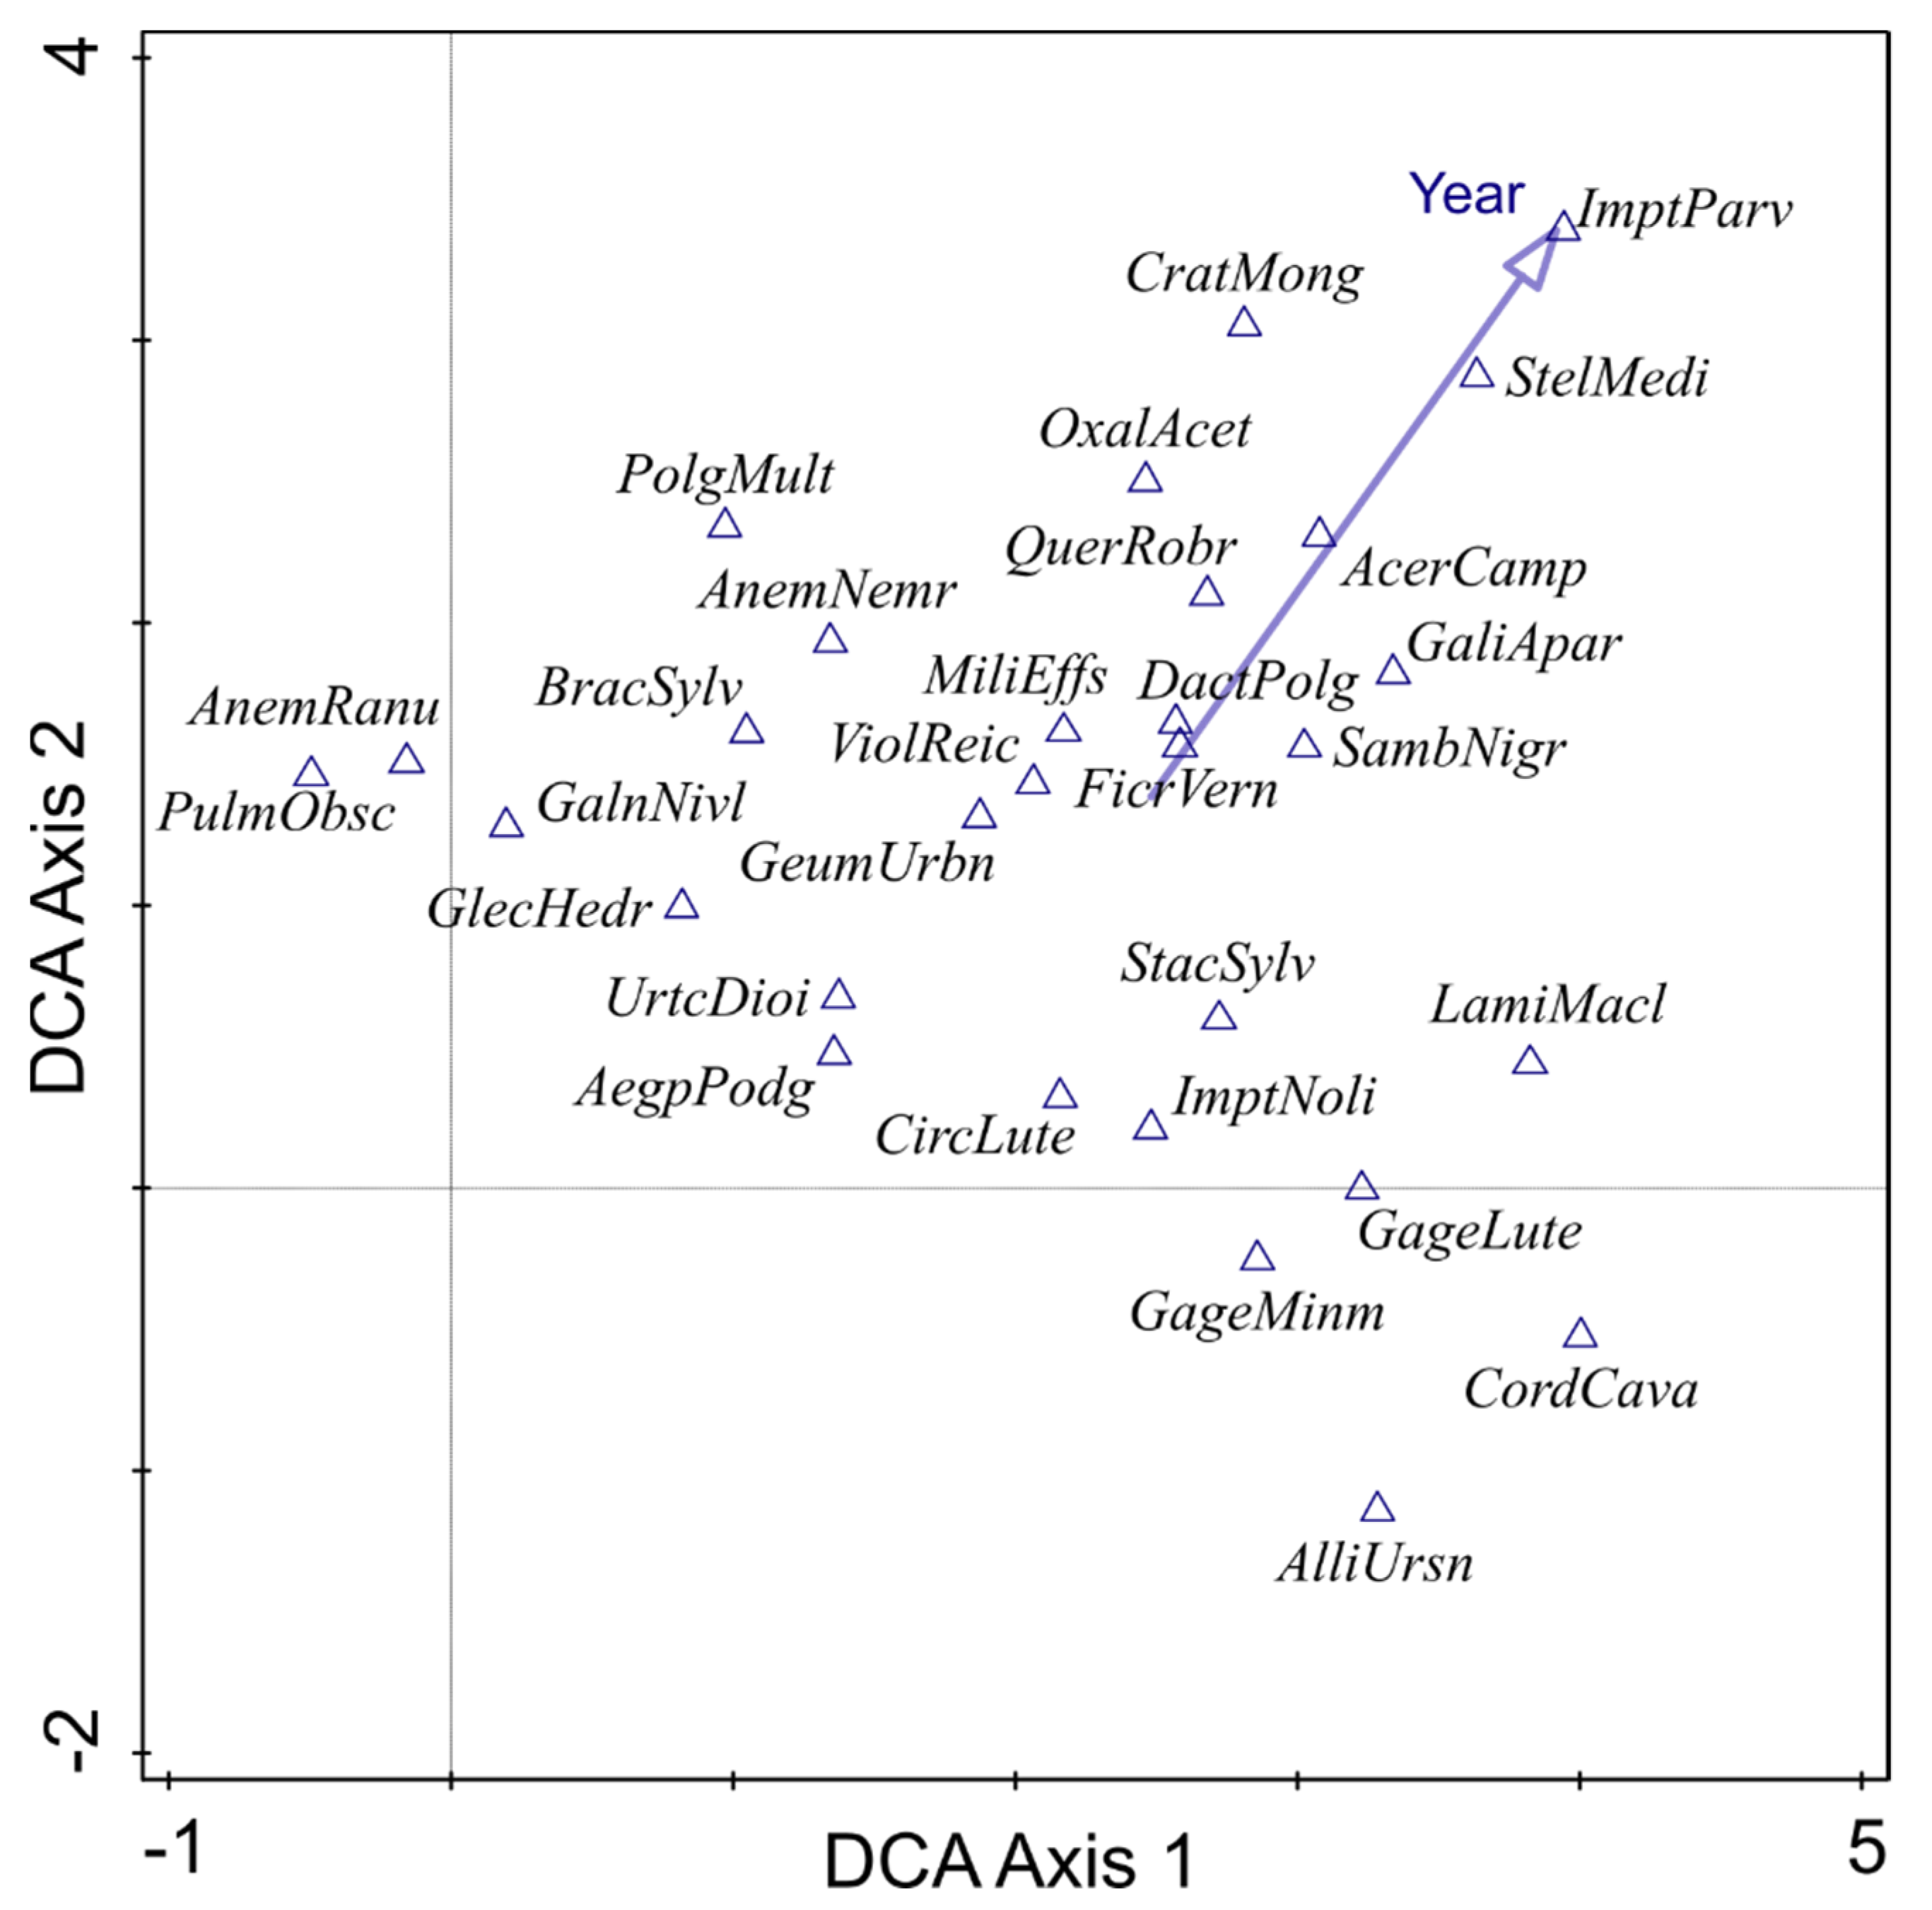
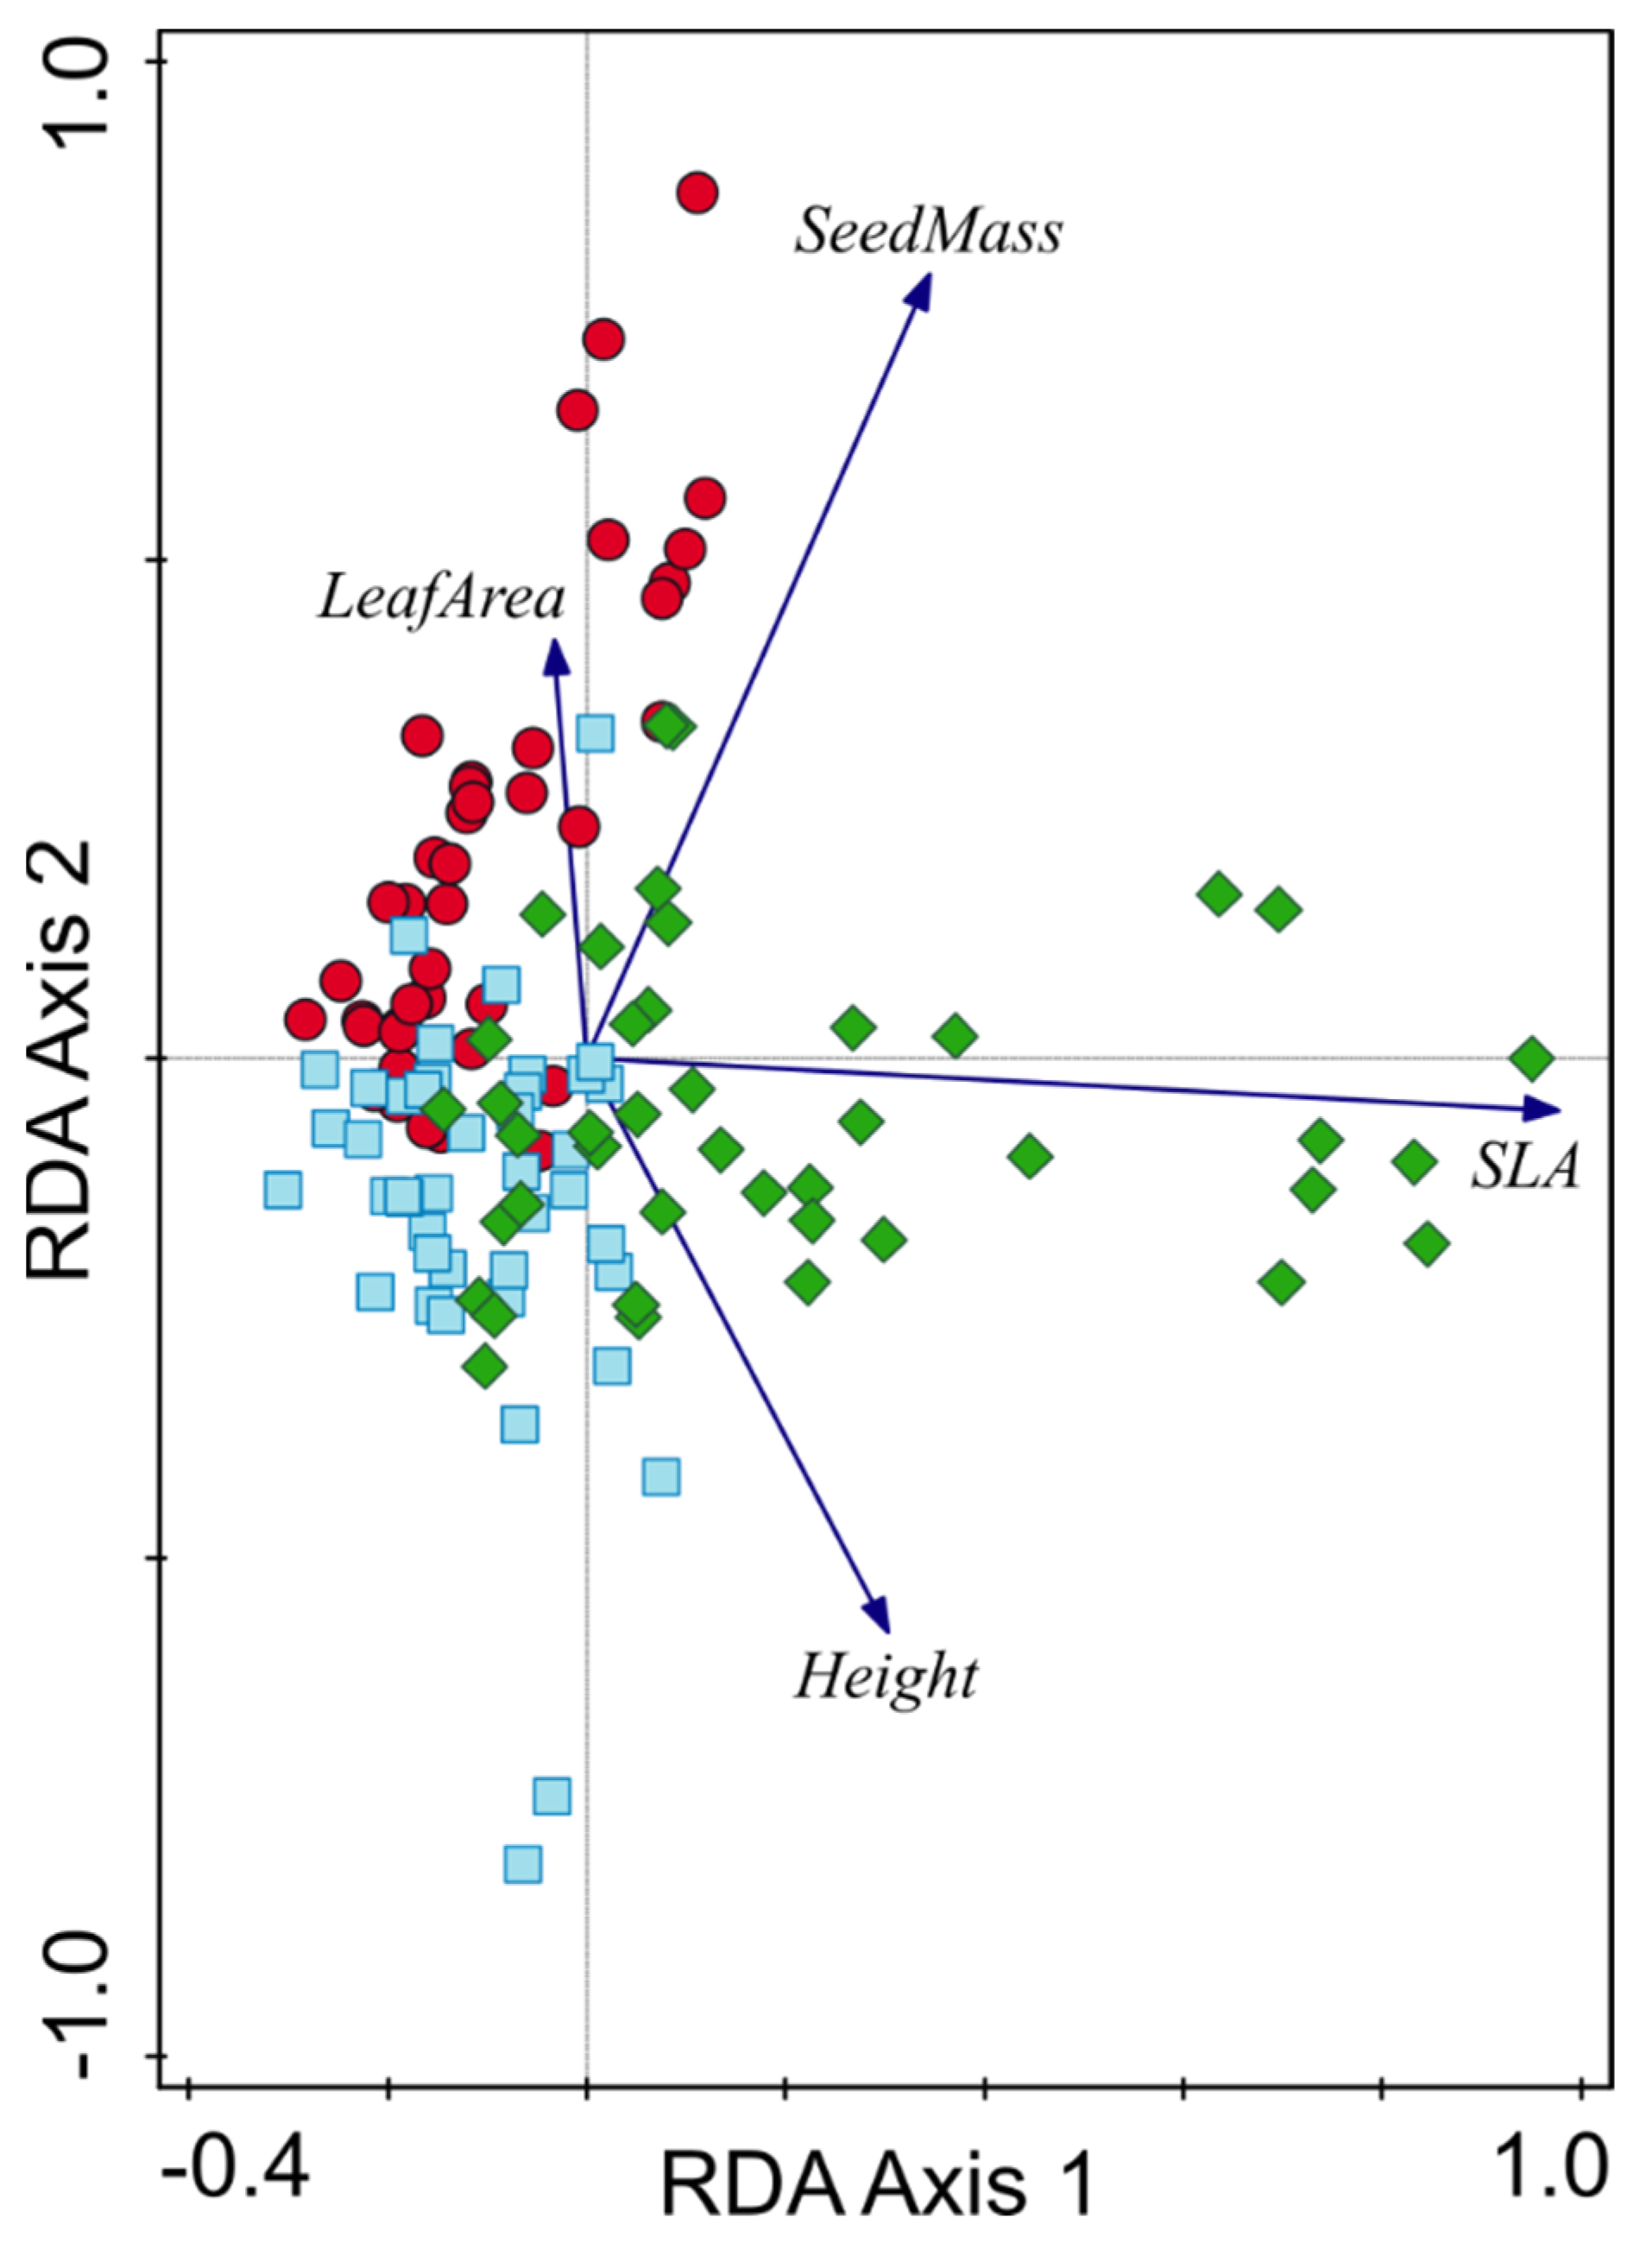
3.3. Temporal Changes in Herbaceous Vegetation Pattern

DCA ordination diagram (Figure 3) shows a species compositional pattern for all subsequent surveys, with a passive projection of Year variable. The DCA results revealed that the first and the second axes explained 9.64% and 6.81% of the compositional variability of the studied forests, respectively.
The results of DCA suggest that the distribution of the sampled plots correspond with the vector of time, indicative by a shift from the lower left (1960) towards the upper right (2020) of the ordination diagram (Figure 3). The same diagram with species instead of sample plots showed that the most recent survey is marked by the nutrient-demanding species, such as Impatiens parviflora, Stellaria media, Galium aparine, and additionally some juveniles (Figure 4).
Correlation analysis of mean EIVs and main compositional gradients (reflected by the DCA sample scores) showed statistically significant correlations only along the second DCA axis. The distribution of sample scores was correlated to the EIVs for moisture (p < 0.02) and nutrients (p < 0.05) (Table 3).
On the other hand, ANOVA revealed no statistically significant differences in the mean EIVs between the studied time periods (Figure 5), although the EIV for light showed a steady increase over the last 60 years.

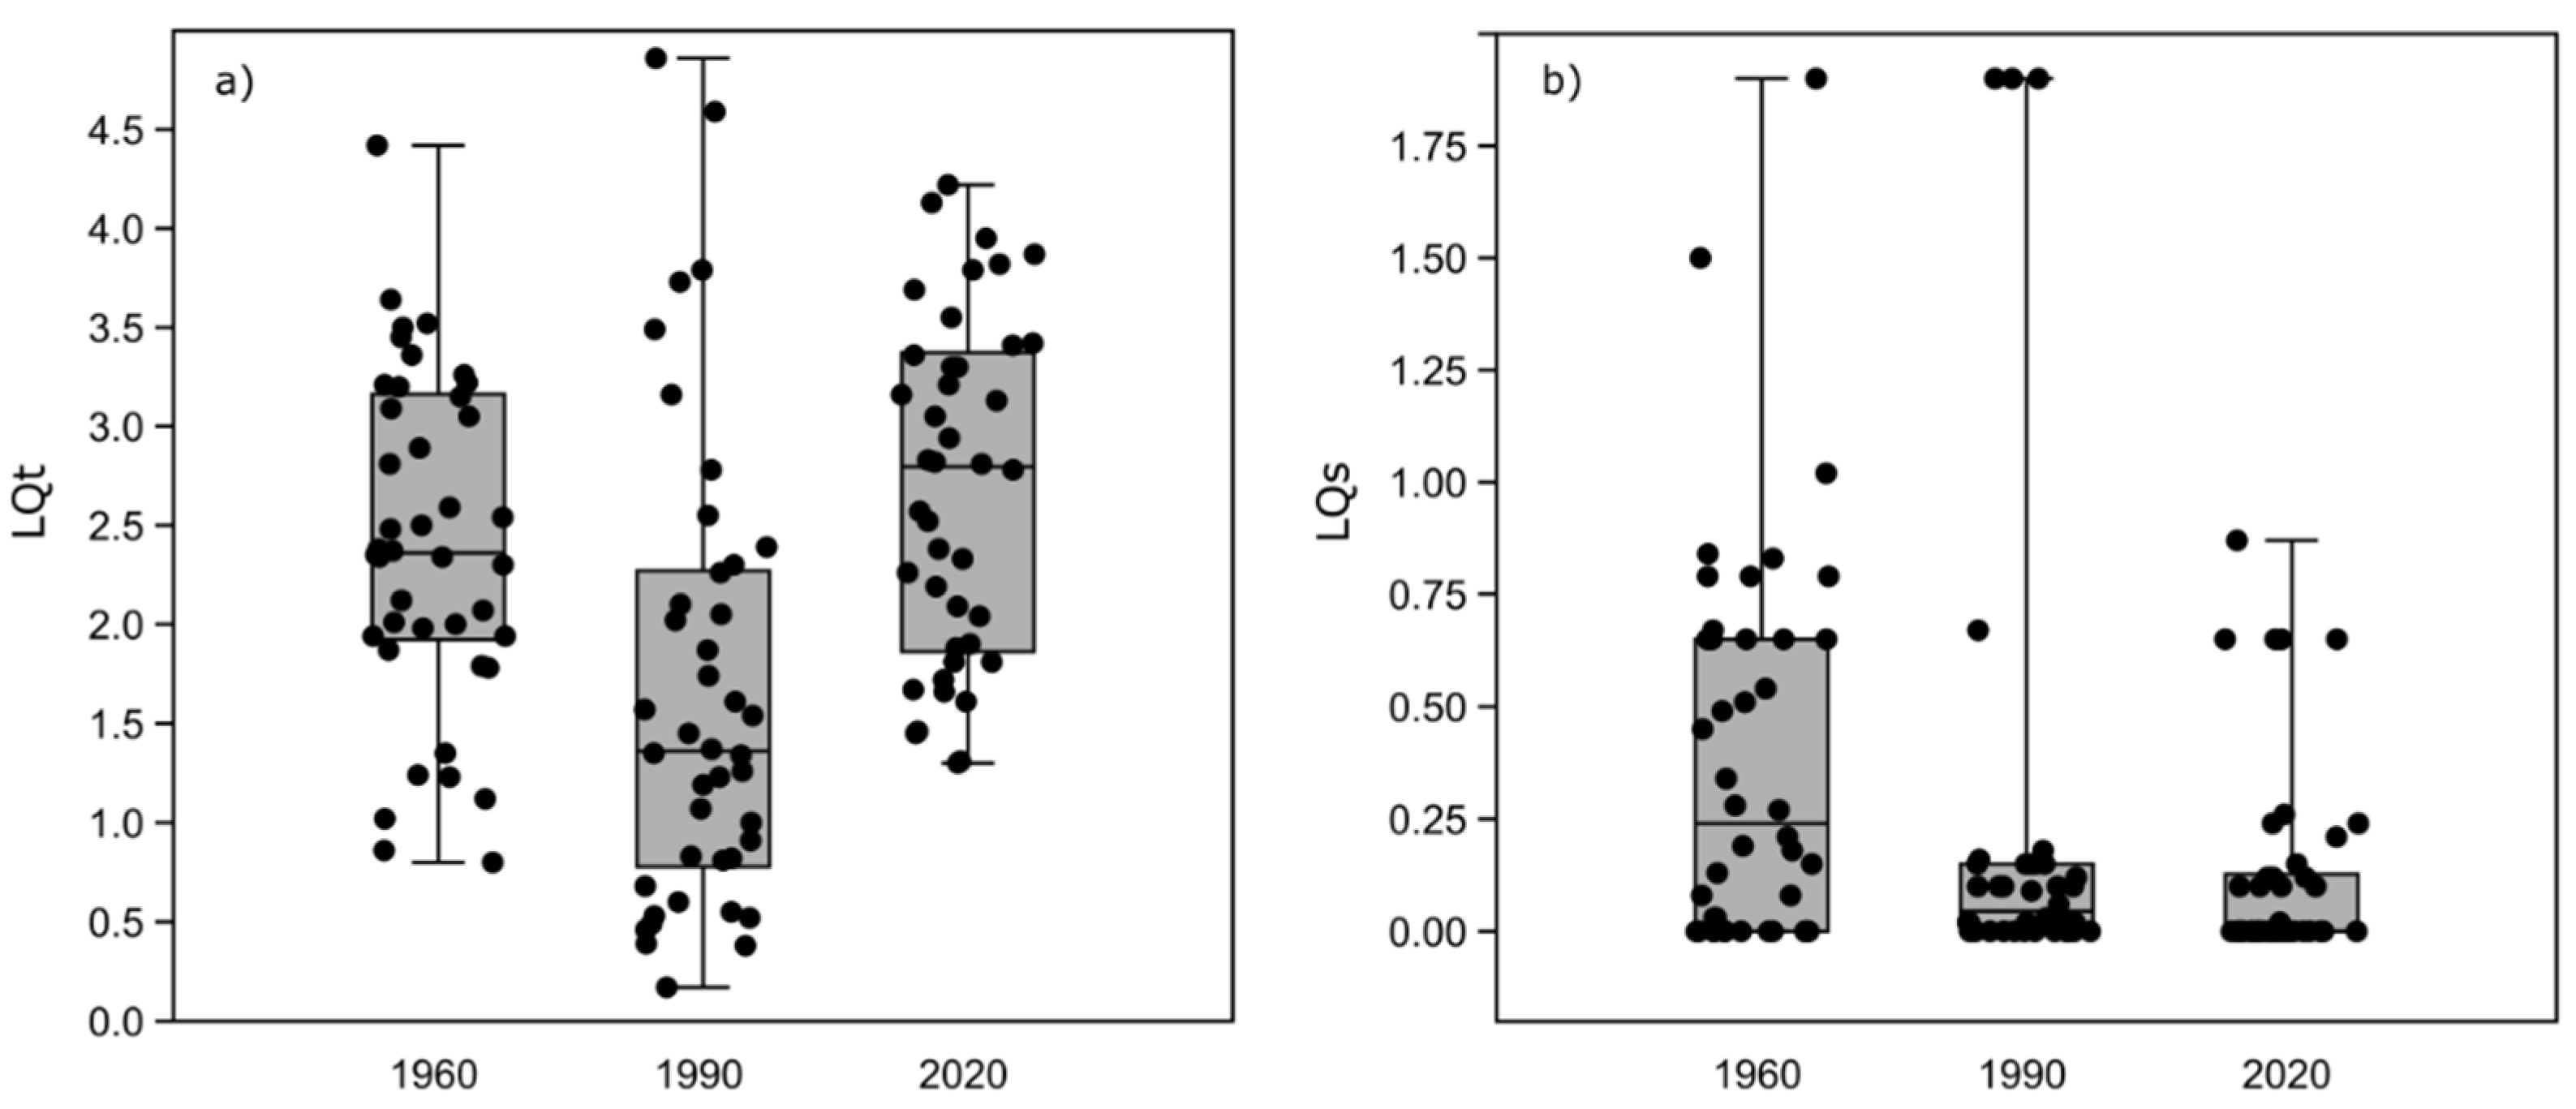
3.4. Changes in Litter Quality Index

We found no statistically significant changes in the litter quality index for trees (LQt) between 1960 and 2020 (p = 0.25), although there was a difference between the first and the last surveys and the middle one (in both cases p < 0.001, see Figure 6a). On the other hand, the litter quality index for shrubs (LQs) has gradually decreased (see Figure 6b), with statistically important differences between 1960 and 2020 (H = 11.4, p < 0.002).

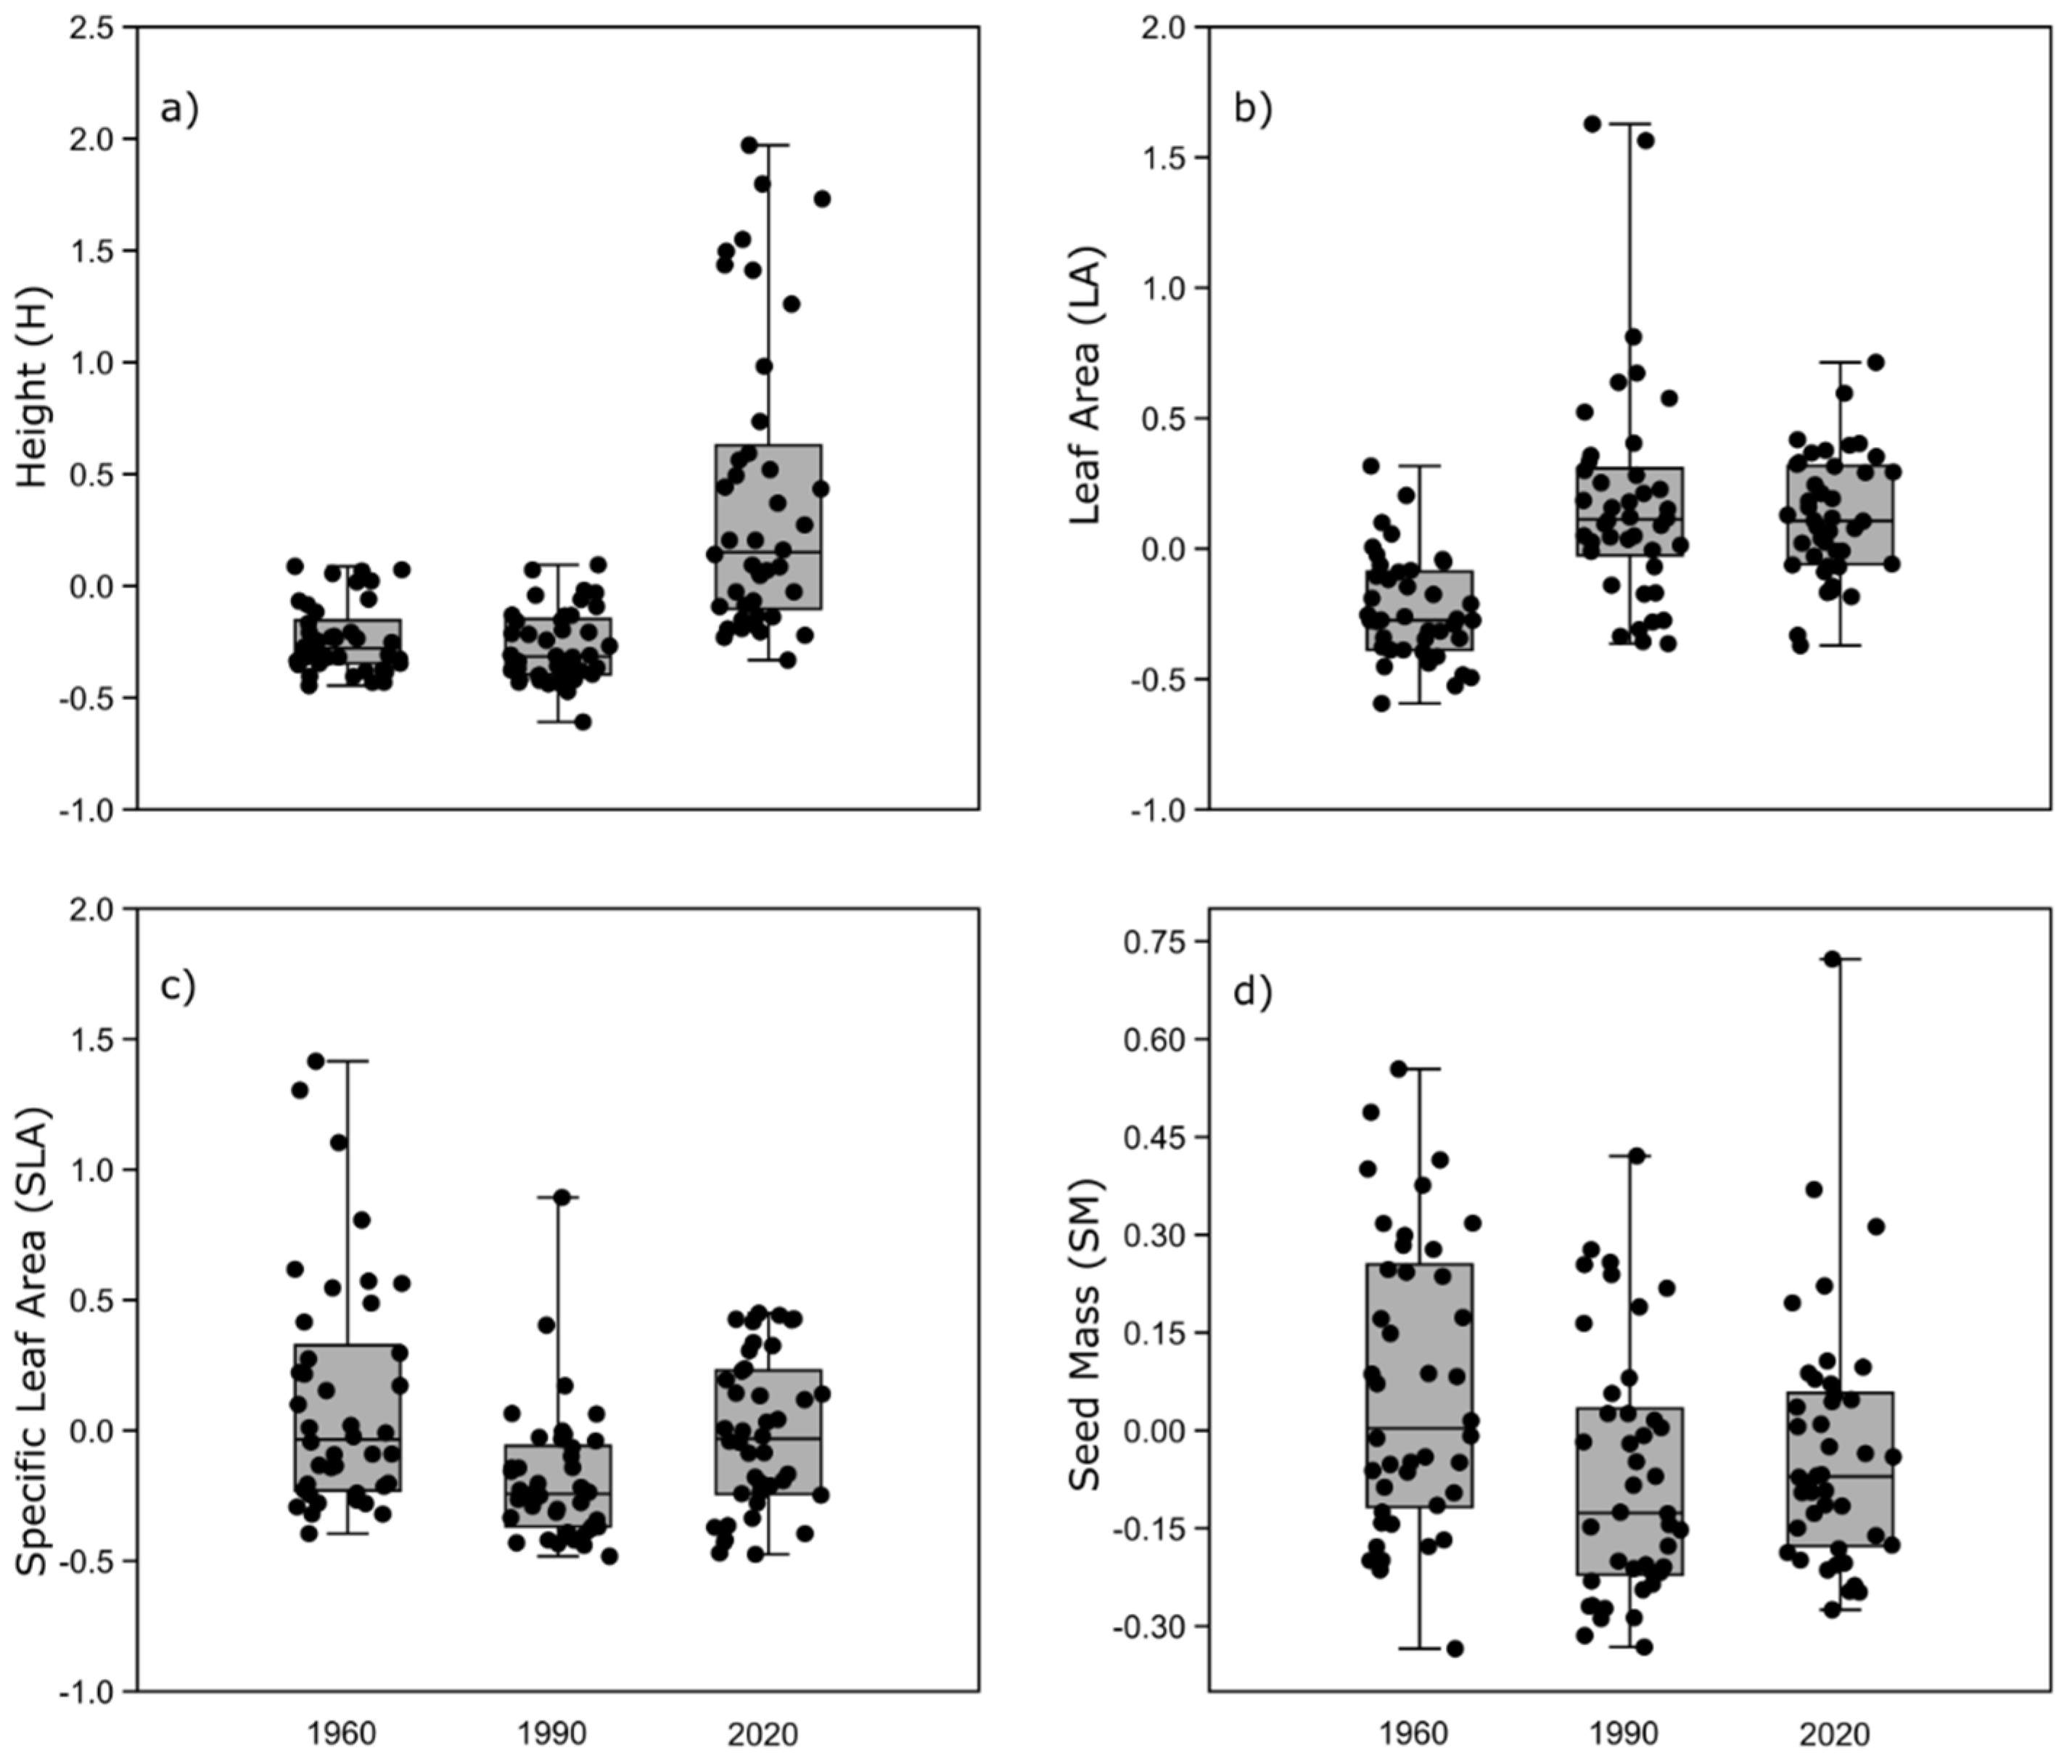
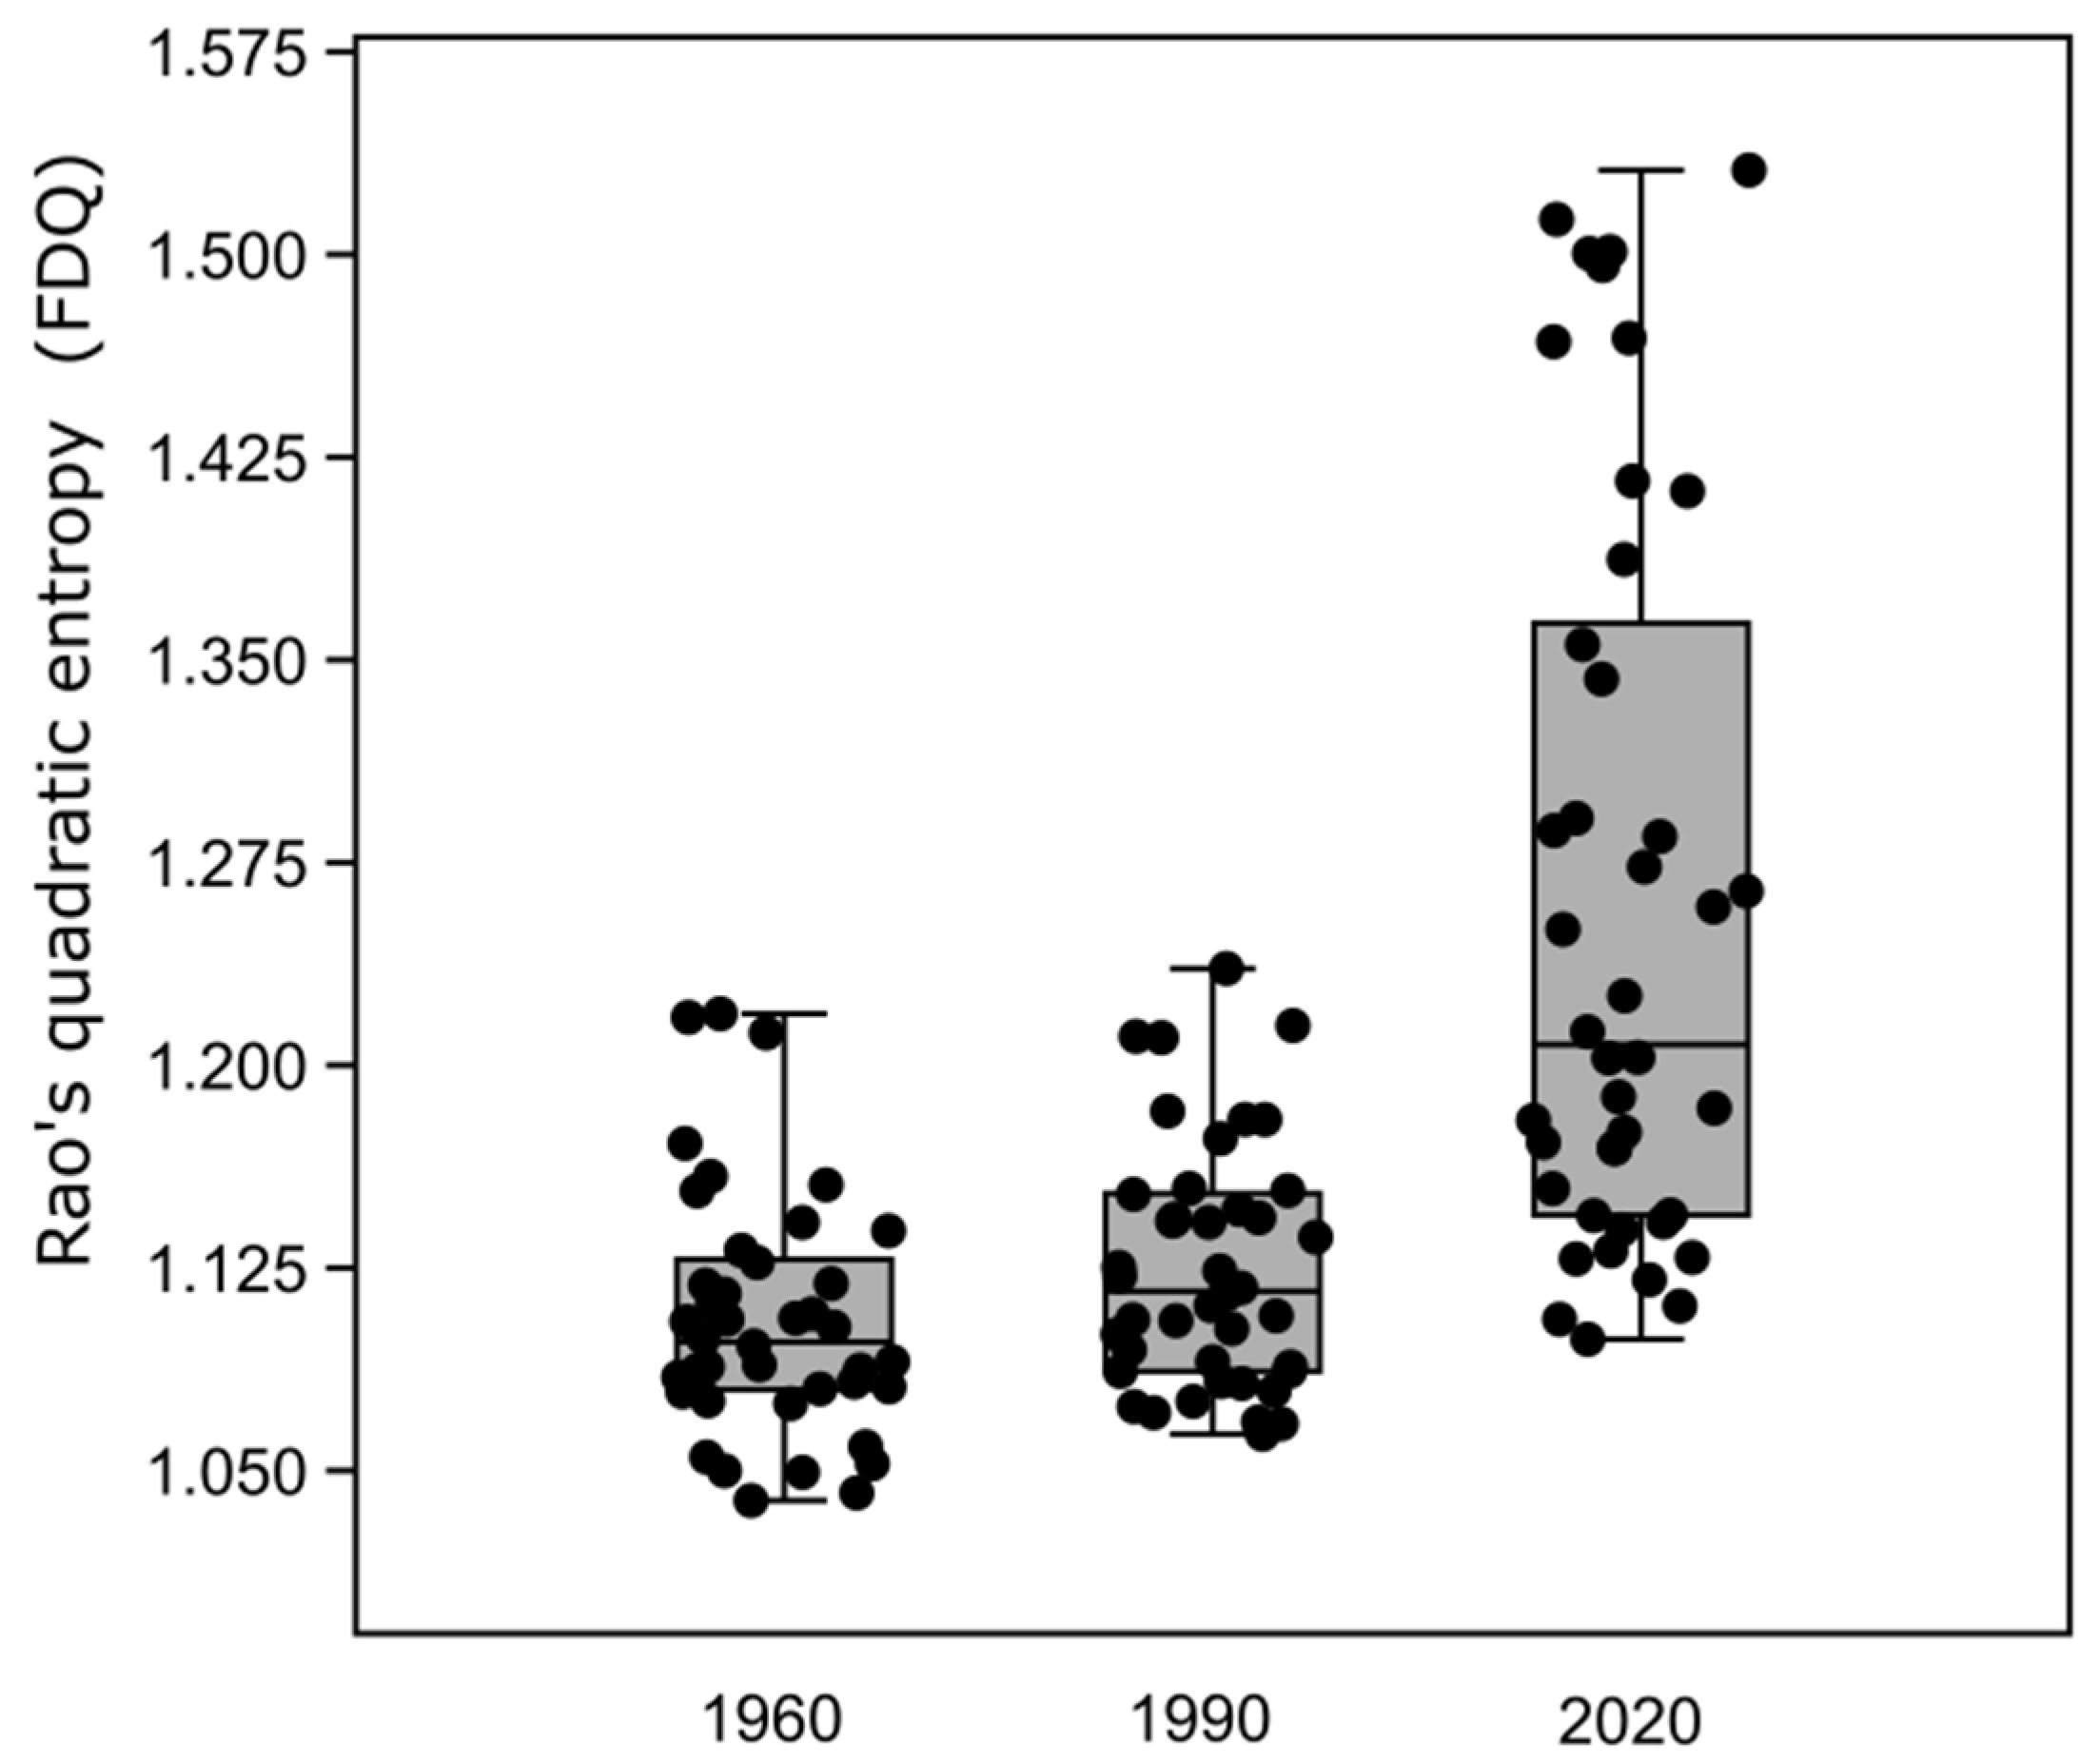
3.5. Changes in Functional Structure

Analysis of the CWMs of functional traits suggests that some have been unchanged in the herb layer since 1960. For two functional traits, we found changes with a high level of significance between 1960 and 2020. Changes in CWM for SLA were non-significant between 1960 and 1990 (Figure 7a), but during the last 30 years the value of this trait suddenly increased, with a high level of significance (H = 54.76, p << 0.001). On the other hand, the mean height of the herb layer significantly increased between 1960 and 1990 (p << 0.001) (Figure 7b), and between 1960 and 2020 (p < 0.001).
There were no significant differences between the first and the last period of investigation concerning LA (p = 0.13, Figure 7c) and SM (p = 0.4, Figure 7d).
The results of the RDA also suggested that the CWMs of studied plant functional traits were not equally responsible for the observed changes in functional structure of individual patches. All plots investigated between 1960 and 1990 showed a high consistency of functional features. Only some of them were marked by a high level of CWMs for seed mass and height. However, in the most recent survey, several analyzed patches showed much higher values of SLA, and partially also of height, which has been already confirmed by the presented analysis of changes in functional traits over time (Figure 8). The first axis, that explained 17.4% of the variation, was correlated with changes in SLA over time. The second axis, explaining 38.38% of the variability, seemed to correlate with leaf area, height, and seed mass, accounting more for the internal variability of the investigated plots (Figure 8). In the first period of investigation plots were marked by the higher values of the CWMs for LA and SM, and during the second and third surveys the CWMs for H increased.
Functional diversity FDQ (measured as Rao’s quadratic entropy) of the investigated forests were stable from 1960 to 1990 (p = 0.35), and after 1990 it rapidly increased (Figure 9). There were significant differences between 1960 and 2020, as well as between 1990 and 2020 (p < 0.001).

4. Discussion

4.1. Species Composition and Diversity Change

We observed significant qualitative and quantitative changes in the herbaceous vegetation of the studied riparian forests over the last six decades, which refer to species composition, richness, and diversity. Our results revealed that the species composition of the studied forests has shifted from the community with a significant proportion of forest specialists [90] (e.g., Aegopodium podagraria, Ajuga reptans, Paris quadrifolia, Symphytum tuberosum) to the one in which nutrient-demanding species play a differentiating role (Impatiens parviflora, Chelidonium majus, Galeopsis tetrahit) (Table 1).
It is also worth mentioning that in these forests there are neophytes which considerably increased their frequency and coverage over the study time (Table 2). Their presence agrees with earlier studies which indicated that the riparian forests are the communities highly vulnerable to plant invasions [29,91,92]. The observed compositional change translates into alterations in species richness and diversity—both metrics showed a significant increase in their values, especially during the last three decades (Figure 2). Therefore, studied forests follow the widely observed pattern of changes currently taking place in forest ecosystems of the temperate zone. The replacement of species typical of forests by disturbance-adapted and nutrient-demanding taxa has been recently extensively reported [12,68,93].
Interestingly, this phenomenon has not yet caused a decline in species richness at the local scale. The loss or decline in the proportion of forest specialists is balanced by species gains [93], which is also true for the present study. The gradual increase in species richness that we observed may be explained by the intermediate disturbance hypothesis, described by Connell [94], who stated that disturbances at an intermediate level maximized species richness. However, an increase in this parameter is often due to the appearance of early-successional, light-demanding, and invasive species that often replace shade-tolerant forest specialists [95]. For these reasons, the total species number per se cannot be treated as the only indicator of forest conservation values, since such an increase is often caused by the entry into the forest by species responding to local disturbance [96]. Our study shows the same patterns, since these gains in species number are associated with the increased role of species that, over a long period, may negatively affect the pool of true forest species associated with forest interiors.

4.2. Possible Reasons for the Change in Species Composition

According to Verheyen et al. [68], the increasing proportion of nutrient-demanding species may result from a rising density of tree canopy and changes in its composition in favor of tree species with a higher LQ index [68]. However, in the present study, LQ remained similar over time (LQt), or decreased (LQs); thus, we may assume it did not affect the species turnover. The increase in species richness from the initial study up to the recent survey may also be connected with high levels of nutrients, which is in line with findings of Bernhardt-Römermann et al. [97] and Naaf and Kolk [98], but in contrast to Verstraeten et al. [99] who revealed a decline in the mean species richness on neutral-sites. Regarding the presence of alien species in PAs, studies conducted in Central Europe pointed out that nature reserves were also affected by the invasion of species, although, in general, it seemed to be less harmful than in the case of managed forests [26,29,100]. Notably, the study of Pyšek et al. [34] confirmed that the older the nature reserve is, the more resistant to invasions. Such tendencies can be due to the usually higher species richness observed in nature reserves, and the much better condition of the plant communities protected inside them [100]. It was also examined that, in more diverse and well-preserved (undisturbed) forest communities, alien species coexist with the native ones rather than compete, contributing to higher species richness and diversity, or the lack of significant, qualitative, and quantitative changes in this respect [34,68,101].

4.3. Changes in Vegetation Type and Habitat Conditions

Our findings also suggest that although the species composition of the studied riparian forests was less diverse (lower species richness and diversity) in the 1960s, the older plots themselves differed more in terms of habitat conditions. It is visible on the DCA diagram, where the distribution of the studied plots along the second axis is correlated with the EIVs for moisture (Figure 3), and nutrients (Table 3), and in the DCA plot presenting the distribution of species (Figure 4). Such an arrangement of the sample scores and species corresponds with the tendencies observed in the nature reserves, reported in the earlier studies [56,57,58,59], that emphasized the presence of mainly two types of forest communities different in reference to moisture conditions, i.e., hardwood floodplain forest and oak-hornbeam forest. Nowadays, the forest communities of the studied nature reserves are more abundant in species, and simultaneously, their species composition is more diverse (Figure 2). However, they seem to be more homogenized in terms of these two metrics, which may be connected with the homogenization of edaphic conditions (e.g., ameliorations, the lack of periodic floods, thus slightly lower moisture). The direction of these changes is not surprising since the transition of the European floodplain forests towards drier communities, such as oak-hornbeam forests, has been widely reported [91,92,102]. Nevertheless, the ANOVA conducted for the entire dataset did not reveal any statistically important differences between surveys in the mean values of the EIVs, although some slight upward and downward trends are visible in reference to light and moisture, respectively (Figure 5). Such results may suggest that studied communities have not substantially changed in terms of habitat conditions over the last 60 years. However, this would be an exception in the background of recent studies, in which temporal changes in environmental conditions are widely reported from deciduous forests [97,98,99,103].

4.4. Functional Structure

Studied riparian forests have changed significantly over time in terms of functional structure. The analysis of the CWMs revealed that herbaceous vegetation has become dominated by species with higher values of the SLA and height (H) (Figure 7). Such species, which are usually shade-tolerant, highly competitive, and less stress-resistant (Table 1 and Table 2), gradually replace typical forest species with lower values of the abovementioned traits, thus, to a greater extent shaping the present functional structure of the studied forest communities [93].
We also found significant changes in the functional diversity (FDQ) [89], which has risen over time. Not only was the herb layer of the riparian forests poorer in species, but also the dominant species were more similar to each other regarding their plant traits. The lower values of FDQ may suggest that herbaceous vegetation was subjected to more stressful conditions in the past (e.g., more frequent floods and lower light availability) and species had to compete for resources [41]. Nowadays, studied forests are richer in species that simultaneously differ from each other in life strategies. This may indicate a higher level of niche differentiation and generally more optimal and less stressful conditions for all species in the herb layer [101].
Moreover, Vanneste et al. [4] revealed that older forests might support a higher variation in functional traits (e.g., SLA, H, seed mass) because they provided a wider variety of microhabitats, due to higher abiotic and biotic heterogeneity. Therefore, we can assume that the rise in FDQ presented in this study may result from strict protection, which has enhanced the formation of numerous microhabitats. Thus currently, species in the herb layer coexist rather than compete for resources. However, paradoxically, this seemingly positive change may facilitate the establishment of alien species which avoid competition and may become more abundant in these newly created niches [104].

5. Conclusions

Our results revealed visible shifts in herbaceous vegetation of studied forest communities during the last six decades. These changes refer not only to species composition but also to the functional structure of surveyed riparian forests. Differences between surveys mainly relate to the increase in the proportion and abundance of nutrient-demanding and alien species, whose presence is a distinctive feature of the most recent plots collected in 2020. We also noted a statistically significant increase in the proportion of species with high SLA and height—features typical of species with a ruderal life strategy [105]. Surprisingly, we did not detect any significant changes in habitat conditions expressed by the EIVs. However, a visible species turnover is reflected by a gradual replacement of forest species with ruderal ones, regardless of that.
On the one hand, the observed trends may suggest that the strict protection of forest communities, within small and isolated reserves, does not fully protect the species combination typical of these communities, against the processes of ruderalization understood not only as changes in the species richness or diversity, but also in the functional structure of the community. This happens even if PAs are located within a large (over 2000 ha) forest complex, but subjected to intense economic (forest management) and tourist pressures. On the other hand, strict protection may have contributed to creating new microhabitats, thus niche differentiation and the reduction of the level of habitat disturbances. These positive changes are reflected by the rise in functional diversity, suggesting that present communities harbor more species that differ in terms of functional traits than the same communities in the past. The problem is that the beneficiaries of these changes are nutrient-demanding, fast-colonizing, and alien species instead of the native ones typical of forest communities.
Therefore, this study shows that a broader perspective is highly needed in the planning and management of the strictly protected areas. It seems that the interior of the protected areas and their surroundings are essential to protect their biotic diversity effectively. This may indicate the necessity to create wide buffer zones around such forest nature reserves, that will be excluded from forest management and whose role will be only to reduce the negative impact of the global and local environmental factors. This approach has been proposed for the first time by Pyšeket al. [34] and is called the Several Small Inside Single Large (SSISL) model, and, in the context of the results presented, it seems to be an appropriate solution to maximize the species richness of nature reserves and to minimize the risk of plant invasions. Therefore, to fulfill the current assumptions of the EU biodiversity strategy concerning the establishment of areas of strict protection, several factors should be taken into account. Firstly, even when protected, forested areas are not extensive in their area (preferably, the bigger they are, and the more diverse in habitat, the better), and they should not be surrounded by intensively managed forests. Secondly, forest nature reserves should be spatially connected to allow free species exchange. Otherwise, when small and isolated, they are prone to undesirable changes in their species composition and functional structure, as we observed.

Supplementary Materials

The following supporting information can be downloaded at: https://www.mdpi.com/article/10.3390/f13050747/s1, Table S1: Basic data of phytosociological relevés used in the study; Table S2: Values of litter quality index (LQ) used in the study; Table S3: List of plant functional traits used in the study; Table S4: Phytosociological relevés including understory herbs, used in the study to analyze functional structure of studied communities, i.e., community weighted means (CWMs) for functional traits and functional diversity (FDQ).

Author Contributions

Conceptualization, K.R. and K.Ś.; methodology, K.Ś. and K.R.; formal analysis, K.Ś. and K.R.; investigation, V.Y., A.W.-R., K.R. and K.Ś.; data curation, K.Ś.; writing—original draft preparation, K.R. and K.Ś.; writing—review and editing, K.R., K.Ś. and A.O.; writing—preparation for printing in accordance with the requirements of the publishing house, preparing references, K.R.; visualization, K.Ś. and K.R. All authors have read and agreed to the published version of the manuscript.

Funding

This research received no external funding.

Institutional Review Board Statement

Not applicable.

Informed Consent Statement

Not applicable.

Data Availability Statement

The data presented in this study are available in the Supplementary Materials.

Conflicts of Interest

The authors declare no conflict of interest.

References

  1. Gilliam, F.S. The Ecological Significance of the Herbaceous Layer in Temperate Forest Ecosystems. BioScience 2007, 57, 845–858. [Google Scholar] [CrossRef]
  2. Díaz, S.; Cabido, M. Plant Functional Types and Ecosystem Function in Relation to Global Change. J. Veg. Sci. 1997, 8, 463–474. [Google Scholar] [CrossRef]
  3. Trumbore, S.; Brando, P.; Hartmann, H. Forest Health and Global Change. Science 2015, 349, 814–818. [Google Scholar] [CrossRef] [PubMed] [Green Version]
  4. Vanneste, T.; Valdés, A.; Verheyen, K.; Perring, M.P.; Bernhardt-Römermann, M.; Andrieu, E.; Brunet, J.; Cousins, S.A.O.; Deconchat, M.; De Smedt, P.; et al. Functional Trait Variation of Forest Understorey Plant Communities across Europe. Basic Appl. Ecol. 2019, 34, 1–14. [Google Scholar] [CrossRef]
  5. Lindner, M.; Maroschek, M.; Netherer, S.; Kremer, A.; Barbati, A.; Garcia-Gonzalo, J.; Seidl, R.; Delzon, S.; Corona, P.; Kolström, M.; et al. Climate Change Impacts, Adaptive Capacity, and Vulnerability of European Forest Ecosystems. For. Ecol. Manag. 2010, 259, 698–709. [Google Scholar] [CrossRef]
  6. Hansen, J.; Sato, M.; Ruedy, R.; Lo, K.; Lea, D.W.; Medina-Elizade, M. Global Temperature Change. Proc. Natl. Acad. Sci. USA 2006, 103, 14288–14293. [Google Scholar] [CrossRef] [PubMed] [Green Version]
  7. Allen, C.D.; Macalady, A.K.; Chenchouni, H.; Bachelet, D.; McDowell, N.; Vennetier, M.; Kitzberger, T.; Rigling, A.; Breshears, D.D.; Hogg, E.H.; et al. A Global Overview of Drought and Heat-Induced Tree Mortality Reveals Emerging Climate Change Risks for Forests. For. Ecol. Manag. 2010, 259, 660–684. [Google Scholar] [CrossRef] [Green Version]
  8. Zohner, C.M.; Mo, L.; Renner, S.S.; Svenning, J.-C.; Vitasse, Y.; Benito, B.M.; Ordonez, A.; Baumgarten, F.; Bastin, J.-F.; Sebald, V.; et al. Late-Spring Frost Risk between 1959 and 2017 Decreased in North America but Increased in Europe and Asia. Proc. Natl. Acad. Sci. USA 2020, 117, 12192–12200. [Google Scholar] [CrossRef]
  9. Brodribb, T.J.; Powers, J.; Cochard, H.; Choat, B. Hanging by a Thread? Forests and Drought. Science 2020, 368, 261–266. [Google Scholar] [CrossRef]
  10. Zellweger, F.; De Frenne, P.; Lenoir, J.; Vangansbeke, P.; Verheyen, K.; Bernhardt-Römermann, M.; Baeten, L.; Hédl, R.; Berki, I.; Brunet, J.; et al. Forest Microclimate Dynamics Drive Plant Responses to Warming. Science 2020, 368, 772–775. [Google Scholar] [CrossRef]
  11. Perring, M.P.; Diekmann, M.; Midolo, G.; Schellenberger Costa, D.; Bernhardt-Römermann, M.; Otto, J.C.J.; Gilliam, F.S.; Hedwall, P.-O.; Nordin, A.; Dirnböck, T.; et al. Understanding Context Dependency in the Response of Forest Understorey Plant Communities to Nitrogen Deposition. Environ. Pollut. 2018, 242, 1787–1799. [Google Scholar] [CrossRef] [PubMed]
  12. Staude, I.R.; Pereira, H.M.; Daskalova, G.N.; Bernhardt-Römermann, M.; Diekmann, M.; Pauli, H.; Van Calster, H.; Vellend, M.; Bjorkman, A.D.; Brunet, J.; et al. Directional Turnover towards Larger-Ranged Plants over Time and across Habitats. Ecol. Lett. 2022, 25, 466–482. [Google Scholar] [CrossRef] [PubMed]
  13. Wagner, V.; Chytrý, M.; Jiménez-Alfaro, B.; Pergl, J.; Hennekens, S.; Biurrun, I.; Knollová, I.; Berg, C.; Vassilev, K.; Rodwell, J.S.; et al. Alien Plant Invasions in European Woodlands. Divers. Distrib. 2017, 23, 969–981. [Google Scholar] [CrossRef]
  14. Saout, S.L.; Hoffmann, M.; Shi, Y.; Hughes, A.; Bernard, C.; Brooks, T.M.; Bertzky, B.; Butchart, S.H.M.; Stuart, S.N.; Badman, T.; et al. Protected Areas and Effective Biodiversity Conservation. Science 2013, 342, 803–805. [Google Scholar] [CrossRef] [PubMed]
  15. Vačkář, D.; Harmáčková, Z.V.; Kaňková, H.; Stupková, K. Human Transformation of Ecosystems: Comparing Protected and Unprotected Areas with Natural Baselines. Ecol. Indic. 2016, 66, 321–328. [Google Scholar] [CrossRef]
  16. Hobbs, R.J.; Huenneke, L.F. Disturbance, Diversity, and Invasion: Implications for Conservation. Conserv. Biol. 1992, 6, 324–337. [Google Scholar] [CrossRef] [Green Version]
  17. Levine, J.M.; Adler, P.B.; Yelenik, S.G. A Meta-Analysis of Biotic Resistance to Exotic Plant Invasions. Ecol. Lett. 2004, 7, 975–989. [Google Scholar] [CrossRef] [Green Version]
  18. Gallardo, B.; Aldridge, D.C.; González-Moreno, P.; Pergl, J.; Pizarro, M.; Pyšek, P.; Thuiller, W.; Yesson, C.; Vilà, M. Protected Areas Offer Refuge from Invasive Species Spreading under Climate Change. Glob. Chang. Biol. 2017, 23, 5331–5343. [Google Scholar] [CrossRef] [Green Version]
  19. Geldmann, J.; Barnes, M.; Coad, L.; Craigie, I.D.; Hockings, M.; Burgess, N.D. Effectiveness of Terrestrial Protected Areas in Reducing Habitat Loss and Population Declines. Biol. Conserv. 2013, 161, 230–238. [Google Scholar] [CrossRef]
  20. Rija, A.A.; Critchlow, R.; Thomas, C.D.; Beale, C.M. Global Extent and Drivers of Mammal Population Declines in Protected Areas under Illegal Hunting Pressure. PLoS ONE 2020, 15, e0227163. [Google Scholar] [CrossRef]
  21. Clark, N.E.; Boakes, E.H.; McGowan, P.J.K.; Mace, G.M.; Fuller, R.A. Protected Areas in South Asia Have Not Prevented Habitat Loss: A Study Using Historical Models of Land-Use Change. PLoS ONE 2013, 8, e65298. [Google Scholar] [CrossRef] [PubMed]
  22. Galford, G.L.; Soares-Filho, B.S.; Sonter, L.J.; Laporte, N. Will Passive Protection Save Congo Forests? PLoS ONE 2015, 10, e0128473. [Google Scholar] [CrossRef] [PubMed]
  23. Maxwell, S.L.; Cazalis, V.; Dudley, N.; Hoffmann, M.; Rodrigues, A.S.L.; Stolton, S.; Visconti, P.; Woodley, S.; Kingston, N.; Lewis, E.; et al. Area-Based Conservation in the Twenty-First Century. Nature 2020, 586, 217–227. [Google Scholar] [CrossRef] [PubMed]
  24. Lecina-Diaz, J.; Alvarez, A.; De Cáceres, M.; Herrando, S.; Vayreda, J.; Retana, J. Are Protected Areas Preserving Ecosystem Services and Biodiversity? Insights from Mediterranean Forests and Shrublands. Landsc. Ecol. 2019, 34, 2307–2321. [Google Scholar] [CrossRef]
  25. Foxcroft, L.C.; Pyšek, P.; Richardson, D.M.; Genovesi, P. Plant Invasions in Protected Areas: Patterns, Problems and Challenges; Springer Science & Business Media: Dordrecht, The Netherlands, 2013; ISBN 9789400777507. [Google Scholar]
  26. Chmura, D.; Sierka, E. The Occurrence of Invasive Alien Plant Species in Selected Forest Nature Reserves in Southern Poland as a Conservation Problem. Nat. Conserv. 2006, 62, 3–11. [Google Scholar]
  27. Chmura, D.; Gucwa-Przepióra, E. Interactions between Arbuscular Mycorrhiza and the Growth of the Invasive Alien Annual Impatiens Parviflora DC: A Study of Forest Type and Soil Properties in Nature Reserves (S Poland). Appl. Soil Ecol. 2012, 62, 71–80. [Google Scholar] [CrossRef]
  28. Riitters, K.; Potter, K.M.; Iannone, B.V.; Oswalt, C.; Guo, Q.; Fei, S. Exposure of Protected and Unprotected Forest to Plant Invasions in the Eastern United States. For. Trees Livelihoods 2018, 9, 723. [Google Scholar] [CrossRef] [Green Version]
  29. Lapin, K.; Oettel, J.; Steiner, H.; Langmaier, M.; Sustic, D.; Starlinger, F.; Kindermann, G.; Frank, G. Invasive Alien Plant Species in Unmanaged Forest Reserves, Austria. NeoBiota 2019, 48, 71–96. [Google Scholar] [CrossRef] [Green Version]
  30. Reczyńska, K.; Świerkosz, K. Does Protection Really Matter? A Case Study from Central European Oak Forests. Diversity 2019, 12, 6. [Google Scholar] [CrossRef] [Green Version]
  31. Asner, G.P.; Hughes, R.F.; Vitousek, P.M.; Knapp, D.E.; Kennedy-Bowdoin, T.; Boardman, J.; Martin, R.E.; Eastwood, M.; Green, R.O. Invasive Plants Transform the Three-Dimensional Structure of Rain Forests. Proc. Natl. Acad. Sci. USA 2008, 105, 4519–4523. [Google Scholar] [CrossRef] [PubMed] [Green Version]
  32. Florens, F.B.V.; Baider, C.; Martin, G.M.N.; Seegoolam, N.B.; Zmanay, Z.; Strasberg, D. Invasive Alien Plants Progress to Dominate Protected and Best-Preserved Wet Forests of an Oceanic Island. J. Nat. Conserv. 2016, 34, 93–100. [Google Scholar] [CrossRef]
  33. Díaz, S.; Settele, J.; Brondízio, E.S.; Ngo, H.T.; Guèze, M.; Agard, J.; Arneth, A.; Balvanera, P.; Brauman, K.A.; Butchart, S.H.M.; et al. Summary for Policymakers of the Global Assessment Report on Biodiversity and Ecosystem Services of the Intergovernmental Science-Policy Platform on Biodiversity and Ecosystem Services; IPBES: Bonn, Germany, 2019. [Google Scholar]
  34. Pyšek, P.; Jarošík, V.; Kučera, T. Inclusion of Native and Alien Species in Temperate Nature Reserves: An Historical Study from Central Europe. Conserv. Biol. 2003, 17, 1414–1424. [Google Scholar] [CrossRef]
  35. Matlack, G.R.; Monde, J. Consequences of Low Mobility in Spatially and Temporally Heterogeneous Ecosystems. J. Ecol. 2004, 92, 1025–1035. [Google Scholar] [CrossRef]
  36. EU Biodiversity Strategy for 2030: Bringing Nature Back into Our Lives; Publications Office of the European Union: Luxembourg, 2021.
  37. Directorate-General for Environment. Criteria and Guidance for Protected Areas Designations—Staff Working Document; European Comission: Brussels, Belgium, 2022. [Google Scholar]
  38. Sabatini, F.M.; Burrascano, S.; Keeton, W.S.; Levers, C.; Lindner, M.; Pötzschner, F.; Verkerk, P.J.; Bauhus, J.; Buchwald, E.; Chaskovsky, O.; et al. Where Are Europe’s Last Primary Forests? Divers. Distrib. 2018, 24, 1426–1439. [Google Scholar] [CrossRef] [Green Version]
  39. Sabatini, F.M.; Bluhm, H.; Kun, Z.; Aksenov, D.; Atauri, J.A.; Buchwald, E.; Burrascano, S.; Cateau, E.; Diku, A.; Duarte, I.M.; et al. European Primary Forest Database v2.0. Sci. Data 2021, 8, 220. [Google Scholar] [CrossRef]
  40. Baran, J.; Pielech, R.; Bodziarczyk, J. No Difference in Plant Species Diversity between Protected and Managed Ravine Forests. For. Ecol. Manag. 2018, 430, 587–593. [Google Scholar] [CrossRef]
  41. Mason, N.W.H.; Mouillot, D.; Lee, W.G.; Wilson, J.B. Functional Richness, Functional Evenness and Functional Divergence: The Primary Components of Functional Diversity. Oikos 2005, 111, 112–118. [Google Scholar] [CrossRef]
  42. De Bello, F.; Lavorel, S.; Lavergne, S.; Albert, C.H.; Boulangeat, I.; Mazel, F.; Thuiller, W. Hierarchical Effects of Environmental Filters on the Functional Structure of Plant Communities: A Case Study in the French Alps. Ecography 2013, 36, 393–402. [Google Scholar] [CrossRef]
  43. Violle, C.; Navas, M.-L.; Vile, D.; Kazakou, E.; Fortunel, C.; Hummel, I.; Garnier, E. Let the Concept of Trait Be Functional! Oikos 2007, 116, 882–892. [Google Scholar] [CrossRef]
  44. Lavorel, S.; McIntyre, S.; Landsberg, J.; Forbes, T.D. Plant Functional Classifications: From General Groups to Specific Groups Based on Response to Disturbance. Trends Ecol. Evol. 1997, 12, 474–478. [Google Scholar] [CrossRef]
  45. Kattge, J.; Diaz, S.; Lavorel, S.; Prentice, I.C.; Leadley, P.; Bonisch, G.; Garnier, E.; Westoby, M.; Reich, P.B.; Wright, I.J.; et al. TRY—a Global Database of Plant Traits. Glob. Chang. Biol. 2011, 17, 2905–2935. [Google Scholar] [CrossRef]
  46. Díaz, S.; Purvis, A.; Cornelissen, J.H.C.; Mace, G.M.; Donoghue, M.J.; Ewers, R.M.; Jordano, P.; Pearse, W.D. Functional Traits, the Phylogeny of Function, and Ecosystem Service Vulnerability. Ecol. Evol. 2013, 3, 2958–2975. [Google Scholar] [CrossRef] [PubMed] [Green Version]
  47. Kenderes, K.; Standovár, T. The Impact of Forest Management on Forest Floor Vegetation Evaluated by Species Traits. Community Ecol. 2003, 4, 51–62. [Google Scholar] [CrossRef]
  48. Dölle, M.; Petritan, A.M.; Biris, I.A.; Petritan, I.C. Relations between Tree Canopy Composition and Understorey Vegetation in a European Beech-Sessile Oak Old Growth Forest in Western Romania. Biologia 2017, 72, 1422–1430. [Google Scholar] [CrossRef]
  49. Ganivet, E.; Flores, O.; Balguerías, E.; de Nascimento, L.; Arévalo, J.R.; Fernández-Lugo, S.; Fernández-Palacios, J.M. Ecological Strategies of Tree Species in the Laurel Forest of Tenerife (Canary Islands): An Insight into Cloud Forest Natural Dynamics Using Long-Term Monitoring Data. Eur. J. For. Res. 2019, 138, 93–110. [Google Scholar] [CrossRef]
  50. Selwood, K.E.; Zimmer, H.C. Refuges for Biodiversity Conservation: A Review of the Evidence. Biol. Conserv. 2020, 245, 108502. [Google Scholar] [CrossRef]
  51. Pielech, R. Plant Species Richness in Riparian Forests: Comparison to Other Forest Ecosystems, Longitudinal Patterns, Role of Rare Species and Topographic Factors. For. Ecol. Manag. 2021, 496, 119400. [Google Scholar] [CrossRef]
  52. Krzemińska, A. Dynamika Zmian Warunków Wodnych W Lasach Na Terenach Polderowych—Analiza Interakcji; Uniwersytet Przyrodniczy we Wrocławiu: Wrocław, Poland, 2008. [Google Scholar]
  53. Jankowski, W.; Świerkosz, K. (Eds.) Korytarz Ekologiczny Doliny Odry—Stan-Funkcjonowanie-Zagrożenia; IUCN: Warszawa, Poland, 1995. [Google Scholar]
  54. Blachowski, J.; Markowicz-Judycka, E.; Zięba, D. Opracowanie Ekofizjograficzne dla Województwa Dolnośląskiego; Wojewódzkie Biuro Urbanistyczne: Wrocław, Poland, 2005; ISBN 9788391347256. [Google Scholar]
  55. Świerkosz, K.; Liberadzka, H.; Łysiak, M.; Zając, K. (Eds.) Obszary Natura 2000 Na Dolnym Śląsku; Regionalna Dyrekcja Ochrony Środowiska we Wrocławiu: Wrocław, Poland, 2012. [Google Scholar]
  56. Kuczyńska, I. Zbiorowiska Leśne Rezerwatów W Nadleśnictwie Oława. Prace Botaniczne 1965, 6, 1–29. [Google Scholar]
  57. Anioł-Kwiatkowska, J. Roślinność Rezerwatu “Grodzińska Ryczyńskie”. Prace Botaniczne 1995, 62, 39–52. [Google Scholar]
  58. Anioł-Kwiatkowska, J.; Weretelnik, E. Flora I Roślinność Rezerwatu “Zwierzyniec” Koło Oławy. Prace Botaniczne 1995, 62, 287–303. [Google Scholar]
  59. Anioł-Kwiatkowska, J.; Weretelnik, E. Flora I Roślinność Rezerwatu “Kanigóra”. Prace Botaniczne 1995, 62, 67–78. [Google Scholar]
  60. Mueller-Dombois, D.; Ellenberg, H. Aims and Methods of Vegetation Ecology; Reprint; The Blackburn Press: Caldwell, NJ, USA, 2002; ISBN 9781930665736. [Google Scholar]
  61. Novák, P.; Willner, W.; Zukal, D.; Kollár, J.; Roleček, J.; Świerkosz, K.; Ewald, J.; Wohlgemuth, T.; Csiky, J.; Onyshchenko, V.; et al. Oak-Hornbeam Forests of Central Europe: A Formalized Classification and Syntaxonomic Revision. Preslia 2020, 92, 1–34. [Google Scholar] [CrossRef]
  62. Euro+Med PlantBase—the Information Resource for Euro-Mediterranean Plant Diversity. 2006. Available online: https://ww2.bgbm.org/EuroPlusMed/query.asp (accessed on 20 February 2022).
  63. Tichý, L. JUICE, Software for Vegetation Classification. J. Veg. Sci. 2002, 13, 451–453. [Google Scholar] [CrossRef]
  64. Roleček, J.; Tichý, L.; Zelený, D.; Chytrý, M. Modified TWINSPAN Classification in Which the Hierarchy Respects Cluster Heterogeneity. J. Veg. Sci. 2009, 20, 596–602. [Google Scholar] [CrossRef]
  65. Chytrý, M.; Tichý, L.; Holt, J.; Botta-Dukát, Z. Determination of Diagnostic Species with Statistical Fidelity Measures. J. Veg. Sci. 2002, 13, 79–90. [Google Scholar] [CrossRef]
  66. Dengler, J.; Berg, C.; Jansen, F. New Ideas for Modern Phytosociological Monographs. Annali di Botanica 2005, 5, 195–213. [Google Scholar]
  67. Tokarska-Guzik, B.; Dajdok, Z.; Zając, M.; Zając, A.; Urbisz, A.; Danielewicz, W.; Hołdyński, C. Rośliny Obcego Pochodzenia w Polsce ze Szczególnym Uwzględnieniem Gatunków Inwazyjnych; Generalna Dyrekcja Ochrony Środowiska: Warszawa, Poland, 2012; ISBN 9788362940349. [Google Scholar]
  68. Verheyen, K.; Baeten, L.; De Frenne, P.; Bernhardt-Römermann, M.; Brunet, J.; Cornelis, J.; Decocq, G.; Dierschke, H.; Eriksson, O.; Hédl, R.; et al. Driving Factors behind the Eutrophication Signal in Understorey Plant Communities of Deciduous Temperate Forests. J. Ecol. 2012, 100, 352–365. [Google Scholar] [CrossRef]
  69. Šipoš, J.; Chudomelová, M.; Vild, O.; Macek, M.; Kopecký, M.; Szabó, P.; Hédl, R. Plant Diversity in Deciduous Temperate Forests Reflects Interplay among Ancient and Recent Environmental Stress. J. Veg. Sci. 2020, 31, 53–62. [Google Scholar] [CrossRef]
  70. Ellenberg, H.; Weber, H.E.; Düll, R.; Wirth, W.; Werner, W.; Paulien, D. Zeigerwerte von Pflanzen in Mitteleuropa. Scripta Geobotanica, 18, 1–258. Scr. Geobot. 1991, 18, 1–258. [Google Scholar]
  71. Berg, C.; Welk, E.; Jäger, E.J. Revising Ellenberg’s Indicator Values for Continentality Based on Global Vascular Plant Species Distribution. Appl. Veg. Sci. 2017, 20, 482–493. [Google Scholar] [CrossRef]
  72. Ter Braak, C.J.F.; Smilauer, P. Canoco Reference Manual and User’s Guide: Software for Ordination, Version 5.0; Microcomputer Power: Ithaca, NY, USA, 2012. [Google Scholar]
  73. Zelený, D.; Schaffers, A.P. Too Good to Be True: Pitfalls of Using Mean Ellenberg Indicator Values in Vegetation Analyses. J. Veg. Sci. 2012, 23, 419–431. [Google Scholar] [CrossRef]
  74. R Core Team. R: A Language and Environment for Statistical Computing; R Foundation for Statistical Computing: Vienna, Austria, 2021. [Google Scholar]
  75. Gleason, J. Comparative Power of the Anova, Randomization Anova, and Kruskal-Wallis Test. Ph.D. Thesis, Wayne State University, Detroit, MI, USA, 2013. [Google Scholar]
  76. Westoby, M. A Leaf-Height-Seed (LHS) Plant Ecology Strategy Scheme. Plant Soil 1998, 199, 213–227. [Google Scholar] [CrossRef]
  77. Lavorel, S.; Garnier, E. Predicting Changes in Community Composition and Ecosystem Functioning from Plant Traits: Revisiting the Holy Grail: Plant Response and Effect Groups. Funct. Ecol. 2002, 16, 545–556. [Google Scholar] [CrossRef]
  78. Czortek, P.; Orczewska, A. Niche Differentiation, Competition or Habitat Filtering? Mechanisms Explaining Co-occurrence of Plant Species on Wet Meadows of High Conservation Value. J. Veg. Sci. 2021, 32, e12983. [Google Scholar] [CrossRef]
  79. Pérez-Harguindeguy, N.; Díaz, S.; Garnier, E.; Lavorel, S.; Poorter, H.; Jaureguiberry, P.; Bret-Harte, M.S.; Cornwell, W.K.; Craine, J.M.; Gurvich, D.E.; et al. New Handbook for Standardised Measurement of Plant Functional Traits Worldwide. Aust. J. Bot. 2013, 61, 167–234. [Google Scholar] [CrossRef]
  80. Moles, A.T.; Warton, D.I.; Warman, L.; Swenson, N.G.; Laffan, S.W.; Zanne, A.E.; Pitman, A.; Hemmings, F.A.; Leishman, M.R. Global Patterns in Plant Height. J. Ecol. 2009, 97, 923–932. [Google Scholar] [CrossRef]
  81. Pakeman, R.J.; Garnier, E.; Lavorel, S.; Ansquer, P.; Castro, H.; Cruz, P.; Doležal, J.; Eriksson, O.; Freitas, H.; Golodets, C.; et al. Impact of Abundance Weighting on the Response of Seed Traits to Climate and Land Use. J. Ecol. 2008, 96, 355–366. [Google Scholar] [CrossRef]
  82. Kleyer, M.; Bekker, R.M.; Knevel, I.C.; Bakker, J.P.; Thompson, K.; Sonnenschein, M.; Poschlod, P.; van Groenendael, J.M.; Klimeš, L.; Klimešová, J.; et al. The LEDA Traitbase: A Database of Life-History Traits of the Northwest European Flora. J. Ecol. 2008, 96, 1266–1274. [Google Scholar] [CrossRef]
  83. Paź-Dyderska, S.; Dyderski, M.K.; Szwaczka, P. Leaf Traits and Aboveground Biomass Variability of Forest Understory Herbaceous Plant Species. Ecosystems 2020, 23, 555–569. [Google Scholar] [CrossRef] [Green Version]
  84. Pakeman, R.J. Functional Trait Metrics Are Sensitive to the Completeness of the Species’ Trait Data? Methods Ecol. Evol. 2014, 5, 9–15. [Google Scholar] [CrossRef]
  85. Lavorel, S.; Grigulis, K.; McIntyre, S.; Williams, N.S.G.; Garden, D.; Dorrough, J.; Berman, S.; Quétier, F.; Thébault, A.; Bonis, A. Assessing Functional Diversity in the Field—Methodology Matters! Funct. Ecol. 2007, 22, 134–147. [Google Scholar] [CrossRef]
  86. Villéger, S.; Mason, N.W.H.; Mouillot, D. New Multidimensional Functional Diversity Indices for a Multifaceted Framework in Functional Ecology. Ecology 2008, 89, 2290–2301. [Google Scholar] [CrossRef] [Green Version]
  87. Mason, N.W.H.; de Bello, F.; Mouillot, D.; Pavoine, S.; Dray, S. A Guide for Using Functional Diversity Indices to Reveal Changes in Assembly Processes along Ecological Gradients. J. Veg. Sci. 2013, 24, 794–806. [Google Scholar] [CrossRef]
  88. Garnier, E.; Lavorel, S.; Ansquer, P.; Castro, H.; Cruz, P.; Dolezal, J.; Eriksson, O.; Fortunel, C.; Freitas, H.; Golodets, C.; et al. Assessing the Effects of Land-Use Change on Plant Traits, Communities and Ecosystem Functioning in Grasslands: A Standardized Methodology and Lessons from an Application to 11 European Sites. Ann. Bot. 2007, 99, 967–985. [Google Scholar] [CrossRef] [Green Version]
  89. Botta-Dukát, Z. Rao’s Quadratic Entropy as a Measure of Functional Diversity Based on Multiple Traits. J. Veg. Sci. 2005, 16, 533–540. [Google Scholar] [CrossRef]
  90. Dzwonko, Z.; Loster, S. Wskaźnikowe Gatunki Roślin Starych Lasów I Ich Znaczenie Dla Ochrony Przyrody I Kartografii Roślinności. Prace Geograficzne 2001, 178, 119–132. [Google Scholar]
  91. Richardson, D.M.; Holmes, P.M.; Esler, K.J.; Galatowitsch, S.M.; Stromberg, J.C.; Kirkman, S.P.; Pyšek, P.; Hobbs, R.J. Riparian Vegetation: Degradation, Alien Plant Invasions, and Restoration Prospects. Divers. Distrib. 2007, 13, 126–139. [Google Scholar] [CrossRef]
  92. Douda, J.; Boublík, K.; Slezák, M.; Biurrun, I.; Nociar, J.; Havrdová, A.; Doudová, J.; Aćić, S.; Brisse, H.; Brunet, J.; et al. Vegetation Classification and Biogeography of European Floodplain Forests and Alder Carrs. Appl. Veg. Sci. 2016, 19, 147–163. [Google Scholar] [CrossRef]
  93. Staude, I.R.; Waller, D.M.; Bernhardt-Römermann, M.; Bjorkman, A.D.; Brunet, J.; De Frenne, P.; Hédl, R.; Jandt, U.; Lenoir, J.; Máliš, F.; et al. Replacements of Small- by Large-Ranged Species Scale up to Diversity Loss in Europe’s Temperate Forest Biome. Nat. Ecol. Evol. 2020, 4, 802–808. [Google Scholar] [CrossRef] [PubMed]
  94. Connell, J.H. Diversity in Tropical Rain Forests and Coral Reefs. Science 1978, 199, 1302–1310. [Google Scholar] [CrossRef] [PubMed] [Green Version]
  95. Catford, J.A.; Daehler, C.C.; Murphy, H.T.; Sheppard, A.W.; Hardesty, B.D.; Westcott, D.A.; Rejmánek, M.; Bellingham, P.J.; Pergl, J.; Horvitz, C.C.; et al. The Intermediate Disturbance Hypothesis and Plant Invasions: Implications for Species Richness and Management. Perspect. Plant Ecol. Evol. Syst. 2012, 14, 231–241. [Google Scholar] [CrossRef]
  96. Boch, S.; Prati, D.; Müller, J.; Socher, S.; Baumbach, H.; Buscot, F.; Gockel, S.; Hemp, A.; Hessenmöller, D.; Kalko, E.K.V.; et al. High Plant Species Richness Indicates Management-Related Disturbances rather than the Conservation Status of Forests. Basic Appl. Ecol. 2013, 14, 496–505. [Google Scholar] [CrossRef]
  97. Bernhardt-Römermann, M.; Baeten, L.; Craven, D.; De Frenne, P.; Hédl, R.; Lenoir, J.; Bert, D.; Brunet, J.; Chudomelová, M.; Decocq, G.; et al. Drivers of Temporal Changes in Temperate Forest Plant Diversity Vary across Spatial Scales. Glob. Chang. Biol. 2015, 21, 3726–3737. [Google Scholar] [CrossRef]
  98. Naaf, T.; Kolk, J. Initial Site Conditions and Interactions between Multiple Drivers Determine Herb-Layer Changes over Five Decades in Temperate Forests. For. Ecol. Manag. 2016, 366, 153–165. [Google Scholar] [CrossRef]
  99. Verstraeten, G.; Baeten, L.; Van den Broeck, T.; De Frenne, P.; Demey, A.; Tack, W.; Muys, B.; Verheyen, K. Temporal Changes in Forest Plant Communities at Different Site Types. Appl. Veg. Sci. 2013, 16, 237–247. [Google Scholar] [CrossRef]
  100. Pyšek, P.; Jarošík, V.; Kučera, T. Patterns of Invasion in Temperate Nature Reserves. Biol. Conserv. 2002, 104, 13–24. [Google Scholar] [CrossRef]
  101. Bernhardt-Römermann, M.; Römermann, C.; Pillar, V.D.; Kudernatsch, T.; Fischer, A. High Functional Diversity Is Related to High Nitrogen Availability in a Deciduous Forest—Evidence from a Functional Trait Approach. Folia Geobotanica 2010, 45, 111–124. [Google Scholar] [CrossRef] [Green Version]
  102. Härdtle, W.; Bergmeier, E.; Fichtner, A.; Heinken, T.; Hölzel, N.; Remy, D.; Schneider, S.; Schwabe, A.; Tischew, S.; Dierschke, H. Pflanzengesellschaft Des Jahres 2021: Hartholz-Auenwald (Ficario-Ulmetum). Tuexenia 2020, 40, 373–399. [Google Scholar] [CrossRef]
  103. Reczyńska, K.; Świerkosz, K. Compositional Changes in Thermophilous Oak Forests in Poland over Time: Do They Correspond to European Trends? Appl. Veg. Sci. 2017, 20, 293–303. [Google Scholar] [CrossRef]
  104. Gioria, M.; Osborne, B.A. Resource Competition in Plant Invasions: Emerging Patterns and Research Needs. Front. Plant Sci. 2014, 5, 501. [Google Scholar] [CrossRef] [PubMed] [Green Version]
  105. Grime, J.P.; Hodgson, J.G.; Hunt, R. Comparative Plant Ecology. A Functional Approach to Common British Species; Springer-Science+Business Media, B.V.: Dordrecht, The Netherlands, 1988; ISBN 9780412741708. [Google Scholar]
Figure 1. Location of the study area (gray rectangle) in SW Poland. Studied nature reserves are marked in red (1—Zwierzyniec; 2—Kanigóra; 3—Grodziska Ryczyńskie). Forests are marked in green. Background from the © MapTiler © OpenStreetMap contributors.
Forests 13 00747 g001
Figure 2. Summary box-and-whisker plots with jitters of forest floor species richness and Shannon–Wiener Index, for three survey dates of riparian forest in the Odra River Valley (SW Poland). The central line of each box indicates the median value, box boundaries the lower (25%) and upper (75%) quartiles, and whiskers the range of values.
Forests 13 00747 g002
Figure 3. DCA ordination diagram for the 126 vegetation plots of the protected, ancient riparian forests in the area of the Odra Valley near Oława (Silesian Lowland, Southwestern Poland), surveyed in 1960, and resurveyed in 1990 and 2020. The gradient length is 3.47 SD. The diagram shows the herbaceous vegetation pattern within plots during the last 60 years. The vector of Year variable was passively projected into a diagram.
Forests 13 00747 g003
Figure 4. Results of the DCA summarized the variation of understory species composition of the protected, ancient riparian forests in the Odra Valley near Oława (Silesian Lowland, Southwestern Poland), surveyed in 1960, and resurveyed in 1990 and 2020, and with passive projection of the vector of Year as supplementary variable. Species with scores limit to 30 by fit according to total species composition. Explanation of the abbreviations used: AcerCamp—Acer campestre; AegpPodg—Aegopodium podagraria; AlliUrsn—Allium ursinum; AnemNemr—Anemone nemorosa; AnemRanu—Anemone ranunculoides; BracSylv—Brachypodium sylvaticum; CircLute—Circaea lutetiana; CordCava—Corydalis cava; CratMong—Crataegus monogyna; DactPolg—Dactylis polygama; FicrVern—Ficaria verna; GageLute—Gagea lutea; GageMinm—Gagea minima; GalnNivl—Galanthus nivalis; GaliApar—Galium aparine; GeumUrbn—Geum urbanum; GlecHedr—Glechoma hederacea; ImptNoli—Impatiens noli-tangere; ImptParv—Impatiens parviflora; LamiMacl—Lamium maculatum; MiliEffs—Milium effusum; OxalAcet—Oxalis acetosella; PolgMult—Polygonatum multiflorum; PulmObsc—Pulmonaria obscura; QuerRobr—Quercus robur; SambNigr—Sambucus nigra; StacSylv—Stachys sylvatica; StelMedi—Stellaria media; UrtcDioi—Urtica dioica; ViolReic—Viola reichenbachiana.
Forests 13 00747 g004
Figure 5. Summary box-and-whisker plots of mean Ellenberg’s Indicator Values (EIVs) for three subsequent surveys of the riparian forest in the Odra River Valley (SW Poland), produced by one-way permutational ANOVA. The central line of each box indicates the median value, box boundaries the lower (25%) and upper (75%) quartiles, and whiskers the range of values. F—test statistic; P. modif. was calculated using a modified permutation test of significance for analysis of mean EIVs [73].
Forests 13 00747 g005
Figure 6. Summary box-and-whisker plots with jitters presenting changes in litter quality of trees (LQt) (a) and shrubs (LQs) (b) between three studied surveys of the riparian forest in the Odra River Valley (SW Poland). The central line of each box indicates the median value, box boundaries the lower (25%) and upper (75%) quartiles, and whiskers the range of values.
Forests 13 00747 g006
Figure 7. Summary box-and-whisker plots with jitters presenting changes in CWMs for analyzed functional traits of herb layer species between three studied surveys of the riparian forest in the Odra River Valley (SW Poland). The central line of each box indicates the median value, box boundaries the lower (25%) and upper (75%) quartiles, and whiskers the range of values.
Forests 13 00747 g007
Figure 8. RDA diagram visualizes the distribution of investigated plots plotted against the community weighted means of functional traits (CWMs) within three surveys conducted in the riparian forest reserves in the Odra River Valley (SW Poland). Explanation: red circles—1960; blue squares—1990, green diamonds—2020.
Forests 13 00747 g008
Figure 9. Summary box-and-whisker plots with jitters presenting changes in functional diversity FDQ (Rao’s quadratic entropy) within herb layer species for three studied surveys of the riparian forest in the Odra River Valley (SW Poland). The central line of each box indicates the median value, box boundaries the lower (25%) and upper (75%) quartiles, and whiskers the range of values.
Forests 13 00747 g009
Table 1. Differentiating herbaceous species for the subsequent periods of investigation. Species are ordered according to their diagnostic value in a particular survey. The Φ coefficient values in the table are multiplied by 100. Their superscripts express the percentage values of species frequency. Only species with Φ > 25, frequency > 25, and constancy ratio > 1.5 were included in the table. Sign “__” means that a given species does not reach a statistically significant Φ value in a particular cluster.
Date of Investigation 196019902020
No. of Relevés 424242
Ratio
Aegopodium podagraria1.735 86__ 50__ 50
Symphytum tuberosum2.829 26__ 2__ 10
Paris quadrifolia2.229 45__ 21__ 14
Ajuga reptans2.127 29__ 12__ 5
Elymus caninus100__ .48 31__ .
Deschampsia cespitosa5.4__ .37 26__ 5
Impatiens parviflora4__ .__ 2378 93
Chelidonium majus16.4__ .__ 251 38
Galeopsis tetrahit3.8__ 12__ 245 45
Stellaria media2.5__ 10__ 2139 52
Chaerophyllum aromaticum4.4__ .__ 739 31
Table 2. Changes in the percentage frequency and percentage mean cover (in brackets) of alien species between three subsequent surveys.
Date of Investigation196019902020
No. of Relevés424242
Impatiens parviflora.24 (2)93 (14)
Ballota nigra.2 (1)5 (1)
Solidago gigantea..10 (1)
Juglans regia (juv.)..5 (2)
Sonchus oleraceus..2 (1)
Quercus rubra (juv.)..2 (1)
Aesculus hippocastanum (juv.)..2 (2)
Table 3. Significance of Spearman’s rank correlation of mean EIVs with four main DCA axes within studied riparian forests using a modified permutation test.
Axis 1Axis 2Axis 3Axis 4
RhoP. ModifRhoP. ModifRhoP. ModifRhoP. Modif
Light0.3450.100−0.1500.3880.2770.0880.1150.472
Temperature0.1230.6160.0060.9920.1180.476−0.2650.088
Continentality−0.2210.4320.0820.7200.1620.296−0.0150.932
Moisture−0.2210.360−0.5000.0120.1620.316−0.0150.960
Soil reaction−0.2680.244−0.3410.044−0.2860.0560.2220.236
Nutrients0.0690.732−0.1330.4800.1490.356−0.1290.368
Publisher’s Note: MDPI stays neutral with regard to jurisdictional claims in published maps and institutional affiliations.

