Article

Diffuse Pollution and Ecological Risk Assessment in Ludaš Lake Special Nature Reserve and Palić Nature Park (Pannonian Basin)

by
Milica Caković
1,*,
Jelena Beloica
1,
Snežana Belanović Simić
1,
Predrag Miljković
1,
Sara Lukić
1,
Aleksandar Baumgertel
1 and
Fritz Schwaiger
2
1
Faculty of Forestry, University of Belgrade, Kneza Višeslava 1, 11030 Belgrade, Serbia
2
Posch & Partners Consulting Engineers, Sebastian-Kneipp-Weg 17, 6020 Innsbruck, Austria
*
Author to whom correspondence should be addressed.
Forests 2021, 12(11), 1461; https://doi.org/10.3390/f12111461
Submission received: 20 September 2021 / Revised: 15 October 2021 / Accepted: 22 October 2021 / Published: 26 October 2021
(This article belongs to the Special Issue Forest Soil and Water Biogeochemistry)

Abstract

:
Diffuse water pollution from agriculture (DWPA) is one of the major factors causing water pollution in Lakes Palić and Ludaš, the two largest shallow lakes of the Pannonian Basin in Serbia. These two lakes are protected under national and international law. On the basis of the number of strictly protected bird species, Ludaš Lake has been classified as a wetland of international importance since 1977 (Ramsar site 3YU002); in 2021, both lakes were nominated as potential Natura 2000 areas. Despite the degree of protection and ecological significance of the area, agricultural land prevails. By a process of land expropriation during 2019, the buffer zone began to expand around the lakes, which should lead to a reduction in pollution. One of the goals of buffer-zone development is to enhance and restore the ecological connectivity of the remaining forest-steppe habitats. During the expropriation process, soil was sampled to record areas with the highest pollution. This paper assesses the environmental risk caused by phosphorus, nitrogen, and the accumulation of heavy metals (Zn, Cu, Pb, Cr, Ni, Mn, Cd, and Hg). For each heavy metal, the corresponding pollution indices (Igeo, PI, EF, Eri, RI, Nemerow) and soil contamination level were calculated. Pollution indices indicate the ecological risk under the influence of heavy metals in the following order: Cd > Cu > Ni > Zn > Pb > Cr > Hg. Results showed that concentrations of Cd exceeded the maximal permissible concentration in all examined soil samples, and high ecological risk areas were determined. High concentrations of nitrogen, phosphorus, and potassium were detected, which could be as a result of intensive agricultural activity. Current conservation measures in this area have not provided adequate protection of the natural environment. Accordingly, existing measures must be controlled or new, more restrictive measures must be prescribed.

1. Introduction

Diffuse water pollution from agriculture (DWPA) is a major global environmental issue, causing eutrophication, reducing the recreational potential of water bodies, and affecting human health [1,2]. According to the WWF (2016) [3], the biodiversity of freshwater ecosystems has been degraded more than that of any other ecosystem, and declined by 81% between 1970 and 2012 due to pollution. Intensive agricultural production affects both the soil and diffuse pollution of water bodies in the immediate vicinity [4,5]. Studies about pollutant input balances for waters in Germany showed that about 67% (25 kt P/a) of the total phosphorus load, and about 72% (586 kt N/a) of the total nitrogen load come from diffuse sources [6]. Total nitrogen that reaches water bodies through point sources was reduced by 25% from 1993 to 2001 [6], while the impact of diffuse pollution is still at a high level [6,7]. Heavy metals are naturally present in the soil [8,9,10,11], but anthropogenic activities increase the concentration, availability, and mobility of these elements [12,13], which negatively affects the living world on Earth [14]. The elevated concentrations of nutrients (N, P2O5, K2O) and heavy metals (Cd, Hg, Cu, Pb) are usually related to human activity, which first includes the proximity of settlements [15], followed by developed tourism [16], nearby roads [17], intensive agricultural production, and pesticide use [18]. The accumulation of heavy metals in the soil is associated with intensive urbanization and industrialization [8,11,14,15], mining [19,20], geological background composition [21], physical and chemical properties of the soil [19], and heavy-metal characteristics [8].
Although point sources still significantly contribute to pollution in the examined area, in this research we focused on diffuse pollution caused by agriculture [22]. The share of the total load of all heavy metals for diffuse sources to soil is around 77% in Germany, of which the erosion of agricultural soils share is 30%, and from the urban areas share is 32% of diffuse sources [23]. Previous studies determined that about 67% of the total phosphorus and about 72% of the total nitrogen load are caused by diffuse inputs (agricultural soils, groundwater, and urban areas). The main pathways of this input are the erosion of agricultural soils (20–30% of diffuse sources), wash-out via groundwater (20–70%), and urban areas (5–16%) [6].
The surroundings of lakes are characterized by remnant forest-steppe vegetation patches, Pannonic salt steppes, and marshes. Land use and cover changes that affected pollution levels were observed within the study area. According to the 2012 census of agriculture [24] in the municipality of Subotica, to which the study area belongs, 6322 agricultural farms were registered (total area of 75,519 ha of agricultural land), while the 2018 farm structure shows that the number of farms increased to 6548 (total area of 83,104 ha of agricultural land) [24]. According to [22], 78% of agricultural land is treated with mineral fertilizer. The agricultural land around the Palić and Ludaš lakes is treated with about 37 tons of nitrogen and 31 tons of phosphorus per year. Consequently, agricultural activities (in some places at a distance of less than 1 meter) lead to the leaching of nutrients into the lakes [25,26], which affects water quality [25].
The Ludaš Lake Special Nature Reserve (SNR) and Palić Nature Park (NP) are protected areas according to national law, and in 2020, they were nominated as a part of the Natura 2000 area network. The Natura 2000 is a network of protected areas that extends across all 27 EU countries. The network provides long-term protection for the most valuable and threatened European species and habitats [27]. The protection level of the lakes is in line with the Law on Nature Conservation [28], which defines uncompromising protection measures and restrictions. Consequently, this area is very sensitive to further contamination by heavy metals and high concentrations of nutrients [27,28]. According to the same documents, water quality, availability, and flow are particularly relevant to Natura 2000 sites [29]. Besides administrative measures [27,28], the natural solution provides long-term protection to reduce the input of pollutants into water bodies [6]. A buffer zone is a crucial management option that could offset the devastating impact of land use [5]. In addition to its significance as a biofilter for preventing nutrients and pollutants from entering lakes from an agricultural area, the establishment of a buffer zone enables the restoration and connectivity of natural potential habitats, contributing to overall biodiversity. This reflects another ecologically important function. According to the lake rehabilitation project of the 1970s, the establishment of buffer strips was planned, but this part of the project was never realized [22,30]. However, a framework project that is currently underway for the construction of a buffer zone includes the establishment of a grass belt, and a belt of high and low vegetation (trees and shrubs) [31].
This paper examines the concentration and spatial distribution of heavy metals and nutrients in soils in a protected natural area exposed to anthropogenic influence.
To perform soil monitoring and analysis, pollution indices are commonly used to determine a comprehensive assessment of heavy-metal accumulation in the soil. The most commonly used indices were applied in this study: enrichment factor (EF) [18,32], index of geoaccumulation (Igeo) [33,34,35], contamination factor (CF) or pollution index (PI) [18,36], ecological risk index (ERI) [37,38], potential ecological index (RI) [8,39], and Nemerow pollution index (PIN) [8,40].
The establishment of buffer strips increases the percentage of forest cover and enables habitat connectivity of the mosaic forest-steppe region, protecting from soil and water pollution from agriculture.
This paper provides a scientific basis and support for landscape experts, policymakers, and managers to improve the management effectiveness of protected areas through two key points:
-
facilitating the restoration and connectivity of forest-steppe habitats, giving information about hotspots, the locations with the highest loads of metals and nutrients;
-
enforcing DWPA consciousness with the application of mitigation measures on agricultura; plots with the highest levels of pollution that require increased awareness, penalties, and incentives.

2. Materials and Methods

2.1. Study Area

Lakes Palić and Ludaš, located in the north of the forest-steppe area of the Republic of Serbia (Figure 1), are shallow hypereutrophic Pannonian lakes (Table 1). Lake Ludaš, which forms the Ludaš Lake Special Nature Reserve (SNR) together with a complex of wetland habitats, has been classified as a wetland habitat of international importance (Ramsar site 3YU002) since March 1977. Lake Ludaš was joined with the Palić Nature Park (NP), which resulted in the establishment of the Palić–Ludaš regional park in 1982. Both areas belong to the Important Bird Area (IBA) of Subotica lakes and wetlands.
The study area extends from 103 to 106 m a.s.l., which indicates a flat terrain without pronounced morphological forms [42]. The geological characteristics of the study area are represented by Pliocene sediments that occur in the facies of boulders, sand, and clay [42]. Measured groundwater level is between 80 and 100 cm [42].
The ecological significance of this area is reflected in the richness of the flora and fauna, and it is also a habitat for several unique and legally protected species. The lakes are located on the Eastern European bird migration route and are critical habitats for resting, overwintering, and feeding waterfowl. The protected area is rich in 176 strictly protected species, and 50 species that are listed in Annex I of the Birds Directive, which separates them as species, on the basis of which Natura2000 areas are nominated [25]. Within the project that is currently being implemented in the Republic of Serbia (IPA-EU for Serbia-Continued support to the implementation of Chapter 27 in the field of nature protection (NATURA 2000 II; 2018/S 039-084316), the studied area was proposed to be part of the Natura 2000 area network. Additionally, this area is characterized by soil types (Histosol and Solonchak) that are globally endangered wetland habitats and have a high priority in the Ramsar Convention [43].
Agricultural areas extend to the lake, so the natural forest-steppe vegetation is present only in the remnants [44]. The study area is characterized by low landscape diversity, while the dominant land use class is agriculture, which places significant pressure on both lakes (extended to the water surface). The meaningful difference between these two lakes is in the level of protection. The Ludaš Lake Special Nature Reserve has a strict regime of nature protection, as defined by the Law on Nature Protection [28]. The Palić Nature Park is characterized by very developed tourism [44,45,46] and the Wastewater Treatment Plant Subotica (WWTPS), which is released into Lake Palić [30,44,47].
In this area, alien tree and shrub species were recorded, along with herbaceous species with a highly invasive potential. The following are invasive species: Ailanthus altissima (Mill.) Swingle, Fraxinus pennsylvanica Marshall, Acer negundo L., Lycium barbarum L., Asclepias syriaca L., while native species that inhabit the anthropogenic soils (ruderal species) are Robinia pseudoacacia L. and Sambucus nigra L. [44].
Despite its long-term protection and significant ecological importance, this area is not characterized by good water or soil quality. Point source (wastewater) and diffuse pollution are the main causes of this area’s degraded water quality (hypereutrophic state). In the 1960s, high water pollution was reported in Lake Palić [26,30,45,46] as a result of wastewater, changing salt concentration, and increased algal reproduction, which caused eutrophication [30]. During the 1970s, several attempts of lake revitalization comprising sludge treatment did not yield the expected results [22,26]. The hydrological regime of the lake was disturbed by hydromelioration works in the vicinity, groundwater exploitation, the development of the sewerage network for the city of Subotica, and the construction of a wastewater treatment plant whose recipient is Lake Palić [22]. The ecological effect of the mentioned activities is reflected in the frequent dead zone of fish [22,26,30,48,49,50].
Research on water quality in the study area using the Carlson trophic state index (TSI) was performed by Gržetić et al. [46], who reported a constant rise in the TSI value, which indicates a constant evolution of the water of Lake Palić from eutrophic to hypereutrophic. Additionally, the 2019 annual report from the water monitoring of Lakes Palić and Ludaš [50] showed poor and very poor water quality, respectively.

2.2. Methodology

2.2.1. Sampling and Analysis

In the area of the Palić–Ludaš regional park, 70 composite soil samples were taken, with every composite sample consisting of 5 subsamples representing one land plot (350 samples in total). Mixed samples of 500 g were taken at two depths, 0–30 and 30–60 cm. The physical and chemical properties of the soil, and the concentration of heavy metals in the soil were determined. Prior to analytical processing, soil samples were air-dried, crushed, and sieved through a 2 mm sieve. The granulometric composition of the soil was determined using the international phosphate B method, while the international Atteberg distribution [51] was used for the distribution of the obtained values.
The pH value of the soil was determined using a glass electrode in a 1:5 (volume fraction) suspension of soil in water (pH in H2O), and in a 1 mol/l potassium chloride solution (pH in KCl), using the ISO 10390:2007 method [52]. Specific electrical conductivity in an aqueous extract of soil is determined using an electrical conductivity meter according to ISO 11265:1994 [53]. Analyses were performed in the laboratory of the Institute of Soil Science, Belgrade, Serbia SRPS ISO/IEC 17025:2017, accreditation no.: 01-207.
Humus content was determined using the Tyurin method according to ISO 10694:2005 [54]. The total amount of base cations and the hydrolytic acidity of the soil were determined using the Kappen method [51]. Calcium carbonate content was determined with a Scheibler altimeter [55].
Easily accessible phosphorus and potassium were determined using the Egner Reihm AL method [56], while the Kjeldahl method was used to determine nitrogen [57]. The content of nitrogen, easily accessible phosphorus, and potassium of the soil were classified as shown in Table 2.
Soil samples were digested with aqua regia under reflux for 2 h with water-cooled condensers to determine the content of trace elements [60]. The content of heavy metals (Zn, Cu, Pb, Cr, Ni, Mn, Cd, and Hg) was determined using flame atomic absorption spectrophotometry (AAS) [61]. Quality control (QC) was performed using certified reference materials (CRM): ERM-CC-141 sample no. 0395 (loam soil).

2.2.2. Ecological Risk Assessment

Soil contamination by heavy metals was analyzed using individual contamination indices. Indices were calculated (Table 3) on the basis of the measured content of each heavy metal in the soil and background concentration. According to investigations performed in similar geological and pedological conditions [9,62], the following values of background concentrations were adopted: Zn—19.0 mg/kg, Cu—4.0 mg/kg, Pb—7.1 mg/kg, Ni—6.5 mg/kg, Cd—0.13 mg/kg, and Hg—0.15 mg/kg.
Enrichment factor (EF) assesses the degree of anthropogenic impact on the concentration of heavy metals in the soil. Metals with low variability occurrence are reference metals, and the most commonly used are Al, Ca, Fe, Mg, and Mn [35,63,64]. The reference element used here was manganese (Mn) because it is one of the main components of the soil crust and is stable in the soil [18,35,65].
On the basis of the concentration of heavy metals in the soil and the background concentration, the geoaccumulation index (Igeo) is calculated [66].
The pollution index (PI) is usually used to determine which heavy metal represents the greatest danger to the environment [67]. It is also used when calculating more complex pollution indices, such as the Nemerow pollution index and the potential ecological risk index. The Nemerow pollution index (PIN) includes the content of all available heavy metals and enables an assessment of the total degree of soil pollution [8,40,68].
When calculating the individual environmental risk index ( E r i ) for each heavy metal, the toxicity coefficient is used. The values of the toxicity coefficients ( T r i ) are Zn—1, Cu—5, Pb—5, Ni—5, Cr—2, Cd—30, Hg—40 [63]. Potential ecological risk (RI) encompasses the combined impact of harmful micronutrients on an ecosystem (Table 3). This index is used to assess the environmental risk posed by the concentration of heavy metals in water, air, and soil [67].

2.2.3. Geospatial and Statistical Analysis

The spatial description of the pollution index was performed using empirical Bayesian kriging (EBK) in the ArcMap 10.8.1 software package (ESRI, Redlands, CA, USA). Statistical analysis was performed in Statgraphics ver. 16.1.11 with the application of the t-test and the Pearson correlation coefficient.

3. Results

3.1. Physical and Chemical Soil Properties

Results of soil physical analysis show that the examined samples around Palić belong to loam classes, while a somewhat lighter mechanical composition (sand and sand–loam) is present around Ludaš. The results of some chemical characteristics are shown in Table 4.

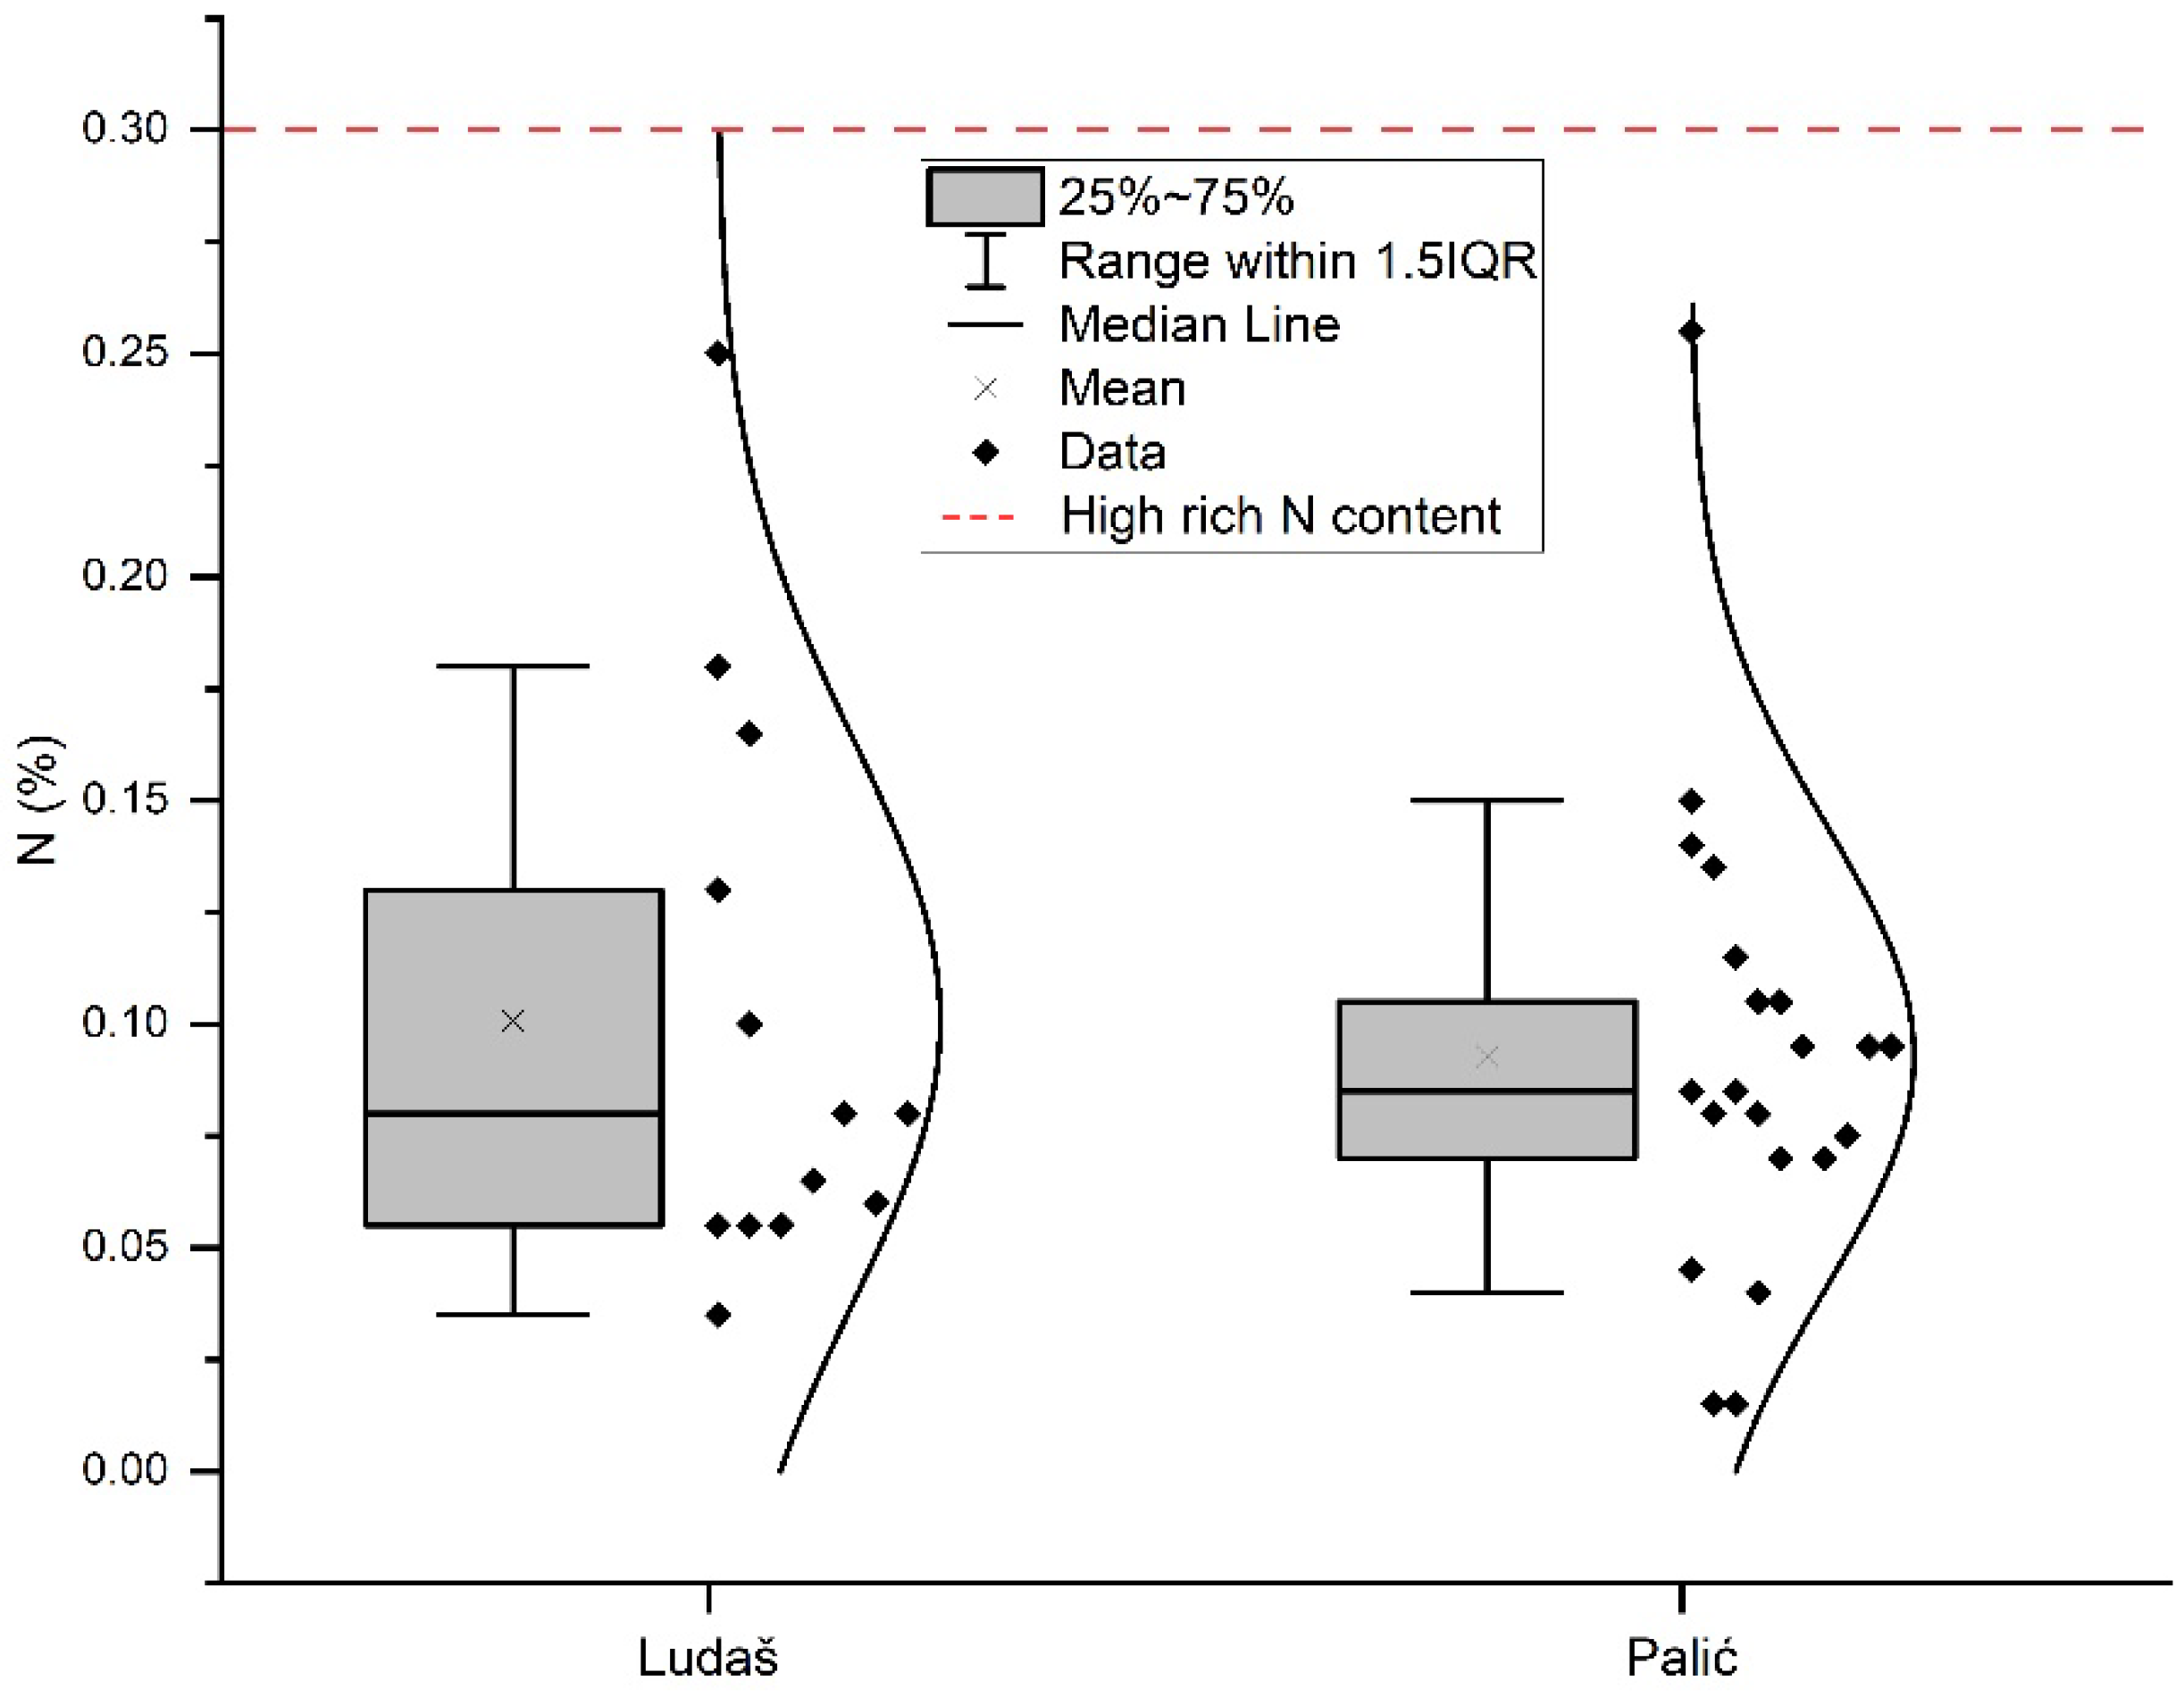
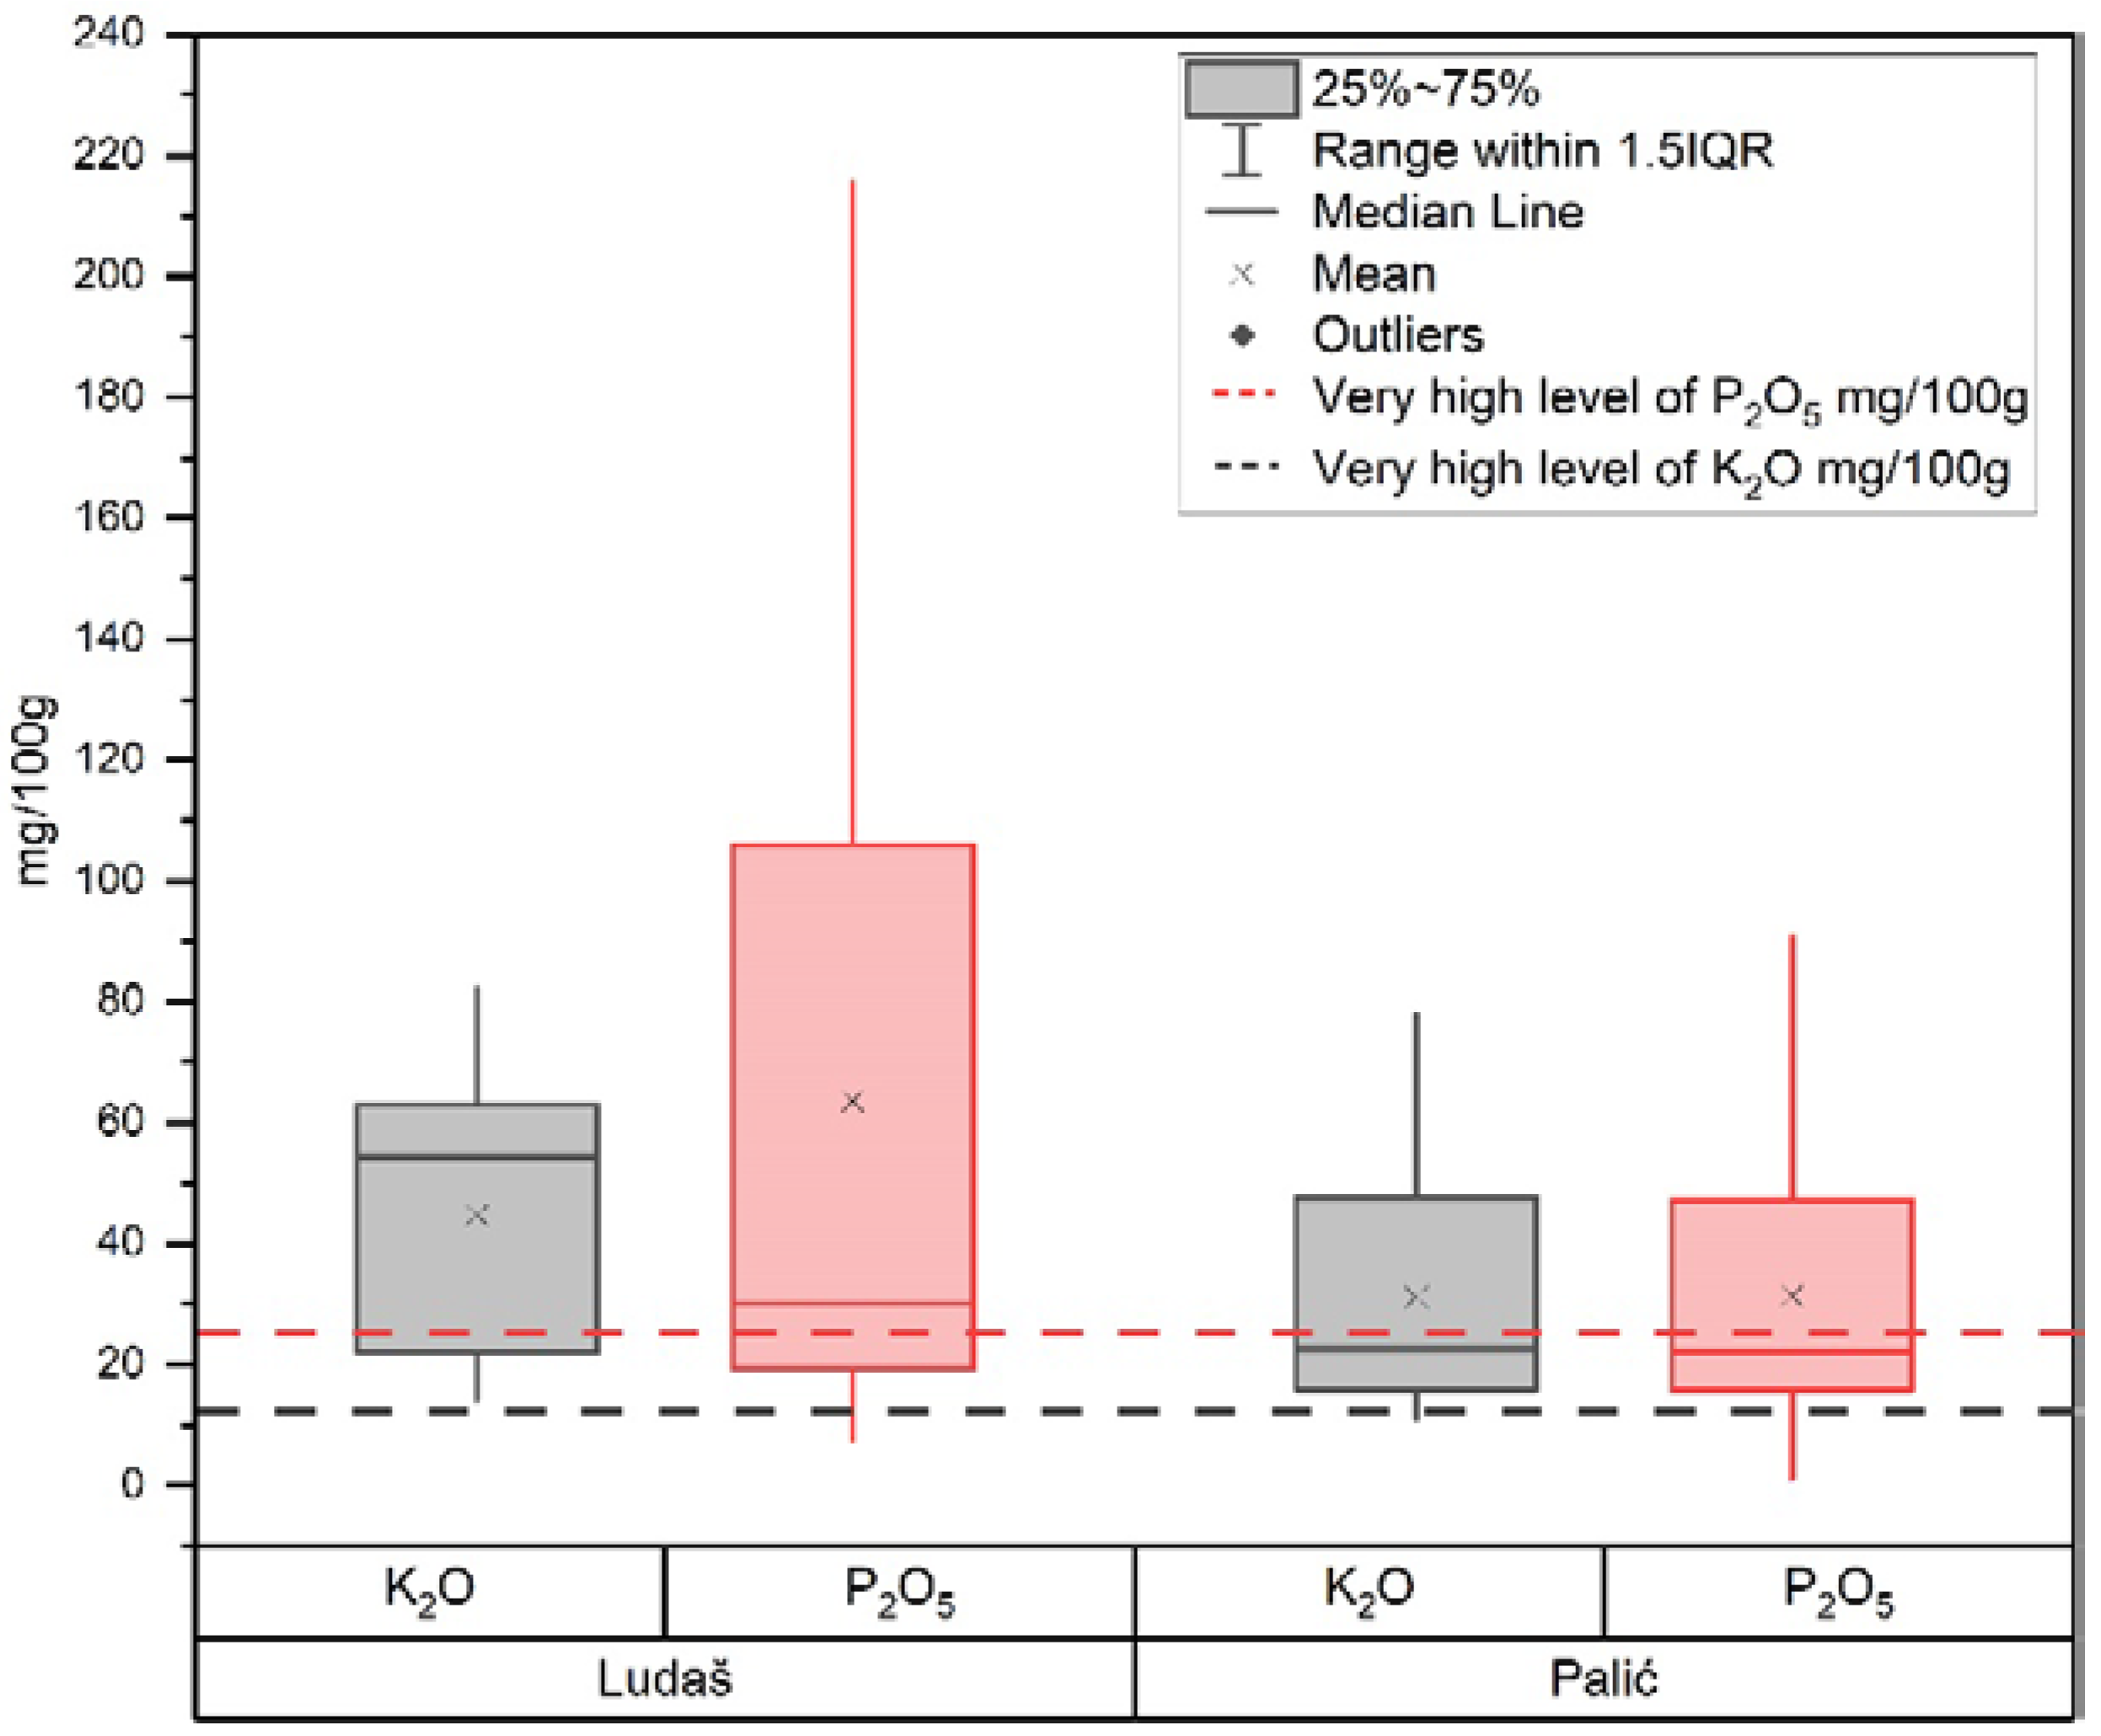
3.2. Nutrient Concentration in Soil (N, P2O5, K2O)

The values of nitrogen content in the soil are shown in Figure 2. According to the classification (Table 2), most samples collected in the Palić area were classified as moderate and rich content, and only a few samples indicated rich nitrogen content in the soil. Samples from the Ludaš area were classified as poor, moderate, and rich content, but some samples belonged to the class with high rich nitrogen content.
Contents of P2O5 and K2O are shown in Figure 3. According to the classification in Table 2, the dashed line represents a very high level of potassium and phosphorous. Values were higher at Ludaš than those at Palić. At Ludaš, some samples reached values above 200 mg/100 g.

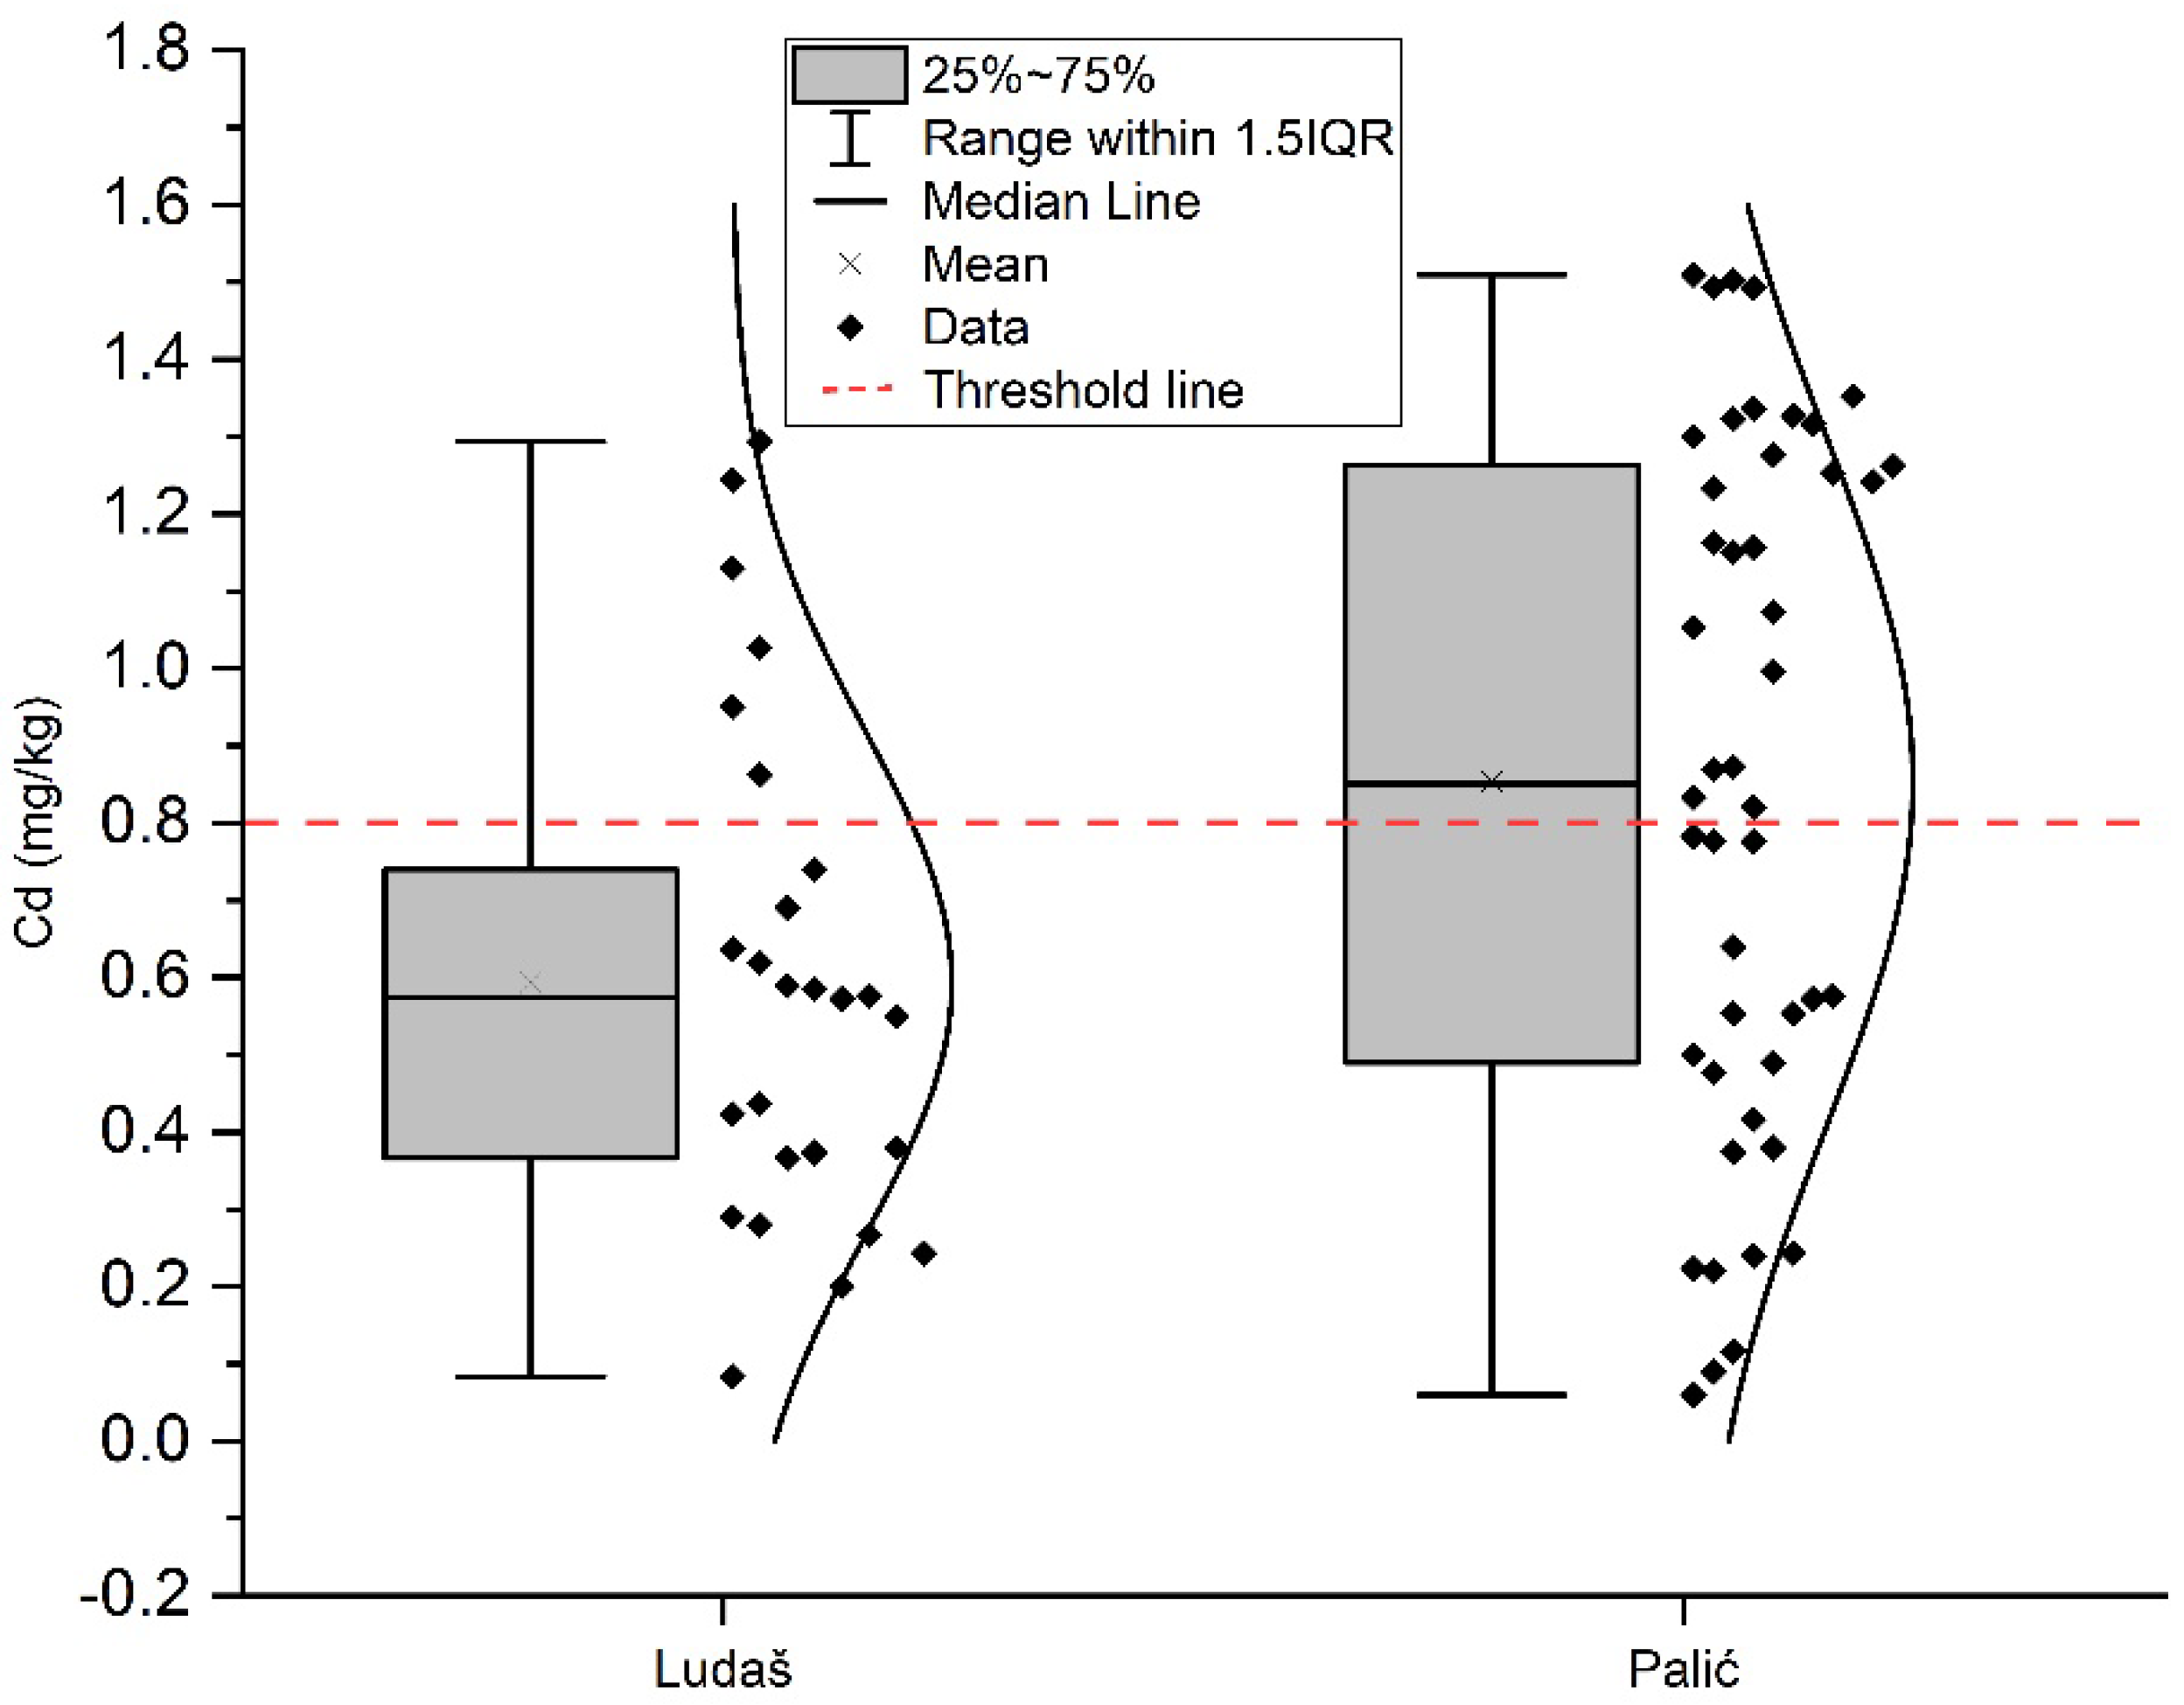
3.3. Concentration of Heavy Metals in Soil

The basic parameters of descriptive statistics and t-test results of heavy metals in the study area are presented in Table 5. When comparing the concentrations of heavy metals between the two localities (Palić and Ludaš), the results of the analysis showed stronger correlations in the surface layer of the soil (Cr, Ni, Mn, Cd, and Hg) compared to the layer of 30–60 cm, where a statistically significant difference was observed in Cr, Ni, Mn, and Zn (Table 5).
Increased concentrations of cadmium were also found within the Palić Nature Park (NP) and the Ludaš Special Nature Reserve (SNR). The concentration of cadmium in Palić was 0.89 ± 0.43; in Ludaš, it was 0.59 ± 0.31 (Figure 4). Cadmium in this area exceeds the limit values at both depths [72].
According to the values of the Pearson correlation coefficient (Table 6), all metals showed strong positive correlation (p < 0.01) with each other and with humus, except Cd. Some tested heavy metals (Zn, Cu, Pb, Cr, Ni, Mn, and Hg) were significantly correlated with pH, N, P2O5, K2O, and clay. Humus showed positive correlation with Zn and Cr (Table 7), and Cu and Ni correlated with P2O5, K2O, and EC.

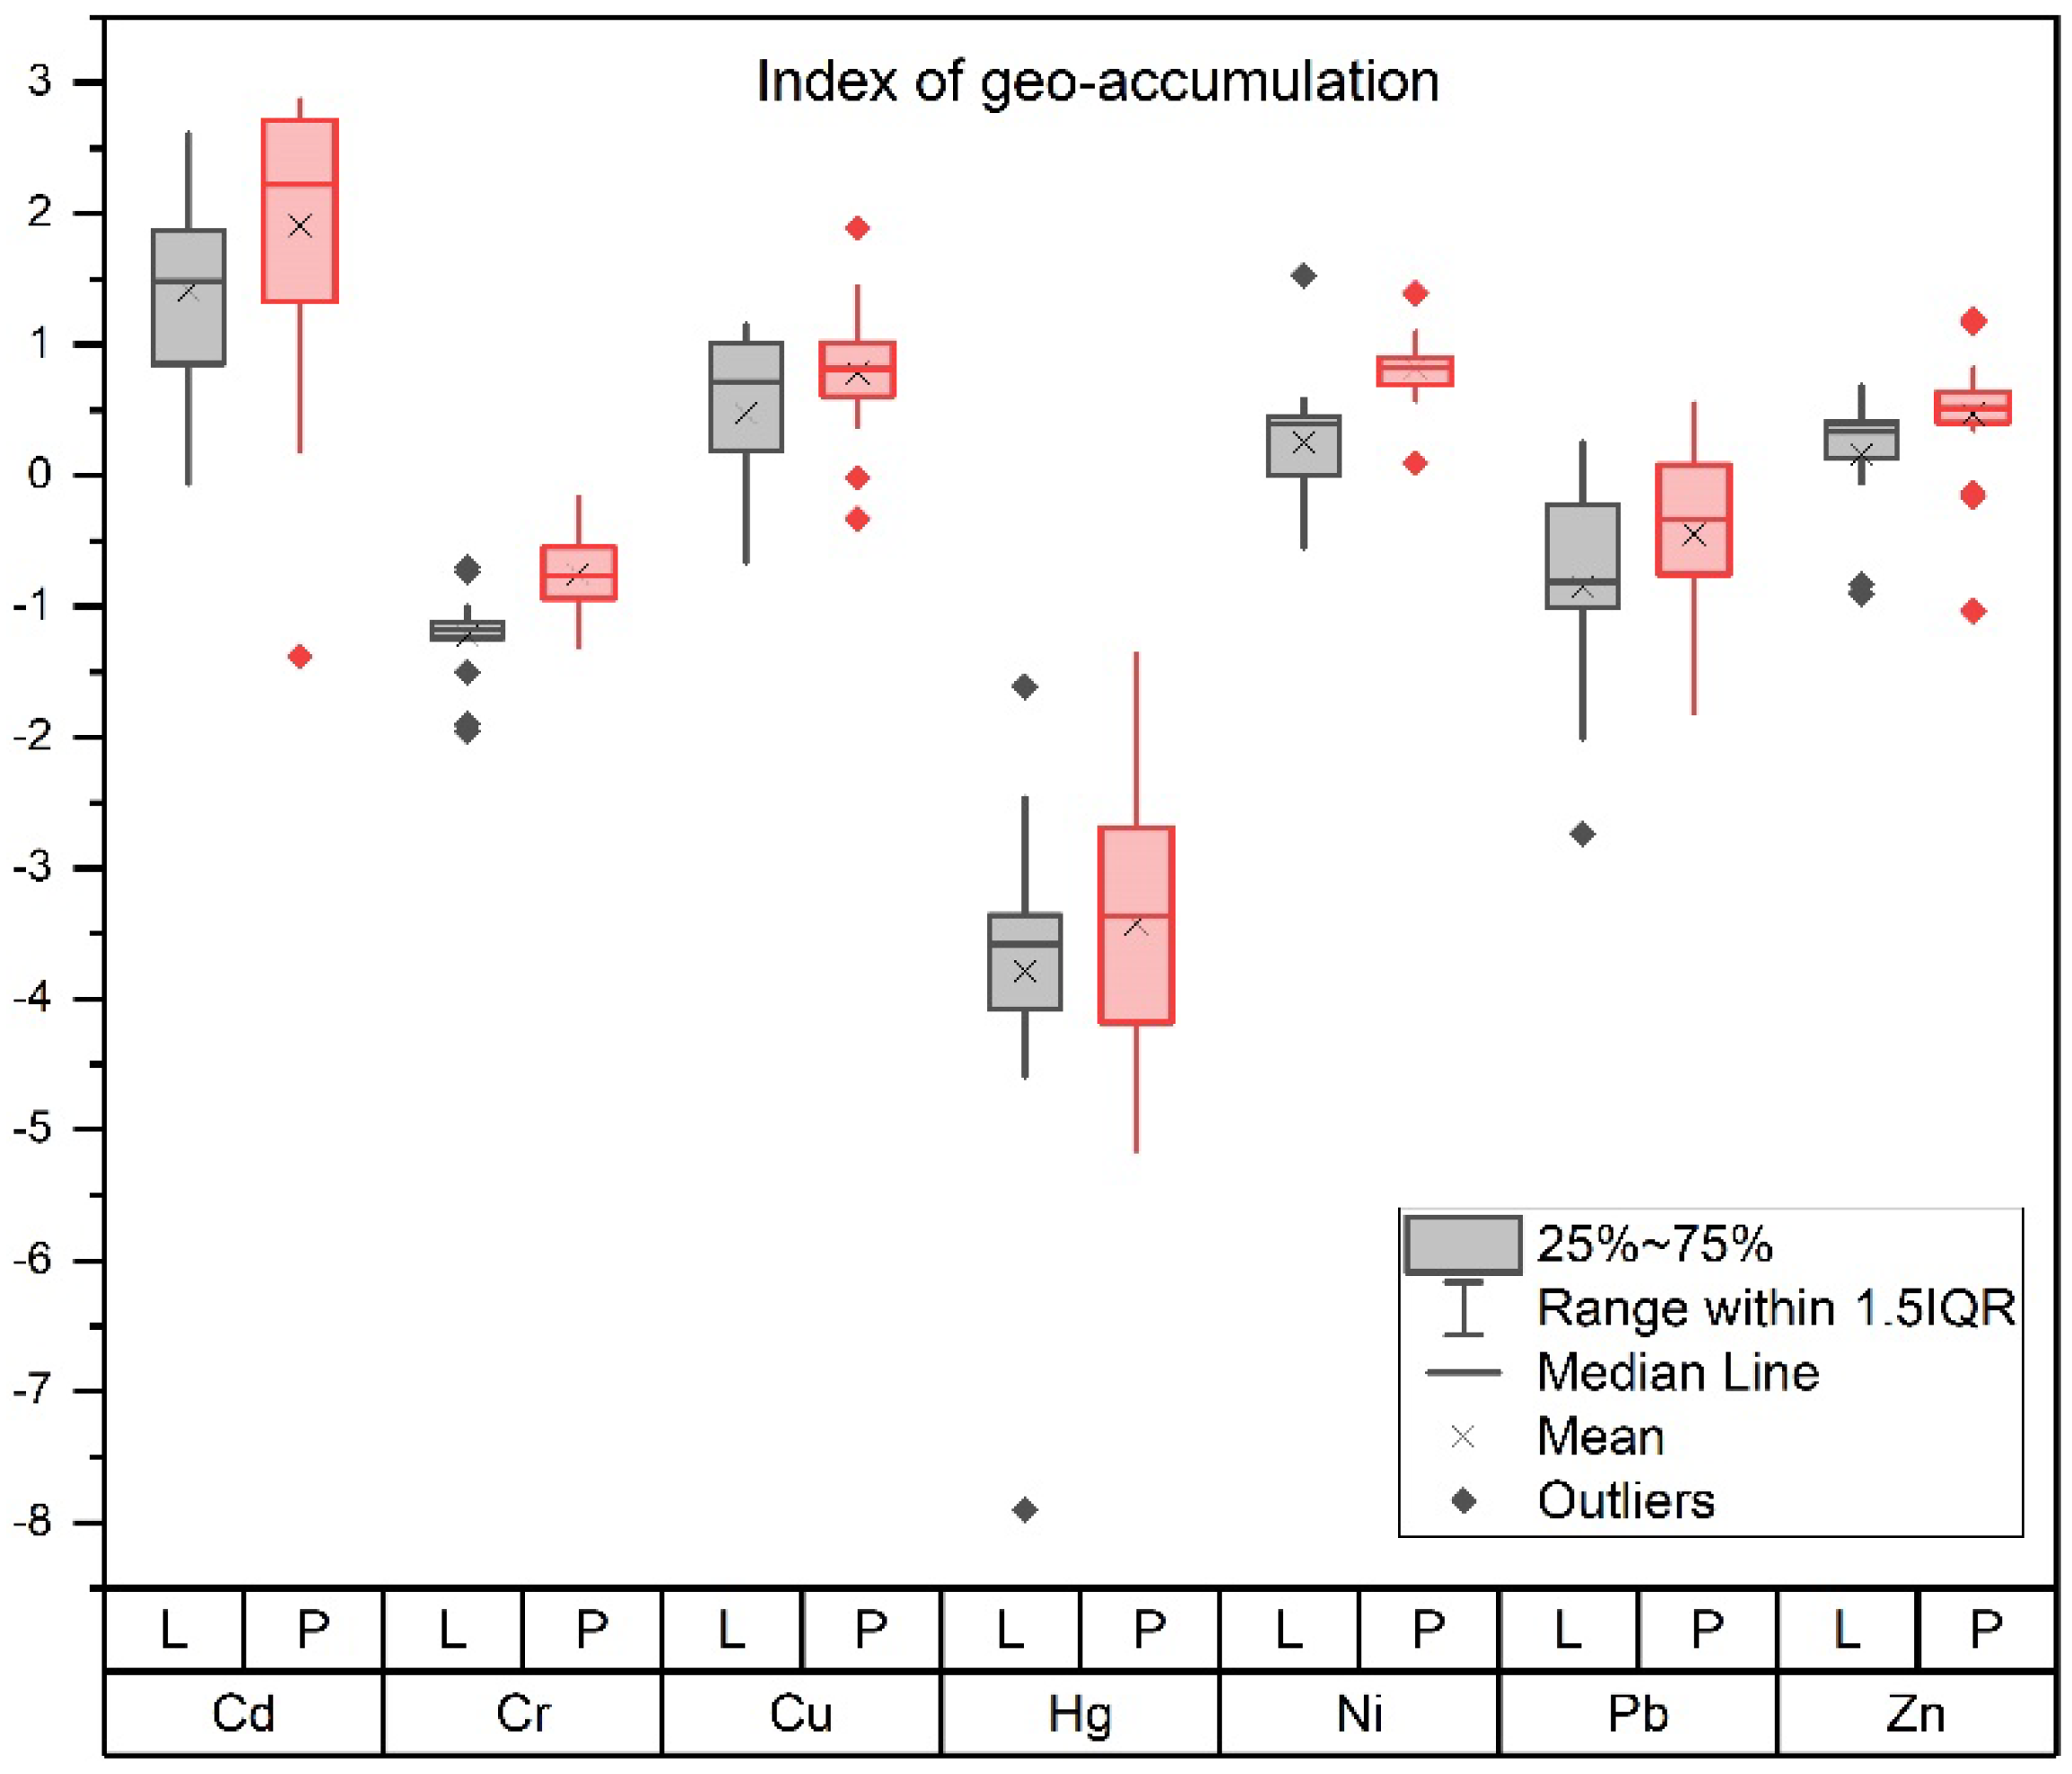
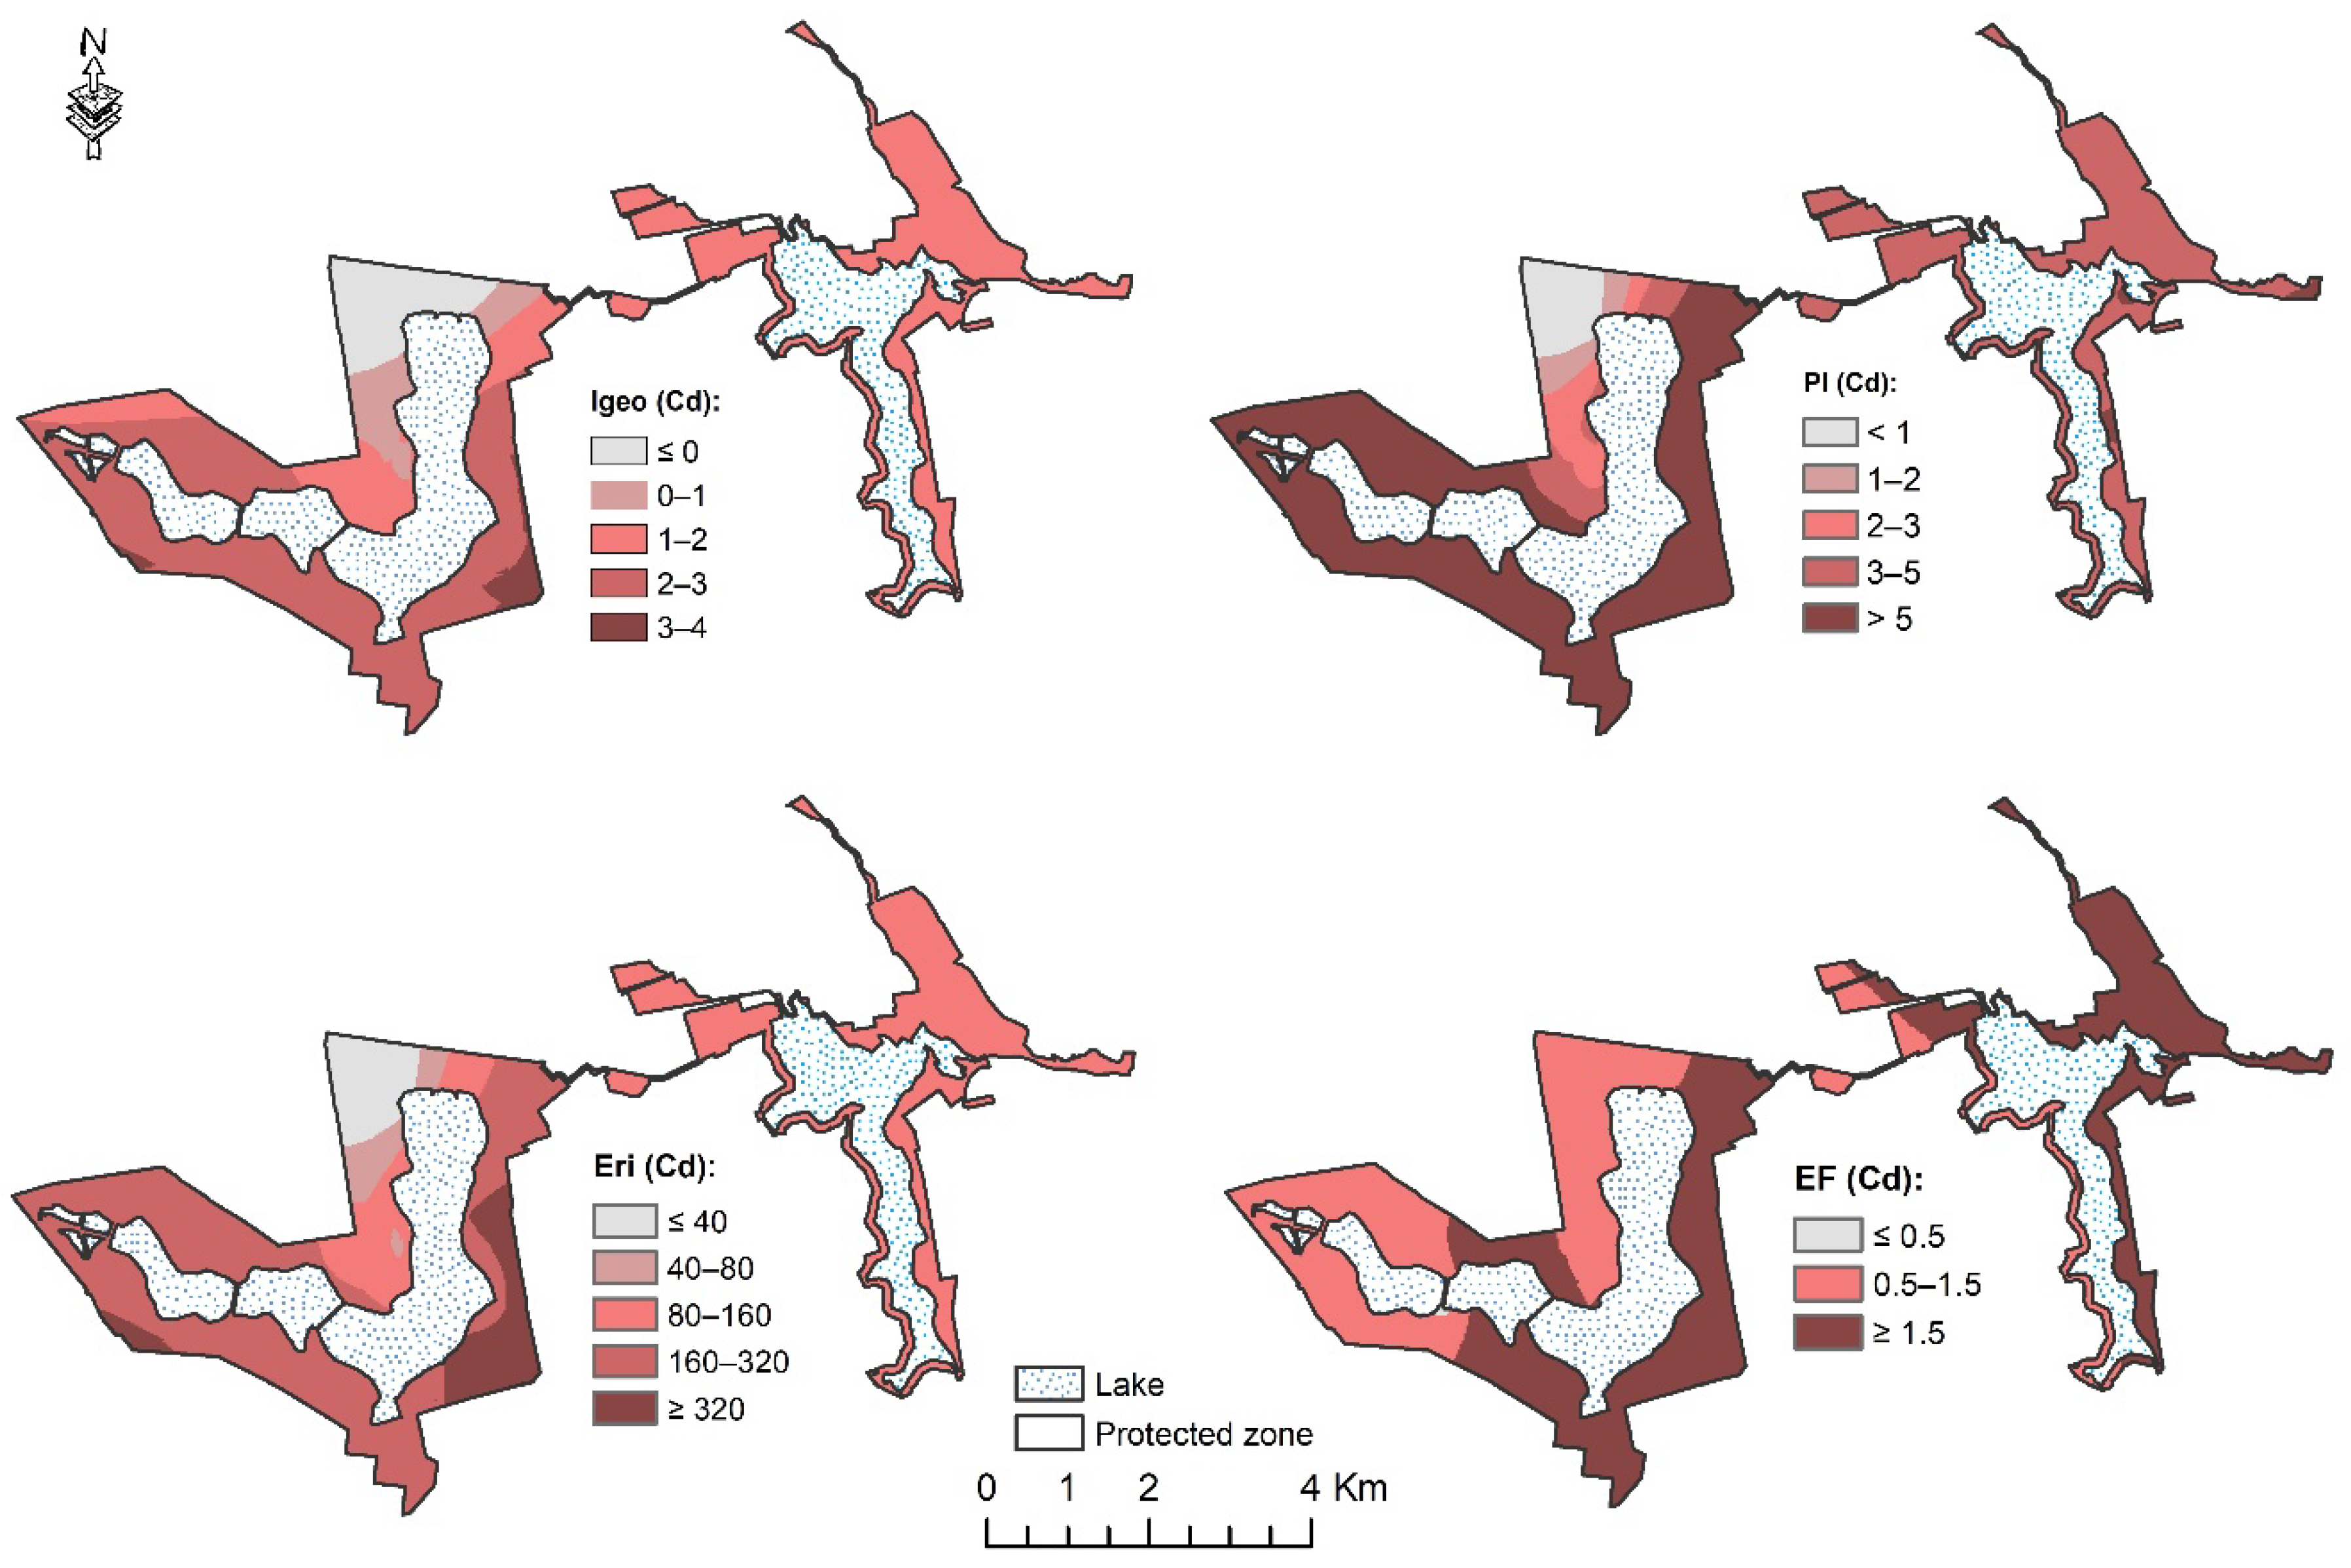
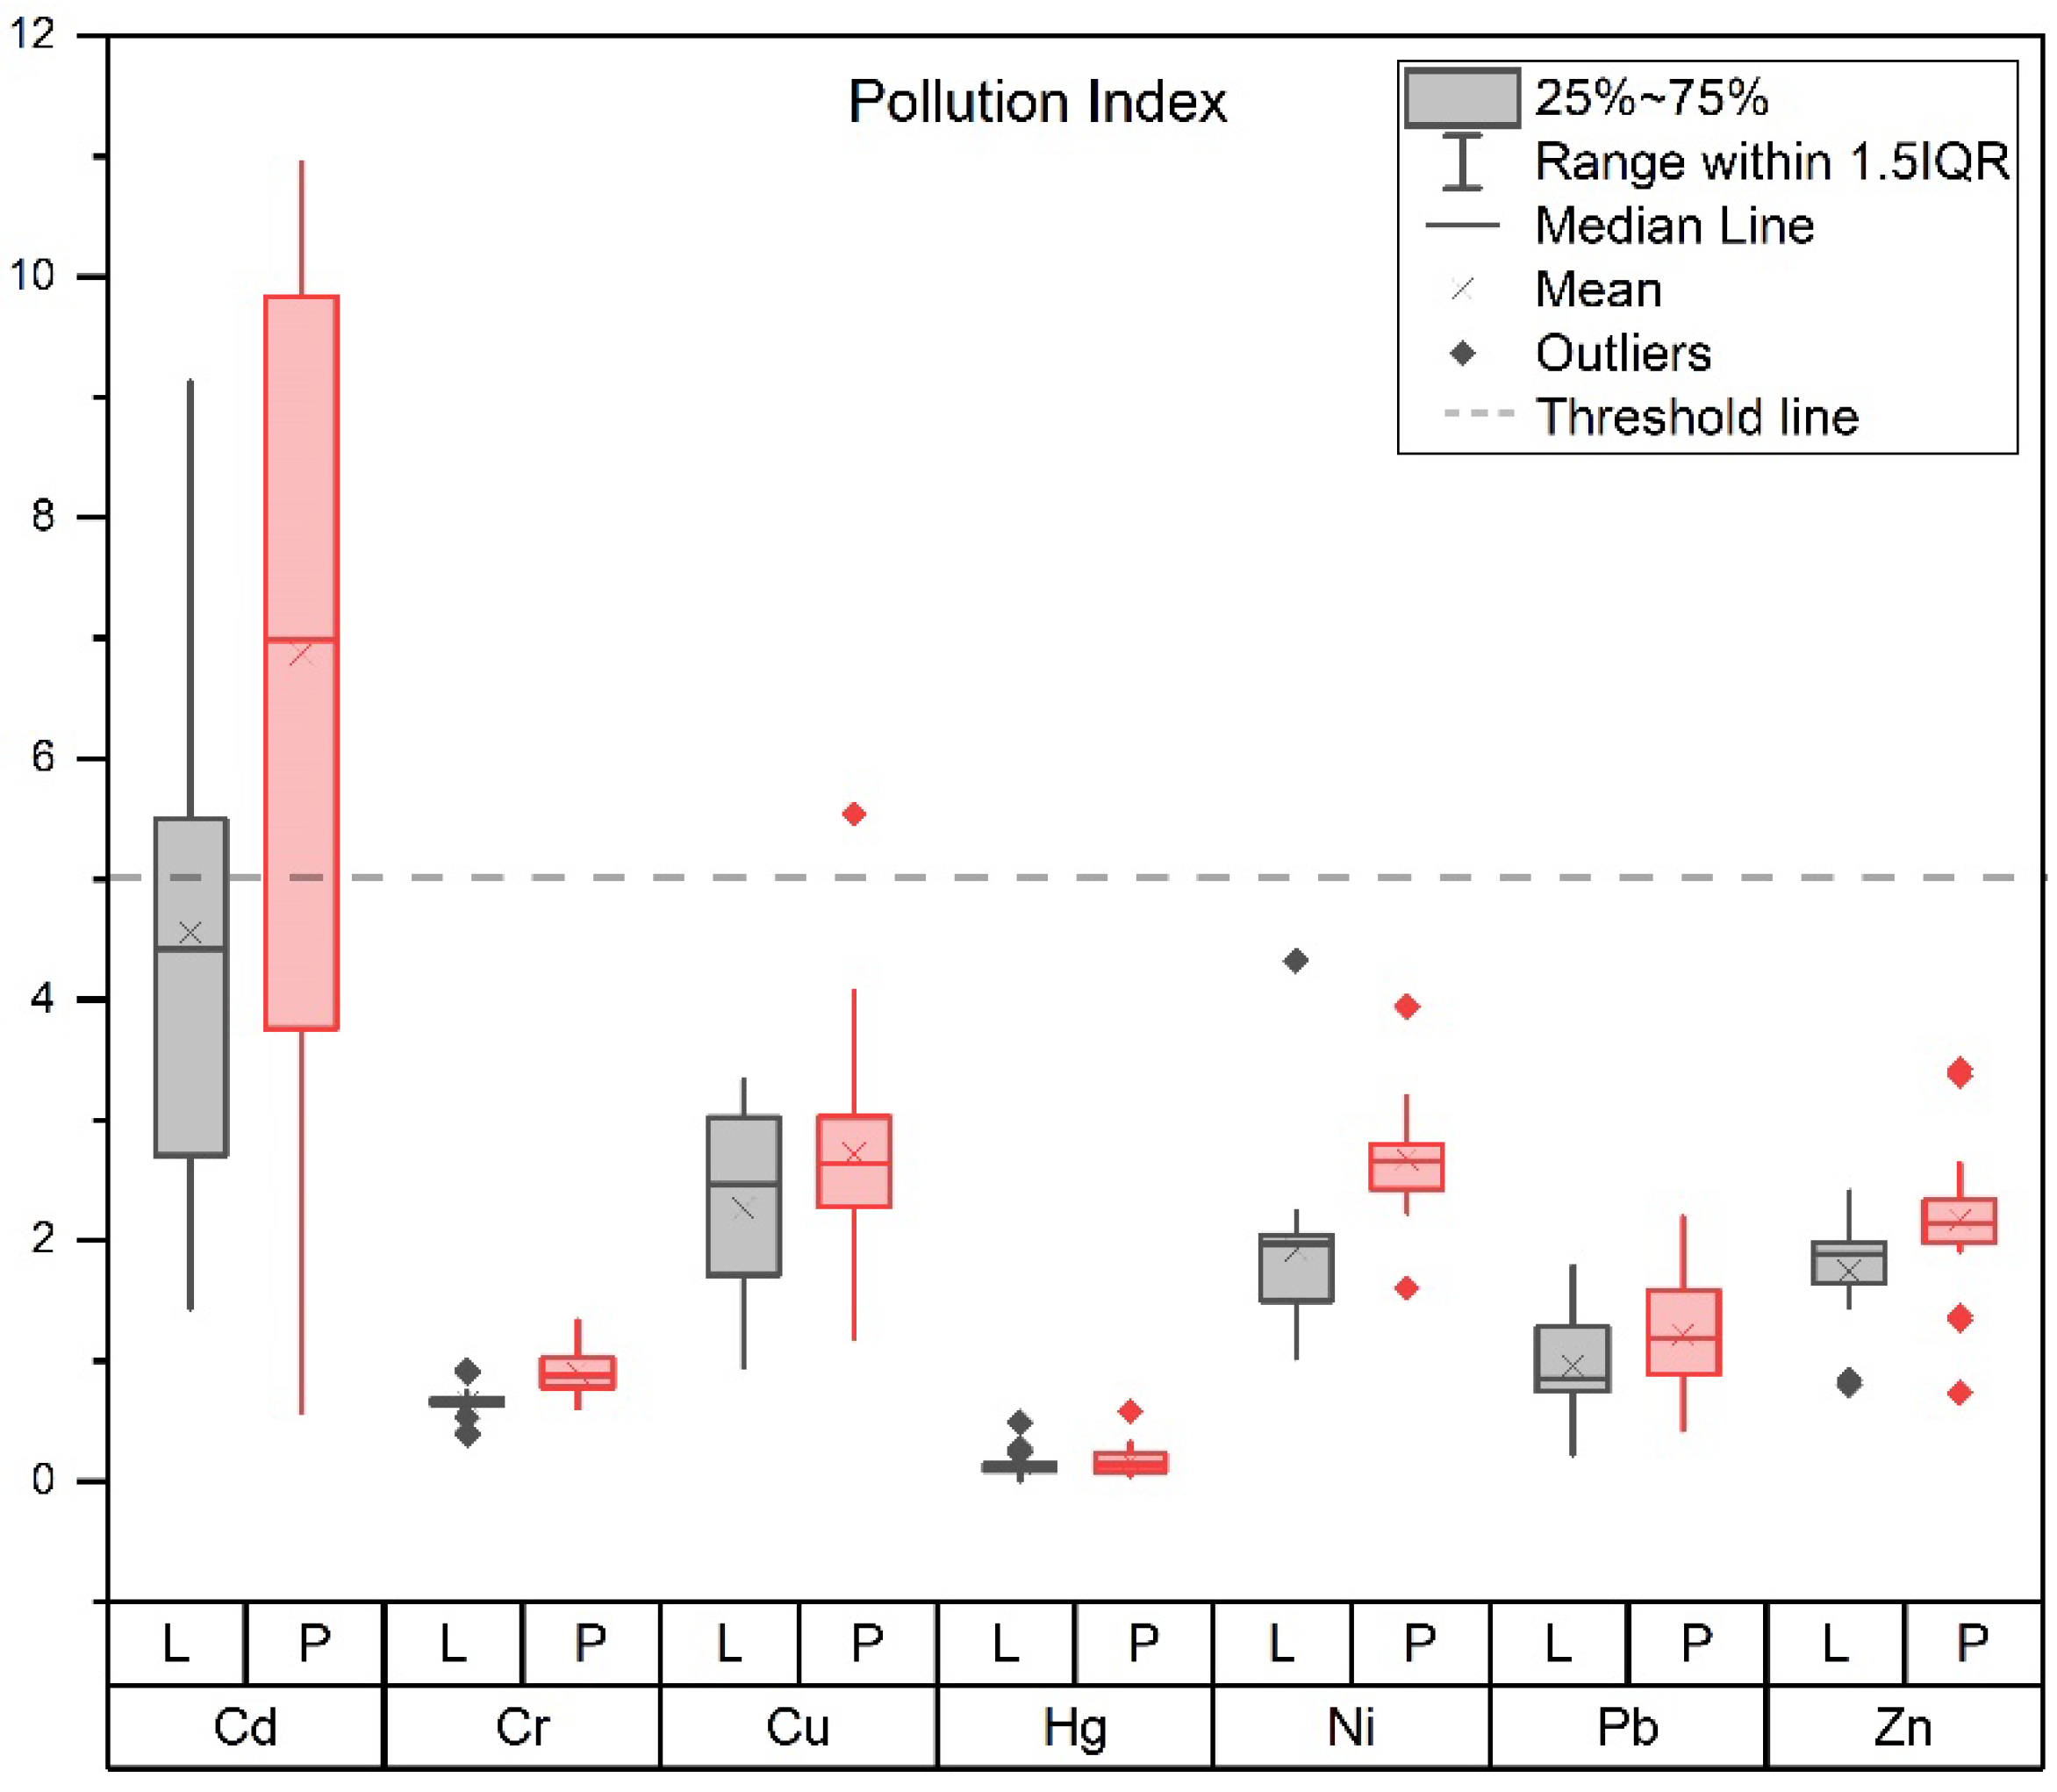
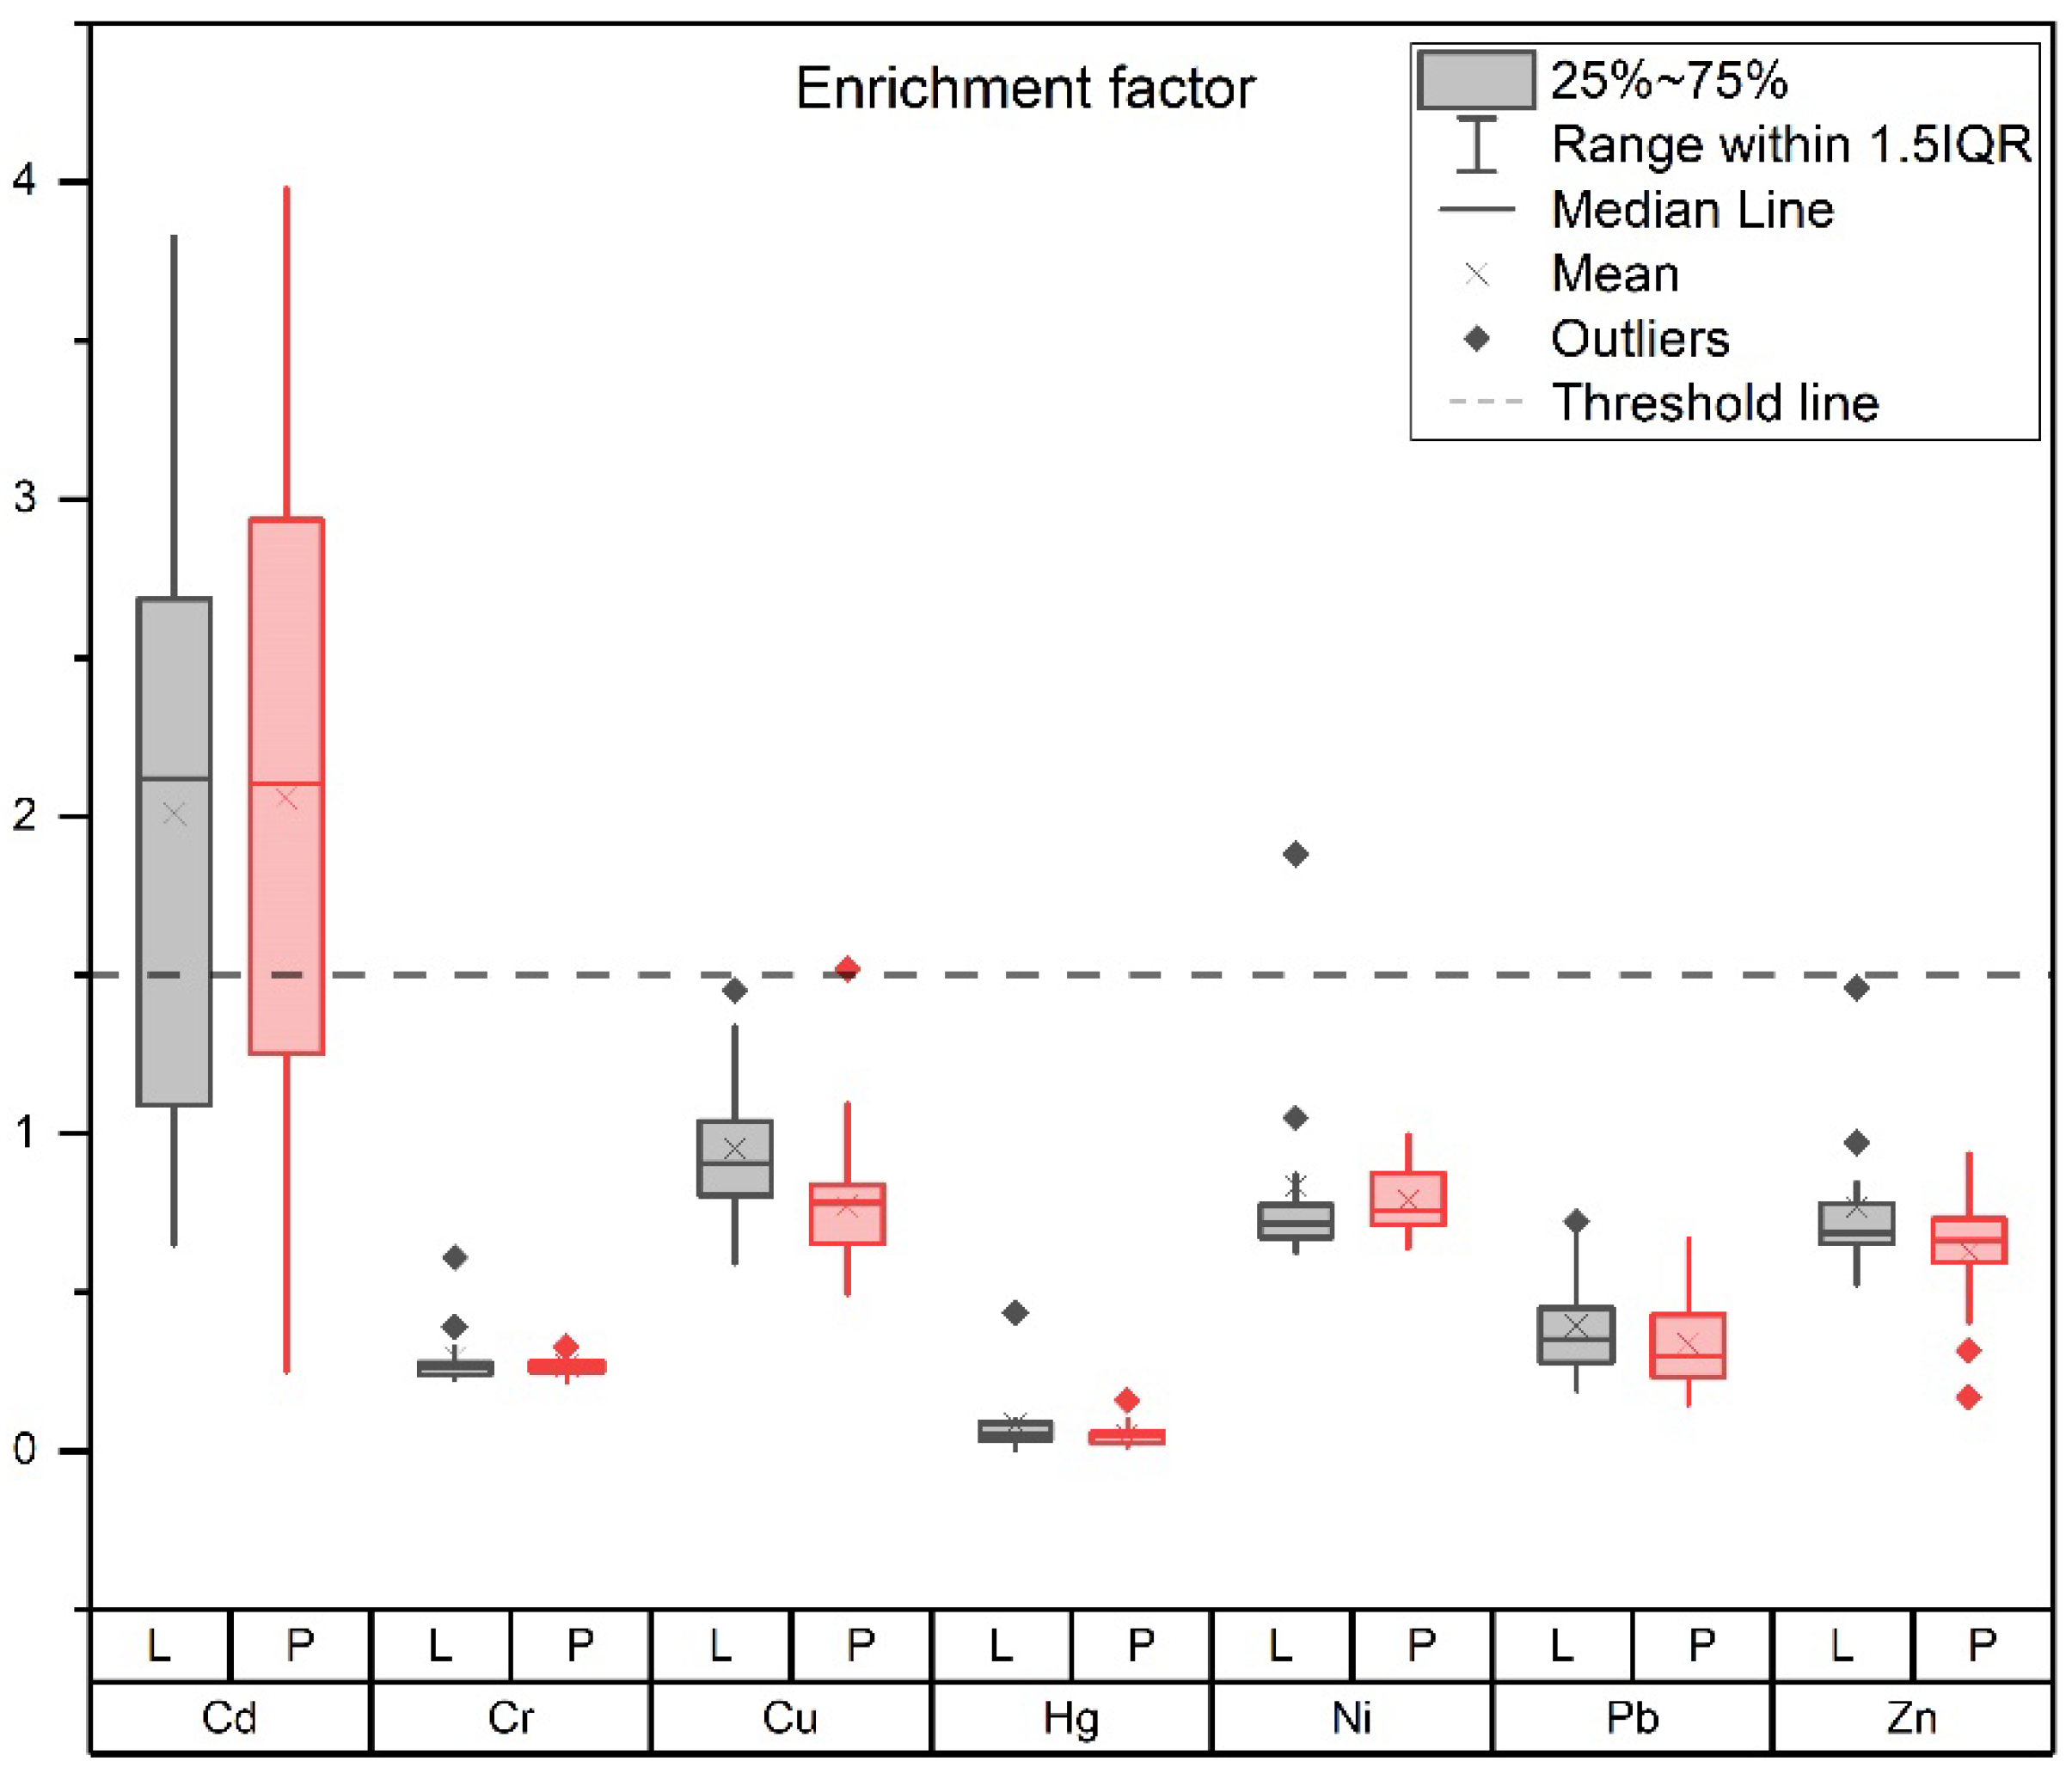
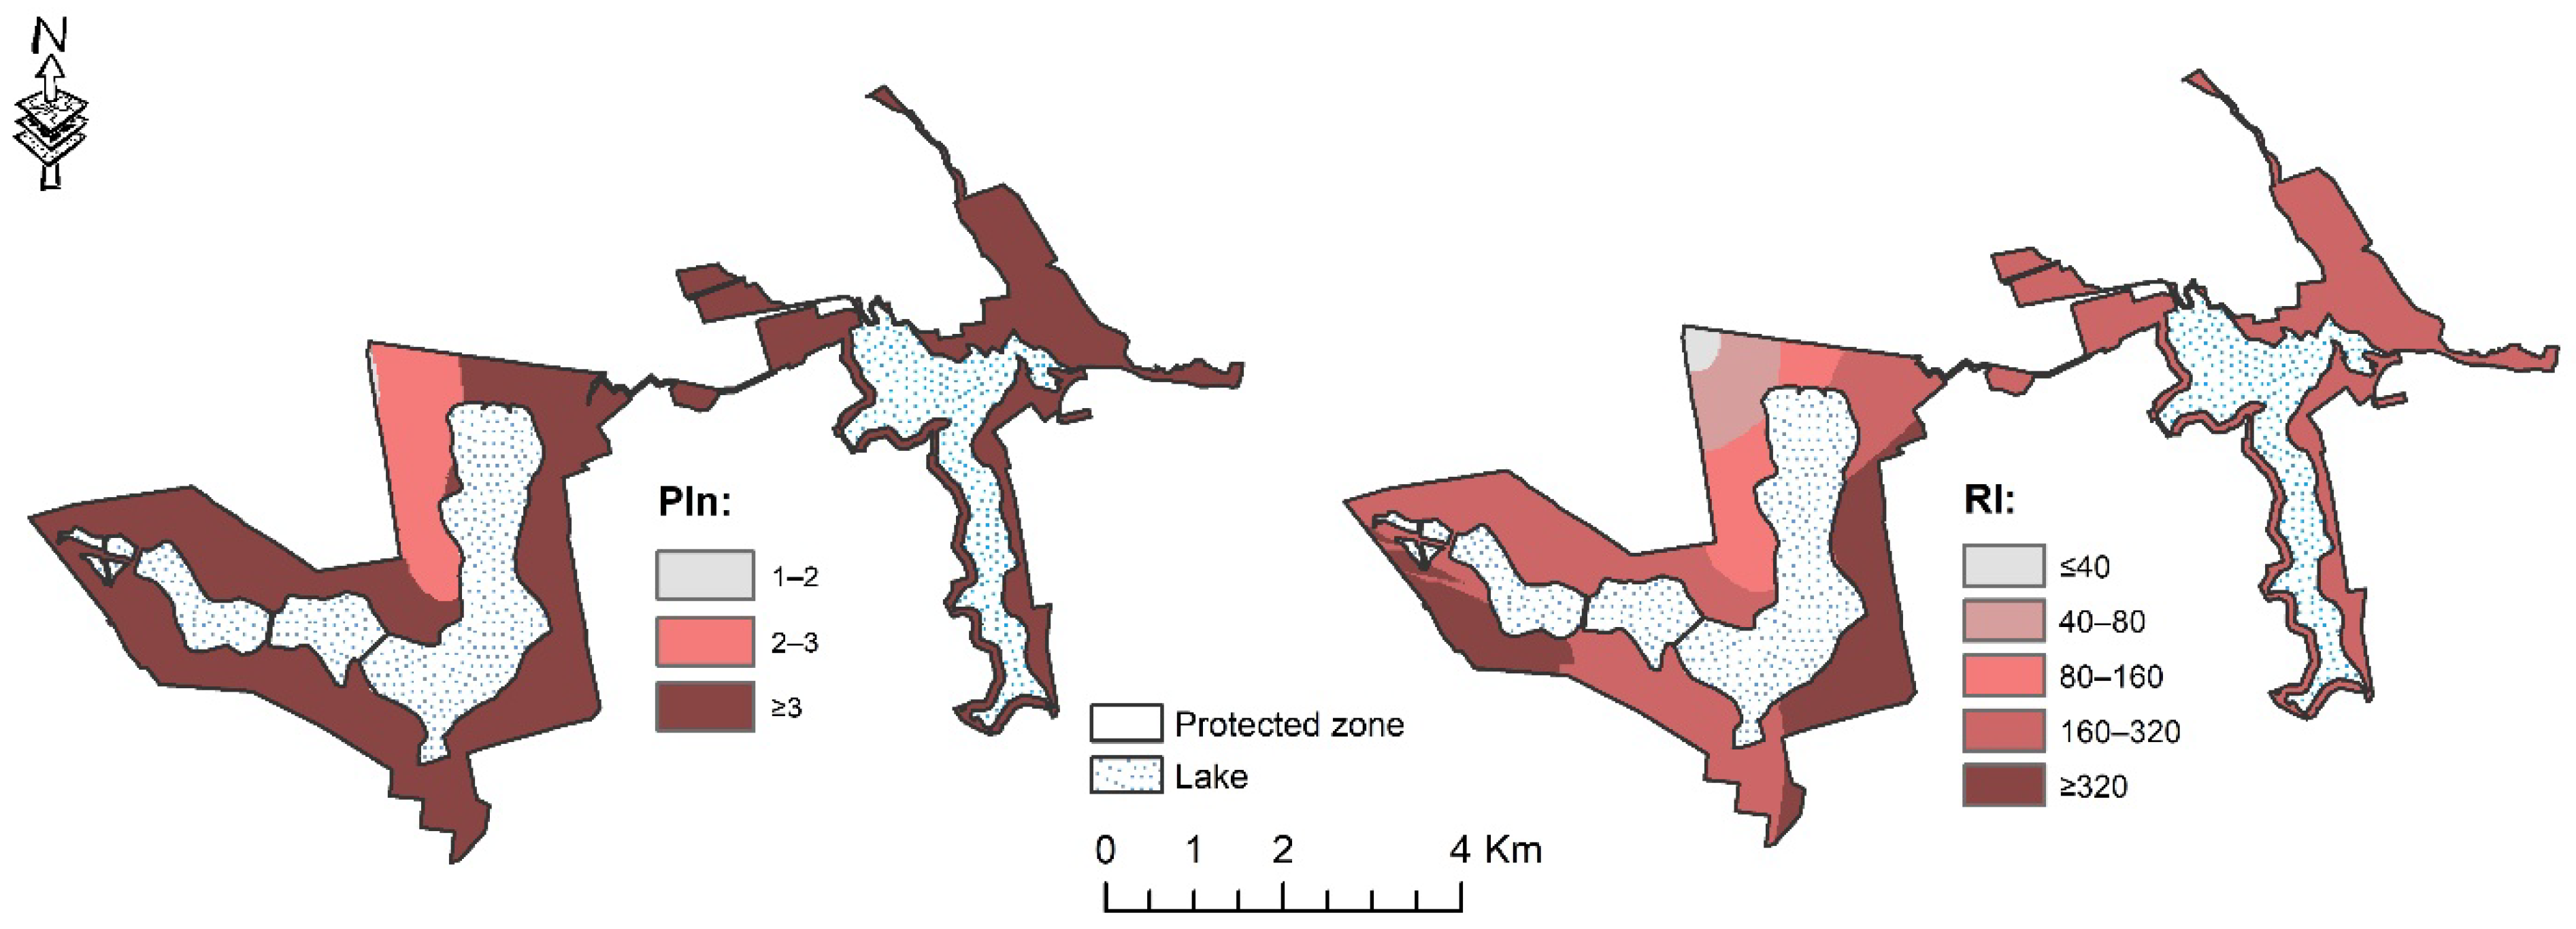
3.4. Pollution Indices

The values of the geoaccumulation index (Igeo) are shown in Figure 5. This index for Pb, Cr, and Hg belongs to the class of unpolluted soil, while Zn, Cu, and Ni belong to the class of unpolluted to moderately polluted soil. More than half of the samples collected in the Palić area using the Igeo index were classified as moderately to heavily polluted regarding cadmium. In the Ludaš area, Igeo values for Cd mostly belonged to classes of unpolluted to moderately polluted soil (Figure 6).
The geospatial values of the Pollution index (PI) are shown in Figure 6. This belongs to different classes of pollution in the series Cd > Cu > Ni > Zn > Pb > Cr > Hg (from most to least polluted). The index for cadmium in the Palić area belongs to the very strong class (6.87 ± 3.33) and the strong class in Ludaš (4.56 ± 2.37) (Figure 7).
Enrichment factor (EF) (Figure 8) showed that the examined samples of the entire studied area belonged to different classes in the series Cd > Cu > Ni > Zn > Pb > Cr > Hg (from most to least polluted). Cadmium stood out because it was the only metal with values of EF greater than 1.5, indicating that its concentration in the soil is not natural (Figure 6). Anthropogenic activities increase its concentration. The mean value of the enrichment factor for Cd in Ludaš was 2.01 ± 0.94; in Palić, it was 2.06 ± 1.06.
Nemerow’s mutual pollution index (PIN) indicates that this is an area of severe pollution (Figure 9). The Nemerow pollution index for the Ludaš area was 3.57 ± 1.58, which classifies this area as heavily polluted. However, in the Palić area, the index was 5.32 ± 2.08, which means that the most common classes were moderate and heavy pollution.
Calculating the ERI determined that cadmium belonged to all classes (Figure 6). The ecological risk index (RI) is shown in Figure 9. At the Ludaš locality, ecological risk is 171.63 ± 72.39, and the represented classes are at moderate, considerable, and very high contamination risk. The ecological risk index in Palić is 249.92 ± 100.57. The largest number of samples from Palić belong to the considerable and very high contamination risk classes. Most samples from the protected Palić area belong to the category of very high ecological risk. Ludaš samples belong to the class of significant ecological risk.
The spatial representation of Cd concentrations is shown in Figure 6. All indices indicate high concentrations of cadmium and belong to the class of the most polluted or endangered soil. Figure 6 shows that Palić and Ludaš differ in the degree of endangerment for indices such as Igeo and Eri. In terms of these two indices, the shoreline of Lake Ludaš is less polluted than that of Palić. However, in terms of the pollution index (PI), there are strong and very strong degrees of pollution. The calculated values of the enrichment factor in the eastern part of NP Palić and SNR Ludaš indicate that the concentration of heavy metals is delivered from noncrustal materials (Figure 6).

4. Discussion

The study area is characterized by an alkaline soil reaction as a result of a significant concentration of free calcium carbonate and easily soluble salts that increase with soil depth (Table 4). These soils are characterized by relatively low electrical conductivity (EC) but high content of Na+ ions, in some spots resulting in a pH value greater than 8.5. The electrical conductivity of the soil is indirectly correlated with the physical and chemical characteristics of the soil (pH, humus, and CaCO3) (Table 6 and Table 7) [73], and may affect plant growth. Areas where it is difficult to establish a buffer zone with trees and shrubs due to the high concentration of salt in the soil are parts of the western, southern, and southeastern shores of Lake Palić, and the southwestern part of the shores of Lake Ludaš. However, these areas certainly stand out, and require a special method of management and conservation as a potentially significant saline steppe habitat.
High nutrient concentrations can affect plant growth and the appearance of harmful effects on the composition and structure of the plant community that was confirmed in past studies [74,75]. Results show mainly moderate nitrogen content in the soil, while just a few samples (in Lake Ludaš) had rich contents (Figure 3). The moderate content of nitrogen in the soil could be the result of the intensive agriculture that dominates the investigated area [46]. High values of P2O5 and K2O content in the soil were measured. The highest concentrations of available potassium and phosphorus were recorded in the western, eastern, and southern shorelines of Lakes Palić and Ludaš. Before buffer zone establishment and the introduction of indigenous species, these areas require intensive maintenance by the removal of existing invasive and allochthonous plant species that have spread due to eutrophic and hypereutrophic conditions in recent years.
Robinia pseudoacacia L. and Sambucus nigra L. are ruderal rather than invasive and occur in highly disturbed habitats with high soil nutrients (high concentrations of phosphorus and potassium). They are not treated as invasive because they do not cause loss of native vegetation, but their presence indicates habitat condition changes due to anthropogenic activity. Conditionally, those species are both natural bioindicators of soil nutrient enrichment and remediates because of their high ability to uptake excess nitrogen, phosphorus, and potassium from the soil.
Strong correlation among Zn, Cu, Pb, Cr, Ni, and Mn could indicate the same origin of these heavy metals (parent material). They are strongly correlated with humus [76,77], pH [76,78], and clay [78,79], as this study indicates. Nevertheless, anthropogenic activities [76] and soil properties [79] can affect the mobility of micronutrients. Numerous studies [80] show how anthropogenic activities, primarily the use of fertilizers, lead to an acidification process. In that sense, lower pH values could further contribute to higher heavy-metal mobility in the soil [81]. Cd not being correlated with the other studied metals indicates anthropogenic origin. This was additionally confirmed by the high ecological risk obtained by calculating the pollution index (Figure 6 and Figure 9).
Artificial (phosphorus) fertilizers contain cadmium, and their use increases this heavy metal in the soil [82]. The concentration of Cd in phosphate fertilizers is lower than the concentration of other microelements [79]. However, cadmium is one of the most ecotoxic metals, which negatively affects all biological processes in humans, plants, and animals [77,83], so much so that some governments have imposed restrictions on the Cd content of P fertilizers [82]. It is necessary to focus on high concentrations of Cd because a more intensive use of fertilizers or industrial sources such as plastics and batteries can lead to exceeding the threshold [84]. Using management practices adapted to local conditions, the impact of agricultural activities can be minimized [85]. In these terrestrial and aquatic ecosystems, the technique of phytoremediation can be implemented, which is applied to soils contaminated with Cd (and other metals) [77].
Results show that soil Cd concentration is above the threshold [72], while other elements are generally within acceptable limits. Calculated indices indicate that Cd is the primary pollutant with the highest degree of pollution in this protected area. According to the Law on Nature Protection [28], economic activities (including agriculture) are forbidden within the Special Nature Reserve. The same law emphasizes that economic and other activities are not allowed within the nature park. Within the boundaries of this protected area, widespread agricultural areas are increasing the concentration of toxic metal Cd in the soil. According to [86], protected areas face imminent danger from agricultural production (use of pesticides or other agricultural chemicals). Some phosphorus fertilizers can contain up to 50 mg/kg of Cd. Therefore, over the past two decades, there have been great efforts to reduce cadmium concentrations in fertilization [87,88]. The average content of Cd across Europe today in fertilizers is about 32 mg/kg, but the values often go above 200 mg/kg. If the plan suggested by the European Commission in 2016 was adopted, the concentration of Cd in fertilizers would have to be limited to 20 mg/kg. In that case, the level of Cd concentration would decrease by 21% over the next 100 years [88].
Organic agricultural production is required to meet very strict conditions regarding nature conservation. It is promoted by EU Regulation 834/2007 [89] as a management system for sustainable agriculture. Some of the requirements of this regulation include restricting the usage of mineral fertilizers, only water of a high category being accepted, and the mandatory preservation of habitats. Consequently, organic agriculture could contribute to the establishment of ecological balance [90], an improvement of biological connections [91], the creation of ideal habitats for animals [92], and a reduction in diffuse water pollution [90].
It is also very important to increase the area under natural vegetation between agricultural and water bodies [93]. Multifunctional buffer zones must be established between agricultural and protected areas. Given the hypereutrophic status of the lakes of the study area [30,46], revitalization and the formation of a buffer zone in the protection area of Lakes Palić and Ludaš would preserve the lakes from the inflow of pollutants from arable land [86].

5. Conclusions

One of the largest forest–steppe regions with particularly rich biodiversity and many endemic species left in Europe is located in the Pannonian Basin.
Considering that the study area lies in this biogeographical region, the endangerment of rare and protected species due to increased concentrations of pollutants may be both regionally and continentally significant.
The increased concentration of some of micro- and macroelements (Cd, N, P2O5, K2O) in the soil is the result of intensive agriculture that is widespread over the area.
Current conservation measures in this area have not provided adequate protection for the natural environment. Accordingly, existing measures must be more strictly controlled or new, more restrictive measures must be prescribed.
It is necessary to increase the coverage of forest vegetation using buffer strips, which could revitalize this area, and reduce soil and water pollution.
This study raises awareness of these environmental problems and could be used as a starting point for establishing the monitoring and appropriate conservation of the Palić Nature Park and the Ludaš Lake Special Nature Reserve.

Author Contributions

Conceptualization, M.C. and J.B.; methodology, M.C.; software, M.C. and A.B.; formal analysis, M.C.; investigation, M.C., F.S.; resources, F.S.; data curation, J.B., S.B.S., S.L., and P.M.; writing—original draft preparation, M.C.; writing—review and editing, J.B., S.B.S., P.M.; visualization, M.C.; supervision, J.B. and S.B.S. All authors have read and agreed to the published version of the manuscript.

Funding

This research was funded within the project “Biodiversity and Water Protection Lake Palić and Lake Ludaš” by KfW Entwicklungsbank, No. BMZ-No 2015 67 098 and 2015 70 043. The APC was funded by University of Belgrade Faculty of Forestry.

Institutional Review Board Statement

Not applicable.

Informed Consent Statement

Not applicable.

Data Availability Statement

Data presented in this study are available from the authors upon request.

Acknowledgments

This work was carried out as part of the Agreement on financing the scientific research work of Scientific Research Organizations in 2021, no. 451-03-9/2021-14/200169 05.02.2021. The authors are grateful to the project “Biodiversity and Water Protection Lake Palić and Lake Ludaš” founded by KfW Entwicklungsbank and Project Leader Fritz Schwaiger, who provided great support and initiative for the education of young people through the project.

Conflicts of Interest

The authors declare no conflict of interest.

References

  1. Okumah, M.; Chapman, P.J.; Martin-Ortega, J.; Novo, P. Mitigating agricultural diffuse pollution: Uncovering the evidence base of the awareness-behaviour-water quality pathway. Water 2018, 11, 29. [Google Scholar] [CrossRef] [Green Version]
  2. Cao, X.; Song, C.; Xiao, J.; Zhou, Y. The optimalwidth and mechanism of riparian buffers for storm water nutrient removal in the Chinese eutrophic Lake Chaohu watershed. Water 2018, 10, 1489. [Google Scholar] [CrossRef]
  3. World Wild Fund for Nature (WWF). Living Planet Report 2016: Risk and Resilience in a New Era; World Wild Fund for Nature (WWF): Grand, Switzerland, 2016; ISBN 9782940529407. [Google Scholar]
  4. Harrison, S.; McAree, C.; Mulville, W.; Sullivan, T. The problem of agricultural ‘diffuse’ pollution: Getting to the point. Sci. Total Environ. 2019, 677, 700–717. [Google Scholar] [CrossRef]
  5. Turunen, J.; Markkula, J.; Rajakallio, M.; Aroviita, J. Riparian forests mitigate harmful ecological effects of agricultural diffuse pollution in medium-sized streams. Sci. Total Environ. 2019, 649, 495–503. [Google Scholar] [CrossRef]
  6. Lange, U.; Döhler, H.; Eurich-Menden, B.; Gömann, H.; Jäger, P.; Kreins, P.; Möller, C.; Prigge, A.; Ristenpart, E.; Schultheiß, U. Evaluation of Policy Measures and Methods to Reduce Diffuse Water Pollution; Federal Environmental Agency (Umweltbundesamt) UBA: Dessau, Germany, 2006; 168p.
  7. Diffuse Pollution, Degraded Waters: Emerging policy solutions. Water Intell. Online 2017, 16, 9781780408798. [CrossRef]
  8. Mazurek, R.; Kowalska, J.; Gąsiorek, M.; Zadrożny, P.; Józefowska, A.; Zaleski, T.; Kępka, W.; Tymczuk, M.; Orłowska, K. Assessment of heavy metals contamination in surface layers of Roztocze National Park forest soils (SE Poland) by indices of pollution. Chemosphere 2017, 168, 839–850. [Google Scholar] [CrossRef] [PubMed]
  9. Bartkowiak, A.; Lemanowicz, J.; Hulisz, P. Ecological risk assessment of heavy metals in salt-affected soils in the Natura 2000 area (Ciechocinek, north-central Poland). Environ. Sci. Pollut. Res. 2017, 24, 27175–27187. [Google Scholar] [CrossRef] [PubMed] [Green Version]
  10. Barbieri, M.; Sappa, G.; Nigro, A. Soil pollution: Anthropogenic versus geogenic contributions over large areas of the Lazio region. J. Geochemical Explor. 2018, 195, 78–86. [Google Scholar] [CrossRef]
  11. Jia, Z.; Li, S.; Wang, L. Assessment of soil heavy metals for eco-environment and human health in a rapidly urbanization area of the upper Yangtze Basin. Sci. Rep. 2018, 8, 3256. [Google Scholar] [CrossRef] [Green Version]
  12. Yan, X.; Liu, M.; Zhong, J.; Guo, J.; Wu, W. How human activities affect heavy metal contamination of soil and sediment in a long-term reclaimed area of the Liaohe River Delta, North China. Sustainability 2018, 10, 338. [Google Scholar] [CrossRef] [Green Version]
  13. Zhen, Z.; Wang, S.; Luo, S.; Ren, L.; Liang, Y.; Yang, R.; Li, Y.; Zhang, Y.; Deng, S.; Zou, L.; et al. Significant Impacts of Both Total Amount and Availability of Heavy Metals on the Functions and Assembly of Soil Microbial Communities in Different Land Use Patterns. Front. Microbiol. 2019, 10, 2293. [Google Scholar] [CrossRef]
  14. Chibuike, G.U.; Obiora, S.C. Heavy metal polluted soils: Effect on plants and bioremediation methods. Appl. Environ. Soil Sci. 2014, 2014, 752708. [Google Scholar] [CrossRef] [Green Version]
  15. Dharani, N.; Onyari, J.M.; Maina, D.M.; Mavuti, K.M. The distribution of Cu and Pb levels in soils and Acacia xanthophloea Benth. from Lake Nakuru National Park Kenya. Bull. Environ. Contam. Toxicol. 2007, 79, 172–177. [Google Scholar] [CrossRef]
  16. Mikhailenko, A.V.; Ruban, D.A.; Ermolaev, V.A.; van Loon, A.J. Cadmium pollution in the tourism environment: A literature review. Geosciences 2020, 10, 242. [Google Scholar] [CrossRef]
  17. Khalid, N.; Hussain, M.; Young, H.S.; Boyce, B.; Aqeel, M.; Noman, A. Effects of road proximity on heavy metal concentrations in soils and common roadside plants in Southern California. Environ. Sci. Pollut. Res. 2018, 25, 35257–35265. [Google Scholar] [CrossRef] [PubMed]
  18. Hashmi, M.Z.; Yu, C.; Shen, H.; Duan, D.; Shen, C.; Lou, L.; Chen, Y. Risk assessment of heavy metals pollution in agricultural soils of siling reservoir watershed in Zhejiang province, China. Biomed. Res. Int. 2013, 2013. [Google Scholar] [CrossRef]
  19. Wei, B.; Yu, J.; Cao, Z.; Meng, M.; Yang, L.; Chen, Q. The availability and accumulation of heavy metals in greenhouse soils associated with intensive fertilizer application. Int. J. Environ. Res. Public Health 2020, 17, 5359. [Google Scholar] [CrossRef] [PubMed]
  20. Ayari, J.; Barbieri, M.; Agnan, Y.; Sellami, A.; Braham, A.; Dhaha, F.; Charef, A. Trace element contamination in the mine-affected stream sediments of Oued Rarai in north-western Tunisia: A river basin scale assessment. Environ. Geochem. Health 2021, 43, 4027–4042. [Google Scholar] [CrossRef]
  21. Navarro-Pedreño, J.; Almendro-Candel, M.B.; Lucas, I.G.; Vidal, M.M.J.; Borras, J.B.; Zorpas, A.A. Trace metal content and availability of essential metals in agricultural soils of Alicante (Spain). Sustainability 2018, 10, 4534. [Google Scholar] [CrossRef] [Green Version]
  22. Rudić, Ž. Factors of Water Quality Degradation in Shallow Pannonian Lakes and Their Contribution to Ecological Risk. Ph.D. Thesis, Faculty of Agriculture, University of Belgrade, Beograd, Serbia, 2 September 2015. (In Serbian). [Google Scholar]
  23. Böhm, E.; Hillenbrand, T.; Walz, R.; Borchardt, D.; Henke, S. Maßnahmenplan Nachhaltige Wasserwirtschaft. Handlungsschwerpunkte für Einen Zukunftsorientierten Umgang mit Wasser in Deutschland: Forschungsbericht zum Vorhaben 297 27 707; UBA-Text 25/99; Umweltbundesamt (UBA): Berlin, Germany, 1999.
  24. Statistical Office of the Republic of Serbia. Agriculture Census. Available online: https://www.stat.gov.rs/en-US (accessed on 30 September 2021).
  25. Public Company Palić—Ludaš. Management Plan of Nature Park “Palić” for the Period 2014–2023; Institute for Nature Conservation of Serbia: Belgrade, Serbia, 2014; 99p. (In Serbian) [Google Scholar]
  26. Raicevic, V.; Bozic, M.; Rudic, Z.; Lalevic, B.; Kikovic, D. The evolution of the eutrophication of the Palić lake (Serbia). Afr. J. Biotechnol. 2011, 10, 1736–1744. [Google Scholar] [CrossRef]
  27. Europian Commisssion. Available online: https://ec.europa.eu/environment/nature/natura2000/faq_en.htm (accessed on 30 September 2021).
  28. Official Gazette of Republic of Serbia 95/2018-267. Law on Nature Protection; Official Gazette: Belgrade, Serbia, 2018. (In Serbian) [Google Scholar]
  29. EA 2021 River Basin Management Plans, Natura 2000 Protected Areas; Environment Agency: Bristol, UK, 2019; pp. 1–27.
  30. Seleši, Đ. The Extinction and Renovation of Lake Palic; Fond za Sanaciju Jezera Palić: Subotica, Yugoslavia, 1973. (In Serbian) [Google Scholar]
  31. Biodiversity and Water Protection Lake Palic and Lake Ludas. Available online: https://www.zastitapalicludas.rs/en/project/ (accessed on 30 September 2021).
  32. Huang, K.; Luo, X.; Zheng, Z. Application of a combined approach including contamination indexes, geographic information system and multivariate statistical models in levels, distribution and sources study of metals in soils in Northern China. PLoS ONE 2018, 13, e0190906. [Google Scholar] [CrossRef] [PubMed] [Green Version]
  33. Charzyński, P.; Plak, A.; Hanaka, A. Influence of the soil sealing on the geoaccumulation index of heavy metals and various pollution factors. Environ. Sci. Pollut. Res. 2017, 24, 4801–4811. [Google Scholar] [CrossRef] [PubMed] [Green Version]
  34. Okedeyi, O.O.; Dube, S.; Awofolu, O.R.; Nindi, M.M. Assessing the enrichment of heavy metals in surface soil and plant (Digitaria eriantha) around coal-fired power plants in South Africa. Environ. Sci. Pollut. Res. 2014, 21, 4686–4696. [Google Scholar] [CrossRef] [PubMed]
  35. Miljković, P. The Influence of Land Cover on the Quality of Suspended Sediment in the Rasina River Watershed. Ph.D. Thesis, Faculty of Forestry, University of Belgrade, Beograd, Serbia, 30 October 2020. (In Serbian). [Google Scholar]
  36. El-Amier, Y.A.; Bonanomi, G.; Al-Rowaily, S.L.; Abd-Elgawad, A.M. Ecological risk assessment of heavy metals along three main drains in nile delta and potential phytoremediation by macrophyte plants. Plants 2020, 9, 910. [Google Scholar] [CrossRef]
  37. Adimalla, N.; Wang, H. Distribution, contamination, and health risk assessment of heavy metals in surface soils from northern Telangana, India. Arab. J. Geosci. 2018, 11, 684. [Google Scholar] [CrossRef]
  38. Marković, M.; Zuliani, T.; Simić, S.B.; Mataruga, Z.; Kostić, O.; Jarić, S.; Vidmar, J.; Milačič, R.; Ščančar, J.; Mitrović, M.; et al. Potentially toxic elements in the riparian soils of the Sava River. J. Soils Sediments 2018, 18, 3404–3414. [Google Scholar] [CrossRef] [Green Version]
  39. Santos-Francés, F.; Martínez-Graña, A.; Rojo, P.A.; Sánchez, A.G. Geochemical background and baseline values determination and spatial distribution of heavy metal pollution in soils of the andes mountain range (Cajamarca-Huancavelica, Peru). Int. J. Environ. Res. Public Health 2017, 14, 859. [Google Scholar] [CrossRef] [Green Version]
  40. Kowalska, J.B.; Mazurek, R.; Gąsiorek, M.; Zaleski, T. Pollution indices as useful tools for the comprehensive evaluation of the degree of soil contamination–A review. Environ. Geochem. Health 2018, 40, 2395–2420. [Google Scholar] [CrossRef] [Green Version]
  41. WRB-IUSS. World Reference Base for Soil Resources 2014. World Soil Resources Reports 106; Food and Agriculture Organization of the United Nations: Rome, Italy, 2014; ISBN 9789251083697. [Google Scholar]
  42. Janković, M. Study on Geotechnical Conditions of Construction Bicycle Trails around Palić Lake; Vuma Studio: Kraljevo, Serbia, 2019. (phase: Part of Project documentation; project “Biodiversity and Water Protection Lake Palić and Lake Ludaš”) (In Serbian) [Google Scholar]
  43. Institute for Nature Conservation of Serbia. Special Nature Reserve “Ludaš Lake” Expert—Documentary Basis for Revision; Institute for Nature Conservation of Serbia: Belgrade, Serbia, 2004; 127p. (In Serbian) [Google Scholar]
  44. Institute for Nature Conservation of Vojvodina Province. Nature Park “Palić”, Proposal for Protection as a Protected Area of III Category—Protection Study; Institute for Nature Conservation of Vojvodina Province: Novi Sad, Serbia, 2011. (In Serbian) [Google Scholar]
  45. Štadler, A. Histroy of Palić 1462-1958; Public Company “Palić—Ludaš”: Subotica, Serbia, 1998; 151p, ISBN 86-83201-01-5. (In Serbian) [Google Scholar]
  46. Gržetić, I.; Čamprag, N. The evolution of the trophic state of the Palić Lake (Serbia). J. Serbian Chem. Soc. 2010, 75, 717–732. [Google Scholar] [CrossRef]
  47. Horvat, M.; Horvat, Z. Implementation of a monitoring approach: The Palic-Ludas lake system in the Republic of Serbia. Environ. Monit. Assess. 2020, 192, 150. [Google Scholar] [CrossRef]
  48. Final Report of Assessment of the Cause of the Fish Kill in Lake Palic and Lake Ludas. Available online: https://www.zastitapalicludas.rs/wp-content/uploads/2021/05/Fish-kill-report-short-ENG.pdf (accessed on 1 October 2021).
  49. Topalović, S. The existing quality of environment and the possibilities of the development of viable tourism in the specific natural reservation of the lake Ludaš. Bull. Serb. Geogr. Soc. 2010, 90, 189–207. [Google Scholar] [CrossRef]
  50. Institute of Public Health Subotica Center for Hygiene and Human Ecology. Annual Report of Water Quality Monitoring of Lakes Palic, Ludas and Palić-Ludaš Canal in 2019. Available online: http://www.subotica.rs/documents/pages/8242_1.pdf (accessed on 1 October 2021). (In Serbian).
  51. Yugoslav Society for Soil Research. Study Methods for Soil Physical Properties; Yugoslav Society for Soil Research: Novi Sad, Serbia, 1997. (In Serbian) [Google Scholar]
  52. ISO 10390:2007. Soil Quality—Determination of pH; International Organization for Standardization: Geneva, Switzerland, 2007. [Google Scholar]
  53. ISO 11265:1994. Soil Quality—Determination of the Specific Electrical Condutivity; International Organization for Standardization: Geneva, Switzerland, 1994. [Google Scholar]
  54. ISO 10694:2005. Soil Quality—Determination of Organic and Total Carbon after Dry Combustion (Elementary Analysis); International Organization for Standardization: Geneva, Switzerland, 2005. [Google Scholar]
  55. ISO 10693:2005. Soil Quality—Determination of Carbonate Content—Volumetric Method); International Organization for Standardization: Geneva, Switzerland, 2005. [Google Scholar]
  56. ISO 11263:2016. Soil quality—Determination of Phosphorus—Spectrometric Determination of Phosphorus Soluble in Sodium Hydrogen Carbonate Solution); International Organization for Standardization: Geneva, Switzerland, 2016. [Google Scholar]
  57. ISO 11261:2005. Soil Quality—Determination of Total Nitrogen—Modified Kjeldahl Method); International Organization for Standardization: Geneva, Switzerland, 2005. [Google Scholar]
  58. Knežević, M.; Košanin, O. Workbook of Pedology; Faculty of Forestry, University of Belgrade: Belgrade, Serbia, 2007; ISBN 978-86-7299-143-7. (In Serbian) [Google Scholar]
  59. Yugoslav Society for Soil Science. Chemical Methods of Soil Surveying, Book 1; Yugoslav Society for Soil Research: Belgrade, Serbia, 1966. (In Serbian) [Google Scholar]
  60. ISO 11466:1955. Soil Quality—Extraction of Trace Elements Soluble in Aqua Regia); International Organization for Standardization: Geneva, Switzerland, 1995. [Google Scholar]
  61. ISO 11047:2004. Soil Quality—Determination of Cadmium, Chromium, Cobalt, Copper, Lead, Manganese, Nickel and Zinc—Flame and Electrothermal Atomic Absorption Spectrometric Methods); International Organization for Standardization: Geneva, Switzerland, 2004. [Google Scholar]
  62. Ninkov, J.; Marković, S.; Banjac, D.; Vasin, J.; Milić, S.; Banjac, B.; Mihailović, A. Mercury content in agricultural soils (Vojvodina Province, Serbia). Environ. Sci. Pollut. Res. 2017, 24, 10966–10975. [Google Scholar] [CrossRef]
  63. Weissmannová, H.D.; Mihočová, S.; Chovanec, P.; Pavlovský, J. Potential ecological risk and human health risk assessment of heavy metal pollution in industrial affected soils by coal mining and metallurgy in Ostrava, Czech Republic. Int. J. Environ. Res. Public Health 2019, 16, 4495. [Google Scholar] [CrossRef] [PubMed] [Green Version]
  64. Barbieri, M. The Importance of Enrichment Factor (EF) and Geoaccumulation Index (Igeo) to Evaluate the Soil Contamination. J. Geol. Geophys. 2016, 5, 237. [Google Scholar] [CrossRef]
  65. Bu, J.; Sun, Z.; Zhou, A.; Xu, Y.; Ma, R.; Wei, W.; Liu, M. Heavy metals in surface soils in the upper reaches of the Heihe River, northeastern Tibetan Plateau, China. Int. J. Environ. Res. Public Health 2016, 13, 247. [Google Scholar] [CrossRef] [PubMed] [Green Version]
  66. Müller, G. Index of geoaccumulation in sediments of the Rhine River. GeoJournal 1969, 2, 108–118. [Google Scholar]
  67. Håkanson, L. An ecological risk index for aquatic pollution controla sedimentological approach. Water Res. 1980, 14, 975–1001. [Google Scholar] [CrossRef]
  68. Nemerow, N.L. Stream, Lake, Estuary, and Ocean Pollution; Van Nostrand Reinhold Publishing Co.: New York, NY, USA, 1985; ISBN 978-0442267209. [Google Scholar]
  69. Sutherland, R.A.; Tolosa, C.A.; Tack, F.M.G.; Verloo, M.G. Characterization of Selected Element Concentrations and Enrichment Ratiosin Background and Anthropogenically Impacted Roadside Areas. Arch. Environ. Contam. Toxicol. 2000, 38, 428–438. [Google Scholar] [CrossRef]
  70. Zhang, J.; Liu, C.L. Riverine composition and estuarine geochemistry of particulate metals in China—Weathering features, anthropogenic impact and chemical fluxes. Estuar. Coast. Shelf Sci. 2002, 54, 1051–1070. [Google Scholar] [CrossRef]
  71. Luo, W.; Lu, Y.; Giesy, J.P.; Wang, T.; Shi, Y.; Wang, G.; Xing, Y. Effects of land use on concentrations of metals in surface soils and ecological risk around Guanting Reservoir, China. Environ. Geochem. Health 2007, 29, 459–471. [Google Scholar] [CrossRef]
  72. Official Gazette of Republic of Serbia 64/2019. Regulation on Limit Values of Polluting, Harmful and Dangerous Substances in the Soil; Official Gazette: Belgrade, Serbia, 2019. (In Serbian) [Google Scholar]
  73. Lech, M.; Fronczyk, J.; Radziemska, M.; Sieczka, A.; Garbulewski, K.; Koda, E.; Lechowicz, Z. Monitoring of total dissolved solids on agricultural lands using electrical conductivity measurements. Appl. Ecol. Environ. Res. 2016, 14, 285–295. [Google Scholar] [CrossRef]
  74. Manojlović, M. Yield and Soil Load in the Border Area; Faculty of Agriculture, University of Novi Sad: Novi Sad, Serbia, 2014; ISBN 978-86-7520-290-5. (In Serbian) [Google Scholar]
  75. Beloica, J. Air Pollution and Forest Ecosystem; Faculty of Forestry, University of Belgrade: Belgrade, Serbia, 2020; ISBN 978-86-7299-314-1. (In Serbian) [Google Scholar]
  76. Nunes, J.R.; Ramos-Miras, J.; Lopez-Piñeiro, A.; Loures, L.; Gil, C.; Coelho, J.; Loures, A. Concentrations of available heavy metals in Mediterranean agricultural soils and their relation with some soil selected properties: A case study in typical Mediterranean soils. Sustainability 2014, 6, 9124–9138. [Google Scholar] [CrossRef] [Green Version]
  77. Kabata-Pendias, A. Trace Elements in Soils and Plants, 4th ed.; CRC Press: Boca Raton, FL, USA, 2010; ISBN 9781420093704. [Google Scholar]
  78. Kastori, R. Heavy Metals and Pesticides in Soil, Heavy Metals and Pesticide in the Soil of the Vojvodina Province; Faculty of Agriculture, University of Novi Sad: Novi Sad, Serbia, 1993; ISBN 86-80417-01-7. (In Serbian) [Google Scholar]
  79. Alloway, B.J. Heavy Metals in Soils Trace—Metals and Metalloids in Soils and their Bioavailability, 3rd ed.; Springer: Berlin/Heidelberg, Germany, 2013; ISBN 978-94-007-4469-1. [Google Scholar]
  80. Singh, B. Are Nitrogen Fertilizers Deleterious to Soil Health? Agronomy 2018, 8, 48. [Google Scholar] [CrossRef] [Green Version]
  81. Zhang, Y.; Zhang, H.; Zhang, Z.; Liu, C.; Sun, C.; Zhang, W.; Marhaba, T. PH Effect on Heavy Metal Release from a Polluted Sediment. J. Chem. 2018, 2018, 7597640. [Google Scholar] [CrossRef]
  82. Roberts, T.L. Cadmium and Phosphorous Fertilizers: The Issues and the Science. Procedia Eng. 2014, 83, 52–59. [Google Scholar] [CrossRef] [Green Version]
  83. Haider, F.U.; Liqun, C.; Coulter, J.A.; Cheema, S.A.; Wu, J.; Zhang, R.; Wenjun, M.; Farooq, M. Cadmium toxicity in plants: Impacts and remediation strategies. Ecotoxicol. Environ. Saf. 2021, 211, 111887. [Google Scholar] [CrossRef]
  84. Huang, L.; Rad, S.; Xu, L.; Gui, L.; Song, X.; Li, Y.; Wu, Z.; Chen, Z. Heavy metals distribution, sources, and ecological risk assessment in Huixian Wetland, South China. Water 2020, 12, 431. [Google Scholar] [CrossRef] [Green Version]
  85. U.S. Enviromental Protection Agency. Protecting Water Quality from Agricultural Runoff; U.S. Enviromental Protection Agency: Washington, DC, USA, 2005; 2p.
  86. Lausche, B. Guidelines for Protected Areas Legislation; International Union for Conservation of Nature and Natural Resources IUCN: Gland, Switzerland, 2011; ISBN 9782831712451. [Google Scholar]
  87. He, Z.L.; Yang, X.E.; Stoffella, P.J. Trace elements in agroecosystems and impacts on the environment. J. Trace Elem. Med. Biol. 2005, 19, 125–140. [Google Scholar] [CrossRef] [PubMed]
  88. Gilbert, N. European Union debates controversal plans to limit cadmium in fertilizer, American Association for the Advancement of Science (AAAS). Science 2018, 10. [Google Scholar] [CrossRef]
  89. EU Council Directive 834/2007 on organic production and labelling of organic products. Off. J. Eur. Union 2007, 2007, 1–23.
  90. Food and Agriculture Organization of the United Nations. Available online: http://www.fao.org/organicag/oa-faq/oa-faq6/en/ (accessed on 1 October 2021).
  91. Grandi, C.; Triantafyllidis, A. Organic Agriculture in Protected Areas. The Italian Experience; Food and Agriculture Organization of the United Nations: Rome, Italy, 2010; 29p. [Google Scholar]
  92. Pfiffnee, L.; Balmer, O. Organic Agriculture and Biodiversity; Fact Sheet; Research Institute of Organic Agriculture (FiBL): Frankfurt am Main, Germany, 2011; ISBN 978-3-03736-195-5. [Google Scholar]
  93. Lawniczak, A.E.; Zbierska, J.; Nowak, B.; Achtenberg, K.; Grześkowiak, A.; Kanas, K. Impact of agriculture and land use on nitrate contamination in groundwater and running waters in central-west Poland. Environ. Monit. Assess. 2016, 188, 172. [Google Scholar] [CrossRef] [PubMed] [Green Version]
Figure 1. Study area.
Forests 12 01461 g001
Figure 2. Nitrogen content (%).
Forests 12 01461 g002
Figure 3. Content of potassium and phosphorous (mg/100 g).
Forests 12 01461 g003
Figure 4. Cadmium concentration (dashed red line is threshold according to [72]; L—Ludaš, P—Palić).
Forests 12 01461 g004
Figure 5. Values of geoaccumulation index (Igeo) (L-Ludaš, P-Palić).
Forests 12 01461 g005
Figure 6. Cd concentration (Igeo, Eri, PI, EF).
Forests 12 01461 g006
Figure 7. Pollution index (PI) values (dashed line is threshold according to [67]; L—Ludaš, P—Palić).
Forests 12 01461 g007
Figure 8. Enrichment factor (EF) values (dashed line is threshold according to [69,70]; L—Ludaš, P—Palić).
Forests 12 01461 g008
Figure 9. Nemerow pollution index and potential ecological risk values.
Forests 12 01461 g009
Table 1. Characteristics of the study area.
PalićLudaš
Area of water body579.77 ha328.5 ha
Length of shoreline28.08 km19.2 km
Buffer area (existing)15.1 ha5.7 ha
Buffer area (planned)13.6 ha17.3 ha
Soil type [41]Calcic Chernozem; Arenic ChernozemSolonchak; Histosol
GeomorphologyLoess; sand
ClimateTemperate climate
Precipitation568.3 mm
Table 2. NPK limit values.
Primary MacronutrientsLimit ValuesReference
N (%)>0.3: high rich content
0.2–0.3: very rich content
0.1–0.2: rich content
0.06–0.1: moderately rich content
0.03–0.06: poor content
0.02–0.03: very poor content
<0.02: limited ability to grow plants
[58,59]
P2O5 (mg/100 g)<10.0: very low content
10.0–15.0: low content
15.0–20.0: middle content
>25.0: high content
K2O (mg/100 g)>8.0: low content
8.0–12.0: middle content
>12.0: high content
Table 3. Indices of pollution used in this study.
IndexFormulaExplanationsLimit ValuesReference
Enrichment factor E F = [ C n r e f ] s a m p l e [ C n r e f ] b a c k g r o u n d [ C n r e f ] s a m p l e —concentration ratio of the examined metal and the reference element in soil samples
[ C n r e f ] b a c k g r o u n d —natural background value of the examined metal to the reference element ratio
0.5 ≤ EF ≤ 1.5: taken as an indication that trace metal is entirely provided from crustal contribution
EF > 1.5: an important proportion of trace metals is delivered from noncrustal materials
[69,70]
Index of geoaccumulation I g e o = log 2 C n 1.5 B n Cn—current heavy-metal content in topsoil;
Bn—heavy-metal content in the NHs, bedrock, or geochemical background;
1.5—constant, allowing for analysis of fluctuations of heavy-metal content
≤0: unpolluted
0–1: unpolluted to moderately polluted
1–2: moderately polluted
2–3: moderately to highly polluted
3–4: highly polluted
4–5: highly to extremely highly polluted
≥5: extremely highly polluted
[66]
Pollution index P I = C n G B Cn—heavy-metal content in soil
GB—values of geochemical background
<1: absent
1–2: low
2–3: moderate
3–5: strong
>5: very strong
[67]
Nemerow
pollution index
P I N = ( 1 n i - 1 n P I ) 2 + P I max 2 2 PI—single pollution index of particular heavy metal
P I max —maximal value of single pollution index of all heavy metals
n—number of studied heavy metals
≤0.7: clean
0.7–1: warning limit
1–2: slight pollution
2–3: moderate pollution
≥3: heavy pollution
[68]
Potential ecological risk index R I = i = 1 n E r i
E r i = T r i P I
E r i —single index of ecological risk factor
n—number of studied heavy metals
T r i — toxicity response coefficient of heavy metals
PI—single pollution index of heavy metal
E r i ≤ 40: low risk
40 ≤ E r i < 80: moderate risk
80 ≤ E r i < 160: considerable risk
160 ≤ E r i < 320: great risk
E r i ≥320: very great risk
RI < 65: low risk
65 < RI < 130: moderate risk
130 < RI < 260: considerable risk
RI > 260: very high risk
[67,71]
Table 4. Chemical characteristics of soil.
Chemical Characteristics of SoilDepthLudašPalić
pH (H2O)0–308.71 ± 0.338.41 ± 0.48
30–609.01 ± 0.368.68 ± 0.62
Humus (%)0–303.51 ± 1.133.94 ± 1.18
30–602.62 ± 0.493.08 ± 1.22
N (%)0–300.12 ± 0.060.11 ± 0.07
30–600.09 ± 0.070.08 ± 0.05
P2O5 mg/100 g0–3062.09 ± 57.2437.93 ± 27.56
30–6065.04 ± 68.3924.89 ± 19.91
K2O mg/100 g0–3049.97 ± 25.0137.49 ± 24.02
30–6039.55 ± 24.2924.83 ± 20.31
EC (µS/cm)0–30181.12 ± 66.48253.19 ± 430.35
30–60260.00 ± 142.92278.17 ± 347.76
Salt concentration (mg/L)0–3091.05 ± 32.87126.60 ± 215.17
30–60130.35 ± 71.19139.28 ± 173.91
Table 5. Heavy-metal concentrations (mg/kg in dry weight) in samples taken in the study area (L—Ludaš, P—Palić; correlation significant at the 0.05 (*) and 0.01 (**) levels).
ZnCuPbCrNiMnCdHg
LPLPLPLPLPLPLPLP
0–30Mean36.1340.869.6711.157.638.6310.1013.1714.2617.13314.52435.770.591.000.020.03
SD11.3412.953.584.614.323.713.082.386.432.4692.7283.200.310.440.020.02
t-test0.130.150.340.00 **0.03 *0.00 **0.00 **0.01 *
30–60Mean31.9340.888.689.975.937.988.4212.1111.5917.45277.62384.440.620.890.020.02
SD10.1511.833.283.152.434.381.932.863.053.4379.7481.550.310.420.010.02
t-test0.04 *0.280.140.00 **0.00 **0.00 **0.060.98
Table 6. Correlation matrix of heavy metals in soils and some soil properties in Palić (0–30) (correlation significant at the 0.05 (*) and 0.01 (**) levels).
ZnCuPbCrNiMnCdHgpHHumusNP2O5K2OCaCO3ECClay
Zn1
Cu0.63 **1
Pb0.45 *0.53 *1
Cr0.58 **0.50 *0.48 *1
Ni0.52 *0.370.56 **0.85 **1
Mn0.420.400.48 *0.89 **0.83 **1
Cd−0.23−0.04−0.18−0.45 *−0.36−0.47 *1
Hg0.400.78 **0.110.360.140.250.171
pH−0.26−0.47 *−0.37−0.37−0.51 *−0.43 *−0.26−0.341
Humus0.57 **0.66 **0.70 **0.66 **0.72 **0.57 **0.050.46 *−0.64 **1
N0.240.60 *0.380.190.100.200.290.71 **−0.53 *0.56 **1
P2O50.220.360.060.51 *0.230.33−0.010.34−0.130.350.041
K2O0.49 *0.330.43 *0.56 **0.56 **0.42−0.220.21−0.140.58 **−0.030.371
CaCO30.00−0.32−0.19−0.36−0.05−0.48 *0.18−0.290.24−0.09−0.37−0.45 *0.171
EC−0.15−0.26−0.22−0.23−0.47 *−0.32−0.35−0.160.94 **−0.51 *−0.37−0.07−0.080.071
Clay0.390.080.260.68 **0.79 **0.62 **−0.270.06−0.290.54 *0.010.090.45 *0.17−0.301
Table 7. Correlation matrix of heavy metals in soils and some soil properties in Ludaš (0–30) (correlation significant at the 0.05 (*) and 0.01 (**) levels).
ZnCuPbCrNiMnCdHgpHHumusNP2O5K2OCaCO3ECClay
Zn1
Cu0.69 **1
Pb0.62 *0.85 **1
Cr0.79 **0.65 *0.411
Ni0.310.69 **0.490.71 **1
Mn0.450.65 *0.490.390.311
Cd0.35−0.070.220.27−0.06−0.061
Hg0.27−0.37−0.500.26−0.34−0.370.271
pH−0.140.130.26−0.190.140.18−0.15−0.551
Humus0.72 **0.66 *0.500.74 **0.58 *0.190.070.190.071
N−0.26−0.39−0.460.120.16−0.72 **0.130.39−0.150.041
P2O50.400.56 *0.64 *0.120.070.260.01−0.25−0.280.03−0.421
K2O0.390.72 **0.520.550.67 *0.40−0.26−0.21−0.060.40−0.200.56 *1
CaCO3−0.070.310.44−0.060.370.08−0.05−0.460.450.36−0.12−0.120.031
EC0.230.64 *0.60 *0.340.69 **0.43−0.18−0.530.73 **0.51−0.22−0.030.510.62 *1
Clay0.210.370.390.030.080.78 **0.03−0.450.56 *0.08−0.69 **−0.090.010.330.521
Publisher’s Note: MDPI stays neutral with regard to jurisdictional claims in published maps and institutional affiliations.

