Article

The Dry and the Wet Case: Tree Growth Response in Climatologically Contrasting Years on the Island of Corsica

1
Institute of Geography, Friedrich-Alexander University Erlangen-Nuremberg, Wetterkreuz 15, 91058 Erlangen, Germany
2
Laboratory of Climatology and Remote Sensing, Philipps-University of Marburg, Deutschhausstraße 12, 35037 Marburg, Germany
3
Laboratoire d’Hydrogéologie, Campus Grimaldi, Université de Corse Pascal Paoli, BP 52, 20250 Corte, France
4
Centre National de la Recherche Scientifique, UMR 6134, SPE, 20250 Corte, France
5
Institute for Environmental Sciences, Brandenburg University of Technology (BTU) Cottbus-Senftenberg, Burger Chaussee 2, 03044 Cottbus, Germany
*
Author to whom correspondence should be addressed.
Forests 2021, 12(9), 1175; https://doi.org/10.3390/f12091175
Submission received: 20 July 2021 / Revised: 20 August 2021 / Accepted: 27 August 2021 / Published: 30 August 2021

Abstract

:
Stem radial variations of Corsican Black pine (Pinus nigra Arnold subsp. laricio Maire) and Maritime pine (Pinus pinaster Aiton) were monitored to quantify the impact of two meteorologically contrasting consecutive years. On the French island of Corsica, in the western Mediterranean basin, the year 2017 was extremely dry, while 2018 was exceptionally wet. We attached electric band dendrometers to 36 pines along an east–west transect, spanning the central mountain range, and set up automated weather stations at all five sites, ranging from 10 m asl to 1600 m asl. Stem radial variations (SRV) were separated into irreversible growth (GRO) and tree water deficit (TWD) periods. During the drought of 2017, the most severe tree water deficits occurred in the western part of the island, whereas trees at higher elevations were more affected than at lower elevations. A prolonged decrease of SRV, even close to the tree line, suggests bimodal growth and reveals high plasticity of growth patterns in both Corsican pines. Stem radial variations correlated significantly with precipitation and temperature. The positive correlations of GRO with precipitation and the negative correlations of TWD with temperature imply that high evapotranspiration led to the intense period of TWD in 2017. A novel approach was used to further investigate the growth/climate relationship by including synoptic-scale pressure situations. This revealed that an elevation gradient in GRO per weather pattern was only present in the wet year and that even rarely occurring weather patterns can have a substantial impact on tree growth. This novel approach provides a more comprehensive insight into meteorological drivers of tree growth patterns by incorporating different scales of the climatic system.

1. Introduction

Changing environmental conditions towards a climate with increasing temperatures as well as a higher intensity and frequency of summer droughts are expected for large regions worldwide [1]. This will have a particularly strong impact on vegetation in regions where ecosystems already show increasing signs of climatic stress [2]. The Mediterranean region is one of these high-risk areas due to a predicted dramatic decrease in water availability [3]. Assuming any Representative Concentration Pathway (RCP) scenario but the lowest (RCP2.6), the annual precipitation amount will likely decline, associated with modifications in the moisture availability by the end of this century [3]. Additionally, the number of extreme events, such as heatwaves and droughts, as well as longer sequences of consecutive dry years, are expected to occur more frequently in the coming decades [4,5,6].
The projected climate change will affect tree growth and consequently influence future forest productivity and species distribution through increasing mortality of drought-sensitive species [7]. Ciais et al. [8] reported a Europewide reduction of ecosystem primary productivity caused by precipitation deficits and extreme summer heat.
Similarly affected by anthropogenic climate change are montane ecosystems. In dry inner-alpine valleys of the Swiss Alps, Bigler et al. [9] observed that occasional severe droughts caused a midterm decline in productivity and subsequent forest dieback. Especially in summer-dry climates, the amount of summer rainfall is an essential factor determining the annual tree-ring width. This has been shown for Cedrus libani from the timberline of the Taurus Mountain range [10,11], for three co-occurring conifers in the Austrian Alps [12], as well as for two co-occurring pine species on Corsica [13]. Furthermore, it has been shown that increased drought stress on Pinus uncinata at high elevations in the Pyrenees led to a change from temperature to water availability, as the growth-limiting factor [14].
To improve our understanding of how tree growth responds to climate change, knowledge on the intra-annual dynamics of radial tree growth is of particular importance [15,16]. By observing stem radial changes at a high temporal resolution, it is possible to determine crucial phenological stages of radial growth. The seasonal influence of meteorological factors on growth, and species-specific responses to climate change can be inferred [17,18,19,20,21].
Trees developed several strategies to cope with changing climate conditions. As cambial onset in conifers in most biomes is mainly triggered by temperature, higher temperatures can lead to an earlier start of the growing season [22]. On the contrary, an earlier growth cessation can be triggered by a lack of water availability during summer in dry regions, as Vieira et al. [23] showed for Pinus pinaster in Portugal’s Mediterranean lowlands. A bimodal stem radial growth pattern, with two growth peaks in spring and autumn along with a decreased growth rate in summer, was identified by Liu et al. [24] in Pinus taiwanensis and Zhang et al. [25] in Pinus massoniana as a strategy for coping with harsh environmental conditions during summer droughts in China. Gruber et al. [26] reported an earlier culmination of the maximum growth rate in Pinus sylvestris as an adaptation to recurring drought periods in spring.
Electric point or band dendrometers are valuable tools for monitoring continuous stem radial variations (SRV) and quantifying radial tree growth in high resolution [15,27,28,29]. Dendrometer measurements allow the investigation of the influence of site conditions and meteorological factors on growth, as well as species-specific responses to changing climate conditions [30,31,32]. However, not all SRV are caused by radial growth, i.e., cambial division and cell expansion. Water-related swelling and shrinkage of the phloem and xylem also influence dendrometer readings. Such variations arise from imbalances between transpiration and water uptake and by processes altering osmotic water potentials [33,34]. These superimposed processes can make data interpretation challenging if it is not possible to accurately differentiate “growth” from “stem water increase” [35].
Several studies investigating intra-annual growth of tree rings exist for the Mediterranean region, using either dendrometers [36], wood formation monitoring [37,38,39], or a combination of both methods [40]. These investigations underline the importance of further analyses, as they demonstrate that tree growth is site- and species-specific and that climatic conditions are of particular importance for growth dynamics. In addition, the hydroclimate in dry areas generally shows high inter-annual variability [38].
Within the Mediterranean region, the French island of Corsica is a well-suited location for studying tree responses to climatically outstanding years under various ecological conditions. Due to its complex topography, the rainfall distribution is highly variable on a local scale [41]. The years 2017 and 2018 were characterized by very different annual rainfall amounts on Corsica. With a mean precipitation sum across the whole island of 723 mm, the year 2017 was remarkably dry. That was the minimum annual precipitation recorded on Corsica since the beginning of climate measurements in 1950. In contrast, 2018 was an exceptionally wet year (1194 mm), compared to the long-term mean of 1981–2010 (901 mm). In that year, the summer precipitation turned out to be more than twofold the long-term average [42].
The use of dendrometers enables an investigation and quantification of tree responses to these contrasts in water availability with high temporal resolution. In addition to the analysis of dendroecological data, we investigated the atmospheric conditions that had led to the two climatologically different years. Furthermore, the dry year can serve as a model year of how trees may cope with predicted climatic changes, as such a year could no longer represent an extreme, but rather the norm in the future.
In this study, we investigate the growth of the two co-occurring species, Corsican Black pine (Pinus nigra Arnold subsp. laricio Maire) and Maritime pine (Pinus pinaster Aiton) in 2017 and 2018. We aim (I) to quantify the impact of the 2017 drought in relation to elevation and aspect and conduct a comparison to the “wet” year 2018, and also determine which elevations and aspects are most affected by within-growing-season drought periods; and (II) to identify the meteorological causalities for differing tree growth rates during the investigated period.

2. Materials and Methods

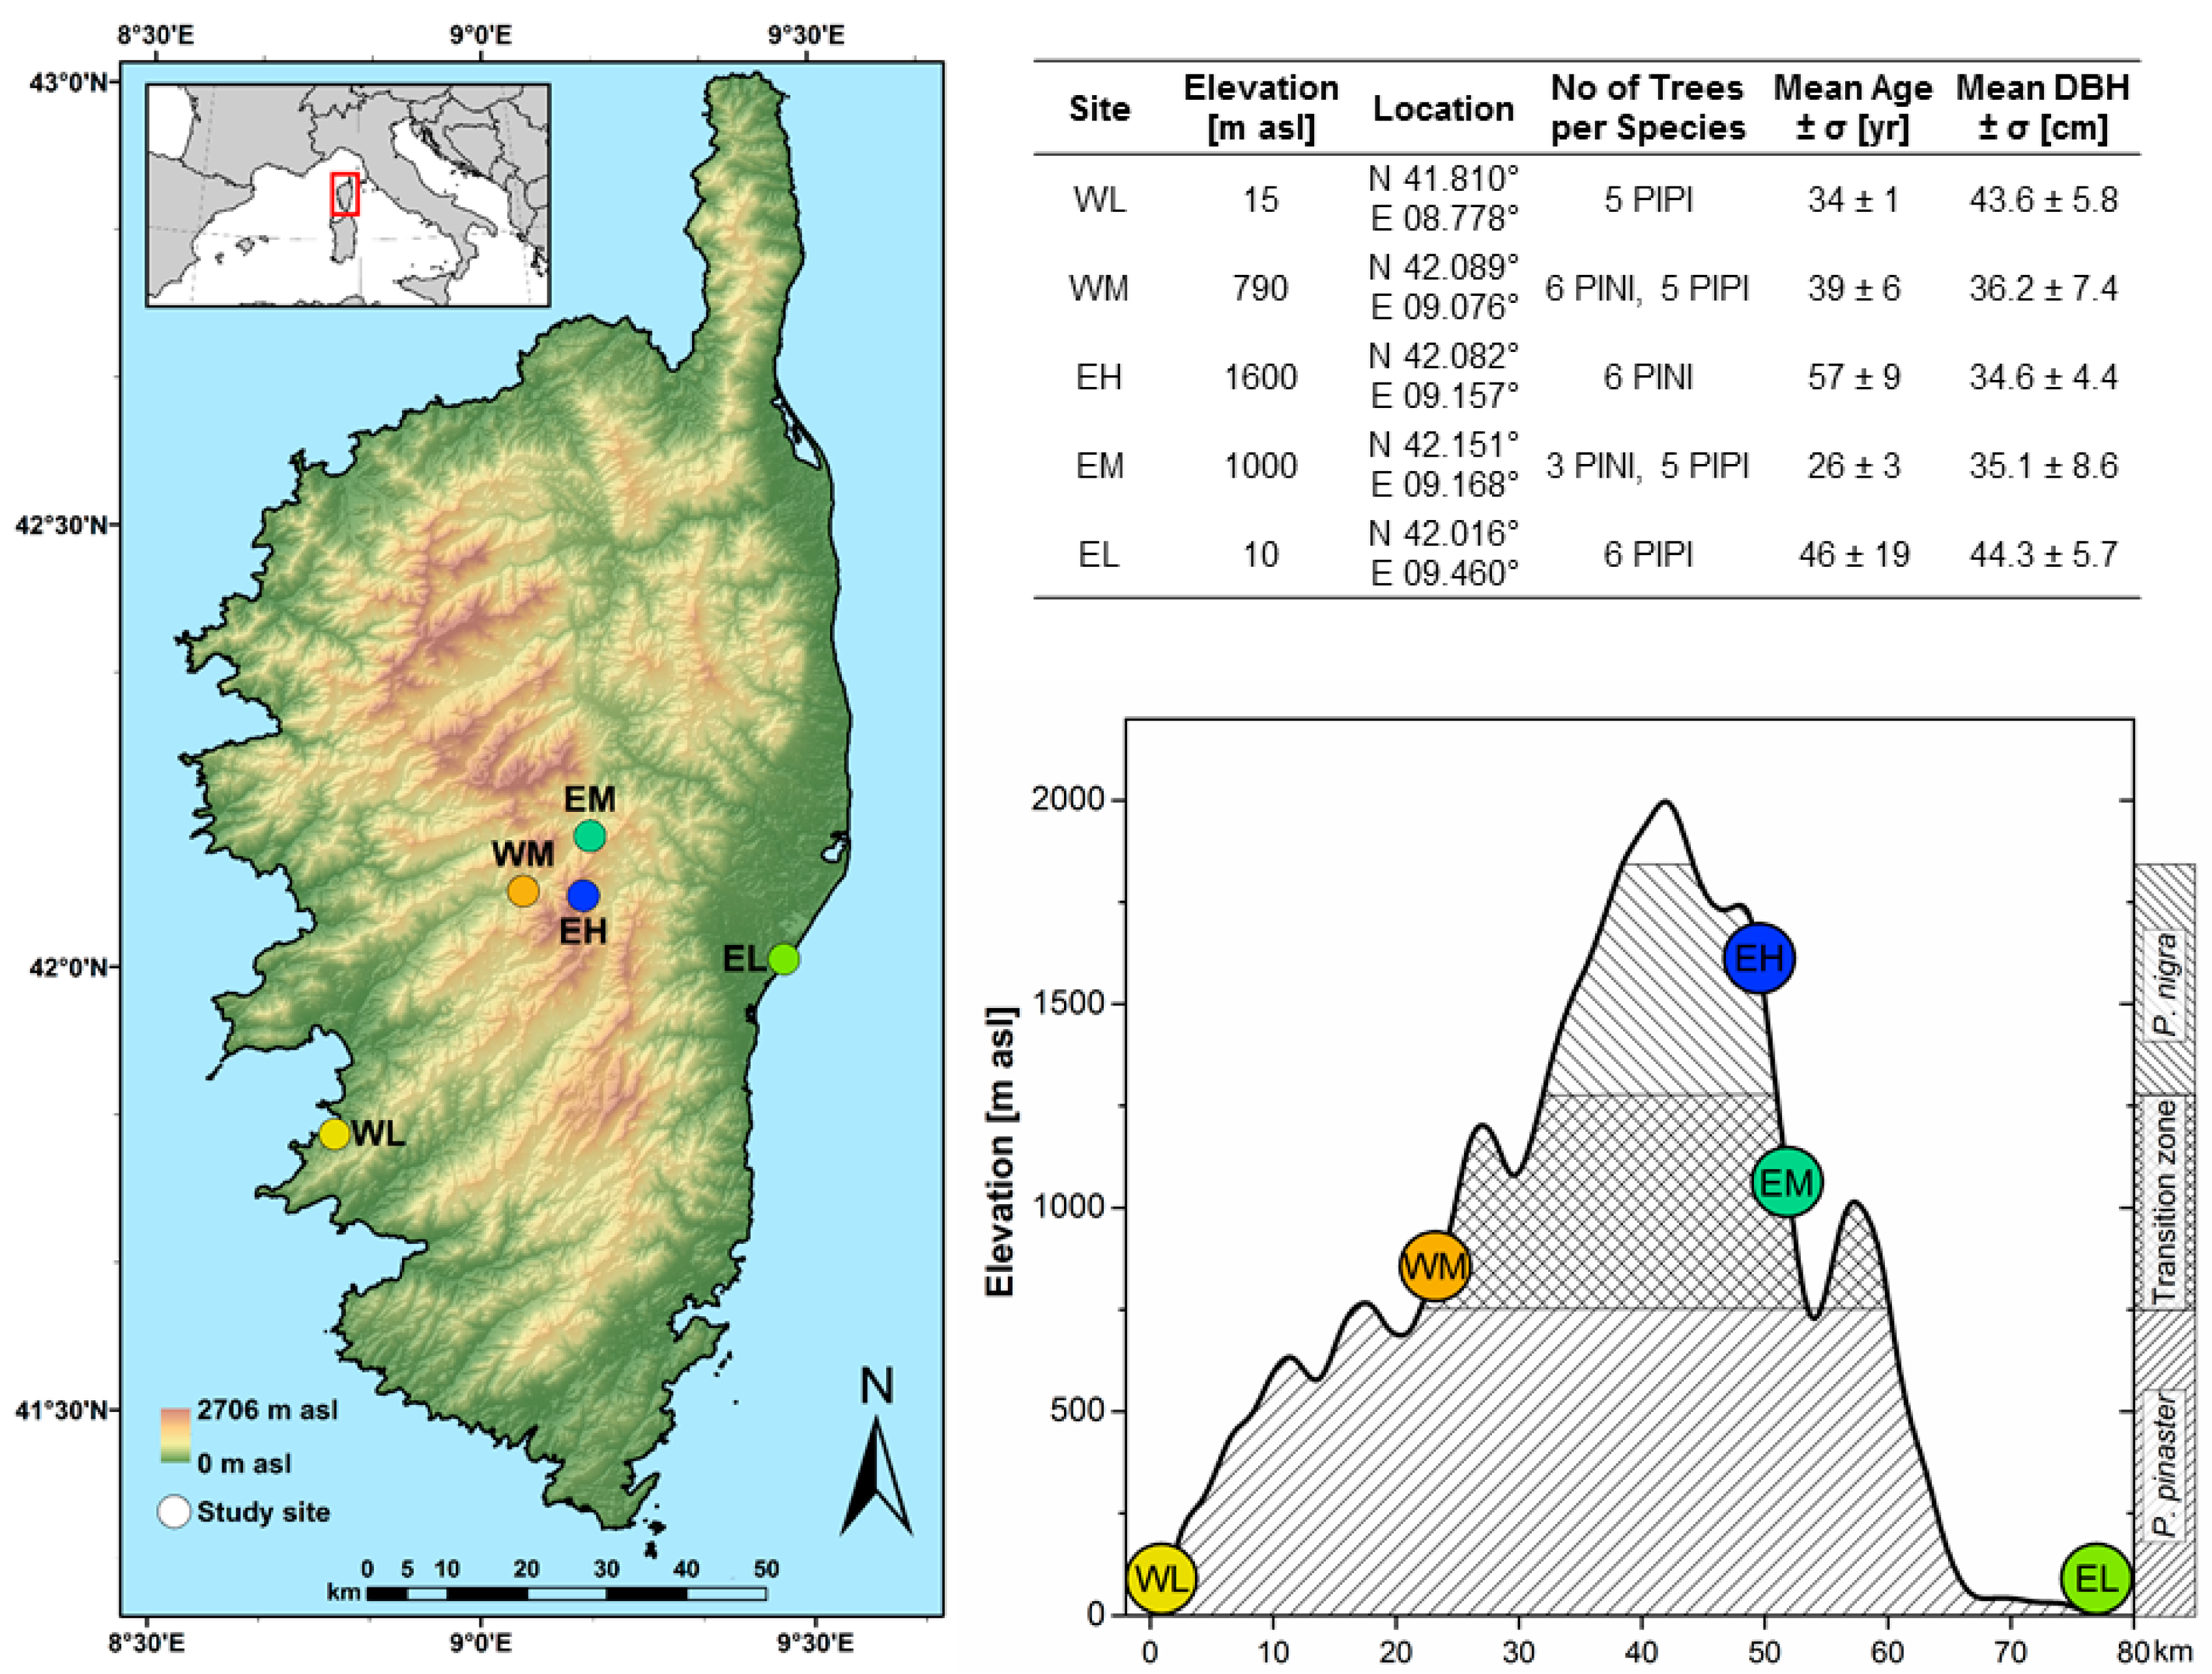
2.1. Study Area and Species

Corsica (France) is the fourth largest and second highest island in the Mediterranean Sea. A central mountain range crosses the island from northwest to southeast. Due to the prominent topography, multiple climatic zones are distributed across the island. The spectrum spans from alpine conditions in the mountains, to a typical Mediterranean climate with dry, hot summers and temperate wet winters close to sea level. This is accompanied by a distinct difference in the distribution of precipitation. The annual average precipitation amount in the mountains (1300 to 2000 mm year−1) is around twofold the sum at sea level (500 to 1100 mm year−1) [43].
Two native pines cover the whole elevation range of forests from sea level to tree line: Pinus pinaster grows from the shores up to around 1250 m asl and Pinus nigra from around 750 m asl to the tree limit at around 1800 m asl [43]. That leads to a broad transition zone of around 500 m where both species co-occur (Figure 1). Those altitudinal ranges provide a suitable setup to study growth responses on the genus level, especially as Häusser et al. [13] showed the similarity of both pine species’ absolute growth rates. The two species exhibit no significant difference in cumulative growth under the same environmental conditions, i.e., at the same sites.
We chose five study sites to cover the entire altitudinal range of pines on the island’s eastern and western sides (Figure 1). The site IDs point to their location along the two elevation gradients, where the first letter represents the side of the central mountain range (W = west and E = east), and the second letter refers to the elevation (L = low, M = medium, and H = high). Between five and eleven trees per site were equipped with band dendrometers, depending on the available pine species. More trees were selected at a medium elevation (EM and WM), where both pine species co-occur. Since younger trees have higher growth rates than older trees, we preferred to use relatively young, but not juvenile trees for the dendrometer measurements. Accordingly, the study trees were selected having a diameter at breast height (DBH) of 35–45 cm, which corresponded to mean tree ages of 26–57, respectively (Figure 1) within equally open forests. The soils at all five sites are acidic due to the prevalence of metamorphic rocks and granites. The soil depth and water holding capacity vary considerably between sites. The highest site (EH) is located near the crest of a mountain range and shows a shallow podzolic cambisol over granitic bedrock. The soils at intermediate sites (EM, WM) are cambisols of varying depth, whereas WL has a well-developed cambisol. The eastern coastal site (EL), positioned on an extensive alluvial plain, is the only one where we located a deep podzol.

2.2. Dendroecological Methods

We equipped 36 pine trees (15 P. nigra and 21 P. pinaster, cf. Figure 1) with logging band dendrometers (DRL 26C, EMS Brno, Brno, Czech Republic) on 09 April 2017, corresponding to the day of the year (DOY) 99. The devices (resolution of <1 µm) were installed at a stem height of two meters to avoid disruption or loss due to roaming cattle. We carefully removed the majority of the thick bark before mounting the dendrometer bands to minimize the influence of bark on stem swelling and shrinking. Stem circumference was measured in 30-min intervals. We conducted initial data preparation and statistical analyses with RStudio [44]. First, we set the stem circumference data of 2018 to zero at DOY 99 to ensure the two years’ comparability and calculated site averages to minimize the impact of possible disturbances on the individual tree level. Measurements of single trees are shown in Supplementary Figure S1. Then the circumferential data were converted into radial data.
Statistical hypothesis testing procedures were also conducted with RStudio [44]. An ANOVA was performed to test the differences between SRV at all sites for both years. Paired t-tests were calculated to compare SRV at all sites between the two years and SRV between species at the sites where they co-occur.
We conducted the subsequent analysis with the R package dendRoAnalyst [45]. This package offers data analysis functions, including all state-of-the-art dendrometer approaches and ease for data processing and management. With this package, sporadic gaps in the high-resolution data were filled, data jumps related to regular band adjustment were corrected, and high-resolution data were averaged into daily data. Then, SRV were separated into phases following the zero-growth approach [46]. According to this concept, SRV are categorized into two phases: Tree water deficit (TWD) corresponds to the phase with reversible expansion and shrinking of the stem due to uptake and loss of water, and the phase of irreversible stem expansion or actual growth (GRO).

2.3. Meteorological Methods

In April 2017, we equipped all sites with automatic weather stations (Campbell Sci stations at EH, EM, and WM; Metek at EL and WL), which measured air temperature, precipitation and soil moisture (at 10–20 cm) in high resolution (5 min for EH, EM, WM and 1 min for EL, WL). Thus, our observations do not cover the beginning of 2017. To fill this gap, we used data from stations of the French meteorological service MétéoFrance [47] that are nearby our study sites and in similar environmental settings. This enabled the generation of a continuous time series of precipitation and temperature data for all sites, with daily resolution, for 2017 and 2018. Soil moisture data were not available from MétéoFrance stations for all locations. Temperature data were elevation-corrected if the MétéoFrance climate station was located at a different altitude to our study site, using a lapse rate of 0.5 °C/100 m for site EH and 0.6 °C/100 m for sites EM and WM. These average lapse rates resulted from comparing our data with respective MétéoFrance data. The difference of mean daily temperatures was calculated for each day where data were available for both our station and the MétéoFrance station. The mean value of the differences was used for determining the lapse rates. It was not possible to correct the precipitation data for elevation change. Therefore, especially at the higher elevation sites (EH and EM), the amount of precipitation is not accurately covered by the MétéoFrance stations. Further gaps in precipitation data exist, especially at the two coastal locations. Gap filling was possible with a very high consistency concerning the days when there was precipitation. However, there were differences in daily sums (mean correlation coefficient at coastal sites r = 0.61) between the MétéoFrance and our stations. We used these data to correlate daily precipitation sums and temperature means with daily growth rates and tree water deficits.
Recent results indicate that synoptic weather patterns also play an essential role in climate–growth relations [48]. For this reason, we also investigated the prevailing large-scale weather situation. Knerr et al. [41] conducted a numerical weather type classification for the period 1980–2018 based on principal component analysis, using the mean sea level pressure derived from ERA5 reanalysis data with a resolution of 0.25° × 0.25° [49]. The authors identified six leading modes of mean sea level pressure. Hereafter we focus on the first three principal components (PCs) since they account for 93.7% of the cumulative explained variance of the whole data set. The first PC (71.0%) corresponds to high-pressure conditions over the western Mediterranean, with a low-pressure gradient resulting in local winds. Henceforth it is referred to as weather pattern 1 (WP1). The second PC (14.0%) represents a meridional pattern of pressure centers resulting in south-easterly winds (WP2), and the third PC (8.7%) constitutes zonal circulation that leads to higher precipitation totals per event (WP3). Principal components four, five, and six make up 2.3%, 1.2% and 0.8% of the cumulative explained variance and are summarized as other weather patterns (WPo).
We examined the abundance of the weather patterns in 2017 and 2018 compared to the long-term average, each WP’s contribution to the total precipitation amount, and the amount of GRO that occurred during each WP. These methods permitted analysis of the large-scale driving factors that led to the different precipitation amounts and hence tree growth during the study period.

3. Results and Discussion

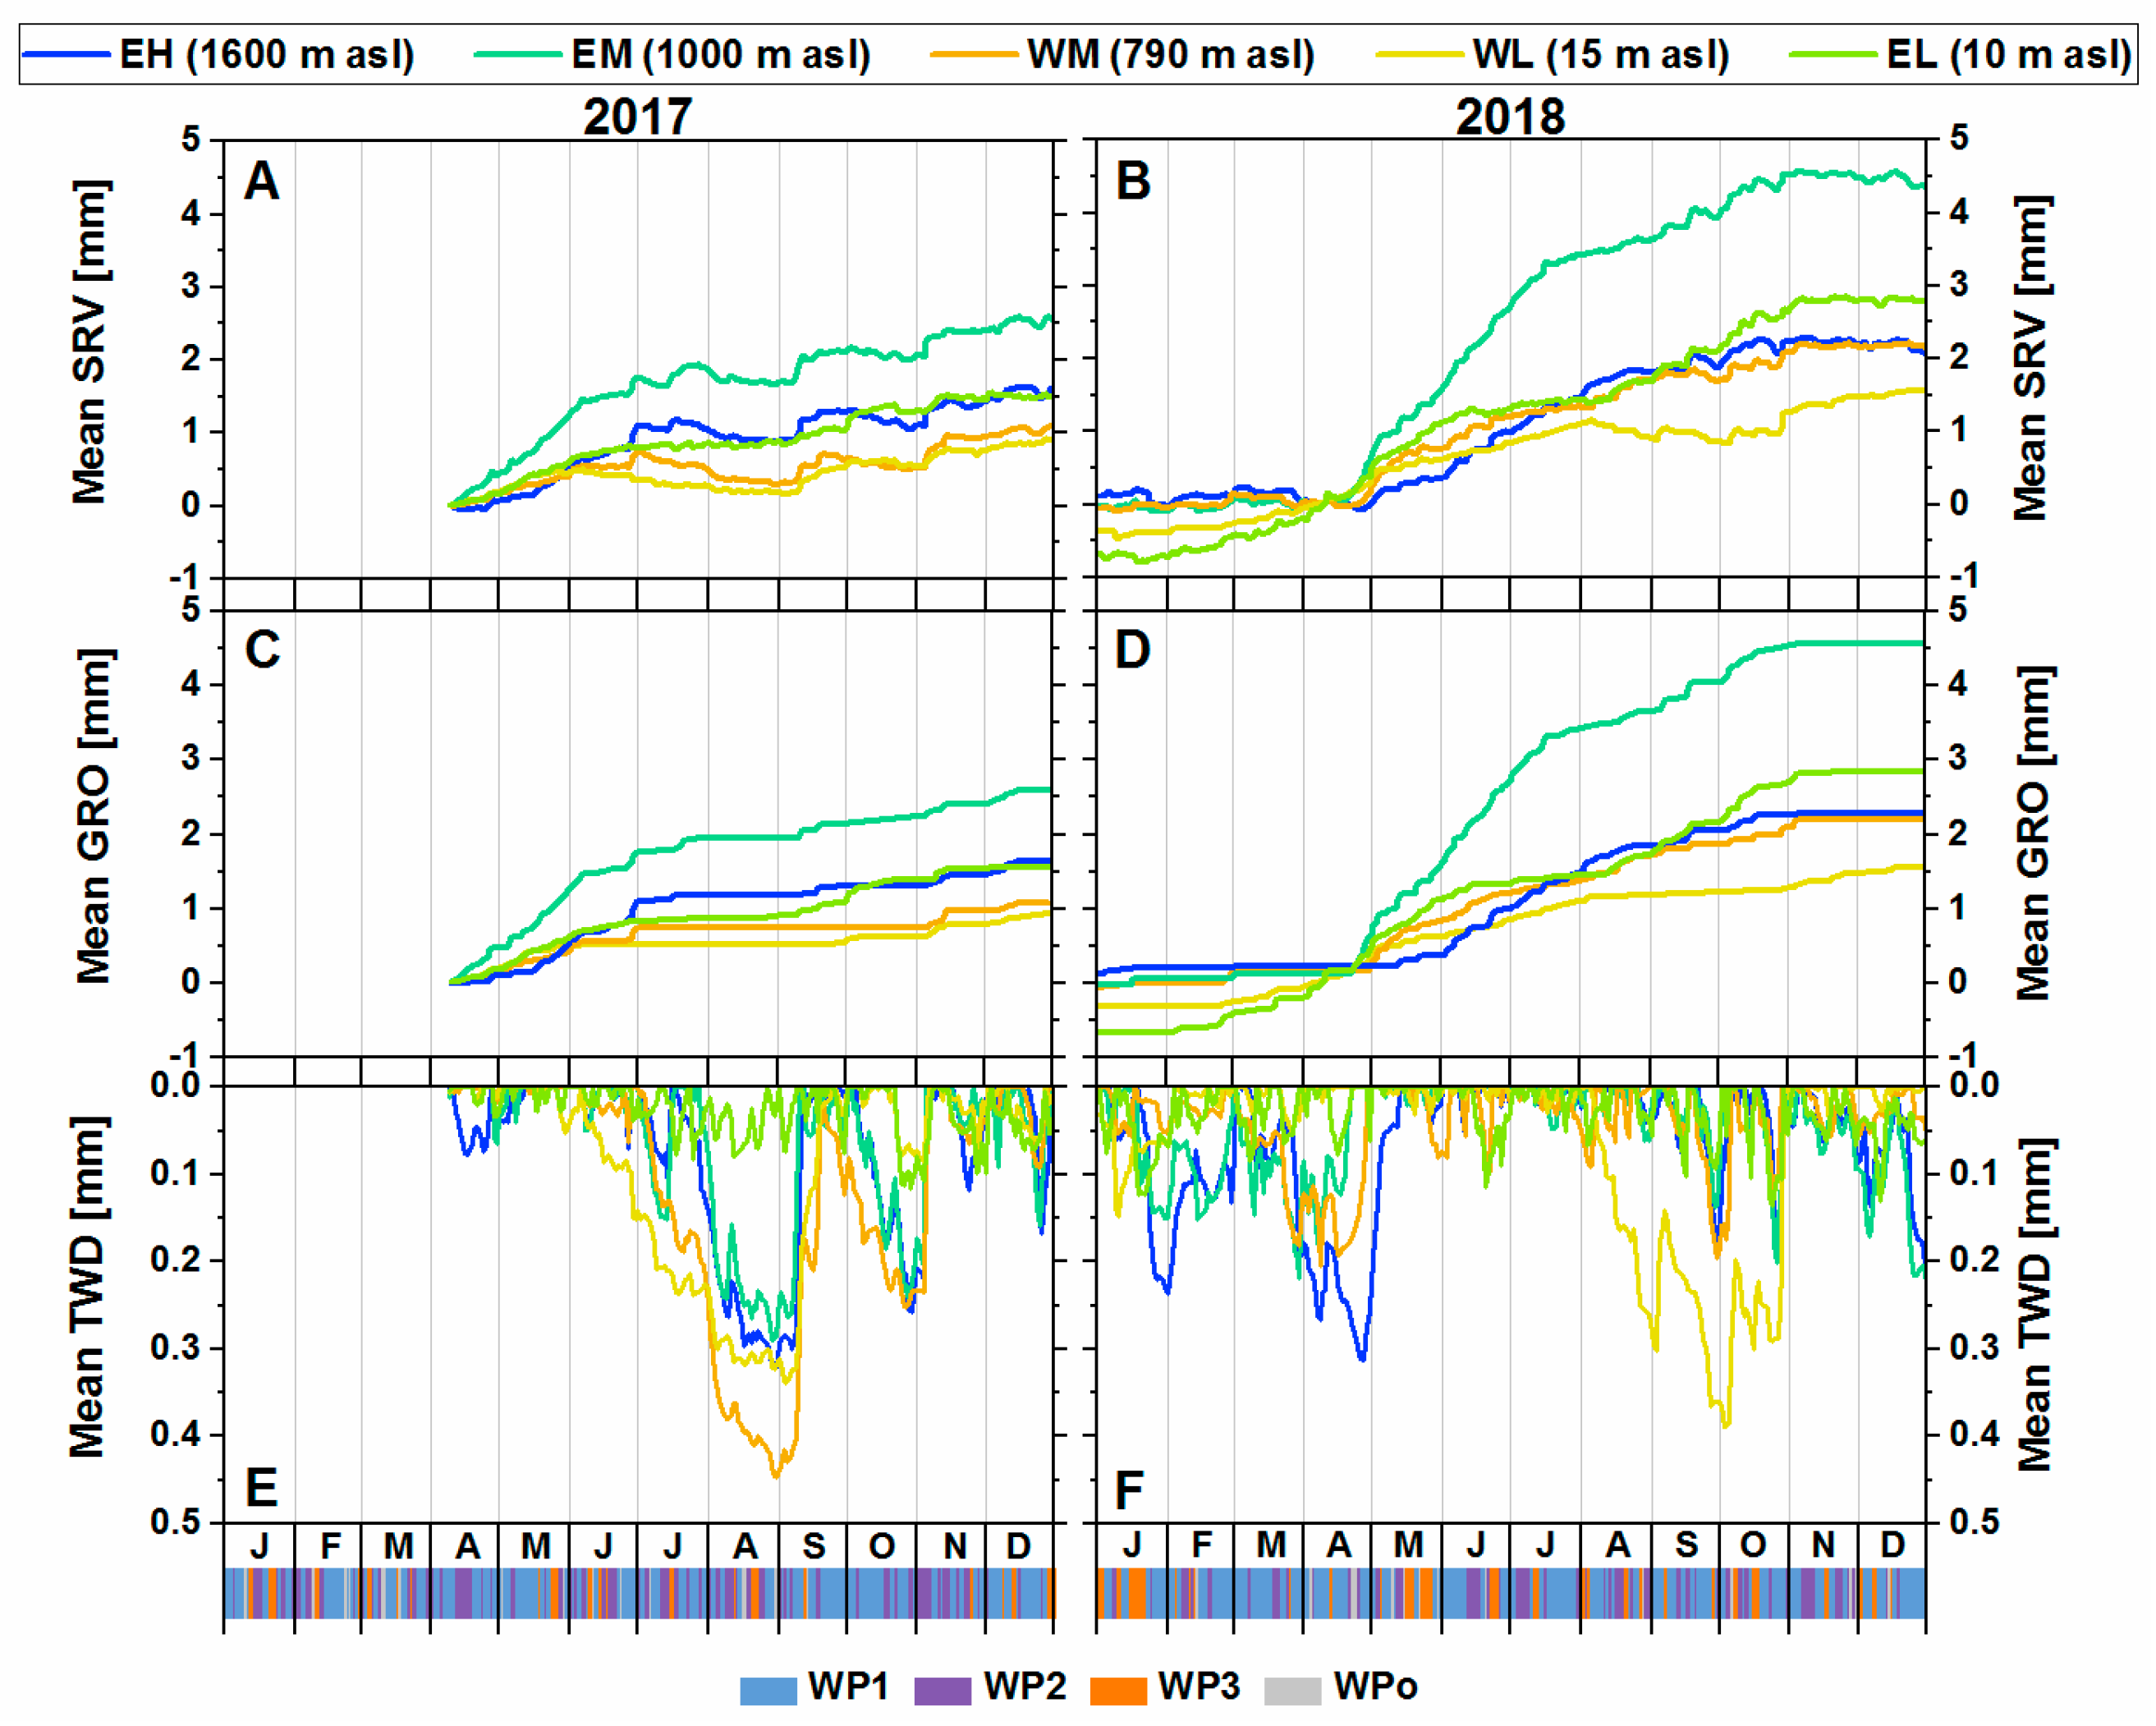
3.1. Stem Radial Variations

3.1.1. Growth Response in 2017 and 2018

The effect of the summer drought in 2017 is unambiguous. The reducing of the stem diameter increase started at WL in early June. Trees at all sites showed long-lasting shrinkage or stagnation of the stem radius between July and September (Figure 2A). This period was briefly interrupted by some rain events in early September. The only exception was at EL, where the tree radii did not shrink over a prolonged time. An ANOVA (calculated with R package stats [44], p = 0.05) showed that mean SRV at the western sites were significantly different from the eastern sites, whereas site EM did not show similarities to the other sites (see Supplementary Table S1). The growth patterns in 2018 were vastly different (Figure 2B). There was only one site with considerable growth stagnation (WL), whereas trees at all other sites did not undergo any prolonged stem radial decrease. It is also visible that the medium and high elevation sites did not experience considerable stem radial growth from the beginning of the year to mid-April, indicating the beginning of the growing season at this time. At the two coastal sites WL and EL, trees started growing earlier in the year. The ANOVA between the sites for 2018 showed significant differences again for site EM, and for site WL.
The smallest difference between the two contrasting years was observed at site EH (+39% in 2018), and the largest difference was at site WM (+104% in 2018, Table 1). At site EH, mean daily growth rates were higher in 2017 than in 2018 until July, whereas the two mid-elevation sites only had higher daily growth rates in 2017 until April (see Supplementary Figure S2). The differences between the two investigated years were significant (paired t-test [44], p = 0.05, Table S1) for each site, where data of 2018 were cropped to DOY 99–365 for comparisons with 2017.
Pinus nigra and P. pinaster exhibited very high synchronicity at the two medium-elevation sites, where they co-occur (WM and EM, see Supplementary Figure S3). In both years P. nigra performed slightly better, which can be explained by the fact that this is the upper distribution boundary of P. pinaster. A statistical similarity in SRV in both species could only be proved for WM in 2018 (t-test, p = 0.05).

3.1.2. Irreversible Growth and Tree Water Deficit

The classification of the days into stem growth, shrinkage, and swelling, revealed different temporal growth patterns in the two years (Figure 2C–F). This underlines the high plasticity of seasonal dynamics of the radial increment of P. nigra and P. pinaster in response to varying numbers of days without precipitation during the growing season. The mid- to high-elevation sites showed unimodal growth patterns in the year with sufficient water availability. However, in 2017, even trees at these sites displayed a bimodal growth pattern, with suppressed growth in summer (Figure 2C), which is characteristic for Mediterranean climates (e.g., [24]). At the coastal sites, the bimodal pattern was only evident at site WL but not at site EL. On the contrary, site EL showed even more days with growth in the summer months in 2017 than the higher sites, indicating that trees at site EL were not seriously affected by the summer drought.
The highest cumulative GRO was recorded at site EM in both years, while it was lowest at WL in both years (Figure 2C,D). Growth before DOY 99 occurred only on coastal sites. Here, trees reached 10% of the maximal GRO for 2018 in mid-March (EL at DOY 70 and WL at DOY 76). The trees at the two medium-elevation sites attained the 10% mark at the end of April (EM at DOY 118 and WM at DOY 121), and trees at the high-elevation site EH, at DOY 142 in the second half of May.
There were uniform TWD periods across the transect, with a more severe impact on the island’s western side in 2017 (Figure 2E). All sites except EL experienced a TWD of more than 0.25 mm during the summer drought. The trees at this site were the only ones that did not suffer a remarkable TWD period in the summer of 2017.
In 2018, however, TWD phases were generally less pronounced and more evenly distributed throughout the year. The trees at the high and mid-elevation sites experienced considerable TWD of more than 0.2 mm in spring, whereas the western coastal site (WL) underwent an extensive, three-month-lasting water deficit period from August to October. Its eastern counterpart (EL) was much less affected. In this year, only two sites (compared to four in 2017) exhibited a TWD of more than 0.25 mm: EH in April and WL in October (Figure 2F).
At all sites, cumulative GRO was higher in 2018 than in 2017 (Table 1). Maximum TWD occurred at almost all sites during the peak of the 2017 summer drought in late August (DOY 241–247). In 2018, on the other hand, the sites reached this benchmark at various times within the year.

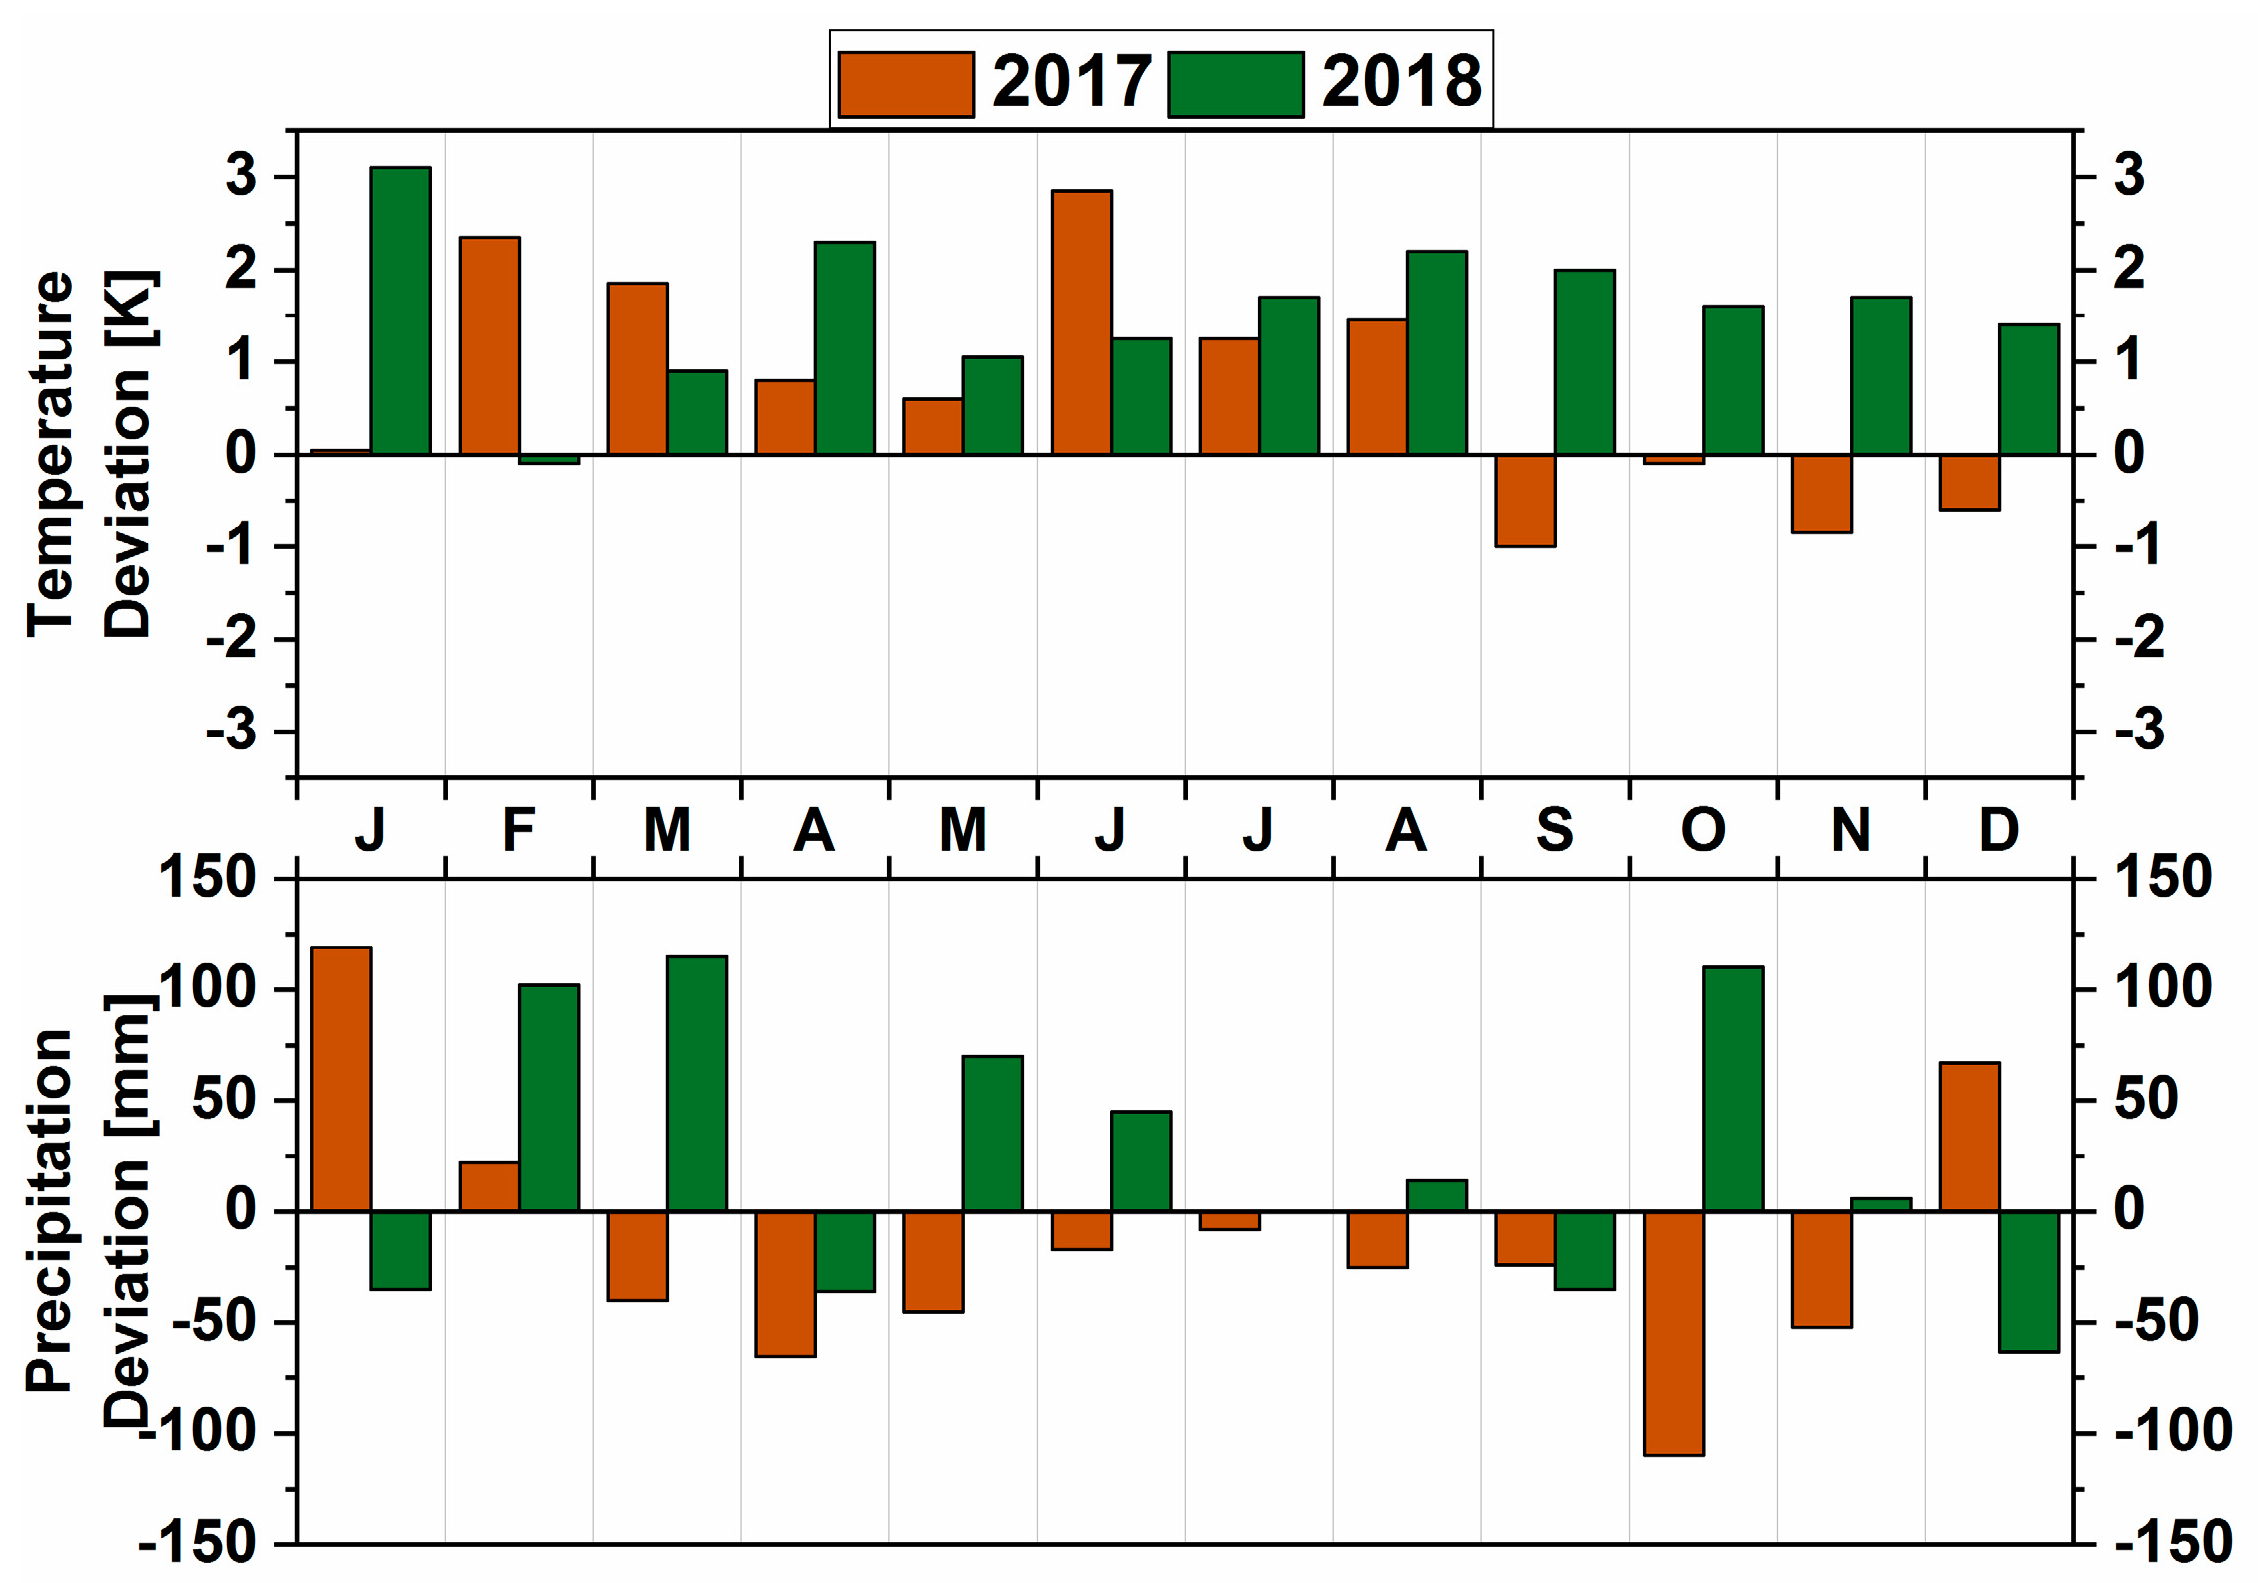
3.2. Meteorological Parameters

3.2.1. Comparison of the Contrasting Years 2017 and 2018

To put the years 2017 and 2018 into a broader context, the measured air temperature and precipitation values were compared with the long-term average (1981–2010) [42] for the whole island (Figure 3). Both years were warm years, with overall, only five months showing values below the long-term average. These “cold” months occurred nearly continuously from September 2017 to February 2018. While the strongest deviation below the average was 1.0 °C (September 2017), the strongest deviation above the long-term mean was more than 2 °C for six months, with the highest values in January 2018 (3.1 °C) and June 2017 (2.9 °C). The monthly temperature deviations from the mean (1981–2010) between April and December differed significantly between the two years at the 95% confidence level (t-test calculated with R package stats [44]).
Precipitation showed considerably higher variability than temperature. The year 2017 was characterized by nine consecutive months with below-average precipitation (March–November). The year 2018, on the other hand, was defined by above-average wet conditions. The deviations were comparably large in both directions: +119 mm in January 2017 as the maximum above the average, and −110 mm in October 2017 as the maximum below the average. No consecutive dry months occurred in 2018. For the year as a whole, precipitation was lower than average by 178 mm in 2017, and higher than average by 293 mm in 2018, across the entire island. The difference in precipitation amounts between the two years was smaller in the summer months than in autumn/winter. The monthly precipitation deviations from the mean (1981–2010) between April and December differed significantly between the two years at the 95% confidence level (t-test calculated with R package stats [44]).
These distinctive differences were also apparent at the local level (Table 2). Our climate stations measured lower annual mean temperatures at almost every site in 2018. Rainy days occurred from 51% to 94% more often. Annual precipitation sums in 2018 were remarkably higher at all sites except EL. At the same time, EL also received more precipitation than the western coastal site (WL). However, at mid-elevation, the eastern part of the transect was drier (sites EM and WM), despite its higher elevation. Mean soil water content was considerably higher in 2018 than in 2017 at all stations.

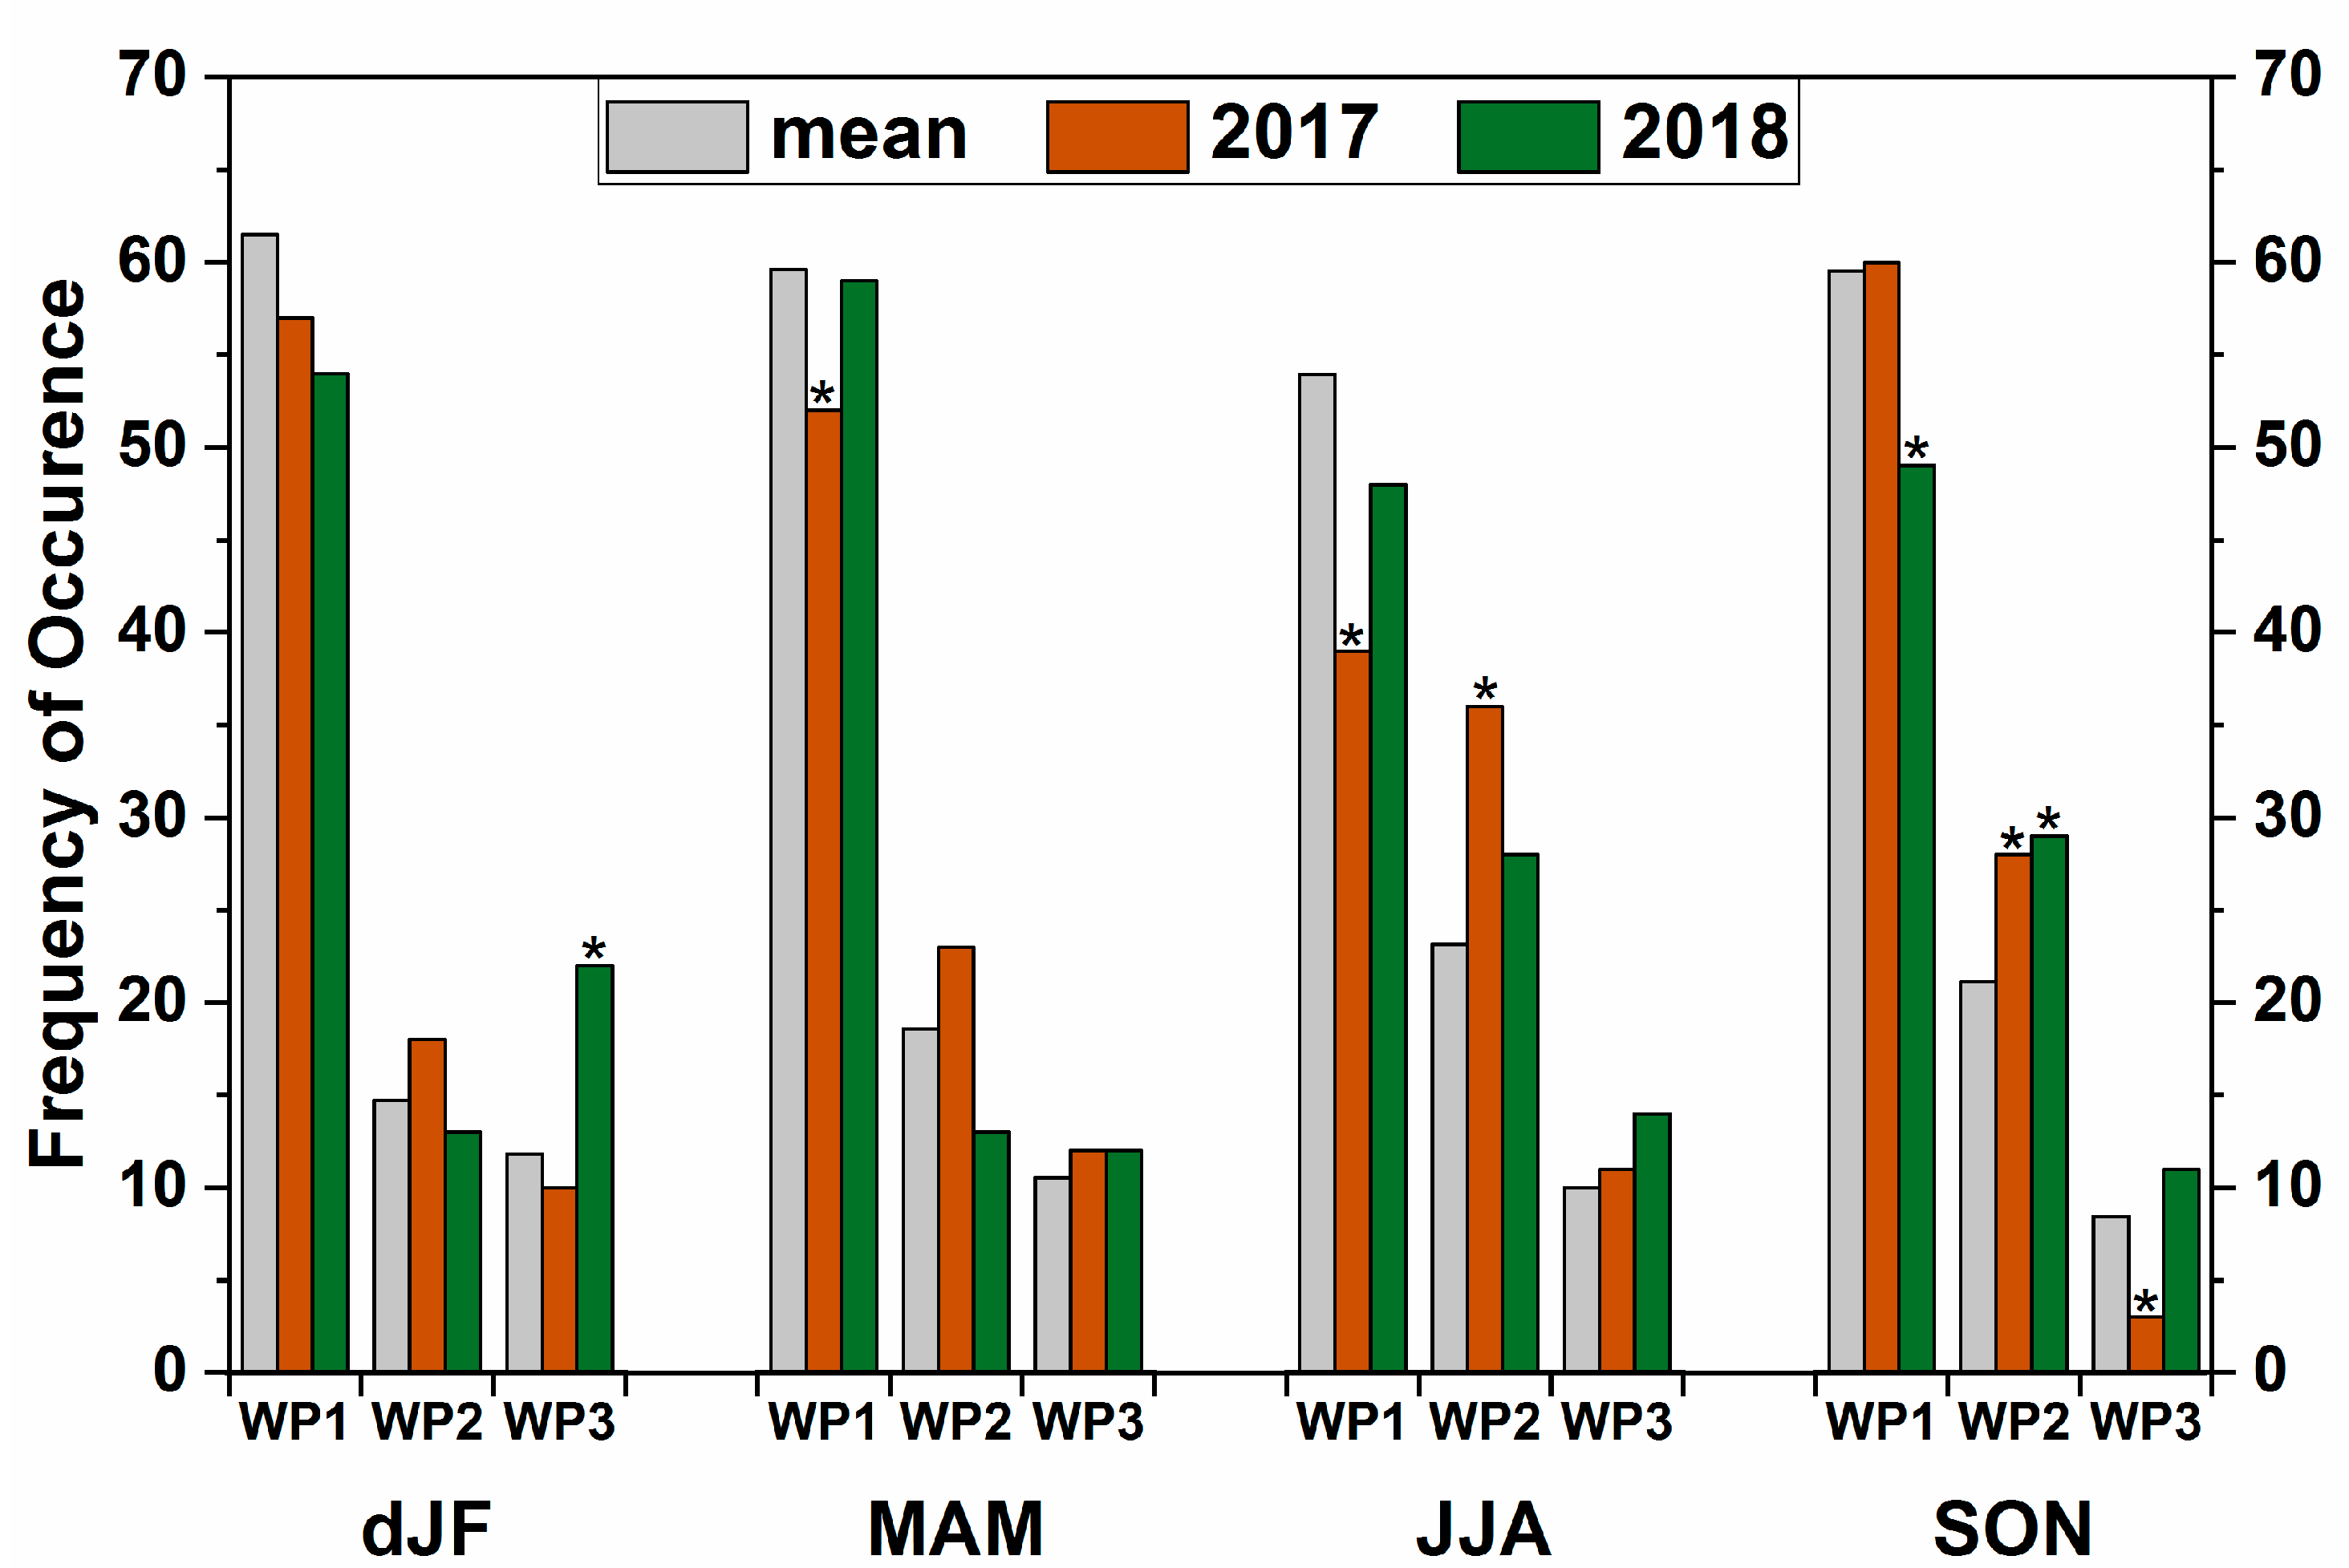
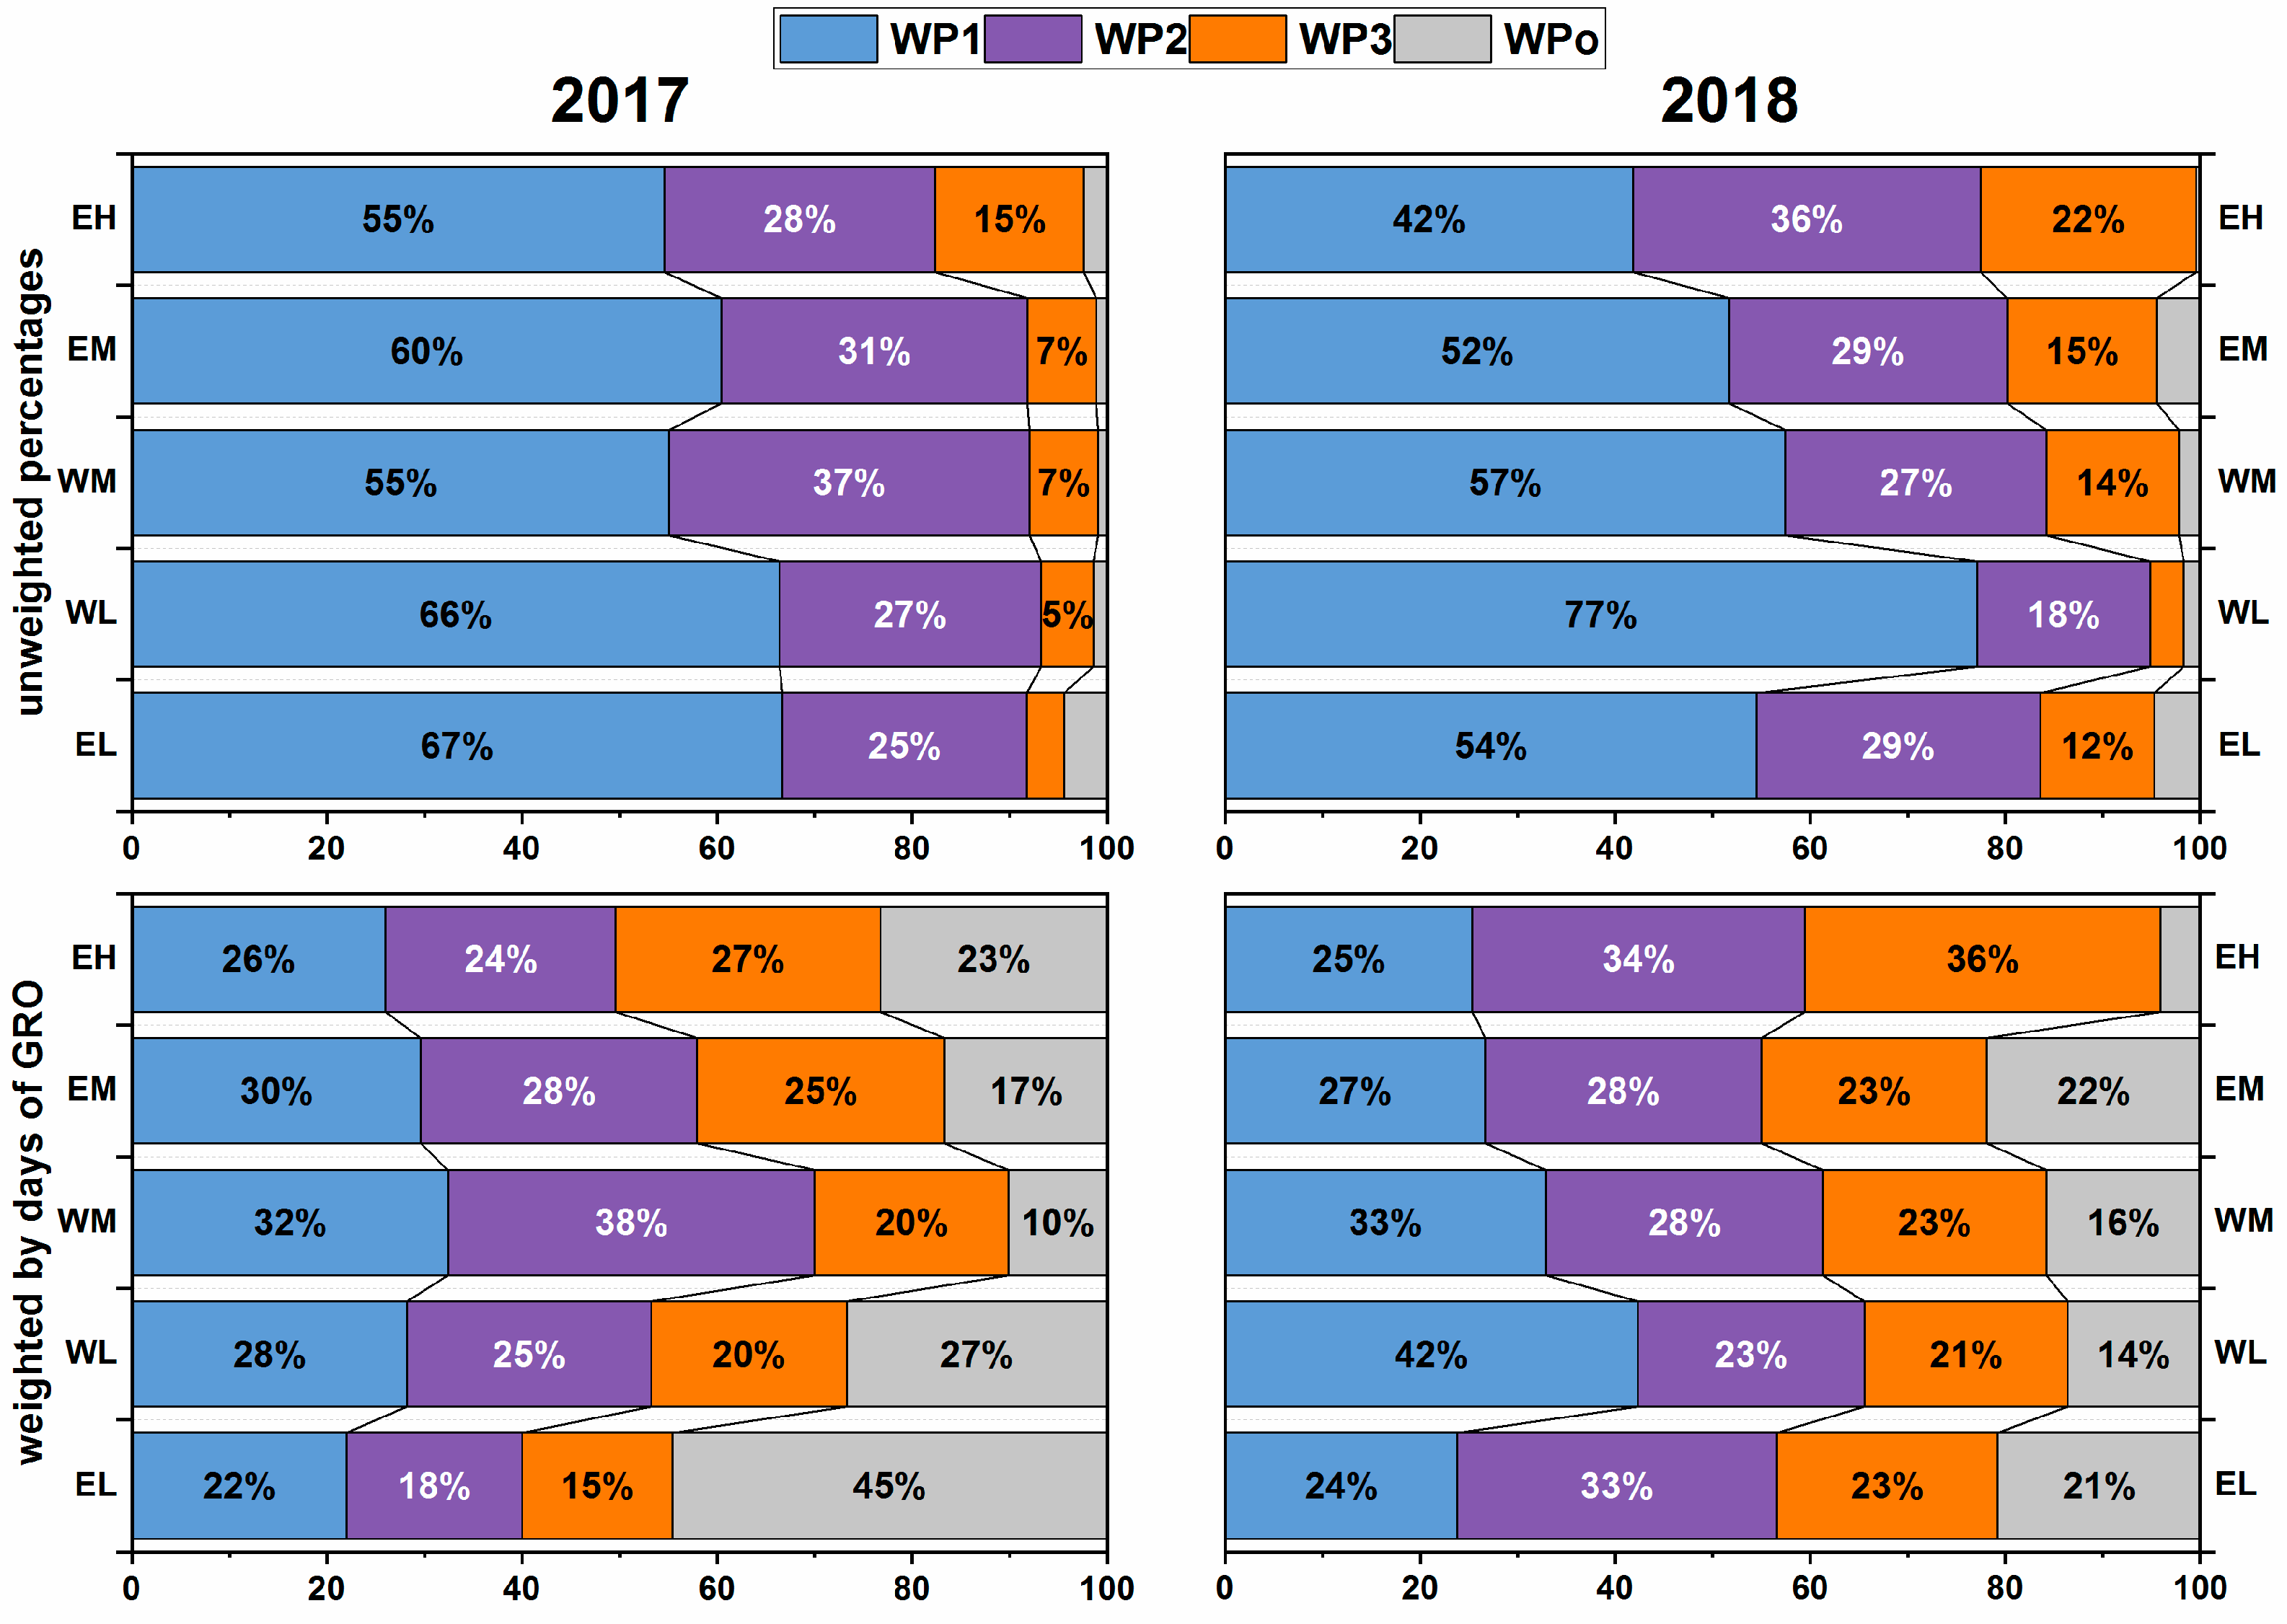
3.2.2. Frequency of the Prevalent Weather Patterns and their Contribution to Precipitation

The weather patterns over the western Mediterranean can be classified into three main types [41]. WP1 is characterized by high pressure in the Mediterranean region and a weak pressure gradient. Under these conditions, the formation of local winds is facilitated, mostly on radiation days during summer. This supports the occurrence of orographic and convective precipitation events. Furthermore, moisture transport towards the island’s interiors is promoted by local breeze systems [41].
WP2 is characterized by a meridional pressure situation with a circulation over Corsica from the south and southeast. The wind from North Africa absorbs moisture over the Mediterranean Sea and can trigger high precipitation amounts on Corsica, especially on the island’s east side [41]. Of the sites in this study, EL is most affected by this weather pattern. Site EM is protected against eastern flows by a mountain range east of the study site (cf. Figure 1).
WP3 is characterized by a zonal circulation with a pronounced flow direction over Corsica from the west and southwest, leading to frontal passages with long-lasting precipitation events [41]. These long-lasting precipitation events occurred more often in 2018 than in 2017 and caused higher precipitation amounts at the higher sites than the coastal sites.
WP1 occurred less often than usual in almost all seasons in 2017, with significantly lower values in MAM and JJA (Figure 4). On the contrary, WP2 occurred more frequently in all seasons, with significantly higher values in JJA and SON. WP3 showed a more diverse pattern in 2017 with a significantly lower prevalence only in SON.
In 2018, WP1 also occurred less often in all seasons. WP2 occurred less frequently in dJF and MAM and more frequently in JJA and SON (significantly). WP3 occurred more often in all seasons, with a significant deviation in dJF. Looking at the data on a yearly basis, both years were characterized by a significantly lower occurrence of WP1. WP2 occurred significantly more often in 2017, while WP3 occurred significantly more often in 2018.
Precipitation occurred on more days in 2018 than in 2017 at all sites. Between 52% and 55% of all rainy days in 2017 occurred under WP1 conditions (Table 3, A: Percentage of Rainy Days by Weather Pattern). In 2018, this proportion was slightly higher (between 55% and 66%). WP2 had a higher contribution in 2017 than in 2018; only at site WL was the percentage similar in both years. In contrast, the contribution of WP3 was higher in 2018 at all sites except WL.
The proportion of the precipitation amount of the different weather patterns was concordant with the frequency of their occurrence. WP1 had the highest contribution at all sites except EL in 2017 (Table 3, B: Percentage of Precipitation Amount by Weather Pattern). At site EL, WP2 had a larger contribution to the total precipitation amount than all other sites, especially in 2018. The contribution of WP3 was lowest at site WL and was, in general, higher in 2017 than in 2018. The exception being at the highest site of the transect (EH). The different frequencies of WP3 in both years can explain the different total precipitation amounts.

3.3. Integration of Meteorology and Tree Growth Response

3.3.1. Site-Specific Precipitation Regimes and Respective Impact on Tree Growth

Site EL receives in total more precipitation than site WL, and the precipitation amount is distributed over more days during the year. That is in concordance with the findings of Knerr et al. [41], who did not observe increased precipitation sums on the west coast compared to other coastal regions on Corsica, although the west coast is more exposed to frontal passages from the westerlies. Precipitation at site EL is more likely caused by local events with a southeast wind direction, so that the precipitation formation process and the large-scale weather patterns are different from site WL. Therefore, precipitation often does not co-occur at both coastal sites, leading to differences in the measured growth response. The overall higher precipitation amounts at site EL combined with the well-developed soil, which can store water from individual precipitation events over more extended periods, led to higher soil moisture (cf. Table 2). This can explain the significantly lower TWD than at site WL. Site WL, in contrast, is mainly affected by air masses with a westerly flow direction. With increasing elevation, these air masses bring orographic precipitation towards site WM. This creates more homogenous precipitation regimes at sites WL and WM than between the two coastal locations. The water supply, and hence the conditions for tree growth, are better at the east coast than at the west coast due to the higher total precipitation amounts and a shorter drought period in summer. A cluster analysis of several climate stations distributed over the whole island of Corsica revealed that westerly exposed regions (i.e., the west coast) show an earlier precipitation peak at the beginning of the year (January) and a later winter precipitation peak (November) compared to the east coast (March and October, respectively) [41].
The three higher study sites EH, EM, and WM, are very similar concerning their precipitation regimes. Precipitation is caused either by passages of fronts, by orographic precipitation, or by local wind systems. Local wind circulations are common year-round on Corsica, but may increase in summer under low synoptic forcing [41]. Site EM integrates effects from the coastal site and the highest site, while site EH shows nearly no similarities with site EL. Although the linear distance between the two sites is only around 25 km, the precipitation regime is entirely different. The topography has a significant influence on the genesis of precipitation events, with an amplification effect in the interior of the island [41]. Such topography reinforcing effects are lacking on the broad plain of the east coast.
The later onset of the growing season in 2018 at site EH can be attributed to the considerably lower temperatures in May/June 2018 compared to 2017. The slight overall difference between the two years compared to the other locations can be explained by the snowy winter of 2016/2017. At the beginning of the growing season, there was still plenty of water available from the snowmelt at site EH, so that the precipitation deficit did not yet have a negative effect on growth, as was the case at sites without a permanent winter snow cover. At mid-elevation, site WM showed a much smaller difference in GRO between the two years than site EM, indicating that EM trees reacted more strongly to different water availability. Although site EM received less precipitation than site WM, trees at site EM showed a higher cumulative growth rate in both years. This can be explained by a higher water holding capacity due to higher soil depth at site EM. Hence, rainwater can be stored over a more extended period. However, if this water reserve is exhausted and not refilled on time, tree growth is temporarily halted (as in 2017). In turn, high growth rates are possible under humid conditions. Regardless of the precipitation amount, site WM is generally a drier location because of its shallow soil with a low water holding capacity. During heavy precipitation events, a large part of the water is lost via surface runoff and interflow. Therefore, even in humid years, only low growth rates can be observed. At the coastal locations, WL showed a larger difference between 2017 and 2018 in JJA compared to site EL. This indicates that the western coast was more strongly affected by the drought of 2017 than the eastern coast.

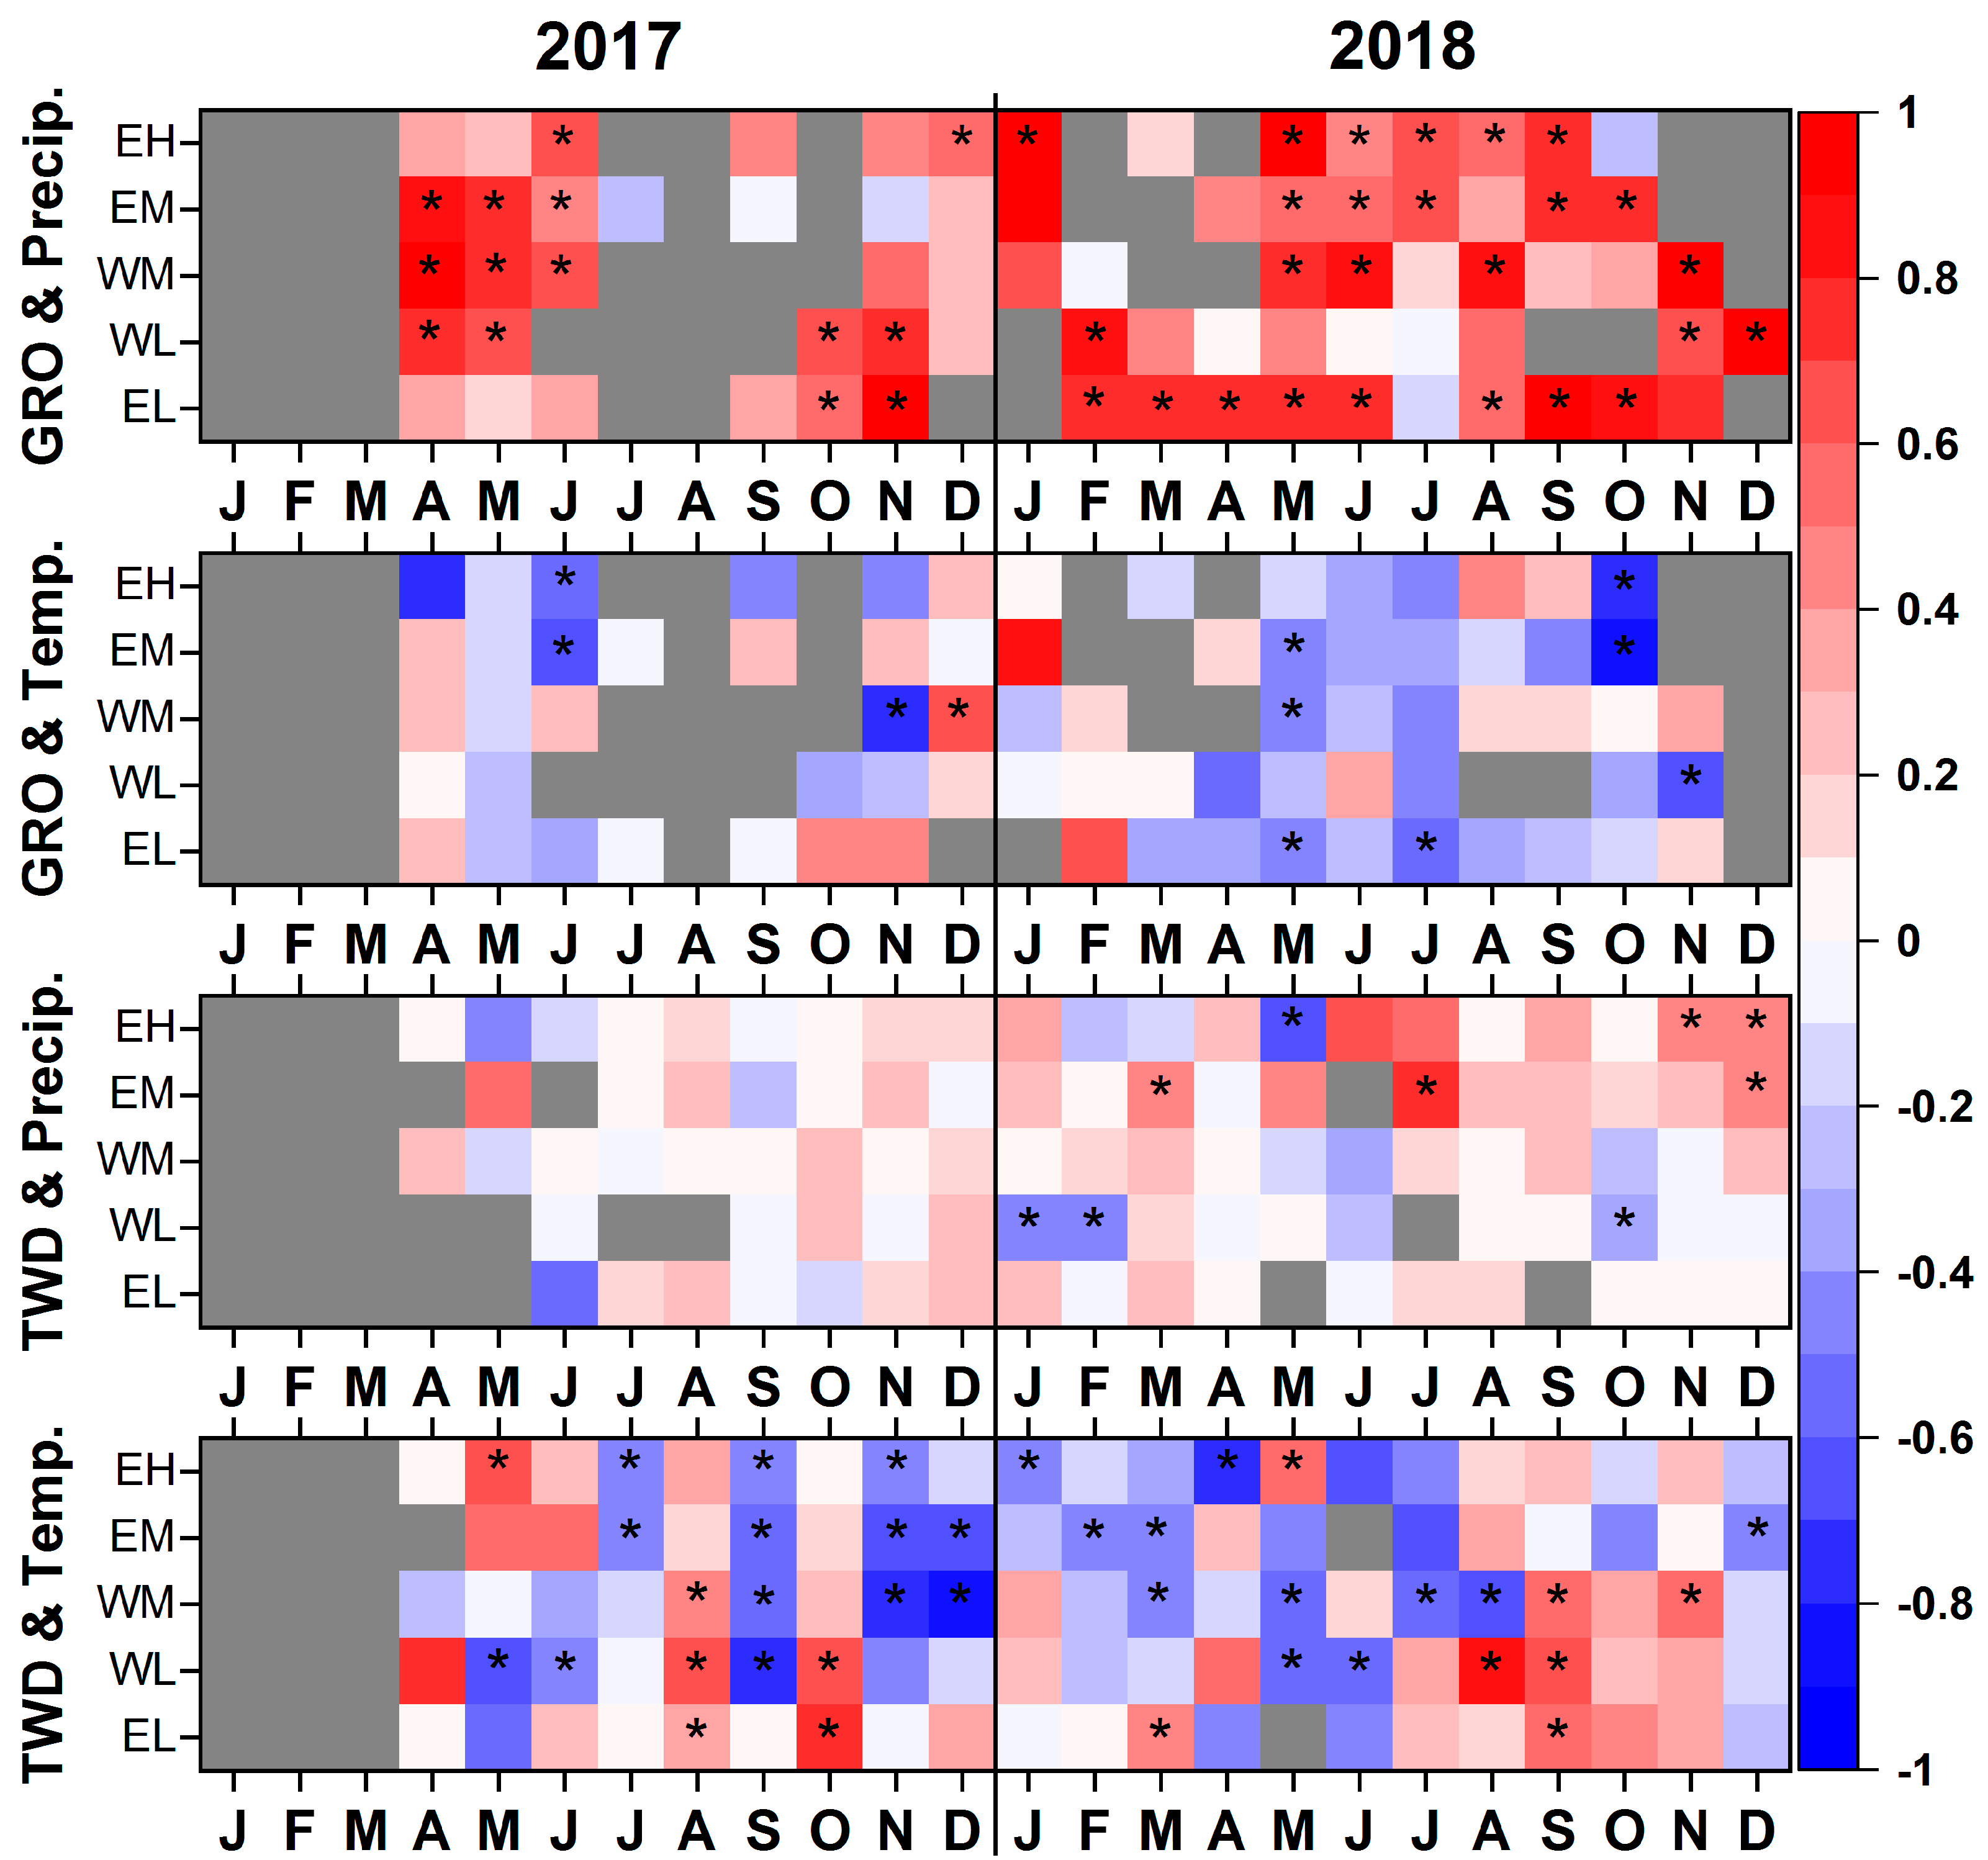
3.3.2. Correlations between Meteorological and Growth Parameters

We calculated correlation coefficients of daily site means of the GRO and TWD values with daily precipitation and temperature measurements for each month and each site, for both years. For each parameter and month, we determined the respective 95% confidence level. (Figure 5). In 2017, GRO showed a positive correlation with precipitation at most sites in spring and early summer and at coastal sites additionally, in October and November. In 2018, significant positive correlations occurred between May and October at almost all sites. While the correlation pattern is very similar between high- and mid-elevation sites, GRO at coastal sites is influenced by precipitation from different months depending on the year. In 2017, significant correlations occurred in spring and summer at WL but not at EL. This situation was switched in 2018.
Temperature and GRO correlated significantly and negatively, but there was no distinct pattern apparent, as with precipitation. In 2018, the pattern generally showed more negative correlations across the transect throughout the summer months.
No significant correlations were found between precipitation and TWD in 2017, but the response was slightly positive across all sites and months. The signal was equally scattered in 2018, with few significant correlations. Most correlations were positive and occurred at the two highest sites (EH and EM).
In contrast, the correlations between TWD and temperature were much higher. From June to December 2017, significant negative correlations occurred at the high and medium sites, and positive correlations at coastal sites in August and October. In 2018, there were more negative correlations in the first half of the year and more positive correlations in the second half. In both years, significant correlations were predominantly negative at higher sites and more positive at lower sites. This could be due to snowmelt at the beginning of the growing period and local thunderstorms towards the end.
These findings imply that high water availability can counteract exceptionally high temperatures (as in 2018). However, if water availability is low (as in 2017), the high temperatures lead to higher evapotranspiration and hamper, or even halt, tree growth.
TWD can serve as a biological indicator of drought stress [46,50,51]. A remarkably high TWD was observed at all sites except EL during the dry summer period in 2017. Sites on the western part of the transect were more affected than sites on the eastern part. The most intense drought stress occurred at site WL, where a clear TWD occurred even during the wet summer and autumn of 2018. The TWD data lead us to conclude that trees at site WL are most vulnerable to drought, followed by trees at WM.
Interestingly, trees at site EL did not respond to the drought in 2017, although the climate conditions were similar to those at the other sites. This implies that these trees have access to deeper water reservoirs and that the water status of the trees is decoupled from the actual soil water potential, as reported in other studies [31,52]. Besides the TWD during summer, we observed an additional remarkable stem shrinkage at the beginning of 2018 at higher locations. During this time of the year, temperatures dropped below zero, which entrained liquid water to move out of the cells to prevent intracellular freezing [34,53].
Figure 6 illustrates how much GRO occurred during the respective prevalent weather patterns in 2017 and 2018. The share of GRO in the patterns (Figure 6—upper panels) shows a more even distribution along the elevation gradient in the dry year (2017) compared to a more distinct elevation pattern in the wet year. The precipitation falling during the prevailing meteorological situation, with a low-pressure gradient over the western Mediterranean (WP1), had a higher impact at lower sites because of its sea breeze aspect. That does not apply for EL, and can be explained by its location on the alluvial fan and the related, decoupled water regime. Comparing the two years, more GRO occurred at all eastern sites (EH, EM, and EL) during WP1 in 2017. The meridional circulation with an east–west pressure gradient (WP2) led to more GRO at almost all sites in the drought year (2017). Although the zonal circulation regime (WP3) led to a higher percentage share of precipitation in 2017 (cf. Table 3, B: Percentage of Precipitation Amount by Weather Pattern), it led to less GRO. These events were more intense in 2017 since the precipitation amounts accumulated during fewer days (cf. Table 3, A: Percentage of Rainy Days by Weather Pattern) and hence, provided a less reliable source of water for the trees.
The percentages weighted by days of the occurrence of GRO, showed how effective the impact of each weather pattern was (Figure 6—lower panels). There was generally a more even distribution over different WPs in the wet year. The gradual increase of WP1’s impact with lower elevation in 2018 is less pronounced but still visible in the weighted data. WP2 had a strong influence on growth at the eastern sites (EH, EM, and EL) in 2018. Although WP3 led to a higher percentage share of precipitation in 2017 (cf. Table 3, B: Percentage of Precipitation Amount by Weather Pattern), it did not have a more substantial influence on GRO.
Remarkably, a considerable amount of GRO happened during the other weather patterns (WPo), which occurred only on 16 days in 2017 and 15 days in 2018. The large percentage of GRO at site EL (45%) is probably partly related to its location, being masked by the groundwater influence. Moreover, WP4 generally leads to higher precipitation amounts at site EL. WP5 is the weather pattern with the strongest correlation to a high amount of rain. It has a meridional orientation and leads to higher precipitation amounts at all sites. Its relatively strong pressure gradient above Corsica can lead to rain, even during generally drier conditions. In the wet year, this impact is obscured by the other, more dominant weather patterns. The influence of WP1 in the dry year is of less importance at the coastal sites because high pressures are more pronounced, and sea breeze rain is less asserted.
Furthermore, the timing of the occurrence of the WPo is important. In 2017 these weather patterns emerged at the beginning of the growing period and in early September (right when the drought ended) and from mid-April to late-May in 2018. This suggests that the strong impact of these infrequent weather patterns is due to the coinciding phenological occurrence of the highest growth rates (cf. Figure S2). Nonetheless, this suggests that precipitation, even distributed over very few days, can strongly impact trees’ growth responses.

4. Conclusions

We investigated the impact of an exceptionally dry and subsequent wet year on the radial tree growth of Corsican Black pine (Pinus nigra Arnold subsp. laricio Maire) and Maritime pine (Pinus pinaster Aiton) on Corsica. The setup of five study sites at different elevations and on eastern and western sides of the island allowed us to put the varying effects on two widespread Pinus species in the western Mediterranean in relation.
Our analysis revealed that in the dry year (2017), trees at almost all sites experienced radial stem growth stagnation or even shrinkage for several months, with maximum TWDs in late August. That suggests a bimodal growth pattern even close to the tree line, contrary to the unimodal growth patterns at most sites in 2018. The most severe TWDs during the drought year occurred in the western part of the island, whereas trees at higher elevations were more affected than at lower elevations within respective aspects. Growth patterns at one site (EL) were masked by other water sources.
In this study, we tested a novel method for identifying the impact of atmospheric weather patterns instead of on-site measured climatological parameters on seasonal tree growth dynamics, which is a rather new approach in dendrosciences. Since the two studied, climatologically contrasting years could be clearly distinguished by the dominant weather patterns, this approach of using large-scale synoptic regimes to interpret intra-annual growth patterns showed initial promising results. However, for a generalization of the obtained interrelations, longer data series are needed.
The drought of 2017 poses an example of how two species of a common tree genus can react to the predicted decrease in summer precipitation in the western Mediterranean. The intra-growing season drought effects significantly affected radial tree growth, although the preceding winter was rich in snow. With the predicted rising frequency of comparable climatic situations, pines (and most likely other genera) in the Mediterranean area will be destined to suffer massively from water stress, even at high elevations.

Supplementary Materials

The following are available online at https://www.mdpi.com/article/10.3390/f12091175/s1, Figure S1: Stem circumference changes of single trees, Figure S2: Site averages of daily growth rates along the elevation transect for 2017 and 2018. Figure S3: Comparison of SRV on species level where both pines co-occur, Table S1: Significant differences of SRV between sites and years calculated by ANOVA at p = 0.05.

Author Contributions

Conceptualization, M.H. and S.S. (Sonja Szymczak); methodology, M.H., S.S. (Sonja Szymczak) and A.B.; formal analysis, M.H. and S.S. (Sonja Szymczak); investigation, M.H.; writing—original draft preparation, M.H. and S.S. (Sonja Szymczak); writing—review and editing, M.H., S.S. (Sonja Szymczak), I.K., J.B., E.G., F.H., K.T., S.S. (Sébastien Santoni) and A.B.; visualization, M.H. All authors have read and agreed to the published version of the manuscript.

Funding

This research was funded by the German Research Foundation (DFG) (grant numbers BE 1780/45-1, BR 1895/27-1, SZ 356/1-1 and TR 1201/2-1) as part of the interdisciplinary research program CorsicArchive (Altitudinal Gradients and Forest Response: Climate, Hydrology and Isotope Variability of a Mediterranean Ecosystem) DFG-PAK 927/1.

Data Availability Statement

Not Applicable.

Acknowledgments

We thank all CorsicArchive team members for sampling and support during fieldwork. Further, we acknowledge MétéoFrance for supplying the climate data.

Conflicts of Interest

The authors declare no conflict of interest.

References

  1. IPCC. Climate Change 2013: The Physical Science Basis. Contribution of Working Group I to the Fifth Assessment Report of the Intergovern-Mental Panel on Climate Change; Cambridge University Press: Cambridge, UK, 2014. [Google Scholar]
  2. Nardini, A.; Lo Gullo, M.A.; Trifilò, P.; Salleo, S. The challenge of the Mediterranean climate to plant hydraulics: Responses and adaptations. Environ. Exp. Bot. 2014, 103, 68–79. [Google Scholar] [CrossRef]
  3. IPCC. Climate Change 2014: Synthesis Report. Contribution of Working Groups I, II and III to the Fifth Assessment Report of the Intergovernmental Panel on Climate Change; IPCC: Geneva, Switzerland, 2015. [Google Scholar]
  4. Beniston, M.; Diaz, H.F. The 2003 heat wave as an example of summers in a greenhouse climate? Observations and climate model simulations for Basel, Switzerland. Glob. Planet. Chang. 2004, 44, 73–81. [Google Scholar] [CrossRef] [Green Version]
  5. Vicente-Serrano, S.M.; Lopez-Moreno, J.-I.; Beguería, S.; Lorenzo-Lacruz, J.; Sanchez-Lorenzo, A.; García-Ruiz, J.M.; Azorin-Molina, C.; Morán-Tejeda, E.; Revuelto, J.; Trigo, R.; et al. Evidence of increasing drought severity caused by temperature rise in southern Europe. Environ. Res. Lett. 2014, 9, 44001. [Google Scholar] [CrossRef]
  6. Zittis, G.; Hadjinicolaou, P.; Fnais, M.; Lelieveld, J. Projected changes in heat wave characteristics in the eastern Mediterranean and the Middle East. Reg. Environ. Chang. 2016, 16, 1863–1876. [Google Scholar] [CrossRef]
  7. Allen, C.D.; Breshears, D.D.; McDowell, N.G. On underestimation of global vulnerability to tree mortality and forest die-off from hotter drought in the Anthropocene. Ecosphere 2015, 6, art129. [Google Scholar] [CrossRef]
  8. Ciais, P.; Reichstein, M.; Viovy, N.; Granier, A.; Ogée, J.; Allard, V.; Aubinet, M.; Buchmann, N.; Bernhofer, C.; Carrara, A.; et al. Europe-wide reduction in primary productivity caused by the heat and drought in 2003. Nature 2005, 437, 529–533. [Google Scholar] [CrossRef] [PubMed]
  9. Bigler, C.; Bräker, O.U.; Bugmann, H.; Dobbertin, M.; Rigling, A. Drought as an Inciting Mortality Factor in Scots Pine Stands of the Valais, Switzerland. Ecosystems 2006, 9, 330–343. [Google Scholar] [CrossRef] [Green Version]
  10. Akkemik, Ü. Tree Rings of Cedrus libani at the Northern Boundary of its Natural Distribution. IAWA J. 2003, 24, 63–73. [Google Scholar] [CrossRef] [Green Version]
  11. Touchan, R.; Xoplaki, E.; Funkhouser, G.; Luterbacher, J.; Hughes, M.K.; Erkan, N.; Akkemik, Ü.; Stephan, J. Reconstructions of spring/summer precipitation for the Eastern Mediterranean from tree-ring widths and its connection to large-scale atmospheric circulation. Clim. Dyn. 2005, 25, 75–98. [Google Scholar] [CrossRef]
  12. Schuster, R.; Oberhuber, W. Drought sensitivity of three co-occurring conifers within a dry inner Alpine environment. Trees 2013, 27, 61–69. [Google Scholar] [CrossRef] [Green Version]
  13. Häusser, M.; Szymczak, S.; Garel, E.; Santoni, S.; Huneau, F.; Bräuning, A. Growth variability of two native pine species on Corsica as a function of elevation. Dendrochronologia 2019, 54, 49–55. [Google Scholar] [CrossRef]
  14. Galván, J.; Büntgen, U.; Ginzler, C.; Grudd, H.; Gutiérrez, E.; Labuhn, I.; Julio Camarero, J. Drought-induced weakening of growth–temperature associations in high-elevation Iberian pines. Glob. Planet. Chang. 2015, 124, 95–106. [Google Scholar] [CrossRef] [Green Version]
  15. Bouriaud, O.; Leban, J.-M.; Bert, D.; Deleuze, C. Intra-annual variations in climate influence growth and wood density of Norway spruce. Tree Physiol. 2005, 25, 651–660. [Google Scholar] [CrossRef] [PubMed] [Green Version]
  16. Rathgeber, C.B.K.; Rossi, S.; Bontemps, J.-D. Cambial activity related to tree size in a mature silver-fir plantation. Ann. Bot. 2011, 108, 429–438. [Google Scholar] [CrossRef] [Green Version]
  17. Deslauriers, A.; Morin, H.; Begin, Y. Cellular phenology of annual ring formation of Abies balsamea in the Quebec boreal forest (Canada). Can. J. For. Res. 2003, 33, 190–200. [Google Scholar] [CrossRef] [Green Version]
  18. Linares, J.C.; Camarero, J.J.; Carreira, J.A. Plastic responses of Abies pinsapo xylogenesis to drought and competition. Tree Physiol. 2009, 29, 1525–1536. [Google Scholar] [CrossRef]
  19. Michelot, A.; Simard, S.; Rathgeber, C.; Dufrêne, E.; Damesin, C. Comparing the intra-annual wood formation of three European species (Fagus sylvatica, Quercus petraea and Pinus sylvestris) as related to leaf phenology and non-structural carbohydrate dynamics. Tree Physiol. 2012, 32, 1033–1045. [Google Scholar] [CrossRef] [Green Version]
  20. Plomion, C.; Leprovost, G.; Stokes, A. Wood Formation in Trees. Plant Physiol. 2001, 127, 1513–1523. [Google Scholar] [CrossRef]
  21. Zhai, L.; Bergeron, Y.; Huang, J.-G.; Berninger, F. Variation in intra-annual wood formation, and foliage and shoot development of three major Canadian boreal tree species. Am. J. Bot. 2012, 99, 827–837. [Google Scholar] [CrossRef] [Green Version]
  22. Rossi, S.; Deslauriers, A.; Anfodillo, T.; Carraro, V. Evidence of threshold temperatures for xylogenesis in conifers at high altitudes. Oecologia 2007, 152, 1–12. [Google Scholar] [CrossRef]
  23. Vieira, J.; Rossi, S.; Campelo, F.; Freitas, H.; Nabais, C. Xylogenesis of Pinus pinaster under a Mediterranean climate. Ann. For. Sci. 2014, 71, 71–80. [Google Scholar] [CrossRef] [Green Version]
  24. Liu, X.; Nie, Y.; Wen, F. Seasonal Dynamics of Stem Radial Increment of Pinus taiwanensis Hayata and Its Response to Environmental Factors in the Lushan Mountains, Southeastern China. Forests 2018, 9, 387. [Google Scholar] [CrossRef] [Green Version]
  25. Zhang, S.; Huang, J.-G.; Rossi, S.; Ma, Q.; Yu, B.; Zhai, L.; Luo, D.; Guo, X.; Fu, S.; Zhang, W. Intra-annual dynamics of xylem growth in Pinus massoniana submitted to an experimental nitrogen addition in Central China. Tree Physiol. 2017, 37, 1546–1553. [Google Scholar] [CrossRef] [Green Version]
  26. Gruber, A.; Strobl, S.; Veit, B.; Oberhuber, W. Impact of drought on the temporal dynamics of wood formation in Pinus sylvestris. Tree Physiol. 2010, 30, 490–501. [Google Scholar] [CrossRef] [PubMed] [Green Version]
  27. Deslauriers, A.; Rossi, S.; Anfodillo, T. Dendrometer and intra-annual tree growth: What kind of information can be inferred? Dendrochronologia 2007, 25, 113–124. [Google Scholar] [CrossRef] [Green Version]
  28. Herzog, K.M.; Häsler, R.; Thum, R. Diurnal changes in the radius of a subalpine Norway spruce stem: Their relation to the sap flow and their use to estimate transpiration. Trees 1995, 10, 94–101. [Google Scholar] [CrossRef]
  29. Zweifel, R.; Item, H.; Häsler, R. Stem radius changes and their relation to stored water in stems of young Norway spruce trees. Trees 2000, 15, 50–57. [Google Scholar] [CrossRef] [Green Version]
  30. Güney, A.; Gülsoy, S.; Şentürk, Ö.; Niessner, A.; Küppers, M. Environmental control of daily stem radius increment in the montane conifer Cedrus libani. J. For. Res. 2020, 31, 1159–1171. [Google Scholar] [CrossRef] [Green Version]
  31. Oberhuber, W.; Gruber, A.; Kofler, W.; Swidrak, I. Radial stem growth in response to microclimate and soil moisture in a drought-prone mixed coniferous forest at an inner Alpine site. Eur. J. For. Res. 2014, 133, 467–479. [Google Scholar] [CrossRef] [Green Version]
  32. Raffelsbauer, V.; Spannl, S.; Peña, K.; Pucha-Cofrep, D.; Steppe, K.; Bräuning, A. Tree Circumference Changes and Species-Specific Growth Recovery After Extreme Dry Events in a Montane Rainforest in Southern Ecuador. Front. Plant Sci. 2019, 10, 342. [Google Scholar] [CrossRef]
  33. Daudet, F.-A.; Améglio, T.; Cochard, H.; Archilla, O.; Lacointe, A. Experimental analysis of the role of water and carbon in tree stem diameter variations. J. Exp. Bot. 2005, 56, 135–144. [Google Scholar] [CrossRef] [Green Version]
  34. Zweifel, R.; Häsler, R. Frost-induced reversible shrinkage of bark of mature subalpine conifers. Agric. For. Meteorol. 2000, 102, 213–222. [Google Scholar] [CrossRef]
  35. Zweifel, R.; Häsler, R. Dynamics of water storage in mature subalpine Picea abies: Temporal and spatial patterns of change in stem radius. Tree Physiol. 2001, 21, 561–569. [Google Scholar] [CrossRef] [Green Version]
  36. Vieira, J.; Rossi, S.; Campelo, F.; Freitas, H.; Nabais, C. Seasonal and daily cycles of stem radial variation of Pinus pinaster in a drought-prone environment. Agric. For. Meteorol. 2013, 180, 173–181. [Google Scholar] [CrossRef] [Green Version]
  37. Camarero, J.J.; Guerrero-Campo, J.; Gutierrez, E. Tree-Ring Growth and Structure of Pinus uncinata and Pinus sylvestris in the Central Spanish Pyrenees. Arct. Alp. Res. 1998, 30, 1. [Google Scholar] [CrossRef]
  38. Martinez del Castillo, E.; Longares, L.A.; Gričar, J.; Prislan, P.; Gil-Pelegrín, E.; Čufar, K.; de Luis, M. Living on the Edge: Contrasted Wood-Formation Dynamics in Fagus sylvatica and Pinus sylvestris under Mediterranean Conditions. Front. Plant Sci. 2016, 7, 370. [Google Scholar] [CrossRef] [PubMed] [Green Version]
  39. de Luis, M.; Novak, K.; Raventós, J.; Gričar, J.; Prislan, P.; Čufar, K. Cambial activity, wood formation and sapling survival of Pinus halepensis exposed to different irrigation regimes. For. Ecol. Manag. 2011, 262, 1630–1638. [Google Scholar] [CrossRef]
  40. Güney, A.; Küppers, M.; Rathgeber, C.; Şahin, M.; Zimmermann, R. Intra-annual stem growth dynamics of Lebanon cedar along climatic gradients. Trees 2017, 31, 587–606. [Google Scholar] [CrossRef] [Green Version]
  41. Knerr, I.; Trachte, K.; Garel, E.; Huneau, F.; Santoni, S.; Bendix, J. Partitioning of Large-Scale and Local-Scale Precipitation Events by Means of Spatio-Temporal Precipitation Regimes on Corsica. Atmosphere 2020, 11, 417. [Google Scholar] [CrossRef] [Green Version]
  42. MétéoFrance. Bulletins Climatiques de France Métropolitaine et Outremer. 2020. Available online: https://donneespubliques.meteofrance.fr/?fond=produit&id_produit=129&id_rubrique=29 (accessed on 6 July 2020).
  43. ONF. Contribution à la Conduite des Peuplements de Pin Laricio et Habitats Associés: Patrimoine et Richesses; Office National des Fôrets: Sarreguemines, France, 2006. [Google Scholar]
  44. R Core Team. R: A Language and Environment for Statistical Computing; R Foundation for Statistical Computing: Vienna, Austria, 2020. [Google Scholar]
  45. Aryal, S.; Häusser, M.; Grießinger, J.; Fan, Z.; Bräuning, A. “dendRoAnalyst”: A tool for processing and analysing dendrometer data. Dendrochronologia 2020, 2020, 125772. [Google Scholar] [CrossRef]
  46. Zweifel, R.; Haeni, M.; Buchmann, N.; Eugster, W. Are trees able to grow in periods of stem shrinkage? New Phytol. 2016, 211, 839–849. [Google Scholar] [CrossRef] [PubMed] [Green Version]
  47. MétéoFrance. Climate Data from Stations Ajaccio, Bocognano, Evisa, Sampolo and Solenzara. 2020. Available online: https://www.meteofrance.fr (accessed on 20 May 2020).
  48. Schultz, J.A.; Beck, C.; Menz, G.; Neuwirth, B.; Ohlwein, C.; Philipp, A. Sensitivity of proxies on non-linear interactions in the climate system. Sci. Rep. 2015, 5, 18560. [Google Scholar] [CrossRef] [PubMed] [Green Version]
  49. Hersbach, H.; Bell, B.; Berrisford, P.; Hirahara, S.; Horányi, A.; Muñoz-Sabater, J.; Nicolas, J.; Peubey, C.; Radu, R.; Schepers, D.; et al. The ERA5 global reanalysis. Q. J. R. Meteorol. Soc. 2020, 146, 1999–2049. [Google Scholar] [CrossRef]
  50. Oberhuber, W.; Kofler, W.; Schuster, R.; Wieser, G. Environmental effects on stem water deficit in co-occurring conifers exposed to soil dryness. Int. J. Biometeorol. 2015, 59, 417–426. [Google Scholar] [CrossRef] [PubMed] [Green Version]
  51. Schäfer, C.; Rötzer, T.; Thurm, E.A.; Biber, P.; Kallenbach, C.; Pretzsch, H. Growth and Tree Water Deficit of Mixed Norway Spruce and European Beech at Different Heights in a Tree and under Heavy Drought. Forests 2019, 10, 557. [Google Scholar] [CrossRef] [Green Version]
  52. Zweifel, R.; Zimmermann, L.; Zeugin, F.; Newbery, D.M. Intra-annual radial growth and water relations of trees: Implications towards a growth mechanism. J. Exp. Bot. 2006, 57, 1445–1459. [Google Scholar] [CrossRef] [PubMed] [Green Version]
  53. Loris, K.; Havranek, W.M.; Wieser, G. Ecological significance of thickness changes in stem, branches and twigs of Pinus cembra L. during winter. PHYTON-HORN- 1999, 39, 117–122. [Google Scholar]
Figure 1. Map with location of study sites. The table contains site details with investigated trees (PINI = Pinus nigra, PIPI = Pinus pinaster, DBH = diameter at breast height). The diagram shows the schematic altitudinal distribution of the species across the east–west transect, including the transition zone, where both species co-occur. Site IDs refer to the respective aspect (W = west and E = east) and elevation (L = low, M = medium, and H = high). σ represents standard deviation.
Forests 12 01175 g001
Figure 2. Daily stem radial variations (SRV) expressed as mean values from 5–11 trees per site in 2017 and 2018 (A,B). Site averages for mean irreversible growth (GRO) and tree water deficit (TWD) for 2017 and 2018 (CF). Values in panels A–D were set to 0 at DOY 99. Bars at the bottom of the graph show daily prevalent weather patterns (see Section 3.2) of the western Mediterranean.
Forests 12 01175 g002
Figure 3. Temperature and precipitation deviations from the long-term monthly mean (1981–2010) in 2017 and 2018. Data was compiled from 11 climate stations at 5–1030 m asl across the whole geographical extent of Corsica [42].
Forests 12 01175 g003
Figure 4. Frequency of occurrence of the different weather patterns on a seasonal basis in 2017 and 2018 compared with the long-term mean (1980–2018). Significant deviations (Student’s t-test, p = 0.05) are marked with an asterisk. The lower-case letter indicates the previous year’s month.
Forests 12 01175 g004
Figure 5. Monthly correlation coefficients of temperature and precipitation with GRO and TWD. Significant correlations (p = 0.05) are marked with an asterisk. Correlations are based on daily data (Daily growth rates are depicted in Figure S2). Grey fields are months where no GRO or TWD was detected.
Forests 12 01175 g005
Figure 6. Comparison of percentages of GRO that occurred during the respective weather patterns in 2017 and 2018. Other weather patterns (WPo) represent the rarely occurring other weather patterns (4, 5, and 6) described in Knerr et al. [41]. Upper panels show percentages of total GRO amount, and lower panels represent the same data weighted by days of the occurrence of GRO.
Forests 12 01175 g006
Table 1. Site averages of radial cumulative irreversible growth (GRO) and tree water deficit (TWD).
SiteCumulative GRO
[mm/Year]
Maximum TWD
[mm/Day]
20172018Δ20172018Δ
WL (15 m asl)0.921.56+70%0.34 at DOY 2470.39 at DOY 277+14%
WM (790 m asl)1.082.21+104%0.45 at DOY 2430.21 at DOY 098−53%
EH (1600 m asl)1.642.28+39%0.32 at DOY 2430.31 at DOY 117−3%
EM (1000 m asl)2.594.57+76%0.29 at DOY 2410.22 at DOY 364−24%
EL (10 m asl)1.542.85+85%0.12 at DOY 3020.14 at DOY 297+16%
Table 2. Annual sums and averages of climate parameters at study sites. Rainy days refer to days with > 0 mm precipitation.
SiteMean Temperature [°C]Rainy Days [n]Precipitation Sum [mm]Mean Soil Water Content [m3/m3]
20172018201720182017201820172018
WL (15 m asl)17.017.4+0.477133+73%319.4609.3+91%0.030.04+33%
WM (790 m asl)13.312.7−0.6112217+94%1193.42208.4+85%0.080.19+138%
EH (1600 m asl)7.77.1−0.6135251+86%1594.32918.4+83%NANANA
EM (1000 m asl)11.810.9−0.9112182+63%990.81695.4+71%0.040.12+200%
EL (10 m asl)16.015.9−0.193140+51%721.5709.5−2%0.070.18+157%
Table 3. Percentages of precipitation parameters by main weather patterns (WP1–WP3).
SiteA: Percentage of Rainy Days
by Weather Pattern [%]
B: Percentage of Precipitation Amount
by Weather Pattern [%]
2017201820172018
WP1WP2WP3WP1WP2WP3WP1WP2WP3WP1WP2WP3
WL (15 m asl)552518612414463617701911
WM (790 m asl)522914592217472825651717
EH (1600 m asl)533112552517592119582021
EM (1000 m asl)522914562318422432621720
EL (10 m asl)523710662012223932553113
Publisher’s Note: MDPI stays neutral with regard to jurisdictional claims in published maps and institutional affiliations.

