Article

How Do Mediterranean Pine Trees Respond to Drought and Precipitation Events along an Elevation Gradient?

1
Institute of Geography, Friedrich-Alexander University Erlangen-Nürnberg, Wetterkreuz 15, 91058 Erlangen, Germany
2
Faculté des Sciences et Techniques, Laboratoire d’Hydrogéologie, Campus Grimaldi, Université de Corse Pascal Paoli, BP 52, 20250 Corte, France
3
Centre national de la recherche scientifique, UMR 6134, SPE, 20250 Corte, France
4
Laboratory of Climatology and Remote Sensing, Philipps-University of Marburg, Deutschhausstraße 12, 35037 Marburg, Germany
5
Institute for Environmental Scienes, Brandenburg University of Technology (BTU) Cottbus-Senftenberg, Burger Chaussee 2, 03044 Cottbus, Germany
*
Author to whom correspondence should be addressed.
Forests 2020, 11(7), 758; https://doi.org/10.3390/f11070758
Submission received: 5 June 2020 / Revised: 3 July 2020 / Accepted: 10 July 2020 / Published: 14 July 2020
(This article belongs to the Special Issue Relationship between Forest Ecophysiology and Environment)

Abstract

:
Drought is a major factor limiting tree growth and plant vitality. In the Mediterranean region, the length and intensity of drought stress strongly varies with altitude and site conditions. We used electronic dendrometers to analyze the response of two native pine species to drought and precipitation events. The five study sites were located along an elevation gradient on the Mediterranean island of Corsica (France). Positive stem increment in the raw dendrometer measurements was separated into radial stem growth and stem swelling/shrinkage in order to determine which part of the trees’ response to climate signals can be attributed to growth. Precipitation events of at least 5 mm and dry periods of at least seven consecutive days without precipitation were determined over a period of two years. Seasonal dynamics of stem circumference changes were highly variable among the five study sites. At higher elevations, seasonal tree growth showed patterns characteristic for cold environments, while low-elevation sites showed bimodal growth patterns characteristic of drought prone areas. The response to precipitation events was uniform and occurred within the first six hours after the beginning of a precipitation event. The majority of stem circumference increases were caused by radial growth, not by stem swelling due to water uptake. Growth-induced stem circumference increase occurred at three of the five sites even during dry periods, which could be attributed to stored water reserves within the trees or the soils. Trees at sites with soils of low water-holding capacity were most vulnerable to dry periods.

1. Introduction

Water availability is the most limiting abiotic factor for plant growth and productivity, especially in arid or semi-arid environments [1,2]. Tree dieback can often be related to water shortage and enhanced drought stress [3,4,5]. The identification of available water sources and the trees′ response to short-term changes in environmental conditions is therefore of great importance to evaluate the vulnerability of forest ecosystems to current climate change.
A tree‘s water status is controlled by atmospheric conditions, the depth and distribution of the root system, and by soil water status. If the tree′s transpiration exceeds the water uptake from the soil, the tree is able to relocate water from internal reservoirs to maintain the transpiration process and to adjust its water use [6] The hydraulic conductance of roots is highly variable and depends on soil water content, salinity of the soil, and on the demands for water from the transpiring shoot [7]. Soil water content is highly variable in space and time. Depending on the rooting and soil depth, trees can have access to different soil water layers and hence may respond differently to single precipitation events [8,9,10]. Beside the amount of water provided by precipitation, its seasonal distribution is of great relevance for regulating plant ecological processes. Several studies underline the importance of winter precipitation in summer-dry climates, which may stimulate an entirely different plant response than a summer rain event as shown for shrubs in desert environments [11,12]. This is particularly the case in climates where deeper soil water reservoirs are replenished by winter precipitation [9].
An indicator for the whole tree water status is the diurnal cycle of shrinking and swelling of the stem [6], which is caused by imbalances between transpiration and root water uptake [13], and by processes altering osmotic water potentials [14]. The daily cycle of water depletion and replenishment can be influenced by several factors, such as rainfall and soil water content, atmospheric vapor pressure deficit, and ambient air temperature [15,16,17]. Hence, stem circumference changes can be used to assess a tree′s climate sensitivity, i.e., the response to extreme meteorological events [18,19], and its water status on short time scales [15].
Stem circumference changes (SCCs) are commonly measured with point or band dendrometers, a powerful tool providing data in unmatched quality and resolution [20]. Dendrometer measurements allow to investigate the influence of site conditions and meteorological factors on growth, as well as species-specific responses to changing climate conditions [19,21,22]. Dendrometers have been used to investigate the seasonal dynamics and growth phenology in a broad range of forest ecosystems in different climate zones, ranging from tropical [19] to subtropical [17,22] or alpine conditions [15,21]. For example, [17] determined water availability as the main factor influencing growth cessation in Pinus pinaster at the west coast of Portugal under Mediterranean climate conditions. However, the interpretation of dendrometer data can be complex, as SCCs depend on various factors. Beside the water-related swelling and shrinkage of phloem, xylem, and bark, increasing stem circumference can also be caused by irreversible radial growth due to newly formed sapwood and bark tissue cells, including cambial division and cell expansion [23,24]. Hence, it is often not possible to accurately differentiate “growth” from “stem water increase” [25]. Models to separate these two parameters require additional physiological data, which might not be available or which are difficult to measure over longer time periods [20]. Therefore, some studies use a combination of dendrometers and wood formation monitoring methods, as, e.g., [22] in the montane conifer Cedrus libani in Turkey.
Little is known about how fast trees respond to short-term fluctuations of water availability, although already [26] stressed the importance of single precipitation events for long-term plant functioning and survival. This is particularly important in climate regimes where the time of the highest rainfall amount and the vegetation period do not coincide, e.g., in the Mediterranean climate. Additionally, time lags in the signal transfer from water uptake to the tree-ring archive can occur [1,27,28,29,30], further complicating the interpretation of tree-ring proxy data related to water uptake, e.g., stable oxygen isotope ratios. Hence, the determination of the response time to discrete climatic events is of high importance. In this study, we used dendrometer measurements to analyze the response of pine trees to discrete climate events in Mediterranean forest ecosystems along elevation gradients on the island of Corsica. In contrast to other studies, we investigated the response to climate events not only during dry periods, but also to precipitation events. Due to the high spatial variability of ecological conditions on Corsica, we were able to study the tree response under both Mediterranean and subalpine climate conditions. We investigated the response of two pine species, which are widespread over the Mediterranean basin, i.e., Pinus pinaster Aiton growing at low to middle elevations, and Pinus nigra J.F. Arn subsp. laricio (Poiret) Maire var. Corsicana Hyl. growing at middle to high elevations, up to the upper tree limit. Despite its economic and ecological importance on Corsica, there are no studies on the intra-annual growth dynamics of P. nigra so far. The main aims of our study are (i) to determine the trees′ response to dry periods and precipitation events by separating the growth- and stem water-related signals in SCC measurements, and (ii) to identify changes in tree response along an elevation gradient in order to distinguish tree growth from stem increment due to physiological responses under various local climate conditions. Hence, this study contributes to a better understanding of the productivity and resilience of both pine species under future climate conditions.

2. Materials and Methods
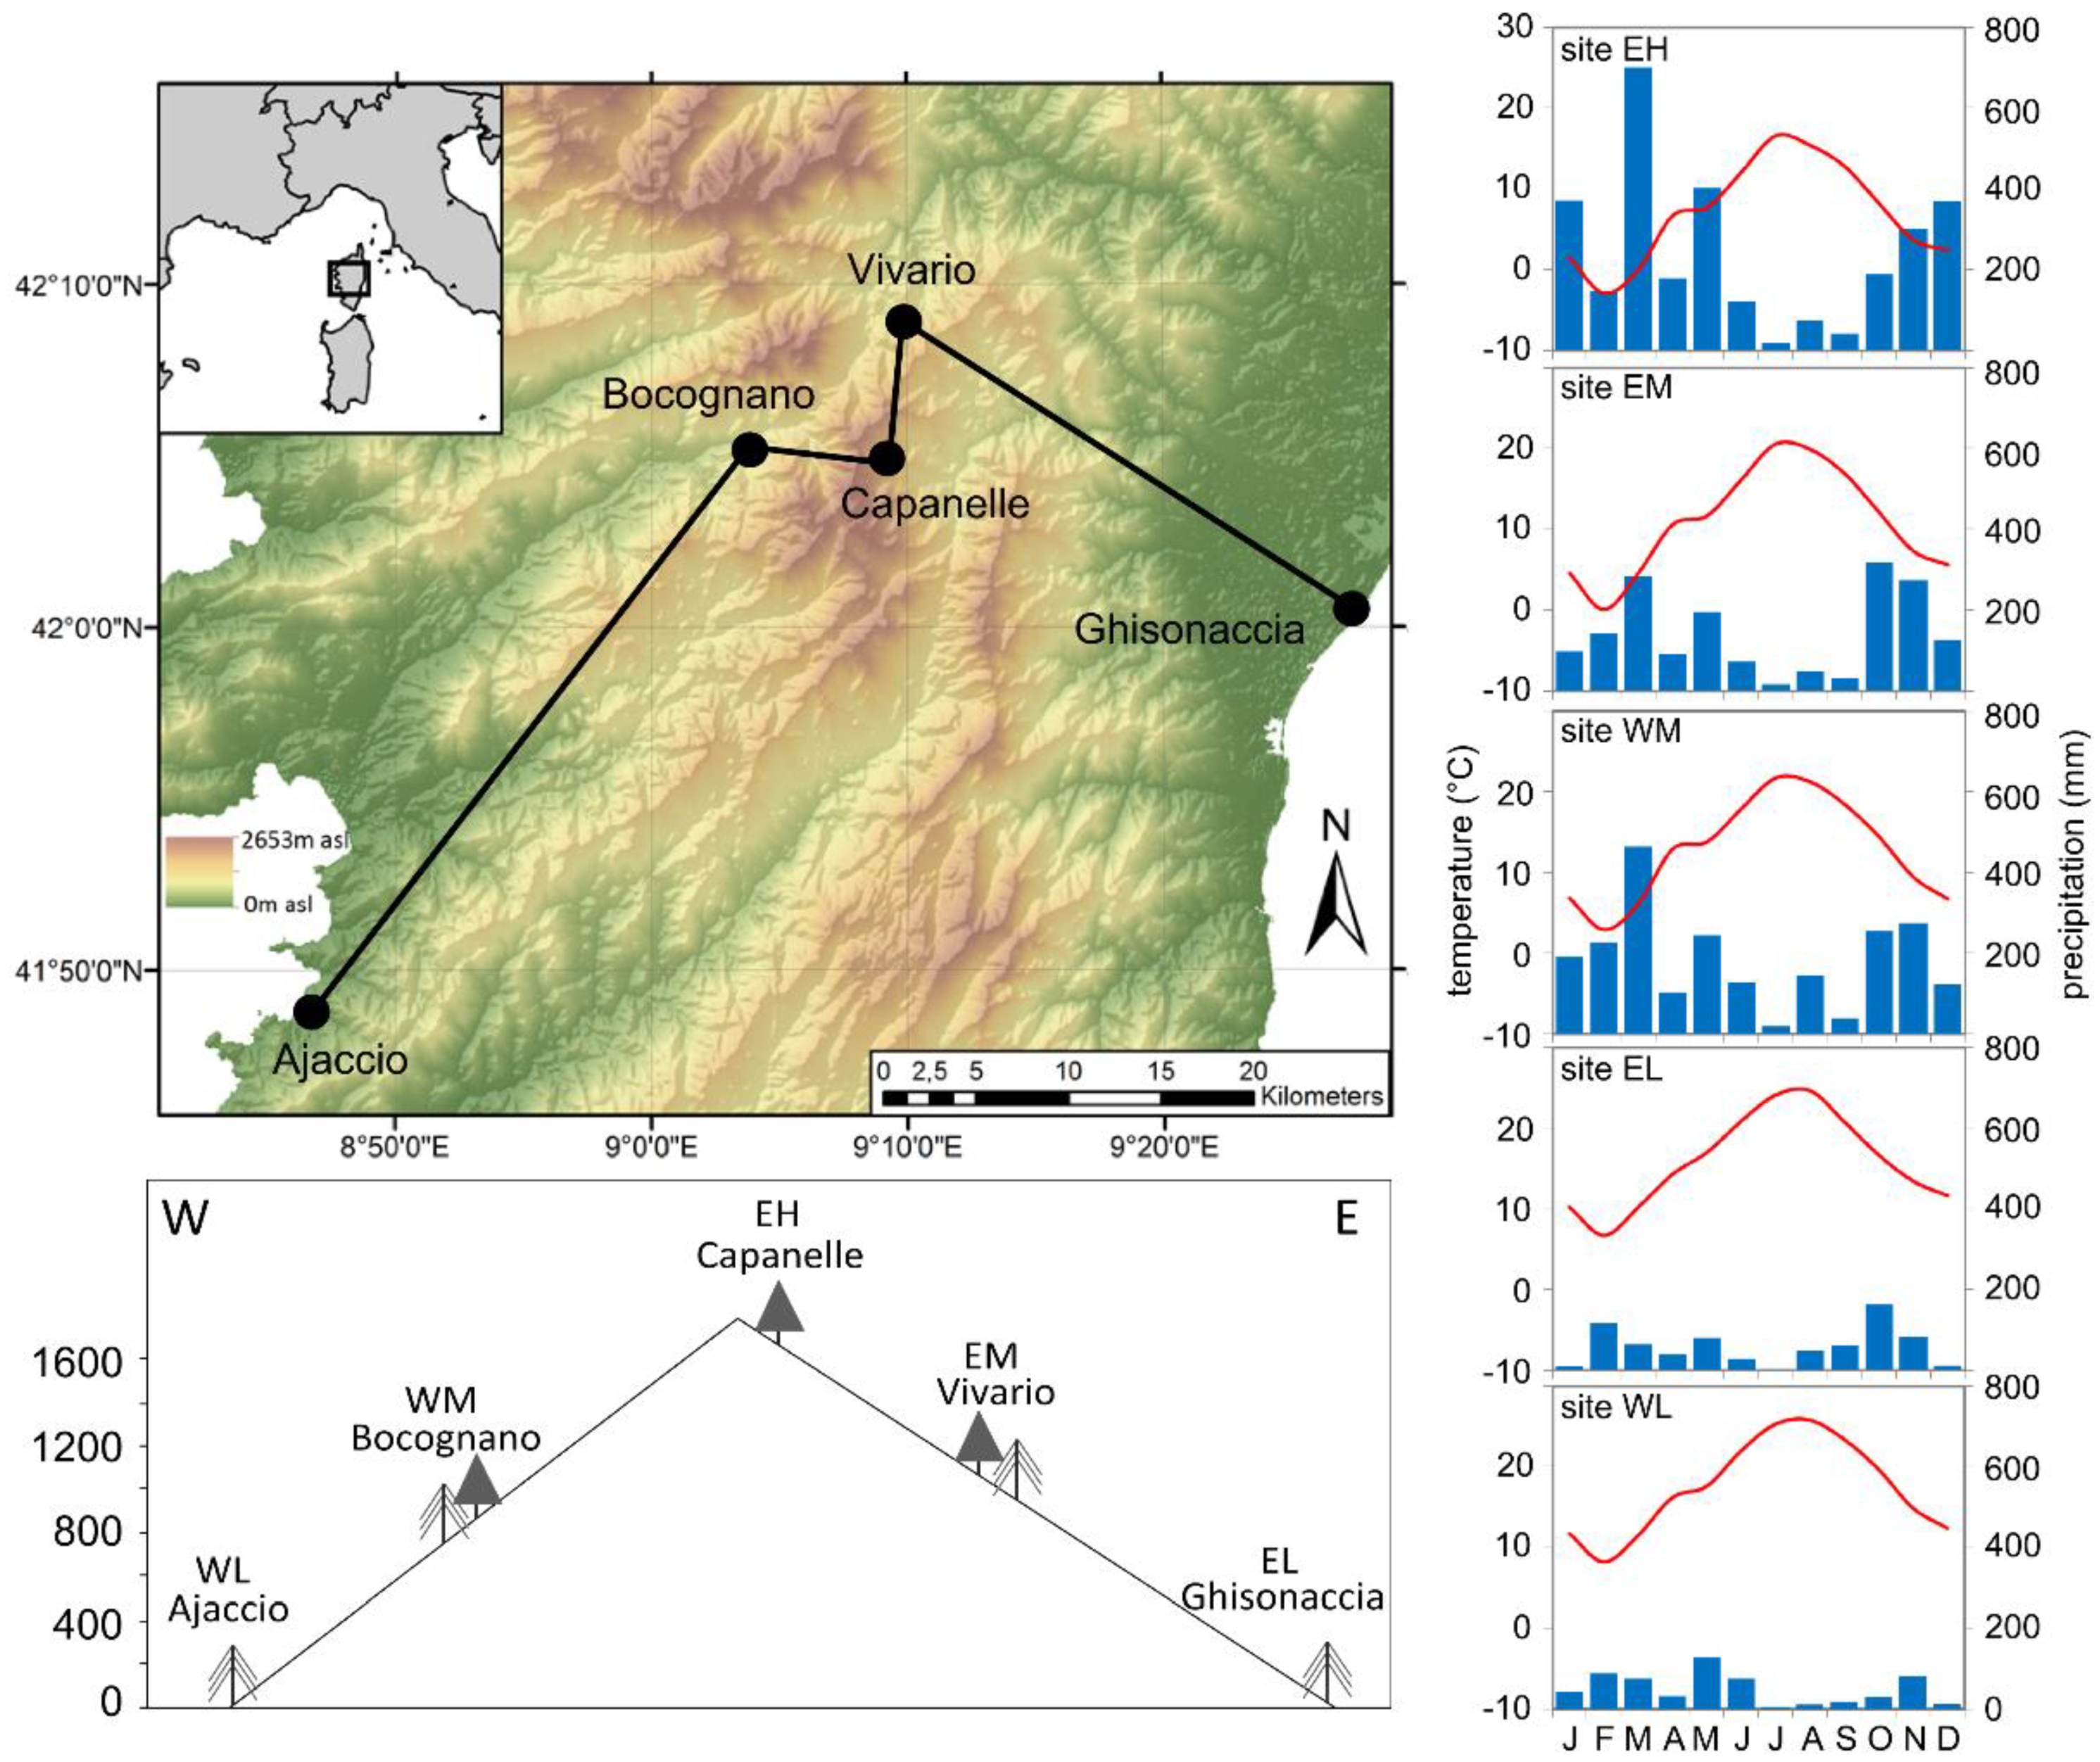
2.1. Study Sites

The mountainous island of Corsica (France) is located in the Western Mediterranean basin between 41–43°N and 8–10°E. It is characterized by a main mountain range extending in the north–south direction, with several peaks exceeding 2000 m above sea level (asl) (e.g., Mte. Cinto: 2706 m asl; Mte. Renoso: 2352 m asl). Due to steep elevation gradients, different microclimates are found, ranging from typical Mediterranean climates with dry hot summers and temperate wet winters close to sea level, to temperate and alpine conditions in the mountain areas, with a continuous winter snow cover above 1500 m asl [31].
Our five study sites are located along two elevation gradients from the Mediterranean coast to the high mountain zone along the western and eastern slopes of the Renoso Massif in central Corsica (Figure 1). For better readability, the study site IDs refer to the location of the sites, where “E” and “W” stands for “east” and “west”, and “L”, “M”, and “H” for “low”, “middle”, and “high” elevation. The two studied pine species, P. nigra and P. pinaster, are widely distributed on Corsica, however, none of the species covers the full range of our transect (0–1600 m asl). A comparison of the cumulative growth rates in the transitional elevation belt in which both species coexist revealed no significant differences between the species [32], making it possible to compare tree data derived from P. nigra with those derived from P. pinaster. Tree-ring width chronologies from two additional sites support the similarity between the growth pattern of both species in elevations between 570 and 1240 m asl (Supplementary Figure S1). All five sites were very similar in terms of acidic soils, the dominance of granites and metamorphic rocks in the underground, and an average tree coverage below 30%. The low-elevation sites Ajaccio (WL) and Ghisonaccia (EL) are small forest patches of pure P. pinaster stands close to the coastlines. While the west coast is characterized by a complex topography with cliffs and bays, the east coast around EL is a large alluvial plain with sandy beaches and lagoons. On these sandy alluvial deposits, the soils are well developed Cambisols (WL) and podzols (EL). The mid-elevation sites Bocognano (WM) and Vivario (EM) are located within the mountain forest belt at 790 (WM) and 1000 m asl (EM), respectively, where P. pinaster and P. nigra co-occur. Soils are Cambisols of varying depths on granitic bedrock. The high-elevation site Capanelle (EH) is located at the upper timberline on the eastern slopes of Monte Renoso. The site is located close to the crest line of the mountain chain and is affected by air masses from the east as well as from the west, so that this high elevation site is representative for both slopes of the transect. The open forest at site EH consists of old-grown P. nigra and Fagus sylvatica trees. The soil is a shallow podzolic Cambisol on granitic bedrock with low water-holding capacity.

2.2. Meteorological Data

All sites were equipped with automatic weather stations (Campbell Scientific stations at EH, EM, and WM; Metek at EL and WL), which measured air temperature, precipitation, wind speed and direction, relative humidity, global radiation, soil moisture, and soil temperature in high resolution (5 min for EH, EM, and WM and 1 min for EL and WL). Soil moisture was recorded with a Campbell CS650 sensor, placed horizontal at 5–10 cm depth. Due to the rocky terrain, it was not possible to measure soil parameters at site EH. Mean temperature decreases with altitude, however, the western coastal site is warmer than the eastern site (Figure 1). Precipitation shows a more diverse pattern (Figure 1). The highest site (EH) is the wettest site, but at mid-elevation, the western site is wetter than the eastern site, although site EM is located at slightly higher elevation than site WM. In contrast, the eastern coast is more humid than the western coast.
To investigate the effect of single precipitation events on tree growth, we extracted all precipitation events between 01 May 2017 and 30 April 2019 from the climate data, thus covering a period of two complete years. We restricted the analysis to precipitation events with a precipitation sum of more than 5 mm, since lower precipitation amounts do not penetrate deeply into the soils [35]. To separate discrete precipitation events, we chose a threshold of one hour without any precipitation, i.e., all precipitation recorded with interruptions of less than one hour was regarded as one precipitation event.
To analyze their impact on tree behavior, we extracted dry periods of at least seven consecutive days without precipitation. The analysis of dry periods was restricted to the time with tree growth at all sites (March–November), i.e., dry periods in winter DJF were excluded because trees at higher elevations are dormant during this period and hence are not expected to respond to moisture changes.

2.3. Dendrometer Data

At each study site, six trees of similar tree age and stem size per study species were equipped with logging band dendrometers with a built-in thermometer (DRL26, EMS Brno) in April 2017, resulting in a total number of 42 study trees (Table 1). Stem circumference was registered in 30-min intervals. To avoid damages by grazing cattle, the dendrometers were installed at a stem height of 2 m. Since Mediterranean pine species have a very thick bark for fire protection, we removed parts of the outer bark without injuring the cambial zone to minimize the influence of bark swelling and shrinking on the dendrometer data.
We analyzed the trees′ responses to precipitation events and dry periods at the site level, i.e., we aggregated the dendrometer data from the individual trees to a mean curve for each site. This eliminates possible disturbance effects of individual trees and provides a representative picture of the common climate response at a specific site. Stem circumference change (SCC) measured by dendrometers contains information about the irreversible stem expansion related to cambial growth and cell expansion, as well as the reversible tree water deficit-induced shrinking and swelling of the stem. To distinguish between SCC caused by growth and stem shrinking/swelling, we used the growth definition of Zweifel [20], who defined growth as a current stem radius value exceeding a precedent maximum. By using this definition, each value of the dendrometer data was classified into one of the three categories of growth, swelling, or shrinkage (Figure 2). Afterwards, we calculated SCC curves free from the growth component by subtracting the values of all changes classified as growth from the raw data, i.e., all values classified as growth were set to the level of the value prior to the growth. Both SCC curves, the raw dendrometer data and the growth-free curves, were used for analyzing the response to precipitation events and dry periods, in order to determine which portion of the detected tree response to climate can be attributed to growth.
For each precipitation event, we extracted the mean SCC for each site from the starting point of the event over the following 48 h. For analyzing effects of dry periods, we extracted the SCC from the first day without precipitation and the following 21 days. We defined this threshold because longer dry periods occurred only at three sites and only once or twice in the investigated time period. To compare the tree responses between sites, the dendrometer data were standardized to the starting point of the precipitation event/dry period. We additionally investigated SCC after precipitation events for different seasons and different precipitation amounts. The precipitation events were divided into six classes regarding their amount. As events with low rainfall totals were more common than events with high rainfall totals, the thresholds to separate rainfall totals were not chosen with regular intervals, i.e., the class with the lowest rainfall totals included 5–9.9 mm/event precipitation, and the following four classes each had an increment of 10 mm/event (10–19.9, 20–29.9 mm/event, etc.). The class with the highest precipitation amount included totals of 50–99.9 mm/event.

3. Results and Discussion

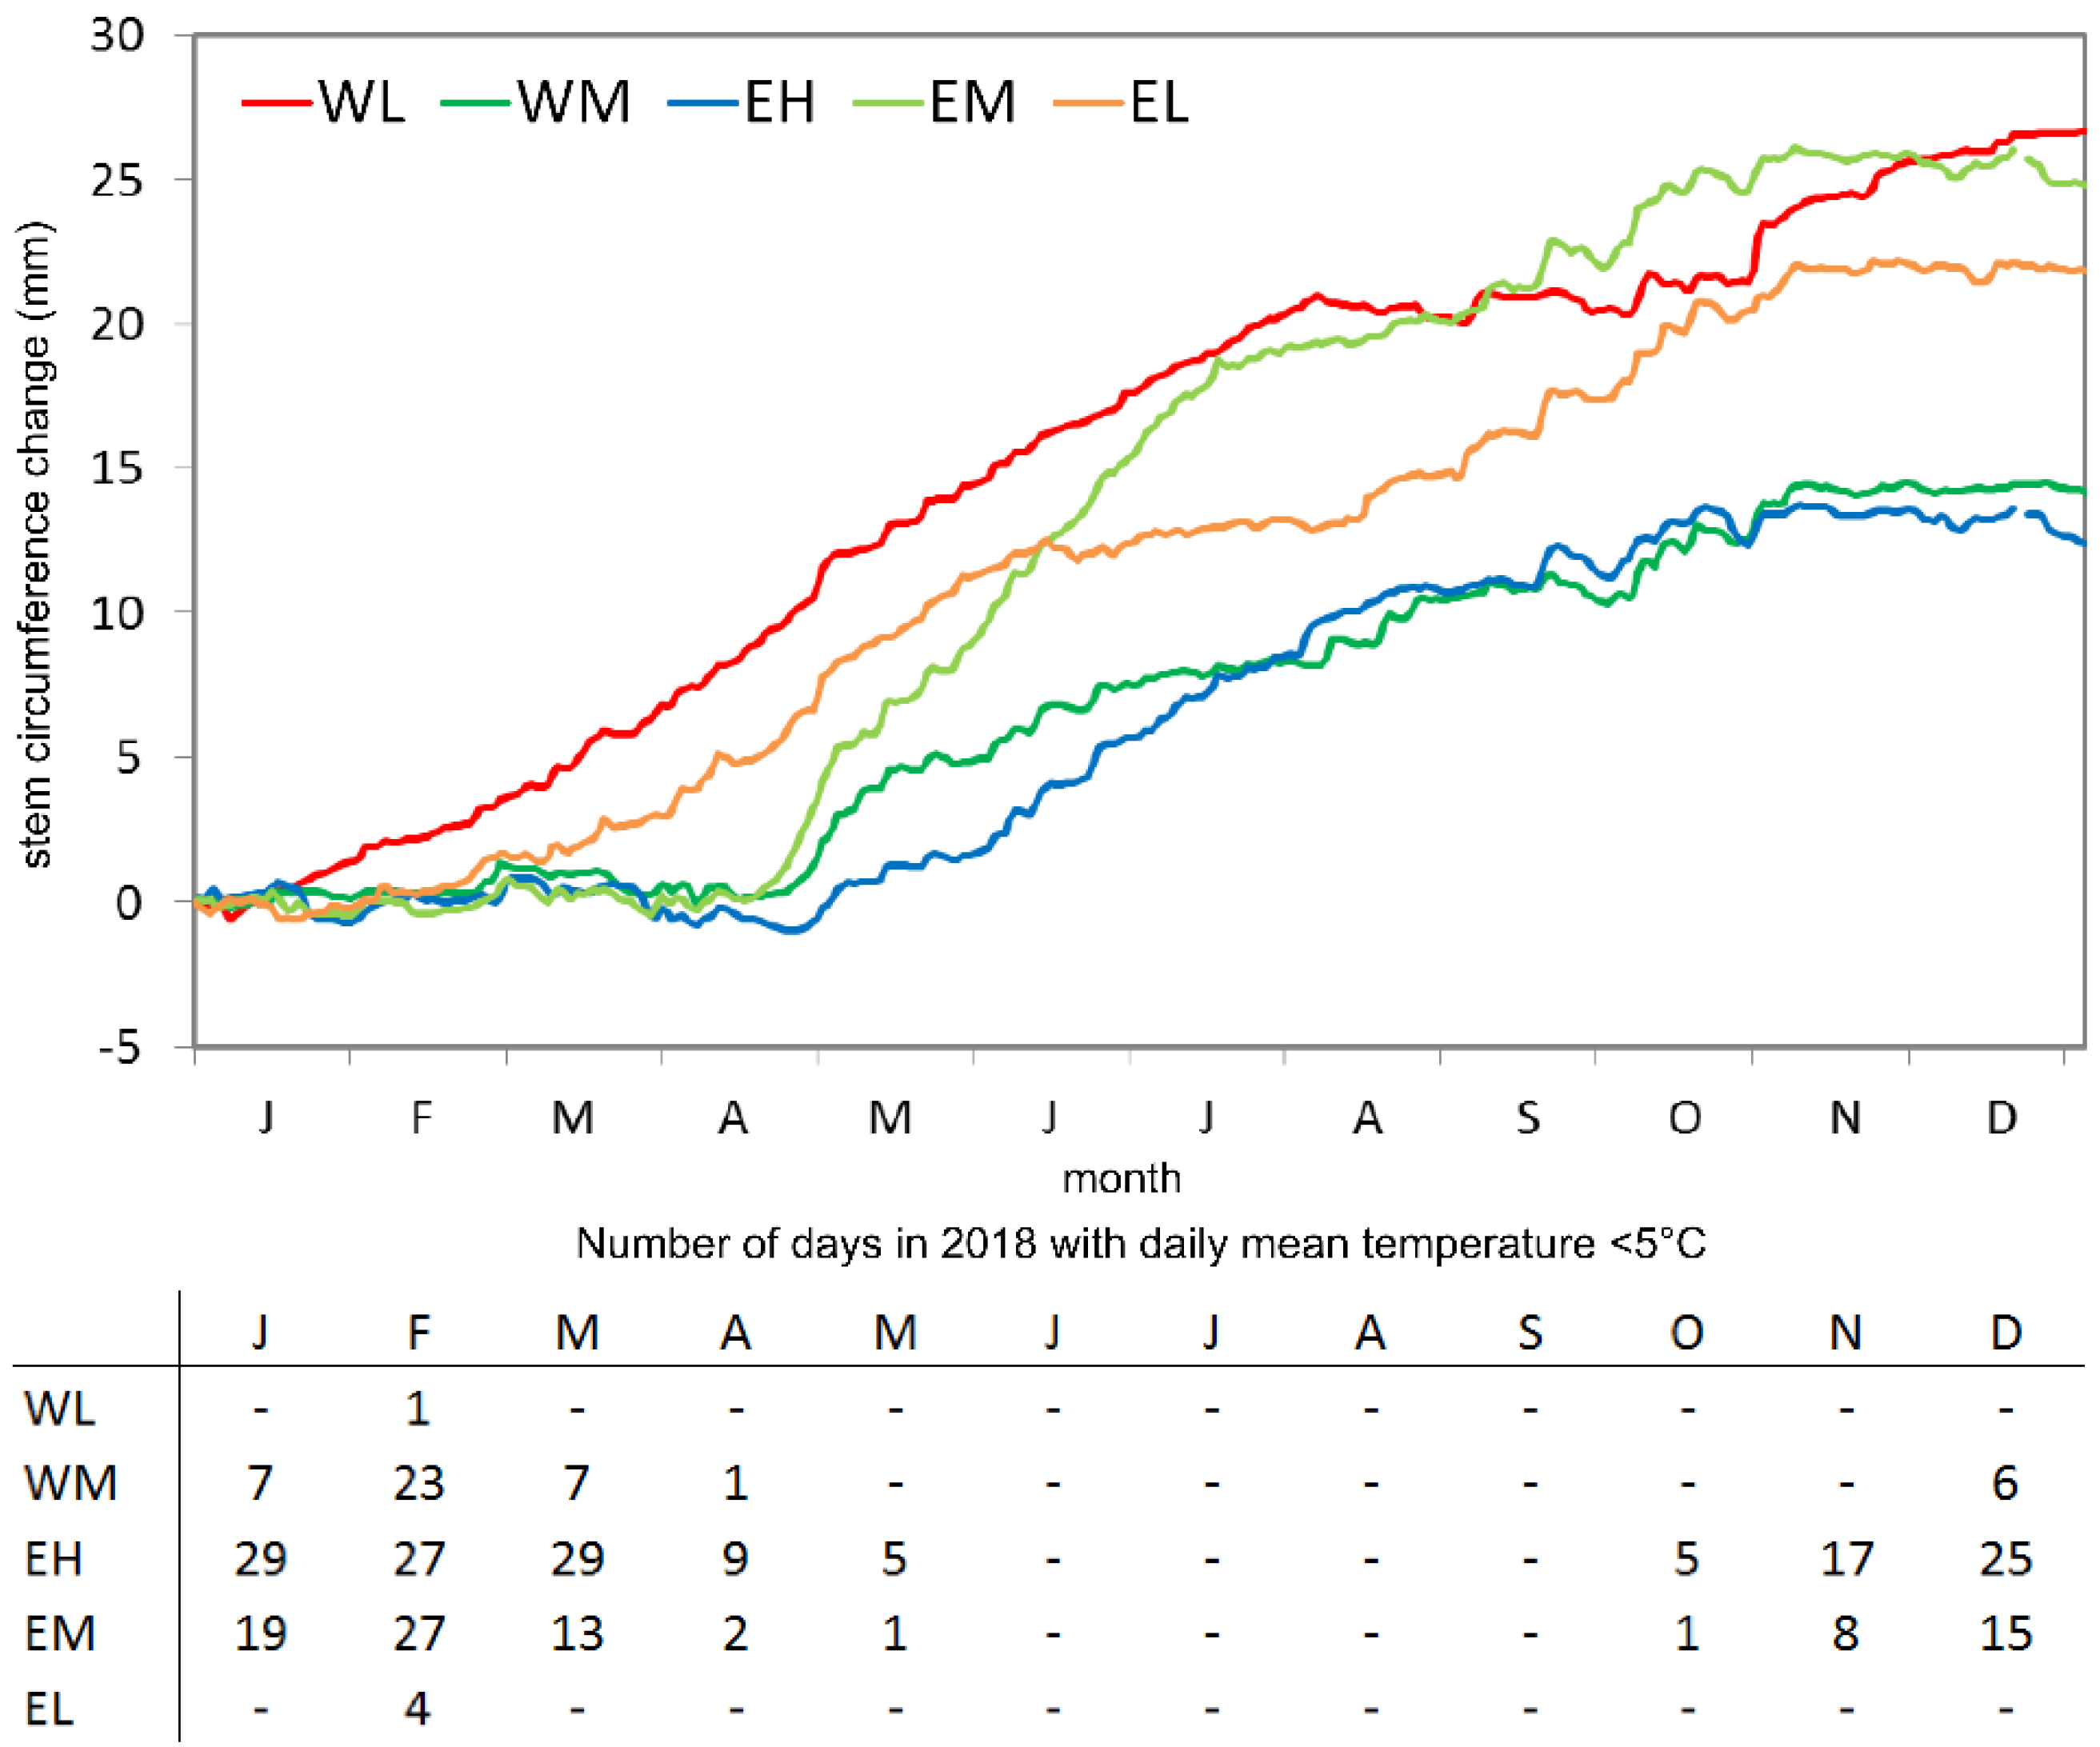
3.1. Site-Specific Stem Circumference Changes and Growing Periods

For the year 2018, the mean SCC curves from the coastal locations (EL and WL) can be clearly distinguished from the other sites by the much earlier start of the growing season, which did not begin before mid/end of April at mid- to high-elevation sites (Figure 3). A remarkable stem shrinkage is visible at site EH before the start of the growing season. The strong stem circumference increase in spring is followed by a decline in the growth rates in July. A second but less intense phase of increasing stem size occurred in October, followed by a cessation of stem diameter increment. The reduction in tree growth during summer did not occur simultaneously at all sites. The lowest cumulative increment sums occurred at sites EH and WM.
The dendrometer data revealed that at all sites except WL, longer periods without growth occurred during several months in autumn/winter. The length of this dormancy period depended on the elevation of the site. At site WL, it was not possible to determine a dormancy season in autumn/winter from the dendrometer data because radial growth showed only short interruptions. Instead, prolonged periods without growth occurred during summer. The shortest dormancy occurred at site EL (from December to February), and the longest at site EH (from October/November to mid-May). Dormancy lasted from November/December to April at site EM, and from January to April at site WM.
As the climatic conditions vary strongly along the studied elevation transect, we expected different growth patterns and durations of the growing season. Bud break and growth onset after winter dormancy are highly responsive to temperature in temperate and boreal trees, as well as at drought-prone sites [37,38,39,40]. Rossi et al. [41] defined a mean daily air temperature of 4–5 °C as a critical value to reactivate xylem cell production of conifers in cold environments. This critical temperature is exceeded earlier at lower sites, leading to an earlier start of the growing season. Temperatures are lower at site EL than at site WL (Figure 1), so that the critical temperatures occur only during few days during a year, or in the case of a mild winter, even not at all, so that no clear dormancy season occurred at site WL in 2018. For WL, the mean temperature in JFM (ND) 2018 was 10.8 °C (13.1 °C), with 1% (0%) of days below the critical value of 5 °C. While the onset of radial growth is controlled by air temperature, several factors can cause the termination of radial growth, e.g., soil water availability [37,40], site conditions, stand age, and tree density [42]. A bimodal stem radial growth pattern with two growth peaks in the transitional seasons (spring-early summer and autumn), and a decreased growth rate in summer as a strategy for coping with harsh environmental conditions in dry periods is a typical pattern observed in climates with summer drought [17,21,43]. The summer growth suppression can either be caused by water deficit or by high temperatures above a certain threshold, which lead to a reduction in net photosynthesis [43]. A bimodal growth pattern is visible at the coastal locations on Corsica. As shown for other conifer species in Mediterranean regions [43,44,45], trees at our study sites also have the capability to resume cambial activity after periods of minimum growth or dormancy during summer droughts.

3.2. Precipitation Events and Dry Periods

The number of identified precipitation events over the two-year observation period ranged from 25 (site WL) to 138 (site WM), with a significantly higher number of rainfall events at higher elevations (Table 2). The same trends were visible in the mean precipitation sums and mean duration of the events. At the higher sites, single precipitation events could last for two days (sites EM and WM) or even longer (site EH), while they were usually shorter than one day at the coastal locations. The precipitation events were unevenly distributed over the seasons. The lowest number of events occurred at all sites in JJA, the highest in either MAM, SON, or DJF. It should be kept in mind that the total number of precipitation events is underestimated at some stations due to data gaps, especially at the coastal locations. However, the observed trend (stronger precipitation events and a higher number of events with increasing elevation) is confirmed by long-term climate stations from MétéoFrance [31].
The number of dry periods was less variable between the sites and ranged from 14 (site EL) to 20 (site WM) (Table 2). The maximum duration of rainless periods was 62 days at site WL, followed by 33 days at site EM. Even at the wettest sites, 19 and 21 consecutive dry days occurred. Coastal sites showed the longest mean duration of dry periods. Except for site WL, dry periods were most common in JJA, but they occurred in all seasons. The low number of dry periods in JJA at site WL was caused by a long dry period in July–August 2017, which lasted for 62 consecutive days.
Precipitation on Corsica is very unevenly distributed throughout the year, with maximum precipitation rates in autumn/winter [31]. Single precipitation events can be followed by prolonged periods without any precipitation of up to more than one month at all sites, except WM and EH. As these periods occur mainly during the time of tree growth, it becomes obvious that the trees need to develop adaptation strategies to cope with drought stress related to this precipitation regime.

3.3. Tree Response to Precipitation Events

More than 50% of the stem circumference increase after precipitation events occurred within the first 12 h after the event (Figure 4). The strongest increase was found at the coastal locations and diminished with increasing elevation. The SCC increase was much steeper in the raw dendrometer data. The difference between the reaction including and excluding growth indicates that the response to precipitation events is a mixed effect of stem swelling and growth, with growth being the largest part at all sites (between around 60 and 80%), except EH (around 40%). The largest change within the 48 h after the event occurred at site EL, followed by WL and EM. The smallest stem increase after precipitation events occurred at the high-elevation site EH. Stem swelling followed immediately after the precipitation event, while stem increment due to growth extended over a longer time. This finding is in concordance with the soil water content (SWC), which increased mainly directly after the event. At all sites except WL, the standard deviation was remarkably reduced when growth was extracted from the raw dendrometer measurements.
Soil water content measurements were only available for four of the five sites (Figure 4). At EH, the stone content in the soil profile was too high for a correct measurement of the soil moisture. SWC at site WL is probably underestimated because the climate station was located on a nearly bare rocky surface, while the trees were located in a valley floor with a higher soil depth. All sites responded very quickly to precipitation events since measurements are obtained in a soil depth of 10–20 cm. The highest soil water content was reached three to twelve hours after the beginning of the precipitation event.
We observed a fast tree response to precipitation events at all five sites. The time lag between the beginning of the precipitation events and a visible response in the dendrometer data is very short, indicating a quick water uptake after an event. This is a faster response as found by [21], who suggested that replenishment of usable stem water reservoirs occurs within a few days after scattered rainfall events. They observed a stronger relationship between environmental variables and daily radial stem increments, when a time lag of one day was considered. The SCC increase in our study is a mixed effect of stem swelling and radial growth, with growth causing the larger part of the increase. The SCC increase due to growth is highest at the coastal locations, indicating that trees at coastal sites are more effective in using the water of precipitation events directly for growth. They are also more effective in using even small precipitation events.
Although trees at our sites grow under different climate conditions and show altitude-specific differences in the seasonal growth patterns, the response to precipitation events was very uniform among trees, sites, and did not vary with precipitation amounts. In the majority of cases (88%), SCC increased within 48 h after the onset of precipitation events. These similar responses are in concordance with the results of [46] and [22], who studied stem circumference changes of Picea abies and Cedrus libani along elevation gradients. Further, in the Italian Alps, positive responses of stem increment to precipitation were found [15]. In approximately 12% of events, we observed stem shrinkage following precipitation. This shrinkage occurred only at the higher sites and between December and April, i.e., during winter dormancy (Figure 3). A marked rehydration of the stem before the beginning of the growing season was observed in trees of cold environments [47,48] because water is withdrawn from the living cells to avoid frost-induced cavitation [25]. At sites EH and WM, temperatures commonly drop below zero between December and April.
On a seasonal basis, the SCC responses to precipitation events showed site-specific patterns (Figure 5). In summer (JJA), a pronounced bimodal to multimodal pattern was apparent, which was not or only weakly developed in other seasons. This diurnal cycle occurring with a temporal shift at site WL can be explained by the fact that only one precipitation event was recorded in JJA (Table 2). Since the values were standardized to the starting point of the precipitation event, a different starting time between events was responsible for the observed shift. SCC response including tree growth was highest in JJA and SON, and lowest in DJF. The steepest SCC increase directly following precipitation events was apparent in JJA, while the lowest SCC occurred in DJF at all sites. Only at site WL, the change in JJA was on a comparably low level. Except for JJA, EH showed the lowest stem diameter increase in all seasons. In all seasons, the response excluding growth was smaller than the reaction including growth, especially in JJA. Furthermore, the response was more homogenous among the sites, except in SON. Surprisingly, the strongest response occurred during SON at site WL. In all other seasons, the maximum increase was rarely above 0.2 mm.
The fluctuations of SCC over 48 h reflect the typical pattern of the daily stem cycle observed in dendrometer data by several authors [16,17,49]. The stem contracts during the day due to transpiration and photosynthesis and expands during the night as a result of replenishment of the stem internal water reserves. The amplitude of this daily cycle is most pronounced in summer as observed in alpine [15,16] as well as in Mediterranean environments [17] because the increased temperatures in combination with increased day length reduce the duration of the recovery phase, while increasing the water loss by transpiration [50].
The mean SCC curves after precipitation events classified by precipitation amount are shown in Figure 6. In the three classes with the lowest precipitation amounts per event (5–29.9 mm), site EH showed the smallest increase. In the two classes with the lowest precipitation amounts per event, both coastal locations showed a similar increase in the beginning, but their behavior diverged within the first day after the event. In contrast, in the following event class, site EL showed a much stronger SCC increase than site WL over the whole 48 h period. Site EM benefited more from precipitation events with high amounts (event class 50–99.9 mm) than sites EH and WM. The response after excluding growth was lower for all event classes. This was especially true for the two event classes of low amounts, indicating that even low precipitation events provide enough water for provoking a growth reaction.
It becomes apparent that the strongest SCC increase is not correlated with the highest precipitation amount. Large amounts of precipitation are more common during winter than during summer (Table 2) due to passages of frontal systems, i.e., the time where no or less growth occurs at the high-elevation sites. The response to events with a low amount of precipitation in summer is therefore superimposed by growth. Another reason is that events with high precipitation amounts often show high precipitation intensity, so we assume that a large part of the precipitation is lost by surface runoff and does not infiltrate into the soils. The correlation factors between precipitation and soil water content support this assumption, as they are rather weak, ranging between 0.32 at site EL and 0.47 at site WL. Additionally, these events often occur during phases with several rainfall events on consecutive days. Soils can already be water-saturated prior to the event and the stems are already replenished with water, so that additional rainfall does not trigger additional stem swelling. This stem internal water storage can provide a significant proportion of the total diurnal and even seasonal water used by a plant [50].

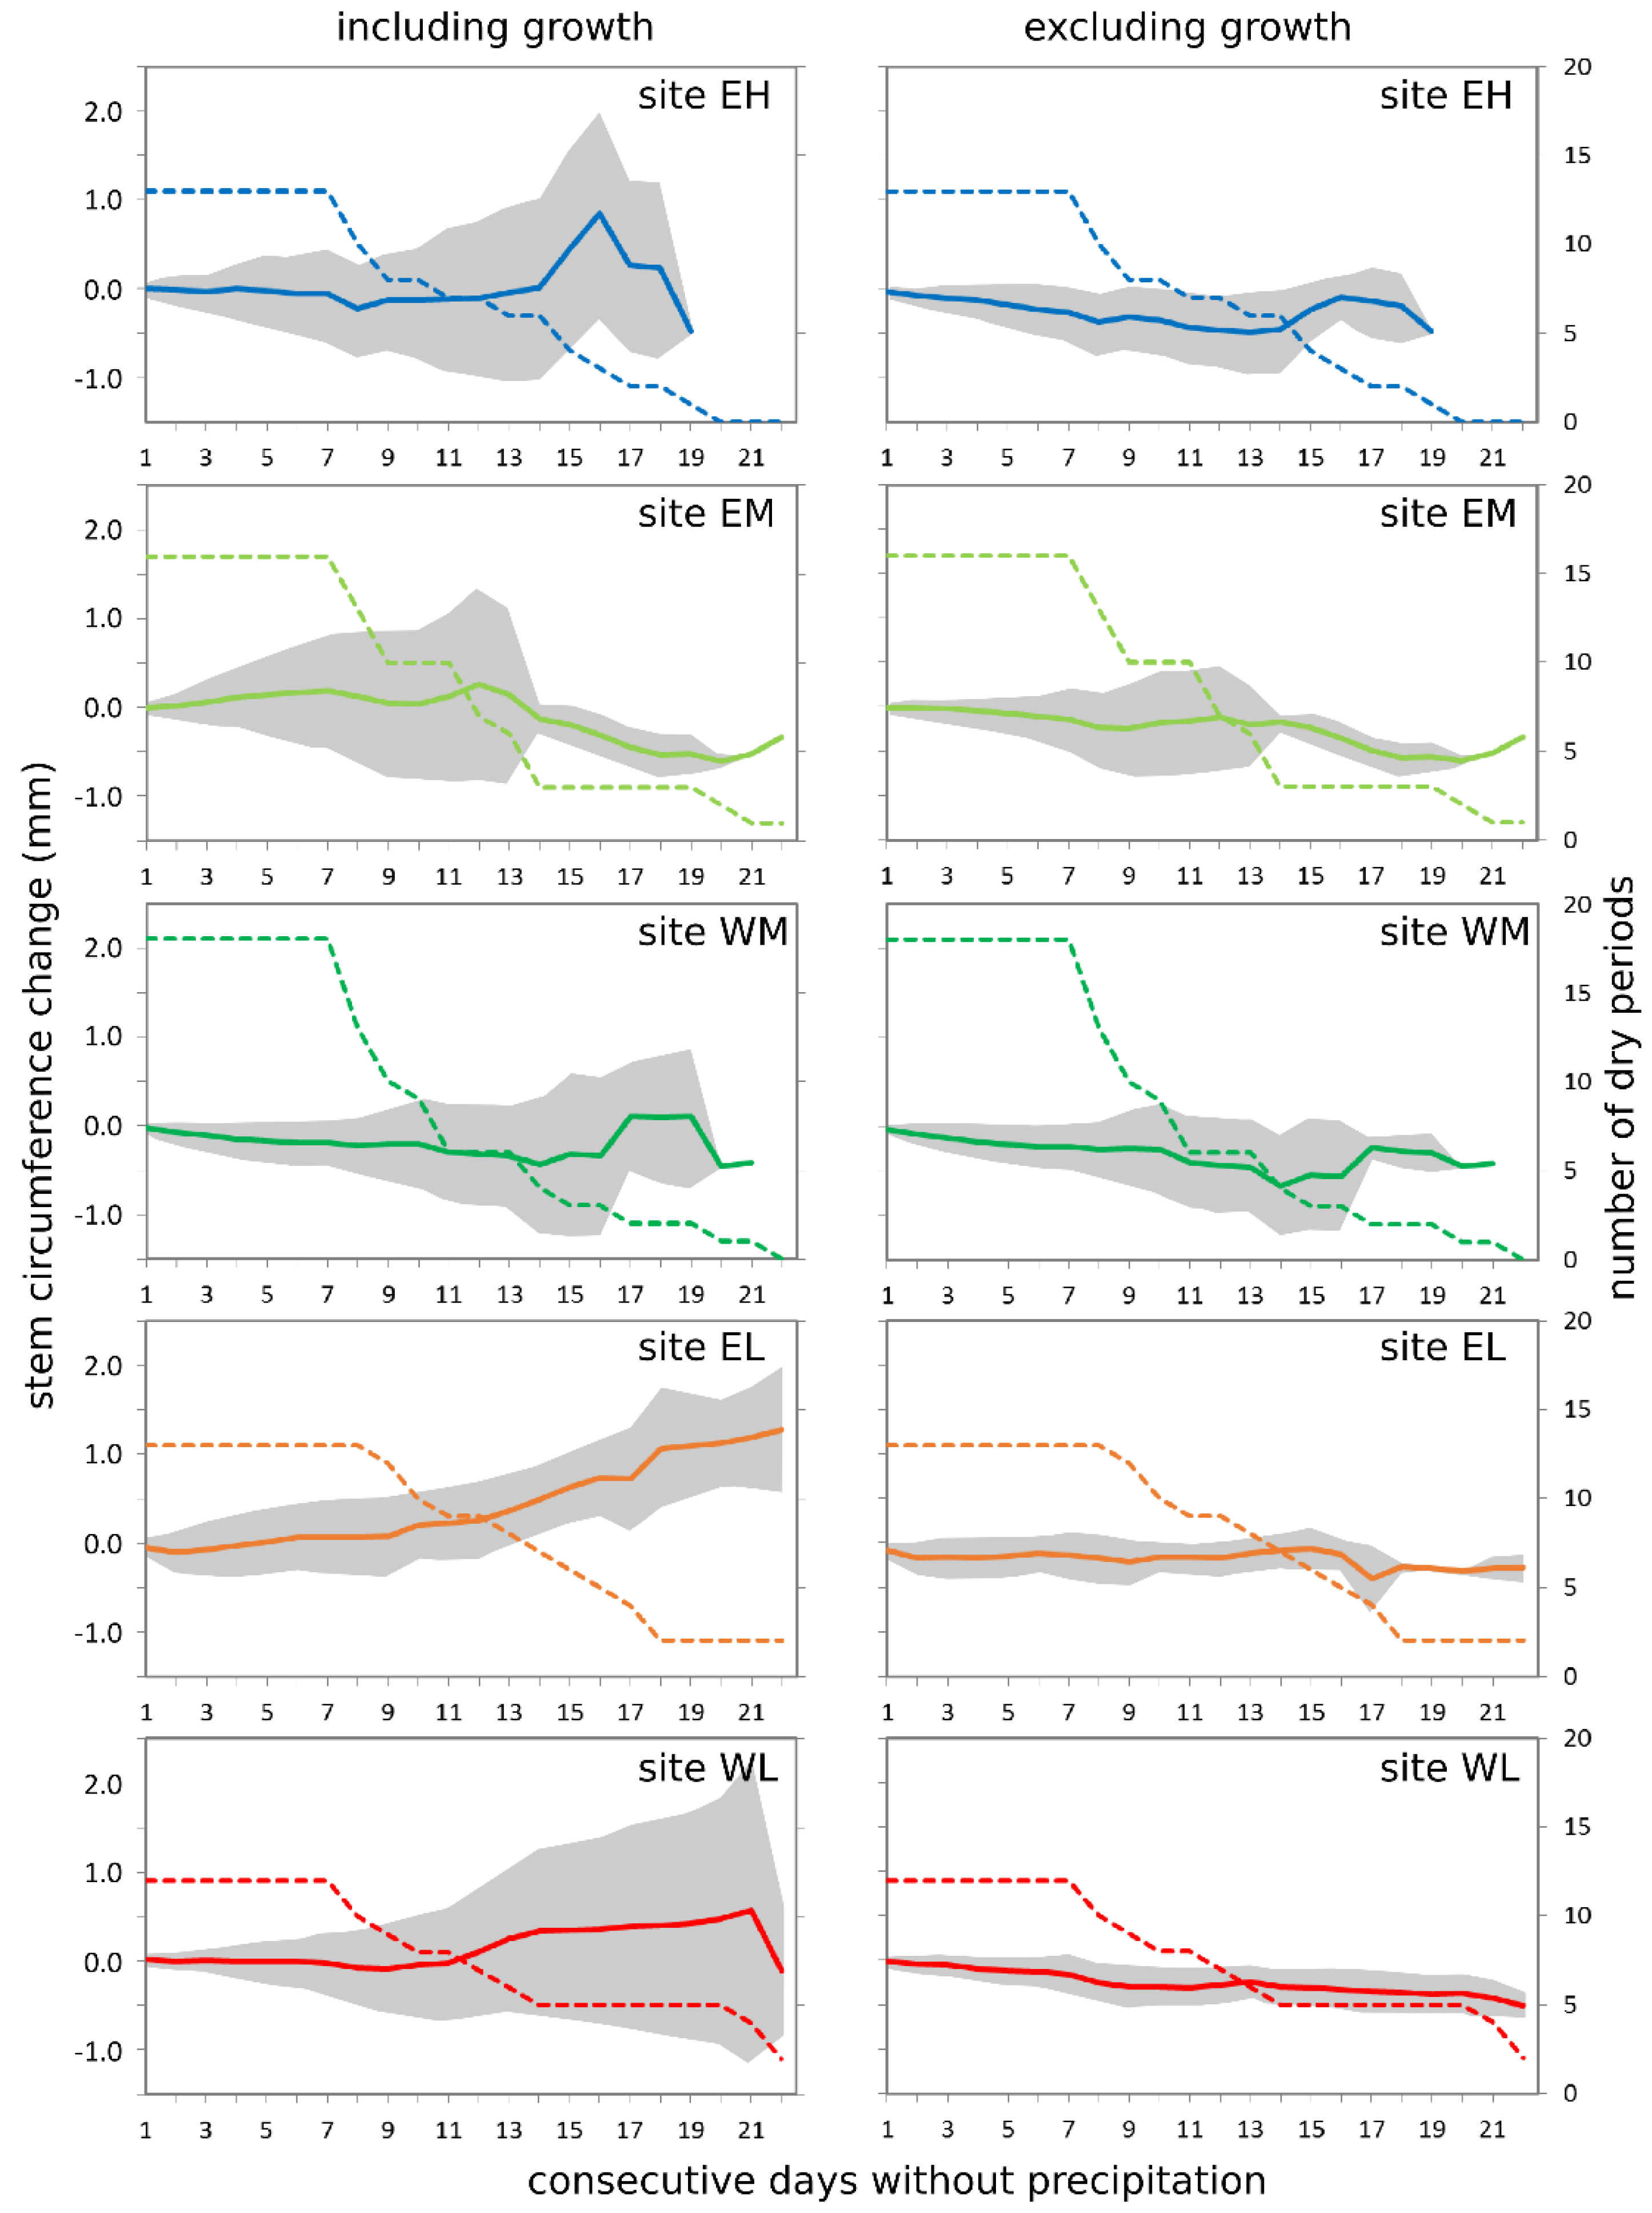
3.4. Tree Response to Dry Periods

The mean daily circumference changes during dry periods between 7 and 22 days are summarized in Figure 7. Dry periods longer than 11 days occurred more frequently at the coastal locations. In contrast to the rather homogenous response to precipitation events, the response to dry periods was site-specific, when considering raw dendrometer data including growth. Interestingly, sites EL and WL did not show any stem shrinkage, but instead an increase in stem circumference. The same was found at site EM, but less pronounced and only during the first seven dry days. In contrast, sites EH and WM showed a shrinkage, which was most severe at site WM. The steep increase in the later days was caused by the lower number of events, however, it indicated that growth occurred at least during single dry periods. After excluding tree growth from the data, the response to dry periods became more uniform among the sites. All sites showed a decreasing trend during the first days of the dry periods. The standard deviation was remarkably reduced when growth was extracted from the curves, especially at the coastal sites.
The continuous stem circumference increases over consecutive dry days at sites WL, EL, and EM could be attributed to cambial growth because the trend disappeared after eliminating growth from the dendrometer data. An enlargement of freshly formed tracheids even during an extended period of drought was also observed by [21], suggesting that conifers can draw upon water reserves stored in sapwood and bark [51,52], more so at dry than at moist sites [13].
Another important factor influencing SCC during dry periods is soil water availability. The water-holding capacity of the soils differs among our study sites. The coastal sites are located in flat areas, where water can be stored after precipitation events. Additionally, soils at site WL can be affected by a small episodic creek, so water from precipitation events in the hilly surrounding becomes available for the trees. At the mid-elevation sites (EM and WM), soil conditions and hence water availability are different. At site EM, the soil is deeper and has a higher water-holding capacity, so water from single precipitation events is longer available. At site WM, the shape of the SWC curve (Figure 4) indicates that most of the precipitation is lost via surface runoff because SWC shows an earlier peak and a faster decrease after the beginning of a precipitation event compared with sites EL and EM. Therefore, although site WM is generally more humid than site EM, only a smaller amount of water from each precipitation event becomes available for the trees. The inferences about water availability derived from dendrometer data are corroborated by oxygen-stable isotope data derived from needle water, stem water, and precipitation from the same sites [53]. Sites EH and WM have limited or no access to deeper soil water, while the other three sites have access to deeper soil water and/or groundwater. P. pinaster is not a Mediterranean floral element in the strict sense, as it needs a certain air humidity and summer precipitation amounts of at least 100 mm [54]. The summer precipitation amount at our sites is lower than 100 mm, hence the vitality of P. pinaster at our coastal study sites indicates that these trees have access to deeper soil water or ground water pools, which are refilled in autumn/winter.

4. Conclusions

Dendrometers are suitable for studying the response of individual trees to weather (extreme) events. Analyzing the response to single precipitation events instead of comparing standard parameters like tree-ring width with seasonal or annual total precipitation is a promising approach to better understand the linkage of tree growth and tree physiological processes to environmental conditions on short timescales with a high temporal resolution. These studies can improve forecasts of tree growth under changing climate conditions, thus providing scenarios of future forest productivity, ecosystem functioning, and tree mortality risk, which are valuable sources of information to make forest management decisions on climate-adapted tree species composition.
In our study, we observed different adaptation strategies of pine trees to deal with the Mediterranean precipitation regime, including a bimodal growth pattern, the use of deeper water sources, and the capability to take up water quickly in the case of moisture availability. The different response to dry phases and precipitation events indicates that the water transfer in pine trees on Corsica is very complex. At sites with deeper soils, trees can use deeper soil water sources under unfavorable rainfall conditions. Thus, trees at sites with soils of low water-holding capacity are most vulnerable to dry periods.
At the ecosystem level, our results can help to improve models of the future distribution of P. nigra and P. pinaster along humidity gradients. P. nigra is the more water-demanding species, so declining water availability may reduce its potential distribution range. This can have serious impacts on silvicultural activities on Corsica as there is a high demand for P. nigra wood.

Supplementary Materials

The following figure is available online at https://www.mdpi.com/1999-4907/11/7/758/s1, Figure S1: Comparison of tree-ring width chronologies of Pinus nigra and Pinus pinaster at four study sites located between 570 and 1240 m asl.

Author Contributions

Conceptualization, S.S. (Sonja Szymczak) and A.B.; methodology, S.S. (Sonja Szymczak), M.H. and A.B.; formal analysis, S.S. (Sonja Szymczak) and M.H.; investigation, S.S. (Sonja Szymczak); writing—original draft preparation, S.S. (Sonja Szymczak); writing—review and editing, S.S. (Sonja Szymczak), M.H., E.G., S.S. (Sébastien Santoni), F.H., A.B., I.K., K.T., J.B.; visualization, S.S. (Sonja Szymczak) and M.H.; All authors have read and agreed to the published version of the manuscript.

Funding

This research was funded by the German Research Foundation (DFG) (grant numbers BE 1780/45-1, BR 1895/27-1, SZ 356/1-1 and TR 1201/2-1) in the scope of the interdisciplinary research program CorsicArchive (Altitudinal Gradients and Forest Response: Climate, Hydrology and Isotope Variability of a Mediterranean Ecosystem) DFG-PAK 927/1.

Acknowledgments

We are thankful to the whole CorsicArchive team for sampling and field support.

Conflicts of Interest

The authors declare no conflict of interest.

References

  1. Meinzer, F.C.; Brooks, J.R.; Gartner, B.L.; Warren, J.M.; Wodruff, D.R.; Bible, K.; Shaw, D.C. Dynamics of water transport and storage in conifers studied with deuterium and heat tracing techniques. Plant Cell Environ. 2006, 29, 105–114. [Google Scholar] [CrossRef] [PubMed] [Green Version]
  2. Battipaglia, G.; DeMicco, V.; Brand, W.A.; Saurer, M.; Aronne, G.; Linke, P.; Cherubini, P. Drought impact on water use efficiency and intra-annual density fluctuations in Erica arborea on Elba (Italy). Plant Cell Environ. 2013, 37, 382–391. [Google Scholar] [CrossRef] [Green Version]
  3. Anderegg, W.R.L.; Flint, A.; Huang, C.-Y.; Flint, L.; Berry, J.A.; Davis, F.W.; Sperry, J.S.; Field, C.B. Tree mortality predicted from drought-induced vascular damage. Nat. Geosci. 2015. [Google Scholar] [CrossRef] [Green Version]
  4. Hember, R.A.; Kurz, W.A.; Coops, N.C. Relationships between the individual-tree mortality and water-balance variables indicate positive trends in water stress-induced tree mortality across North America. Glob. Chang. Biol. 2017, 23, 1691–1710. [Google Scholar] [CrossRef] [PubMed]
  5. Choat, B.; Brodribb, T.J.; Brodersen, C.R.; Duursma, R.A.; López, R.; Medlyn, B.E. Triggers of tree mortality under drought. Nature 2018, 558, 531–539. [Google Scholar] [CrossRef]
  6. Schäfer, C.; Rötzer, T.; Thurm, E.A.; Biber, P.; Kallenbach, C.; Pretzsch, H. Growth and tree water deficit of mixed Norway spruce and European beech at different heights in a tree and under heavy drought. Forests 2019, 10, 577. [Google Scholar] [CrossRef] [Green Version]
  7. Steudle, E. Water uptake by roots: Effects of water deficit. J. Exp. Bot. 2000, 51, 1531–1542. [Google Scholar] [CrossRef] [Green Version]
  8. Jackson, R.; Moore, L.; Hoffmann, W.; Pockman, W.; Linder, C. Ecosystem rooting depth determined with caves and DNA. Proc. Natl. Acad. Sci. USA 1999, 96, 11387–11392. [Google Scholar] [CrossRef] [Green Version]
  9. Ogle, K.; Reynolds, J.F. Plant responses to precipitation in desert ecosystems: Integrating functional types, pulses, thresholds, and delays. Oecologia 2004, 141, 282–294. [Google Scholar] [CrossRef] [PubMed]
  10. Eggemeyer, K.D.; Awada, T.; Harvey, F.E.; Wedin, D.A.; Zhou, X.; Zanner, C.W. Seasonal changes in depth of water uptake for encroaching trees Juniperus virginiana and Pinus ponderosa and two dominant C4 grasses in a semiarid grassland. Tree Physiol. 2009, 29, 157–169. [Google Scholar] [CrossRef]
  11. Reynolds, J.F.; Virginia, R.A.; Kemp, P.R.; de Soyza, A.G.; Tremmel, D.C. Impact of drought on desert shrubs: Effects of seasonality and degree of resource island development. Ecol. Monogr. 1999, 69, 69–106. [Google Scholar] [CrossRef]
  12. Gebauer, R.L.W.; Ehleringer, J.R. Water and nitrogen uptake patterns following moisture pulses in a cold desert community. Ecology 2000, 81, 1415–1424. [Google Scholar] [CrossRef]
  13. Zweifel, R.; Zimmermann, L.; Newbery, D.M. Modeling tree water deficit from microclimate: An approach to quantifying drought stress. Tree Physiol. 2005, 25, 147–156. [Google Scholar] [CrossRef] [PubMed] [Green Version]
  14. Mencuccini, M.; Hölttä, T.; Sevanto, S.; Nikinmaa, E. Concurrent measurements of change in the bark and xylem diameters of trees reveal a phloem-generated turgor signal. New Phytol. 2013, 198, 1143–1154. [Google Scholar] [CrossRef]
  15. Deslauriers, A.; Rossi, S.; Anfodillo, T. Dendrometer and intra-annual tree growth: What kind of information can be inferred? Dendrochronologia 2007, 25, 113–124. [Google Scholar] [CrossRef] [Green Version]
  16. King, G.; Fonti, P.; Nievergelt, D.; Büntgen, U.; Frank, D. Climatic drivers of hourly to yearly tree radius variations along a 6 °C natural warming gradient. Agric. Meteorol. 2013, 168, 36–46. [Google Scholar] [CrossRef]
  17. Vieira, J.; Rossi, S.; Campelo, F.; Freitas, H.; Nabais, C. Sesaonal and daily cycles of stem radial variation of Pinus pinaster in a drought-prone environment. Agric. Meteorol. 2013, 180, 173–181. [Google Scholar] [CrossRef] [Green Version]
  18. Siegmund, J.F.; Sanders, T.G.M.; Heinrich, I.; van der Maaten, E.; Simard, S.; Helle, G.; Donner, R.V. Meteorological drivers of extremes in daily stem radius variations of beech, oak, and pine in northeastern Germany: An event coincidence analysis. Front. Plant Sci. 2016, 7, 733. [Google Scholar] [CrossRef] [Green Version]
  19. Raffelsbauer, V.; Spannl, S.; Pena, K.; Pucha-Cofrep, D.; Steppe, K.; Bräuning, A. Tree circumference changes and species-specific growth recovery after extreme dry events in a montane rainforest in southern Ecuador. Front. Plant Sci. 2019, 10. [Google Scholar] [CrossRef]
  20. Zweifel, R. Radial stem variations—A source of tree physiological information not fully exploited yet. Plant Cell Environ. 2016, 39, 231–232. [Google Scholar] [CrossRef]
  21. Oberhuber, W.; Gruber, A.; Kofler, W.; Swirdak, I. Radial stem growth in response to microclimate and soil moisture in a drought-prone mixed coniferous forest at an inner Alpine site. Eur. J. Res. 2014, 133, 467–479. [Google Scholar] [CrossRef] [PubMed] [Green Version]
  22. Güney, A.; Gülsoy, S.; Sentürk, Ö.; Niessner, A.; Küppers, M. Environmental control of daily stem radius increment in the montane conifer Cedrus libani. J. Res. 2019. [Google Scholar] [CrossRef] [Green Version]
  23. Chan, T.; Hölttä, T.; Berninger, F.; Mäkinen, H.; Nöjd, P.; Mencuccini, M.; Nikinmaa, E. Separating water-potential induced swelling and shrinking from measured radial stem variations reveals a cambial growth and osmotic concentration signal. Plant Cell Environ. 2016, 39, 233–244. [Google Scholar] [CrossRef] [Green Version]
  24. Mencuccini, M.; Salmon, Y.; Mitchell, P.; Hölttä, T.; Choat, B.; Meir, P.; O’Grady, A.; Tissue, D.; Zweifel, R.; Sevanto, S.; et al. An empirical method that separates irreversible stem radial growth from bark water content changes in trees: Theory and case studies. Plant Cell Environ. 2017, 40, 290–303. [Google Scholar] [CrossRef] [PubMed]
  25. Zweifel, R.; Häsler, R. Dynamics of water storage in mature subalpine Picea abies: Temporal and spatial patterns of change in stem radius. Tree Physiol. 2001, 21, 561–569. [Google Scholar] [CrossRef] [Green Version]
  26. Noy-Meir, I. Desert ecosystems: Environment and producers. Annu. Rev. Ecol. Syst. 1973, 4, 25–51. [Google Scholar] [CrossRef]
  27. Barnard, R.L.; Salmon, Y.; Kodama, N.; Sörgel, K.; Holst, J.; Rennenberg, H.; Gessler, A.; Buchmann, N. Evaporative enrichment and time lags between δ18O of leaf water and organic pools in a pine stand. Plant Cell Environ. 2007, 30, 539–550. [Google Scholar] [CrossRef] [PubMed]
  28. Brandes, E.; Wenninger, J.; Koeninger, P.; Schindler, D.; Rennenberg, H.; Leibundgut, C.; Mayer, H.; Gessler, A. Assessing environmental and physiological controls over water relations in a Scots pine (Pinus sylvestris L.) stand through analyses of stable isotope composition of water and organic matter. Plant Cell Environ. 2007, 30, 113–127. [Google Scholar] [CrossRef]
  29. Vicente-Serrano, S.M.; Gouveia, C.; Camarero, J.J.; Beguería, S.; Trigo, R.; López-Moreno, J.L.; Azorín-Molina, C.; Pasho, E.; Lorenzo-Lacruz, J.; Revuelto, J.; et al. Response of vegetation to drought time-scales across global land biomes. Proc. Natl. Acad. Sci. USA 2013, 110, 52–57. [Google Scholar] [CrossRef] [Green Version]
  30. Wu, D.H.; Zhao, X.; Liang, S.L.; Zhou, T.; Huang, K.C.; Tang, B.J.; Zhao, W.Q. Time-lag effects of global vegetation responses to climate change. Glob. Chang. Biol. 2015, 21, 3520–3531. [Google Scholar] [CrossRef]
  31. Bruno, C.; Dupre, G.; Giorgetti, G.; Borne, D. Chì Tempu Face? Météorologie, Climat et Microclimats de la Corse; CNDP-CRDP de Corse/MétéoFrance: Ajaccio, France, 2001. [Google Scholar]
  32. Häusser, M.; Szymczak, S.; Garel, E.; Santoni, S.; Huneau, F.; Bräuning, A. Growth variability of two native pine species on Corsica as a function of altitude. Dendrochronologia 2019, 54, 49–55. [Google Scholar] [CrossRef]
  33. Shuttle Radar Topography Mission of the United States Geological Survey. Available online: https://lta.cr.usgs.gov/SRTM/ (accessed on 15 January 2018).
  34. MétéoFrance. Climate Data from Stations Ajaccio, Bocognano, Evisa, Sampolo and Solenzara. Available online: https://www.meteofrance.fr (accessed on 20 May 2020).
  35. Cheng, X.L.; An, S.Q.; Li, B.; Chen, J.Q.; Lin, G.H.; Liu, Y.H.; Luo, Y.; Liu, S. Summer rain pulse size and rainwater uptake by three dominant desert plants in a desertified grassland ecosystem in northwestern China. Plant Ecol. 2006, 184, 1–12. [Google Scholar] [CrossRef]
  36. Aryal, S.; Häusser, M.; Grießinger, J.; Fan, Z.-X.; Bräuning, A. DendRoAnalyst: A Complete Tool for Processing and Analyzing Dendrometer Data. R Package Version 0.1.0. 2020. Available online: https://CRAN.R-project.org/package=dendRoAnalyst (accessed on 7 May 2020).
  37. Thabeet, A.; Vennetier, M.; Gadbin-Henry, C.; Denelle, N.; Roux, M.; Caraglio, Y.; Vila, B. Response of Pinus sylvestris L. to recent climatic events in the French Mediterranean region. Trees 2009, 23, 843–853. [Google Scholar] [CrossRef] [Green Version]
  38. Hänninen, H.; Tannino, K. Tree seasonality in a warming climate. Trends Plant. Sci. 2011, 16, 412–416. [Google Scholar] [CrossRef]
  39. Rossi, S.; Morin, H.; Deslauriers, A.; Plourde, P.Y. Predicting xylem phenology in black spruce under climate warming. Glob. Chang. Biol. 2011, 17, 614–625. [Google Scholar] [CrossRef]
  40. Swidrak, I.; Gruber, A.; Kofler, W.; Oberhuber, W. Effects of environmental conditions on onset of xylem growth in Pinus sylvestris under drought. Tree Physiol. 2011, 31, 483–493. [Google Scholar] [CrossRef] [Green Version]
  41. Rossi, S.; Deslauriers, A.; Gricar, J.; Seo, J.-W.; Rathgeber, C.B.K.; Anfodillo, T.; Morin, H.; Levanic, T.; Oven, P.; Jalkanen, R. Critical temperatures for xylogenesis in conifers of cold climates. Glob. Ecol. Biogeogr. 2008, 17, 696–707. [Google Scholar] [CrossRef]
  42. Güney, A.; Kerr, D.; Sökücü, A.; Zimmermann, R.; Küppers, M. Cambial activity and xylogenesis in stems of Cedrus libani A. Rich at different altitudes. Bot. Stud. 2015. [Google Scholar] [CrossRef]
  43. Liu, X.; Nie, Y.; Wen, F. Seasonal dynamics of stem radial increment of Pinus taiwanensis Hayata and its response to environmental factors in the Lushan mountains, southeastern China. Forests 2018, 9, 387. [Google Scholar] [CrossRef] [Green Version]
  44. De Luis, M.; Gričar, J.; Čufar, K.; Raventós, J. Sesaonal dynamics of wood formation in Pinus halepensis from dry and semi-arid ecosystems in Spain. IAWA J. 2007, 28, 389–404. [Google Scholar] [CrossRef] [Green Version]
  45. Camarero, J.J.; Olano, J.M.; Parras, A. Plastic bimodal xylogenesis in conifers from continental Mediterranean climates. New Phytol. 2010, 185, 471–480. [Google Scholar] [CrossRef] [PubMed]
  46. Cocozza, C.; Palombo, C.; Tognetti, R.; La Porta, N.; Anichini, M.; Giovannelli, A.; Emiliani, G. Monitoring intra-annual dynamics of wood formation with microcores and dendrometers in Picea abies at two different altitudes. Tree Physiol. 2016, 36, 832–846. [Google Scholar] [CrossRef] [PubMed] [Green Version]
  47. Deslauriers, A.; Morin, H.; Begin, Y. Cellular phenology of annual ring formation of Abies balsamea in the Quebec boreal forest (Canada). Can. J. For. Res. 2003, 33, 190–200. [Google Scholar] [CrossRef] [Green Version]
  48. Turcotte, A.; Morin, H.; Krause, C.; Deslauriers, A.; Thibeault-Martel, M. The timing of spring rehydration and its relation with the onset of wood formation in black spruce. Agric. Meteorol. 2009, 149, 1403–1409. [Google Scholar] [CrossRef]
  49. Klippel, L.; Hartl-Meier, C.; Lindén, J.; Kochbeck, M.; Emde, K.; Esper, J. Hourly resolved climate response of Picea abies beyond its natural distribution range. Balt. For. 2017, 23, 556–563. [Google Scholar]
  50. Čermak, J.; Kučerá, J.; Bauerle, W.L.; Phillips, N.; Hinckley, T.M. Tree water storage and its diurnal dynamics related to sap flow and changes in stem volume in old-growth Douglas-fir trees. Tree Physiol. 2007, 27, 181–198. [Google Scholar] [CrossRef]
  51. Holbrook, N.M. Stem water storage. In Plant Stems: Physiology and Functional Morphology; Gartner, B.L., Ed.; Academic Press: San Diego, CA, USA, 1995; pp. 151–175. [Google Scholar]
  52. Grip, H.; Hällgren, J.E. Water cycling in coniferous forest ecosystems. In Ecosystems of the World. Volume 6. Coniferous Forests; Andersson, F., Ed.; Elsevier: Amsterdam, The Netherlands, 2005; pp. 385–426. [Google Scholar]
  53. Szymczak, S.; Barth, J.; Bendix, J.; Huneau, F.; Garel, E.; Häusser, M.; Juhlke, T.; Knerr, I.; Santoni, S.; Trachte, K.; et al. Tracking the oxygen isotope composition from source to sink in pine trees along an elevation gradient in a Mediterranean ecosystem. Chem. Geol. 2020. under review. [Google Scholar] [CrossRef]
  54. Schütt, P.; Weisgerber, H.; Schuck, H.J.; Lang, U.; Stimm, B.; Roloff, A. Lexikon der Nadelbäume; Nikol: Hamburg, Germany, 2004; p. 639. [Google Scholar]
Figure 1. Map showing the location of the study sites and a schematic view of the study transect with site names and site codes explained in the main text. The two different tree signatures indicate the species Pinus nigra (filled symbol) and Pinus pinaster (dashed symbol). The digital elevation model is based on SRTM (Shuttle Radar Topography Mission) data [33]. Climate characteristics are expressed as the mean monthly temperature (red lines) and monthly precipitation sums (blue bars) in 2018. Data gaps from our own climate stations are filled with data from nearby MétéoFrance climate stations [34].
Forests 11 00758 g001
Figure 2. Schematic figure explaining the classification of the stem circumference change into shrinking, swelling, and growth, and the exclusion of the growth component, created with the R-program dendRoAnalyst [36]. Each dot represents a 30-min measurement recorded in 2017.
Forests 11 00758 g002
Figure 3. Mean cumulative stem circumference changes from the five study sites for the year 2018 reported as daily mean values from all trees (6 at WL, EH and EL, 12 at WM and EM) per site. Site codes refer to the east (E) and west (W) sides of Corsica, L, M, and H stand for low-, middle-, and high-elevation sites, respectively. The inserted table indicates the number of days in 2018 with daily mean temperatures <5 °C per site. Data gaps from our own climate stations are filled with data from nearby MétéoFrance climate stations [34].
Forests 11 00758 g003
Figure 4. Mean stem circumference changes (solid lines; grey shaded areas indicate the range expressed as mean ± 1 standard deviation) and change of soil water content (dashed lines) over 48 h after precipitation events per site including (left column) and excluding (right column) tree growth. Precipitation events are extracted from the time period May 2017 to April 2019. Site codes refer to the east (E) and west (W) sides of Corsica, L, M, and H stand for low-, middle-, and high-elevation sites, respectively. Soil water measurements are not available for site EH.
Forests 11 00758 g004
Figure 5. Mean stem circumference changes after precipitation events during different seasons, including (left column) and excluding (right column) tree growth. Precipitation events are extracted from the time period May 2017 to April 2019. Site codes refer to the east (E) and west (W) sides of Corsica, L, M, and H stand for low-, middle-, and high-elevation sites, respectively.
Forests 11 00758 g005
Figure 6. Mean stem circumference changes after precipitation events classified by precipitation amount, including (left column) and excluding (right column) tree growth. Stem circumference changes (SCC) curves are only shown for classes with at least two events per site. Precipitation events are extracted from the time period May 2017 to April 2019. Site codes refer to the east (E) and west (W) sides of Corsica, L, M, and H stand for low-, middle-, and high-elevation sites, respectively.
Forests 11 00758 g006
Figure 7. Mean stem circumference changes (solid lines; grey shaded areas indicate the range expressed as mean ± 1 standard deviation) during dry periods of at least seven consecutive days without precipitation including (left column) and excluding (right column) tree growth. Dashed lines indicate the number of dry periods. Dry periods are extracted from the time period May 2017 to April 2019. Site codes refer to the east (E) and west (W) sides of Corsica, L, M, and H stand for low-, middle-, and high-elevation sites, respectively.
Forests 11 00758 g007
Table 1. Overview of the tree data set. The tree species refers to Pinus pinaster (PIPI) and Pinus nigra (PINI), respectively. Site codes refer to the eastern (E) and western (W) side of Corsica, L, M, and H stand for low-, middle-, and high-elevation sites, respectively. The ages and stem circumferences are expressed as mean values ± 1 standard deviation (STD).
Number of TreesTree SpeciesMean Age (yr) ± 1 STDMean Stem Circumference (cm) ± 1 STD
WL6PIPI32 ± 10131 ± 24
WM12PIPI, PINI42 ± 7116 ± 24
EH6PINI59 ± 10109 ± 15
EM12PIPI, PINI53 ± 10120 ± 30
EL6PIPI47 ± 20139 ± 19
Table 2. Characteristics of precipitation events and dry periods between May 2017 and April 2019. Mean precipitation sum was calculated independent from the mean duration of the events. Site codes refer to the eastern (E) and western (W) side of Corsica, L, M, and H stand for low-, middle-, and high-elevation sites, respectively. The seasons are expressed as abbreviations for the corresponding months (DJF: December, January, February; MAM: March, April, May; JJA: June, July, August; SON: September, October, November). Data gaps at individual climate stations: WL: January–February 2018, April–June 2018; EL: April–June 2018, mid November 2018–mid April 2019; EM: 15 days in March 2018.
Precipitation Events
WLWMEHEMEL
mean precipitation sum per event (mm)11.520.833.018.614.3
mean duration of precipitation events (h)6914106
mean intensity per event (mm/h)2.62.72.92.33.3
number of events per seasonDJF64241317
MAM84348295
JJA11913121
SON1034242624
number of events per amount class5–9.9 mm1447383814
10–19.9 mm745263714
20–29.9 mm4172497
30–39.9 mm-131051
40–49.9 mm-5311
50–99.9 mm-10167-
> 100 mm--91-
total number of precipitation events251381269837
Dry periods with at least 7 days without precipitation
WLWMEHEMEL
maximum duration (days) 6221193327
mean duration (days) 1810111314
number of dry periods per seasonDJF32331
MAM35342
JJA37678
SON76453
total number of dry periods 1620161914

