Article

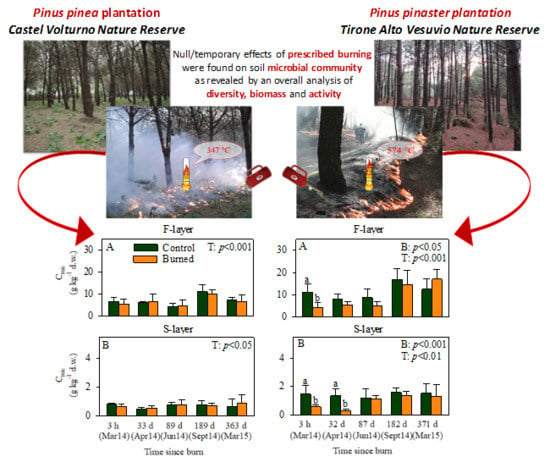
Soil Microbial Diversity, Biomass, and Activity in Two Pine Plantations of Southern Italy Treated with Prescribed Burning

1
Department of Environmental Biological and Pharmaceutical Sciences and Technologies, University of Campania “Luigi Vanvitelli”, Via Vivaldi 43, 81100 Caserta, Italy
2
Department of Agricultural, Forest and Food Sciences, University of Turin, Largo Paolo Braccini 2, 10095 Grugliasco (TO), Italy
3
Department of Agricultural Sciences, University of Naples Federico II, Via Università 100, 80055 Portici (NA), Italy
*
Author to whom correspondence should be addressed.
Forests 2020, 11(1), 19; https://doi.org/10.3390/f11010019
Submission received: 5 November 2019 / Revised: 5 December 2019 / Accepted: 18 December 2019 / Published: 21 December 2019
(This article belongs to the Special Issue Relationship between Forest Biodiversity and Soil Functions)

Abstract

:
Microbial diversity plays a crucial role in ecosystem processes, including organic matter decomposition and nutrient cycling. This research explores the effect of prescribed burning (PB) on soil microbial diversity, as well as biomass and activity in Mediterranean pine plantations. In burned and adjacent unburned plots of Pinus pinea and P. pinaster plantations of Southern Italy protected areas, the fermentation layer and the 5 cm thick layer of mineral soil underneath were sampled at intervals during the first year after PB. The experimental protocol encompassed measurements of total microbial abundance (Cmic and soil DNA), fungal mycelium, fungal fraction of Cmic, microbial activity, bacterial genetic diversity (16S rDNA PCR-DGGE), microbial metabolic quotient (qCO2), and C mineralization rate (CMR), as well as physical and chemical soil properties. PB caused only temporary (up to 3 h–32 d) reductions in Cmic, DNA amount, fungal mycelium, respiration, and CMR in the P. pinaster plantation, and had no appreciable negative effect on the microbial community in P. pinea plantation, where fire intensity was lower because of less abundant litter fuel. In either plantation, PB did not generally reduce bacterial genetic diversity (evaluated as band richness, Shannon index, and evenness), thus, also accounting for the fast recovery in microbial growth and activity after high-intensity PB in P. pinaster plantation. While confirming PB as a sustainable practice to reduce wildfire risk, also supported by data on plant community obtained in the same plantations, the results suggest that an integrated analysis of microbial diversity, growth, and activity is essential for an accurate description of PB effects on soil microbial communities.

Graphical Abstract

1. Introduction

Soil microbial community plays a key role in terrestrial ecosystems, by being involved in several ecosystem services. Indeed, it provides supporting services (soil formation, nutrient cycling, and plant growth), as well as regulating services (i.e., climate and gas regulation, C sequestration, water purification, disease and pest regulation, and bioremediation) and provisioning ones (i.e., the supply of food, fiber, fuel, genetic resources, chemicals, and pharmaceuticals) [1,2,3].
Soil microorganisms generally respond to changes in environmental conditions much faster than physical and chemical properties such as soil organic C or total N content [4,5,6]. Changes in soil microbial community, therefore, are useful indicators of the effects of stress or disturbance factors on soil. Research on soil microbial community currently concerns the evaluation of changes in quantity or biomass, structure (ranging from community fingerprint to species identification), and activity as indicators of environmental changes [7] by using traditional biochemical and microscopy techniques, as well as the newer molecular procedures [8]. However, only a few studies have simultaneously used microbial indicators of quantity or biomass, structure, and activity, notwithstanding the relationship among them is still unclear; therefore, studies in this research field should include the assessment of each of these three groups of indicators [7].
Common sources of disturbance in the Mediterranean ecosystems are wildfires, which affect a substantial amount of the forest cover, especially in concomitance with summer drought [9,10]. By causing a general reduction in the forest understory and tree crown cover and changes in physical, chemical, and biological properties of soil, wildfires can adversely affect soil functions. Indeed, soil alteration induced by fire could favour erosive processes and nutrient loss, thus affecting nutrient cycling [11], microbial activity, and CO2 emission from soil [12,13]. In order to reduce the fire risk in Mediterranean forests, the prescribed burning (hereafter PB) technique has been increasingly employed in the last years [14,15]. PB is applied under specific operative conditions (known as “prescriptions”) with the main goal of reducing the amount of surface dead fine fuels for fire hazard abatement, while minimizing undesired fire effects on ecosystems, including the soil component [14,16].
Several studies have shown that PB application is a useful fuel management tool that reduces wildfire hazard and severity, thus, improving ecosystem resilience to wildfire, particularly in Mediterranean pine plantations [14,16,17,18,19,20,21,22]. However, current understanding of the effects of prescribed burning on ecosystem components and processes is incomplete. Whereas extensive literature is available on the PB effects on vegetation and plant physiology [14,23,24,25,26,27,28,29], the knowledge of the effects of PB on soil components and processes is still unsatisfactory and mainly concerns soil chemical properties, while biological properties have not been widely investigated, until now [30]. Moreover, the biological data available are not fully consistent because both negative, positive, or neutral effects of PB have been reported depending on the soil initial characteristics, vegetation, fire intensity and frequency [30,31,32,33]. In addition, research on the effects of PB on soil microbial community has been mostly focused on total microbial biomass and activity [34,35,36], whereas effects on all variables linked to soil microbial community (quantity/biomass, structure, and activity) after PB treatment have been investigated only occasionally, i.e., in Texas grassland [37], Oklahoma oak forest [33], and British Columbia fir forest [38]. Moreover, the soil microbial diversity is not well understood in Mediterranean areas treated with PB.
With the aim to provide useful information on the sustainability of this practice for forest management in Mediterranean ecosystems, we investigated soil microbial diversity (as bacterial genetic diversity), abundance (as biomass and DNA amount), and activity (as respiration and indexes of microbial metabolism), and the relationships among these variables, in two pine plantations of Southern Italy treated with PB. We chose two plantations (dominated respectively, by P. pinea and P. pinaster) that differed for litter amount in order to obtain different fire intensity.
We hypothesize the following: (1) prescribed burning has no or slight effect on microbial biomass, activity, and diversity of fermentation layer and underlying 5 cm soil in both plantations and (2) the change in microbial diversity is a useful indicator of the effect of PB on soil microbial community that has to be associated to indicators more commonly investigated, i.e., variations in microbial biomass and activity.

2. Materials and Methods

2.1. Study Areas

The study was carried out in two pine plantations dominated by P. pinea L. and P. pinaster Aiton subsp. pinaster, respectively (Figure 1). The P. pinea plantation (40°57′39.79′′ N and 13°59′50.09′′ E) is located in the Castel Volturno Nature Reserve [39], a sandy coastal area located between sea level and 9 m of altitude. The mean age of trees was 50 years [24]. The understory mainly consists of flammable plants, such as Phillyrea angustifolia L., Rhamnus alaternus L. subsp. Alaternus, and Asparagus acutifolius L. [24,40]. The climate is typically Mediterranean, with hot dry summers and cool wet winters. Data from the meteorological station of Ischitella for 1974 to 2012 report a mean annual temperature of 13.6 °C and a mean annual rainfall of 761.3 mm [24]. Soil is a Calcacaric Arenosol according to the FAO system of soil classification [41].
The P. pinaster plantation (40°48′42.84′′ N and 14°24′46.86′′ E) is located in the Tirone Alto Vesuvio Nature Reserve, within the Vesuvius National Park, at about 600 m a.s.l. and 20% slope. The mean age of trees was 37 years [42]. The understory consists of Robinia pseudoacacia L., Genista etnensis (Raf.) DC., Cytisus scoparius (L.) Link subsp. scoparius, and Quercus ilex L. subsp. ilex. The mean annual temperature in the interval 1951–2014 was 16.1 °C and the mean annual precipitation was 766 mm [43]. Soil is a Lepti-Vitric Andosol (Skeletic) according to the FAO system of soil classification [41].
Overall, the P. pinea plantation showed a higher number of plant species in the forest understory (9.5 ± 0.7) as compared with P. pinaster (6.91 ± 2.5) plantation, as evaluated, respectively, on 50 m2 plots (Esposito et al., unpublished results) and 78.5 m2 plots (Stinca et al., unpublished results). It also showed lower tree density and higher values of shrub and herb cover, as well as herb height as compared with P. pinaster (Table 1).

2.2. Prescribed Burning Treatment

In both plantations, the PB was applied in March 2014 with the main aim to reduce the fire hazard by reducing surface fuel loadings and interrupting fuel continuity. Either study area was divided into the following two plots about 0.50 ha each: treated with PB (burned) and untreated (control). The operative conditions during the treatment in terms of weather conditions, fuel load (as dry weight), and fire behaviour are reported in Table 1. The arrival time of the fire was assessed by using 9 K-type thermocouples (0.4 mm in diameter) positioned in the litter and 9 just below the fermentation layer in P. pinea plantation, and 7 thermocouples in the litter and 6 under the fermentation layer in P. pinaster plantation. From each thermocouple we extracted maximum temperature and the residence time (s) above 100 °C (Table 1).
PB was more intense in P. pinaster than in the P. pinea plantation (<150 kW m−1 vs. <50 kW m−1), because of more abundant fine litter fuel (14.8 ± 1.7 vs. 6.4 ± 1.1 t ha−1). This resulted in higher temperatures and more prolonged residence times above 100 °C in the litter and F-layer (Table 1). In both plantations the litter layer thickness had not yet recovered to the prefire levels, at least up to 18 months after the treatment [44].

2.3. Sampling Protocol and Laboratory Measurements

Samples of the fermentation layer (F-layer) and underlying 5 cm soil (S-layer) were collected in 6 subplots (40 × 40 cm) of burned and unburned plots. In each subplot, all fermentation layer was collected; successively, five cores of S-layer were collected by a cylindrical sampler (diameter 6 cm and height 5 cm) and then mixed to obtain a homogeneous sample. The sampling was performed at 3 h, and 33, 89, 189, and 363 days after PB in the P. pinea plantation and at 3 h, and 32, 87, 182, and 371 days after PB in the P. pinaster plantation.
Limited to the first sampling (3 h), the weight of fermentation layer (after drying at 75 °C) was determined.
At each sampling time, the F-layer and S-layer (the latter sieved at 2 mm mesh) were analyzed for water content, total and extractable organic C, total microbial biomass, DNA amount, fungal mycelium, microbial activity, and bacterial genetic diversity. In addition, pH, total and mineral N (as ammonium and nitrate) were determined for S-layer samples.
Water content of F- and S-layer samples was measured by gravimetric method [45]. S-layer pH was determined on a water suspension of air-dried soil (1:2.5 ratio) using a calibrated electrode (Hanna Instruments mod. HI1230) [46]. Total N was determined on dried (75 °C) and pulverized soil with a NCS Elemental Analyzer (Thermo FlashEA 1112). Ammoniacal and nitric N contents were determined on fresh soil stored at 4 °C until measurement. Mineral nitrogen was extracted from soil with 0.5 M K2SO4 (1:5 soil: extractant) and measured by selective electrodes for NH4+-N (ORION, Mod. 9512BNWP) and NO3-N (ORION, Mod. 9707BNWP) [47]. Total organic carbon (Corg) of dried F- and S-layer samples was measured by humid digestion in 0.33 M K2Cr2O7 [48,49].
Fresh F-layer and S-layer, stored at 4 °C until measurement, were used to determine total microbial biomass C (Cmic), fungal mycelium amount, and respiration activity. Moreover, the following two indexes of microbial metabolism were calculated: metabolic quotient (qCO2: g CO2-C kg−1 Cmic h−1) [50], indicating the activity level of microbial community, and C mineralization rate (CMR: g CO2-C kg−1 Corg h−1), representing the fraction of organic C mineralized in the time unit. In addition, fungal fraction of microbial C (Cfung % Cmic) was evaluated.
Total microbial biomass was assessed with the chloroform-fumigation extraction method [51]. Organic carbon, extracted with 0.5 M K2SO4 from chloroform-fumigated samples and not fumigated samples, was measured by chemical digestion with 0.066 M K2Cr2O7. On the basis of the organic carbon (Corg) content in extracts of fumigated and non-fumigated samples, microbial biomass carbon (Cmic) was calculated [51]. This measure also provided data on the extractable organic C (Cext) that was obtained from non-fumigated samples. The abundance of soil microorganisms was also deducted from total DNA, considered a robust indicator of microbial biomass [52]. DNA was extracted from 0.25 g of F- or S-layer samples (stored at −20 °C until use) with the FastDNA SPIN Kit for soil (Bio 101 Inc). Two subplots (3rd and 4th) of burned and unburned plots were used for assessing DNA content and bacterial diversity (see below) in four over five sampling times (3 h, and 33, 189, and 363 days in P. pinea plantation and 3 h, and 32, 182, and 371 days in P. pinaster plantation).
Total fungal mycelium was determined with the membrane filter [53]. The length of hyphae was determined with the intersection method [54]. The mass of mycelia was evaluated from the average values of cross section (9.3 μm2), density (1.1 g mL−1), and dry mass of the hyphae (15% of the wet mass) [55]. From fungal mycelium and Cmic data, the fungal fraction of microbial C (Cfung % Cmic) was calculated [56].
The microbial activity was assessed as potential respiration, by measuring the CO2 evolved from samples by gas chromatography (TRACE™ Ultra Gas Chromatograph) [57], modified. Samples were incubated in standard conditions (25 °C, 55% water-holding capacity, in the dark) for 1 h before analysis [58].
The metabolic quotient (qCO2: g CO2-C kg−1 Cmic h−1) and C mineralization rate (CMR: g CO2-C kg−1 Corg h−1) were calculated from respiration, microbial biomass (Cmic), and total organic C (Corg) data.
The bacterial genetic diversity was evaluated by 16S rDNA PCR-DGGE on DNA extracts [59]. PCR amplification was performed using the primer set GC 968f/UNI 1401r [60,61] in the conditions described by Agnelli et al. [62]. PCR products were quantified on 1% agarose gel in 1X TBE buffer using Low DNA Mass Ladder 100 bp as a marker. Denaturing-gradient gel electrophoresis (DGGE) was performed using the DcodeSystem (Universal Mutation Detection System, Biorad). Operative conditions were 6% polyacrylamide gel and 35% to 50% denaturant gradient of urea and formamide (100% denaturant contained 7 M urea and 40% formamide). The gel was run at 60 °C under 200 V for 4 h. DGGE profiles of the bacterial community were analyzed with ImageJ ver.1.33, in order to obtain band number and band intensity for each lane [59]. The bacterial diversity was assessed in terms of richness (band number), Shannon index (H) and evenness index. The Shannon index was calculated by the equation, H = −Σ(ni/N) × ln (ni/N), where ni is the intensity of each band and N the sum of the intensities of all bands in the same lane [63]. The evenness index was calculated as the ratio between Shannon index and natural logarithm of richness, the latter corresponding to the maximum value of Shannon index for the observed band number.

2.4. Statistical Analysis

A normality test (Kolmogorov–Smirnov) was applied to datasets before parametric tests; the data were transformed by log10 when not normally distributed [64]. For each variable, two-way ANOVA (followed, if required, by Bonferroni test) was applied using treatment (burned or control) and sampling time (T) as factors. The significance level of the Bonferroni test, for burned vs. control comparisons was p ≤ 0.01, according to Bonferroni method [64]. Moreover, the significance of differences between two considered plantations, for each variable, was assayed by t-test.
Correlations among parameters were assayed by Pearson’s coefficient (n = 60 throughout except genetic data, for which n = 16).
All statistical analyses were carried out using the software SigmaPlot12.

3. Results

In both plantations, PB consumed litter but not the F-layer. In the P. pinaster plantation, an increase in the mass of the F-layer was observed (839 ± 373 g m−2 before PB vs. 1231 ± 331 g m−2 after PB), suggesting that partially mineralized litter was transferred to this layer. The same did not occur in P. pinea plantation (1140 ± 277 g m−2 before PB vs. 1135 ± 367 g m−2 after PB), indicating that litter had been entirely mineralized.
PB generally did not affect soil chemical characteristics in P. pinea plantation, however, a significant increase was found on the overall study period in Ntot, NH4+-N, and NO3-N concentrations (Table 2 (A)), and, limited to 89 and 363 days, in extractable C (Cext) concentration of the F layer (Table 3 (A)). In this plantation, positive correlations were found between NH4+-N concentration and soil DNA and fungal mycelium (respectively, r = 0.50 and r = 0.68, p < 0.05) and between NO3-N concentration and soil respiration, qCO2, and CMR (respectively, r = 0.45, r = 0.29, r = 0.463, p < 0.05).
In P. pinaster plantation, burning treatment produced a slightly but significant increase in soil pH, and a significant decrease in NH4+-N content, limited to 32 d and 182 d (Table 2 (B)), water content in both the F- and S-layers (Table 3 (B)). In either plantation, PB treatment did not affect the organic C concentration in F- or S-layer (Corg, Table 3).
Microbial variables also showed different responses to PB in the two plantations. A comparison of burned and control plots, showed that no negative effect was generally found in P. pinea plantation (Figure 2); however, a significant decrease in fungal mycelium was found in the S-layer, 3 h after the treatment (Figure 2F). The observed changes in respiration and qCO2 (Figure 2I,K) were not clearly referable to fire treatment because they were sometimes higher in the control and sometimes the reverse. In P. pinaster plantation a negative effect of PB on some microbial variables was observed in both the F- and S-layers (Figure 3), but this effect was temporary. In particular, both layers showed a significant decrease in total C microbial biomass (Cmic) and fungal mycelium immediately after burning (3 h) and generally up to 32 days thereafter (Figure 3A,B,E,F). A decrease in respiration (Figure 3I) and C mineralization rate (CMR, Figure 3M) was observed in F-layer at 3 h and 371 days after burning. The burned plots also showed a slight reduction in S-layer DNA content (Figure 3D). Unlike other microbial variables, the fungal fraction of Cmic and qCO2 of the S-layer were higher in burned plots than in controls up to 32 d after treatment (Figure 3H,L).
From the analysis of the DGGE profiles or bacterial genetic fingerprints of the F-layer (Figure 4A,C) and S-layer (Figure 4B,D) of considered plantations, no significant differences were generally observed for bacterial richness, Shannon index, and evenness between burned and unburned plots (Table 4), except for richness in P. pinea S-layer, which was slightly lower in burned plot.
Richness, Shannon, and evenness indexes (Table 4) were generally significantly (p < 0.05) higher in P. pinaster than in P. pinea plantation (except for soil richness), in line with Cmic and respiration trend (p < 0.05); in contrast, DNA amount was lower (p < 0.05) in the F-layer of P. pinaster plantation than in P. pinea plantation (Figure 2 and Figure 3). P. pinaster plantation also showed significantly (p < 0.01) higher values of Corg and total N content, in the S-layer, and of Cext and water content, in both F- and S-layer as compared with P. pinea plantation (Table 2 and Table 3).
Two-way ANOVA analysis of the whole dataset showed that the sampling time was more critical than the burning treatment towards most variables considered (Table 2 and Table 3, Figure 2 and Figure 3), except for genetic ones that were generally unaffected by either of them (Table 4). The water content significantly changed with sampling time in both F- and S-layer (Table 3) and this in turn affected most other investigated variables. Indeed, extractable C (Cext), microbial biomass, fungal mycelium of both F- and S-layer were generally positively correlated with the water content (0.30 < r < 0.91, p < 0.05, in P. pinea plantation, and 0.57 < r < 0.89, p < 0.001, in P. pinaster plantation). Moreover, limited to the F-layer, total organic C (Corg) was positively correlated with water content in both plantations (r = 0.32, in P. pinea; r = 0.26, in P. pinaster, p < 0.05) and respiration was correlated with water content only in P. pinaster plantation (r = 0.33, p < 0.01). In addition, soil mineral N (NH4+-N and NO3-N) was generally positively correlated with soil water content in both plantations (0.27 < r < 0.49, p < 0.05).
Bacterial diversity variables (richness, Shannon index, and evenness) generally did not change during the study period and were not correlated with microbial growth (DNA amount, microbial C, and fungal mycelium) and metabolism (respiration, qCO2, and CMR) in P. pinea plantation. On the contrary, significant correlations among bacterial diversity and other microbial variables were observed in the P. pinaster plantation. In particular, richness and Shannon index were positively correlated with Cmic, in the F-layer, and with respiration and CMR in the S-layer (0.52 < r < 0.65; p < 0.05). Surprisingly, richness in the F-layer was negatively correlated with respiration, qCO2, CMR, and fungal fraction of Cmic (−0.59 < r < −0.77, p < 0.05).

4. Discussion

4.1. Effect of PB on Soil Microbial Community

As far as we are aware, this is the first study investigating the effects of prescribed burning (PB) on microbial biomass, activity and bacterial genetic diversity in pine plantations in a Mediterranean area. By comparing burned and control plots at each sampling time, we observed that the PB treatment in the P. pinea plantation did not affect the microbial community of either F- or S-layer (except for richness in soil). In contrast, a decrease in microbial biomass (Cmic), DNA amount, fungal mycelium, respiration, and C mineralization rate (CMR) was observed in the P. pinaster plantation generally until 32 d after treatment (in both layers or only one of the two). The more marked effect of prescribed burning in the P. pinaster plantation is consistent with higher maximum temperature and longer residence time above 100 °C during the treatment, most likely reflecting higher fire intensity due to more abundant litter fuel as compared with the P. pinea stand. Alcañiz et al. [30] reported that the effects of prescribed burning on soil biological properties depended on fire characteristics (intensity, residence time, and severity). Similarly, other authors observed that fire effect on soil microoganisms relied on temperatures at which they were exposed [35,65]. A decrease in fungal mycelium [13] and ATP content [66] with increasing fire severity has also been observed after experimental fires in an Italian Mediterranean maquis.
The effect of PB on soil microbial community in the P. pinaster plantation could be also due to indirect fire effect, such as the significant decrease of soil water content and Cext concentrations in F- and S-layers of burned area, generally not observed in P. pinea plantation.
In this study, PB treatments were found to affect the soil microbial community to a lesser extent than that of sampling time. Indeed, two-way ANOVA showed that most variables depended on sampling time, only a few being also affected by fire treatment. Crucially, temporal variation due to rainfall seasonality largely overlapped the effect of PB in either plantation. As a matter of fact, soil biological activity in Mediterranean areas is primarily affected by yearly fluctuation in water availability [67]. In line with this, most microbial variables considered in this study were positively correlated to the water content.
Our results are consistent with former research showing that repeated PB in a P. halepensis plantation in Southern Italy had only short-term or no effects on chemical and microbial properties of the fermentation layer and the 5 cm soil layer underneath, with a superimposed predominance of the water factor [31]. Likewise, no or minimal effects of PB on soil physical and chemical properties were observed in a short-grass plain in Texas [37], a P. pinaster plantation in Portugal [68] and a P. palustris forest in South Caroline [69].
Total organic C did not change significantly in burned plots as compared with controls, while F-layer extractable C (limited to 89 and 363 days) and soil total N and mineral N significantly increased in burned plots of P. pinea plantation, where fire intensity was relatively low. This possibly reflects incorporation of nitrogen-enriched ashes produced by combustion at low temperature [30]. An increase in ammoniacal N has been reported in a Texas grassland after PB [37]. Benefits from higher C and N contents could balance negative effects of fire, thus, accounting for little or no damage to the microbial community. Indeed, in P. pinea plantation, soil DNA and fungal mycelium were positively correlated with NH4+-N concentration; moreover, soil respiration, qCO2, and CMR were positively correlated with NO3-N concentration.

4.2. Interrelationships among Variables

Bacterial genetic diversity was evaluated as richness, Shannon index, and evenness of bacteria after DNA extraction and amplification of a specific segment of bacterial 16S rDNA [60]. The values of DNA yield for the F-layer of P. pinea (44 to 79 mg kg−1) and P. pinaster (25 to 58 mg kg−1) plantations and for the S-layer (respectively, 13 to 51 mg kg−1 in P. pinea, and 11 to 38 mg kg−1, in P. pinaster) mostly fell within the range (0.1 to 41.8 mg kg−1) reported in 2150 French soils [52], only occasionally being slightly above. The richness values found in our study systems were comparable with those reported in soils from P. nigra and Abies alba Italian forests [70] and in a P. pinaster Spanish forest with an understory of Mediterranean bushes [71].
Whereas wildfire can cause changes in the soil bacterial genetic diversity, as demonstrated in a Spanish P. pinaster forest [71], our study showed that generally PB did not affect bacterial genetic diversity in either plantation, except for richness in soil of P. pinea plantation. Because bacterial richness in the above-lying F-layer was not affected by treatment, the observed effect on soil suggests the involvement of other factors (not investigated here) that co-varied with the burning factor. Other authors found no or temporary variations in microbial community structure after prescribed burning [37,72]. On the contrary, experimental summer fire in a Mediterranean maquis caused decreases in functional diversity [56], fungal species density [73], and fungal fraction of microbial C [13], although an increase in culturable total, xerotolerant, and heat-stimulated fungi was also observed [74]. In this study, an increase in the fungal fraction of microbial C was only found in the S-layer in P. pinaster plantation and was restricted to the first month after treatment. In combination with a parallel decrease in Cmic and fungal mycelium, this suggests that fire negatively affected bacteria more than fungi in the soil of the P. pinaster stand.
Unchanged genetic bacterial diversity in burned plots in P. pinea plantation is an expected result, because PB had relatively low intensity and no other microbial variable changed appreciably after exposition to fire in this system. This is consistent with the lack of effects in this plantation also on tree growth [24] and plant species richness (Esposito et al., unpublished data). The lack of effect on bacterial diversity in the P. pinaster plantation, instead, is more surprising because a higher fire intensity in this system caused significant changes in other microbial variables, generally persisting for a month after fire, and reduced microbial efficiency in C use as shown by higher values of soil qCO2. A significant increase in soil qCO2 after wildfire and experimental summer fire has also been reported in Mediterranean maquis [13,75]. These observations fit well with the general tendency of microorganisms to increase CO2-producing catabolic activity and reduce growth-sustaining anabolism when exposed to stressing conditions [6,50,76].
The lack of PB effects on soil bacterial diversity and the temporary effects on soil microbial biomass and activity in P. pinaster plantation demostrated that also higher intensity PB had a low impact on soil. On the other hand, in this plantation PB did not affect negatively the tree growth [42] nor the plant species richness. Indeed, 20 months after PB treatment plant species richness did not change between control and burned plots (6.4 ± 1.9 vs. 6.9 ± 1.3, as measured in 78.5 m2 plots, Stinca et al., unpublished results).
No correlation was observed in P. pinea plantation among bacterial genetic diversity and microbial biomass and activity, whereas, in P. pinaster plantation, richness, and Shannon index were positively correlated with Cmic in the F-layer, and with respiration and CMR in the S-layer. On the other hand, richness was negatively correlated with microbial activity and fungal fraction of Cmic in the F-layer. These contradictory relationships suggest the participation of factors other than those considered in the present study. Nannipieri et al. [8] suggested that the lack of correlation between microbial diversity and a fundamental index of microbial activity such as organic matter decomposition could be explained by functional redundancy of the microbial community. As a matter of fact, the reduction and disappearance of certain microbial entities could have little effect on soil functions if others persist that can perform the same functions.
Relatively to intra-ecosystem variability, a greater variability in bacterial genetic diversity was observed when comparing the two pine plantations (about 40 km apart) to each other, demonstrating that these indices are sensitive to variation of environmental factors (such as those site dependent). Indeed, as compared with P. pinea plantation, the P. pinaster plantation generally showed significantly higher values of richness, Shannon index, and evenness in both the F- and S-layer, which fits well with higher values of Cmic and respiration. Surprisingly, an opposite trend was observed for soil DNA amount. In P. pinaster plantation, soil microorganisms could benefit from significantly higher soil organic C and total N content as well as higher Cext and water content in both F- and S-layer. This confirms the importance of water as a regulating factor for soil microbial community in the Mediterranean environment [66]. As compared with P. pinea plantation, P. pinaster plantation had a lower undergrowth plant species richness, as well as lower shrub and herbs cover and tree high, suggesting that microbial community was affected by soil chemical properties more than plant species richness and vegetation structure.

5. Conclusions

The application of PB for fire hazard reduction in two pine plantations located in protected areas of Southern Italy exposed to high fire risk achieved the objective of reducing the litter fuel and interrupting its continuity without causing persistent negative effects on the soil, as well as on tree growth and vegetation. In this study a temporary negative effect on microbial biomass and activity was observed in the P. pinaster plantation only, where higher fire intensity occurred as compared with P. pinea plantation. However, in both plantations the magnitude of fire-related changes was by far smaller than the spectrum of changes associated with the sampling time, confirming our first hypothesis.
Moreover, our results confirmed our second hypothesis that microbial diversity is a powerful tool that effectively integrates microbial growth and activity data in the study of fire effects on soil microbial communities. Indeed, the absence of changes in bacterial genetic diversity in burned plots suggested that fire caused no important damage to the structure of microbial community living immediately below the litter layer even after relatively intense burning in P. pinaster plantation, thus explaining the fast recovery of microbial growth and activity in the aftermath.
Our results confirm that the application of prescribed burning in the studied plantations under the prescriptions adopted (see Table 1) could be a safe practice reducing forest fire hazard without causing relevant damages.
Questions open to future research, include: (i) to verify if the response to PB observed in pine plantations can be generalized to other Mediterranean ecosystems, (ii) to test fire intensity and severity thresholds above which marked changes in soil microbial activity occur, and (iii) to know if specific bacterial or fungal species could be damaged or stimulated by PB treatment.

Author Contributions

Conceptualization, F.A.R.; data curation, F.A.R.; formal analysis, E.G., R.M. and D.A.; funding acquisition, A.E. and S.M.; investigation, E.G., D.A., and A.S.; methodology, R.M.; supervision, F.A.R.; writing—original draft, E.G. and R.M.; writing—review and editing, F.A.R., R.M., A.E., D.A., A.S., and S.M. All authors have read and agreed to the published version of the manuscript.

Funding

This research was funded by Campania Region (Italy)—CUP B24H13000030005.

Acknowledgments

Thanks are due to the Campania Region (Italy) for permitting the realization of this study, to A. Salgueiro of GIFF S.A., Portugal, for prescribed burn implementation, and to R. Ligrone for helpful comments during the preparation of the manuscript.

Conflicts of Interest

The authors declare no conflict of interest.

References

  1. Adhikari, K.; Hartemink, A.E. Linking soils to ecosystem services—A global review. Geoderma 2016, 262, 101–111. [Google Scholar] [CrossRef]
  2. Saccá, M.L.; Barra Caracciolo, A.; Di Lenola, M.; Grenni, P. Ecosystem services provided by soil microorganisms. In Soil Biological Communities and Ecosystem Resilience; Lukac, M., Grenni, P., Gamboni, M., Eds.; Springer International Publishing: Cham, Switzerland, 2017; pp. 9–24. [Google Scholar]
  3. Singh, J.S.; Gupta, V.K. Soil microbial biomass: A key soil driver in management of ecosystem functioning. Sci. Total Environ. 2018, 634, 497–500. [Google Scholar] [CrossRef]
  4. Pankhurst, C.E.; Hawke, B.G.; McDonald, H.J.; Kirby, C.A.; Buckerfield, J.C.; Michelsen, P.; O’Brien, K.A.; Gupta, V.V.S.R.; Doube, B.M. Evaluation of soil biological properties as potential bioindicators of soil health. Aust. J. Exp. Agric. 1995, 35, 1015–1028. [Google Scholar] [CrossRef]
  5. Powlson, D.S.; Brookes, P.C.; Christensen, B.T. Measurement of soil microbial biomass provides an early indication of changes in the total soil organic matter due to straw incorporation. Soil Biol. Biochem. 1987, 19, 159–164. [Google Scholar] [CrossRef]
  6. Joergensen, R.G.; Emmerling, C. Methods for evaluating human impact on soil microorganisms based on their activity, biomass, and diversity in agricultural soils. J. Plant Nutr. Soil Sci. 2006, 169, 295–309. [Google Scholar] [CrossRef]
  7. Pulleman, M.M.; Creamer, R.; Hamer, U.; Helder, J.; Pelosi, C.; Pérès, G.; Rutgers, M. Soil biodiversity, biological indicators and soil ecosystem services—An overview of European approaches. Curr. Opin. Environ. Sustain. 2012, 4, 529–538. [Google Scholar] [CrossRef]
  8. Nannipieri, P.; Ascher, J.; Ceccherini, M.T.; Landi, L.; Pietramellara, G.; Renella, G. Microbial diversity and soil functions. Eur. J. Soil Sci. 2003, 54, 655–670. [Google Scholar] [CrossRef]
  9. Trabaud, L.; Grandjanny, M. Post-fire reconstitution of the flowering phenology in Mediterranean shrubland plants. In Fire and Biological Processes; Trabaud, L., Prodon, R., Eds.; Backhuys Publishers: Leiden, The Netherlands, 2002; pp. 99–113. [Google Scholar]
  10. Turco, M.; von Hardenberg, J.; AghaKouchak, A.; Llasat, M.C.; Provenzale, A.; Trigo, R.M. On the key role of droughts in the dynamics of summer fires in Mediterranean Europe. Sci. Rep. 2017, 7, 81. [Google Scholar] [CrossRef] [Green Version]
  11. Rodríguez, J.; González-Pérez, J.A.; Turmero, A.; Hernández, M.; Ball, A.S.; González-Vila, F.J.; Arias, M.E. Wildfire effects on the microbial activity and diversity in a Mediterranean forest soil. Catena 2017, 158, 82–88. [Google Scholar] [CrossRef] [Green Version]
  12. Fierro, A.; Rutigliano, F.A.; De Marco, A.; Castaldi, S.; Virzo De Santo, A. Post-fire stimulation of soil biogenic emission of CO2 in a sandy soil of a Mediterranean shrubland. Int. J. Wildland Fire 2007, 16, 573–583. [Google Scholar] [CrossRef]
  13. Rutigliano, F.A.; De Marco, A.; D’Ascoli, R.; Castaldi, S.; Gentile, A.; Virzo De Santo, A. Impact of fire on fungal abundance and microbial efficiency in C assimilation and mineralisation in a Mediterranean maquis soil. Biol. Fertil. Soils 2007, 44, 377–381. [Google Scholar] [CrossRef]
  14. Fernandes, P.; Botelho, H. A review of prescribed burning effectiveness in fire hazard reduction. Int. J. Wildland Fire 2003, 12, 117–128. [Google Scholar] [CrossRef] [Green Version]
  15. Furlaud, J.M.; Grant, A.B.J.; Williamson, A.; David, M.J.; Bowma, S. Simulating the effectiveness of prescribed burning at altering wildfire behaviour in Tasmania, Australia. Int. J. Wildland Fire 2017, 27, 15–28. [Google Scholar] [CrossRef] [Green Version]
  16. Fernandes, P.M.; Davies, G.M.; Ascoli, D.; Fernández, C.; Moreira, F.; Rigolot, E.; Stoof, C.R.; Vega, J.A.; Molina, D. Prescribed burning in southern Europe: Developing fire management in a dynamic landscape. Front. Ecol. Environ. 2013, e4–e14. [Google Scholar] [CrossRef] [Green Version]
  17. Piñol, J.; Beven, K.; Viegas, D. Modelling the effect of fire-exclusion and prescribed fire on wildfire size in Mediterranean ecosystems. Ecol. Model. 2005, 183, 397–409. [Google Scholar] [CrossRef]
  18. Cassagne, N.; Pimont, F.; Dupuy, J.L.; Linn, R.R.; Marell, A.; Oliveri, C.; Rigolot, E. Using a fire propagation model to assess the efficiency of prescribed burning in reducing the fire hazard. Ecol. Model. 2011, 222, 1502–1514. [Google Scholar] [CrossRef]
  19. Marino, E.; Guijarro, M.; Hernando, C.; Madrigal, J.; Díez, C. Fire hazard after prescribed burning in a gorse shrubland: Implications for fuel management. J. Environ. Manag. 2011, 92, 1003–1011. [Google Scholar] [CrossRef]
  20. Ascoli, D.; Catalanotti, A.E.; Valese, E.; Cabiddu, S.; Delogu, G.; Driussi, M.; Esposito, A.; Leone, V.; Lovreglio, R.; Marchi, E.; et al. Esperienze di fuoco prescritto in Italia: Un approccio integrato per la prevenzione degli incendi boschivi. Forest@ 2012, 9, 20–38. [Google Scholar] [CrossRef] [Green Version]
  21. Casals, P.; Valor, T.; Besalú, A.; Molina-Terrén, D. Under story fuel load and structure eight to nine years after prescribed burning in Mediterranean pine forests. Forest Ecol. Manag. 2016, 362, 156–168. [Google Scholar] [CrossRef]
  22. Espinosa, J.; Palheiro, P.; Loureiro, C.; Ascoli, D.; Esposito, A.; Fernandes, P.M. Fire-severity mitigation by prescribed burning assessed from fire-treatment encounters in maritime pine stands. Can. J. Forest Res. 2018, 49, 205–211. [Google Scholar] [CrossRef]
  23. Battipaglia, G.; Strumia, S.; Esposito, A.; Giuditta, E.; Sirignano, C.; Altieri, S.; Rutigliano, F.A. The effects of prescribed burning on Pinus halepensis Mill. as revealed by dendrochronological and isotopic analyses. Forest Ecol. Manag. 2014, 334, 201–208. [Google Scholar] [CrossRef]
  24. Battipaglia, G.; Savi, T.; Ascoli, D.; Castagneri, D.; Esposito, A.; Mayr, S.; Nardini, A. Effects of prescribed burning on ecophysiological, anatomical and stem hydraulic properties in Pinus pinea L. Tree Physiol. 2016, 36, 1–13. [Google Scholar] [CrossRef] [Green Version]
  25. Battipaglia, G.; Tognetti, R.; Valese, E.; Ascoli, D.; De Luca, P.F.; Basile, S.; Ottaviano, M.; Mazzoleni, S.; Marchetti, M.; Esposito, A. Incendi 2017: Un’importante lezione. Forest@ 2017, 14, 231–236. [Google Scholar] [CrossRef] [Green Version]
  26. Fernandes, P.; Botelho, H.; Rego, F.C. A piroecologia do pinheiro bravo. Silva Lusit. 2005, 13, 233–248. [Google Scholar]
  27. Fan, Z.; Ma, Z.; Dey, D.C.; Roberts, S.D. Response of advance reproduction of oaks and associated species to repeated prescribed fires in upland oak-hickory forests, Missouri. Forest Ecol. Manag. 2012, 266, 160–169. [Google Scholar] [CrossRef]
  28. Fuentes, L.; Duguy, B.; Nadal-Sala, D. Short-term effects of spring prescribed burning on the understory vegetation of a Pinus halepensis forest in Northeastern Spain. Sci. Total Environ. 2018, 610–611, 720–731. [Google Scholar] [CrossRef]
  29. Schwartz, N.B.; Urban, D.L.; White, P.S.; Moody, A.; Klein, R.N. Vegetation dynamics vary across topographic and fire severity gradients following prescribed burning in Great Smoky Mountains National Park. For. Ecol. Manag. 2016, 365, 1–11. [Google Scholar] [CrossRef]
  30. Alcañiz, M.; Outeiro, L.; Francos, M.; Ubeda, X. Effects of prescribed fires on soil properties: A review. Sci. Total Environ. 2018, 613–614, 944–957. [Google Scholar] [CrossRef]
  31. Catalanotti, A.E.; Giuditta, E.; Marzaioli, R.; Ascoli, D.; Esposito, A.; Strumia, S.; Mazzoleni, S.; Rutigliano, F.A. Effects of single and repeated prescribed burns on soil organic C and microbial activity in a Pinus halepensis plantation of Southern Italy. Appl. Soil Ecol. 2017, 125, 108–116. [Google Scholar] [CrossRef]
  32. Shen, J.P.; Chen, C.R.; Lewis, T. Long term repeated fire disturbance alters soil bacterial diversity but not the abundance in an Australian wet sclerophyll forest. Sci. Rep. 2016, 6, 3–12. [Google Scholar] [CrossRef] [Green Version]
  33. Williams, R.J.; Hallgren, S.W.; Wilson, G.W.T. Frequency of prescribed burning in an upland oak forest determines soil and litter properties and alters the soil microbial community. For. Ecol. Manag. 2012, 265, 241–247. [Google Scholar] [CrossRef]
  34. Fritze, H.; Pennanen, T.; Pietikäinen, J. Recovery of soil microbial biomass and activity from prescribed burning. Can. J. For. Res. 1993, 23, 1286–1290. [Google Scholar] [CrossRef]
  35. Hamman, S.T.; Burke, I.C.; Knapp, E.E. Soil nutrients and microbial activity after early and late season prescribed burns in a Sierra Nevada mixed conifer forest. For. Ecol. Manag. 2008, 256, 367–374. [Google Scholar] [CrossRef]
  36. McCarthy, D.R.; Brown, K.J. Soil respiration responses to topography, canopy cover, and prescribed burning in an oak-hickory forest in southeastern Ohio. For. Ecol. Manag. 2006, 237, 94–102. [Google Scholar] [CrossRef]
  37. Fultz, L.M.; Moore-Kucera, J.; Dathe, J.; Davinic, M.; Perry, G.; Wester, D.; Schwilk, D.W.; Rideout-Hanzak, S. Forest wildfire and grassland prescribed fire effects on soil biogeochemical processes and microbial communities: Two case studies in the semi-arid Southwest. Appl. Soil Ecol. 2016, 99, 118–128. [Google Scholar] [CrossRef]
  38. Switzer, J.M.; Hope, G.D.; Grayston, S.J.; Prescott, C.E. Changes in soil chemical and biological properties after thinning and prescribed fire for ecosystem restoration in a Rocky Mountain Douglas-fir forest. For. Ecol. Manag. 2012, 275, 1–13. [Google Scholar] [CrossRef]
  39. Croce, A.; Stinca, A.; Santangelo, A.; Esposito, A. Exploring vascular flora biodiversity of two protected sandy coastal areas in southern Italy. Rend. Lincei 2019, 30, 323–336. [Google Scholar] [CrossRef]
  40. Esposito, A.; Mazzoleni, S.; Strumia, S. Post-fire bryophyte dynamics in Mediterranean vegetation. J. Veg. Sci. 1999, 10, 261–268. [Google Scholar] [CrossRef]
  41. di Gennaro, A. I Sistemi di Terre Della Campania. 2002. Available online: https://www.iris.unina.it/handle/11588/179891#.XfyHZmZ5uUk (accessed on 5 November 2019).
  42. Niccoli, F.; Esposito, A.; Altieri, S.; Battipaglia, G. Fire severity influences ecophysiological responses of Pinus pinaster Ait. Front. Plant Sci. 2019, 10, 539. [Google Scholar] [CrossRef]
  43. Zalloni, E.; Battipaglia, G.; Cherubini, P.; De Micco, V. Site conditions influence the climate signal of intra-annual density fluctuations in tree rings of Q. ilex L. Ann. Forest Sci. 2018, 75, 68. [Google Scholar] [CrossRef] [Green Version]
  44. Giuditta, E.; Coenders-Gerrits, A.M.J.; Bogaard, T.A.; Wenninger, J.; Greco, R.; Rutigliano, F.A. Measuring changes in forest floor evaporation after prescribed burning in Southern Italy pine plantations. Agric. Forest Meteorol. 2018, 256–257, 516–525. [Google Scholar] [CrossRef] [Green Version]
  45. Allen, S.E. Chemical Analysis of Ecological Materials; Blackwell Scientific Publications: Oxford, UK, 1989. [Google Scholar]
  46. Burc, R. (Ed.) USDA Natural Resources Conservation Service Soil Survey Laboratory Methods Manual; Soil Survey Investigations; Report No. 42; Version 4.0.; National Soil Survey Center: Lincoln, NE, USA, 2004.
  47. Castaldi, S.; Carfora, A.; Fiorentino, A.; Natale, A.; Messere, A.; Miglietta, F.; Cotrufo, M.F. Inhibition of net nitrification activity in a Mediterranean woodland: Possible role of chemicals produced by Arbutus unedo. Plant Soil 2009, 315, 273–283. [Google Scholar] [CrossRef]
  48. Springer, U.; Klee, J. Prüfung der Leistungsfähigkeit von einigen wichtigeren Verfahren zur Bestimmung des Kohlemstoffs mittels Chromschwefelsäure sowie Vorschlag einer neuen Schnellmethode. Z. Pflanzenernähr. Dang. Bodenk 1954, 64, 1–26. [Google Scholar] [CrossRef]
  49. Sleutel, S.; De Neve, S.; Singier, B.; Hofman, G. Quantification of organic carbon in soils: A comparison of methodologies and assessment of the carbon content of organic matter. Commun. Soil Sci. Plan. 2007, 38, 2647–2657. [Google Scholar] [CrossRef]
  50. Anderson, T.H.; Domsch, K.H. The metabolic quotient for CO2 (qCO2) as a specific activity parameter to assess the effects of environmental conditions, such as pH, on the microbial biomass of forest soils. Soil Biol. Biochem. 1993, 25, 393–395. [Google Scholar] [CrossRef]
  51. Vance, E.D.; Brookes, P.C.; Jenkinson, D.S. An extraction method for measuring soil microbial biomass C. Soil Biol. Biochem. 1987, 19, 703–707. [Google Scholar] [CrossRef]
  52. Dequiedt, S.; Saby, N.P.A.; Lelievre, M.; Jolivet, C.; Thioulous, J.; Toutain, B.; Arrouays, D.; Bispo, A.; Lemanceau, P.; Ranjard, L. Biogeographical patterns of soil molecular microbial biomass as influenced by soil characteristics and management. Glob. Ecol. Biogeogr. 2011, 20, 641–652. [Google Scholar] [CrossRef]
  53. Sundman, V.; Sivelä, S. A comment on the membrane filter technique for estimation of length of fungal hyphae in soil. Soil Biol. Biochem. 1978, 10, 399–401. [Google Scholar] [CrossRef]
  54. Olson, F.C.W. Quantitative estimates of filamentous algae. Trans. Am. Microsc. Soc. 1950, 69, 272–279. [Google Scholar] [CrossRef]
  55. Berg, B.; Söderström, B. Fungal biomass and nitrogen in decomposing Scots pine needle litter. Soil Biol. Biochem. 1979, 11, 339–341. [Google Scholar] [CrossRef]
  56. D’Ascoli, R.; Rutigliano, F.A.; De Pascale, R.A.; Gentile, A.; Virzo De Santo, A. Functional diversity of the microbial community in Mediterranean maquis soils as affected by fires. Int. J. Wildland Fire 2005, 14, 355–363. [Google Scholar] [CrossRef]
  57. Kieft, T.L.; White, C.S.; Loftin, S.R.; Aguilar, R.; Craig, J.A.; Skaar, D.A. Temporal dynamics in soil carbon and nitrogen resources at a grassland-shrubland ecotone. Ecology 1998, 79, 671–683. [Google Scholar]
  58. Anderson, N.J.P.E.; Domsch, K.H. A Physiological method for the quantitative measurement of microbial biomass in soils. Soil Biol. Biochem. 1978, 10, 215–221. [Google Scholar] [CrossRef]
  59. Niro, E.; Marzaioli, R.; De Crescenzo, S.; D’Abrosca, B.; Castaldi, S.; Esposito, A.; Fiorentino, A.; Rutigliano, F.A. Effects of the allelochemical coumarin on plants and soil microbial community. Soil Biol. Biochem. 2016, 95, 30–39. [Google Scholar] [CrossRef]
  60. Muyzer, G.; Brinkhoff, T.; Nübel, U.; Santegoeds, C.; Schäfer, H.; Wawer, C. Denaturing gradient gel electrophoresis (DGGE) in microbial ecology. In Molecular Microbial Ecology Manual; Akkermans, A.D.L., van Elsas, J.D., Bruijn, F.J., Eds.; Kluwer Academic Publishers: Dordrecht, The Netherlands, 1997; pp. 1–27. [Google Scholar]
  61. Nübel, U.; Engelen, B.; Felske, A.; Snaidr, J.; Wieshuber, A.; Amann, R.I.; Ludwig, W.; Backhaus, H. Sequence heterogeneities of genes encoding 16S rRNAs in Paenibacillus polymyxa detected by temperature gradient gel electrophoresis. J. Bacteriol. 1996, 178, 5636–5643. [Google Scholar] [CrossRef] [PubMed] [Green Version]
  62. Agnelli, A.; Ascher, J.; Corti, G.; Ceccherini, M.T.; Nannipieri, P.; Pietramellara, G. Distribution of microbial communities in a forest soil profile investigated by microbial biomass, soil respiration and DGGE of total and extracellular DNA. Soil Biol. Biochem. 2004, 36, 859–868. [Google Scholar] [CrossRef]
  63. Manefield, M.; Griffiths, R.I.; Leigh, M.B.; Fisher, R.; Whiteley, A.S. Functional and compositional comparison of two activated sludge communities remediating coking effluent. Environ. Microbiol. 2005, 7, 715–722. [Google Scholar] [CrossRef]
  64. Sokal, R.R.; Rholf, F.J. Biometry: The principles and Practices of Statistic in Biological Research, 3rd ed.; W.H. Freeman & Company: New York, NY, USA, 1994. [Google Scholar]
  65. Fontúrbel, M.T.; Fernández, C.; Vega, J.A. Prescribed burning versus mechanical treatments as shrubland management options in NW Spain: Mid-term soil microbial response. Appl. Soil Ecol. 2016, 107, 334–346. [Google Scholar] [CrossRef]
  66. Fioretto, A.; Papa, S.; Pellegrino, A. Effects of fire on soil respiration, ATP content and enzyme activities in Mediterranean maquis. Appl. Veg. Sci. 2005, 8, 13–20. [Google Scholar] [CrossRef]
  67. Rutigliano, F.A.; Castaldi, S.; D’Ascoli, R.; Papa, S.; Carfora, A.; Marzaioli, R.; Fioretto, A. Soil activities related to nitrogen cycle under three plant cover types in Mediterranean environment. Appl. Soil Ecol. 2009, 43, 40–46. [Google Scholar] [CrossRef]
  68. Meira-Castro, A.C.; Shakesby, R.A.; Marques, J.E.; Doerr, S.H.; Meixedo, J.P.; Teixeira, J.; Chaminé, H.I. Effects of prescribed fire on surface soil in a Pinus pinaster plantation, northern Portugal. Environ. Earth Sci. 2015, 73, 3011–3018. [Google Scholar] [CrossRef] [Green Version]
  69. Coates, T.A.; Chow, A.T.; Hagan, D.L.; Wang, G.G.; Bridges, W.C., Jr.; Dozier, J.H. Frequent prescribed burning as a long-term practice in longleaf pine forests does not affect detrital chemical composition. J. Environ. Qual. 2017, 46, 1020–1027. [Google Scholar] [CrossRef] [PubMed]
  70. Ascher, J.; Ceccherini, M.T.; Pantani, O.L.; Agnelli, A.; Borgoni, F.; Guerri, G.; Nannipieri, P.; Pietramellara, G. Sequential extraction and genetic fingerprinting of a forest soil metagenome. Appl. Soil Ecol. 2009, 42, 176–181. [Google Scholar] [CrossRef]
  71. Rodríguez, J.; González-Pérez, J.A.; Turmero, A.; Hernández, M.; Ball, A.S.; González-Vila, F.J.; Arias, M.E. Physico-chemical and microbial perturbations of Andalusian pine forest soils following a wildfire. Sci. Total Environ. 2018, 634, 650–660. [Google Scholar] [CrossRef]
  72. Cookson, W.R.; O’Donnel, A.J.; Grant, C.D.; Grierson, P.F.; Murphy, D.V. Impact of Ecosystem Management on Microbial Community Level Physiological Profiles of Postmining Forest Rehabilitation. Microb. Ecol. 2008, 55, 321–332. [Google Scholar] [CrossRef]
  73. Capogna, F.; Persiani, A.M.; Maggi, O.; Dowgiallo, G.; Puppi, G.; Manes, F. Effects of different fire intensities on chemical and biological soil components and related feedbacks on a Mediterranean shrub (Phillyrea angustifolia L.). Plant Ecol. 2009, 204, 155–171. [Google Scholar] [CrossRef]
  74. Rutigliano, F.A.; Migliorini, M.; Maggi, O.; D’Ascoli, R.; Fanciulli, P.P.; Persiani, A.M. Dynamics of fungi and fungivorous microarthropods in a Mediterranean maquis soil affected by experimental fire. Eur. J. Soil Biol. 2013, 56, 33–34. [Google Scholar] [CrossRef]
  75. Rutigliano, F.A.; Fierro, A.R.; De Pascale, R.A.; De Marco, A.; De Santo, A.V. Role of fire on soil organic matter turnover and microbial activity in a Mediterranean burned area. Dev. Soil Sci. 2002, 28, 205–215. [Google Scholar]
  76. Wardle, D.A.; Ghani, A. A critique of the microbial metabolic quotient (qCO2) as a bioindicator of disturbance and ecosystem development. Soil Biol. Biochem. 1995, 27, 1601–1610. [Google Scholar] [CrossRef]
Figure 1. Study areas in the Campania region, Southern Italy, Google Earth Pro, July 4, 2019 (A). Control and burned plots in P. pinea (B) and P. pinaster (C) plantations.
Forests 11 00019 g001
Figure 2. P. pinea plantation. Mean (+ standard deviation) values of microbial biomass C (Cmic) (A,B), DNA yield (C,D), fungal mycelium (E,F), fungal fraction of Cmic (Cfung % Cmic) (G,H), respiration (I,J), metabolic quotient (qCO2) (K,L), and carbon mineralization rate (CMR) (M,N) in the fermentation layer (F-layer), and in the 5 cm soil underneath (S-layer) of control and burned plots at different times (3 h, and 33, 89, 189, 363 d) after treatment. Each graph reports significant effects of burning (B) and sampling time (T) as assayed by two-way ANOVA (on the top), and of burning alone at each sampling time, by Bonferroni test (with different letters on bars, p ≤ 0.01).
Forests 11 00019 g002
Figure 3. P. pinaster plantation. Mean (+ standard deviation) values of microbial biomass C (Cmic) (A,B), DNA yield (C,D), fungal mycelium (E,F), fungal fraction of Cmic (Cfung % Cmic) (G,H), respiration (I,J), metabolic quotient (qCO2) (K,L) and carbon mineralization rate (CMR) (M,N) in the fermentation layer (F-layer) and in 5 cm soil layer underneath (S-layer) of control and burned plots at different times (3 h, and 32, 87, 182, 371 d) after the treatment. Each graph reports significant effects of burning (B) and sampling time (T) as assayed by two-way ANOVA (on the top), and of burning alone at each sampling time, by Bonferroni test (with different letters on bars; p ≤ 0.01).
Forests 11 00019 g003
Figure 4. Genetic fingerprints of the bacterial community in P. pinea (A,B) and P. pinaster (C,D) plantations. For both plantation, two field replicates (a,b) for each experimental condition were analyzed at different times after prescribed fire (I, 3h; II, 33 d; IV, 189 d; and V, 363 d for P. pinea plantation and I, 3h; II, 32 d; IV, 182 d; and V, 371 d for P. pinaster plantation, respectively). M, marker Mass Ruler DNA Ladder mix.
Forests 11 00019 g004
Table 1. Stand structure, fuel load, and operative conditions during prescribed burning in two pine plantations 1.
P. pineaP. pinaster
Stand Structure
Tree density (n. ha−1)954 (±178)1294 (±243)
Tree cover (%)65 (±7.1)62.3 (±5.9)
Tree high (m)13.5 (±2.1)11.7 (±0.7)
Shrub cover (%)70.0 (±14.1)37.1 (±24.6)
Shrub high (m)1.8 (±3.5)1.9 (±1.2)
Herb cover (%)62.5 (±12.6)2.1 (±1.7)
Herb high (cm)32.5 (±5.0)15.0 (±0.7)
Fuel load (t ha−1)
Litter (<6 mm)6.4 (±1.1)14.8 (±1.7)
Woody litter (6–25 mm)1.4 (±1.0)2.7 (±2.3)
Herb fuels0.54 (±0.21)Not analysed
Weather data 2
Air temperature (°C)18 (±0.65)16 (±0.57)
Relative humidity (%)54 (±4.1)52 (±3.7)
Litter moisture (%)32 (±3.8)38 (±4.1)
Wind speed (km h−1)2.7 (±0.9)4.2 (±1.8)
Number of days since rain before the treatment817
Fire behavior
Ignition patternBackfireBackfire
Flame length (m)<0.5<1
Rate of spread (m min−1)0.14 (±0.04)0.19 (±0.03)
Fireline intensity (kW m−1)<50<150
Litter mean maximum temperature (°C) 347 (±202)574 (±205)
F-layer mean maximum temperature (°C) 95 (±136)438 (±97)
Mean residence of temperature (s) above 100 °C in the litter139 (±90)230 (±42)
Mean residence of temperature (s) above 100 °C under F-layer30 (±67) 180 (±70)
1 Data are means ± standard deviations, except for number of days since rain, flame length, and fireline intensity and 2 weather conditions were monitored, each 30 min during the burn, by a portable weather station (Kestrel 4500) positioned at 2 m above the ground.
Table 2. Mean (± standard deviation) values of soil pH, total (Ntot), and mineral N content (NH4+-N and NO3- -N content) in the control and burned plots of P. pinea (A) and P. pinaster (B) plantations at different times after burning. Results of two-way ANOVA for burning and sampling time were reported at the bottom of A and B, respectivey. N.S., nonsignificant. For each of 5 sampling times, significant differences between treatments (determinated by Bonferroni test at p ≤ 0.01) are indicated by different letters (a and b) in superscripts.
(A) Time after Burning (Sampling Date)pHNtot
(g kg−1 d.w.)
NH4+-N
(mg kg−1 d.w.)
NO3-N
(mg kg−1 d.w.)
3 h (12 March 2014)
Control7.2 (±0.6)2.0 (±0.5)1.6 (±1.1)4.6 (±1.3)
Burned6.6 (±0.8)2.6 (±0.7)4.1 (±2.8)7.0 (±2.1)
33 d (14 April 2014)
Control6.8 (±0.6)2.2 (±0.8)11.8 (±2.0)6.2 (±2.5)
Burned6.4 (±0.5)3.1 (±0.9)13.7 (±2.6)5.8 (±1.8)
89 d (9 June 2014)
Control6.5 (±0.7)2.7 (±0.9)7.6 (±0.7)7.6 (±3.6) a
Burned6.8 (±0.5)2.9 (±0.7)9.4 (±3.9)48.3 (±23.4) b
189 d (17 September 2014)
Control6.7 (±0.4)2.1 (±0.3)0.9 (± 0.3)24.0 (±7.7) a
Burned6.5 (±0.5)2.6 (±0.7)1.2 (±0.4)54.3 (±26.2) b
363 d (10 March 2015)
Control6.7 (±0.4)2.2 (±0.6)13.7 (±2.2)2.4 (±0.5)
Burned6.5 (±0.5)2.4 (±0.6)15.9 (±2.3)2.4 (±0.9)
BurningN.S.p < 0.05p = 0.001p < 0.001
Sampling timeN.S.N.S.p < 0.001p < 0.001
(B) Time after Burning (Sampling Date)pHNtot
(g kg−1 d.w.)
NH4+-N
(mg kg−1 d.w.)
NO3-N
(mg kg−1 d.w.)
3 h (21 March 2014)
Control5.6 (±0.5)4.5 (±3.0)1.3 (±1.0)1.8 (±0.3)
Burned6.2 (±0.4)4.9 (±4.8)2.2 (±1.5)1.7 (±0.1)
32 d (22 April 2014)
Control6.2 (±0.5)4.9 (±3.2)31.5 (±15.6) a4.0 (±1.1)
Burned6.4 (±0.2)1.2 (±0.4)14.3 (±5.0) b4.1 (±0.4)
87 d (16 June 2014)
Control6.1 (±0.5)1.5 (±0.9)2.0 (±0.2) 1.2 (±0.2)
Burned6.3 (±0.5)2.5 (±1.8)2.1 (±0.2)1.1 (±0.1)
182 d (19 September 2014)
Control6.0 (±0.5)7.4 (±3.3)3.4 (±1.6) a2.9 (±0.7)
Burned6.2 (±0.3)7.5 (±4.0)1.7 (±0.5) b2.4 (±0.5)
371 d (27 March 2015)
Control6.0 (±0.5)7.4 (±3.6)32.3 (±8.7)3.4 (±1.0)
Burned6.2 (±0.3)7.4 (±2.9)28.4 (±12.3)2.6 (±1.0)
Burningp < 0.05N.S.N.S.N.S.
Sampling timeN.S.p < 0.001p < 0.001p < 0.001
Table 3. Mean (± standard deviation) values of water content (WC), organic carbon (Corg), and extractable organic carbon (Cext) content in the fermentation layer (F-layer) and in the 5 cm soil layer underneath (S-layer) in control and burned plots of P. pinea (A) and P. pinaster (B) plantations at different times after burning. Results of two-way ANOVA for burning and sampling time were reported at the bottom of A and B, respectivey. N.S., nonsignificant. For each of 5 sampling times, significant differences between treatments (determinated by Bonferroni test at p ≤ 0.01) are indicated by different letters (a and b) in superscripts.
(A) Time after Burning (Sampling Date)F-LayerS-Layer
WC
(%)
Corg
(g kg−1 d.w.)
Cext
(g kg−1 d.w.)
WC
(%)
Corg
(g kg−1 d.w.)
Cext
(g kg−1 d.w.)
3 h (12 March 2014)
Control164 (±44)505.8 (±46.9)2.6 (±0.7)25 (±7)46.5 (±4.6)0.2 (±0.1)
Burned182 (±20)503.3(±42.8)2.6 (±0.4)31 (±8)48.8 (±11.1)0.3 (±0.04)
33 d (14 April 2014)
Control180 (±27)482.5 (±27.6)2.7 (±0.3)22 (±7)48.9 (±16.4)0.2 (±0.03)
Burned168 (±9)481.8 (±51.5)2.5 (±0.4)25 (±14)51.9 (±12.3)0.2 (±0.1)
89 d (9 June 2014)
Control34 (±10)422.2 (±60.3)1.1 (±0.3)15 (±11)45.1 (±5.4)0.1 (±0.04)
Burned35 (±11)367.7 (±37.1)1.9 (±0.3)18 (±14)46.1 (±7.7)0.2 (±0.04)
189 d (17 September 2014)
Control182 (±81)441.9 (±30.7)2.4 (±0.9)14 (±3)52.4 (±7.4)0.2 (±0.1)
Burned159 (±38)451.9 (±50.3)2.2 (±0.5)15 (±3)53.2 (±12.7)0.2 (±0.04)
363 d (10 March 2015)
Control172 (±21)359.7 (±50.2)2.8 (±0.7) a29 (±13)48.5 (±9.5)0.3 (±0.02)
Burned154 (±41)337.6 (±48.6)4.4 (±1.0) b28 (±11)49.6 (±9.5)0.3 (±0.1)
BurningN.S.N.S.p < 0.05N.S.N.S.N.S.
Sampling timep < 0.001p < 0.001p < 0.001p < 0.001N.S.p < 0.001
(B) Time after Burning (Sampling Date)F-layerS-layer
WC
(%)
Corg
(g kg−1 d.w.)
Cext
(g kg−1 d.w.)
WC
(%)
Corg
(g kg−1 d.w.)
Cext
(g kg−1 d.w.)
3 h (21 March 2014)
Control267 (±92) a413.9 (±39.1)2.6 (±0.7)54 (±14)82.8 (±5.9)0.3 (±0.1)
Burned147 (±41) b404.0 (±36.5)2.7 (±1.0)31 (±13)78.0 (±4.4)0.2 (±0.1)
32 d (22 April 2014)
Control258 (±76) a426.6 (±45.4)4.3 (±1.4)58 (±15)a79.0 (±8.2)0.3 (±0.1)
Burned179 (±33) b421.1 (±36.1)2.9 (±0.8)21 (±6)b75.7 (±15.3)0.2 (±0.1)
87 d (16 June 2014)
Control135 (±40)407.4 (±35.7)2.5 (±0.8)19 (±6)78.5 (±11.7)0.1 (±0.1)
Burned97 (±34)400.0 (±53.3)1.9 (±0.3)23 (±9)84.9 (±14.9)0.2 (±0.03)
182 d (19 September 2014)
Control292 (±32)430.3 (±46.3)4.7 (±1.0)162 (±32)75.8 (±12.7)0.5 (±0.2)
Burned264 (±41)429.3 (±47.1)4.4 (±1.1)140 (±47)77.2 (±4.6)0.5 (±0.2)
371 d (27 March 2015)
Control247 (±55)426.9 (±36.3)5.5 (±1.3)172 (±80)79.6 (±12.8)0.5 (±0.1)
Burned256 (±49)426.6 (±48.7)4.3 (±0.9)109 (±86)78.3 (±9.1)0.3 (±0.1)
Burningp < 0.001N.S.p < 0.05p < 0.001N.S.p < 0.05
Sampling timep < 0.001N.S.p < 0.001p < 0.001N.S.p < 0.001
Table 4. Mean (± standard deviation) values of richness, Shannon, and evenness indexs in control and burned plots of P. pinea (A) and P. pinaster (B) plantations at different times after burning. Results of two-way ANOVA for burning and sampling time were reported at the bottom of A and B, respectivey. N.S., nonsignificant.
(A) Time after Burning (Sampling Date)F-LayerS-Layer
Richness
(Band Number)
Shannon IndexEveness
Index
Richness
(Band Number)
Shannon IndexEveness
Index
3 h (12 March 2014)
Control27.0 (±0.0)3.1 (±0.1)0.96 (±0.00)39 (±0.0)3.3 (±0.1)0.91 (±0.02)
Burned27.5 (±2.1)3.1 (±0.0)0.92 (±0.02)36 (±4.2)3.3 (±0.1)0.93 (±0.00)
33 d (14 April 2014)
Control29.0 (±2.8)3.2 (±0.1)0.94 (±0.03)39.0 (±4.2)3.4 (±0.2)0.93 (±0.02)
Burned26.5 (±4.9)3.0 (±0.1)0.94 (±0.00)35.0 (±1.4)3.4 (±0.0)0.94 (±0.02)
189 d (17 September 2014)
Control24.0 (±4.2)3.0 (±0.1)0.96 (±0.00)39.0 (±1.4)3.5 (±0.1)0.95 (±0.05)
Burned25.5(±9.2)3.0 (±0.4)0.93 (±0.02)33.0(±0.0)3.3 (±0.1)0.94 (±0.02)
363 d (10 March 2015)
Control21.5 (±0.7)2.9 (±0.0)0.94 (±0.01)39.5 (±3.5)3.4 (±0.0)0.93 (±0.01)
Burned22.0 (±2.8)2.7 (±0.1)0.90 (±0.07)38.0 (±0.0)3.4 (±0.0)0.94 (±0.01)
BurningN.S.N.S.N.S. P < 0.05N.S.N.S.
Sampling timeN.S.N.S.N.S.N.S.N.S.N.S.
(B) Time after Burning (Sampling Date)F-layerS-layer
Richness
(band number)
Shannon indexEveness
index
Richness
(band number)
Shannon indexEveness
Index
3 h (21 March 2014)
Control39.5 (±2.1)3.6 (±0.1)0.97 (±0.02)40.0 (±5.7)3.5 (±0.1)0.96 (±0.00)
Burned36.5 (±0.7)3.5 (±0.1)0.96 (±0.01)37.0 (±1.4)3.5 (±0.1)0.96 (±0.02)
32 d (22 April 2014)
Control38.0 (±4.2)3.5 (±0.1)0.97 (±0.01)36.0 (±2.8)3.4 (±0.2)0.95 (±0.03)
Burned36.0 (±2.8)3.5 (±0.1)0.97 (±0.01)38.0 (±1.4)3.5 (±0.0)0.95 (±0.01)
182 d (19 September 2014)
Control44.0 (±2.82)3.7 (±0.1)0.98 (±0.01)38.0 (±7.1)3.5 (±0.1)0.96 (±0.01)
Burned41.5 (±3.5)3.6 (±0.1)0.96 (±0.01)29.0 (±7.1)3.2 (±0.2)0.96 (±0.01)
371 d (27 March 2015)
Control43.5 (±0.7)3.7 (±0.0)0.97 (±0.00)43.5 (±2.1)3.7 (±0.0)0.98 (±0.00)
Burned42.0 (±0.0)3.5 (±0.1)0.94 (±0.01)42.0 (±5.7)3.6 (±0.1)0.96 (±0.00)
BurningN.S.N.S.N.S.N.S.N.S.N.S.
Sampling timep < 0.05N.S.N.S.N.S.N.S.N.S.

