Leaf and Crown Optical Properties of Five Early-, Mid- and Late-Successional Temperate Tree Species and Their Relation to Sapling Light Demand

Plant Ecology, Albrecht von Haller Institute for Plant Sciences, University of Goettingen, 37073 Goettingen, Germany
*
Author to whom correspondence should be addressed.
Forests 2019, 10(10), 925; https://doi.org/10.3390/f10100925
Submission received: 18 September 2019
/
Revised: 1 October 2019
/
Accepted: 9 October 2019
/
Published: 21 October 2019
(This article belongs to the Special Issue Tree Crown Dynamics and Morphology)
Abstract
:The optical properties of leaves and canopies determine the availability of radiation for photosynthesis and the penetration of light through tree canopies. How leaf absorptance, reflectance and transmittance and radiation transmission through tree canopies change with forest succession is not well understood. We measured the leaf optical properties in the photosynthetically active radiation (PAR) range of five Central European early-, mid- and late-successional temperate broadleaf tree species and studied the minimum light demand of the lowermost shade leaves and of the species’ offspring. Leaf absorptance in the 350–720 nm range varied between c. 70% and 77% in the crown of all five species with only a minor variation from the sun to the shade crown and between species. However, specific absorptance (absorptance normalized by mass per leaf area) increased about threefold from sun to shade leaves with decreasing leaf mass area (LMA) in the late-successional species (Carpinus betulus L., Tilia cordata Mill., Fagus sylvatica L.), while it was generally lower in the early- to mid-successional species (Betula pendula Roth, Quercus petraea (Matt.)Liebl.), where it changed only a little from sun to shade crown. Due to a significant increase in leaf area index, canopy PAR transmittance to the forest floor decreased from early- to late-successional species from ~15% to 1%–3% of incident PAR, linked to a decrease in the minimum light demand of the lowermost shade leaves (from ~20 to 1%–2%) and of the species’ saplings (from ~20 to 3%–4%). The median light intensity on the forest floor under a closed canopy was in all species lower than the saplings’ minimum light demand. We conclude that the optical properties of the sun leaves are very similar among early-, mid- and late-successional tree species, while the shade leaves of these groups differ not only morphologically, but also in terms of the resource investment needed to achieve high PAR absorptance.
Keywords:
absorptance; Betula; Fagus; minimum light demand; PAR; Quercus; shade leaves; sun leaves; transmittance1. Introduction
Plant productivity depends on the optical properties of leaves and tree crowns, as they influence the availability of radiation for photosynthesis. Foliar optics, i.e., the spectral absorptance, reflectance and transmittance in the photosynthetically active radiation (PAR) range (380–760 nm), also determine, together with the spatial distribution of leaves, the penetration of light through plant canopies and how much radiation is available for lower leaf strata and at the forest floor [1]. Yet, radiation distribution in canopies is difficult to predict, partly as a consequence of the fact that radiation has direct and diffuse components, and radiation intensity and quality are markedly altered by the foliage itself. Major determinants of leaf spectral PAR reflectance, transmittance and absorptance are the chlorophyll concentration per leaf dry mass [2], and the leaf thickness or leaf mass area (LMA) [3]. The leaf chlorophyll concentration commonly decreases with an increasing radiation intensity, while LMA and leaf thickness typically increase [4]. Along the light intensity gradient from the sun to the shade crown and from the open to the deep shade, these adaptive modifications act in opposite directions. Therefore, it is difficult to predict how leaf reflectance, transmittance and absorptance are changing along light-intensity gradients and how they differ between the foliage of light-demanding early-successional and shade-tolerant late-successional trees.
A key determinant of leaf and crown optical properties is the tree functional type, notably the contrast between needle-leaved and broad-leaved, and deciduous and evergreen trees. The species’ role in forest succession may also influence foliar optics and the penetration of radiation through the canopy, because the growth strategies of early- and late-successional tree species are typically different with possible consequences for crown architecture and foliage distribution. Shade-intolerant pioneer trees often develop multi-layered canopies [5], while shade-tolerant late-successional species tend to have mono-layered canopies, at least in the lower crown. Such a structural difference must influence the canopy radiation transmittance and thus light availability in the shade crown and on the ground. Whether leaf and crown optical properties are influenced by phylogeny is not well known, yet.
There is a wealth of studies about species differences in leaf optics, comparing different growth forms, habitats and light environments [3,6,7,8]. Leaf spectral reflectance as an indicator of plant stress has attracted particular attention, especially in trees, as it can be monitored by remote-sensing techniques [9,10,11]. Less well studied are tree species differences in leaf transmittance and absorptance, despite their large influence on photosynthetic CO2 fixation and the consequences for tree regeneration and forest dynamics. Multi-species comparisons of leaf transmittance, reflectance and absorptance properties may help to understand how the optical properties of leaves vary among tree species in dependence on functional type, successional position and environment. Such studies have been conducted for tropical pioneer and late-successional forests [8,12], but early- and late-successional trees from temperate forests have not been studied systematically in this respect.
In this study, we compare five widespread temperate, early- to late-successional tree species with different crown architectures regarding (1) the optical properties of their sun and shade leaves, and (2) the canopy light transmittance and the minimum light demand of their shade leaves and offspring. From an earlier study that investigated species differences in leaf morphology, leaf angles and crown shape between these early- to late-successional species [13], we assume that shade-tolerant late-successional species exhibit greater sun-shade crown differences in foliar PAR absorptance and reflectance properties than early-successional species, but that these functional groups also differ in their sun leaf optics. Since the leaf area index was found to increase from early- to late-successional species in this species sample [13], we further expect a marked decrease in canopy radiation transmittance to the ground and an associated decrease in the minimum light demand of the species’ lowermost shade leaves and the foliage of their saplings.
2. Materials and Methods
2.1. Study Sites
The study was conducted in 10 forest stands in northwest and central Germany that were dominated by one of the five tree species Betula pendula Roth (silver birch), Quercus petraea (Matt.) Liebl. (sessile oak), Carpinus betulus L. (European hornbeam), Tilia cordata Mill. (little-leaved linden), and Fagus sylvatica L. (European beech). The five target species belong to four different families (Betulaceae, Pinaceae, Fagaceae, Malvaceae) and are widespread in the natural forest vegetation of Central Europe, representing either early- (Betula, Quercus), mid/late- (Quercus, Carpinus) or late-successional species (Tilia, Fagus) of a forest succession after stand-level disturbance. The species differ considerably in their morphology and physiology, notably with respect to light demand at juvenile stage (light-demanding to highly shade-tolerant), crown architectural type, wood density (490–790 g cm−3), tree lifespan (short- vs. long-lived), leaf type and longevity (broadleaf deciduous vs. coniferous evergreen), xylem anatomy (ring- or diffuse-porous, coniferous), and drought tolerance (low to high) (see Table 1). In terms of the shade tolerance of the adults, the species can be ranked in the sequence Fagus > Tilia = Carpinus > Quercus > Betula.
All 10 stands investigated had a closed canopy with canopy openness <10%, and were composed of mature or at least pre-mature trees in the upper canopy layer. In most stands, a variable number of stems of other species were also present. Mean diameter at breast height (dbh), tree height and age varied among the five species with the Q. petraea stands being older, and the B. pendula stands younger than the average (Table 2). The stem density of the stands varied with the crown dimensions of the species; it was particularly low in the Q. petraea stands. While most stands are located in the lowlands of northwest Germany on Pleistocene sandy to loamy glacial deposits, a minority of stands was selected in the central German uplands on variable Mesozoic bedrock. Soil types were dystric Cambisols on poor sand to eutric Cambisols and Leptosols on limestone (Table 3). The climate of the region is temperate sub-oceanic with 650–850 mm of annual precipitation and an annual mean temperature of 8–10 °C (Table 4).
2.2. Analysis of Leaf Optical Properties
Transmittance and reflectance spectra of fresh leaves were measured with a Kontron Uvikon 900 spectroradiometer (Kontron Instruments; supplied by Tresser Instruments, Rossdorf, Germany) coupled to an integrating Ulbricht sphere. The transmittance and reflectance of radiation in the 350–720 nm wavelength interval was measured at a spectral resolution of 1 nm by placing the leaves at 90° to the radiation beam in the photometer. Measurements were conducted with leaves that were harvested in mid-summer (July) in two trees per species that occupied dominant positions in the upper canopy. Ten branches per species (five per tree) were collected at five height levels in the crown, re-cut under water and transported to the laboratory, where they were kept at 5 °C until measurement within 24 h. Sampling was done at about 0.1, 0.4, 0.5–0.6, 0.7–0.8 and 0.90–0.95 relative canopy height in the Carpinus, Tilia and Fagus trees, and at about 0.5, 0.7, 0.8, 0.9 and 0.95 relative height in the Betula and Quercus trees to cover the known leaf morphology gradient in the canopy of the species (see [13]). Sampling was conducted by tree climbing in the Carpinus and Tilia trees and through access via existing scaffolding towers in the Betula, Quercus and Fagus trees. The height of the sampled trees was 20–27 m; all trees were dominant trees in the upper canopy layer. The height of the sampled trees was close to the population mean in the study plots.
Intact leaves of representative size for that height level were investigated. The leaf size was selected according to the previous study of [13] on leaf size distribution in the crown of these trees. Five leaves per branch were chosen at about 15–20 cm distance to each other and measured, resulting in 10 leaves per height and species from two different trees. Leaf transmittance was analyzed by illuminating the adaxial surface in such a way that light passed through the leaf lamina into the integrating sphere. To consider also the specular properties of the leaf surface [21], we conducted an additional measurement by arranging the leaves with 8° inclination over a rectangular position to the light source, i.e., at 82° to the beam. This gives higher reflectance values than measurement at 90°, as the reflectance directly into the light source is also recorded. Absorptance was computed as 100 minus transmittance plus reflectance.
Leaf absorptance data were normalized by leaf dry mass per m−2 (LMA) to obtain mass-specific absorptance, i.e.,% absorptance per g leaf dry mass m−2. LMA was determined in felled trees that were sliced into 2 m-high layers. All leaves in a layer were sampled quantitatively for mass determination after drying at 70 °C for 48 h (see [13]). Five branch samples with about 25 leaves were collected by random in every height layer of a tree for determining leaf size and LMA using a scanner and the software WinFolia (Régent Instruments, Quebec, Canada).
The leaf area index (LAI) was measured in all 10 stands in 1998 and 1999 by litter collection with 10 circular litter buckets with a 0.287 m2 aperture that were installed at fixed distances of 2.2 m in stand sections with closed canopy. The litter was collected on two dates (November/December and February/March) and the material sorted into the fractions leaves, twigs and fruits and separated by species. The leaf mass per area (LMA) of the litter was obtained by collecting 50 randomly selected leaves from every bucket and by subsequently scanning them for leaf area determination (WinFolia, Régent Instruments, Quebec, Canada). The dry mass was determined afterwards (70 °C, 48 h). The LAI of the target species and admixed species (if present) was derived from multiplying LMA with the leaf mass and relating the leaf area to the bucket aperture.
2.3. Canopy Transmissivity and Minimum Light Demand of Shade Leaves and Juveniles
In two to six stands per species, we measured photosynthetic photon flux density (PPFD; conventionally defined as 380–760 nm) with quantum sensors (LI-190SA, LiCor Inc., Lincoln, NE, USA) above the canopy, on the forest floor, at the height of the lowermost (darkest) shade leaves, and directly above tree saplings to calculate canopy transmissivity for PAR, and to determine the minimum light demand of shade leaves and tree offspring of the respective species. Those 10 stands listed in Table 2, plus eight additional stands in the neighborhood (nos. 11–18), were investigated. Two quantum sensors were connected to the same data logger (CR10, Campbell Scientific, Logan, UT, USA) and read every 10 sec to measure incident PPFD synchronously to below-canopy flux density, allowing to express below-canopy PPFD in percent of incident flux density. In a few stands, the first sensor was attached to an 800 m-long cable to record incident PPFD above the canopy on top of scaffolding towers. In the majority of stands, towers were not available and incident radiation was measured outside the forest in the open or, alternatively, in the center of large forest gaps. In two cases, suitable gaps were not available and the sensor was operated with an independent synchronized logger at a distance of c. 1.4 km to the forest plots. The second sensor was used in the forest interior to record PPFD at a large number of predefined locations on the forest floor in order to obtain average flux densities for the forest floor, and also at the height level of shade leaves and saplings of the respective species. The sensor was attached to the end of a 2 m-long pole with a cardanic mounting in order to keep it in horizontal position without shading by the operator. Both sensors were calibrated against each other before the start of the measuring campaigns.
Measurements were conducted in the three summers 1996, 1998 and 1999 under high solar angles (11 a.m. to 2 p.m.) exclusively on days with overcast sky in the period of maximum leaf area development (early June to early July). The measurements on the forest floor were conducted in rectangular plots of 4 × 10 or 10 × 10 m size with a grid width of 1 m, with one side of the rectangle leaning to a stem and the plot covering a large part of the inter-stem space between directly neighboring trees (see Figure S1 in the Supplement). One measurement was conducted on every grid point, resulting in 55 to 121 measuring points per plot. Two plots per site were demarcated in forest sections with a relatively homogeneous and closed canopy and absence of a shrub layer, resulting in at least four measuring plots (and 220 to > 400 measuring points) per tree species. Synchronously measured PAR flux densities (PPFD) on the forest floor and above the canopy (or in the open) were used to calculate relative PAR intensities in percent of incident radiation. Using the Monsi and Saeki formulation of Lambert–Beer’s law ([22]) and applying it to incident and transmitted PAR intensity allowed calculating the canopy extinction coefficient KPAR from
with I being the PAR flux density below the canopy (forest floor), I0 incident PAR flux density, K the canopy extinction coefficient for PAR (KPAR), and LAI the leaf area index.
We further applied the Monsi–Saeki equation to estimate the clumping index Ω of foliage and axial elements in the canopy using measured data of total leaf area (F), mean leaf angle over the horizon (α) and leaf transmittance (τ) in the stands (according to data from [13]), and considering the sun’s angle θ during the radiation measurements:
with u = sin θ, and F’ = F · (1 − τ) · β · Ω. The last expression was solved for Ω and considers the influence of leaf area, leaf optical properties, and canopy element clumping on the interception of PAR in the canopy. β is the spectral sensitivity of the quantum sensors.
For determining the minimum light demand of shade leaves and saplings, we selected a large number of shade leaves and saplings (size: 50–90 cm) in the darkest sections of the forest understory (typically 120 objects per species at distances of 10 to several 100 m). Here we define the minimum light demand of a leaf or plant as the lowest PPFD value (expressed in percent of incident radiation) in our data set that was measured in the field directly above a leaf or plant, assuming that darker sites could not be colonized due to shortage of energy. These values represent minimum, and not average, light intensities, as found in the vicinity of shade leaves and saplings of the five species. In contrast, the PPFD values recorded in the forest floor plots reflect the full spectrum of PAR transmissivities observable under closed-canopy sections of the respective forests.
2.4. Statistical Analyses
In case of leaf transmission and absorption spectra, curves averaged over 10 measured leaves are given. Standard deviation is given only in graphs, were this is feasible in terms of clarity. All data were tested for normal distribution with a Shapiro–Wilk test. Since the light transmission data showed pronounced left-skewed distribution, the results are presented in box-whisker plots with median, 25- and 75-percentiles and maxima and minima. Plot means of PPFD are compared among species and between forest floor, shade leaves and saplings with the Mann–Whitney U-test for unbalanced, non-normally distributed data, followed by a pair-wise comparison of means ([23]). These analyses were conducted with SAS software (SAS Institute, Cary, NC, USA). A significance level of p < 0.05 was used throughout the study.
3. Results
3.1. Leaf Optical Properties
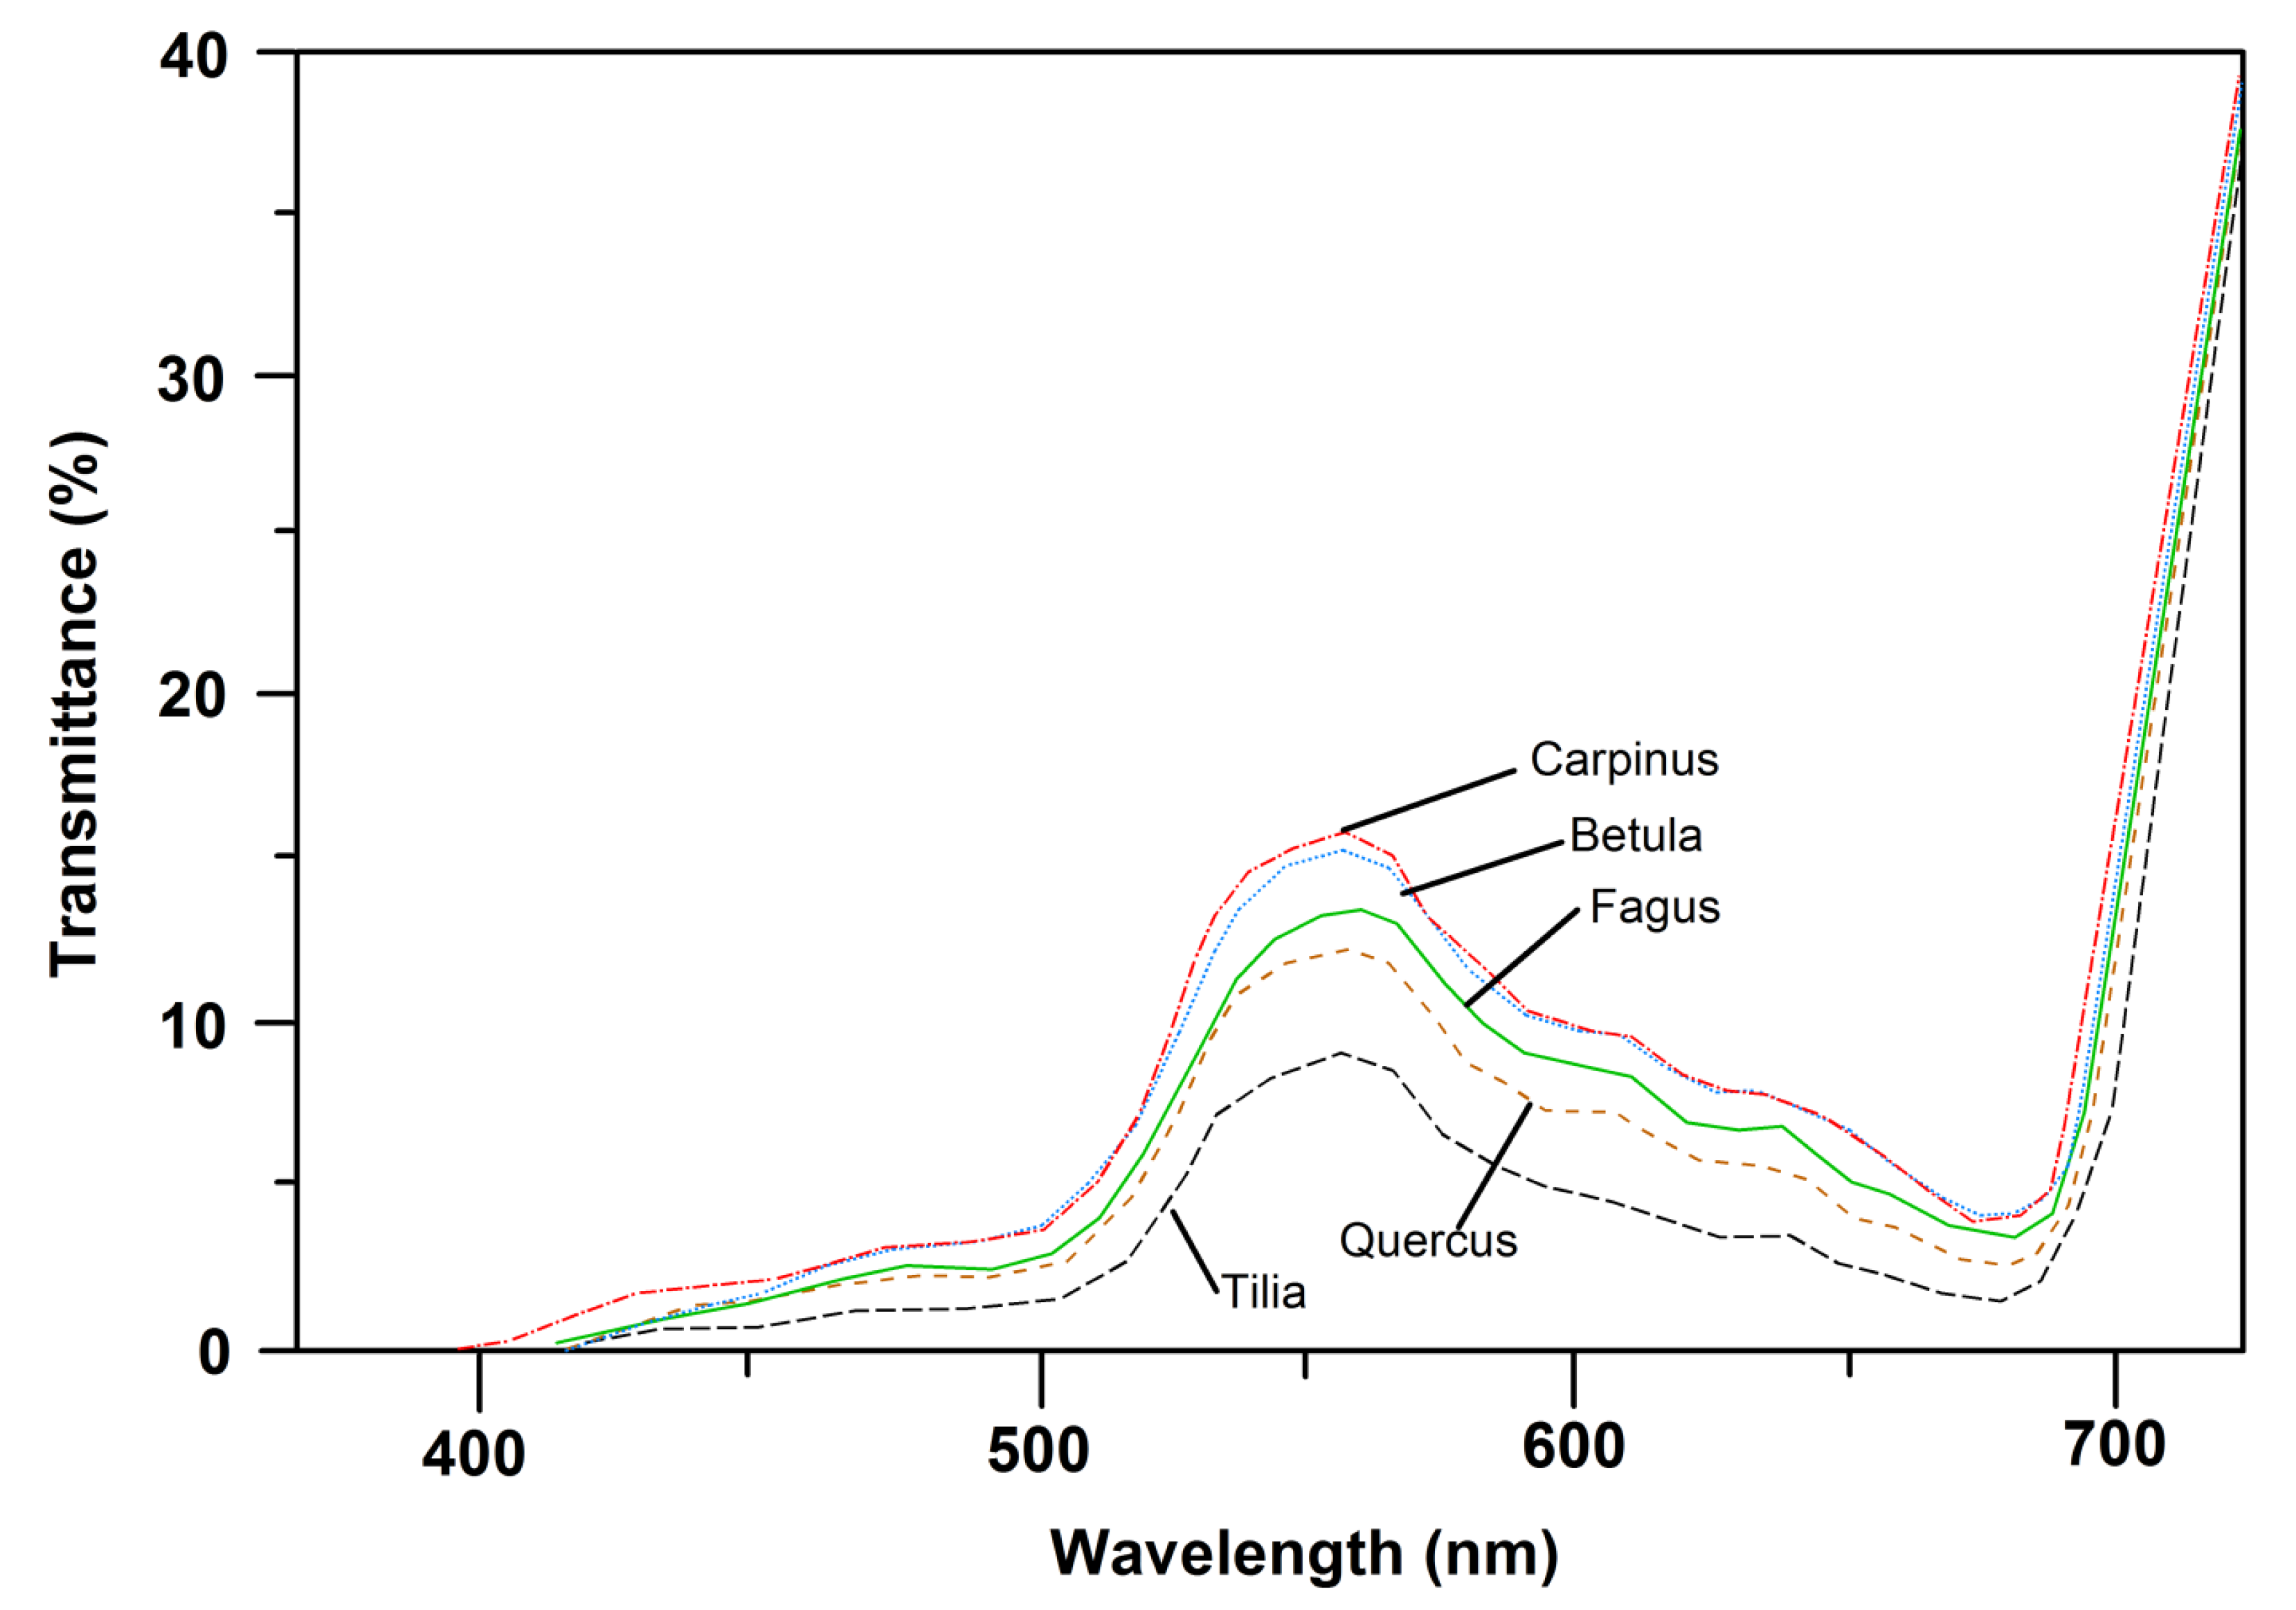
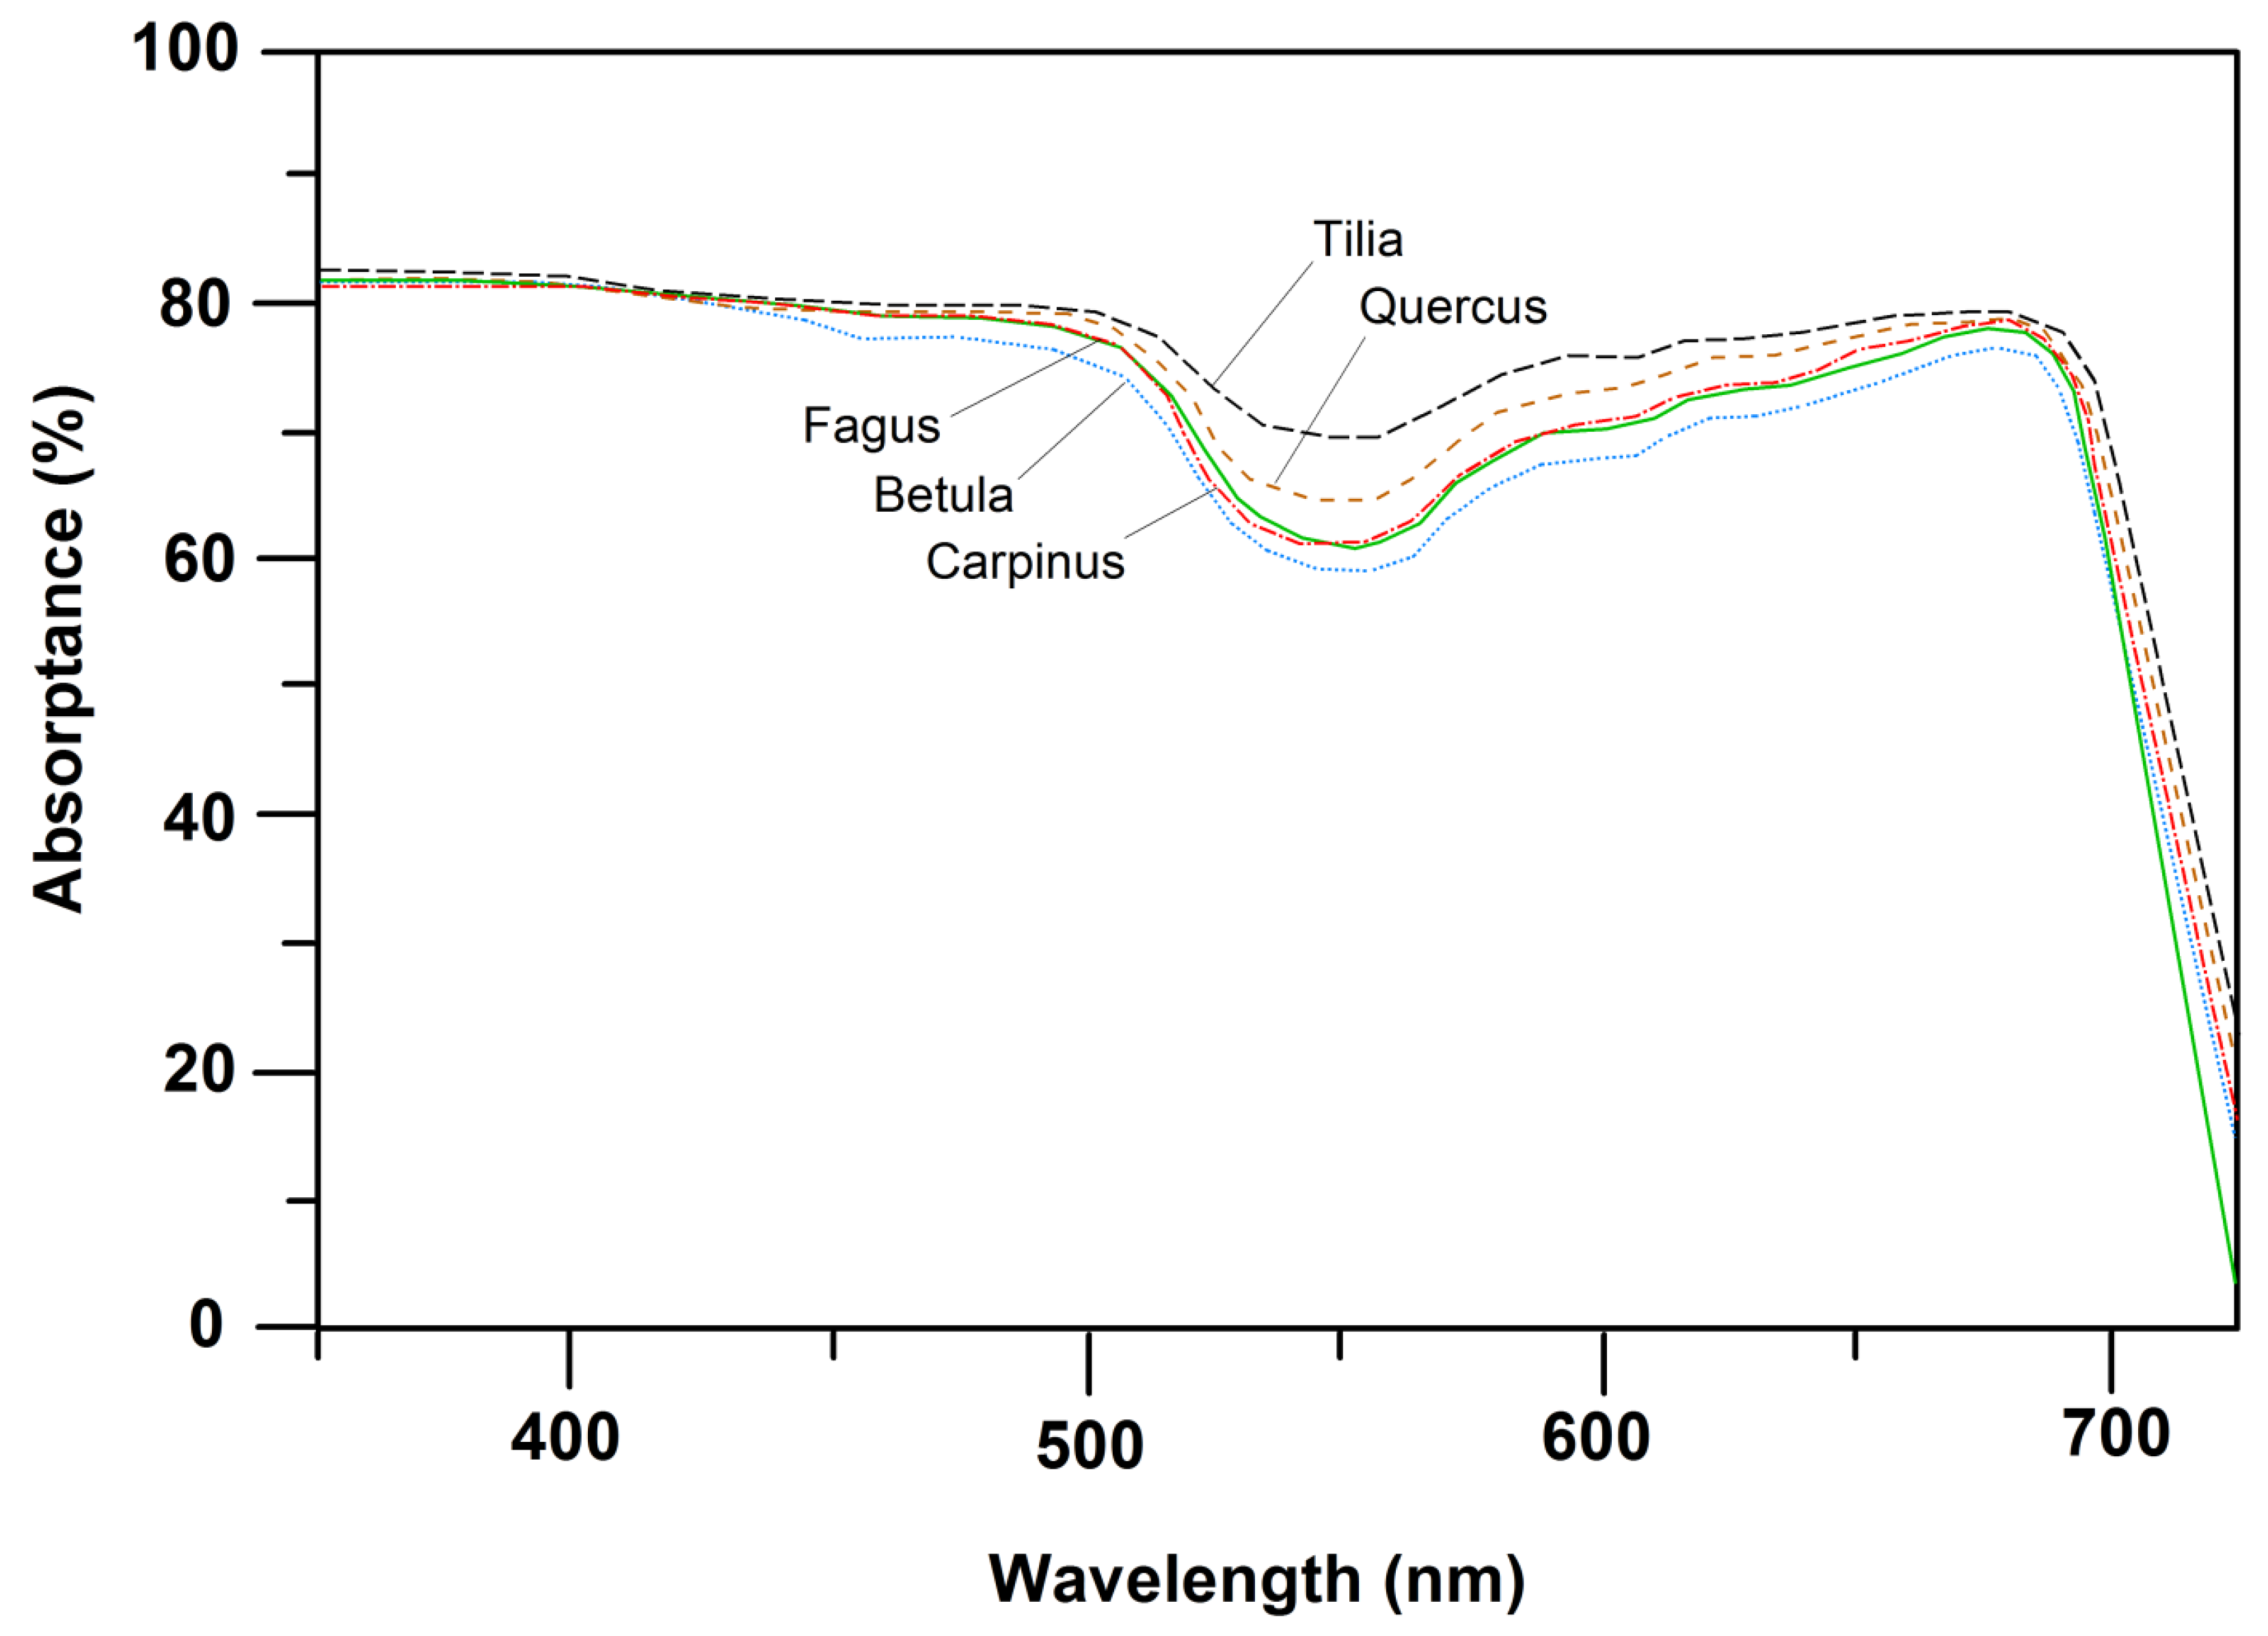
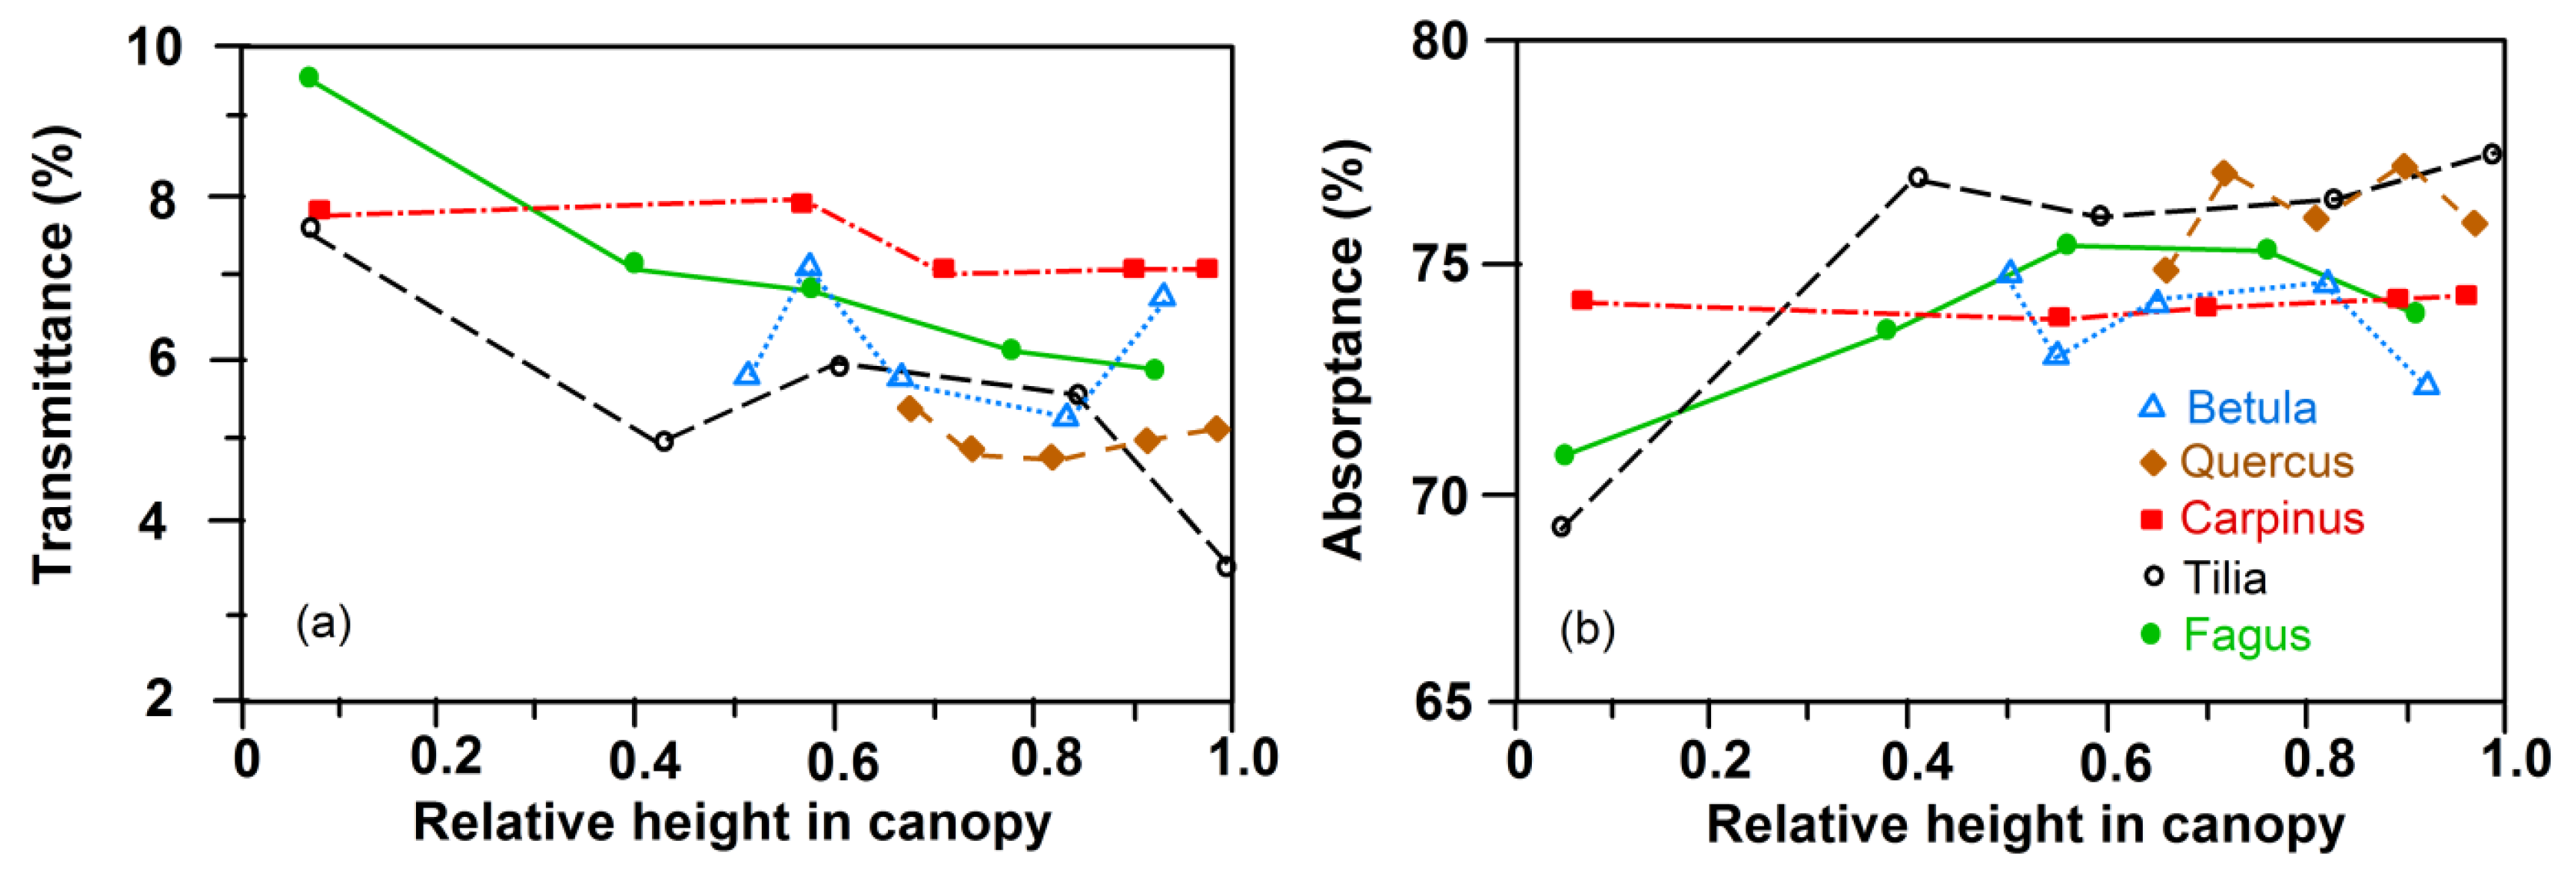
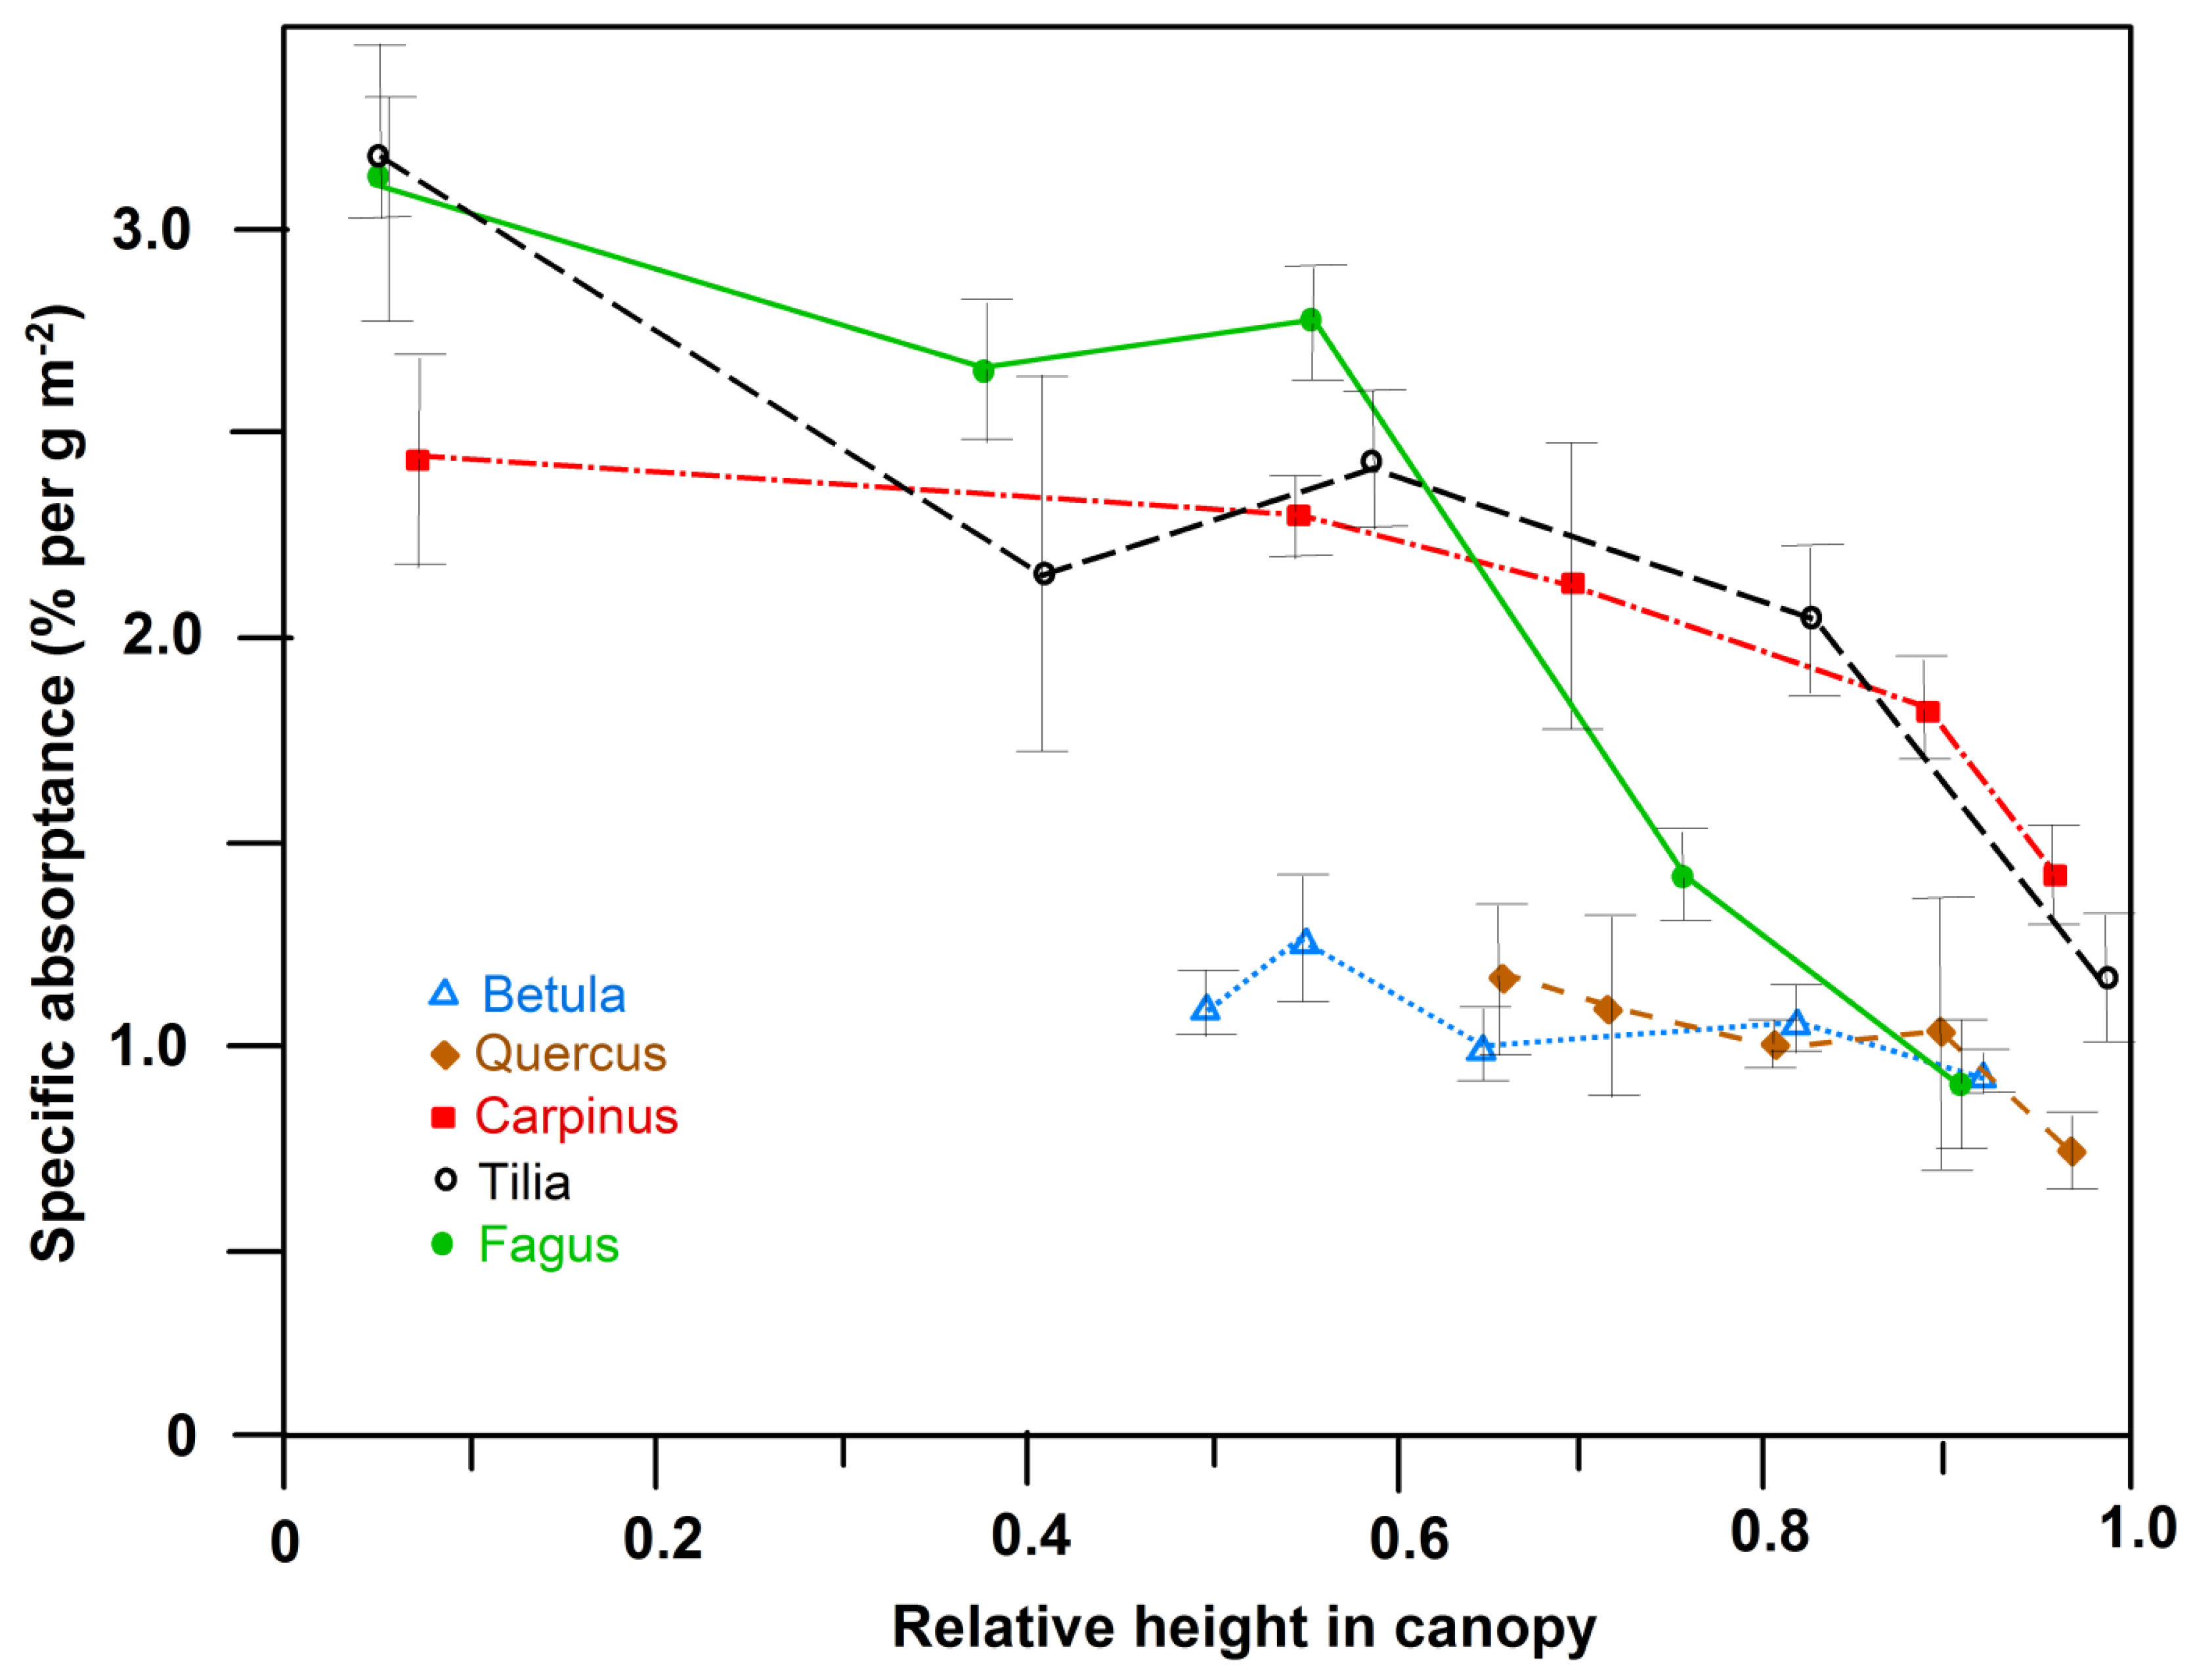
All five species exhibited a similar shape of the transmission curve (PAR range: 350–720 nm) of upper sun-crown leaves, irrespective of their position in succession. However, species differences in transmittance in particular in the 500–600 nm wavelength interval (green light) were visible, with roughly twice as high a transmittance of C. betulus and B. pendula than of T. cordata leaves in this range (Figure 1). The transmittance of F. sylvatica and Q. petraea leaves was intermediate in this wave band. Correspondingly, the absorptance in the 500–600 nm interval decreased in the sequence T. cordata > Q. petraea > F. sylvatica, C. betulus > B. pendula, with no clear dependence on position in succession (Figure 2). The transmittance of leaves, integrated over the 350–720 nm interval, varied between 3.4% and 7.2% and increased from the sun to the shade crown in T. cordata, C. betulus and B. pendula in correspondence with the decrease in leaf mass area (LMA) and leaf thickness. In F. sylvatica and Q. petraea, only a weak tendency to a downward increase in the crown was visible (Figure S3 and Figure 3a). Leaf absorptance in the 350–720 nm range varied between c. 70% and 77% in the crown of the five species with only a minor change from the sun to the shade crown (Figure S2 and Figure 3b; with consideration of leaf specular properties). An exception was the lowermost shade leaves of F. sylvatica and T. cordata, in which low LMA was linked to particularly low PAR absorption (significant sun–shade leaf difference). Sun leaf absorptance integrated over the 350–720 nm range was by 2%–3% higher in T. cordata than in the other species, while the integral of shade leaf absorptance was not different among the species (Figure S2). Specific absorptance, i.e., absorption normalized by leaf mass per area, showed much larger variation among the species and height levels in the crown than the absolute absorption values. The three late-successional species F. sylvatica, T. cordata and C. betulus achieved a much higher PAR absorption in the shade crown for an investment of leaf mass per area than early-successional B. pendula and mid/late-successional Q. petraea (Figure 4). Specific absorptance increased about threefold from crown top to bottom with decreasing LMA in the former species, while it changed only little from sun to shade leaves in B. pendula and Q. petraea.
The extinction coefficient for PAR (KPAR) in the canopy as calculated with the Monsi-Saeki equation [15] from PAR flux density data above and below the canopy for conditions of diffuse radiation (Equation (1)) varied between 0.48 and 0.51 in the four mid- or late-successional species, but was lower (0.37) in early-successional B. pendula (Table 5).
3.2. Canopy Transmittance and Minimum Light Demand of Foliage
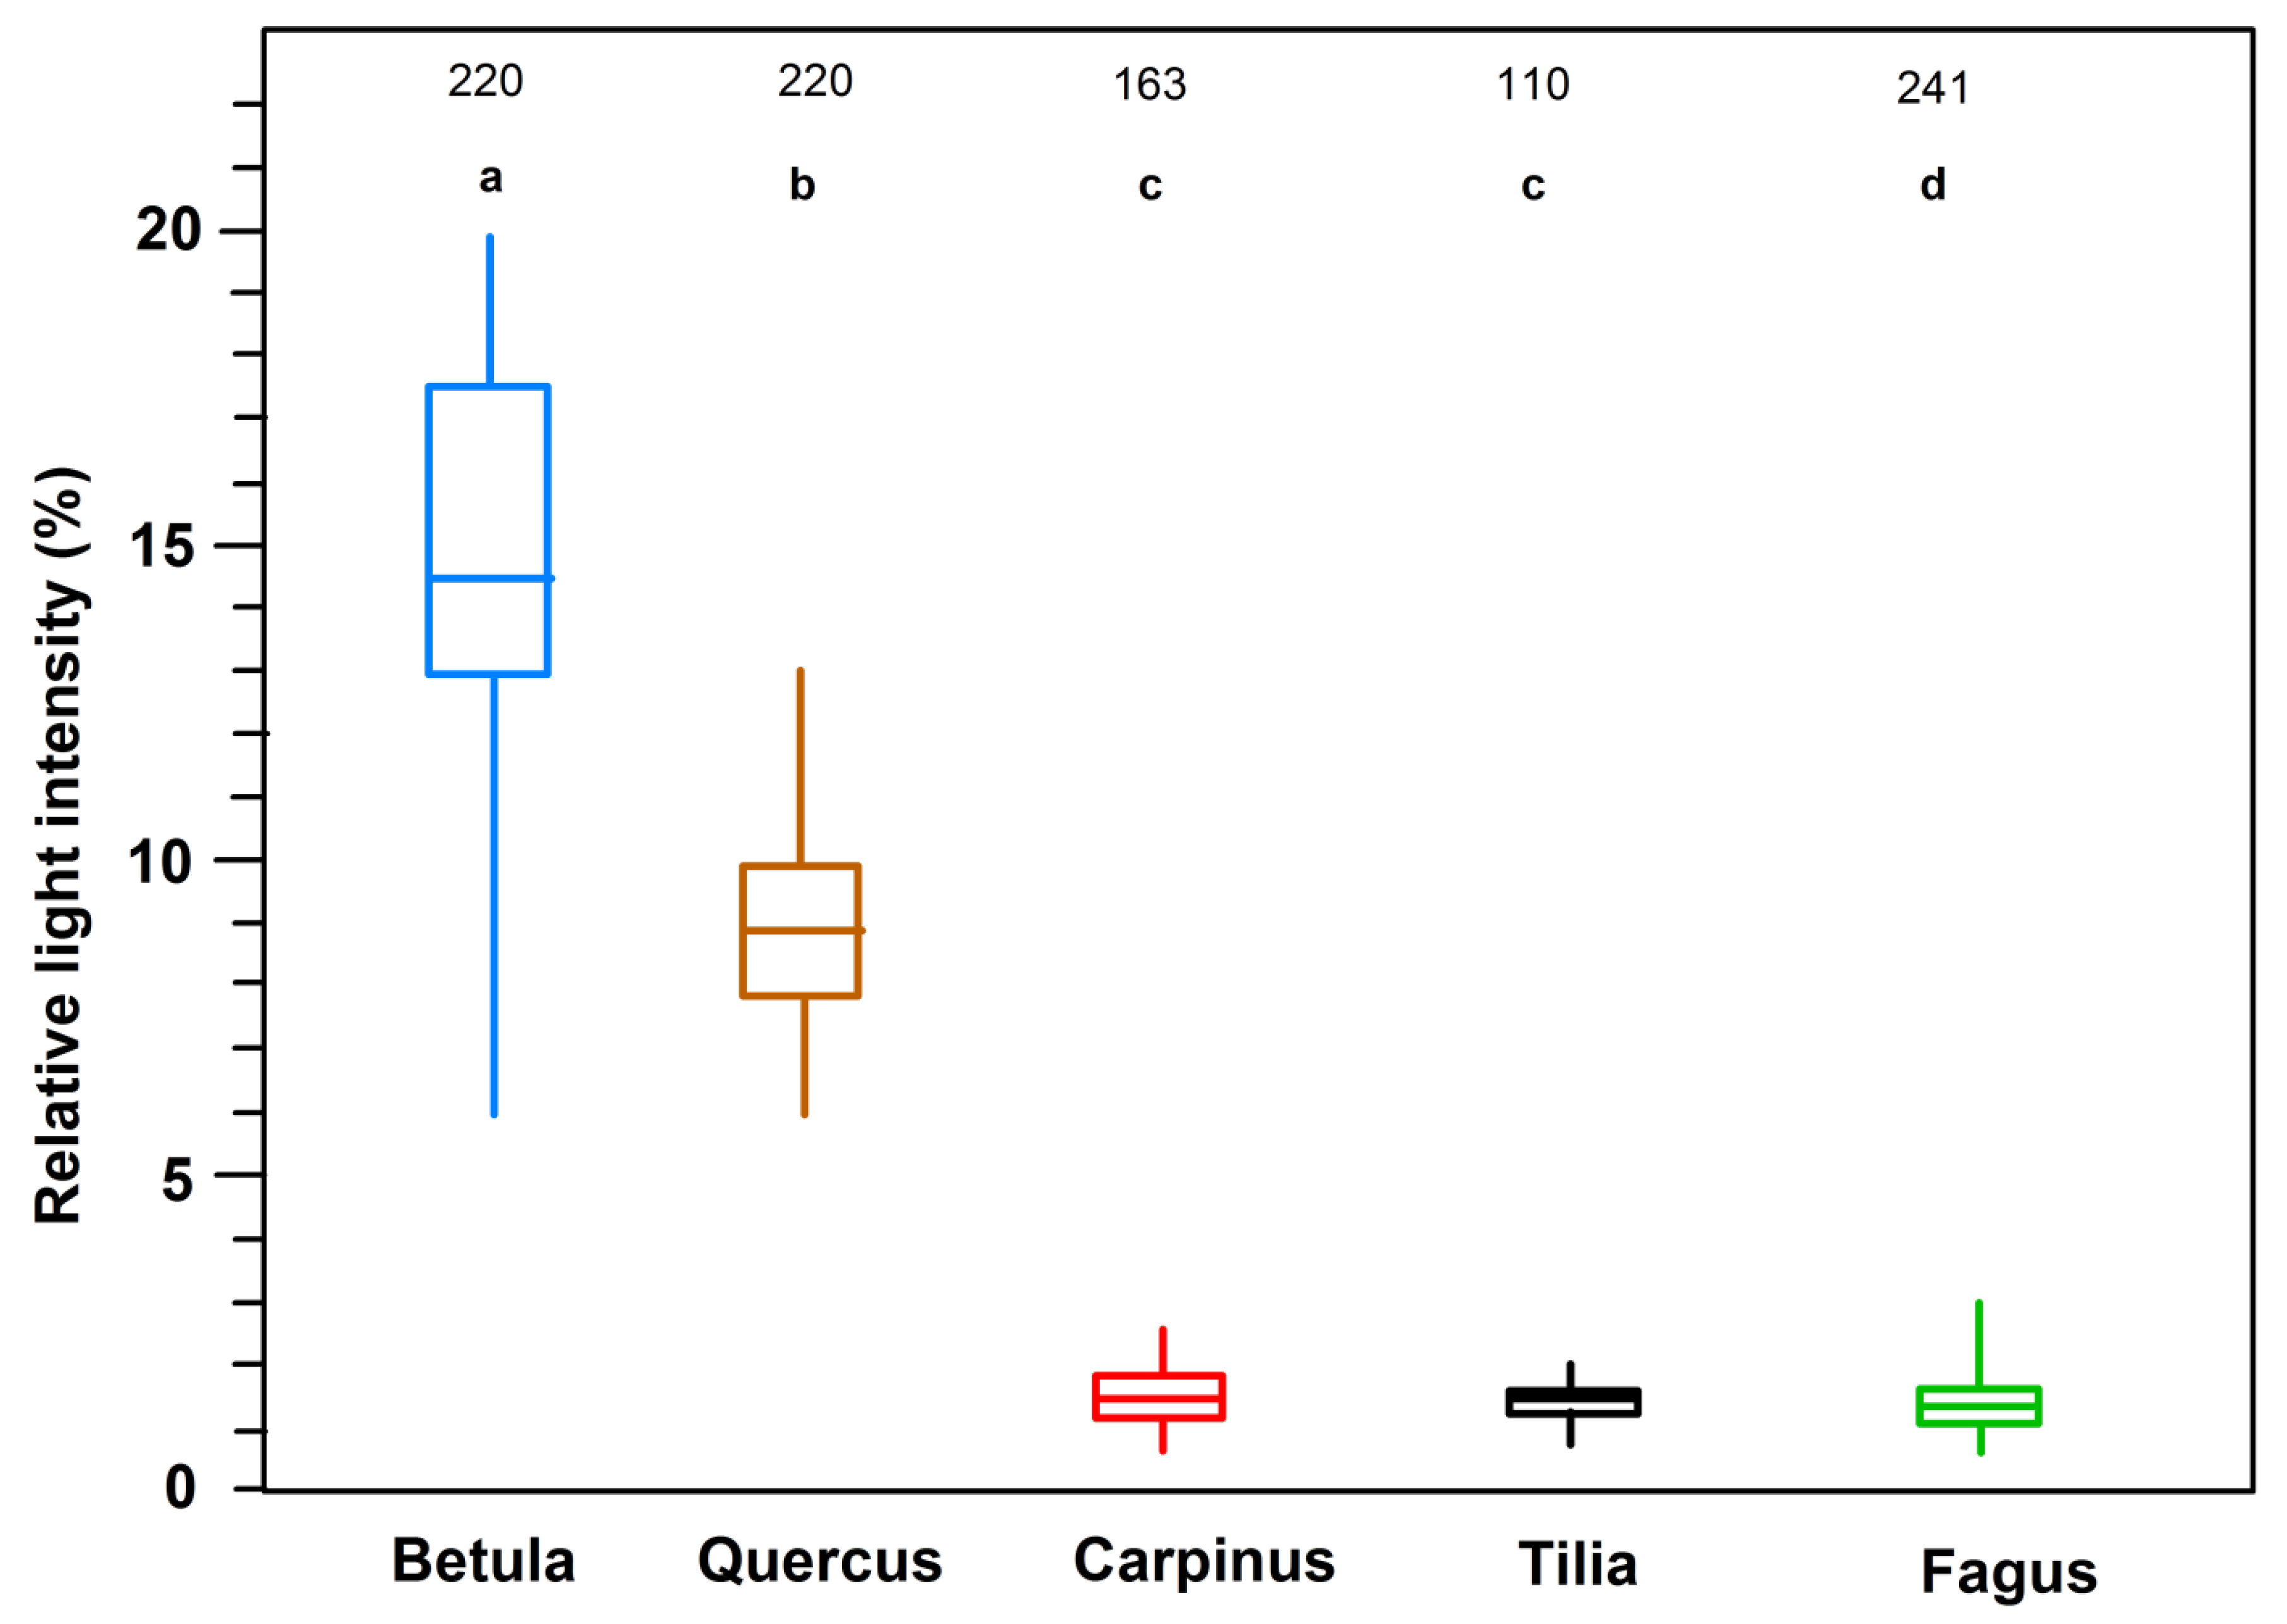
Closed stands of the five species differed considerably in the PAR transmittance of their canopies. A median transmission of 14.8% was recorded in the B. pendula stands, with individual values varying between 6.4% and 19.8% (Figure 5). This contrasts with the dark understory of late-successional T. cordata (median: 1.4%), C. betulus (1.3) and F. sylvatica (1.3), where individual transmittance values ranged between 0.6% and 2.8%. Mid/late-successional Q. petraea took an intermediate position with a median of 8.4% for the two studied stands (range: 4.9–12.8%). The investigation of two to six stands per species shows that median values from different stands are quite similar in most cases (Figure S4 in the Supplement); an exception is the T. cordata stand #8. Differences are caused by stand age (100- to 150-year-old F. sylvatica stands (nos. 9, 10, 16–18): 0.9%–2.1%; 26-year-old F. sylvatica stand (no. 15): 0.7%) and inter-annual variation (values from 1999 always lower than from 1998), reflecting spatial or temporal variation in canopy density and leaf area. Differences in stand structure and canopy homogeneity are also reflected in the stand-level variation of transmission values as displayed in the box-whisker plots of Figure S4.
The clumping index Ω of foliar and canopy axis elements as calculated for the different stands from PAR transmission measurements, leaf angles and leaf optical properties with Equation (2) was lower in B. pendula canopies (0.41) than in canopies of the other four mid- to late-successional species (0.51–0.55; Table 5).
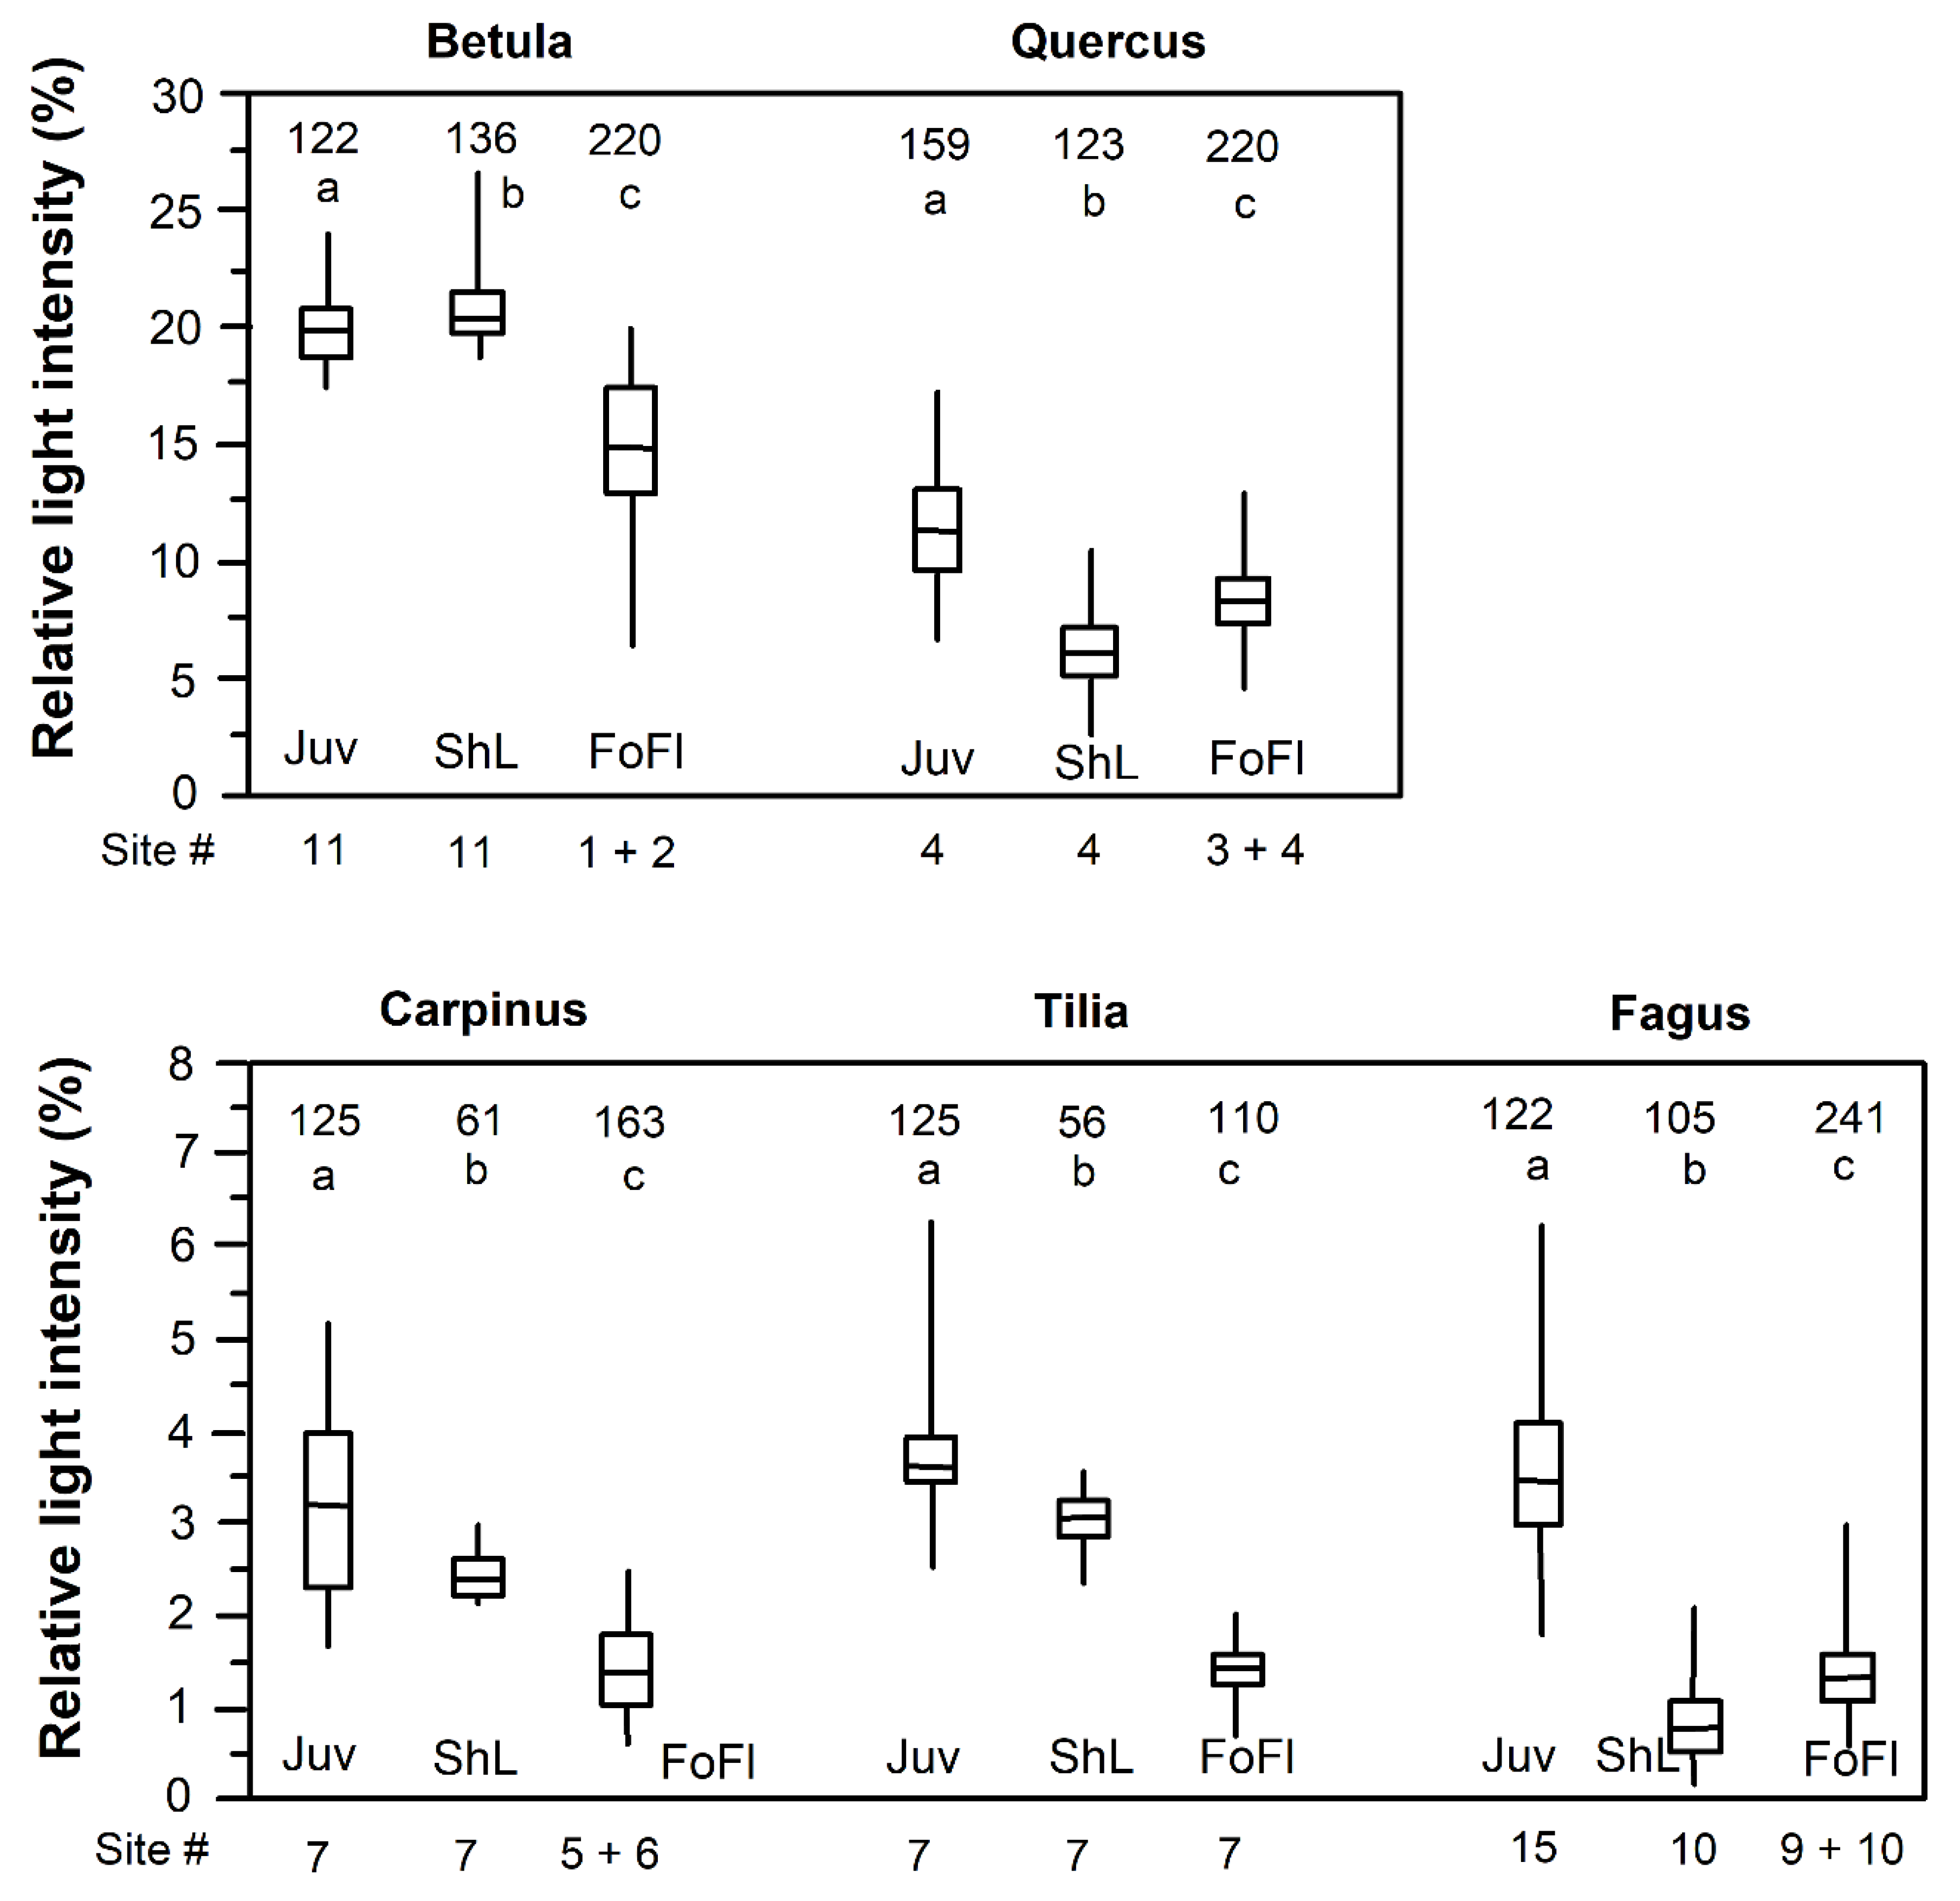
According to light intensity measurements in vicinity of shade leaves in the darkest sections of the forests, a minimum light demand of 21.0, 6.3, 2.5, 3.0 and 0.8% of incident light were found for B. pendula, Q. petraea, C. betulus, T. cordata and F. sylvatica, respectively (median values of 120–150 measurements each; Figure 6). Saplings of 50–90 cm height required minimum relative light intensities of 21.0%, 11.4%, 3.3%, 3.6% and 3.4%, respectively. Thus, saplings and adult-tree shade leaves had similar minimum light requirements in early-successional B. pendula, while the lowermost shade leaves were more shade-tolerant than saplings in the other four mid/late- or late-successional species. Median light intensity on the forest floor under a closed canopy was lower than the saplings’ minimum light demand in all five species (differences significant; Figure 6).
4. Discussion
4.1. Foliar Optics of Early- to Late-Successional Species
A major finding of this study is that the PAR absorptance and transmittance spectra of sun leaves are strikingly similar among the five studied early-, mid- or late-successional species. This is visible in the only moderate species variation of integrated absorptance (72%–77%) and transmittance (c. 4%–7%) in the 350–720 nm range. Our reflectance, absorptance and transmittance values fit well to data obtained with similar methods in other temperate broadleaf tree species (Table 6: upper section). If the specular properties of leaf surfaces are considered in the measurements (see Methods section), then considerably larger reflectance and lower absorptance values are obtained (Table 6: lower section). However, only a few authors have considered this property (e.g., [24]) until now. Comparing the data that considered specular properties, the species differences did not become larger in our sample than for the figures without specular properties.
The striking uniformity in leaf optical properties exists despite considerable species differences in sun leaf LMA (75–110 g m−2), leaf thickness, and leaf size (c. 7 to 40 cm2, [13]). If species differences do exist, they are largest near 550–560 nm, where chlorophyll is absorbing weakly. [29] concluded that species differences in leaf optical properties are mainly caused by differences in leaf thickness and foliar water content. However, in our sample, T. cordata had a somewhat higher absorptance and lower transmittance in the 350–720 nm range than the other species, despite relatively thin sun leaves with low LMA compared to the other species. Overall, our results suggest that the sun leaf tissue of different temperate broadleaf trees is equipped with a rather similar setting of photosynthetic and photoprotective pigments, even though phylogeny and successional position are markedly different.
A general convergence in leaf optical properties has also been found in studies that covered a broader spectrum of plant functional types and greater variation in leaf thickness than the species sample investigated here. A study of multiple species from tropical sunny and deeply shaded habitats also showed a high similarity in leaf optical properties [8,12]. For a species sample of herbaceous and woody, deciduous and evergreen species from the temperate zone, [3] confirmed the uniformity in leaf optics across a broad variety of habitats from sun-exposed to deeply shaded. Given that the sun leaves of our five species are all exposed to full sunlight, the similarity in leaf optics of early-, mid- and late-successional broadleaf tree species is not surprising. Including conifers and woody species from arid environments in the sample would certainly increase the heterogeneity in leaf optics, as the more xeromorphic needles or leaves of these species have largely different reflectance and transmittance properties due to differences in leaf surface structure, anatomy, chemical composition and water content [29]. Drought or flooding stress is another factor that could increase the range of reflectance and absorptance values recorded [30].
One would expect larger differences in leaf optics between early- and late-successional tree species for the shade leaves, which differ more in terms of morphology and physiology between the two functional groups [13]. For example, extreme shade leaves of the five species differed in LMA about threefold (20–60 g cm−2), while the sun leaves varied only by c. 50% (75–110 g cm−2). While we are lacking data on the spectral absorptance and transmittance of shade leaves, we can reject this hypothesis, when the integrated absorptance and transmittance in the 350–720 nm wave band is considered. With respect to this property, the lowermost shade leaves of B. pendula and Q. petraea did not differ from those of the other species, i.e., early-, mid- and late-successional species had similar leaf optics not only in the sun but also in the shade crown. This conclusion is supported by the leaf optical studies conducted by [12] in the tropics and the comparative study of [3] in the temperate zone, which both covered very long light intensity gradients, but did not find systematic differences in absorptance, transmittance and reflectance values. Contrary to expectation from the vertical leaf morphology gradient in the crown, the absorptance and transmittance differences between shade and sun leaves were generally small, in principal agreement with the observed convergence in leaf optical properties.
Much greater is the difference between sun and shade leaves with respect to the resource investment needed to reach a PAR absorptance in the range of 70%–77%. In the three late-successional species (C. betulus, T. cordata, F. sylvatica), shade leaves with their lower LMA achieved an about three times higher specific absorptance per dry mass investment than sun leaves. In contrast, the sun-shade leaf difference was small in this respect in early- or mid-successional B. pendula and Q. petraea. Producing shade leaves with high specific absorptance requires high chlorophyll concentrations in the leaf mesophyll, which apparently is not achievable for early- and mid-successional species that lack a distinct shade crown. As the building of an extended shade crown with chlorophyll-rich leaves requires the investment of additional amounts of carbon, nitrogen and other elements (e.g., magnesium and phosphorus), it could be that temperate early- and mid-successional species are more constrained by nutrient (particularly nitrogen) shortage than are late-successional trees. In support of this hypothesis, Hagemeier (unpubl.) found in C. betulus, T. cordata and F. sylvatica larger amounts of N stored in the leaf and twig biomass per shade crown volume than in B. pendula and Q. petraea.
4.2. Canopy Transmittance and the Minimum Light Demand of Shade Leaves and Saplings
According to PAR measurements on the forest floor, canopy transmittance decreases continually from ~15% under early-successional B. pendula to 1%–3% under the late-successional species. This reduction may reflect the most important functional change taking place in the course of temperate forest succession, i.e., the increase in canopy PAR interception. The major driver is a leaf area increase by 4 m2 m−2 [13], but the more horizontal leaf orientation in the shade crown of the late-successional species is also influential, while the change in leaf absorptance properties is insignificant. A literature review shows that leaf area generally increases from early- to late-successional species in temperate broadleaf forests [31,32]. This is driven by the development of additional layers of horizontally-oriented shade leaves, which are highly efficient in the interception of radiation in low-light environments. The Monsi–Saeki equation attributes the attenuation of light along its path through the canopy to the cumulated leaf area and a specific extinction coefficient KPAR, which incorporates effects of leaf optics, leaf angles, foliage clumping and the area of twigs and branches in the radiation beam. By inverting the Monsi–Saeki equation, we obtained similar KPAR values for Q. petraea, C. betulus, T. cordata and F. sylvatica canopies (0.48–0.51); the values are comparable to figures calculated for other temperate deciduous forests [33,34,35]. However, the KPAR value obtained for the B. pendula canopies was lower (0.37). Since species differences in leaf optics play a minor role, main factors causing the deviating KPAR value for B. pendula must be the steeper leaf angles in these stands [13], together with a lower foliage clumping (0.41 vs. 0.51–0.55) and probably also a smaller amount of structural elements per crown volume (Hagemeier, unpubl.).
PAR measurements in direct vicinity of the lowermost shade leaves show that the five species differ greatly with respect to the minimum light demand of the most tolerant shade leaves (from 21% relative light intensity in B. pendula to <1% in F. sylvatica). In our species sample, the capability to tolerate deep shade is closely linked to the development of a large shade crown and a large total leaf area. The average light intensity on the forest floor (i.e., under the lowermost leaf layer) was somewhat lower than near the darkest shade leaves in those stands, where the light beam to the ground was further attenuated by the presence of a shrub layer or dead branches (e.g., in the B. pendula, C. betulus and T. cordata stands). In contrast, we found higher average light intensities on the forest floor than near the darkest shade leaves in case of the Q. petraea and F. sylvatica stands, because we measured only in proximity of the darkest shade leaves and did not cover the entire shade leaf population with our measurements.
In all five species, saplings had on average a higher minimum light demand than the median relative light intensity recorded on the forest floor. This suggests that offspring can develop under a closed canopy only in few patches with somewhat higher illumination than the average, and most regeneration is restricted to forest gaps. In the closed-canopy patches investigated here, the bulk of vital seedlings and saplings of the late-successional species C. betulus, T. cordata and F. sylvatica was found under relative light intensities of 2.5%–4.0%, with virtually no saplings surviving at patches illuminated with less than 2%. The corresponding average forest floor light intensities ranged between 1 and 2% and thus probably were too low for the species’ own offspring. Since we measured under conditions of diffuse light (overcast sky), it is possible that erratic light flecks increase the average radiation flux density on the forest floor to a certain extent, thereby facilitating the survival of saplings. Interestingly, a similar pattern was found for early-successional B. pendula and mid/late-successional Q. petraea, though at much higher light levels (sapling minimum light demand: ~20% and >10%, respectively).
Comparing the minimum light demand of adult trees’ shade leaves and saplings points to a physiological difference between the pioneer species B. pendula and the other four species: In the latter group of mid/late-successional species, saplings were more light-demanding than the most shade-tolerant shade leaves, which was not found in B. pendula. One possible explanation is that birch seedlings typically germinate on a forest floor with a relatively dense herbaceous layer due to the high light levels, causing fierce above- and belowground competition. This represents an additional stressor for the young plants besides low energy. The survival of birch seedlings in a crowded herb layer may thus depend on rapid height growth and consequently on higher light intensities than when growing alone. Trees with a distinct shade crown cast deep shade and thus restrict their own offspring to canopy gaps, but they also reduce herb layer density and competition intensity on the forest floor. An alternative, more speculative explanation is that temperate late-successional tree species with their larger leaf area and greater N, P, Mg and K stocks in crown biomass (Leuschner and Hagemeier, unpubl.) may well be capable of operating shade leaves with very low or zero net carbon gain [36], which probably is more difficult to be achieved by the saplings due to low below-canopy light intensities. Early-successional trees with a typically smaller leaf area may be constrained in this respect.
5. Conclusions
A characteristic difference between early- and late-successional tree species is the light demand of seedlings and saplings, which typically is high in the former and much lower in the latter. At maturity, this physiological difference vanishes, as the trees of both functional groups are typically exposed to full sunlight in the upper crown. In correspondence, we found no principal differences in sun leaf optical properties among the studied early-, mid- and late-successional tree species. These functional groups differ primarily in the degree of within-crown leaf morphological and physiological plasticity, which is much higher in the latter. It has consequences for the radiation budget of the entire canopy, the species’ regeneration and the competitive hierarchy among different forest tree species.
The capability of late-successional species to develop distinct shade leaves adapted to achieve a net carbon gain in low light conditions through reduced leaf construction and maintenance costs but increased specific leaf absorptance, has profound effects on the morphology, physiology and spatial arrangement of leaves. In contrast, leaf optical properties seem to be remarkably similar across species and crown levels in temperate broadleaf tree species, irrespective of phylogeny and functional group. Marked differences existed with respect to the carbon cost, at which different tree species, and sun and shade leaves, achieve radiation absorption. The question of why late-successional tree species are capable of producing distinct shade leaves and larger total leaf areas than early-successional species, may ultimately relate to the availability of soil resources, notably nitrogen and water, which are a prerequisite for shade crown development. Tree longevity may also be influential, as investment in the shade crown may only pay off over time spans, that are less relevant for fast-growing, rapidly dispersed, early-successional species. Comparative leaf and crown optical studies in a larger number of temperate tree species are needed to test the broader validity of these conclusions.
Supplementary Materials
The following are available online at https://www.mdpi.com/1999-4907/10/10/925/s1: Figure S1: Plot for measuring PAR flux density on the forest floor. Figure S2: Absorptance of leaves of the five species in the sun, middle and shade crown integrated over the wavelength interval 350–720 nm (means with standard deviation of each 10 leaves). Figure S3: Transmittance of leaves of the five species in the sun, middle and shade crown integrated over the wavelength interval 350–720 nm (means with standard deviation of each 10 leaves). Figure S4: Relative PAR irradiance (in % of incident radiation) on the forest floor in each two stands with closed canopy of the five tree species.
Author Contributions
C.L. conceived the study, M.H. conducted the research and did most of the data analysis, C.L. wrote the paper, both authors reviewed the final draft.
Funding
This research was funded by a grant of Deutsche Bundesstiftung Umwelt (DBU) to M.H. The support is gratefully acknowledged.
Acknowledgments
We thank Heiko Eggert for his great support during the spectroradiometer measurements.
Conflicts of Interest
The authors declare no conflict of interest. The founding sponsors had no role in the design of the study; in the collection, analyses, or interpretation of data; in the writing of the manuscript, and in the decision to publish the results.
References
- Campbell, G.S. Fundamentals of radiation and temperature relations. In Physiological Plant Ecology I; Encyclopedia of Plant Physiology, New Series 12A; Springer: Berlin, Germany, 1981; pp. 11–40. [Google Scholar]
- Vogelmann, T.C. Plant tissue optics. Ann. Rev. Plant Physiol. Plant Mol. Biol. 1993, 44, 231–251. [Google Scholar]
- Knapp, A.K.; Carter, G.A. Variability in leaf optical properties among 26 species from a broad range of habitats. Am. J. Bot. 1998, 85, 940–946. [Google Scholar] [PubMed]
- Bjorkman, O. Responses to different quantum flux densities. In Physiological Plant Ecology I; Encyclopedia of Plant Physiology, New Series 12A; Springer: Berlin, Germany, 1981; pp. 57–107. [Google Scholar]
- Horn, J.S. The Adaptive Geometry of Trees; Princeton University Press: Princeton, NJ, USA, 1971; 144p. [Google Scholar]
- Billings, W.D.; Morris, R.J. Reflection of visible and infrared radiation from leaves of different ecological groups. Ecology 1951, 38, 327–331. [Google Scholar]
- Gausman, H.W.; Allen, W.A. Optical parameters of leaves of 30 plant species. Plant Physiol. 1973, 52, 57–62. [Google Scholar]
- Lee, D.W.; Bone, R.A.; Tarsis, S.L.; Storch, D. Correlates of leaf optical properties in tropical forest sun and extreme-shade plants. Am. J. Bot. 1990, 77, 370–380. [Google Scholar] [CrossRef]
- Curran, P.J. Remote sensing of foliar chemistry. Remote Sens. Env. 1989, 30, 271–278. [Google Scholar] [CrossRef]
- Lee, C.M.; Cable, M.L.; Hook, S.J.; Green, R.O.; Ustin, S.L.; Mandl, D.J.; Middleton, E.M. An introduction to the NASA Hyperspectral InfraRed Imager (HyspIRI) mission and preparatory activities. Remote Sens. Environ. 2015, 167, 6–19. [Google Scholar]
- Asner, G.P.; Brodrick, P.G.; Anderson, C.B.; Vaughn, N.; Knapp, D.E.; Martin, R.E. Progressive forest canopy water loss during the 2012–2015 California drought. Proc. Natl. Acad. Sci. USA 2016, 113, E249–E255. [Google Scholar] [CrossRef]
- Lee, D.W.; Graham, R. Leaf optical properties of rainforest sun and extreme shade plants. Am. J. Bot. 1986, 73, 1100–1108. [Google Scholar] [CrossRef]
- Hagemeier, M.; Leuschner, C. Functional crown architecture of five temperate broadleaf tree species: Vertical gradients in leaf morphology, leaf angle, and leaf area density. Forests 2019, 10, 265. [Google Scholar] [CrossRef]
- Ellenberg, H. Vegetation Mitteleuropas mit den Alpen, 5th ed.; Ulmer: Stuttgart, Germany, 1996. [Google Scholar]
- Hölscher, D.; Hertel, D.; Leuschner, C.; Hottkowitz, M. Tree species diversity and soil patchiness in a temperate broad-leaved forest with limited rooting space. Flora 2002, 197, 118–125. [Google Scholar] [CrossRef]
- Köcher, P.; Gebauer, T.; Horna, V.; Leuschner, C. Leaf water status and stem xylem flux in relation to soil drought in five temperate broad-leaved tree species with contrasting water use strategies. Ann. For. Sci. 2009, 66, 101–112. [Google Scholar] [CrossRef]
- Hallé, F.; Oldeman, R.A.A.; Tomlinson, P.B. Tropical Trees and Forests. An Architectural Analysis; Springer: Berlin/Heidelberg, Germany, 1978. [Google Scholar]
- Roloff, A. Kronenentwicklung und Vitalitätsbeurteilung ausgewählter Baumarten der gemäßigten Breiten. Schr. Forstl. Fak. Univ. Göttingen Niedersächs. Forstl. Vers. 1989, 93, 1–258. [Google Scholar]
- Zimmermann, J.; Hauck, M.; Dulamsuren, C.; Leuschner, C. Climate warming-related growth decline affects Fagus sylvatica, but not other broad-leaved tree species in Central European mixed forests. Ecosystems 2015, 18, 560–572. [Google Scholar] [CrossRef]
- Choat, B.; Jansen, S.; Brodribb, T.J.; Cochard, H.; Delzon, S.; Bhaskar, R.; Bucci, S.J.; Feild, T.S.; Gleason, S.M.; Hacke, U.G.; et al. Global convergence in the vulnerability of forests to drought. Nature 2012, 491, 752–755. [Google Scholar] [CrossRef] [Green Version]
- Gates, D.M. Spectral properties of leaves. Appl. Opt. 1965, 4, 11–20. [Google Scholar] [CrossRef]
- Monsi, M.; Saeki, T. Über den Lichtfaktor in den Pflanzengesellschaften und seine Bedeutung für die Stoffproduktion. Jpn. J. Bot. 1953, 14, 22–52. [Google Scholar]
- Wilcoxon, F. Individual comparisons by ranking methods. Biom. Bull. 1945, 1, 80–83. [Google Scholar] [CrossRef]
- Lee, D.W. Unusual strategies of light absorption in rain-forest herbs. In On the Economy of Plant Form and Function; Givnish, T., Ed.; Cambridge University Press: Cambridge, UK, 1986; pp. 105–131. [Google Scholar]
- Grant, R.H. Partitioning of biologically active radiation in plant canopies. Int. J. Biometorol. 1997, 40, 26–40. [Google Scholar] [CrossRef]
- Ehleringer, J.R.; Werk, K.S. Modifications of solar-radiation absorption patterns and implications for carbon gain at the leaf level. In On the Economy of Plant Form and Function; Givnish, T., Ed.; Cambridge University Press: Cambridge, UK, 1986; pp. 57–82. [Google Scholar]
- Tanner, V.; Eller, B.M. Veränderungen der spektralen Eigenschaften der Blätter der Buche (Fagus sylvatica L.) von Laubaustrieb bis Laubfall. Allg. Forst. Jagdztg. 1985, 157, 108–117. [Google Scholar]
- Eller, B.M.; Glättli, R.; Flach, B. Optische Eigenschaften und Pigmente von Sonnen- und Schattenblättern der Rotbuche (Fagus sylvatica L.) und der Blutbuche (Fagus sylvatica cv. Atropunicea). Flora 1981, 171, 170–185. [Google Scholar]
- Baldini, E.; Facini, O.; Nerozzi, F.; Rossi, F.; Rotondi, A. Leaf characteristics and optical properties of different woody species. Trees 1997, 12, 73–81. [Google Scholar] [CrossRef]
- Carter, G.A.; Knapp, A.K. Leaf optical properties in higher plants: Linking spectral characteristics to stress and chlorophyll concentration. Am. J. Bot. 2001, 88, 677–684. [Google Scholar] [CrossRef] [PubMed]
- Leuschner, C.; Ellenberg, H. Ecology of Central European Forests; Springer Nature: Cham, Switzerland, 2017. [Google Scholar]
- Leuschner, C.; Meier, I.C. Ecology of Central European tree species. Perspect. Ecol. Evol. Syst. 2018, 33, 89–103. [Google Scholar] [CrossRef]
- Baldocchi, D.; Hutchison, B.A.; Matt, D.R.; McMillen, R.T. Solar radiation in an oak-hickory forest: An evaluation of extinction coefficients for several radiation components during fully-leafed periods. Agric. Forest Meteorol. 1984, 32, 307–322. [Google Scholar] [CrossRef]
- Yang, X.; Miller, D.R.; Montgomery, M.E. Vertical distribution of canopy foliage and biologically active radiation in a defoliated/refoliated hardwood forest. Agric. Forest Meteorol. 1993, 67, 129–146. [Google Scholar] [CrossRef]
- Vose, J.M.; Sullivan, N.H.; Clinton, B.D.; Bolstad, P.V. Vertical leaf area distribution, light transmittance, and application of the Beer-Lambert Law in four mature stands in the southern Appalachians. Can. J. For. Res. 1995, 25, 1036–1043. [Google Scholar] [CrossRef]
- Reiter, I.M.; Häberle, K.-H.; Nunn, A.J.; Heerdt, C.; Reitmayer, H.; Grote, R.; Matyssek, R. Competitive strategies in adult beech and spruce: Space-related foliar carbon investment versus carbon gain. Oecologia 2005, 146, 337–349. [Google Scholar] [CrossRef]
Figure 1.
PAR-transmittance spectra of upper sun-canopy leaves of the five species with consideration of leaf specular properties. Depicted are mean curves of spectroradiometer measurements on each of 10 leaves per species. For standard deviation of means see Figure S3 in the Supplement.
Figure 1.
PAR-transmittance spectra of upper sun-canopy leaves of the five species with consideration of leaf specular properties. Depicted are mean curves of spectroradiometer measurements on each of 10 leaves per species. For standard deviation of means see Figure S3 in the Supplement.

Figure 2.
PAR-absorptance spectra of upper sun-canopy leaves of the five species with consideration of leaf specular properties. Depicted are mean curves of spectroradiometer measurements on each 10 leaves per species. For standard deviations of means see Figure S2 in the Supplement.
Figure 2.
PAR-absorptance spectra of upper sun-canopy leaves of the five species with consideration of leaf specular properties. Depicted are mean curves of spectroradiometer measurements on each 10 leaves per species. For standard deviations of means see Figure S2 in the Supplement.

Figure 3.
Transmittance (a) and absorptance (b) of PAR by leaves of the five species in dependence on height in the canopy (means of the 350–720 nm wave band, with consideration of leaf specular properties). Based on spectroradiometer measurements of each of 10 leaves per height level and species.
Figure 3.
Transmittance (a) and absorptance (b) of PAR by leaves of the five species in dependence on height in the canopy (means of the 350–720 nm wave band, with consideration of leaf specular properties). Based on spectroradiometer measurements of each of 10 leaves per height level and species.

Figure 4.
Specific absorptance (absorptance normalized by leaf mass area (LMA)) of PAR (350–720 nm wave band) of leaves of the five species in dependence on height in the canopy (absorptivity in % per unit leaf dry mass per area). Means ± 1 STD are given.
Figure 4.
Specific absorptance (absorptance normalized by leaf mass area (LMA)) of PAR (350–720 nm wave band) of leaves of the five species in dependence on height in the canopy (absorptivity in % per unit leaf dry mass per area). Means ± 1 STD are given.

Figure 5.
Relative PAR irradiance (in percent of incident radiation) on the forest floor in each two stands with closed canopy of the five tree species (Tilia: only one stand). Paired measurements with two quantum sensors at 110–241 measurement points around noon (11 a.m.–2:00 p.m.) under overcast sky with one sensor placed in the open and the other moved on the forest floor. Box-whisker plots with median, 25- and 75-percentiles, and minima and maxima. Significantly different arithmetic means are indicated with different small letters.

Figure 6.
Relative PAR irradiance (in % of incident radiation) directly above juvenile plants (Juv), the lowermost shade leaves of adult trees (ShL), and on the forest floor (FoFl) in several stands with closed canopy of the five tree species. In order to quantify minimum light demand, the radiation measurements above vital juveniles and adult trees’ shade leaves were conducted at the darkest locations, where these objects were found in the stands. The total numbers of radiation measurements per stand are depicted in the figure top. Different small letters indicate significantly different arithmetic means between juveniles, shade leaves and forest floor.


Table 1.
Functional and morphological traits of the five tree species studied according to [14,15,16,17,18,19,20], and others.
| Betula pendula | Quercus petraea | Carpinus betulus | Tilia cordata | Fagus sylvatica | |
|---|---|---|---|---|---|
| Family | Betulaceae | Fagaceae | Betulaceae | Malvaceae | Fagaceae |
| Crown architecture type 1 | Rauh/Sc/Tr | Rauh | Troll | Troll | Troll |
| Successional status | early | mid/late | (mid)-late | late | late |
| Shade tolerance of adults 2 | intolerant | (intolerant) | tolerant | tolerant | tolerant |
| Shade production of adults 3 | V | III | I | II | I |
| Shade tolerance of saplings 4 | V | IV | II | III | I |
| Drought tolerance 5 | medium | high | med./high | medium | low |
| Type of mycorrhiza 6 | ECM | ECM | ECM | ECM | ECM |
| Xylem anatomy 7 | diffuse | ring | diffuse | diffuse | diffuse |
1 After [17], following [18]; B. pendula: at young age Rauh, later Scarrone, at high age Troll. 2 General categorization of the species’ shade tolerance according to [20]. 3 From various literature sources and personal observation of [14]. Relative categorization of species (I—very high, II—high, III—medium, IV—low, V—very low). 4 From various literature sources and personal observation of [14]. Relative categorization of species (I—very high, II—high, III—medium, IV—low, V—very low). 5 Drought tolerance ranking based on distribution range and habitat preference data in [14], dendrochronological information of drought-induced growth reductions (after [19] and other sources), P50 values of embolism resistance [20], and records of drought damage (e.g., pre-senescent leaf loss) of the species. 6 ECM = ectomycorrhiza 7 Ring-porous, diffuse-porous.
Table 2.
Stand structural characteristics of the 10 studied stands.
| Species | Site No. | Stand Age (yr) | Basal Area (m2 ha−1) | Stem Density (ha−1) | Mean dbh (cm) | Mean Height (m) | Abundance of Main Species (% of Stems) |
|---|---|---|---|---|---|---|---|
| Betula pendula | 1 | 45 | 25.2 | 880 | 19 ± 6 | 20 ± 3 | 85 |
| Betula pendula | 2 | 67 | 28.5 | 420 | 25 ± 3 | 25 ± 3 | 98 |
| Quercus petraea | 3 | 154 | 27.5 | 260 | 37 ± 6 | 23 ± 3 | 94 |
| Quercus petraea | 4 | 149 | 23.8 | 190 | 44 ± 6 | 23 ± 2 | 95 |
| Carpinus betulus | 5 | 116 | 31.5 | 345 | 29 ± 1 | 27 ± 5 | 68 |
| Carpinus betulus | 6 | 95 | 37.0 | 420 | 32 ± 9 | 26 ± 3 | 77 |
| Tilia cordata | 7 | 83 | 35.9 | 370 | 23 ± 9 | 23 ± 4 | 96 |
| Tilia cordata | 8 | 65–81 | 37.7 | 780 | 22 ± 9 | 22 ± 4 | 81 |
| Fagus sylvatica | 9 | 95–115 | 30.8 | 445 | 38 ± 7 | 26 ± 2 | 92 |
| Fagus sylvatica | 10 | 96 | 24.2 | 375 | 38 ± 6 | 26 ± 2 | 100 |
Table 3.
Some physiographic and stand structural characteristics of the study sites in northern and central Germany.
Table 3.
Some physiographic and stand structural characteristics of the study sites in northern and central Germany.
| Species | Site No. | Location | Coor-Dinates | Elevation (m a.s.l.) | Slope | Soil Substrate | Soil Type | Admixed Species |
|---|---|---|---|---|---|---|---|---|
| Betula pendula | 1 | Lehrer Wald (Helmstedt county), Lower Saxony | 10°42′ E 52°19′ N | 95 | level | Loamy sand | Stagnosol-Cambisol | Alnus glutinosa |
| Betula pendula | 2 | Lappwald (Helmstedt county), Lower Saxony | 11°01′ E 52°16′ N | 147 | level | loamy sand | Stagnosol-Camibsol | Pinus sylvestris |
| Quercus petraea | 3 | Breitenhees, Lüneburger Heide, Lower Saxony | 10°30′ E 52°49′ N | 120 | level | loamy sand | Dystric Cambisol | Picea abies |
| Quercus petraea | 4 | Breitenhees, Lüneburger Heide, Lower Saxony | 10°30′ E 52°49′ N | 123 | level | loamy sand | Dystric Cambisol | Picea abies |
| Carpinus betulus | 5 | Ziegelrodaer Forst (near Mansfeld), Thuringia | 11°32′ E 51°26′ N | 225 | 5% NW | sandy loam | Dystric Cambisol | Tilia cordata, Acer ssp. |
| Carpinus betulus | 6 | Ziegelrodaer Forst (near Mansfeld), Thuringia | 11°32′ E 51°26′ N | 235 | 11% N | sandy loam | Dystric Cambisol | Fraxinus excel., Tilia cordata |
| Tilia cordata | 7 | Colbitz-Letzlinger Heide (Wolmirstedt county), S.-Anhalt | 11°32′ E 52°21′ N | 85 | level | loamy sand | Luvisol | Quercus robur, Fraxinus excel., |
| Tilia cordata | 8 | Colbitz-Letzlinger Heide (Wolmirstedt county), S.-Anhalt | 11°33′ E 52°20′ N | 78 | level | loamy sand | Luvisol | Quercus robur, Fraxinus excel. |
| Fagus sylvatica | 9 | Unterlüss, Lüneburger Heide, Lower Saxony | 10°16′ E 52°50′ N | 115 | level | sand | Dystric Cambisol | Quercus petraea |
| Fagus sylvatica | 10 | Unterlüss, Lüneburger Heide, Lower Saxony | 10°19′ E 52°49′ N | 113 | level | loamy sand | Dystric Cambisol |
Table 4.
Climate data of the six climate stations in the neighborhood of the study sites.
| Station | Site Affiliation (Site No.) | Elevation (m a.s.l.) | MAT (°C) | MAP (mm yr−1) |
|---|---|---|---|---|
| Unterlüss | 3, 4, 9, 10 | 98 | 8.1 | 801 |
| Helmstedt | 1, 2 | 140 | 8.6 | 608 |
| Magdeburg | 7, 8 | 79 | 8.7 | 494 |
| Artern | 5, 6 | 164 | 8.6 | 462 |
MAT—mean annual temperature, MAP—mean annual precipitation (period 1961–1990; Deutscher Wetterdienst, Offenbach, Germany).
Table 5.
Leaf area index (LAI; litter bucket data), leaf area density (LAD) in the upper sun crown (maximal values) and shade crown (tree harvest data of [13]), canopy extinction coefficient for PAR KPAR (according to photosynthetically active radiation (PAR) transmission measurements under diffuse light conditions applying Equation (1); after [22]), and foliage clumping index Ω (by solving Equation (2) after [22], for Ω) of the five tree species. Means of each two stands (no. 1 to 10 in Table 2).
| Species | LAI | LAD (Sun Crown) | LAD (Shade Crown) | Extinction Coefficient | Clumping Index |
|---|---|---|---|---|---|
| (m2 m−2) | (m2 m−3) | (m2 m−3) | KPAR | Ω | |
| Betula pendula | 4.6 | 3.2 | 0.3 | 0.37 | 0.42 |
| Quercus petraea | 5.5 | 2.8 | 0.5 | 0.48 | 0.51 |
| Carpinus betulus | 8.3 | 19 | 0.2 | 0.51 | 0.55 |
| Tilia cordata | 7.1 | 11 | 0.1 | 0.48 | 0.51 |
| Fagus sylvatica | 8.4 | n.d. | n.d. | 0.51 | 0.55 |
Table 6.
Transmittance, reflectance and absorptance of sun leaves of different temperate broadleaf tree species in the 350–720 nm range according to different authors (in %, means ± standard error (SE)). Part of the values was read from figures. Leaves were generally measured at 90° orientation to the radiation beam (‘without consideration of specular properties’). In this study, leaves were additionally measured at an angle of 82° (i.e., with 8° inclination to the rectangular orientation) to consider specular properties of the leaf surface, which can greatly increase measured reflectance (lower table section).
| Species | Transmittance | Reflectance | Absorptance | Author |
|---|---|---|---|---|
| Without consideration of specular properties | ||||
| Betula pendula | 6.94 ± 0.62 | 8.81 ± 0.26 | 84.59 ± 0.74 | This study |
| Populus deltoides | 87.28 | Gates 1965 [21] | ||
| Quercus petraea | 5.18 ± 0.12 | 5.95 ± 0.10 | 89.19 ± 0.17 | This study |
| Q. rubra | 5.71 | 11.62 | 82.67 | Grant 1997 [25] |
| 17 species, oak-maple forest | 82.6 | Ehleringer & Werk 1986 [26] | ||
| Carpinus betulus | 7.19 ± 0.16 | 6.45 ± 0.45 | 86.70 ± 0.19 | This study |
| Tilia cordata | 3.42 ± 0.17 | 5.79 ± 0.06 | 91.12 ± 0.21 | This study |
| Fagus sylvatica | 6.00 ± 0.14 | 6.86 ± 0.18 | 87.48 ± 0.27 | This study |
| F. sylvatica | 89.9–91.6 | Tanner & Eller 1985 [27] | ||
| F. sylvatica | 90.5 | Eller et al. 1981 [28] | ||
| F. sylvatica cv. atropunicea | 95 | Eller et al. 1981 [28] | ||
| With consideration of specular properties | ||||
| Betula pendula | 6.94 ± 0.62 | 21.24 ± 0.30 | 72.16 ± 0.75 | This study |
| Quercus petraea | 5.18 ± 0.12 | 19.46 ± 0.40 | 75.70 ± 0.43 | This study |
| Carpinus betulus | 7.19 ± 0.16 | 19.06 ± 0.24 | 74.09 ± 0.38 | This study |
| Tilia cordata | 3.42 ± 0.17 | 19.56 ± 0.40 | 77.35 ± 0.43 | This study |
| Fagus sylvatica | 6.00 ± 0.14 | 20.57 ± 0.42 | 73.76 ± 0.50 | This study |
© 2019 by the authors. Licensee MDPI, Basel, Switzerland. This article is an open access article distributed under the terms and conditions of the Creative Commons Attribution (CC BY) license (http://creativecommons.org/licenses/by/4.0/).
Share and Cite
MDPI and ACS Style
Hagemeier, M.; Leuschner, C. Leaf and Crown Optical Properties of Five Early-, Mid- and Late-Successional Temperate Tree Species and Their Relation to Sapling Light Demand. Forests 2019, 10, 925. https://doi.org/10.3390/f10100925
AMA Style
Hagemeier M, Leuschner C. Leaf and Crown Optical Properties of Five Early-, Mid- and Late-Successional Temperate Tree Species and Their Relation to Sapling Light Demand. Forests. 2019; 10(10):925. https://doi.org/10.3390/f10100925
Chicago/Turabian StyleHagemeier, Marc, and Christoph Leuschner. 2019. "Leaf and Crown Optical Properties of Five Early-, Mid- and Late-Successional Temperate Tree Species and Their Relation to Sapling Light Demand" Forests 10, no. 10: 925. https://doi.org/10.3390/f10100925
Note that from the first issue of 2016, this journal uses article numbers instead of page numbers. See further details here.