Modeling Experiments for Evaluating the Effects of Trees, Increasing Temperature, and Soil Texture on Carbon Stocks in Agroforestry Systems in Kerala, India


1
Department of Natural Resource Ecology & Management, Iowa State University, Ames, IA 50011, USA
2
College of Forestry, Kerala Agricultural University, KAU PO, Thrissur, 680656 Kerala, India
*
Author to whom correspondence should be addressed.
Forests 2019, 10(9), 803; https://doi.org/10.3390/f10090803
Submission received: 16 August 2019
/
Revised: 7 September 2019
/
Accepted: 9 September 2019
/
Published: 14 September 2019
(This article belongs to the Special Issue Agroforestry Systems: The Role of Trees in Ecosystem Services—A Special Issue in Collaboration with the 4th World Congress on Agroforestry)
Abstract
:Research Highlights: Agroforestry systems in the humid tropics have the potential for high rates of production and large accumulations of carbon in plant biomass and soils and, thus, may play an important role in the global C cycle. Multiple factors can influence C sequestration, making it difficult to discern the effect of a single factor. We used a modeling approach to evaluate the relative effects of individual factors on C stocks in three agricultural systems in Kerala, India. Background and Objectives: Factors such as plant growth form, management, climate warming, and soil texture can drive differences in C storage among cropping systems, but the relationships among these factors and their effects are complex. Our objective was to use CENTURY, a process-based model of plant–soil nutrient cycling, in an experimental mode to evaluate the effects of individual factors on C stocks in soil and biomass in monocultures (annuals or trees) and agroforestry systems. Materials and Methods: We parameterized the model for this region, then conducted simulations to investigate the effects on C stocks of four experimental scenarios: (1) change in growth form; (2) change in tree species; (3) increase in temperature above 20-year means; and (4) differences in soil texture. We compared the models with measured changes in soil C after eight years. Results: Simulated soil C stocks were influenced by all factors: growth form; lignin in tree tissues; increasing temperature; and soil texture. However, increasing temperature and soil sand content had relatively small effects on biomass C. Conclusions: Inclusion of trees with traits that promoted C sequestration such as lignin content, along with the use of best management practices, resulted in the greatest C storage among the simulated agricultural systems. Greater use and better management of trees with high C-storage potential can thus provide a low-cost means for mitigation of climate warming.
1. Introduction
Deforestation, land degradation, and other changes in land use resulted in estimated emissions of 0.9 ± 0.5 Pg C per year from 2005 to 2014, thus contributing to the 4.4 (±0.1) Pg per year increase in atmospheric C [1]. Reforestation is a major strategy for reducing atmospheric CO2 because trees take up CO2 from the atmosphere and sequester it in the long-living tissues of woody biomass. Thus, maximizing forest cover and limiting agriculture’s impact on atmospheric C play critical roles in limiting global warming to the 1.5 °C increase specified in the Paris Agreement [2]. Agriculture is also expected to play a role in climate change mitigation, but this strategy is limited to augmenting soil C stocks (0–40 cm depth) globally by 0.4% per year, which is indeed an aspirational goal [3,4]. This presents a dilemma in choosing between land use for monocultures of trees that store more C and monocultures of annual crops that store less C but provide major food staples. Agroforestry systems, in which agricultural crops are grown with trees (www.icraf.org), offer a mitigation solution that meets the needs for both food provisioning via annual crops and high C storage in trees. The C storage potential is especially high in the humid tropics where these systems can be very productive, and which also provide multiple products [5,6].
With >181 million ha of arable lands [7], India has considerable potential for soil C sequestration through agricultural mitigation activities [8]. Indian soils are estimated to contain soil C stocks of 20–25 Gt (0–1 m) [3]. Apart from soil C stocks, tree-based systems often contain significant pools of biomass carbon [9]. Agroforestry is thus one of the cardinal strategies for augmenting terrestrial C pools. India is also home to an array of agroforestry systems, e.g., tropical homegardens. Indeed, the South Asia region is often regarded as the “cradle of agroforestry” [10].
Although agroforestry systems abound in India, it is difficult to predict their potential for C storage, in comparison with other options that farmers may choose, such as monocultures of annual crops, palms, or trees. This is not surprising, given the uncertainties in the terrestrial C budget in general [2]. In agroforestry systems, many factors can influence C cycling and, thus, introduce variability in C stocks in biomass and soil. For example, site characteristics such as soil and land-use types, species involved, stand age, and management practices are major determinants of C stocks in soil and biomass in agroforestry systems [9]. Moreover, the relationships and feedbacks among the various factors are complex, rendering it difficult to discern the relative contribution of each factor to C storage. The use of process-based modeling can address this issue because it provides a holistic framework for evaluating a single factor at a time [11].
We used CENTURY, a general model of plant–soil nutrient cycling [12], integrated with field-based measurements, to evaluate the capacity of agroforestry systems to sequester C, in comparison with two other main types of agricultural systems in central Kerala, India. In this context, we addressed the following questions and their corresponding hypotheses:
1.1. How Does C Storage in Agroforestry Systems Compare with that in Monocultures of Annual Crops or Trees?
Certain combinations of plant species that are grown together in agroforestry systems demonstrate complementary patterns in their resource use and, thus, have higher productivity and C storage [9]. In general, the degree of complementarity and its effect on C storage depends on environmental conditions, in combination with the functional traits of the species present in the system [13]. In this study, we focused on the functional trait of growth form. Agroforestry systems in central Kerala often contain a wide diversity of growth forms, including grasses, annual crops, root crops, vines, palms, deciduous trees, and evergreen trees [14]. In our modeled comparisons of three agricultural systems, we considered two growth forms—annuals and trees. Simulated agroforestry systems contain both growth forms, whereas monocultures contain either an annual or tree crop.
We hypothesized that C stocks in both biomass and soil will increase with the proportion of trees in the agricultural system, if factors other than growth form are held constant. The rationale was that woodiness drives biomass C storage because perennial trees have a greater proportion of long-lived, non-harvested tissues that can accrue greater biomass than annual crops. Trees also tend to decrease soil bulk density and produce more organic matter (OM) that provides C inputs to soil, thereby ameliorating soil C stocks [15]. In addition, decomposition of soil organic matter (SOM) is generally slower in less disturbed, perennial systems than in annual cropping systems [16], which would also promote soil C storage. Nevertheless, we emphasize that agroforestry systems can, indeed, store large amounts of C relative to tree monocultures [9]. In both agroforestry systems and tree monocultures however, C storage depends on multiple factors, including traits of the planted species, their complementarity in resource use, and management practices such as fertilization, irrigation, and stocking density. Thus, in field-based comparisons of C storage among agricultural systems across sites, it is difficult to control for factors that may be confounded with growth form and, hence, it is challenging to evaluate the effect of woodiness alone.
1.2. To What Extent Does Variation in Traits among Tree Species Influence C Stocks?
If land is to be dedicated to trees as a mitigation strategy, it makes sense to maximize this approach and guide the design of agricultural systems by increasing our understanding of the tree traits that influence C storage. From a biogeochemical perspective, traits that differ among tree species can differentially influence production of OM and its turnover and decomposition, thus affecting the accumulation of biomass and soil C [17]. Carbon storage would likely vary directly with a trait such as growth potential, given that other traits were similar among species. We focused on a trait for which the outcome would be less obvious—lignin concentration of above- and belowground plant tissues.
We hypothesized that soil C stocks will increase with increasing tissue lignin content. The rationale is that decomposition of litter can decline with the lignin content of plant tissues [18], such that OM will accrue in soil. We also hypothesized that biomass C will be lower in species with higher lignin contents in tissues because plant growth can decline with increasing lignin contents in plant tissues [19,20].
1.3. Will Increasing Temperatures Influence C Stocks in Tree-Based Systems?
With climate warming being unequivocal [21], it is critical to evaluate the effects of increased temperature on C stocks in biomass and soil, given the uncertainties regarding the effects of higher temperatures on C dynamics, especially in lower latitudes [22,23]. While numerous aspects of climate change affect C cycling processes in agricultural systems, we focused on rising temperatures in this study.
We hypothesized that increasing temperatures will have a relatively small effect on biomass C stocks in a humid tropical setting. The rationale is that higher temperatures prevalent in lower latitudes are already optimal for plant growth [24], such that small increases in temperature will not affect plant productivity and turnover. However, if temperatures surpass the optimum, this increase may reduce plant growth and increase mortality, thereby reducing biomass C. We hypothesized that increasing temperatures will reduce soil C via the effect of increasing decomposition of SOM [25].
1.4. What is the Effect of Soil Texture on C Stocks?
We included this modeling scenario as a benchmark for gauging the effects of the other modeled factors, given that the effects of soil texture on C stocks are well documented [26,27,28]. Soil types vary substantially within the study area and across other potential areas for agroforestry, and soil texture and the fractions of sand, silt, and clay provide a quantifiable approach for modeling the effect of soil type. We hypothesized that C stocks in biomass and soil will decline with the increasing sand content of soil. The rationale is that soils with a higher sand content have a lower capacity for nutrient and water retention and, thus, support less plant growth, therefore lower biomass and soil C [28].
We addressed these questions by conducting four sets of modeling experiments in CENTURY, comparing simulated C stocks in biomass and soil in baseline runs with output after incremental changes in parameters to evaluate the long-term effects on agroforestry systems. The four experiments were designed to test the effects on biomass and soil C stocks of: (1) cropping systems that differed in the number and type of growth forms; (2) different levels of one tree trait—lignin content in tissues; (3) increasing temperature; and (4) soil texture. We evaluated the model predictions regarding the effects of growth forms on soil C stocks by comparing modeled output with measured changes in soil C over an 8-year interval in 48 agroforestry systems in central Kerala.
2. Materials and Methods
2.1. Study Sites and Experimental Design
This study was conducted in the District of Thrissur in the state of Kerala, situated in the southwest corner of India (between 10° and 10°47′ N, and 75°55′ and 76°54′ E). This region is ideal for comparing the effects on C stocks of agroforestry systems that differ in species composition for several reasons. First, crop and tree species richness and functional diversity are high, with 91 species in at least eight functional groups in the studied systems [14]. Moreover, Kerala farmers grow these crops in both monocultures and polycultures within the same farm, thus allowing for comparison of a paired monoculture with a polyculture while controlling for other factors such as soil type and climate [14]. Second, these systems are ancient, with continuous sedentary agriculture documented for >4000 years [29]. As such, this allows time for differences in species traits to have measurable effects on soil C stocks. Finally, this region is expected to experience an increase in mean annual temperature (MAT) [30], such that predictions about the effect of increasing MAT on C stocks will provide useful information for designing future agroforestry systems.
The climate is tropical, humid, with two monsoonal seasons. The summer monsoon season occurs from June to September, with the northeast or retreating monsoon occurring from October to November [31,32]. Mean annual rainfall in Thrissur District is 2750 mm (Kerala Agricultural University weather station, Vellanikkara, Thrissur District, state of Kerala, India, latitude 10°31′ N, longitude 76°17′ E, elevation 40 m, data unpublished), with rainfall increasing from the coast to the hills (part of the Western Ghats), and 75% of rain falling during the monsoonal months from June–September. Daily maximum temperatures of 36–39 °C occur during March and April, the pronounced dry season; the MAT is 27.8 °C (Kerala Agricultural University).
The parent material is pre-Cambrian, except for coastal areas with more recent sediments [31,32]. The predominant dry-land soil types range from Typic Kandiustults (clayey-skeletal Haplic Acrisols, Food and Agricultural Organization, FAO system) in coastal areas to Ustic Kandihumults (clayey-skeletal Humic Acrisols, FAO system) to Oxic Humitropepts (clayey Mollic Cambisols, FAO system) in the highlands [32] (H. Eswaran, personal communication). These soils do not contain carbonates, so soil C is equivalent to soil organic C.
In a previous study conducted in 1997 (Jan–May), we located 50 farms in which we established a set of paired plots (each 10 × 10 m) within a single farm. One of the paired plots contained a given plant functional group of crops (annual, palm or tree) grown in a monoculture and the other contained the same crop grown in an agroforestry system. The paired plots were on similar soil types, with the same cropping system and management for at least a decade. Local Agricultural Officers from the Kerala State Agriculture Department provided us with a list of farmers whose farms met these criteria, from which we randomly selected 50 farms in which farmers wished to participate in the study. The selected farmers represented a wide range of socioeconomic groups. Their landholding size ranged from 0.03 to 10 ha [14]. The most common crops grown in monocultures included: annual crops such as plantain or multipurpose banana (Musa × paradisiaca L. var. Nendran); palms, such as coconut (Cocos nucifera L.) or arecanut (Areca catechu L.); and trees, e.g., rubber (Hevea brasilensis Müll. Arg.). The agroforestry systems contained from two to >seven functional groups of crops, including: grasses, e.g., Napier grass (Pennisetum purpureum Schumach.); annual herbs; perennial herbs; root crops such as taro (Colocasia esculenta (L.) Schott); vines such as black pepper (Piper nigrum L.), palms; leguminous trees (Erythrina indica Lam., coral tree); deciduous trees (rubber); and evergreen trees (Artocarpus heterophyllus Lam., jackfruit). We revisited these farms for this study and re-sampled the soil eight years later (October–November 2005) if the cropping system had not changed since the previous sampling. At the 2005 sampling time, all of the annual systems previously sampled had been rotated to another crop, as part of the management plan. Thus, we have no data for the second sample time for annual cropping systems. Although the sampling months differed between the two sample years, we did not expect this to be a confounding factor because previous studies in the humid tropics indicated a lack of seasonal variability in soil C stocks [33].
2.2. Field and Laboratory Methods and Data Analysis
The objective of the field study was to obtain field-based data for characterizing the capacity of the model to quantify soil C stocks and their changes in agroforestry systems and monocultures of trees. Sampling the surface soil (0–10 cm) was sufficient to meet this objective, and further, this approach minimized the effects of destructive sampling on a family’s farm. The objective of the modeling study was to characterize the potential for total C storage in agroforestry systems, so we modelled soil to a depth of 50 cm, in addition to modeling the surface soil.
In the field study, we re-sampled soil in plots that had been sampled eight years previously. It was not possible to compare changes in soil C in the annual monocultures, because these plots had been rotated to a different system during the interim between sample times. We re-sampled monocultures of palms to provide a basis of comparison for the other systems, although data were not available to parameterize the model for that system. Thus, 39 plots were sampled at both times.
For both sampling times, the methods were as described by Russell [14]. Briefly, we used a push-tube soil sampler to extract eight cores, 4.2 cm in diameter, in each plot at randomly selected points. Samples within a plot were bulked, with subsequent analyses conducted on the single bulked sample. We removed roots and rocks from samples, which we then air-dried and passed through a 2 mm mesh sieve. Sub-samples were dried at 105 °C for dry-weight conversion. Soil samples were finely ground for analyses of organic C and total N by dry combustion (DC) using a Thermo-Finnigan EA Flash (Series 1112, EA Elantech, Lakewood, NJ, USA). Duplicates were run on all samples. Bulk density was sampled one time by the soil core method [34].
To analyze differences in soil C among cropping systems and between sampling times, we first tested for homogeneity of variances and normality of distributions. The data did not fit the assumptions, but ln-transformed data did; thus, analyses were done with the transformed data. We used a generalized linear model procedure to conduct an analysis of variance (ANOVA) test with a time series analysis to test for differences in soil C between sample times and among cropping systems [35]. We also used ANOVA to test for differences among systems in changes of soil C over time. For post-hoc tests, we used Tukey–Kramer multiple comparison tests (experiment-wise error rate, α = 0.05).
2.3. Modeling
The CENTURY model was used to simulate carbon and nutrient dynamics for many types of ecosystems, including tropical systems [25,36,37,38,39]. The CENTURY model contains a soil organic matter/decomposition submodel, a water budget model, a forest production submodel, and functions for simulating management activities and natural events.
We parameterized the model (version 4.5, forest mode) for climate in the Thrissur District using monthly maximum and minimum temperature and precipitation data (1983–2005) from the Vellanikkara weather station of Kerala Agricultural University Thrissur (Table S1). We used published data for crops, trees, and soils in these systems [14,40,41,42] to parameterize the model for the baseline run. We modeled a typical land-use-change scenario for the region, i.e., the “spin-up”, that consisted of allowing the natural vegetation of semi-evergreen forest to grow for 1800 years, followed by slash-and-burning of the forest and establishment of a homegarden for 98 years (CENTURY “Schedule” file, Table S2). We then appended the experimental run to the spin-up land-use-change scenario. Table S2 contains the schedule file for the 100% annual cropping treatment in Experiment 1 on the effects of growth forms in cropping systems. For all experiments, the baseline tree in the model was “LUQD” for Luquillo deciduous, the typical tree modeled in CENTURY for tropical forests with distinct dry periods. This LUQD tree is deciduous during drought periods, as are rubber trees. In addition, the parameters for this tree type (listed in Table S3) best matched information from the literature on tree species in Kerala agroforestry systems. For all systems that contained an annual crop, plantain banana was used (“BAN” in CENTURY, parameters listed in Table S4).
For each of the modeling experiments, we changed one set of parameters at a time to create a single treatment level, ran the model, and collected the output for aboveground biomass C and soil C (0–50 cm) at the end of the 100 year experimental run. The process was repeated for each treatment level and for the two soil depths (0–10 and 0–50 cm). Each experiment had five treatment levels. The baseline and experimental parameters are listed in Tables S2–S5. For modeling Experiment 1, regarding the effect of growth forms on cropping systems, the three systems included: (1) a monoculture of an annual crop, banana (plantain); (2) an agroforestry system (AFS) of annual crops and trees; and (3) a monoculture of trees. Typically, this annual crop receives OM additions and occasional irrigation. In contrast, these management factors are optional in the other two cropping systems. To allow for comparison among the three systems without confounding these management factors, we included treatment levels with (+) and without (0) OM addition and irrigation for the agroforestry and 100% tree systems. Thus, the five treatment levels were: Annuals +; AFS 0; AFS +; Trees 0; and Trees +. To compare our field-based soil C measurements with Experiment 1 output, model output for the 0–10 cm soil depth was also collected.
For Experiment 2, regarding the effect of tissue lignin content, the Trees 0 cropping system was used, i.e., a monoculture of trees with no OM additions or irrigation. The experimental range in the fraction of lignin levels varied by component, as follows: leaves, 0.05–0.25; fine roots, 0.18–0.36; fine branches, large wood and coarse roots, 0.25–0.45 (Table S3). These values were centered approximately around the baseline tree species, LUQD (leaves, 0.15; fine roots, 0.28; other components 0.35, Table S3). The experimental ranges were based on values for trees from the literature [20,43,44].
For Experiment 3, regarding the effect of increasing temperatures, simulations were run using the AFS + cropping system. Both minimum and maximum temperatures were increased for all 12 months (see variables “TMX2M(1–12)” and “TMN2M(1–12)’ in Table S5). Starting with the current baseline temperatures, temperatures were increased incrementally across the five treatment levels to a maximum increase of 6 °C. Based on the United Kingdom Meteorological Office coupled climate model, Bhaskaran et al. [30] predicted temperature increases of 1–4 °C in the Indian subcontinent during cooler periods—the winter and monsoon seasons. The range for our experiment was intended to include higher temperature increases during hotter parts of the year.
For Experiment 4, regarding the effect of soil texture, AFS + was the simulated cropping system. The sand fraction parameter was decreased from 0.7 to 0.1 across the five experimental runs, and the clay fraction correspondingly increased from 0.1 to 0.6; the silt fraction varied less, from 0.20 to 0.30 (Table S6). The experimental textures thus ranged from sandy loam to loam to clay loam to clay soil. The ranges for sand and clay were centered near the baseline values: sand, 0.30; clay, 0.41, a clay/clay loam soil. The experimental range encompassed the soil textures found in this region [32].
3. Results
3.1. Model Output
3.1.1. Experiment 1: Effects of Growth Form(s)
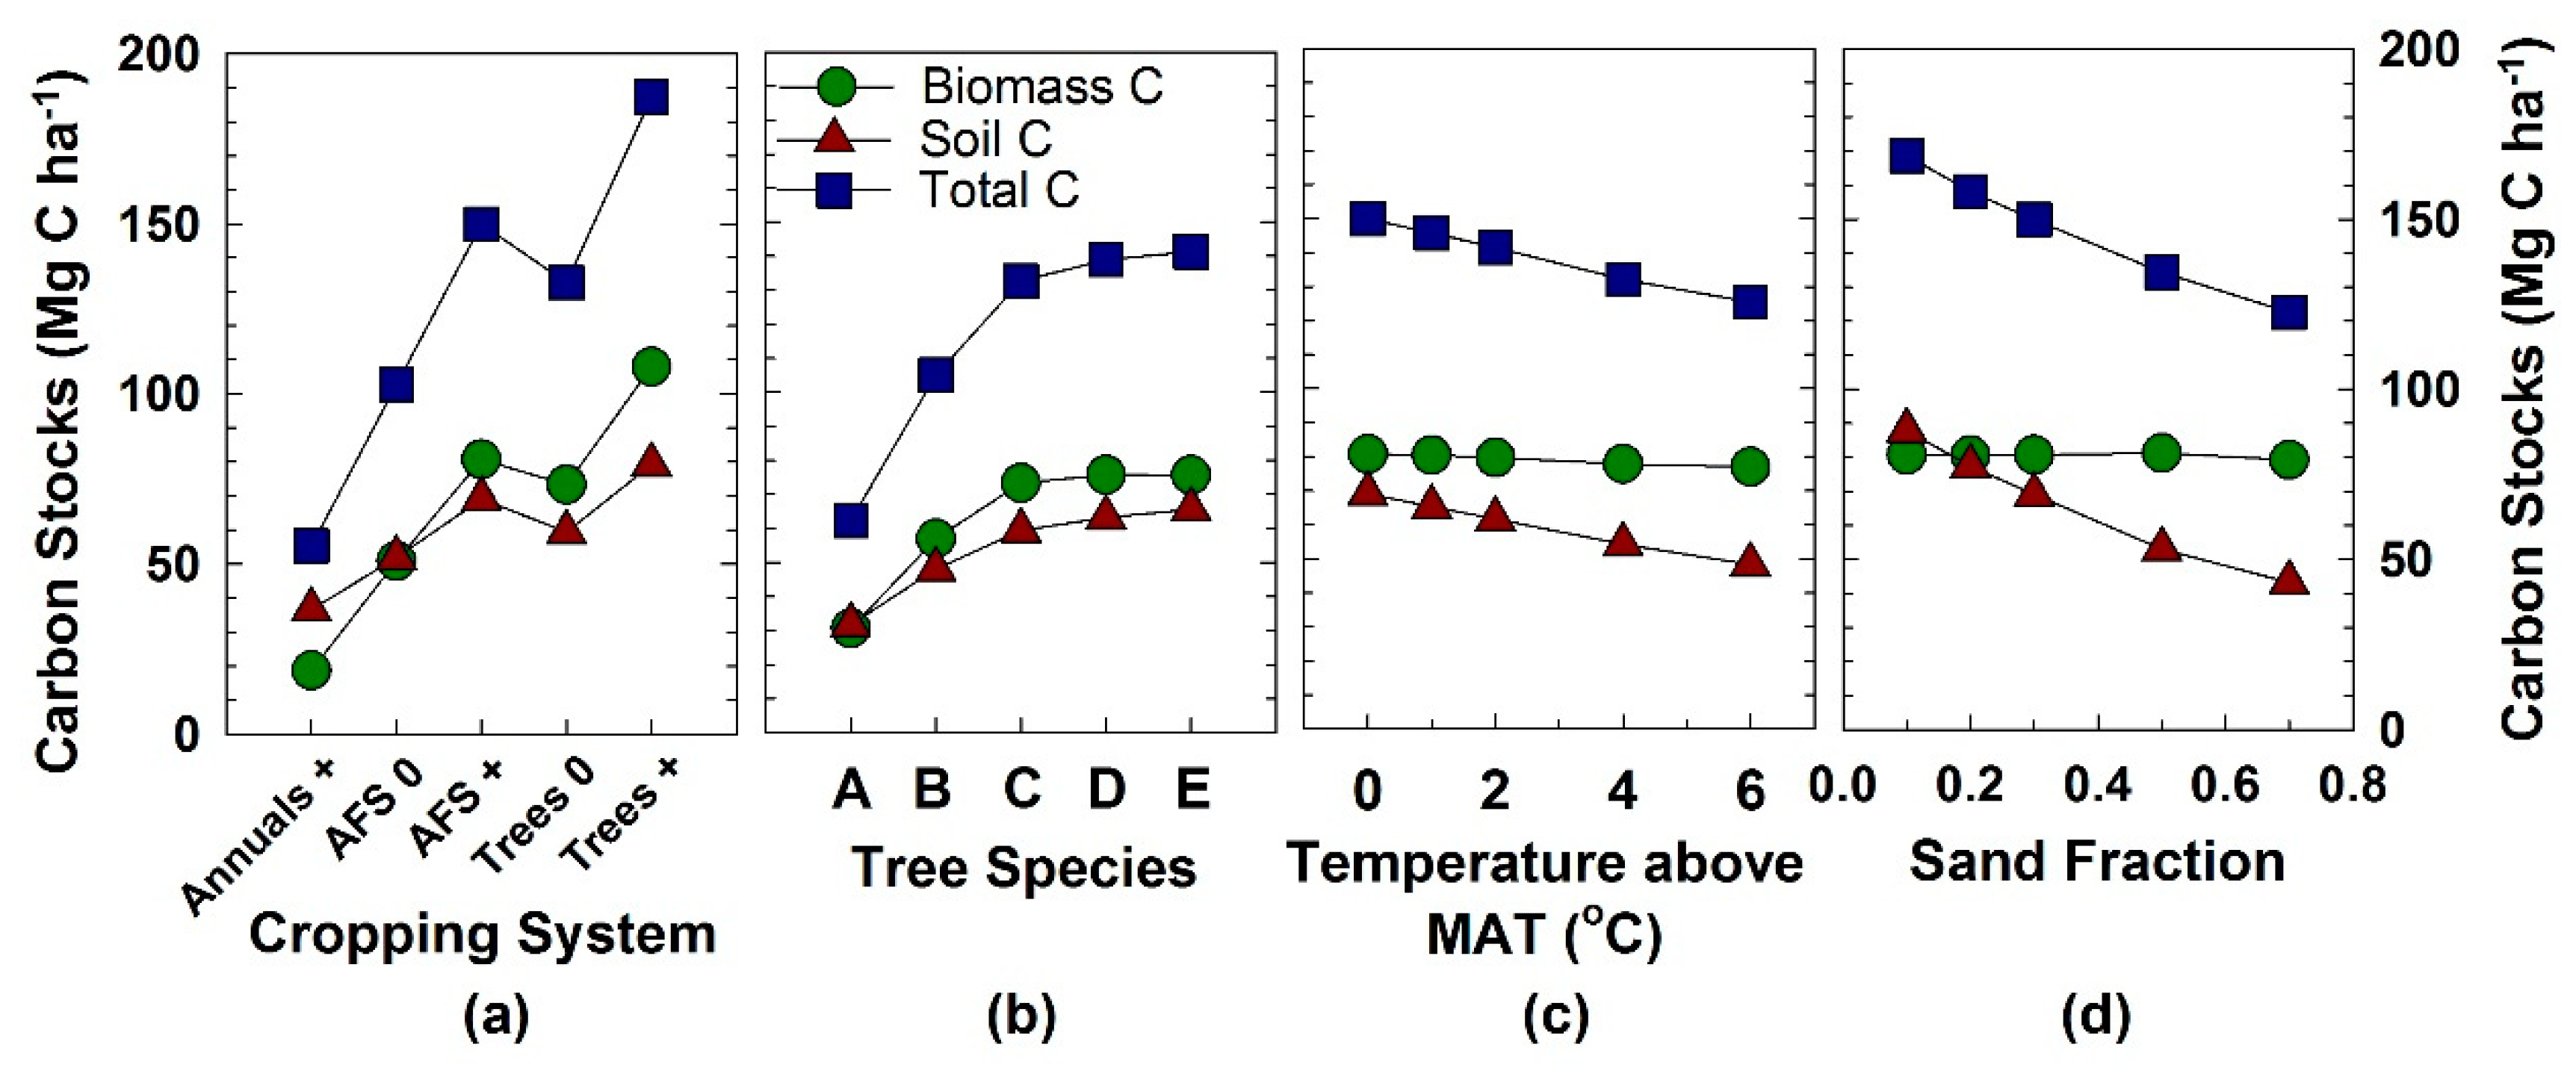
In comparisons of the three systems, simulated C stocks in aboveground biomass were 430% greater in the AFS + system (annuals and trees) than in the Annual + monoculture, both of which received OM additions and irrigation (Figure 1a). The monoculture of Trees + had only 34% greater C stocks than the AFS + system. Soil C stocks were 90% higher in the AFS + system than in the Annual + system, but only 10% higher in the Tree + system compared with the AFS + system. Thus, total C increased by 270% in the transition from all annual crops to the agroforestry mixture of annuals and perennials, and by 25% in the transition to the monoculture of trees.
As in real-life practice in this region, the simulated annual crop failed to accumulate any biomass without OM addition and irrigation. Thus, we could make simulation comparisons only of the AFS 0 and Trees 0 with the Annual + system. The AFS 0 system had 270% more aboveground biomass C and 42% more soil C than the Annual + system (Figure 1a). The Trees 0 monoculture had 44% greater aboveground biomass and 14% more soil C than the AFS 0 system in these two scenarios without any additions. Thus, total C was 86% higher in the AFS 0 system than the Annual + monoculture, and increased 29% more in the transition from AFS 0 to the Tree 0 monoculture.
3.1.2. Experiment 2: Effects of Individual Tree Species
In this experiment, the five modeled tree “species” differed only in their lignin fraction parameters (WDLIG 1–5 in Table S3). Lignin fractions ranged from 0.05 to 0.25 in leaves, from 0.18 to 0.36 in fine roots, and from 0.25 to 0.45 in fine branches, large wood, and coarse roots (Table S3). Simulated C stocks in aboveground biomass increased with lignin content, approaching an asymptote by the intermediate lignin values, at which point biomass was 240% greater than at the lowest lignin contents (Tree “A” in Figure 1b). Soil C stocks doubled as lignin content increased. Thus, total C increased by 227% as lignin content increased among the experimental tree “species”.
3.1.3. Experiment 3: Effects of Increasing Temperature
The experimental temperatures represented the current baseline mean monthly temperatures, plus increases of 1, 2, 4, and 6 °C above the current temperatures (Table S5). Simulated C stocks in aboveground biomass declined with an increase in temperature to 95% of the baseline biomass (Figure 1c). Soil C declined with an increase in temperature to 70% of the baseline. Thus, total C stocks decreased to 84% of the baseline run when there was no change in temperature.
3.1.4. Experiment 4: Effects of Soil Texture
To simulate different soil textures in this experiment, we ran the model at five different sand fractions, decreasing the parameter from 0.7 to 0.1, and increasing the clay fraction correspondingly from 0.1 to 0.6 (Table S6). The silt fraction was relatively similar across runs. Aboveground C stocks increased by only 2% as sand content declined, whereas soil C stocks doubled over this range of sand content (Figure 1d). Thus, total C stocks increased by 38% over this range of experimental soil types.
3.2. Field-Based Measurements of Soil Carbon
Soil C (0–10 cm) did not differ significantly between the sampling times which were 8 years apart (p > 0.32) (Table 1), and the interaction of sampling time with cropping system was not significant (p > 0.79). Soil C differed significantly among the cropping systems (p = 0.0009); soil C was higher in agroforestry systems and rubber tree monocultures than in palm monocultures. The modeled soil C for the agroforestry systems and rubber tree monocultures corresponded well with measured ranges of soil C.
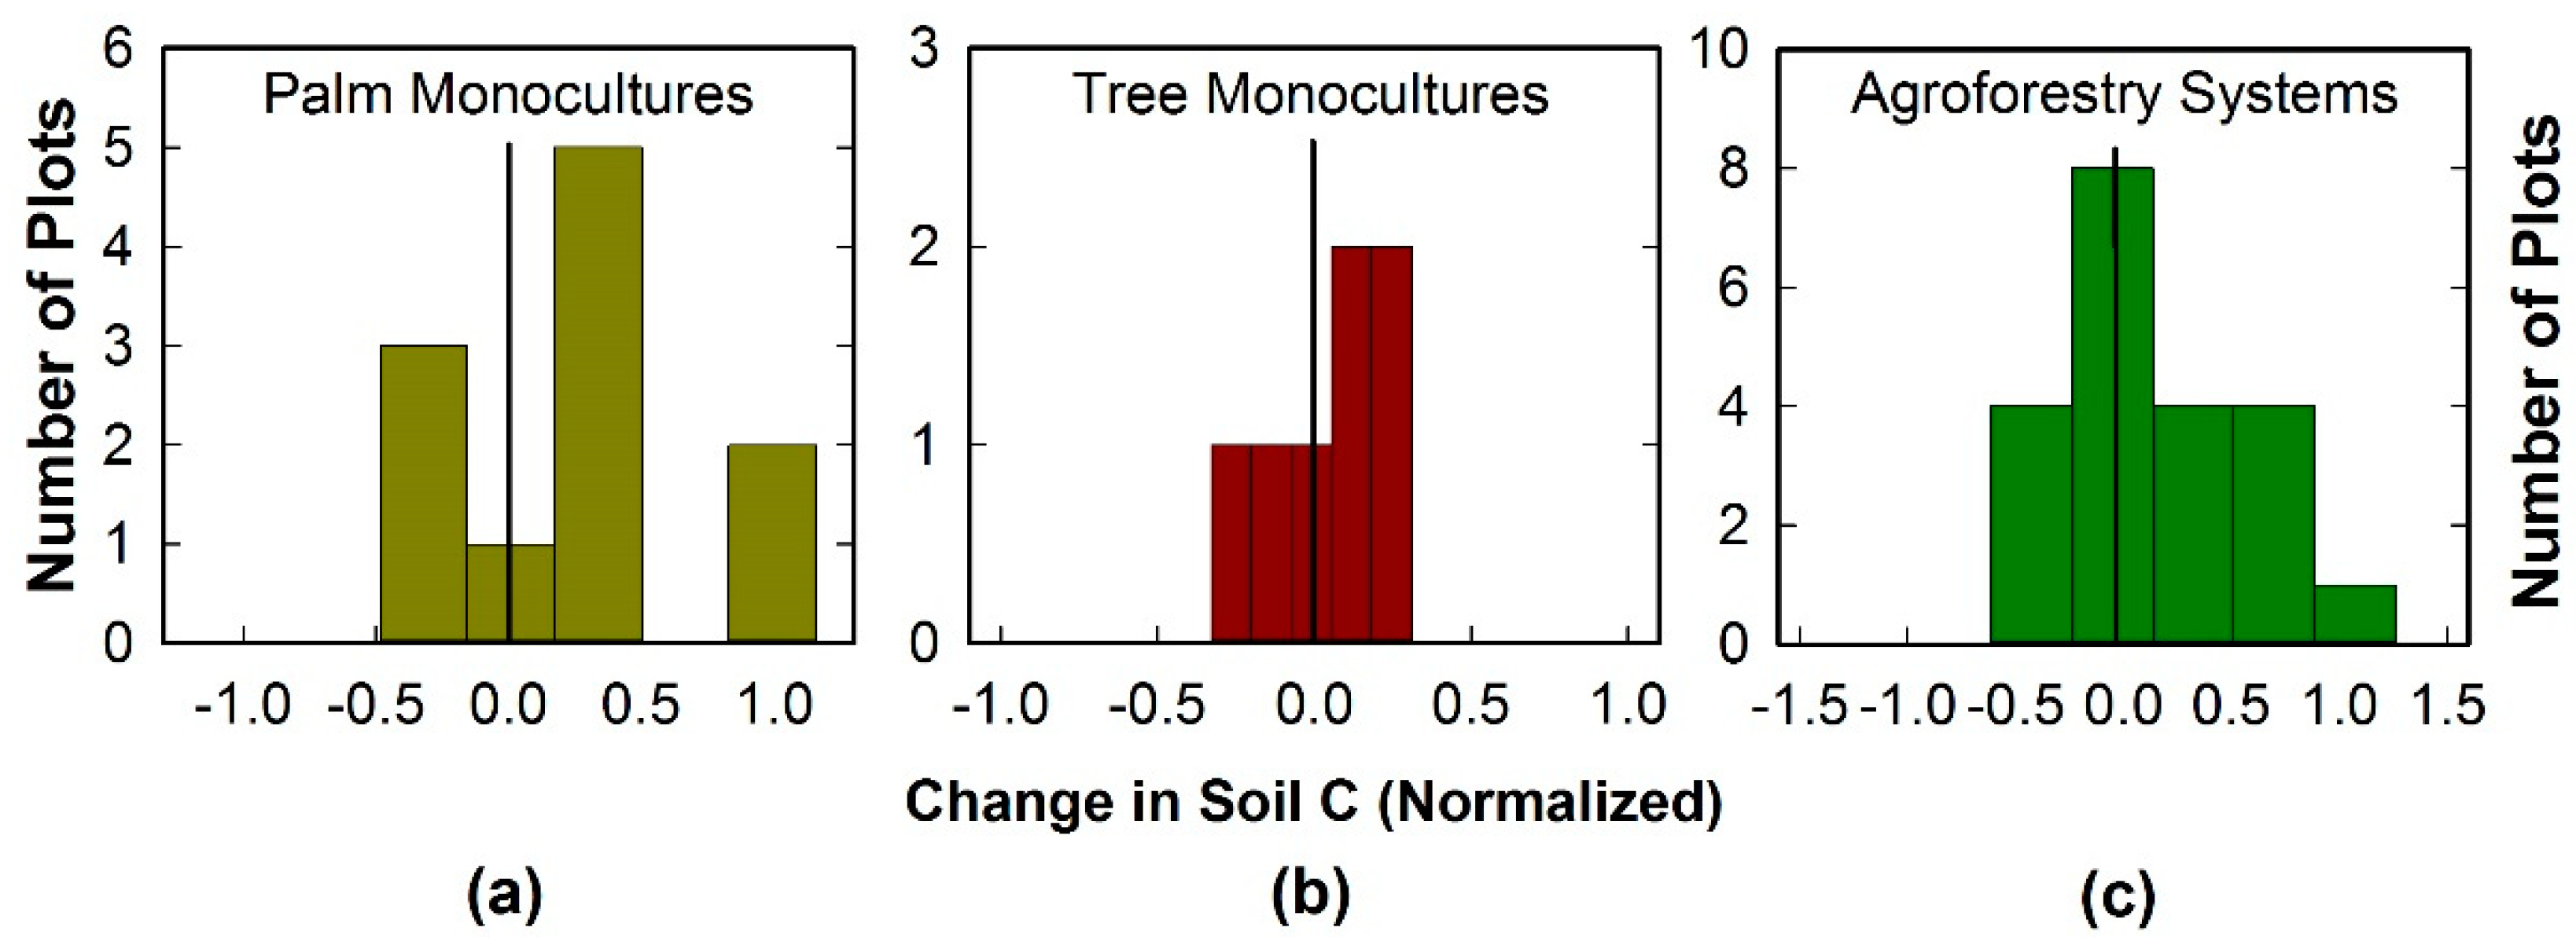
In the field-based measurements, soil C increased rather than decreased in a greater number of plots in palm monocultures and agroforestry systems (Figure 2). Agroforestry systems had the largest relative increases in soil C, whereas tree monocultures had the lowest increases.
4. Discussion
The model demonstrated a capacity to characterize measured surface soil C stocks and their changes in agroforestry systems and tree monocultures: modeled soil C values for these systems, ranging from 916 to 1585 g m−2, fell within the variability measured in the field (Table 1). Moreover, the measured changes in soil C (Figure 2) were consistent with the variability in modeled predictions that arose from differences in management of OM additions and irrigation. Although we did not measure deeper soil (10–50 cm), the modeled C stocks for this depth were consistent with field studies by others in Kerala agroforestry systems [45]. In addition, the modeled aboveground C stocks were within ranges reported in the literature [40,42,46]. Although true validation of the model was not possible, the congruence of the modeled output with measured soil C stocks in this and other studies indicated that the model captured the C dynamics of these systems sufficiently well for us to evaluate the outcome of our modeling experiments. In contrast with field-based observational studies in which one factor may be confounded with other factors, these modeling experiments allowed for the evaluation of a single factor at a time within a holistic framework. This provided a means for direct comparison of the effects of individual factors on C storage in agricultural systems under various conditions in central Kerala.
4.1. Biomass C Stocks
4.1.1. Effects of Growth Form(s)
Of the four simulated factors, growth form, as modeled in Experiment 1, had the greatest effect on C stocks in aboveground biomass in Kerala agricultural systems (Figure 1). Changing from a monoculture of annual non-woody crops to an agroforestry system containing trees and annuals more than quadrupled C stocks in aboveground biomass when the systems received irrigation and OM additions.
Annual cropping systems generally necessitate OM additions and irrigation in some locations, but management of tree crops is more flexible. Even without OM additions and irrigation, aboveground C stocks in the agroforestry system were nearly triple that of the annual monoculture that did receive OM additions and irrigation. These results highlight the effectiveness of agroforestry systems as a mitigation strategy that can store nearly as much C as a monoculture of trees, while at the same time providing annuals and cash crops and requiring fewer inputs.
The change from annual monoculture to agroforestry represents an increase in the number of functional groups. An increase in biomass C stocks was similarly associated with increased plant functional diversity in other studies in agroforestry systems [14] and experiments [33,47,48]. Various mechanisms could explain the effect of this increase on biomass C stocks. As the number of plant functional groups increases, canopy structure can diversify, thus increasing light use, thereby increasing photosynthesis. Similarly, the stratified belowground architecture of such systems [49] can enhance water and nutrient uptake [16]. Tropical trees can tap into water and nutrient supplies at greater depths than most annual crops [50,51] and they exhibit considerable phenotypic plasticity in this respect [49]. As such, a higher proportion of trees in the system will promote biomass C accumulation.
4.1.2. Effects of Tree Species
Differences among individual tree species in the lignin content of their tissues (Experiment 2) had the next biggest impact on biomass C: stocks increased nearly 2.5 fold across the range of lignin contents (Figure 1b). It is notable that this increase occurred without any inputs of fertilizers or irrigation—it arose simply by changing to a different “species” of tree. These results align with field-based experimental results in which the identity of a species played a significant role in C accumulation because tree species differ in their traits, which influenced C cycling differentially [17,33,52,53].
Deforestation in the tropics increased from 6.9 to >7.9 million ha over the period 2000 to 2012 [54]. Thus, the dilemma of how to restore the landscape with trees, while providing land for agriculture continues to grow. Agroforestry presents an optimal solution for this. To maximize this land use, however, our modeling findings highlight the importance of evaluating the tree species traits that influence their capacity to sequester C. Researchers have evaluated species-specific traits for reforestation efforts with plantations, focusing on traits such as survival, wood density, height, diameter, crown cover, shade or sun tolerance, seed dispersal mechanism, photosynthetic characteristics and water use [55,56,57,58]. Our findings indicate that this same approach could advance the potential for sequestering biomass C in agroforestry systems. Evaluating more types of traits and incorporating results from this research into the design of agroforestry systems could further improve C storage in agroforests.
4.1.3. Increasing Temperatures
In the simulated warming of 6 °C above the current MAT, from 26.4 to 32.4 °C, biomass C stocks decreased by only 5% (Figure 1c). If the magnitude of this temperature increase did not surpass optimal thresholds for photosynthesis, increase respiration, or increase mortality rates, one would not expect a direct effect of increased temperature on biomass C. However, one would expect to see indirect effects of increased temperature via increased evapotranspiration, leading to increased soil moisture stress, especially in this rain-fed agroforestry system modeled, thereby leading to reduced plant growth and biomass C stocks. Indeed, modeled potential evapotranspiration (PET) increased with MAT (Figure 3a). However, as MAT increased, soil water available for crop/tree survival (parameter “avh2o(2)” in CENTURY) remained stable at 12.9 cm of water for a 0–50 cm depth and streamflow decreased by only 7% (Figure 3a). The relatively high clay content used in this experiment, 41%, allowed for relatively high soil water availability. The critical means by which the modeled trees avoided water stress was that the tree “LUQD” was deciduous, thereby allowing it to avoid water stress during the dry season.
There are many uncertainties in modeled predictions of how climate will change [22], and our results suggest that there are also uncertainties in modeling how cropping systems will respond to increases in temperature, and the corresponding changes in plant water use. Although CENTURY contains nearly 100 tree parameters, only two parameters relate to water use: evergreen versus deciduous and the effect on transpiration rate of doubling the atmospheric CO2 concentration. Another way to simulate the effect of water stress with this model is to change the soil texture, as in Experiment 4, given soil texture’s effect on soil water-holding capacity. Future modeling could explore the effect of other tree traits on water use, including allocation to fine roots and evergreen leaves, to examine the indirect effects of increasing temperature on C stocks in agroforestry systems.
4.1.4. Soil Texture
The magnitude of the effect of soil texture on biomass C stocks was less than that of any of the other factors: biomass C declined only 2%–3% as the sand fraction increased from 0.1 to 0.7 (Figure 1c). As sand content increased, simulated available soil water declined by 17% (Figure 3b). One would have expected a greater reduction in biomass with this decline in soil water. The explanation is that in this modeled setting, soil nutrients were relatively more limiting to biomass accumulation than water limitation.
Because temperature parameters were held constant across levels of sand fractions in this Experiment 4, PET also remained constant, unlike in Experiment 3 on temperature. With no change in PET, simulated streamflow declined by only 2% (Figure 1c), even as soil water availability declined with increasing sand content. Future modeling could explore the relationships between water and nutrient limitations in agroforestry systems in conjunction with crop/tree traits and their sensitivity to drought and lower soil nutrient status. This research can inform practitioners about the impacts of the trade-offs involved in choosing species for agroforestry systems based on the environmental constraints within a site.
4.2. Soil C Stocks
4.2.1. Tree Species and Growth-Form Effects
Of the factors modeled, traits of individual tree species (i.e., species identity) had the biggest impact on soil C stocks (Figure 1b). The modeled species with the highest lignin content increased soil C more than two-fold (207%). This result aligns with the concept that lignin is relatively recalcitrant [18] and would thus accrue in soil, building up soil C stocks.
Manipulating the growth forms also had a large effect: soil C increased nearly two-fold (190%) with the addition of trees to an annual system (Figure 1a). These simulation results align well with multiple field-based studies in which soil C increased with plant functional diversity [44,54,59,60]. In home gardens in Kerala, Saha et al. [45] found that soil C stocks were directlyrelated to plant diversity.
4.2.2. Increasing Temperature
Whereas the effect of increasing temperature was minimal on biomass C storage, the effect on soil C stocks was much greater. Soil C declined to 90% of the original stocks under a 2 °C increase in temperature, and to 70% under the modeled 6 °C increase. Many other factors influence the decomposition of SOM, including water and O2 availability, substrate quality, fire, physical and chemical protection, and enzymes and inhibitors. As such, it can be difficult to ascertain the sensitivity of SOM decomposition to temperature because these other factors may mask the effects of temperature on decomposition [61]. The CENTURY model addresses this inherent difficulty by compartmentalizing OM within three pools in mineral soil (i.e., active, slow, and passive), plus plant tissue pools, based on their mean residence time and chemistry. This provides a robust framework for modeling SOM decomposition and its controlling factors in a diverse array of soils. For future modeling, this represents a rich context for examining relationships between soil C and the crop/tree species planted, environmental conditions, and management.
4.2.3. Soil Texture
Similar to temperature, the simulated increase in sand content had a much stronger effect on soil C stocks than on biomass stocks. Soil C more than doubled over the range of sand/clay combinations, a response similar to that of the change in the modeled tree species. This strong response of modeled change in soil texture provides confidence in the model’s sensitivity to environmentally important factors. The similar response to the effects of soil texture, a factor known to influence soil C and tree species, also indicates the relative strength of the effect of species traits on ecosystem processes.
This strong effect of modeled soil texture on soil C stocks is supported by field-based studies. As reviewed by Nair et al. [9], soil texture influences the formation of primary organo-mineral complexes. Clay soils enhance aggregation and the stability of soil aggregates and provides physical protection of SOM. In contrast, sands rely on physical binding by roots and hyphae, rather than organo-mineral complexes, such that aggregates in sandy soils tend to be weak. As such, clay soils retain more C than sandy soils.
4.3. Implications for Total (Biomass + Soil) C Storage in Tropical Agroforestry Systems
The potential for C storage in humid tropical systems is very high, ranking among the highest for agroforestry systems around the world [5]. In India, the potential C storage in agroforestry systems in the humid tropical lowlands is estimated to be 92–228 MgC ha−1 [62], on par with that of forest plantations and mature forest in the humid tropics [17]. With potential C sequestration rates of 1.1–2.2 Pg C/year in 585–1245 million ha in Africa, Asia, and the Americas, agroforestry systems can play an important role in mitigating climate warming [62]. A literature study found that soil C storage rates in agroforestry systems in sub-Saharan Africa were significantly higher than 4‰ [63]. Moreover, agroforestry systems can enhance pools of soil organic C that last for millennia [64].
Our field-based measurements of surface soil C indicated that soil C storage varied significantly among agroforestry systems, a finding supported by other soil C studies at deeper depths in sites in Kerala [45] and in sub-Saharan Africa [63]. Many factors, including the species composition and number and density of woody species, land use history, and soil type, can influence C storage in agroforestry systems [45,65]. Of the factors modeled in this study, manipulation of growth form had the largest effect on total C storage under management with OM additions and irrigation, with total C stocks 2.7 fold greater in the agroforestry system compared with the annual monoculture (Figure 1a). Without OM addition or irrigation, however, the traits of the individual tree species had the largest effect on simulated total C storage, with a 2.3 fold increase in total C across the range of lignin contents in trees (Figure 1b).
Management factors such as the type, quantity, and timing of organic amendments and inorganic fertilizers can also influence C storage. Across farms in this study, the type and quantity of organic amendments varied among farms and agricultural systems [14]. Organic amendments included dung, green manure, wood ash, neem (Azadirachta indica A. Juss.) extract, and finely ground rock phosphate. Farmers also used marketed fertilizers such as di-ammonium phosphate (18% N, 20% P), ammonium phosphate (16% N, 8.6% P), and “17-17-17” (percentages of N, P, and K on a mass basis). Agricultural land use has changed recently in Kerala [66], and that too could introduce variability in management as management options, policies, and socioeconomic factors have changed. Although best management practices (BMPs) for agroforestry systems involving tillage, green manure addition, and tree management have been described [65,67,68], future research is needed in helping farmers achieve BMPs for specific agroforestry systems.
Although these modeling experiments focused on the C storage capacity of agroforestry, these species-rich systems can enhance other ecosystem services, including provisioning of food, fibers, wood, and medicines; control of climate and disease; refugia for rare species; and cultural and spiritual benefits. Higher biodiversity of agroforests can result in a stable supply of ecosystem goods and services if their crop species respond differently to environmental and biotic perturbations and allow for a range of management options [13].
Our modeling results highlight the flexibility provided by agroforestry systems, i.e., one could increase C storage simply through judicious selection of tree species based on their traits, without economic investment in fertilizers and irrigation. This strategy of selecting species for their C-storage potential would require a better knowledge of tree traits that influence C dynamics, indicating future directions for research. From the standpoint of developing sustainable agricultural systems, the modeling results suggest the need to consider site-specific environmental conditions in conjunction with the water- and nutrient-use traits of the species to be planted. Research focused on evaluating the trade-offs between water use efficiency, nutrient use efficiency, and growth potential for common crops in agroforestry will provide valuable information for designing systems for maximizing C storage in a warming world and playing a role in mitigating climate change.
5. Conclusions
The integrated use of measurements from long-term plots in conjunction with process-based modeling allowed us to evaluate the effects of four factors on C storage in agroforestry systems in Kerala, India, a humid tropical environment. The type of growth form had the largest impact on C storage in aboveground biomass—inclusion of trees into an annual cropping system more than quadrupled C stocks. Species-specific traits such as lignin content had a greater effect on soil C stocks than did growth form, however. One of the most important implications from this modeling study is that inclusion of trees in the system promotes higher C storage in these agricultural systems without the economic costs of fertilizers or irrigation. Greater use and better management of trees within these agricultural systems thus provides a very low-cost means for mitigation of climate warming.
Supplementary Materials
The following are available online at https://www.mdpi.com/1999-4907/10/9/803/s1, Table S1: Climate data from the Vellanikkara, Thrissur Station. Latitude: 10°31’; Longitude: 76°13’. Height is 40 m above MSL. Monthly data from January 1983 to September 2005, Table S2: Schedule’ file in CENTURY. Blocks #1–4 simulate the land-use scenario, i.e., the ‘spin-up,’ prior to the start of the experimental modeling. Block #5 simulates the first run in Experiment #1 on effects of cropping system for the treatment of 100% Annuals (Banana, plantain), Table S3: Tree parameters in the Tree.100 file. Table S4: Crop Parameters in the ‘Crop.100’ file, Table S5: Climate parameters used in Experiment 3 on effects of increase in temperature. Point # refers to the order of the temperature increase, from lowest to highest. Bolding denotes parameters that differed among the ‘treatment’ levels. Point #1 values are based on the actual climate data, i.e., no warming effect, Table S6: Site parameters used in Experiment 4 on the effect of soil type. Point # refers to the order of increase in sand content, from lowest to highest. Bolding denotes parameters that differed among the ‘treatment’ levels.
Author Contributions
Conceptualization, methodology, software, formal analysis, validation, data curation, visualization, writing—original draft preparation, funding acquisition, project administration: A.E.R. Resources, writing—review and editing: B.M.K.
Funding
This research was funded by the Fulbright Program through a Fellowship (to A.E.R.) in the Indo-American Environmental Leadership Program.
Acknowledgments
We thank Kerala Agricultural University (KAU) for use of facilities. G.S.L.H.V. Rao provided 20 years of meteorological data for parameterizing the model’s climate variables. Cindy Keough provided assistance with model programming. We also thank the farmers who participated in this study and several research technicians at KAU for assistance in this research.
Conflicts of Interest
The authors declare no conflict of interest.
References
- Le Quéré, C.; Moriarty, R.; Andrew, R.M.; Canadell, J.G.; Sitch, S.; Korsbakken, J.I.; Friedlingstein, P.; Peters, G.P.; Andres, R.J.; Boden, T.A. Global carbon budget 2015. Earth Syst. Sci. Data 2015, 7, 349–396. [Google Scholar] [CrossRef]
- Houghton, R.A.; Nassikas, A.A. Negative emissions from stopping deforestation and forest degradation, globally. Glob. Chang. Biol. 2018, 24, 350–359. [Google Scholar] [CrossRef] [PubMed]
- Minasny, B.; Malone, B.P.; McBratney, A.B.; Angers, D.A.; Arrouays, D.; Chambers, A.; Chaplot, V.; Chen, Z.-S.; Cheng, K.; Das, B.S. Soil carbon 4 per mille. Geoderma 2017, 292, 59–86. [Google Scholar] [CrossRef]
- Nath, A.J.; Lal, R.; Sileshi, G.W.; Das, A.K. Managing India’s small landholder farms for food security and achieving the “4 per Thousand” target. Sci. Total Environ. 2018, 634, 1024–1033. [Google Scholar] [CrossRef] [PubMed]
- Kumar, B.M.; Nair, P.K.R. Carbon Sequestration Potential of Agroforestry Systems: Opportunities and Challenges; Springer Science & Business Media: Berlin, Germany, 2011; Volume 8. [Google Scholar]
- Muschler, R.G. Agroforestry: Essential for Sustainable and Climate-Smart Land Use. In Tropical Forestry Handbook; Springer: Berlin, Germany, 2016; pp. 2013–2116. [Google Scholar]
- MOSPI. Statistical Year Book India 2018. Available online: http://www.mospi.gov.in/statistical-year-book-india/2018/177 (accessed on 11 September 2019).
- Lal, R. Soil carbon sequestration in India. Clim. Chang. 2004, 65, 277–296. [Google Scholar] [CrossRef]
- Nair, P.K.R.; Nair, V.D.; Kumar, B.M.; Showalter, J.M. Carbon sequestration in agroforestry systems. In Advances in Agronomy; Elsevier: Amsterdam, The Netherlands, 2010; Volume 108, pp. 237–307. [Google Scholar]
- Kumar, B.M.; Singh, A.K.; Dhyani, S.K. South Asian agroforestry: Traditions, transformations, and prospects. In Agroforestry-The Future of Global Land Use; Springer: Berlin, Germany, 2012; pp. 359–389. [Google Scholar]
- McGuire, A.; Sitch, S.; Clein, J.S.; Dargaville, R.; Esser, G.; Foley, J.; Heimann, M.; Joos, F.; Kaplan, J.; Kicklighter, D. Carbon balance of the terrestrial biosphere in the twentieth century: Analyses of CO2, climate and land use effects with four process-based ecosystem models. Glob. Biogeochem. Cycles 2001, 15, 183–206. [Google Scholar] [CrossRef]
- Metherell, A. A Model for Phosphate Fertiliser Requirements for Pastures—Incorporating Dynamics and Economics. In The Efficient Use of Fertilisers in a Changing Environment: Reconciling Productivity and Sustainability; Occasional Report; Massey University: Palmerston North, New Zealand, 1994. [Google Scholar]
- Hooper, D.U.; Chapin, F.S.; Ewel, J.J.; Hector, A.; Inchausti, P.; Lavorel, S.; Lawton, J.H.; Lodge, D.; Loreau, M.; Naeem, S. Effects of biodiversity on ecosystem functioning: A consensus of current knowledge. Ecol. Monogr. 2005, 75, 3–35. [Google Scholar] [CrossRef]
- Russell, A.E. Relationships between crop-species diversity and soil characteristics in southwest Indian agroecosystems. Agric. Ecosyst. Environ. 2002, 92, 235–249. [Google Scholar] [CrossRef]
- Fisher, R.F. Amelioration of degraded rain forest soils by plantations of native trees. Soil Sci. Soc. Am. J. 1995, 59, 544–549. [Google Scholar] [CrossRef]
- Gliessman, S. Agroecology: Ecological Processes in Sustainable Agriculture; CRC Press: Boca Raton, FL, USA, 1998. [Google Scholar]
- Russell, A.E.; Raich, J.W.; Arrieta, R.B.; Valverde-Barrantes, O.; González, E. Impacts of individual tree species on carbon dynamics in a moist tropical forest environment. Ecol. Appl. 2010, 20, 1087–1100. [Google Scholar] [CrossRef]
- Melillo, J.M.; Aber, J.D.; Muratore, J.F. Nitrogen and lignin control of hardwood leaf litter decomposition dynamics. Ecology 1982, 63, 621–626. [Google Scholar] [CrossRef]
- Hancock, J.E.; Loya, W.M.; Giardina, C.P.; Li, L.; Chiang, V.L.; Pregitzer, K.S. Plant growth, biomass partitioning and soil carbon formation in response to altered lignin biosynthesis in Populus tremuloides. New Phytol. 2007, 173, 732–742. [Google Scholar] [CrossRef] [PubMed]
- Novaes, E.; Kirst, M.; Chiang, V.; Winter-Sederoff, H.; Sederoff, R. Lignin and biomass: A negative correlation for wood formation and lignin content in trees. Plant Physiol. 2010, 154, 555–561. [Google Scholar] [CrossRef] [PubMed]
- Pachauri, R.K.; Allen, M.R.; Barros, V.R.; Broome, J.; Cramer, W.; Christ, R.; Church, J.A.; Clarke, L.; Dahe, Q.; Dasgupta, P. Climate Change 2014: Synthesis Report. Contribution of Working Groups I, II and III to the Fifth Assessment Report of the Intergovernmental Panel on Climate Change; IPCC: Geneva, Switzerland, 2014. [Google Scholar]
- Rosenzweig, C.; Elliott, J.; Deryng, D.; Ruane, A.C.; Müller, C.; Arneth, A.; Boote, K.J.; Folberth, C.; Glotter, M.; Khabarov, N. Assessing agricultural risks of climate change in the 21st century in a global gridded crop model intercomparison. Proc. Natl. Acad. Sci. USA 2014, 111, 3268–3273. [Google Scholar] [CrossRef] [PubMed]
- O’Neill, B.C.; Oppenheimer, M.; Warren, R.; Hallegatte, S.; Kopp, R.E.; Pörtner, H.O.; Scholes, R.; Birkmann, J.; Foden, W.; Licker, R. IPCC reasons for concern regarding climate change risks. Nat. Clim. Chang. 2017, 7, 28. [Google Scholar] [CrossRef]
- Lambers, H.S.; Chapin, F.; Pons, T.L. Plant Physiological Ecology; Springer: New York, NY, USA, 1998. [Google Scholar]
- Raich, J.W.; Parton, W.J.; Russell, A.E.; Sanford, R.L.; Vitousek, P.M. Analysis of factors regulating ecosystemdevelopment on Mauna Loa using the Century model. Biogeochemistry 2000, 51, 161–191. [Google Scholar] [CrossRef]
- Sanchez, P.A. Soil productivity and sustainability in agroforestry systems. Agrofor. A Decade Dev. 1987, 205–223. [Google Scholar]
- Quesada, C.; Phillips, O.; Schwarz, M.; Czimczik, C.; Baker, T.; Patiño, S.; Fyllas, N.; Hodnett, M.; Herrera, R.; Almeida, S. Basin-wide variations in Amazon forest structure and function are mediated by both soils and climate. Biogeosciences 2012, 9, 2203–2246. [Google Scholar] [CrossRef] [Green Version]
- Coleman, D.C.; Callaham, M.A.; Crossley, D., Jr. Fundamentals of Soil Ecology; Academic Press: Cambridge, MA, USA, 2017. [Google Scholar]
- Raychaudhuri, S.; Kaw, R.; RAG-HAVAN, D. Agriculture in Ancient India; Indian Council of Agricultural Research: New Delhi, India, 1964. [Google Scholar]
- Bhaskaran, B.; Mitchell, J.; Lavery, J.; Lal, M. Climatic response of the Indian subcontinent to doubled CO2 concentrations. Int. J. Climatol. 1995, 15, 873–892. [Google Scholar] [CrossRef]
- Pascal, J.-P. Wet Evergreen Forests of the Western Ghats of India; Institut Français de Pondichéry: Pondicherry, India, 1988. [Google Scholar]
- Bourgeon, G. Explanatory Booklet on the Reconnaissance Soil Map of Forest Area–Western Karnataka and Goa; Institut Français de Pondichéry: Pondicherry, India, 1989. [Google Scholar]
- Russell, A.E.; Cambardella, C.A.; Ewel, J.J.; Parkin, T.B. Species, rotation, and life-form diversity effects on soil carbon in experimental tropical ecosystems. Ecol. Appl. 2004, 14, 47–60. [Google Scholar] [CrossRef]
- Blake, G.R.; Hartge, K. Bulk density 1. Methods Soil Anal. Part 1—Phys. Mineral. Methods; American Society of Agronomy: Madison, WI, USA, 1986; pp. 363–375. [Google Scholar]
- SAS Institute. SAS User’s Guide: Statistics; SAS Institute: Cary, NC, USA, 1985; Volume 2. [Google Scholar]
- Motavalli, P.; Palm, C.; Parton, W.; Elliott, E.; Frey, S. Comparison of laboratory and modeling simulation methods for estimating soil carbon pools in tropical forest soils. Soil Biol. Biochem. 1994, 26, 935–944. [Google Scholar] [CrossRef]
- Probert, M.; Keating, B.; Thompson, J.; Parton, W. Modelling water, nitrogen, and crop yield for a long-term fallow management experiment. Aust. J. Exp. Agric. 1995, 35, 941–950. [Google Scholar] [CrossRef]
- Vitousek, P.M.; Turner, D.R.; Parton, W.J.; Sanford, R.L. Litter decomposition on the Mauna Loa environmental matrix, Hawai’i: Patterns, mechanisms, and models. Ecology 1994, 75, 418–429. [Google Scholar] [CrossRef]
- Parton, W.; Tappan, G.; Ojima, D.; Tschakert, P. Ecological impact of historical and future land-use patterns in Senegal. J. Arid Environ. 2004, 59, 605–623. [Google Scholar] [CrossRef]
- Kumar, B.M.; George, S.J.; Jamaludheen, V.; Suresh, T. Comparison of biomass production, tree allometry and nutrient use efficiency of multipurpose trees grown in woodlot and silvopastoral experiments in Kerala, India. For. Ecol. Manag. 1998, 112, 145–163. [Google Scholar] [CrossRef]
- Kumar, B.M.; Thomas, J.; Fisher, R.F. Ailanthus triphysa at different density and fertiliser levels in Kerala, India: Tree growth, light transmittance and understorey ginger yield. Agrofor. Syst. 2001, 52, 133–144. [Google Scholar] [CrossRef]
- Kumar, B.M.; Kumar, S.S.; Fisher, R.F. Galangal growth and productivity related to light transmission in single-strata, multistrata and ‘no-over-canopy’systems. J. New Seeds 2005, 7, 111–126. [Google Scholar] [CrossRef]
- Raich, J.W.; Russell, A.E.; Bedoya-Arrieta, R. Lignin and enhanced litter turnover in tree plantations of lowland Costa Rica. For. Ecol. Manag. 2007, 239, 128–135. [Google Scholar] [CrossRef]
- Russell, A.E.; Raich, J.W.; Valverde-Barrantes, O.J.; Fisher, R.F. Tree species effects on soil properties in experimental plantations in tropical moist forest. Soil Sci. Soc. Am. J. 2007, 71, 1389–1397. [Google Scholar] [CrossRef]
- Saha, S.K.; Nair, P.K.R.; Nair, V.D.; Kumar, B.M. Soil carbon stock in relation to plant diversity of homegardens in Kerala, India. Agrofor. Syst. 2009, 76, 53–65. [Google Scholar] [CrossRef]
- Kumar, B.M.; George, S.; Suresh, T. Fodder grass productivity and soil fertility changes under four grass+ tree associations in Kerala, India. Agrofor. Syst. 2001, 52, 91–106. [Google Scholar] [CrossRef]
- Tilman, D.; Knops, J.; Wedin, D.; Reich, P.; Ritchie, M.; Siemann, E. The influence of functional diversity and composition on ecosystem processes. Science 1997, 277, 1300–1302. [Google Scholar] [CrossRef]
- Fornara, D.; Tilman, D. Plant functional composition influences rates of soil carbon and nitrogen accumulation. J. Ecol. 2008, 96, 314–322. [Google Scholar] [CrossRef]
- Kumar, B.M.; Jose, S. Phenotypic plasticity of roots in mixed tree species agroforestry systems: Review with examples from peninsular India. Agrofor. Syst. 2018, 92, 59–69. [Google Scholar] [CrossRef]
- Jobbágy, E.G.; Jackson, R.B. The distribution of soil nutrients with depth: Global patterns and the imprint of plants. Biogeochemistry 2001, 53, 51–77. [Google Scholar] [CrossRef]
- Stahl, C.; Hérault, B.; Rossi, V.; Burban, B.; Bréchet, C.; Bonal, D. Depth of soil water uptake by tropical rainforest trees during dry periods: Does tree dimension matter? Oecologia 2013, 173, 1191–1201. [Google Scholar] [CrossRef]
- Hobbie, S.E.; Ogdahl, M.; Chorover, J.; Chadwick, O.A.; Oleksyn, J.; Zytkowiak, R.; Reich, P.B. Tree species effects on soil organic matter dynamics: The role of soil cation composition. Ecosystems 2007, 10, 999–1018. [Google Scholar] [CrossRef]
- Montagnini, F. Accumulation in above-ground biomass and soil storage of mineral nutrients in pure and mixed plantations in a humid tropical lowland. For. Ecol. Manag. 2000, 134, 257–270. [Google Scholar] [CrossRef]
- Austin, K.G.; González-Roglich, M.; Schaffer-Smith, D.; Schwantes, A.M.; Swenson, J.J. Trends in size of tropical deforestation events signal increasing dominance of industrial-scale drivers. Environ. Res. Lett. 2017, 12, 054009. [Google Scholar] [CrossRef]
- Butterfield, R.P. Promoting biodiversity: Advances in evaluating native species for reforestation. For. Ecol. Manag. 1995, 75, 111–121. [Google Scholar] [CrossRef]
- Hooper, E.; Condit, R.; Legendre, P. Responses of 20 native tree species to reforestation strategies for abandoned farmland in Panama. Ecol. Appl. 2002, 12, 1626–1641. [Google Scholar] [CrossRef]
- Dierick, D.; Hölscher, D. Species-specific tree water use characteristics in reforestation stands in the Philippines. Agric. For. Meteorol. 2009, 149, 1317–1326. [Google Scholar] [CrossRef]
- Craven, D.; Dent, D.; Braden, D.; Ashton, M.; Berlyn, G.; Hall, J. Seasonal variability of photosynthetic characteristics influences growth of eight tropical tree species at two sites with contrasting precipitation in Panama. For. Ecol. Manag. 2011, 261, 1643–1653. [Google Scholar] [CrossRef]
- Vitousek, P.; Hooper, D. Biological diversity and terrestrial ecosystem biogeochemistry. In Biodiversity and Ecosystem Function; Springer: Berlin, Germany, 1994; pp. 3–14. [Google Scholar]
- Finzi, A.C.; Van Breemen, N.; Canham, C.D. Canopy tree–Soil interactions within temperate forests: Species effects on soil carbon and nitrogen. Ecol. Appl. 1998, 8, 440–446. [Google Scholar]
- Davidson, E.A.; Janssens, I.A. Temperature sensitivity of soil carbon decomposition and feedbacks to climate change. Nature 2006, 440, 165. [Google Scholar] [CrossRef]
- Dixon, R. Agroforestry systems: Sources of sinks of greenhouse gases? Agrofor. Syst. 1995, 31, 99–116. [Google Scholar] [CrossRef]
- Corbeels, M.; Cardinael, R.; Naudin, K.; Guibert, H.; Torquebiau, E. The 4 per 1000 goal and soil carbon storage under agroforestry and conservation agriculture systems in sub-Saharan Africa. Soil Till. Res. 2019, 188, 16–26. [Google Scholar] [CrossRef] [Green Version]
- Lorenz, K.; Lal, R. Soil organic carbon sequestration in agroforestry systems. A review. Agron. Sustain. Dev. 2014, 34, 443–454. [Google Scholar] [CrossRef] [Green Version]
- Kunhamu, T.; Kumar, B.M.; Samuel, S. Does Tree Management Affect Biomass and Soil Carbon Stocks of Acacia mangium Willd. Stands in Kerala, India. In Carbon Sequestration Potential of Agroforestry Systems; Springer: Berlin, Germany, 2011; pp. 217–228. [Google Scholar]
- Guillerme, S.; Kumar, B.; Menon, A.; Hinnewinkel, C.; Maire, É.; Santhoshkumar, A. Impacts of public policies and farmer preferences on agroforestry practices in Kerala, India. Environ. Manag. 2011, 48, 351–364. [Google Scholar] [CrossRef]
- Jarecki, M.K.; Lal, R. Crop management for soil carbon sequestration. Crit. Rev. Plant Sci. 2003, 22, 471–502. [Google Scholar] [CrossRef]
- Lorenz, K.; Lal, R. Carbon dynamics and pools in major forest biomes of the world. In Carbon Sequestration in Forest Ecosystems; Springer: Berlin, Germany, 2010; pp. 159–205. [Google Scholar]
Figure 1.
Simulated C stocks in four modeling experiments. (a) Experiment 1, regarding the effect of cropping system. The five treatments either received (+) or did not receive (0) organic matter (OM) additions and irrigation. (b) Experiment 2, regarding the effect of tree species. Lignin content in modeled tree species (A–E) increased from 0.25 to 0.45 in woody tissues, 0.05 to 0.25 in leaves, and 0.18 to 0.36 in fine roots. See Table S3 for tissue lignin fractions (variables WDLIG (1–5)). (c) Experiment 3, regarding the effect of increases in air temperature above the mean annual temperature (MAT). (d) Experiment 4, regarding the effect of soil type. Soil C values were for a 0–50 cm depth.

Figure 2.
Changes in soil C in agroforestry systems in comparison with monocultures of palms and trees in Kerala. (a) Monocultures of palms (coconut and arecanut). (b) Monocultures of rubber trees. (c) Agroforestry systems. Soil (0–10 cm in depth) was sampled at two times over an 8 year period. Changes in soil C were calculated as: (Final minus Initial Soil C)/Initial Soil C.

Figure 3.
(a) Simulated changes in potential evapotranspiration (PET) and streamflow with increasing temperature. (b) Simulated changes in soil water available for crop/tree survival and streamflow with changes in soil sand fraction.
Figure 3.
(a) Simulated changes in potential evapotranspiration (PET) and streamflow with increasing temperature. (b) Simulated changes in soil water available for crop/tree survival and streamflow with changes in soil sand fraction.


Table 1.
Soil carbon (Mg ha−1) in Kerala agroforestry systems over an 8-year period.
| Cropping System | Number of Plots | Measured Soil C 1 | Modeled Soil C | |
|---|---|---|---|---|
| Time 1 | Time 2 | |||
| Monoculture: coconut, arecanut (palms) a 2 | 11 | 9.12 ± 1.21 | 10.25 ± 0.91 | No data |
| Monoculture: rubber (tree) b | 7 | 15.46 ± 2.58 | 15.19 ± 1.30 | 15.85 |
| Agroforestry System b | 21 | 14.54 ± 1.25 | 14.74 ± 0.92 | 13.83 |
1 Means (± standard error) are for a 0–10 cm depth. 2 Different letters in this column denote significant differences at α ≤ 0.05.
© 2019 by the authors. Licensee MDPI, Basel, Switzerland. This article is an open access article distributed under the terms and conditions of the Creative Commons Attribution (CC BY) license (http://creativecommons.org/licenses/by/4.0/).
Share and Cite
MDPI and ACS Style
Russell, A.E.; Kumar, B.M. Modeling Experiments for Evaluating the Effects of Trees, Increasing Temperature, and Soil Texture on Carbon Stocks in Agroforestry Systems in Kerala, India. Forests 2019, 10, 803. https://doi.org/10.3390/f10090803
AMA Style
Russell AE, Kumar BM. Modeling Experiments for Evaluating the Effects of Trees, Increasing Temperature, and Soil Texture on Carbon Stocks in Agroforestry Systems in Kerala, India. Forests. 2019; 10(9):803. https://doi.org/10.3390/f10090803
Chicago/Turabian StyleRussell, Ann E., and B. Mohan Kumar. 2019. "Modeling Experiments for Evaluating the Effects of Trees, Increasing Temperature, and Soil Texture on Carbon Stocks in Agroforestry Systems in Kerala, India" Forests 10, no. 9: 803. https://doi.org/10.3390/f10090803
Note that from the first issue of 2016, this journal uses article numbers instead of page numbers. See further details here.