Review

Non-Destructive Evaluation Techniques and What They Tell Us about Wood Property Variation

1
Department of Wood Science and Engineering, College of Forestry, Oregon State University, Corvallis, OR 97331, USA
2
Warnell School of Forestry and Natural Resources, University of Georgia, Athens, GA 30602, USA
3
School of Forestry, University of Canterbury, Christchurch, New Zealand
4
Forest Quality Pty Ltd., Huonville, Tasmania, Australia
5
Marshall Day Acoustics, Auckland 1010, New Zealand
6
Silviscan Pty Ltd., Doncaster East, Victoria, Australia
7
Scion, Rotorua 3010, New Zealand
8
INRA-Unité BioForA, Orléans, France
9
UGent-Woodlab, Laboratory of Wood Technology, Department of Environment, Faculty of Bioscience Engineering, Ghent University, B-9000 Gent, Belgium
10
Ghent University Centre for X-ray Tomography (UGCT), B-9000 Gent, Belgium
11
USDA Forest Service, Forest Products Laboratory, Madison, WI 53726, USA
*
Author to whom correspondence should be addressed.
Forests 2019, 10(9), 728; https://doi.org/10.3390/f10090728
Submission received: 19 July 2019 / Revised: 10 August 2019 / Accepted: 15 August 2019 / Published: 24 August 2019
(This article belongs to the Special Issue A Decade of Forests Open Access Publishing)

Abstract

:
To maximize utilization of our forest resources, detailed knowledge of wood property variation and the impacts this has on end-product performance is required at multiple scales (within and among trees, regionally). As many wood properties are difficult and time-consuming to measure our knowledge regarding their variation is often inadequate as is our understanding of their responses to genetic and silvicultural manipulation. The emergence of many non-destructive evaluation (NDE) methodologies offers the potential to greatly enhance our understanding of the forest resource; however, it is critical to recognize that any technique has its limitations and it is important to select the appropriate technique for a given application. In this review, we will discuss the following technologies for assessing wood properties both in the field: acoustics, Pilodyn, Resistograph and Rigidimeter and the lab: computer tomography (CT) scanning, DiscBot, near infrared (NIR) spectroscopy, radial sample acoustics and SilviScan. We will discuss these techniques, explore their utilization, and list applications that best suit each methodology. As an end goal, NDE technologies will help researchers worldwide characterize wood properties, develop accurate models for prediction, and utilize field equipment that can validate the predictions. The continued advancement of NDE technologies will also allow researchers to better understand the impact on wood properties on product performance.

1. Introduction

Non-destructive evaluation (NDE) is defined by Pellerin and Ross [1] as: “The science of identifying the physical and mechanical properties of a piece of material without altering its end-use capabilities and then using this information to make decisions regarding appropriate applications”. NDE is a critical feature of numerous industries and has a long history of ensuring product quality control and safety. Broadly speaking, industrial NDE is a carefully controlled practice involving certified specialists [2] who have received training in the proper use of various standard techniques employed to serve the needs of a diverse client base. Owing to importance of these tests, e.g., X-raying a new pipe weld to ensure quality and avoid failure, approval of a NDE testing agency is required prior to use, or to continue use.
Wood product NDE research commenced in the 1960s and was largely focused on lumber with the first wood NDE symposium held in Madison, WI in 1964 (the sequence of NDE meetings is ongoing with the 21st scheduled for September 2019 in Freiburg, Germany). Many different techniques were covered at the first symposium (densitometry/radiography, electrical capacitance and resistance, microwave, nuclear magnetic resonance, stress wave and ultrasonics). The application of some of these initial techniques, for example Metriguard’s stress wave tools for lumber and veneer stiffness (modulus of elasticity, MOE) assessment, have had commercial success.
For various reasons many of the techniques that can be applied to wood products in an industrial or research setting are unsuitable for field use. For this paper, we consider a method to be nondestructive if it is applied to either a standing tree or a felled log, or if the method is used on a radial sample and captures pith to bark measurements to quantify variation in wood properties due to cambial age. The radial sample can be cut from either an increment core [3,4] or a disc which can be obtained from the ends of logs after felling. Other techniques that require processing (grinding, microtoming) a radial strip into smaller sections followed by destructive analysis are not described in detail. We acknowledge that some of these methods are still relatively rapid in comparison to traditional methods, and thus a selection of the techniques will be discussed following a description of NDE tools.
NDE in a forestry context is considered attractive for various reasons and the following list, which is by no means complete, serves to demonstrate why the use of NDE tools has grown rapidly in the last 20–25 years:
  • Protection of investment.
  • Potential to reduce costs.
  • Potential for field-use.
  • Real-time collection of data.
  • Minimize sample collection.
  • Ease of measurement.
  • Speed of data collection.
  • Ability to identify most suitable application.
  • Ability to reduce variability within product classes.
Tools that are robust, easy to use in the field, and rapidly provide data (measurement time in minutes) have emerged on the market in response to demand from the forestry sector. Typically used for resource assessment or in tree improvement programs, these tools provide measurements of a parameter, e.g., acoustic velocity, that has been shown to relate directly to an important wood property (MOE). In parallel, lab-based NDE tools providing accurate measurements of specific wood properties have been developed complementing field-based tools. The following list contains a summary of tools commonly used to assess wood properties of trees. It should be noted that some of these tools utilize a number of different techniques to measure properties:
  • Acoustics—standing tree/log.
  • Pilodyn.
  • Resistograph.
  • Rigidimeter.
  • SilviScan.
  • Near infrared (NIR) spectroscopy.
  • Radial sample acoustics.
  • DiscBot.
  • Computer tomography (CT) scanning.
The first four are designed for use in the field. The remaining tools are all lab-based, while near infrared (NIR) spectroscopy has potential for field-use. Field tools provide predictions of density (Pilodyn, Resistograph) and MOE (acoustics, Rigidimeter), owing to the importance of these wood properties in determining end-product performance. NIR spectroscopy can be used to estimate a number of different properties provided a suitable calibration exists, while SilviScan and DiscBot utilize a number of different measurement methods to determine multiple properties. It is important to recognize that the use of some NDE tools is presently quite advanced, while for others development and application related research is ongoing.
Owing to the wide range of NDE options available and reasons for forest sampling, it can be difficult to determine which approach to employ for a given project. In this review we seek to draw together the diverse opinions of several experts to identify forestry related applications where a technique is particularly well or uniquely suited, and how to best apply the methodology. For consistency, the following list of objectives, directly relevant to forest practices such as tree improvement, and forest and silvicultural management, was selected. While not complete, it largely encompasses the various uses to which NDE has been applied, including:
  • Screening families and clones.
  • Estimation of genetic parameters.
  • Correlation with genetic markers.
  • Forest inventory.
  • Monitoring silvicultural and environmental effects.
  • Within-tree variation.
  • Correlation with product properties.
  • Dendrochronology.

2. Forest Sampling

An important component of wood and fiber quality analysis, whether by NDE tool or traditional method, is the sampling efforts themselves, however little attention has been given in the literature to sampling strategies specific to wood and fiber quality. Arguably, the most comprehensive text is Downes et al. [5] focused on sampling eucalypts. Typically, forest sampling is a trade-off between capturing enough information to accurately quantify the mean and variability in a particular wood property while balancing the costs associated with the sampling and subsequent analysis. Raymond [6] found in radiata pine (Pinus radiata D. Don) grown in New Zealand that sampling more than 10 trees per stand resulted in marginally smaller standard errors for the mean estimate for a stand. Jordan et al. [7], working with loblolly pine (Pinus taeda L.), recommended sampling 10–15 trees/site, and concluded that to capture the mean value with an acceptable standard error for a physiographic region, emphasis should be placed on sampling more sites within a region, rather than more trees within an individual site. Typically, plots are established with diameters being taken for each tree in the plot, and from a subset of trees the heights are measured. The form for each tree is evaluated to determine the potential of the trees to make specific products (e.g., sawtimber or pulp). After collecting diameter information and evaluating tree form, selection of sample trees for wood property analysis typically occurs across the diameter distribution with most studies focusing on defect free trees to minimize the probability of sampling trees with high incidence of reaction wood [8,9]. These recommendations are targeted towards quantifying regional variation and thus capturing the variability of the environmental impacts on wood properties across a growing region, but other objectives likely require different sampling strategies. For example, when attempting to determine silvicultural treatment effects, sampling more trees per treatment would likely be appropriate than the recommended 10–15 trees/site to have enough statistical power to determine significant differences. If the intent is to quantify the wood properties for an individual stand to determine end product value or suitability of a particular stand to make a particular product, then sampling both defect-free and defect-containing trees is likely appropriate. Modeling efforts have typically excluded samples with compression wood as radial patterns are very different from normal wood [10]. Modeling the formation of compression wood by silvicultural treatment has been given little attention in the literature but is an important area of investigation. Measurement error should also influence sampling strategies, whereby instruments with larger measurement errors should be offset with additional sample collection. For genetic assessment of very young trees, inducing reaction wood formation by tilting trees has been employed in order to be certain of the wood type (compression or tension wood, opposite wood) being measured, because young stems rarely grow straight [11,12,13,14].
Collecting cores from trees requires care to ensure that the core contains the pith, as well as having the grain run perpendicular to the length of the core. Typically, cores are collected from bark-to-bark, but for large trees cores can be collected from pith-to-bark with a section of the wood past the pith sampled to prevent core breakage at the pith. As wood is an orthotropic material attention to grain orientation at all times is critical, for example, not having the grain run perpendicular to the length of the core will result in erroneous readings for some instruments. For example, X-ray densitometry systems that do not utilize image-based camera detectors will sample both earlywood (EW) and latewood (LW) during EW to LW and LW to EW transition periods when the grain does not run perpendicular, which will interfere with the measurement of each ring component. For radial ultrasonic systems, velocity readings will decrease as grain becomes less perpendicular because longitudinal velocity (3000 to 6000 m s−1) is much greater than either radial or tangential velocity (1000 to 1700 m s−1) [15]. Cores that do not contain the pith results in challenges associated with reconstructing growth rings. Dendrochronology studies will estimate the pith location based on the ring curvature using either a ruler or in software [16,17]. Additionally, growth rings should be straight across the sample, but this is difficult even in a “perfect” sample due to curvature in the growth rings near the pith. The SilviScan system was designed to minimize ring curvature problems by rotating the sample at each measurement point. Note that sample rotation does not fix longitudinal grain deviation errors. Following the collection of cores from standing trees, recommended best practice is to leave the hole in the tree unplugged, thus allowing the tree to heal itself rather than introducing a foreign object or chemical into the tree [4,18].

3. Sample Preparation

Most instruments that capture radial variation require careful sample preparation. Following collection, samples should either be immediately dried to ambient moisture content conditions using a gentle drying schedule, or frozen to prevent stain by fungi. The wood of some tree species such as eucalypts is very susceptible to checking and thus for certain analyses samples should be soaked in ethanol which prevents the collapse of cells during drying by having the ethanol substitute with the water in the wood [5].
Processing dried samples into radial strips from cores or disk samples is usually done by gluing samples onto holders on either one or two sides, and then passing the sample through a twin-blade saw. As pith-to-bark samples are fragile, particularly those obtained from 5 mm cores, gluing samples in holders helps to avoid breakages. When preparing samples for densitometry, the saw blades are commonly spaced 2 mm apart. The face exposed is a function of the instrument and user preference. For example, if capturing only X-ray densitometry information from the sample, the transverse face is typically exposed. SilviScan (see latter section for a more detailed description of this instrument) will expose the radial face to the densitometry beam to enable the same sample to be used for X-ray diffraction, with the top (cross section) of the sample being used for image analysis. SilviScan samples have dimensions of 2 mm in the tangential direction and 7 mm in the longitudinal direction enabling imaging on the transverse face of the sample and calibration of the X-ray densitometery measurements with the gravimetric density of the sample. Making multiple measurements on the same samples offers significant advantages (SilviScan), although this is not always possible for all laboratories given instrument limitations or measurement techniques. For example, assessing acoustic velocity in samples requires a taller sample than a typical 2 mm tall densitometer sample. The University of Georgia wood and fiber quality lab uses a quad-blade saw to cut book matched samples from disks for radial assessment of acoustic velocity, X-ray densitometry, and tracheid properties. The setup requires a relatively tall longitudinal sample (approximately 25 mm) and thus cores cannot be processed this way. The Scion DiscBot system was designed to capture all measurements on the same disc and thus offers the distinct advantage of capturing both radial and circumferential variation in wood properties. With all systems that employ saws it is critical that the saw blades be sharp as any tear out will have a large impact on the accuracy of the densitometry readings and will affect the surface coupling between the transducers and the sample when measuring ultrasonic velocity.
To eliminate the effects of extractives on wood density measurements, removal is typically done using some type of Soxhlet extraction system or through repeated soakings with the solvent being exchanged periodically [19]. The choice of chemical selected for extraction is dependent on the type of extractives present, acetone is effective at removing resinous extractives [19]. The Larix genus being a notable example where hot water extraction at 60 °C is recommended due to the nature of extractives present in the wood [20]. Removal of extractives can occur before or after machining. If the quantity of extractives is of interest, for example via NIR spectroscopy, then the samples can be scanned prior to extraction to estimate the extractives content. Figure 1 shows a densitometer sample before and after extraction.

4. The Role of NDE in Tree Breeding

Tree breeding is one of the tools used by plantation growers to maximize profitability, shifting the mean of multiple traits to increase the quantity and quality of wood products. At its core, breeding uses a cycle of selecting superior trees, testing superiority, mating among superior trees, and deploying superior genetic material [21]. Wood properties are generally more heritable than growth properties [22,23]; however, growth and form properties have been the focus of selection due to the cost of measuring wood properties. Various NDE tools are being used in breeding programs globally (Table 1) to achieve improvements in key wood properties, consistent with the objectives listed earlier, these include screening, genetic parameter estimation and biotechnology.
Running a breeding cycle requires an understanding of both within- and among-tree variability for each of the traits that the breeding program is targeting, and the genetic correlations among the traits of interest. Moreover, breeders need to partition the observed variability into genetic and environmental components, to base selection on genetic superiority. While estimating a population mean for genetic trials is possible with a few dozen individuals, good estimates of the genetic structure may need hundreds of samples (for heritability), while needing many hundreds or thousands of samples to estimate genetic correlations between traits.
Tree breeders prefer non-destructive assessments, because (i) destructive techniques are often slow and expensive, making it impossible to collect the desired number of samples in time and in budget, and (ii) once the best trees are identified they need to be alive for crossing and/or propagation. Another constraint is that breeders like to assess trees as early as possible, often between 1/4 and 1/3 of rotation age. It is possible to detect differences in the wood properties among genotypes even earlier, with screening reported as early as eight months of age, e.g., [11]. Assessing wood properties in seedlings requires novel modifications of standardized techniques, such is shown in acoustic velocity assessment [24,25]. Gonçalves et al. [26] tracked growth and wood properties from three months to six years to estimate the future quality of clones.
Two key considerations when breeding trees are (1) the presence of radial profiles and (2) the type of trait: maximization (as tree volume) or threshold (MOE grades). Very early screening of maximization traits is extremely difficult, but when dealing with thresholds we can reframe the selection process as first pass the bar, e.g., [27], which is much easier to achieve.

Genomics

The use of DNA markers promises to lower selection age even more, reducing the need for continuous phenotypic assessment, including wood properties [28,29]. In general terms, phenotypic data are used to predict genetic values [30], which are deregressed [31], and then a variant of the method proposed by Meuwissen et al. [32] is used to build a linear predictive model of genetic performance based on DNA markers. Furthermore, long-term use of genomics requires recalibrating the prediction equations after a few cycles of selection, which will, again, need a substantial number of phenotypic assessments for newer material in the breeding program [33].
However, this approach still needs relatively large datasets for building the statistical models, a task for which NDE is well-placed. For example, when building genomic selection models, Resende et al. [34] used Pilodyn to predict wood specific gravity and NIR to predict pulp yield from increment cores for 920 trees. Cappa et al. [35] assessed 303 trees with Pilodyn to predict density and NIR to predict lignin content, syringyl:guaiacyl (S:G) ratio, and extractives content. More recently, Beaulieu et al. [36] used SilviScan on 1694 trees to assess 11 wood properties.

5. Standing Tree or Log NDE

5.1. Acoustics

The concept of using acoustic wave velocity (AV) as a measure of wood quality has been widely recognized in both wood manufacturing and forestry sectors. A variety of acoustic measurement tools have been developed and applied to various wood products (e.g., lumber, veneer, laminated veneer lumber (LVL), glulam beams) and raw wood materials (logs and standing trees) for quality evaluation. The development of standing tree acoustic tools has opened the way for assessing wood properties on standing trees before harvest, enabling management, planning, harvesting, and wood processing to be carried out in a way that maximizes extracted value from the resource [37,38,39]. Perhaps the largest widespread use of assessing acoustic velocity of standing trees is via tree improvement programs who have adopted AV tools for the assessment of breeding trials [27,40,41,42,43].
AV has been used to predict MOE, generally referred to as dynamic MOE via:
M O E d y n =   ρ A V 2
where MOEdyn is dynamic MOE, ρ is the density and AV is the acoustic velocity. For standing trees the AV is assessed by measuring the time of flight (TOF) of acoustic waves between two measuring points (typically centered around breast height). The two sensor probes (transmit probe and receiver probe) have frequencies of 1–2 kHz and the acoustic energy is generated in the tree through a hammer impact. Figure 2 shows the use of a portable TOF acoustic tool for measuring AV in standing trees. An alternative acoustic approach (resonance) is typically used for logs, hence measurement principles for standing trees and logs are different. TOF only measures the outerwood of a tree to a depth of 20–30 mm over a distance of approximately 1 to 1.2 m (determined by the distance between measurement points) [37,44], while resonance measurements are representative of a whole log and considered more accurate than TOF tools [45]. Relationships derived between the two sets of measurements are biased and require adjustment to allow direct comparison [46]. Ignoring the bias there is a good relationship between tree and log AV [37,46,47,48,49,50]; although it has also been observed that the relationship between the two sets of measurements weakens in older stands, presumably because outerwood properties become more consistent in older trees.
The density term in the MOEdyn equation is generally assumed to be constant when assessing standing trees and logs, although measuring the actual green density can improve the accuracy of the acoustic velocity models if relating to static properties is of interest [51,52,53]. Measuring the basic density is not a suitable technique for improving the accuracy of the MOEdyn equation [53] because AV changes with moisture content [54,55]. AV increases rapidly with decreasing moisture content below the fiber saturation point. Above the fiber saturation point AV will decrease with increasing moisture content but at a slower rate than below the fiber saturation point [54,55].
Many studies have demonstrated good relationships between tree or log AV and MOE of small defect-free wood specimens [56], and moderate relationships between tree or log AV and MOE of structural products [47,49,50,53,57,58,59,60]. For example, Ikeda and Arima [47] reported significant correlations between tree AV and MOE of logs and square sawn timbers in sugi (Cryptomeria japonica D. Don), while Huang [57] demonstrated that loblolly pine trees with potential to produce high and low stiffness lumber can be identified by tree AV alone. Hence, with simple velocity measurements, individual trees and stands can be evaluated and sorted for their potential to provide structural quality lumber, and hence better evaluate stumpage values of standing timber [37]. Moore et al. [58], working with Sitka spruce (Picea sitchensis (Bong.) Carr.), and Butler et al. [53], working with loblolly pine, set threshold values of AV measured from logs to correspond with thresholds of MOE of lumber cut from logs. Attempts to use standing tree AV measurements to assess fiber attributes (measured using SilviScan) and pulp yield have provided mixed results [61,62].
Studies have been conducted to investigate how silvicultural practices affect AV of trees in a stand, information that is important to managers wishing to make informed decisions to enhance stiffness of harvested material and better determine the value of plantations [60,63,64,65,66,67]. Standing tree acoustic tools were found to be practical on a large-scale for stand level comparisons of wood and fiber properties and for assessment of thinning impacts [66,68].
In response to demands from the forestry and forest products industries for a field tool capable of assessing wood quality, extensive research with many species has demonstrated the use of TOF acoustic tools for predicting stiffness in standing trees. Globally acoustic technology is increasingly being implemented in forest and wood processing operations, especially when end-product value is directly associated with wood properties (e.g., high stiffness).

5.2. Pilodyn

The Pilodyn is a portable tool for assessing density in standing trees. As noted by Cown [69], “originally developed in Switzerland to obtain quantitative data on the degree of soft rot in wooden poles”. Its use involves the injection of a striker pin (spring-loaded) into wood with a known force. A scale on the surface of the instrument (Figure 3) provides a measure of pin penetration [69]. Pin penetration depth is negatively correlated with wood density. Three different striker pins (2.0, 2.5, and 3.0 mm diameter) allows Pilodyn use to be adapted to the density of the wood being tested [70]. As summarized by Gao et al. [70] r-values ranging from −0.81 to −0.90 have been reported for various softwood species including eastern white pine (Pinus strobus L.); European larch (Larix decidua Mill.), loblolly pine, Norway spruce (Picea abies (L.) H. Karst.), radiata pine, western red cedar (Thuja plicata Donn ex D. Don), and white spruce (Picea glauca (Moench) Voss).
Pilodyn penetration has a strong genetic correlation with wood specific gravity (SG) as reported for various species including loblolly pine [71], slash pine (Pinus elliottii Engelm.) [72], Douglas-fir (Pseudotsuga menziesii (Mirb.) Franco) [73], and Eucalyptus [74,75,76,77] and it has been used as an indirect measure of density in tree improvement programs. As a small area of bark needs to be removed prior to testing, its application has been limited to young trees where this can be easily achieved [78], as opposed to older trees with thicker bark. In practice, accuracy of the Pilodyn is somewhat limited [69] and thus it is commonly used to estimate family average values, but it is considered unreliable for individual tree selection in breeding programs [79].
Pilodyn testing is one of the least invasive sampling techniques, however, the wood being evaluated in Pilodyn testing is only the outmost rings and thus is not representative of the stem’s mean density. It is also assumed that the wood being tested is above the fiber saturation point (FSP) as pin penetration decreases as moisture content decreases below the FSP (approximately 30% for most species) [80].

5.3. Resistograph

The development of the Resistograph began in the early 1990s [81]. Early uses of the instrument have been in qualitative studies to identify decay and other defects in trees and poles [82]. Previous work with earlier instruments indicated that its ability to quantify density variation was limited [83] but still useful for breeding purposes [84,85,86]. Recent improvements in the instrument have resulted in generally higher correlations than previous instruments, and thus more widespread adoption for correlation with wood density. Gao et al. [70] concluded that, compared with other technologies (Pilodyn, torsiometer, nail withdrawal) the Resistograph was a lower cost and more rapid means of collecting wood density data. Over the past four years the IML PD400 (Resi) has been assessed in Australia and New Zealand as a means of quantifying basic density in individual standing plantation (eucalypt and pine) trees [87], and has become the operational assessment tool for wood density in the New Zealand and Australia radiata pine breeding programs.
The instrument drives a 3 mm diameter needle through a tree at a set forward speed (feed speed) and rotation rate (rpm) and measures the resistance to turning (torque) producing a radial trace (Figure 4) at a sampling interval of 0.1 mm. The key features of this tool are its low cost in field application, digital data capture and the relatively high-resolution data. A 400 mm long trace can be taken from a single tree in less than 20 s, with tests conservatively showing that 50 to 120 trees per hour can be sampled, depending on terrain, ground cover and the need for defining individual tree identifiers on the instrument interface.
The trace represents a profile of resistance every 0.1 mm and the radial variation in wood density [70,81,88]. Typically, this level of detail is more than commercial users require. As an NDE assessment they are primarily seeking a single value of wood density as a site or population average, with possibly some measure of variance among trees. To facilitate this need, software applications have been developed that allow the user to generate required values with minimal time and expertise. Web-based processing platforms (Figure 5) allow users to process Resi traces and download required values, in the process producing additional metrics such as diameter at breast height (DBH) and bark thickness (Figure 5).
Initial resource characterization in radiata pine across the Murray Valley in Australia indicated that site average values of density predicted from the Resi explained over 80% of the variance in site average density obtained from 50 mm outerwood cores collected the previous year [88]. Subsequent work has demonstrated its ability to provide an accurate measure of wood density across a range of eucalypt plantations within Australia [87] with phenotypic correlations explaining better than 80% of the variance. Other work in radiata pine and eucalypts has further demonstrated similarly strong relationships in multiple studies across Australia and New Zealand. The strongest relationships are obtained when Resi traces and validation core samples are taken as spatially close together as possible.
The Resi has demonstrated sufficient commercial value to warrant its operational use by many forest growers, particularly as contracts for log supply between growers and processors increasingly include wood quality metrics that provide an incentive to growers to improve wood quality. However, there are still research questions that need to be addressed to improve the application and support of the technology. Many of these questions have been addressed to some extent in recent years, e.g., [89]. While the questions are valid and need addressing, they should not preclude the use of the technology for wood density NDE. Commercial uptake will be an incentive for ongoing refinement of the application. The following questions are not intended to be an exhaustive list, nor a complete review of the work done in these areas.

Issues Related to Resistance Drilling

The Resi traces shown in Figure 4 and Figure 5 are full diameters and part diameters respectively. The trace in Figure 4 shows the flat line at the end (right hand side) where the needle has emerged from the opposite side of the tree. The presence of this flat line can be used by processing software to automatically categorize a trace into full and partial diameters. The resistance value of the flat line is typically greater than zero because of needle drag. This drag can vary significantly between trees, but if quantified can be corrected using a linear baseline correction. This raises the question of whether the drag effect is linear across the diameter? In contrast, trace-specific drag cannot be quantified in an incomplete diameter trace. Drag has been shown to be primarily driven by diameter and density variation and a generic correction has been defined and implemented in the web-platform.
The Resi also allows the forward resistance of the needle to be recorded as well as torque. The effect of needle drag on this measure is much less [90], and the effectiveness of this measure for predicting wood density requires a more thorough analysis. Initial studies have suggested it explains slightly less variance in wood density than turning resistance (Downes, in preparation), and operationalizing the technology has focused on the latter.
The effect of wear on the needle over repeated drillings has been assessed in several studies, e.g., [89,91] and ongoing monitoring is warranted in quantifying the effects across species. The Resi needle is very flexible and does not always follow a straight path across the diameter. Under some conditions, curvature can be severe and seems to interact with the slope of grain. If the trace is taken with a marked angle down, then the needle tends to curve to the right, while the needle tends to curve to the left with a marked angle up. Some degree of curvature can be assessed in full diameter traces, observing the exit point, whereas in partial diameter traces this is unknown.
As more commercial users employ the technology the degree to which instrument specific coefficients to convert resistance values to wood density are required warrants more systematic assessment, especially when multiple instruments are used within the same operation. Downes et al. [87] compared several different instruments used on different sample sets and the different relationships with basic density that resulted. These coefficients indicated that the relationship was consistently linear (at least at the level of variance observed) but could be affected by species, range of actual wood density in the population (seasonal variance was not accounted for).
There is enough evidence to demonstrate the effect of moisture on the resistance values comparing dry timber with green but quantifying the effects in standing trees, especially with respect to heartwood and sapwood, warrants further study [89,92,93].
Given the above sources of variance, the degree to which the same relationships between resistance units and basic density remain constant across species is yet to be established.
The ability to process the Resi trace to extract other wood properties warrants investigation [94]. Likewise, the potential to extract annual ring widths and growth trajectories in plantation inventory has obvious value. Its use in conjunction with growth and wood property models such as eCambium [95] is a current area of investigation.

5.4. Rigidimeter

The Rigidimeter was designed to evaluate MOE directly from standing trees [96]. It was inspired by Koizumi and Ueda’s [97,98] tree bending equipment, itself inspired by previous work, e.g., [99] and related to the work of Langbour [100] and Milne and Blackburn [101] who used cables to pull trunks to evaluate lengthwise bending rigidity of standing trees. The Rigidimeter benefited from several progressive improvements concerning both its handling and reliability [102]. The Rigidimeter is made up of two independent units: the first one is the trunk-bending mechanism and the second measures the resulting deflection (Figure 6).
The device is fastened onto the trunk with connections to the tree stem secured using two wide steel contacts located on both ends of the gantry. The trunk is bent (within the elastic region of the stress–strain curve) by applying pressure generated by a foot-operated hydraulic pump via hydraulic jacks at two points. A digital load cell with accuracy of 10 N directly measures the pressure. The mean deflection of the trunk is then measured 1.3 m above the ground level by the second unit with an accuracy of 10 μm in response to the load applied to the stem [103].
Within a given plane of a tree, repeated measurements of bending with the Rigidimeter showed excellent repeatability (r = 0.99) [96] but measurements in two orthogonal directions are recommended to improve accuracy especially in the presence of reaction wood [102]. As the calculation of MOE includes tree diameter raised to the power of four, particular care to measure over bark diameters with a precision of 1 mm is required [102]. Validation testing has compared standing tree MOE with boards or small defect-free specimens measured using standard methods. At the tree level, Pearson correlation coefficients for several conifers were moderate to high (0.48–0.90) [96,97,103], and all authors found high correlations at the genotype (clone, full-sib families) mean level (0.74–0.86).
The Rigidimeter is particularly well-suited for ranking genotypes [96,98,103,104,105]. Rigidimeter MOE values showed large phenotypic and genetic variability (in contrast to some other wood traits like density), moderate to high levels of heritability and low genetic by environment (GxE) interaction [106,107]. In a study in New Zealand (unpublished), trunk MOE measured with the Rigidimeter on standing radiata pine trees was found to be genetically variable and significantly correlated with acoustic velocity and stem knottiness index. Perspectives for genetic improvement of wood stiffness using the Rigidimeter have been clearly demonstrated in hybrid larch [107].
The Rigidimeter weighs approximately 18 kg and is easily handled (e.g., quickly tied to a tree, rapid loading) and it has been designed for deployment in adverse weather conditions, provided the trees are not frozen. Seasonal effects on stiffness estimation on standing trees were limited [108]. It is well-suited to estimate stiffness of trees with a BH diameter in the range 10 cm to 20 cm. Over 50 trees per day can be assessed by a team of two provided trees have been previously pruned up to 2 m from the ground.
While the Rigidimeter is not a high-throughput phenotyping tool, it has found its place in tree breeding programs in the last steps of the selection process when most trees in genetic trials have been discarded based on other selection criteria such as growth and form. For example, the Rigidimeter is particularly suitable for assessing the stiffness of a few hundred trees before the final selection. The genetic gain efficiency proved to be then higher than indirectly selecting on density [103]. In our experimental conditions, this would preferentially occur when trees are between 15- and 20-years-old.
More detailed study of stiffness changes in the trunk with age is possible through repeated measurements of the same standing trees with the Rigidimeter. For example, measurements made on corewood (juvenile wood) and later on outerwood (mature wood) can be used to separately estimate MOE’s of corewood and outerwood, provided the trees have DBH’s in the 100 to 200 mm range [102]. Other uses of the Rigidimeter in plantations have been suggested, such as the study of factors such as wind on stem asymmetry and reaction wood [102].

5.5. Near Infrared (NIR) Spectroscopy

This NDE technique utilizes spectra measured in the NIR region of the electromagnetic spectrum. Wavelengths measured, and their resolution, vary by instrument but the most useful region for qualitative analysis by NIR reflectance is 1200 to 2500 nm (8333–4000 cm−1). NIR spectra largely consist of overtone and combination bands of fundamental stretching vibrations of O–H, N–H and C–H functional groups observed in the mid-infrared region. All wood components (cellulose, extractives, hemicellulose, and lignin) possess these groups, hence any wood property changes can be observed in measured spectra; however, the presence of multiple overlapping overtone and combination bands makes interpretation of wood spectra problematic. Analysis of wood by the technique relies on the development of a multivariate model using a characterized set of samples and NIR spectra collected from the surface of these samples (either solid or milled wood) and using the model to predict properties for a set of uncharacterized samples. NIR spectroscopy is a highly sensitive technique hence the adoption of strict operating practices to ensure consistency of all aspects of its application and to minimize variation is strongly advised. Sandak et al. [109] provide many practical recommendations for the successful application of this technique.
The earliest NDE applications of NIR spectroscopy were in agriculture where it was utilized to determine the moisture, crude protein, and oil concentrations in cereal grains and oil-bearing seeds [110], while it was not until the late 1980s that potential wood-related applications were reported [111,112]. Of primary interest were properties directly related to the economics of the pulp and paper industry, particularly pulp yield, which is expensive and time-consuming to measure using standard methods. Since this time there has been rapid growth in NIR–wood related research [113] with a broad range of wood properties and products examined. However, the earliest studies, which predominately focused on wood chemistry, highlighted the greatest strength of this technique, and one that no other NDE method possesses, and that is the ability to estimate wood chemistry, or properties directly related to chemistry such as pulp yield.
NDE evaluation of standing trees can potentially be achieved using spectra collected on-site or in the lab based on spectra collected from a milled increment core. Utilizing milled increment cores to estimate whole-tree properties has been the most common approach. It has been demonstrated that spectra from milled breast height cores can provide good calibrations for estimating whole-tree properties [114,115] and this approach has been adopted by several forest industry companies to assess progeny in their breeding programs [116]. The first option is the most desirable; however, seasonal variation in pulp yield at the cambial surface (the surface from which a spectrum is collected with a portable spectrometer) has proved too variable to produce consistent calibration performance [117,118,119]. In related research, Muneri et al. [120] compared estimates of pulp yield obtained using NIR spectra collected directly from standing trees using a portable NIR instrument and with those obtained from milled increment cores on a lab-based spectrometer. They concluded that the lab-based measurements provided better results. NIR predicted wood properties based on spectra from milled increment cores have also been used for resource assessment. Arauco (Chile) have developed models for pulp yield, basic density, and specific consumption (wood required per unit of pulp) for at least 30,000 ha of their plantation estate [116] while Giroud et al. [121] examined regional variation in density and MOE for several boreal species in Quebec, Canada.

6. NDE on Radial Samples

6.1. SilviScan

SilviScan is a linked system of instruments and software for the rapid, automated analysis of the structure and properties of wood in small samples cut from increment cores. Other samples, including samples from discs, can be used if prepared appropriately (Figure 7). The system is designed to take into account many of the uncontrolled natural variations in wood, such as non-concentric annual rings, spiral grain, and diving grain. In addition, SilviScan accommodates less than perfect sampling and sample preparation.
The main components of SilviScan (Figure 8) are:
  • Optical Cell Scanner (radial and tangential tracheid and fiber diameters, vessel size and position, ring boundary position, ring orientation);
  • X-ray Densitometer (conditioned density profile, fiber tilt, ring boundary position);
  • X-ray Diffractometer (microfibril angle (MFA), tracheid and fiber 3D orientation, cellulose crystallite width).
From these primary measurements, many other properties (coarseness, wall thickness, specific surface area, MOE, modulus of rupture, longitudinal shrinkage, paper sheet density, growth rate, EW/LW ratio, compression wood, tension wood) may be estimated, depending on the sample type. NIR spectroscopy was intended as a fourth component but this was only partially implemented/integrated and continues to be a topic of investigation. Measured data are exported both as radial profiles at 25-micron intervals and as tables of annual ring widths and statistical properties (mean, median, percentiles, and standard deviation) for each wood characteristic.

6.1.1. SilviScan Operation

Radial wood sections are cut to the dimensions 2 mm × 7 mm (tangential × longitudinal), extracted with acetone if necessary (softwoods only), reconditioned at 40% relative humidity and 20 °C, resulting in a moisture content of about 7%. If preventive measures are not taken, blue stain fungus in some softwoods can be a problem because the melanin produced by the fungus has very high absorbance over the range of wavelengths used for imaging. To correct this after staining has occurred, mild hydrogen peroxide bleaching can be an effective treatment. One transverse face is polished using sandpaper with grit sizes 240, 400, and sometimes 1200 or 1500 for woods with very thin cell walls. The systems in Vancouver and Stockholm have automatic polishing systems. In Melbourne, the polishing was automated for many years but is currently done by hand.

6.1.2. Image Analysis

For the determination of tracheid diameter, samples are placed on a linear motor, above which is mounted a software-controlled autofocus microscope with a charge-coupled device (CCD) camera from which contiguous 1392 × 1040 pixel × 16-bit images are obtained (2048 × 2028 pixels in Melbourne since 2015). The pixel size is 1.29 μm if a 5× objective is fitted, and 0.65 μm for a 10× objective. Illumination of the samples is by long wavelength light-emitting diodes (typically in the range 650–880 nm) directed to the sides of the sample below the surface. The light is scattered within the sample and conducted along the cell walls, emerging at the polished cell wall cross-sections. The lumens remain relatively dark, as they are blocked by sanding dust (Figure 9). Custom software stitches the images together, binarises them, and measures the radial and tangential tracheid diameters in 25 μm intervals from pith to bark, parallel to the ring boundaries.

6.1.3. Densitometry

Radial density profiles are determined by calibrated imaging X-ray densitometry (see Figure 10 for an image of a spruce sample) using a copper fine-focus X-ray tube in point focus orientation. The source is placed far from the sample to optimize the spatial resolution. The sample is placed on a linear motor mounted on a turntable to allow the automated alignment of the annual rings with the X-ray beam (20 mA, 35 kV, nickel filtered). Depending on the rate of change of ring angle, the X-ray camera (1392 × 1040 pixels) records up to 7 mm of radial density profile per step, at a pixel size of about 6 μm. Intensity is converted to density (ρ) using a modified form of the Lambert–Beer law, allowing for residual polychromaticity of the X-ray beam:
ρ = 1 µ m t ln I 0 I
where µm is X-ray mass attenuation coefficient, t is sample thickness in the direction of the X-ray beam, I0 is the incident X-ray intensity and I is the transmitted intensity. SilviScan is calibrated to take into account the effect of X-ray polychromaticity on the mass attenuation coefficient. The density profiles are mapped onto the same 25 μm interval scale as the image data for the calculation of cell wall thickness, coarseness, and specific surface area.

6.1.4. Diffractometry

The measurement of MFA is based on X-ray transmission diffractometry using a copper fine‑focus X-ray tube in point focus orientation. The nickel-filtered beam (20 mA, 35 kV) is focused to 200 μm at the sample using a parabolic capillary. An intensified CCD camera with a tapered glass fiber optic coated with a thin X-ray sensitive phosphor and bonded to a 1392 × 1040 pixel CCD (the same type as that on the densitometer), is used to image the diffraction patterns (Figure 11). The X-ray pencil beam is directed parallel to the annual rings, automatically controlled by the information from the image analyzer. MFA is calculated from [122]:
M F A 2 = 2 ( S 2 σ 2 )
where S is the resolution-adjusted standard deviation of the azimuthal profile of the 002 diffraction peaks and σ is the local standard deviation of microfibril orientation.
MFA represents only the crystalline cellulose of the S2 secondary wall layer. Non-cellulosic polysaccharides and lignin, the relatively unoriented primary wall, the secondary walls S1 and S3, and parenchyma cells contribute to the base line. MFA is corrected for broadening caused by tracheid tilt in the X-ray beam. The MFA radial profile is determined over intervals chosen in the range 0.1–5 mm and then placed on the same 25 μm interval scale as the other profiles.

6.1.5. Image Analysis

Average tracheid wall thickness w is derived from the primary results of image analysis and X-ray densitometry:
8 w P = 1 1 16 A ρ P 2 ρ w
where P is tracheid perimeter, A is area per tracheid, ρ is wood density, and ρw is tracheid wall density (~1500 kg m−3). The middle lamella is included, and other softwood cell types are ignored. In order to perform this calculation, the image and density profiles are accurately aligned by cross-correlation of all common features. Relationships such as this have been used for more than half a century, e.g., [123]. Application to fibers in hardwoods is more complex, as it requires correction for other cell types—particularly vessels.

6.1.6. Elastic Modulus

The longitudinal MOE of wood is calculated from the densitometric and diffractometric data according to the relationship [124]:
M O E c . I c v a . D b M O E ~ a ( I c v D ) b
where MOE is longitudinal modulus of elasticity, Icv is the coefficient of variation of the intensity of the 002 azimuthal diffraction profile, D is wood density, and a and b are instrumental calibration constants. The SilviScan results are consistent with empirically collected elastic moduli from sonic resonance methods (standard error ~1 GPa).

6.1.7. SilviScan Evolution

1988–1993: SilviScan-1

SilviScan-1 (Figure 12) was the initial prototype. It incorporated transmitted light imaging, stitching of sequential data to form full radial profiles of properties, conventional X-ray absorption densitometry using a scintillation detector, and conventional X-ray diffractometry of small sections of samples. Evans found in 1989 that the transverse surface of thick sections of polished wood could be imaged in transmission using a tungsten light source. It was clear that only longer wavelengths were being transmitted, so the cost and complexity of the system was greatly improved by using long wavelength diodes. The samples could be illuminated either in line with the microscope optics or from the side. In either case the light traveled along the fiber walls and gave images with high contrast, suitable for automated image analysis.

1993–2001: SilviScan-2

SilviScan-2 (Figure 13) was the second prototype, specializing in the image analysis of hardwoods such as eucalypts. The pixel size was less than 0.9 μm. This system continued the all-in-one design concept, using a single transport system and one X-ray source for both densitometry and diffractometry. SilviScan-2 was the first instrument to demonstrate the estimation of MFA using a 2D detector, which enabled high throughput radial measurement of MFA on samples. The X-ray source was a copper rotating anode type with a 100 μm target. A glass capillary focused the X-ray beam to 200 μm at the sample and two different cameras were used to capture diffractometric and densitometric information.

2001–Present: SilviScan-3

SilviScan-3 (Figure 14) is the current incarnation designed for greater efficiency and lower maintenance costs. This system is installed in Australia (University of Melbourne, Burnley), Sweden (Innventia, Stockholm), and Canada (FP Innovations, Vancouver). The functions of optical image analysis, densitometry, and diffractometry are separated and run independently, thereby greatly increasing analysis speed. The Cell Scanner has interchangeable lenses and diode lighting systems allowing the use of a wide range of resolutions and illumination wavelengths. The image pixel size can be 0.65 μm, 1.3 μm or 1.6 μm, depending on the objective lens (10×, 5×, 4×). Both transmitted and reflected light images are obtained on each sample run. SilviScan-3 uses 880 nm diodes for transmitted light imaging. Reflected light imaging has been performed using a wide range of wavelengths. The system currently uses 450 nm (blue) but green, red, and infrared have all been employed over the last 25 years. It would be possible to use readily available UV diodes in SilviScan’s illumination system for reflected light imaging and fluorescence studies, given the appropriate optics and camera. When lighting systems are changed, SilviScan corrects for residual chromatic aberration and its effect on magnification and focal plane position.
Both the software and hardware in SilviScan have been designed to follow technological and scientific advances. This has allowed us to take advantage of huge increases in computer power, to follow the development of cameras and of light-emitting diode (LED) lighting. In addition, as operating systems, drivers, and other third-party software evolve, SilviScan has been adapted. Except for a few fundamental principles, SilviScan-3 bears very little resemblance to SilviScan-1.

6.1.8. SilviScan Applications

Some of the ways in which wood property information is used are discussed briefly below. The reference list is far from exhaustive; there are many others, including conference papers, confidential reports and works-in-progress. Some references belong in more than one category, but have been listed only once.

Silvicultural and Environmental Effects on Wood, Including Dendroclimatology, Dendrochronology and Cambial Modeling

SilviScan produces profiles of wood properties from pith to bark at regular spatial intervals. The equivalent climate information is based on regular time intervals. The two types of information can be matched using the radial growth rate of the tree. In this way, the variations in the core properties can be related to the external (silvicultural and climatic) influences acting on the cambium [125,126,127,128,129,130,131,132,133,134,135,136,137,138,139,140,141]. In addition, cambial process modeling is greatly accelerated by the availability of high-resolution wood property information.

Genetics and Selection

In order to gain the maximum benefits from commercial forestry it is necessary to improve the capacity for early selection. Intensive measurement of wood properties using SilviScan has aided geneticists and tree breeders in selection of the best trees for future generations [142,143,144,145,146,147,148,149,150,151]. Ring-by-ring analysis of parent trees and their offspring can be used to generate heritabilities of wood properties as a function of tree age, e.g., [142,143]. By bringing forward the identification and use of improved genetic material, the rate of genetic gain can be increased. The use of efficient DNA profiling in conjunction with rapid phenotyping can short-circuit the breeding process and revolutionize plantation forestry, provided environmental factors are considered.

Measurement Methods

Some of the measurement principles of SilviScan are described in these publications [152,153,154,155,156,157,158,159,160,161,162,163,164,165,166,167,168,169], including a few comparisons of SilviScan data with data obtained by other methods. The full description of SilviScan operation has not been published in detail because of its extent. It is important to recognize that some of the relationships used by SilviScan were discovered as early as the 1960s by exceptional researchers such as Diana Smith and Alfred Stamm.

Pulp and Paper Properties

The original purpose of SilviScan-1 was the improvement of the quality of pulpwood from softwood plantations [170,171,172,173,174,175,176,177,178,179]. One of the most consistent requests from pulp mill operators is that wood supply to the mill be uniform from day to day; absolute measures of quality are largely secondary to uniformity of supply. It is now possible to map the forest and plantation resource in terms of many pulpwood quality characteristics.

Solid Wood Properties

Although the original requirement of Australian industry was for pulp quality improvement, the primary data is more directly applicable to the uses of solid wood [180,181,182,183,184,185,186,187,188,189,190,191,192,193,194,195,196,197,198]. In some of these studies, the ability of SilviScan to analyze large numbers of samples in great detail has been used to map the interior structure of stems to give a more comprehensive understanding of wood property variation over a wide range of scales.

Integration with Spectroscopic Methods

The development of relationships between wood properties and product properties often requires both morphological and chemical information. Appropriately calibrated NIR spectroscopy may be used to estimate many of the physical and chemical properties of wood. Combination of these complementary technologies can, in some circumstances, allow more comprehensive and cost-effective large-scale assessments of wood quality [199,200,201,202,203,204,205,206,207,208].

6.2. Near Infrared Spectroscopy

One of the most successful NDE applications of NIR spectroscopy is in the estimation of genetic parameters, particularly those related to pulp production, where NIR presents the only viable option for analyzing the necessarily large sample sets [209]. The earliest studies [198,210] utilized NIR spectra from milled increment cores to estimate genetic parameters and genotype × environment interactions for pulp yield, pulpwood productivity, and cellulose (a pulp yield substitute) in Tasmanian bluegum (Eucalyptus globulus Labill.), a species grown widely in temperate regions for the quality of the wood pulp it produces. Later studies on the same species [209,211] reported genetic parameters for extractives, lignin content, and S:G ratio. Similar studies in related hardwood species have followed [212,213,214,215,216], and the range of properties assessed has also been expanded to include basic density and lignin content. Equivalent work in softwoods is rare, with an example being a study based on maritime pine (Pinus pinaster Aiton) grown in France [217]. Related studies have used NIR predicted data for determination of quantitative trait loci and in association mapping for pulp yield and related properties (cellulose, lignin, S:G ratio, and extractives) [218,219,220,221,222,223,224].
A critical aspect is the multivariate model used for the prediction of properties. Owing to the nature of the genetics-related studies, no attempt has been made to validate predictions; however, Schimleck et al. [225] and Downes et al. [226] showed that NIR-based predictions of pulp yield on independent sample sets provided strong relationships (i.e., samples known to have high pulp yields were predicted as such, as were low yielding samples). In addition, Schimleck et al. [212] in a study of a large shining gum (Eucalyptus nitens H. Deane and Maiden) sample set of known cellulose content, found that estimated genetic gains (based on forward and backward selection) using either measured cellulose data or NIR-predicted data were comparable.
In any of these studies an assumption is that selected calibration samples represent the population. For a study of limited size, a subsample may be selected from available samples (e.g., [212]), and algorithms are available to assist with sample selection [227]. For example, with many of the eucalypt studies noted, costly individual models could have been developed for each study but as an alternative a model representative of temperate Australia developed at considerable expense was used [226,228,229]. Every identifiable source of variation was included giving a high-level of confidence in predictions, but model applicability to a new or different population should be questioned and it is often an obstacle to adopting NIR technology. Continued inclusion of new samples into calibration models seems prudent since new sources of variation can be used to re-calibrate models and improve predictions [230].
NIR spectroscopy has also been employed to examine the within-tree variation of wood properties. Again, wood chemistry and related properties have been a focus with studies examining radial variation in pulp yield [231,232,233], cellulose and various wood sugars [232,233,234], extractives (acetone-soluble and hot-water), lignin, and total phenolics [235]. Radial variation in fiber collapse, density, MFA, MOE, and tracheid properties have also been explored based on NIR-predicted data [204,234,236]. Using NIR predicted radial data from samples collected at multiple heights maps showing within-tree variation have been reported for pulp yield in shining gum trees [231] and density, MFA, MOE, and tracheid length in loblolly pine [237,238]. The density, MFA, and MOE calibrations were based on SilviScan data. In studies of within-tree variation of these properties where high resolution is not required and large numbers of samples have to be analyzed, NIR spectroscopy can provide a cost-effective alternative to SilviScan; however, SilviScan or a densitometer (for density) will always provide more accurate data.
An initial issue with these studies was the low spatial resolution of measurements, for example Schimleck et al. [204] measured NIR spectra in 10 mm increments making studies of within ring variation impossible. More recent studies improved resolution to 1 mm [232,233,234,239], allowing within-ring variation to be examined, or the determination of single ring properties; however, an assumption was that calibrations based on whole-tree samples were applicable to spectra measured at a resolution of 1 mm. More recently, hyperspectral imaging has been used to examine radial variation at the disc level [240,241] greatly improving visualization of wood property variation; however, questions relating to the suitability of calibrations for high-resolution prediction and their verification still apply. Efforts to apply NIR spectroscopy to the examination of silvicultural effects have been hampered by inadequate resolution and insufficient sensitivity to detect differences among treatments [242].

6.3. Radial Sample Acoustics

Acoustic wave propagation speed is directly affected by the ratio of a material’s stiffness to its density, and so is often employed to determine stiffness, usually with an independent density-measuring technique such as X-ray densitometry. The use of acoustics to examine wood property variation on strips, cores, and other small samples requires much shorter acoustic or vibrational wavelengths and hence much greater acoustic frequencies than standing tree tools [243]. The acoustic wavelength is calculated by:
Λ =   v f
where Λ is wavelength with units of m, v is velocity with units of m/s, and f is frequency with units of Hz (s−1). For example, to measure cores with a diameter of 10 mm, ultrasonic (>20 kHz) frequencies in the order of 1 MHz are likely to be employed.
At such high frequencies careful consideration must be given to effective coupling of acoustic energy into the sample and the effect transducer/sample interfaces might have on the results. Acoustic speeds are also significantly influenced by relaxation time-constants and energy damping of molecules in the sample, resulting in over estimation of stiffness if static stiffness estimates are required [244]. Consideration must also be given to the types of waves (e.g., shear, longitudinal, surface) that are being transmitted in the sample and how they affect results. Since wood is an orthotropic material, different acoustic speeds will be observed in different directions [245], and so grain orientation of the sample must also be determined or fixed. Finally, since the moisture content of the wood affects both its density and stiffness, the sample may need to be conditioned to a known moisture content [246].
Effective coupling of acoustic energy between the acoustic transducers and the sample can be achieved by minimizing the acoustic impedance mismatch between the transducer and the sample [247], and by maximizing the coupling area between the transducers and the sample. One can allow the transducers to contact the sample with suitable impedance matching tips, which may be soft to increase the coupling area. Non-contact approaches are also available. One possibility is to use an air-coupled, focused beam method which overcomes impedance issues by increasing intensity of the acoustic signal at the sample surface [248]. Another method is to directly excite acoustic waves on the sample surface using laser ablation [249] or plasma discharge, and to directly measure surface vibration using a laser vibrometer. If the samples are green (fresh) wood, it can be immersed in water to provide a better impedance-matching, non-contact option.
Once the transducers are set up, the general method to measure acoustic speed is to send an acoustic pulse into the sample and to monitor the time it takes to propagate through the sample. The acoustic pulse must be short enough to enable accurate measurement of acoustic speed in the sample using the signal processing techniques available, while avoiding acoustic wave reflections within the sample. An effective calibration method must also be employed. Using materials which have known acoustic properties that are similar to wood, and which have the same shape as the wood samples to be measured, is an effective way to calibrate the whole measurement system.
Mason et al. [250] found strong correlations between ultrasonic velocity and SilviScan MFA for radiata pine and an ultrasonic velocity disk scanner robot described by Mason et al. [250] has been used to obtain radial scans for 10 mm diameter increment cores (Apiolaza, in preparation). The machine will overestimate acoustic velocities, as it is testing with samples smaller than what it was designed for, but the radial profiles are useful for selecting genetic material with low radial stiffness gradients. An ultrasonic velocity system has been employed by Dahlen et al. [251] to measure the radial and longitudinal variation in ultrasonic velocity at 10 mm radial increments for loblolly pine and Douglas-fir. Samples can be prepared from discs or 12 mm increment cores. The DiscBot system described in the next section presents a way to assess ultrasonic velocity on discs. With all of these systems, relating the ultrasonic velocity values to MFA is important. A yet to be answered question is whether a global calibration model can be applied to all species, that relates AV to MFA, or whether species specific (or softwood and hardwood specific), calibrations will need to be developed.

6.4. DiscBot

The DiscBot has been developed over the past ten years by Scion (the New Zealand Forest Research Institute Limited). It combines multiple NDE techniques (NIR hyperspectral imaging, radial sample acoustics, densitometry, and grain angle scanning) into a single platform to obtain data on the variation in selected physical, mechanical, and chemical properties within a tree (Figure 15). The rationale for developing the DiscBot was to be able to characterize the “true” extent of variation in these wood properties within a tree at approximately the cubic centimeter scale. It is hypothesized that variation in wood properties at this scale is a key determinant of end-product performance, particularly for products such as solid dimension lumber [252] where MOE and distortion are important characteristics [253,254]. A key challenge with predicting the performance of solid lumber is predicting distortion, which is driven to a large extent by localized gradients in longitudinal shrinkage and grain angle [255,256,257,258]. These gradients in longitudinal shrinkage are a combination of regions of high longitudinal shrinkage, such as those associated with the presence of compression wood [259], superimposed on the radial variation in longitudinal shrinkage that occurs within a tree, principally resulting from the corresponding variation in MFA [260,261,262,263].
To estimate the variation in stiffness and shrinkage behavior of wood within a stem, the DiscBot collects information on chemical composition (primarily cellulose, lignin, and hemicellulose content), MFA, grain angle, and wood density. The DiscBot has five sensors that capture information on the properties of disc samples that are 20–30 mm thick and have been conditioned to achieve an equilibrium moisture content of approximately 12%. Discs are mounted in a frame that moves them past the five sensors and precisely records their position. A distortion-free RGB image is captured of the disc using a high-quality camera, which provides a permanent record and also enables features such as knots, resin pockets, intra-ring checks, and compression wood to be identified. An imaging spectrograph fitted with an NIR camera (900–1700 nm) is used to image the transverse face of discs at a radial resolution of approximately 2 mm [239,240]. These NIR spectral datasets are processed using a chemometric model to produce estimates of the variation in lignin, glucose, and galactan content in radiata pine trees. MOE is predicted from information on wood density and MFA [161]. Wood density is estimated from measurements made with an X-ray line camera (150 kV X-ray source) at approximately 0.5 mm resolution. MFA is predicted from ultrasonic time of flight measurements made with a pair of transducers that roll over the sample. A series of parallel paths 5 mm apart are traced across the sample to provide complete coverage. Linear potentiometers measure the thickness of the disc so that the velocity of the ultrasonic wave can be calculated. Previous research has shown that there is a strong negative linear relationship between ultrasonic velocity and MFA in radiata pine [249]. Finally, grain angle is measured non-destructively using “masked light transmission” [264]. This technique is based on the principle that light is transmitted some distance through wood, particularly in the axial direction. More specifically, light entering the surface of a wood disc is hypothesized to be preferentially directed along the tracheid direction. By applying a barrier (mask template) above the disc to block the external light source, the deflection of the light caused by the angle of the grain can be detected in a scanner and grain angle computed.
While the system is still in development, examples of data obtained from the different scanners are shown in Figure 16. By taking multiple discs from within a single stem, intra-stem wood property maps can be produced that can then be used as inputs into numerical product performance simulators [252,258,265]. These data and the subsequent simulations enable the effects of silvicultural practices, environment, and genetics on intra-stem wood property patterns and their impacts on end-product performance to be determined. This will provide greater insights into the full impact of these factors which may not be uncovered through simply analyzing density and AV data collected on standing trees [266,267]. For example, it can be used to screen different clones to identify those that have intra-stem patterns of wood properties that make them more suitable to particular end-uses, rather than simply ranking them for density or MOE.

6.5. Computer Tomography (CT) Scanning

The basic feature of X-rays is the capacity to penetrate an object under study while being attenuated according to Beer’s law [268]. Images acquired are referred to as projections or a radiograph. One of the disadvantages of a radiograph is that it is a 2D representation of a 3D object, thus depth information about an object is lost. Hounsfield [269] solved this problem by means of tomography: projections are acquired at different viewing angles and these are used for subsequent 3D reconstruction of an object using specific algorithms. Since then, X-ray Computed Tomography (CT) has revolutionized medical imaging and many other research fields. Due to developments in both hardware and software, the resolution of CT has increased significantly and high-resolution X-ray micro CT scanning (µCT) is now available facilitating microdensitometry and anatomical measurements on tree rings [270,271,272]. This section will cover applications for CT and µCT scanning. Typical resolutions for CT scanning are mm to sub mm, whereas µCT scanners are able to resolve sub µm resolutions [273].
The earliest work on the use of CT scanning for wood [274] used a custom-built portable CT scanner on living trees to measure the annual growth rate via annual ring measurements. Field use of CT scanning presents significant challenges and most work has since focused on bringing samples to a CT scanner rather than bringing the scanner to the tree. The work has since evolved to use CT scanning for measuring the density of wood blocks [275], or measuring density on increment cores with focus on improving information obtained during forest inventory work [276]. Research at Institut national de la recherche agronomique (INRA) has focused on utilizing medical CT scanning for high throughput scanning of increment cores [276]. The radial resolution that a CT scanner can resolve is less than a typical densitometer, however the sample measuring per time is seconds rather than minutes that a typical densitometer requires [277]. Thus, the utilization of CT scanning for wood quality studies is significant for improving information obtained from forest inventory efforts. There also exists the possibility of using CT scanning for tree breeding studies.
The large increase in the resolution of µCT scanning presents many exciting opportunities for studying radial variability in wood. With µCT scanners typical densitometry measurements on tree rings can be done; however, unlike typical densitometry sample preparation is less important [270,271,272]. Research at UGent-Woodlab has focused on utilizing µCT scanning for high-throughput scanning of increment cores [278,279]. The technique has been used for inter-annual [280,281,282] and intra-annual [283,284] tree growth studies. An example of a µCT scanner at the UGCT (UGent Centre for X-ray Tomography, www.ugct.ugent.be) is shown in Figure 17, and a cross-section scan through an increment core of oak is illustrated in Figure 18.
µCT can be considered a tomographic microscopy technique, and therefore is a suitable tool for studying wood anatomy at the cellular level in three dimensions. Examples of its use include studies of the 3D structure of juvenile aspen [286], investigation of reaction wood in detail [287], and visualization of specific anatomical features [288,289,290].
One other important area for CT scanning is in evaluating knots, both through laboratory studies whereby branches are quantified and modelled, as well as utilization in sawmills [291]. A significant amount of research has been done using CT scanning of logs to map internal characteristics [292,293]. In addition to algorithms for knot detection [294,295,296], algorithms developed include pith detection [297], fiber orientation [298], spiral grain [299], decay recognition [300], and moisture distribution mapping [301]. Ultimately mapping internal log defects prior to sawing allows for improved lumber value recovery during processing [302,303,304]. Studies have also examined variation within and among stems, e.g., [305], verified light detection and ranging (LiDAR) measurements of wood quality assessment with verification by X-ray CT data [306], and prediction of stiffness of sawn products based on log scans [307]. Information obtained from CT scanning logs can enable decision making based on branch structure by tree geneticists, such as recent work by Song et al. [308] on the genetic architecture of branching traits. Such data are not only of great interest for sawing optimization, but could be a rich source of information in terms of silvicultural effects and within-tree variation, such as the work by Bjorklund and Petersson [309] on predicting knot diameter in Swedish Scots pine (Pinus sylvestris L.).
In general, while CT and µCT systems are expensive, the technique provides significant flexibility and offers vast potential in improving our understanding of wood variability. Owing to the versatility of the instruments, it is difficult to quantify the time needed for scanning to allow comparison with other techniques, as it depends on the available equipment (detector read-out time), scanning requirements (related to scan quality), acquisition mode, the type of object, and experimental set-up.

7. Measurements That Are Rapid but not Nondestructive

Measuring lignin content in wood is typically done via a multistep wet chemistry process following sample grinding and extraction. Lignin content can be determined using a weight-based approach (Klason), or a spectrophotometric approach (acetyl bromide) [310,311,312]. These techniques are laborious and a rapid alternative is the use of pyrolysis molecular-beam mass spectrometry (Py-MBMS) [313,314,315,316]. The technique rapidly quantifies the lignin content of wood and provides quantitative information such as S:G ratio. This technique still requires samples to be ground and extracted; however, measurement time per sample is a few minutes and thus is considerably faster than traditional methods. Linking Py-MBMS with NIR spectroscopy is particularly useful.
Measuring the dimensions of pulped fibers or tracheids (referred hereafter as fibers) typically requires pulping a sample to remove lignin allowing it to be broken down (macerated) to its constituent fibers and then measuring the length and the width of the fibers. The most commonly used method for macerating fibers in a laboratory environment involves heating wood at elevated temperatures (60 °C) in a solution of glacial acetic acid (50%), hydrogen peroxide (15%), and water (35%) [317] for approximately 48 h. Following maceration, fibers are separated from the maceration solution using a Buchner funnel under vacuum then rinsed with water to a neutral pH. Using automated fiber analyzers, the measurement of length and width of thousands of fibers can be done in less than 10 min [318,319,320,321]. Compared to manual measurement using a microscope, the technique is both rapid and reliable provided weighted length measurement is substituted for mean length to better differentiate between non-cut and cut fibers [320]. Fiber coarseness can also be obtained provided the weight of fibers is measured prior to the measurement of length and width. It should be noted that coarseness measured on fibers is different to SilviScan coarseness owing to loss of cell wall thickness and fiber swell during pulping [322]. We note that measurement of fiber length has been done on the tangential face of non-macerated samples [323,324]; however, few studies have utilized this technique since the introduction of automated fiber analyzers.
Further processing a radial sample into either individual rings, a selected number of rings, or EW and LW of an individual ring provides opportunity for numerous analyses. Dendrochronology studies have frequently used microtoming to prepare a section for microscopy imaging of cell dimensions [325,326]. Recently efforts have been made by the scientific community to improve the microtomes available specific for wood [327,328] as well as tools needed for analyzing images [329].
MFA determined by X-ray diffraction will provide the most representative measure for a section of wood in a pith–bark radial strip; however, other techniques exist, as reviewed by Huang et al. [330], and can be used when the MFA of an individual tracheid is of interest. The measurement of MFA using an X-ray diffraction system can be done on the tangential face of thin EW and LW samples, recent examples include Hein et al. [331], Cramer et al. [332] in loblolly pine, and Gorman et al. [333] for lodgepole pine (Pinus contorta Douglas). These studies and others demonstrate that MFA can be measured on commercially available X-ray diffraction instruments providing a rapid alternative to MFA measured via microscopy. However, compared to SilviScan or other purposely-adapted X-ray diffraction systems that allow for radial scanning, sample throughput is limited owing to laborious sample preparation along with the necessary work needed to keep individual samples organized. Individual rings, or their EW and LW components, can be cut and their wood density measured as an alternative to densitometry [331].

8. Future Challenges and Opportunities for NDE of Wood Properties

In the past 25 years the emergence of NDE tools have allowed a much greater understanding of wood property variation at multiple scales ranging from regional to within-ring. Various research studies, many cited in this manuscript, have demonstrated potential applications, which collectively have served to highlight the unique attributes of each technique. An understanding of these attributes coupled with clear objectives for resource assessment, tree improvement or wood quality related research will lead to the selection of the appropriate technique for a given application. Here we have created different scenarios (related directly to the various uses to which wood NDE has been applied) to explore the suitability of an NDE technique (or tools) for a given task. Table 2 summarizes field-based tools and techniques, while lab-based systems are summarized in Table 3. It is our intention that both tables will clarify the choice of approach but when considering options there is much a potential user needs to learn and in Table 4 we have attempted to provide answers to what we think are some of the most important questions.
Tremendous advances have been achieved in the application of NDE technologies to study trees in both native forests and plantations but for any operational NDE assessment for wood quality used routinely in commercial forestry it must have at least two characteristics. Firstly, it must have a strong cost–benefit ratio. The long-term nature of plantation forestry investment is inherently problematic given the upfront costs associated with tree planting and the delay in financial return. Therefore, the costs of assessing wood quality must have a demonstrable mechanism to provide commercial advantages; growers need an incentive to grow wood for more than harvestable volume. This is enhanced if the assessment NDE costs are sufficiently low. Secondly, the NDE method must have demonstrable and reproducible precision in assessing the target trait, particularly at the population mean level and preferably at the individual tree level. As new NDT tools are developed and tested for routine application it is critical that their performance be judged against these key criteria.
Balancing cost of analysis with adequate resolution to successfully achieve a research or operational objective is critical in the application of NDE technologies. Depending on the information required the most expensive option may be the only real option available and how many samples can be analyzed for a specified cost becomes important. We have not attempted to compare costs of analysis in detail as there are so many variables involved making a valid comparison impossible. Often cost estimates are for an in-house application of an “off-the-shelf” tool and do not include research and development costs or the costs associated with data management, record keeping or reporting. Likewise, a full cost recovery model (wages, overhead, and depreciation) is rarely considered and SilviScan is the only NDE option that we are aware of that incorporates all these factors when determining the final cost of analysis. If SilviScan did not operate under these constraints, pricing would be different but the price that is presently estimated for sample analysis is the most realistic cost estimate available of any NDE technique. Further, to make a proper comparison with other NDE techniques would involve the same cost recovery calculations as though they were performed on the same samples, at the same resolution and by the same personnel in the same organization. Resolution also makes comparison of NDE techniques (and costs) difficult. Many techniques are low resolution and provide no information on radial trends or within-tree variation. If, for example, low resolution data is required from SilviScan then the cost of analysis can be greatly reduced compared to the µm resolution required for dendrochronological studies. In addition, the properties determined can have a marked influence on cost. Awareness of these issues are important when considering what NDE technique to employ.
The development of new applications for existing technologies is ongoing. Recent research on acoustic technologies by Fibre-gen (New Zealand) has resulted in an acoustic measurement system that can be mounted in a processor head of a harvesting machine. The system allows for the operational assessment of AV when harvesting timber, and during the log bucking decision process [334]. The system measures the TOF of an acoustic wave in the stem section held by the processor head, immediately following a cross-cut. With the AV displayed in the cab, operators can cut and sort higher value logs or segregate low AV logs based on user-defined velocity threshold levels [335]. Trial studies have demonstrated the potential for segregating logs with high AV for higher value structural markets such as LVL [335].
NIR spectroscopy presents an attractive option but its utilization is one of the most variable of all NDE tools as many companies produce instruments, calibrations are not readily transferable and the application of the technology inherently involves many developmental challenges that do not exist with other “off-the-shelf” tools. To ensure the best possible chance of success with this technology we recommended the development of “best practices”, e.g., Sandak et al. [109], that are consistently applied. We believe this would assist with wider operational adoption and would also allow information to be shared more easily (presently it is impossible owing to the use of different spectrometers and wood property assessment methodologies). The development of best practices for other tools may not be necessary but could prove to be beneficial.
Hyperspectral imaging (employed by DiscBot) presents an exciting development in a broad range of wood related applications. While “traditional” NIR analysis has involved spot measurements “hyperspectral imaging combines spectroscopy and imaging resulting in three dimensional multivariate data structures (“hypercubes”). Each pixel in a hypercube contains a spectrum representing its light absorbing and scattering properties. This spectrum can be used to estimate chemical composition and/or physical properties of the spatial region represented by that pixel” [336]. As the hyperspectral spectral imaging system is an array of pixels the data can be used to produce images of spatial variability across the surface of the scanned sample (as per the glucose, galactan etc. disc maps shown in Figure 16). Data acquisition is also rapid allowing wood property information to be generated at a level that is unmatched by other instruments creating challenges for data storage, management and retrieval. While relatively new, the adoption of best practices in applying the technology and in reporting of experimental procedures would help others interested in employing the technique (at present a highly trained person is required to operate it). CT scanning presents similar challenges and while adopted in some industrial operations for saw log defect and knot detection, and the detection of clear wood, the potential exists for the technology to be more widely utilized. µCT scanners are becoming faster and well-established, when coupled with the ability to scan samples in batches and minimal sample preparation µCT promises to be routinely used in the future. Furthermore, hyperspectral imaging utilizing energy sensitive detectors to measure energies of incoming X-rays can be used for chemical analysis of samples and offers new avenues of research. An example is the dual energy approach (scanning at two energies which improves differentiating between features, in this case water in wood) recently showcased for moisture mapping of wood [337]. Finally, multi-spectral and multi-modal workflows (SilviScan and DiscBot are examples) either by combination of several different cutting-edge equipment [338] for a combination of optical, X-ray, and NIR imaging) or by combination in a single machine (Laforce et al. [339] combining X-ray, CT, and X-ray fluorescence) are currently being developed.
NDE tools have presented new opportunities for tree breeding programs. Originally breeding programs targeted growth, form, and adaptation traits, but NDE has allowed the inclusion of wood properties, which depending on the breeding program, may extend to multiple selection criteria. NIR spectroscopy is often favored by breeding programs, as spectra can be calibrated against multiple variables. Lignin and pulp yield [340], and physical wood properties [341] calibrations are common, while recently extractives content calibrations have been developed at University of Canterbury [342] as an indicator of coast grey box (Eucalyptus bosistoana F. Muell.) wood durability.
Annual costs of wood properties assessments in a breeding program can be quite high, pushing for continuous reevaluation of NDE technologies. For example, in New Zealand, the Radiata Pine Breeding Company is replacing basic density obtained from increment cores by predictions based on the Resistograph. This change will eliminate both processing samples in a laboratory, and provide within-tree radial trends of wood density (Mark Paget, personal communication). A similar effort, to assess drill resistance and acoustic time of flight for assessing genetic variation six- to nine-year old loblolly pine progeny tests has been undertaken by the NCSU Tree Improvement Program [343]. The need to minimize costs will be ongoing and presents opportunities for new research and development, for example the development of a field tool that measures multiple properties simultaneously presents an exciting possibility.
The final use of the information obtained by NDE tools will affect both the attitude towards assessment limitations and the acceptable resolution. For example, tree breeders most often need to assess large numbers of young trees (<1/3 rotation age) to rank their assessments. In that case, it is possible to sacrifice accuracy (a consistent over- or underestimate) if retaining enough precision to tell families and, better, individual trees apart. A single trait value per tree will commonly be sufficient (e.g., for pulp yield or basic density); however, there are traits for which a property gradient (e.g., wood stiffness) or critical value (e.g., ring at which the tree achieves a stiffness threshold) could be of interest. From a practical point of view, radial assessments every 10 mm, or even sparser, will be enough to estimate the gradients. In contrast, research projects looking at fundamental understanding will require higher resolution assessments.
In summary, we have considered a number of instruments in this review that have been extensively employed by the scientific community to improve our understanding of wood and fiber quality, its variability with regard to genetics and the environment, and ways that silviculture can be used to manipulate it. Some of the authors here, as part of collaborative teams, have developed or are currently developing instruments reported on here. We acknowledge that developing any instrument is time consuming and difficult; Gene Wolfe wrote in the Book of the New Sun, “Here I pause. If you wish to walk no farther with me, reader, I cannot blame you. It is no easy road.” However, consider the measurement of MFA via microscopy versus using one of the SilviScan diffraction systems. Each SilviScan system can measure the MFA of 100 million to 20 billion cells per year. Suffice to say that the SilviScan system can measure more cells in one year than the total number of MFA measurements done using microscopy techniques over any number of years. Thus, we challenge those reading this to work towards the continued development of NDE instruments.

Author Contributions

L.S. and J.D.—conceptualized the review and Table 2, Table 3 and Table 4, Future challenges, largely responsible for editing manuscript. L.S.—Introduction, NIR Spectroscopy. J.D.—Forest sampling, Sample preparation, and Destructive but rapid tests. L.A.—The role of NDE in tree breeding, Table 1, Future challenges, information for Table 2, Table 3 and Table 4. G.D.—Resistograph, Future challenges, information for Table 2, Table 3 and Table 4, editing manuscript. G.E.—Radial sample acoustics. R.E.—SilviScan, Future Challenges, information for Table 2, Table 3 and Table 4. J.M.—DiscBot, Future Challenges, information for Table 2, Table 3 and Table 4, editing manuscript. L.P.—Rigidimeter, information for Table 2, Table 3 and Table 4. J.V.d.B.—CT scanning, information for Table 2, Table 3 and Table 4. X.W.—Acoustics, Pilodyn, Future Challenges, information for Table 2, Table 3 and Table 4.

Funding

No external funding was received for the purpose of writing this review.

Acknowledgments

Joseph Dahlen—members and collaborators of the Wood Quality Consortium. Jan Van den Bulcke—The Special Research Fund of Ghent University (BOF-UGent) is acknowledged for the financial support of the UGCT Center of Expertise (BOF.EXP.2017.0007). The authors also acknowledge Eduardo Cappa (Argentina), Greg Dutkowski, Milos Ivkovic, Dominic Kain, David Pilbeam, and Dean Williams (Australia), Claudio Balocchi and Fernando Droppelman (Chile), Annie Raffin (France), Mark Paget (New Zealand), Steve Verryn (South Africa), Fikret Isik, Keith Jayawickrama, and Gary Peter (USA) for information related to criteria and tools frequently used for early selection (Table 1).

Conflicts of Interest

The authors declare no conflict of interest.

References

  1. Pellerin, R.F.; Ross, R.J. Nondestructive Evaluation of Wood; Forest Products Society: Madison, WI, USA, 2002. [Google Scholar]
  2. ANSI/ASNT CP-189. ASNT Standard for Qualification and Certification of Nondestructive Testing Personnel; American National Standards Institute: Washington, DC, USA, 2011. [Google Scholar]
  3. Van Mantgem, P.J.; Stephenson, N.L. Does coring contribute to tree mortality? Can. J. For. Res. 2004, 34, 2394–2398. [Google Scholar] [CrossRef]
  4. Tsen, E.W.J.; Sitzia, T.; Webber, B.L. To core, or not to core: The impact of coring on tree health and a best-practice framework for collecting dendrochronological information from living trees. Biol. Rev. 2016, 91, 899–924. [Google Scholar] [CrossRef]
  5. Downes, G.; Hudson, I.; Raymond, C.; Dean, G.; Michell, A.; Schimleck, L.; Evans, R.; Muneri, A. Sampling Plantation Eucalypts for Wood and Fibre Properties; CSIRO Publishing: Collingwood, Victoria, Australia, 1997. [Google Scholar]
  6. Raymond, C. Density assessment of radiata pine: Sampling strategy revisited. Holzforschung 2006, 60, 580–582. [Google Scholar] [CrossRef]
  7. Jordan, L.; Schimleck, L.R.; Clark, A.; Hall, D.B.; Daniels, R.F. Estimating optimum sampling size to determine weighted core specific gravity of planted loblolly pine. Can. J. For. Res. 2007, 37, 2242–2249. [Google Scholar] [CrossRef]
  8. Mora, C.R.; Allen, H.L.; Daniels, R.F.; Clark, A. Modeling corewood–outerwood transition in loblolly pine using wood specific gravity. Can. J. For. Res. 2007, 37, 999–1011. [Google Scholar] [CrossRef]
  9. Moore, J.R.; Cown, D.J.; McKinley, R.B. Modelling microfibril angle variation in New Zealand-grown radiata pine. N. Z. J. For. Sci. 2014, 44, 25. [Google Scholar] [CrossRef] [Green Version]
  10. Auty, D.; Gardiner, B.A.; Achim, A.; Moore, J.R.; Cameron, A.D. Models for predicting microfibril angle variation in Scots pine. Ann. For. Sci. 2013, 70, 209–218. [Google Scholar] [CrossRef]
  11. Apiolaza, L.A.; Butterfield, B.; Chauhan, S.S.; Walker, J.C.F. Characterization of mechanically perturbed young stems: Can it be used for wood quality screening? Ann. For. Sci. 2011, 68, 407–414. [Google Scholar] [CrossRef]
  12. Chauhan, S.S.; Walker, J.F.C. Wood quality in artificially inclined 1-year-old trees of Eucalyptus regnans—Differences in tension wood and opposite wood properties. Can. J. For. Res. 2011, 41, 930–937. [Google Scholar] [CrossRef]
  13. Chauhan, S.S.; Sharma, M.; Thomas, J.; Apioloaza, L.A.; Collings, D.A.; Walker, J.C.F. Methods for the very early selection of Pinus radiata D. Don for solid wood products. Ann. For. Sci. 2013, 70, 439–449. [Google Scholar] [CrossRef]
  14. Sharma, M.; Apioloaza, L.A.; Chauhan, S.; Mclean, J.P.; Wikaira, J. Ranking very young Pinus radiata families for acoustic stiffness and validation by microfibril angle. Ann. For. Sci. 2016, 73, 393–400. [Google Scholar] [CrossRef]
  15. Bucur, V.; Herbé, C.; Nosei, G. Annual Ring Characteristics of Pinus Taeda Measured by Ultrasonic and X-Ray Techniques. IAWA J. 1994, 15, 121–132. [Google Scholar] [CrossRef]
  16. Applequist, M.B. A simple pith location for use with off-centre increment cores. J. For. 1958, 56, 141. [Google Scholar]
  17. Liu, C.J. Rectifying radii on off-center increment cores. For. Sci. 1986, 32, 1058–1061. [Google Scholar]
  18. Dujesiefken, D.; Rhaesa, A.; Eckstein, D.; Stobbe, H. Tree wound reactions of differently treated boreholes. J. Arboric. 1999, 25, 113–123. [Google Scholar]
  19. Eberhardt, T.L.; Samuelson, L.J. Collection of wood quality data by X-ray densitometry: A case study with three southern pines. Wood Sci. Technol. 2015, 49, 739–753. [Google Scholar] [CrossRef]
  20. Downes, G.; Grabner, M.; Wimmer, R.; Gierlinger, N.; Evans, R. Heartwood extractives in larch and effects on X-ray densitometry. Can. J. For. Res. 2005, 35, 2781–2786. [Google Scholar] [Green Version]
  21. White, T.L. A conceptual framework for tree improvement programs. New For. 1987, 1, 325–342. [Google Scholar] [CrossRef]
  22. Zobel, B.J.; Talbert, J. Applied Forest Tree Improvement; John Wiley & Sons: New York, NY, USA, 1984; pp. 395–398. [Google Scholar]
  23. Cornelius, J. Heritabilities and additive genetic coefficients of variation in forest trees. Can. J. For. Res. 1994, 24, 372–379. [Google Scholar] [CrossRef]
  24. Emms, G.; Nanayakkara, B.; Harrington, J. A novel technique for non-damaging measurement of sound speed in seedlings. Eur. J. For. Res. 2012, 131, 1449–1459. [Google Scholar] [CrossRef]
  25. Emms, G.W.; Harrington, J.J.; Nanayakkara, B. Application of longitudinal-wave time-of-flight sound speed measurement to Pinus radiata seedlings. Can. J. For. Res. 2013, 43, 750–756. [Google Scholar] [CrossRef]
  26. Gonçalves, R.; Lorensani, R.G.M.; Ruy, M.; Veiga, N.S.; Müller, G.; da Silva Alves, C.; Martins, G.A. Evolution of acoustical, geometrical, physical, and mechanical parameters from seedling to cutting age in Eucalyptus clones used in the pulp and paper industries in Brazil. For. Prod. J. 2019, 69, 5–16. [Google Scholar]
  27. Apiolaza, L.A. Very early selection for solid wood quality: Screening for early winners. Ann. For. Sci. 2009, 66, 601. [Google Scholar] [CrossRef]
  28. Grattapaglia, D.; Resende, M.D. Genomic selection in forest tree breeding. Tree Genet. Genomes 2011, 7, 241–255. [Google Scholar] [CrossRef]
  29. Isik, F. Genomic selection in forest tree breeding: The concept and an outlook to the future. New For. 2014, 45, 379–401. [Google Scholar] [CrossRef]
  30. Mrode, R.A. Linear Models for the Prediction of Animal Breeding Values; CABI Publishing: Wallingford, UK, 1996. [Google Scholar]
  31. Garrick, D.J.; Taylor, J.F.; Fernando, R.L. Deregressing estimated breeding values and weighting information for genomic regression analyses. Genet. Sel. Evol. 2009, 41, 55. [Google Scholar] [CrossRef]
  32. Meuwissen, T.H.; Hayes, B.J.; Goddard, M.E. Prediction of total genetic value using genome-wide dense marker maps. Genetics 2001, 157, 1819–1829. [Google Scholar]
  33. Hayes, B.; Bowman, P.; Chamberlain, A.; Goddard, M.; Goddard, M. Invited review: Genomic selection in dairy cattle: Progress and challenges. J. Dairy Sci. 2009, 92, 433–443. [Google Scholar] [CrossRef] [Green Version]
  34. Resende, M.D.V.; Resende, M.F.R.; Sansaloni, C.P.; Petroli, C.D.; Missiaggia, A.A.; Aguiar, A.M.; Abad, J.M.; Takahashi, E.K.; Rosado, A.M.; Faria, D.A.; et al. Genomic selection for growth and wood quality in Eucalyptus: Capturing the missing heritability and accelerating breeding for complex traits in forest trees. New Phytol. 2012, 194, 116–128. [Google Scholar] [CrossRef]
  35. Cappa, E.P.; El-Kassaby, Y.A.; Garcia, M.N.; Acuña, C.; Borralho, N.M.G.; Grattapaglia, D.; Poltri, S.N.M. Impacts of Population Structure and Analytical Models in Genome-Wide Association Studies of Complex Traits in Forest Trees: A Case Study in Eucalyptus globulus. PLoS ONE 2013, 8, e81267. [Google Scholar] [CrossRef]
  36. Beaulieu, J.; Doerksen, T.; Clément, S.; Mackay, J.; Bousquet, J. Accuracy of genomic selection models in a large population of open-pollinated families in white spruce. Hered. 2014, 113, 343–352. [Google Scholar] [CrossRef] [Green Version]
  37. Wang, X.; Carter, P.; Ross, R.J.; Brashaw, B.K. Acoustic assessment of wood quality of raw forest materials–A path to increased profitability. For. Prod. J. 2007, 57, 6–14. [Google Scholar]
  38. Ross, R.J. Nondestructive Evaluation of Wood, 2nd ed.; USDA-FS Forest Products Laboratory: Madison, WI, USA, 2015. [Google Scholar]
  39. Carter, P. Acoustic technology—Enhanced tools for research and operations. In Proceedings of the 20th International Nondestructive Testing and Evaluation of Wood Symposium, Madison, WI, USA, 12–15 September 2017. [Google Scholar]
  40. Matheson, A.C.; Gapare, W.J.; Ilic, J.; Wu, H.X. Inheritance and Genetic Gain in Wood Stiffness in Radiata Pine Assessed Acoustically in Young Standing Trees. Silvae Genet. 2008, 57, 56–64. [Google Scholar] [CrossRef] [Green Version]
  41. Lindström, H.; Reale, M.; Grekin, M. Using non-destructive testing to assess modulus of elasticity of Pinus sylvestris trees. Scand. J. For. Res. 2009, 24, 247–257. [Google Scholar] [CrossRef]
  42. Lenz, P.; Auty, D.; Achim, A.; Beaulieu, J.; MacKay, J. Genetic improvement of white spruce mechanical woodtraits–early screening by means of acoustic velocity. Forests 2013, 4, 575–594. [Google Scholar] [CrossRef]
  43. Hong, Z.; Fries, A.; Lundqvist, S.-O.; Gull, B.A.; Wu, H.X. Measuring stiffness using acoustic tool for Scots pine breeding selection. Scand. J. For. Res. 2015, 30, 1–10. [Google Scholar] [CrossRef]
  44. Auty, D.; Achim, A. The relationship between standing tree acoustic assessment and timber quality in Scots pine and the practical implications for assessing timber quality from naturally regenerated stands. Forestry 2008, 81, 475–487. [Google Scholar] [CrossRef] [Green Version]
  45. Andrews, M. Wood quality measurement—Son et lumie’re. N. Z. J. For. 2002, 47, 19–21. [Google Scholar]
  46. Mora, C.R.; Schimleck, L.R.; Isik, F.; Mahon, J.M.; Clark, A.; Daniels, R.F. Relationship between acoustic variables and different measures of stiffness in standing Pinus taeda trees. Can. J. For. Res. 2009, 39, 1421–1429. [Google Scholar] [CrossRef]
  47. Ikeda, K.; Arima, T. Quality evaluation of standing trees by a stress-wave propagation method and its application II. Evaluation of sugi stands and application to production of sugi structural square sawn timber. Mokuzai Gakaishi 2000, 46, 189–196. [Google Scholar]
  48. Chauhan, S.; Walker, J.; Chauhan, S. Variations in acoustic velocity and density with age, and their interrelationships in radiata pine. For. Ecol. Manag. 2006, 229, 388–394. [Google Scholar] [CrossRef]
  49. Grabianowski, M.; Manley, B.; Walker, J.C.F. Acoustic measurements on standing trees, logs and green lumber. Wood Sci. Technol. 2006, 40, 205–216. [Google Scholar] [CrossRef]
  50. Simic, K.; Gendvilas, V.; O’Reilly, C.; Harte, A.M. Predicting structural timber grade-determining properties using acoustic and density measurements on young Sitka spruce trees and logs. Holzforschung 2019, 73, 139–149. [Google Scholar] [CrossRef]
  51. Lasserre, J.-P.; Mason, E.G.; Watt, M.S.; Moore, J.R. Influence of initial planting spacing and genotype on microfibril angle, wood density, fibre properties and modulus of elasticity in Pinus radiata D. Don corewood. For. Ecol. Manag. 2009, 258, 1924–1931. [Google Scholar] [CrossRef]
  52. Wang, X. Acoustic measurements on trees and logs: A review and analysis. Wood Sci. Technol. 2013, 47, 965–975. [Google Scholar] [CrossRef]
  53. Butler, M.A.; Dahlen, J.; Eberhardt, T.L.; Montes, C.; Antony, F.; Daniels, R.F. Acoustic evaluation of loblolly pine tree- and lumber-length logs allows for segregation of lumber modulus of elasticity, not for modulus of rupture. Ann. For. Sci. 2017, 74, 1–15. [Google Scholar] [CrossRef]
  54. Wang, S.-Y.; Chuang, S.-T. Experimental Data Correction of the Dynamic Elastic Moduli, Velocity and Density of Solid Wood as a Function of Moisture Content above the Fiber Saturation Point. Holzforschung 2000, 54, 309–314. [Google Scholar] [CrossRef]
  55. Chan, J.M.; Walker, J.C.; Raymond, C.A. Effects of moisture content and temperature on acoustic velocity and dynamic MOE of radiata pine sapwood boards. Wood Sci. Technol. 2011, 45, 609–626. [Google Scholar] [CrossRef]
  56. Wang, X.; Ross, R.J.; Mcclellan, M.; Barbour, R.J.; Erickson, J.R.; Forsman, J.W.; McGinnis, G.D. Nondestructive evaluation of standing trees with a stress wave method. Wood Fiber Sci. 2001, 33, 522–533. [Google Scholar]
  57. Huang, C.L. Predicting lumber stiffness of standing trees. In Proceedings of the 12th International Nondestructive Testing and Evaluation of Wood Symposium, Sopron, Hungary, 13–15 September 2000. [Google Scholar]
  58. Moore, J.R.; Lyon, A.J.; Searles, G.J.; Lehneke, S.A.; Ridley-Ellis, D.J. Within- and between-stand variation in selected properties of Sitka spruce sawn timber in the UK: Implications for segregation and grade recovery. Ann. For. Sci. 2013, 70, 403–415. [Google Scholar] [CrossRef]
  59. Paradis, N.; Auty, D.; Carter, P.; Achim, A. Using a Standing-Tree Acoustic Tool to Identify Forest Stands for the Production of Mechanically-Graded Lumber. Sensors 2013, 13, 3394–3408. [Google Scholar] [CrossRef]
  60. Lowell, E.C.; Todoroki, C.L.; Dykstra, D.P.; Briggs, D.G. Linking acoustic velocity of standing Douglas-fir trees to veneer stiffness: A tree-log-product study across thinning treatments. N. Z. J. For. Sci. 2014, 44, 1. [Google Scholar] [CrossRef]
  61. Downes, G.M.; Ebdon, N.; Meder, R.; Joyce, K.; French, J. Standing Tree Measurement of Acoustic Velocity as a Predictor of Kraft Pulp Yield in E. nitens across 2 Sites. FWPA PN07.3025. 2008. Available online: https://www.fwpa.com.au/images/processing/PNC053-0708_Research_Report_Acoustics_0.pdf (accessed on 10 August 2019).
  62. Newton, P.F. Acoustic-Based Non-Destructive Estimation of Wood Quality Attributes within Standing Red Pine Trees. Forests 2017, 8, 380. [Google Scholar] [CrossRef]
  63. Wang, X.; Ross, R.J.; Mcclellan, M.; Barbour, R.J.; Erickson, J.R.; Forsman, J.W. Strength and Stiffness Assessment of Standing Trees Using a Nondestructive Stress Wave Technique; US Forest Service, Forest Products Laboratory: Madison, WI, USA, 2000. [Google Scholar]
  64. Wang, X.; Ross, R.J.; Verrill, S.; Lowell, E.; Barbour, J. Acoustic evaluation of thinning and biosolid fertilization effects on wood quality of a Douglas-fir stand. In Proceedings of the 19th International Nondestructive Testing and Evaluation of Wood Symposium, Rio de Janeiro, Brazil, 22–25 September 2015. [Google Scholar]
  65. Briggs, D.G.; Thienel, G.; Turnblom, E.C.; Lowell, E.; Dykstra, D.; Ross, R.J.; Wang, X.; Carter, P. Influence of thinning on acoustic velocity of Douglas-fir trees in western Washington and western Oregon. In Proceedings of the 15th International Symposium on Nondestructive Testing of Wood, Duluth, MN, USA, 10–12 September 2007. [Google Scholar]
  66. Raymond, C.A.; Joe, B.; Anderson, D.W.; Watt, D.J. Effect of thinning on relationships between three measures of wood stiffness in Pinus radiata: Standing trees vs. logs vs. short clear specimens. Can. J. For. Res. 2008, 38, 2870–2879. [Google Scholar] [CrossRef]
  67. Essien, C.; Cheng, Q.; Via, B.K.; Loewenstein, E.F.; Wang, X. An Acoustics Operations Study for Loblolly Pine (Pinus taeda) Standing Saw Timber with Different Thinning History. Bioresources 2016, 11, 7512. [Google Scholar] [CrossRef]
  68. Murphy, G.; Cown, D. Stand, stem and log segregation based on wood properties: A review. Scand. J. For. Res. 2015, 30, 1–14. [Google Scholar] [CrossRef]
  69. Cown, D.J. Comparison of the Pilodyn and Torsiometer methods for the rapid assessment of wood density in living trees. N. Z. J. For. Sci. 1978, 8, 384–391. [Google Scholar]
  70. Gao, S.; Wang, X.; Wiemann, M.C.; Brashaw, B.K.; Ross, R.J. A critical analysis of methods for rapid and nondestructive determination of wood density in standing trees. Ann. For. Sci. 2017, 74, 77. [Google Scholar] [CrossRef]
  71. Sprague, J.R.; Talbert, J.T.; Jett, J.B.; Bryant, R.L. Utility of the Pilodyn in selection for mature wood specific gravity in loblolly pine. For. Sci. 1983, 29, 696–701. [Google Scholar]
  72. Gough, G.; Barnes, R.D. A Comparison of Three Methods of Wood Density Assessment in a Pinus elliottii Progeny Test. South Afr. For. J. 1984, 128, 22–25. [Google Scholar] [CrossRef]
  73. King, J.N.; Yeh, F.C.; Heaman, J.C.; Dancik, B.P. Selection of wood density and diameter in controlled crosses of coastal Douglas-fir. Silvae Genet. 1988, 37, 152–157. [Google Scholar]
  74. da Rosado, S.C.S.; Brune, A.; de Oliveira, L.M. Avaliacão da densidade básica da madeira de árvores em pé. Rev. Arvore 1983, 7, 147–153. [Google Scholar]
  75. Moura, V.P.G.; Barnes, R.D.; Birks, J.S. A comparison of three methods of assessing wood density in provenances of Eucalyptus camaldulensis Dehnh. and other Eucalyptus species in Brazil. Aust. For. Res. 1987, 17, 83–90. [Google Scholar]
  76. Greaves, B.; Borralho, N.; Raymond, C.; Farrington, A. Use of a Pilodyn for the indirect selection of basic density in Eucalyptus nitens. Can. J. For. Res. 1996, 26, 1643–1650. [Google Scholar] [CrossRef]
  77. Wu, S.-J.; Xu, J.-M.; Li, G.-Y.; Risto, V.; Lu, Z.-H.; Li, B.-Q.; Wang, W. Use of the pilodyn for assessing wood properties in standing trees of Eucalyptus clones. J. For. Res. 2010, 21, 68–72. [Google Scholar] [CrossRef] [Green Version]
  78. Chen, Z.-Q.; Karlsson, B.; Lundqvist, S.-O.; Gil, M.R.G.; Olsson, L.; Wu, H.X. Estimating solid wood properties using Pilodyn and acoustic velocity on standing trees of Norway spruce. Ann. For. Sci. 2015, 72, 499–508. [Google Scholar] [CrossRef] [Green Version]
  79. Raymond, C.A.; Muneri, A.; MacDonald, A.C. Non-destructive sampling for basic density in Eucalyptus globulus and E. nitens. Appita J. 1998, 51, 224–228. [Google Scholar]
  80. Llana, D.F.; Hermoso, E.; Bobadilla, I.; Íñiguez-González, G. Influence of moisture content on the results of penetration and withdrawal resistance measurements on softwoods. Holzforschung 2018, 72, 549–555. [Google Scholar] [CrossRef]
  81. Rinn, F.; Schweingruber, F.-H.; Schär, E. Resistograph and X-ray Density Charts of Wood. Comparative Evaluation of Drill Resistance Profiles and X-ray Density Charts of Different Wood Species. Holzforschung 1996, 50, 303–311. [Google Scholar] [CrossRef]
  82. Costello, L.R.; Quarles, S.L. Detection of wood decay in blue gum and elm: An evaluation of the Resistograph® and the portable drill. J. Arboric. 1999, 25, 311–318. [Google Scholar]
  83. Li, B.; Isik, F. Rapid assessment of wood density of live trees using the Resistograph for selection in tree improvement programs. Can. J. For. Res. 2003, 33, 2426–2435. [Google Scholar]
  84. Eckard, J.T.; Isik, F.; Bullock, B.; Li, B.; Gumpertz, M. Selection efficiency for solid wood traits in Pinus taeda using time-of-flight acoustic and micro-drill resistance methods. For. Sci. 2010, 56, 233–241. [Google Scholar]
  85. Fundova, I.; Funda, T.; Wu, H.X. Non-destructive wood density assessment of Scots pine (Pinus sylvestris L.) using Resistograph and Pilodyn. PLoS ONE 2018, 13, e0204518. [Google Scholar] [CrossRef]
  86. Fundova, I.; Funda, T.; Wu, H.X. Non-Destructive Assessment of Wood Stiffness in Scots Pine (Pinus sylvestris L.) and its Use in Forest Tree Improvement. Forests 2019, 10, 491. [Google Scholar] [CrossRef]
  87. Downes, G.M.; Lausberg, M.; Potts, B.M.; Pilbeam, D.L.; Bird, M.; Bradshaw, B. Application of the IML Resistograph to the infield assessment of basic density in plantation eucalypts. Aust. For. 2018, 81, 1–9. [Google Scholar] [CrossRef]
  88. Downes, G.M.; Lausberg, M. Evaluation of the RESI software tool for the prediction of HM200 within pine logs sourced from multiple sites across New Zealand and Australia. N. Z. Solid Wood Innov. 2016, 15. [Google Scholar]
  89. Kloppenburg, A.M. Density Determination of Tropical Hardwoods with the Resistograph. Master’s Thesis, Delft University of Technology, Delft, The Netherlands, 2018. [Google Scholar]
  90. Nutto, L.; Biechele, T. Drilling resistance measurement and the effect of shaft friction–using feed force information for improving decay identification on hard tropical wood. In Proceedings of the 19th International Nondestructive Testing and Evaluation of Wood Symposium, Rio de Janeiro, Brazil, 22–25 September 2015. [Google Scholar]
  91. Sharapov, E.; Wang, X.; Smirnova, E.; Wacker, J.P. Wear behavior of drill bits in wood drilling resistance measurements. Wood Fiber Sci. 2018, 50, 154–166. [Google Scholar] [CrossRef]
  92. Walach, D.; Jaskowska-Lemanska, J.; Dybel, P. The impact of moisture content of wood on the results of non-destructive tests. Ann. Warsaw Univ. Life Sci. SGGW For. Wood Technol. 2015, 92, 448–454. [Google Scholar]
  93. Sharapov, E.; Brischke, C.; Militz, H.; Smirnova, E. Combined effect of wood moisture content, drill bit rotational speed and feed rate on drilling resistance measurements in Norway spruce (Picea abies (L.) Karst.). Wood Mater. Sci. Eng. 2018, 1–7. [Google Scholar] [CrossRef]
  94. Carrillo, I.; Valenzuela, S.; Elissetche, J.P. Comparative evaluation of Eucalyptus globulus and E. nitens wood and fibre quality. IAWA J. 2017, 38, 105–116. [Google Scholar] [CrossRef]
  95. Drew, D.M.; Downes, G. A model of stem growth and wood formation in Pinus radiata. Trees 2015, 29, 1395–1413. [Google Scholar] [CrossRef]
  96. Launay, J.; Rozenberg, P.; Paques, L.; Dewitte, J.-M. A new experimental device for rapid measurement of the trunk equivalent modulus of elasticity on standing trees. Ann. For. Sci. 2000, 57, 351–359. [Google Scholar] [CrossRef]
  97. Koizumi, A.; Ueda, K. Estimation of the mechanical properties of standing trees by non-destructive bending tests. Mokuzai Gakkashi 1986, 39, 669–676. [Google Scholar]
  98. Koizumi, A.; Takada, K.; Ueda, K.; Katayose, T. Radial growth and wood quality of plus trees of Japanese larch. I. Radial growth, density, trunk modulus of elasticity of grafted clones. Mokuzai Gakkaishi 1990, 36, 98–102. [Google Scholar]
  99. Vafai, A.; Farshad, M. Modulus of elasticity of wood in standing tree. Wood Sci. 1979, 12, 93–97. [Google Scholar]
  100. Langbour, P. Rigidité de L’arbre sur Pied, Indicateur de L’élasticité Longitudinale du Bois, Application Aux Peupliers. Ph.D. Thesis, INPL, Nancy, France, 1989. [Google Scholar]
  101. Milne, R.; Blackburn, P. The elasticity and vertical distribution of stress within stems of Picea sitchensis. Tree Physiol. 1989, 5, 195–205. [Google Scholar] [CrossRef]
  102. Launay, J.; Ivkovich, M.; Bastien, C.; Higelin, P.; Rozenberg, P.; Paques, L. Rapid measurement of trunk MOE on standing trees using RIGIDIMETER. Ann. For. Sci. 2002, 59, 465–469. [Google Scholar] [CrossRef] [Green Version]
  103. Pâques, L.E.; Rozenberg, P. Ranking larch genotypes with the Rigidimeter: Relationships between modulus of elasticity of standing trees and of sawn timber. Ann. For. Sci. 2009, 66, 414. [Google Scholar] [CrossRef]
  104. Takada, K.; Koizumi, A.; Ueda, K. Geographic variation in the moduli of elasticity of tree trunks among Japanese larch in provenance trial-stands. Mokuzai Gakkaishi 1992, 38, 222–227. [Google Scholar]
  105. Takata, K.; Teraoka, Y. Genotypic effects on the variation of wood quality and growth traits in plantation forest made by cutting cultivars of Japanese cedar. J. Wood Sci. 2002, 48, 106–113. [Google Scholar] [CrossRef]
  106. Pâques, L.E. Roles of European and Japanese larch in the genetic control of growth, architecture and wood quality traits in interspecific hybrids (Larix eurolepis Henry). Ann. For. Sci. 2004, 61, 25–33. [Google Scholar] [CrossRef]
  107. Pâques, L.E.; Millier, F.; Rozenberg, P. Selection perspectives for genetic improvement of wood stiffness in hybrid larch (Larix x eurolepis Henry). Tree Genet. Genomes 2010, 6, 83–92. [Google Scholar] [CrossRef]
  108. Rozenberg, P.; Franc, A.; Mamdy, C.; Launay, J.; Schermann, N.; Bastien, J.C. Genetic control of stiffness of standing Douglas fir; from the standing stem to the standardised wood sample, relationships between modulus of elasticity and wood density parameters. Part II. Annales des Sciences Forestières 1999, 56, 145–154. [Google Scholar] [CrossRef]
  109. Sandak, J.; Sandak, A.; Meder, R. Assessing Trees, Wood and Derived Products with near Infrared Spectroscopy: Hints and Tips. J. Near Infrared Spectrosc. 2016, 24, 485–505. [Google Scholar] [CrossRef] [Green Version]
  110. Ben-Gera, I.; Norris, K.H. Determination of moisture content in soybeans by direct spectrophotometry. Israel J. Agric. Res. 1968, 18, 125–132. [Google Scholar]
  111. Birkett, M.D.; Gambino, M.J.T. Potential applications for near infrared spectroscopy in the pulping industry. Pap. S. Afr. 1988, 34–38. [Google Scholar]
  112. Birkett, M.D.; Gambino, M.J.T. Estimation of pulp kappa number with near-infrared spectroscopy. Tappi J. 1989, 72, 193–197. [Google Scholar]
  113. Tsuchikawa, S.; Kobori, H. A review of recent application of near infrared spectroscopy to wood science and technology. J. Wood Sci. 2015, 61, 213–220. [Google Scholar] [CrossRef] [Green Version]
  114. Schimleck, L.R.; Rezende, G.D.S.P.; Demuner, B.J.; Downes, G.M. Estimation of whole-tree wood quality traits using near infrared spectra from increment cores. Appita J. 2006, 59, 231. [Google Scholar]
  115. Schimleck, L.R.; Kube, P.D.; A Raymond, C.; Michell, A.J.; French, J. Estimation of whole-tree kraft pulp yield of Eucalyptus nitens using near-infrared spectra collected from increment cores. Can. J. For. Res. 2005, 35, 2797–2805. [Google Scholar] [CrossRef]
  116. Meder, R.; Trung, T.; Schimleck, L.; Schimleck, L. Seeing the Wood in the Trees: Unleashing the Secrets of Wood via near Infrared Spectroscopy. J. Near Infrared Spectrosc. 2010, 18, 3. [Google Scholar] [CrossRef]
  117. Downes, G.M.; Meder, R.; Luff, R.; Catela, F. Quality Assessment of Australian Woodchips Project 4: Rapid Field-Based Assessment of Pulpwood Quality in Standing Trees; CSIRO FFP Client Report 1658; FWPRDC Project PN04.2008; 2006; unpublished. [Google Scholar]
  118. Downes, G.M.; Meder, R.; Ebdon, N.; Menz, D.; Hicks, C. Quality Assessment of Australian Woodchips Project 5: Field-Based Application of Acoustic Velocity and NIR as Predictors of Pulp Quality Across Site and Species; CSIRO FFP Client Report No. 1895; FWPA PN07.3027; unpublished.
  119. Meder, R.; Brawner, J.T.; Downes, G.M.; Ebdon, N. Towards the in-forest Assessment of Kraft Pulp Yield: Comparing the Performance of Laboratory and Hand-Held Instruments and Their Value in Screening Breeding Trials. J. Near Infrared Spectrosc. 2011, 19, 421–429. [Google Scholar] [CrossRef]
  120. Muneri, A.; Asada, T.; Tomita, K.; Kusunoki, K.; Szota, C. Between-tree variation in stem volume, wood density, fibre length and Kraft pulping properties of Eucalyptus globulus and the utility of field-portable NIR Spectroscopy and wood cores in evaluating pulpwood quality properties of standing trees. Appita J. 2011, 64, 356–361. [Google Scholar]
  121. Giroud, G.; Begin, J.; Defo, M.; Ung, C.H. Regional variation in wood density and modulus of elasticity of Quebec’s main boreal tree species. For. Ecol. Manag. 2017, 400, 289–299. [Google Scholar] [CrossRef]
  122. Evans, R. A variance approach to the x ray diffractometric estimation of microfibril angle in wood. Appita J. 1999, 52, 283–289. [Google Scholar]
  123. Smith, D.M. Microscopic Methods for Determining Cross-Sectional Cell Dimensions; US Forest Service: Madison, WI, USA, 1967.
  124. Evans, R. Wood stiffness by x-ray diffractometry. In Characterisation of the Cellulosic Cell Wall; Stokke, D., Groom, L., Eds.; Blackwell Publishing: Ames, IA, USA, 2006; pp. 138–146. [Google Scholar]
  125. Allen, K.J.; Drew, D.M.; Downes, G.M.; Evans, R.; Cook, E.R.; Battaglia, M.; Baker, P.J.; Baker, P. A strong regional temperature signal in low-elevation Huon pine. J. Quat. Sci. 2013, 28, 433–438. [Google Scholar] [CrossRef]
  126. Allen, K.J.; Cook, E.R.; Evans, R.; Francey, R.; Buckley, B.M.; Palmer, J.G.; Peterson, M.J.; Baker, P.J. Lack of cool, not warm, extremes distinguishes late 20th Century climate in 979-year Tasmanian summer temperature reconstruction. Environ. Res. Lett. 2018, 13, 034041. [Google Scholar] [CrossRef]
  127. Downes, G.M.; Wimmer, R.; Evans, R. Understanding wood formation: Gains to commercial forestry through tree-ring research. Dendrochronologia 2002, 20, 37–51. [Google Scholar] [CrossRef]
  128. Downes, G.M.; Nyakuengama, J.G.; Evans, R.; Northway, R.N.; Blakemore, P.; Dickson, R.; Lausberg, M. Relationship between wood density, microfibril angle and stiffness in thinned and fertilized Pinus radiata (D. Don). IAWA J. 2002, 23, 253–266. [Google Scholar] [CrossRef]
  129. Drew, D.M.; Downes, G.M.; Evans, R. Short-term growth responses and associated wood density fluctuations in variously irrigated Eucalyptus globulus. Trees 2010, 25, 153–161. [Google Scholar] [CrossRef]
  130. Drew, D.M.; Allen, K.; Downes, G.M.; Evans, R.; Battaglia, M.; Baker, P. Wood properties in a long-lived conifer reveal strong climate signals where ring-width series do not. Tree Physiol. 2013, 33, 37–47. [Google Scholar] [CrossRef]
  131. Evans, R.; Downes, G.M.; Murphy, J.O. Application of new wood characterisation technology to dendrochronology. In Proceedings of the Tree Rings, Environment and Humanity, Tucson, AZ, USA, 17–21 May 1996. [Google Scholar]
  132. O’Donnell, A.J.; Allen, K.J.; Evans, R.M.; Cook, E.R.; Trouet, V.; Baker, P.J. Wood density provides new opportunities for reconstructing past temperature variability from southeastern Australian trees. Glob. Planet. Chang. 2016, 141, 1–11. [Google Scholar] [CrossRef] [Green Version]
  133. Read, J.; Evans, R.; Sanson, G.D.; Kerr, S.; Jaffré, T. Wood properties and trunk allometry of co-occurring rainforest canopy trees in a cyclone-prone environment. Am. J. Bot. 2011, 98, 1762–1772. [Google Scholar] [CrossRef]
  134. Andreassen, K.; Børja, I.; Dalsgaard, L.; Karlsson, B.; Tollefsrud, M.; Solberg, S.; Rosner, S.; Světlík, J.; Evans, R. Wood density as a screening trait for drought sensitivity in Norway spruce. Can. J. For. Res. 2014, 44, 154–161. [Google Scholar]
  135. Rosner, S.; Luss, S.; Světlík, J.; Andreassen, K.; Børja, I.; Dalsgaard, L.; Evans, R.; Tveito, O.E.; Solberg, S. Chronology of hydraulic vulnerability in trunk wood of conifer trees with and without symptoms of top dieback. J. Plant Hydraul. 2016, 3, 1. [Google Scholar] [CrossRef] [Green Version]
  136. Rosner, S.; Světlík, J.; Andreassen, K.; Børja, I.; Dalsgaard, L.; Evans, R.; Luss, S.; Tveito, O.E.; Solberg, S. Novel Hydraulic Vulnerability Proxies for a Boreal Conifer Species Reveal That Opportunists May Have Lower Survival Prospects under Extreme Climatic Events. Front. Plant Sci. 2016, 7, 229. [Google Scholar] [CrossRef]
  137. Rosner, S.; Gierlinger, N.; Klepsch, M.; Karlsson, B.; Evans, R.; Lundqvist, S.-O.; Svĕtlík, J.; Børja, I.; Dalsgaard, L.; Andreassen, K.; et al. Hydraulic and mechanical dysfunction of Norway spruce sapwood due to extreme summer drought in Scandinavia. For. Ecol. Manag. 2018, 409, 527–540. [Google Scholar] [CrossRef]
  138. Wimmer, R.; Downes, G.M.; Evans, R. High-resolution analysis of radial growth and wood density in Eucalyptus nitens, grown under different irrigation regimes. Ann. For. Sci. 2002, 59, 519–524. [Google Scholar] [CrossRef]
  139. Downes, G.M.; Wimmer, R.; Evans, R. Temporal variation of microfibril angle in Eucalyptus nitens grown in different irrigation regimes. Tree Physiol. 2002, 22, 449–457. [Google Scholar] [Green Version]
  140. Wimmer, R.; Downes, G.; Evans, R.; French, J. Effects of site on fibre, kraft pulp and handsheet properties of Eucalyptus globulus. Ann. For. Sci. 2008, 65, 602. [Google Scholar] [CrossRef]
  141. Xu, J.-M.; Lü, J.-X.; Bao, F.-C.; Huang, R.-F.; Liu, X.-D.; Evans, R.; Zhao, Y.-K. Response of wood density of Picea crassifolia to climate change in Qilian Mountains of North-Western China. J. Beijing For. Univ. 2011, 33, 115–121. [Google Scholar]
  142. Dungey, H.S.; Matheson, A.C.; Kain, D.; Evans, R. Genetics of wood stiffness and its component traits in Pinus radiata. Can. J. For. Res. 2006, 36, 1165–1178. [Google Scholar] [CrossRef]
  143. Baltunis, B.S.; Wu, H.X.; Powell, M.B. Inheritance of density, microfibril angle, and modulus of elasticity in juvenile wood of Pinus radiata at two locations in Australia. Can. J. For. Res. 2007, 37, 2164–2174. [Google Scholar] [CrossRef]
  144. Lindström, H.; Evans, R.; Reale, M. Implications of selecting tree clones with high modulus of elasticity. N. Z. J. For. Sci. 2005, 35, 50–71. [Google Scholar]
  145. Lindström, H.; Harris, P.; Sorensson, C.T.; Evans, R. Stiffness and wood variation of 3-year-old Pinus radiata clones. Wood Sci. Technol. 2005, 38, 579–597. [Google Scholar] [CrossRef]
  146. Macmillan, C.P.; Mansfield, S.D.; Stachurski, Z.H.; Evans, R.; Southerton, S.G. Fasciclin-like arabinogalactan proteins: Specialization for stem biomechanics and cell wall architecture in Arabidopsis and Eucalyptus. Plant J. 2010, 62, 689–703. [Google Scholar] [CrossRef]
  147. Nyakuengama, J.G.; Evans, R.; Matheson, A.C.; Spencer, D.J.; Vinden, P. Wood quality and quantitative genetics of Pinus radiata. Fibre traits and wood density. Appita J. 1999, 52, 348–357. [Google Scholar]
  148. Nyakuengama, J.G.; Matheson, A.C.; Evans, R.; Spencer, D.J.; Vinden, P. Effect of age on genetic control of Pinus radiata earlywood and latewood properties. Appita J. 2000, 53, 103–107. [Google Scholar]
  149. Shelbourne, C.J.A.; Evans, R.; Kibblewhite, R.P.; Low, C. Inheritance of tracheid transverse dimensions and wood density in radiata pine. Appita J. 1997, 50, 46–50. [Google Scholar]
  150. Vikram, V.; Cherry, M.L.; Briggs, D.; Cress, D.W.; Evans, R.; Howe, G.T. Stiffness of Douglas-fir lumber: Effects of wood properties and genetics. Can. J. For. Res. 2011, 41, 1160–1173. [Google Scholar] [CrossRef]
  151. Sorensson, C.; Cown, D.J.; Dungey, H.S.; Watt, M.S.; Evans, R. Determining the main and interactive effect of age and clone on wood density, microfibril angle, and modulus of elasticity for Pinus radiata. Can. J. For. Res. 2010, 40, 1550–1557. [Google Scholar]
  152. Buksnowitz, C.; Müller, U.; Evans, R.; Teischinger, A.; Grabner, M. The potential of SilviScan’s X-ray diffractometry method for the rapid assessment of spiral grain in softwood, evaluated by goniometric measurements. Wood Sci. Technol. 2008, 42, 95–102. [Google Scholar] [CrossRef]
  153. Chen, F.; Evans, R. A robust approach for vessel identification and quantification in eucalypt pulpwoods. Appita J. 2005, 58, 442–447. [Google Scholar]
  154. Chen, F.F.; Evans, R. Automated measurement of vessel properties in birch and poplar wood. Holzforschung 2010, 64, 369–374. [Google Scholar] [CrossRef]
  155. Evans, R. Rapid Measurement of the Transverse Dimensions of Tracheids in Radial Wood Sections from Pinus radiata. Holzforschung 1994, 48, 168–172. [Google Scholar] [CrossRef]
  156. Evans, R.; Downes, G.M.; Menz, D.N.J.; Stringer, S.L. Rapid measurement of variation in tracheid transverse dimensions in a radiata pine tree. Appita J. 1995, 48, 134–138. [Google Scholar]
  157. Evans, R.; Stuart, S.-A.; Van der Touw, J. Microfibril angle scanning of increment cores by x-ray densitometry. Appita J. 1996, 49, 411–414. [Google Scholar]
  158. Evans, R. Rapid scanning of microfibril angle in increment cores by x ray diffractometry. In Proceedings of the IAWA/IUFRO International Workshop on the Significance of Microfibril Angle to Wood Quality, Westport, New Zealand, 21–25 November 1997. [Google Scholar]
  159. Evans, R.; Hughes, M.; Menz, D. Microfibril angle variation by scanning x ray diffractometry. Appita J. 1999, 52, 363–367. [Google Scholar]
  160. Evans, R.; Ilic, J. Rapid prediction of wood stiffness from microfibril angle and density. For. Prod. J. 2011, 51, 53–57. [Google Scholar]
  161. Gureyev, T.E.; Evans, R.; Stuart, S.-A.; Cholewa, M. Quasi-one-dimensional tomography. J. Opt. Soc. Am. 1996, 13, 734. [Google Scholar] [CrossRef]
  162. Gureyev, T.E.; Evans, R. An extension to quasi-one-dimensional tomography. Appl. Opt. 1998, 37, 26–28. [Google Scholar] [CrossRef]
  163. Gureyev, T.E.; Evans, R. Tomography of objects with a priori known internal geometry. Inverse Probl. 1998, 14, 1469–1480. [Google Scholar] [CrossRef]
  164. Gureyev, T.E.; Evans, R. A method for measuring vessel-free density distribution in hardwoods. Wood Sci. Technol. 1999, 33, 31–42. [Google Scholar] [CrossRef]
  165. Gureyev, T.; Evans, R. A new method for rapid measurement of vessel-free density distribution in hardwoods. Appita J. 2000, 52, 226–230. [Google Scholar]
  166. Keunecke, D.; Mannes, D.; Niemz, P.; Lehmann, E.; Evans, R. SilviScan vs. neutron imaging to generate radial softwood density profiles. Wood Res. 2010, 55, 49–59. [Google Scholar]
  167. Long, J.M.; Conn, A.; Batchelor, W.J.; Evans, R. Comparison of methods to measure fibril angle in wood fibres. Appita J. 2000, 53, 206–209. [Google Scholar]
  168. Stuart, S.-A.; Evans, R. X-ray diffraction estimation of the microfibril angle variation in eucalypt increment cores. Appita J. 1995, 48, 197–200. [Google Scholar]
  169. Yang, J.L.; Evans, R. Prediction of MOE of eucalypt wood from microfibril angle and density. Holz als Roh und Werkstoff 2003, 61, 449–452. [Google Scholar] [CrossRef]
  170. Downes, G.M.; Evans, R.; Wimmer, R.; French, J.; Farrington, A.; Lock, P. Wood, pulp and handsheet relationships in plantation grown E. globulus. Appita J. 2003, 56, 221–228. [Google Scholar]
  171. Evans, R.; Kibblewhite, R.P.; Stringer, S. Kraft pulp fibre property prediction from wood properties in eleven radiata pine clones. Appita J. 1997, 50, 25–33. [Google Scholar]
  172. Evans, R.; Kibblewhite, R.P.; Lausberg, M. Relationships between wood and pulp properties of twenty-five 13-year-old radiata pine trees. Appita J. 1999, 52, 132–139. [Google Scholar]
  173. Jones, T.G.; Corson, S.R.; Evans, R. Relationships between wood and PRMP properties of 14-year-old radiata pine trees. Appita J. 2001, 54, 210–216. [Google Scholar]
  174. Kibblewhite, R.P.; Evans, R.; Riddell, M.J.C. Handsheet property prediction from kraft fibre and wood tracheid properties in eleven radiata pine clones. Appita J. 1997, 50, 131–138. [Google Scholar]
  175. Kibblewhite, R.P.; Evans, R.; Riddell, M.J.C. Prediction of whole-tree radiata pine kraft tracheid/fibre length from pith-to-bark strips taken 1.4 m from ground. Appita J. 2002, 55, 213–219. [Google Scholar]
  176. Kibblewhite, R.P.; Evans, R.; Riddell, M.J.C. Kraft handsheet, and wood tracheid and chemical property interrelationships for 50 individual radiata pine trees. Appita J. 2003, 56, 229–233. [Google Scholar]
  177. Kibblewhite, R.P.; Evans, R.; Riddell, M.J.C. Interrelationships between kraft handsheet, and wood fibre and chemical properties for the trees and logs of 29 Eucalyptus fastigata and 29 E. nitens. Appita J. 2004, 57, 317–325. [Google Scholar]
  178. Kibblewhite, R.P.; Evans, R.; Grace, J.C.; Riddell, M.J.C. Fibre length, microfibril angle and wood colour variation and interrelationships for two radiata pine trees with mild and severe compression wood. Appita J. 2005, 58, 316–322. [Google Scholar]
  179. Wimmer, R.; Downes, G.; Evans, R.; Rasmussen, G.; French, J. Direct Effects of Wood Characteristics on Pulp and Handsheet Properties of Eucalyptus globulus. Holzforschung 2002, 56, 244–252. [Google Scholar] [CrossRef]
  180. Evans, R.; Stringer, S.L.; Kibblewhite, R.P. Variation in microfibril angle, density and fibre orientation in twenty-nine Eucalyptus nitens trees. Appita J. 2001, 53, 450–457. [Google Scholar]
  181. Hillis, W.; Evans, R.; Washusen, R. An unusual formation of tension wood in a natural forest Acacia sp. Holzforschung 2004, 58, 241–245. [Google Scholar] [CrossRef]
  182. Keunecke, D.; Evans, R.; Niemz, P. Microstructural properties of common yew and Norway spruce determined with SilviScan. IAWA J. 2009, 30, 165–178. [Google Scholar] [CrossRef]
  183. Kibblewhite, R.P.; Evans, R.; Riddell, M.J.C.; Shelbourne, C.J.A. Changes in density and wood-fibre properties with height position in 15/16-year-old Eucalyptus nitens and E. fastigata. Appita J. 2004, 57, 240–247. [Google Scholar]
  184. Kibblewhite, R.P.; Suckling, I.D.; Evans, R.; Grace, J.C.; Riddell, M.J. Lignin and carbohydrate variation with earlywood, latewood, and compression wood content of bent and straight ramets of a radiata pine clone. Holzforschung 2010, 64, 101–109. [Google Scholar] [CrossRef]
  185. Lachenbruch, B.; Johnson, G.R.; Downes, G.M.; Evans, R. Relationships of density, microfibril angle, and sound velocity with stiffness and strength in mature wood of Douglas-fir. Can. J. For. Res. 2010, 40, 55–64. [Google Scholar] [CrossRef]
  186. Lachenbruch, B.; Moore, J.R.; Evans, R. Radial Variation in Wood Structure and Function in Woody Plants, and Hypotheses for Its Occurrence. Tree Physiol. 2011, 4, 121–164. [Google Scholar]
  187. Lanvermann, C.; Evans, R.; Schmitt, U.; Hering, S.; Niemz, P. Distribution of structure and lignin within growth rings of Norway spruce. Wood Sci. Technol. 2013, 47, 627–641. [Google Scholar] [CrossRef] [Green Version]
  188. Macmillan, C.P.; O’Donnell, P.J.; Smit, A.-M.; Evans, R.; Stachurski, Z.H.; Torr, K.; West, M.; Baltunis, J.; Strabala, T.J. A survey of the natural variation in biomechanical and cell wall properties in inflorescence stems reveals new insights into the utility of Arabidopsis as a wood model. Funct. Plant Boil. 2013, 40, 662–676. [Google Scholar] [CrossRef] [Green Version]
  189. McLean, J.P.; Evans, R.; Moore, J.R. Predicting the longitudinal modulus of elasticity of Sitka spruce from cellulose orientation and abundance. Holzforschung 2010, 64, 495–500. [Google Scholar] [CrossRef]
  190. Mishnaevsky, L.; Freere, P.; Sharma, R.; Brøndsted, P.; Qing, H.; Bech, J.I.; Sinha, R.; Acharya, P.; Evans, R. Strength and Reliability of Wood for the Components of Low-cost Wind Turbines: Computational and Experimental Analysis and Applications. Wind. Eng. 2009, 33, 183–196. [Google Scholar] [CrossRef]
  191. Washusen, R.; Evans, R. Prediction of shrinkage in solid-wood during drying from cellulose crystallite width in one 11-year-old tree of Eucalyptus globulus Labill. Aust. For. 2001, 64, 123–126. [Google Scholar] [CrossRef]
  192. Washusen, R.; Evans, R. The association between cellulose crystallite width and tension wood occurrence in Eucalyptus globulus Labill. IAWA J. 2001, 22, 235–243. [Google Scholar] [CrossRef]
  193. Washusen, R.; Ades, P.; Evans, R.; Ilic, J.; Vinden, P. Relationships between Density, Shrinkage, Extractives Content and Microfibril Angle in Tension Wood from Three Provenances of 10-Year-Old Eucalyptus globulus Labill. Holzforschung 2001, 55, 176–182. [Google Scholar] [CrossRef]
  194. Washusen, R.; Evans, R.; Southerton, S. A study of Eucalyptus grandis and E. globulus branch wood microstructure. IAWA J. 2005, 26, 203–210. [Google Scholar] [CrossRef]
  195. Xu, P.; Donaldson, L.A.; Walker, J.C.F.; Evans, R.; Downes, G. low-stiffness wood in radiata pine butt log part 1: Effects of density and microfibril angle on the vertical variation of wood stiffness. Holzforschung 2004, 58, 273–286. [Google Scholar] [CrossRef]
  196. Yang, J.L.; Ilic, J.; Evans, R.; Fife, D. Interrelationships between shrinkage properties, microfibril angle and cellulose crystallite width in 10-year old Eucalyptus globulus Labill. N. Z. J. For. Sci. 2003, 33, 47–61. [Google Scholar]
  197. Yang, J.L.; Bailleres, H.; Evans, R.; Downes, G. Evaluating growth strain of Eucalyptus globulus Labill. from SilviScan measurements. Holzforschung 2006, 60, 574–579. [Google Scholar] [CrossRef]
  198. Raymond, C.A.; Schimleck, L.R. Development of near infrared reflectance analysis calibrations for estimating genetic parameters for cellulose content in Eucalyptus globulus. Can. J. For. Res. 2002, 32, 170–176. [Google Scholar] [CrossRef]
  199. Wallis, A.F.A.; Evans, R.; Newman, R.H.; Roick, U.C.; Suckling, I.D. Changes in Cellulose Crystallinity During Kraft Pulping. Comparison of Infrared, X-ray Diffraction and Solid State NMR Results. Holzforschung 1995, 49, 498–504. [Google Scholar]
  200. Schimleck, L.R.; Evans, R.; Ilic, J. Estimation of Eucalyptus delegatensis wood properties by NIR spectroscopy. Can. J. For. Res. 2001, 31, 1671–1675. [Google Scholar] [CrossRef]
  201. Schimleck, L.R.; Evans, R.; Matheson, A.C. Estimation of Pinus radiata D. Don clear wood properties by near-infrared spectroscopy. J. Wood Sci. 2002, 48, 132–137. [Google Scholar] [CrossRef]
  202. Schimleck, L.R.; Evans, R. Estimation of wood stiffness of increment cores by near infrared spectroscopy: The development and application of calibrations based on selected cores. IAWA J. 2002, 23, 217–224. [Google Scholar] [CrossRef]
  203. Schimleck, L.R.; Evans, R. estimation of microfibril angle of increment cores by near infrared spectroscopy. IAWA J. 2002, 23, 225–234. [Google Scholar] [CrossRef]
  204. Schimleck, L.R.; Matheson, A.C.; Evans, R.; Ilic, J. Estimation of wood stiffness of increment cores by near-infrared spectroscopy. Can. J. For. Res. 2002, 32, 129–135. [Google Scholar] [CrossRef]
  205. Schimleck, L.R.; Evans, R. Estimation of air-dry density of increment cores by near infrared spectroscopy. Appita J. 2003, 56, 312–317. [Google Scholar]
  206. Schimleck, L.R.; Evans, R. Estimation of P. radiata D. Don tracheid morphological characteristics by near infrared spectroscopy. Holzforschung 2004, 58, 66–73. [Google Scholar] [CrossRef]
  207. Schimleck, L.R.; Downes, G.M.; Evans, R. Estimation of Eucalyptus nitens wood properties by near infrared spectroscopy. Appita J. 2006, 59, 136–141. [Google Scholar]
  208. Schimleck, L.R.; Espey, C.; Mora, C.R.; Evans, R.; Taylor, A.; Muniz, G. Characterization of the wood quality of pernambuco (Caesalpinia echinata Lam) by measurements of density, extractives content, microfibril angle, stiffness, color, and NIR spectroscopy. Holzforschung 2009, 63, 457–463. [Google Scholar] [CrossRef]
  209. Stackpole, D.J.; Vaillancourt, R.E.; Alves, A.; Rodrigues, J.; Potts, B.M. Genetic Variation in the Chemical Components of Eucalyptus globulus Wood. G3 Genes|Genomes|Genetics 2011, 1, 151–159. [Google Scholar] [CrossRef] [Green Version]
  210. Raymond, C.; Schimleck, L.; Muneri, A.; Mitchell, A.J. Genetic parameters and genotype-by-environment interactions for pulp yield predicted using near infrared reflectance analysis and pulp productivity in Eucalyptus globulus. For. Genet. 2001, 8, 213–224. [Google Scholar]
  211. Poke, F.S.; Raymond, C.A. Predicting Extractives, Lignin, and Cellulose Contents Using Near Infrared Spectroscopy on Solid Wood in Eucalyptus globulus. J. Wood Chem. Technol. 2006, 26, 187–199. [Google Scholar] [CrossRef]
  212. Schimleck, L.R.; Kube, P.D.; Raymond, A.C. Genetic improvement of kraft pulp yield in Eucalyptus nitens using cellulose content determined by near infrared spectroscopy. Can. J. For. Res. 2004, 34, 2363–2370. [Google Scholar] [CrossRef]
  213. Brawner, J.T.; Meder, R.; Dieters, M.; Lee, D.J. Selection of Corymbia citriodora for pulp productivity. South For. 2012, 74, 121–131. [Google Scholar] [CrossRef]
  214. Hung, T.D.; Brawner, J.T.; Meder, R.; Lee, D.J.; Southerton, S.; Thinh, H.H.; Dieters, M.J. Estimates of genetic parameters for growth and wood properties in Eucalyptus pellita F. Muell. to support tree breeding in Vietnam. Ann. For. Sci. 2015, 72, 205–217. [Google Scholar] [CrossRef]
  215. Healey, A.L.; Downes, G.; Herberling, M.; Gore, P.L.; Hardner, C.M. Improving prediction accuracy and selection of open-pollinated seed-lots in Eucalyptus dunnii Maiden using a multivariate mixed model approach. Ann. For. Sci. 2016, 73, 1035–1046. [Google Scholar] [Green Version]
  216. Varghese, M.; Harwood, C.E.; Bush, D.J.; Baltunis, B.; Kamalakannan, R.; Suraj, P.G.; Hegde, D.; Meder, R. Growth and wood properties of natural provenances, local seed sources and clones of Eucalyptus camaldulensis in southern India: Implications for breeding and deployment. New For. 2017, 48, 67–82. [Google Scholar] [CrossRef]
  217. Perez, D.D.S.; Guillemain, A.; Alazard, P.; Plomion, C.; Rozenberg, P.; Rodrigues, J.C.; Alves, A.; Chantre, G. Improvement of Pinus pinaster Ait elite trees selection by combining near infrared spectroscopy and genetic tools. Holzforschung 2007, 61, 611–622. [Google Scholar]
  218. Thamarus, K.; Groom, K.; Bradley, A.; Raymond, C.A.; Schimleck, L.R.; Williams, E.R.; Moran, G.F.; Raymond, C. Identification of quantitative trait loci for wood and fibre properties in two full-sib pedigrees of Eucalyptus globulus. Theor. Appl. Genet. 2004, 109, 856–864. [Google Scholar] [CrossRef]
  219. Freeman, J.S.; Whittock, S.P.; Potts, B.M.; Vaillancourt, R.E. QTL influencing growth and wood properties in Eucalyptus globulus. Tree Genet. Genomes 2009, 5, 713–722. [Google Scholar] [CrossRef] [Green Version]
  220. Freeman, J.S.; Potts, B.M.; Downes, G.M.; Pilbeam, D.; Thavamanikumar, S.; Vaillancourt, R.E. Stability of quantitative trait loci for growth and wood properties across multiple pedigrees and environments inEucalyptus globulus. New Phytol. 2013, 198, 1121–1134. [Google Scholar] [CrossRef] [Green Version]
  221. Thumma, B.R.; Matheson, B.A.; Zhang, D.; Meeske, C.; Meder, R.; Downes, G.M.; Southerton, S.G. Identification of a Cis-Acting Regulatory Polymorphism in a Eucalypt COBRA-Like Gene Affecting Cellulose Content. Genetics 2009, 183, 1153–1164. [Google Scholar] [CrossRef] [Green Version]
  222. Thumma, B.R.; Southerton, S.G.; Bell, J.C.; Owen, J.V.; Henery, M.L.; Moran, G.F. Quantitative trait locus (QTL) analysis of wood quality traits in Eucalyptus nitens. Tree Genet. Genomes 2010, 6, 305–317. [Google Scholar] [CrossRef]
  223. Southerton, S.G.; Macmillan, C.P.; Bell, J.C.; Bhuiyan, N.; Dowries, G.; Ravenwood, I.C.; Joyce, K.R.; Williams, D.; Thumma, B.R. Association of allelic variation in xylem genes with wood properties in Eucalyptus nitens. Aust. For. 2010, 73, 259–264. [Google Scholar] [CrossRef]
  224. Thavamanikumar, S.; McManus, L.J.; Ades, P.K.; Bossinger, G.; Stackpole, D.J.; Kerr, R.; Hadjigol, S.; Freeman, J.S.; Vaillancourt, R.E.; Zhu, P.; et al. Association mapping for wood quality and growth traits in Eucalyptus globulus ssp. globulus Labill identifies nine stable marker-trait associations for seven traits. Tree Genet. Genomes 2014, 10, 1661–1678. [Google Scholar] [CrossRef]
  225. Schimleck, L.; Raymond, C.A.; Beadle, C.L.; Downes, G.M.; Kube, P.D.; French, J. Applications of NIR spectroscopy to forest research. Appita J. 2000, 53, 458–464. [Google Scholar]
  226. Downes, G.; Meder, R.; Hicks, C.; Ebdon, N. Developing and evaluating a multisite and multispecies NIR calibration for the prediction of Kraft pulp yield in eucalypts. South. For. J. For. Sci. 2009, 71, 155–164. [Google Scholar] [CrossRef]
  227. Mora, C.R.; Schimleck, L.R. On the selection of samples for multivariate regression analysis: Application to near-infrared (NIR) calibration models for the prediction of pulp yield inEucalyptus nitens. Can. J. For. Res. 2008, 38, 2626–2634. [Google Scholar] [CrossRef]
  228. Downes, G.; Meder, R.; Harwood, C. A Multi-Site, Multi-Species near Infrared Calibration for the Prediction of Cellulose Content in Eucalypt Woodmeal. J. Near Infrared Spectrosc. 2010, 18, 381–387. [Google Scholar] [CrossRef]
  229. Downes, G.M.; Meder, R.; Bond, H.; Ebdon, N.; Hicks, C.; Harwood, C. Measurement of cellulose content, Kraft pulp yield and basic density in eucalypt woodmeal using multisite and multispecies near infra-red spectroscopic calibrations. South. For. J. For. Sci. 2011, 73, 181–186. [Google Scholar] [CrossRef]
  230. Schimleck, L.R.; Peter, G.F.; Daniels, R.F.; Iii, A.C.; Jones, P.D. Nondestructive estimation of Pinus taeda L. wood properties for samples from a wide range of sites in Georgia. Can. J. For. Res. 2005, 35, 85–92. [Google Scholar]
  231. Schimleck, L.R.; Michell, A.J. Determination of within-tree variation of kraft pulp yield using near-infrared spectroscopy. Tappi J. 1998, 81, 229–236. [Google Scholar]
  232. Downes, G.M.; Meder, R.; Ebdon, N.; Bond, H.; Evans, R.; Joyce, K.; Southerton, S. Radial Variation in Cellulose Content and Kraft Pulp Yield in Eucalyptus Nitens using Near-Infrared Spectral Analysis of Air-Dry Wood Surfaces. J. Near Infrared Spectrosc. 2010, 18, 147–154. [Google Scholar] [CrossRef]
  233. Downes, G.M.; Harwood, C.E.; Wiedemann, J.; Ebdon, N.; Bond, H.; Meder, R. Radial variation in Kraft pulp yield and cellulose content in Eucalyptus globulus wood across three contrasting sites predicted by near infrared spectroscopy. Can. J. For. Res. 2012, 42, 1577–1586. [Google Scholar] [CrossRef]
  234. Meder, R.; Marston, D.; Ebdon, N.; Evans, R. Spatially-Resolved Radial Scanning of Tree Increment Cores for near Infrared Prediction of Microfibril Angle and Chemical Composition. J. Near Infrared Spectrosc. 2010, 18, 499–505. [Google Scholar] [CrossRef]
  235. Gierlinger, N.; Wimmer, R. Radial distribution of heartwood extractives and lignin in mature European larch. Wood Fiber Sci. 2004, 36, 387–394. [Google Scholar]
  236. Wentzel-Vietheer, M.; Washusen, R.; Downes, G.M.; Harwood, C.; Ebdon, N.; Ozarska, B.; Baker, T. Prediction of non-recoverable collapse in Eucalyptus globulus from near infrared scanning of radial wood samples. Eur. J. Wood Wood Prod. 2013, 71, 755–768. [Google Scholar] [CrossRef]
  237. Mora, C.R.; Schimleck, L.R. Determination of within-tree variation of Pinus taeda wood properties by near infrared spectroscopy. Part 2: Whole-tree wood property maps. Appita J. 2009, 62, 232–238. [Google Scholar]
  238. Lundqvist, S.-O.; Ekenstedt, F.; Hedenberg, O.; Twaddle, A. Wood and fiber properties of loblolly pine in the southeast USA. Variations and prediction models. In Proceedings of the 5th Workshop, Connection Between Forest Resources and Wood Quality: Modelling Approaches and Simulation Software, Waiheke Island Resort, New Zealand, 20–27 November 2005. [Google Scholar]
  239. Downes, G.M.; Touza, M.; Harwood, C.; Wentzel-Vietheer, M. NIR detection of non-recoverable collapse in sawn boards of Eucalyptus globulus. Holz als Roh und Werkstiff 2014, 72, 563–570. [Google Scholar] [CrossRef]
  240. Thumm, A.; Riddell, M.; Nanayakkara, B.; Harrington, J.; Meder, R. Near Infrared Hyperspectral Imaging Applied to Mapping Chemical Composition in Wood Samples. J. Near Infrared Spectrosc. 2010, 18, 507–515. [Google Scholar] [CrossRef]
  241. Thumm, A.; Riddell, M.; Nanayakkara, B.; Harrington, J.; Meder, R. Mapping Within-Stem Variation of Chemical Composition by near Infrared Hyperspectral Imaging. J. Near Infrared Spectrosc. 2016, 24, 605–616. [Google Scholar] [CrossRef]
  242. Antony, F.; Jordan, L.; Schimleck, L.R.; Daniels, R.F.; Clark, A. The effect of mid-rotation fertilization on the wood properties of loblolly pine (Pinus taeda L.). IAWA J. 2009, 30, 49–58. [Google Scholar] [CrossRef]
  243. Bucur, V. An ultrasonic method for measuring the elastic constants of wood increment cores bored from living trees. Ultrasonics 1983, 21, 116–126. [Google Scholar] [CrossRef]
  244. Divós, F.; Tanaka, T. Effects of Creep on Modulus of Elasticity Determination of Wood. J. Vib. Acoust. 2000, 122, 90–92. [Google Scholar] [CrossRef]
  245. Payton, R.G. Wave fronts in wood. Q. J. Mech. Appl. Math. 2003, 56, 527–546. [Google Scholar] [CrossRef]
  246. Unterwieser, H.; Schickhofer, G. Influence of moisture content of wood on sound velocity and dynamic MOE of natural frequency- and ultrasonic runtime measurement. Eur. J. Wood Prod. 2011, 69, 171–181. [Google Scholar] [CrossRef]
  247. Li, Z.; Yang, D.-Q.; Liu, S.-L.; Yu, S.-Y.; Lu, M.-H.; Zhu, J.; Zhang, S.-T.; Zhu, M.-W.; Guo, X.-S.; Wu, H.-D.; et al. Broadband gradient impedance matching using an acoustic metamaterial for ultrasonic transducers. Sci. Rep. 2017, 7, 42863. [Google Scholar] [CrossRef]
  248. Fang, Y.; Lin, L.; Feng, H.; Lu, Z.; Emms, G.W. Review of the use of air-coupled ultrasonic technologies for nondestructive testing of wood and wood products. Comput. Electron. Agric. 2017, 137, 79–87. [Google Scholar] [CrossRef]
  249. Hutchins, D. Ultrasonic Generation by Pulsed Lasers. Phys. Acoust. 1988, 18, 21–123. [Google Scholar]
  250. Mason, E.G.; Hayes, M.; Pink, N. Validation of ultrasonic velocity estimates of wood properties in discs of radiata pine. N. Z. J. For. Sci. 2017, 47, 16. [Google Scholar] [CrossRef] [Green Version]
  251. Dahlen, J.; Auty, D.; Eberhardt, T.L.; Turnblom, E.; Lowell, E.; Schimleck, L.R.; Montes, C. Assessing the within-tree variation in stiffness from ultrasonic velocity and specific gravity measurements in Douglas-fir and loblolly pine. In Proceedings of the 21st International Nondestructive Testing and Evaluation of Wood Symposium, Freiburg, Germany, 24–27 September 2019. [Google Scholar]
  252. Harrington, J.J. Heirarchical Modelling of Softwood Hygro-Elastic Properties. Ph.D. Thesis, University of Canterbury, Christchurch, New Zealand, 2002. [Google Scholar]
  253. Johansson, G.; Kliger, R.; Perstorper, M. Quality of structural timber-product specification system required by end-users. Holz als Roh und Werkstoff 1994, 52, 42–48. [Google Scholar] [CrossRef]
  254. Perstorper, M.; Pellicane, P.; Kliger, I.; Johansson, G. Quality of timber products from Norway spruce Part 1. Optimization, key variables and experimental study. Wood Sci. Technol. 1995, 29, 157–170. [Google Scholar] [CrossRef]
  255. Johansson, M.; Perstorper, M.; Kliger, R.; Johansson, G. Distortion of Norway spruce timber Part 2. Modelling twist. Holz als Roh und Werkstoff 2001, 59, 155–162. [Google Scholar] [CrossRef]
  256. Kliger, R.; Johansson, M.; Perstorper, M.; Johansson, G. Distortion of Norway spruce timber Part 3. Modelling bow and spring. Holz als Roh und Werkstoff 2003, 61, 241–250. [Google Scholar] [CrossRef]
  257. Perstorper, M.; Pellicane, P.; Kliger, I.; Johansson, G. Quality of timber products from Norway spruce Part 3. Influence of spatial position and growth characteristics on bending stiffness and strength. Wood Sci. Technol. 1995, 29, 339–352. [Google Scholar]
  258. Ormarsson, S. Numerical Analysis of Moisture-Related Distortions in Sawn Timber. Ph.D. Thesis, Chalmers University of Technology, Gothenburg, Sweden, 1999. [Google Scholar]
  259. Xu, P.; Liu, H.; Evans, R.; Donaldson, L.A. Longitudinal shrinkage behaviour of compression wood in radiata pine. Wood Sci. Technol. 2009, 43, 423–439. [Google Scholar] [CrossRef]
  260. Harris, J.M.; Meylan, B.A. The influence of microfibril angle on longitudinal shrinkage and tangential shrinkage in Pinus radiata. Holzforschung 1965, 19, 144–153. [Google Scholar] [CrossRef]
  261. Meylan, B.A. Cause of high longitudinal shrinkage in wood. For. Prod. J. 1968, 18, 75–78. [Google Scholar]
  262. Meylan, B.A. The influence of microfibril angle on the longitudinal shrinkage-moisture content relationship. Wood Sci. Technol. 1972, 6, 293–301. [Google Scholar] [CrossRef]
  263. Pang, S. Predicting anisotropic shringkage of softwood Part 1: Theories. Wood Sci. Technol. 2002, 36, 75–91. [Google Scholar] [CrossRef]
  264. Riddell, M.; Cown, D.; Harrington, J.; Lee, J.; Moore, J. Assessing Spiral Grain Angle by Light Transmission: Proof of Concept. IAWA J. 2012, 33, 1–14. [Google Scholar] [CrossRef]
  265. Johansson, M.; Ormarsson, S. Influence of growth stresses and material properties on distortion of sawn timber—Numerical investigation. Ann. For. Sci. 2009, 66, 1–10. [Google Scholar] [CrossRef]
  266. Kimberley, M.O.; Moore, J.R.; Dungey, H.S. Modelling the effects of genetic improvement on radiata pine wood density. N. Z. J. For. Sci. 2016, 46, 241. [Google Scholar] [CrossRef]
  267. Moore, J.R.; Cown, D.J.; McKinley, R.B.; Sabatia, C.O. Effects of stand density and seedlot on three wood properties of young radiata pine grown at a dry-land site in New Zealand. N. Z. J. For. Sci. 2015, 45, 4. [Google Scholar] [CrossRef] [Green Version]
  268. Cnudde, V.; Boone, M.N. High-resolution X-ray computed tomography in geosciences: A review of the current technology and applications. Earth Sci. Rev. 2013, 123, 1–17. [Google Scholar] [CrossRef] [Green Version]
  269. Hounsfield, G.N. Computerized transverse axial scanning (tomography): Part 1. Description of system. Br. J. Radiol. 1973, 46, 1016–1022. [Google Scholar] [CrossRef]
  270. Van den Bulcke, J.; Wernersson, E.L.; Dierick, M.; Van Loo, D.; Masschaele, B.; Brabant, L.; Boone, M.N.; Van Hoorebeke, L.; Haneca, K.; Brun, A.; et al. 3D tree-ring analysis using helical X-ray tomography. Dendrochronologia 2014, 32, 39–46. [Google Scholar] [CrossRef]
  271. Bastin, J.-F.; Fayolle, A.; Tarelkin, Y.; Bulcke, J.V.D.; De Haulleville, T.; Mortier, F.; Beeckman, H.; Van Acker, J.; Serckx, A.; Bogaert, J.; et al. Wood Specific Gravity Variations and Biomass of Central African Tree Species: The Simple Choice of the Outer Wood. PLoS ONE 2015, 10, e0142146. [Google Scholar] [CrossRef]
  272. De Mil, T.; Hubau, W.; Angoboy Ilondea, B.; Rocha Vargas, M.A.; Boeckx, P.; Steppe, K.; Van Acker, J.; Beeckman, H.; Van den Bulcke, J. Asynchronous leaf and cambial phenology in a tree species of the Congo Basin requires space–time conversion of wood traits. Ann. Bot. 2019. [Google Scholar] [CrossRef]
  273. Dierick, M.; Van Loo, D.; Masschaele, B.; Bulcke, J.V.D.; Van Acker, J.; Cnudde, V.; Van Hoorebeke, L. Recent micro-CT scanner developments at UGCT. Nucl. Instrum. Methods Phys. Res. Sect. B Beam Interact. Mater. Atoms 2014, 324, 35–40. [Google Scholar] [CrossRef] [Green Version]
  274. Onoe, M.; Tsao, J.W.; Yamada, H.; Nakamura, H.; Kogure, J.; Kawamura, H.; Yoshimatsu, M. Computed tomography for measuring the annual rings of a live tree. Nucl. Instrum. Methods Phys. Res. 1984, 221, 213–220. [Google Scholar] [CrossRef]
  275. Freyburger, C.; Longuetaud, F.; Mothe, F.; Constant, T.; Leban, J.M. Measuring wood density by means of X-ray computer tomography. Ann. For. Sci. 2009, 66, 804. [Google Scholar] [CrossRef]
  276. Jacquin, P.; Mothe, F.; Longuetaud, F.; Billard, A.; Kerfriden, B.; Leban, J.-M. CarDen: A software for fast measurement of wood density on increment cores by, C.T. scanning. Comput. Electron. Agric. 2019, 156, 606–617. [Google Scholar] [CrossRef]
  277. Jacquin, P.; Longuetaud, F.; Leban, J.-M.; Mothe, F. X-ray microdensitometry of wood: A review of existing principles and devices. Dendrochronologia 2017, 42, 42–50. [Google Scholar] [CrossRef]
  278. De Mil, T.; Vannoppen, A.; Beeckman, H.; Van Acker, J.; Van den Bulcke, J. A field-to-desktop toolchain for X-ray, C.T. densitometry enables tree ring analysis. Ann. Bot. 2016, 117, 1187–1196. [Google Scholar] [CrossRef]
  279. Van den Bulcke, J.; Boone, M.A.; Dhaene, J.; Van Loo, D.; Van Hoorebeke, L.; Boone, M.N.; Wyffels, F.; Beeckman, H.; Van Acker, J.; De Mil, T. Advanced X-ray, C.T. scanning can boost tree-ring research for earth-system sciences. Ann. Bot. 2019. [Google Scholar] [CrossRef]
  280. Vannoppen, A.; Boeckx, P.; De Mil, T.; Kint, V.; Ponette, Q.; Bulcke, J.V.D.; Verheyen, K.; Muys, B. Climate driven trends in tree biomass increment show asynchronous dependence on tree-ring width and wood density variation. Dendrochronologia 2018, 48, 40–51. [Google Scholar] [CrossRef]
  281. Vanhellemont, M.; Sousa-Silva, R.; Maes, S.L.; Bulcke, J.V.D.; Hertzog, L.; De Groote, S.R.; Van Acker, J.; Bonte, D.; Martel, A.; Lens, L.; et al. Distinct growth responses to drought for oak and beech in temperate mixed forests. Sci. Total. Environ. 2019, 650, 3017–3026. [Google Scholar] [CrossRef]
  282. Maes, S.L.; Perring, M.P.; Vanhellemont, M.; Depauw, L.; Van den Bulcke, J.; Brūmelis, G.; Brunet, J.; Decocq, G.; den Ouden, J.; Härdtle, W.; et al. Environmental drivers interactively affect individual tree growth across temperate European forests. Glob. Chang. Biol. 2019, 25, 201–217. [Google Scholar] [CrossRef]
  283. De Mil, T.; Ilondea, B.A.; Maginet, S.; Duvillier, J.; Van Acker, J.; Beeckman, H.; Van den Bulcke, J. Cambial activity in the understory of the Mayombe forest, DR Congo. Trees 2017, 31, 49–61. [Google Scholar] [CrossRef]
  284. Van Camp, J.; Hubeau, M.; Van den Bulcke, J.; Van Acker, J.; Steppe, K. Cambial pinning relates wood anatomy to ecophysiology in the African tropical tree Maesopsis eminii. Tree Physiol. 2017, 38, 232–242. [Google Scholar] [CrossRef]
  285. Masschaele, B.; Dierick, M.; Van Loo, D.; Boone, M.N.; Brabant, L.; Pauwels, E.; Cnudde, V.; Van Hoorebeke, L. HECTOR: A 240kV micro-CT setup optimized for research. J. Phys. Conf. Ser. 2013, 463, 012012. [Google Scholar] [CrossRef]
  286. Svedström, K.; Lucenius, J.; Bulcke, J.V.D.; Van Loo, D.; Immerzeel, P.; Suuronen, J.-P.; Brabant, L.; Van Acker, J.; Saranpää, P.; Fagerstedt, K.; et al. Hierarchical structure of juvenile hybrid aspen xylem revealed using X-ray scattering and microtomography. Trees 2012, 26, 1793–1804. [Google Scholar] [CrossRef]
  287. Brereton, N.J.B.; Ahmed, F.; Sykes, D.; Ray, M.J.; Shield, I.; Karp, A.; Murphy, R.J. X-ray micro-computed tomography in willow reveals tissue patterning of reaction wood and delay in programmed cell death. BMC Plant Boil. 2015, 15, 83. [Google Scholar] [CrossRef]
  288. Van den Bulcke, J.; Boone, M.; Van Acker, J.; Stevens, M.; Van Hoorebeke, L. X-ray tomography as a tool for detailed anatomical analysis. Ann. For. Sci. 2009, 66, 1–12. [Google Scholar]
  289. Brodersen, C.R. Visualizing wood anatomy in three dimensions with high-resolution X-ray micro-tomography (μCT)—A review. IAWA J. 2013, 34, 408–424. [Google Scholar] [CrossRef]
  290. Koddenberg, T.; Militz, H. Morphological imaging and quantification of axial xylem tissue in Fraxinus excelsior L. through X-ray micro-computed tomography. Micron 2018, 111, 28–35. [Google Scholar] [CrossRef]
  291. Wagner, F.G.; Taylor, F.W.; Ladd, D.S.; McMillin, C.W.; Roder, F.L.; Ultrafast, C.T. scanning of an oak log for internal defects. For. Prod. J. 1989, 39, 62–64. [Google Scholar]
  292. Wei, Q.; Leblon, B.; La Rocque, A. On the use of X-ray computed tomography for determining wood properties: A review. Can. J. For. Res. 2011, 41, 2120–2140. [Google Scholar] [CrossRef]
  293. Chui, Y.H.; Wei, Q.; Zhang, S.Y.; LeBlon, B. Reconstruction of 3D images of internal log characteristics by means of successive 2D log computed tomography images. Holzforschung 2009, 63, 575–580. [Google Scholar]
  294. Krähenbühl, A.; Kerautret, B.; Debled-Rennesson, I.; Longuetaud, F.; Mothe, F. Knot Detection in X-Ray, C.T. Images of Wood. In Proceedings of the Computer Vision—ECCV, Florence, Italy, 7–13 October 2012. [Google Scholar]
  295. Roussel, J.R.; Mothe, F.; Krähenbühl, A.; Kerautret, B.; Debled-Rennesson, I.; Longuetaud, F. Automatic knot segmentation in, C.T. images of wet softwood logs using a tangential approach. Comput. Electron. Agric. 2014, 104, 46–56. [Google Scholar] [CrossRef]
  296. Cool, J.; Duchesne, I.; Belley, D.; Fredriksson, M. Knot detection in computed tomography images of partially dried jack pine (Pinus banksiana) and white spruce (Picea glauca) logs from a Nelder type plantation. Can. J. For. Res. 2017, 47, 910–915. [Google Scholar] [Green Version]
  297. Boukadida, H.; Longuetaud, F.; Colin, F.; Freyburger, C.; Constant, T.; Leban, J.-M.; Mothe, F. PithExtract: A robust algorithm for pith detection in computer tomography images of wood – Application to 125 logs from 17 tree species. Comput. Electron. Agric. 2012, 85, 90–98. [Google Scholar] [CrossRef]
  298. Sepúlveda, P.; Kline, D.E.; Oja, J. Prediction of fiber orientation in Norway spruce logs using an X-ray log scanner: A preliminary study. Wood Fiber Sci. 2007, 35, 421–428. [Google Scholar]
  299. Sepúlveda, P.; Oja, J.; Grönlund, A. Predicting spiral grain by computed tomography of Norway spruce. J. Wood Sci. 2002, 48, 479–483. [Google Scholar] [CrossRef]
  300. Petutschnigg, A.J.; Flach, M.; Katz, H. Decay recognition for spruce in CT-images. Holz als Roh und Werkstoff 2002, 60, 219–223. [Google Scholar] [CrossRef]
  301. Hattori, Y.; Kanagawa, Y. Non-destructive measurement of moisture distribution in wood with a medical X-ray, C.T. scanner, 1: Accuracy and influencing factors. Mokuzai Gakkaishi 1985, 31, 974–982. [Google Scholar]
  302. An, Y.; Schajer, G.S. Geometry-based, C.T. scanner for measuring logs in sawmills. Comput. Electron. Agric. 2014, 105, 66–73. [Google Scholar] [CrossRef]
  303. Fredriksson, M. Optimizing sawing of boards for furniture production using, C.T. log scanning. J. Wood Sci. 2015, 61, 474–480. [Google Scholar] [CrossRef]
  304. Rais, A.; Ursella, E.; Vicario, E.; Giudiceandrea, F. The use of the first industrial X-ray, C.T. scanner increases the lumber recovery value: Case study on visually strength-graded Douglas-fir timber. Ann. For. Sci. 2017, 74, 786. [Google Scholar] [CrossRef]
  305. Longuetaud, F.; Mothe, F.; Fournier, M.; Dlouhá, J.; Santenoise, P.; Deleuze, C. Within-stem maps of wood density and water content for characterization of species: A case study on three hardwood and two softwood species. Ann. For. Sci. 2016, 73, 601–614. [Google Scholar] [CrossRef]
  306. Stängle, S.M.; Brüchert, F.; Kretschmer, U.; Spiecker, H.; Sauter, U.H. Clear wood content in standing trees predicted from branch scar measurements with terrestrial LiDAR and verified with X-ray computed tomography. Can. J. For. Res. 2013, 44, 145–153. [Google Scholar] [CrossRef]
  307. Oja, J.; Grundberg, S.; Grönlund, A. Predicting the Stiffness of Sawn Products by X-ray Scanning of Norway Spruce Saw Logs. Scand. J. For. Res. 2001, 16, 88–96. [Google Scholar] [CrossRef]
  308. Song, J.; Brendel, O.; Bodénès, C.; Plomion, C.; Kremer, A.; Colin, F. X-ray computed tomography to decipher the genetic architecture of tree branching traits: Oak as a case study. Tree Genet. Genomes 2017, 13, 5. [Google Scholar] [CrossRef]
  309. Bjorklund, L.; Petersson, H. Predicting Knot Diameter of Pinus sylvestris in Sweden. Scand. J. For. Res. 1999, 14, 376–384. [Google Scholar] [CrossRef]
  310. Iiyama, K.; Wallis, A.F.A. An improved acetyl bromide procedure for determining lignin in woods and wood pulps. Wood Sci. Technol. 1988, 22, 271–280. [Google Scholar] [CrossRef]
  311. Rodrigues, J.; Faix, O.; Pereira, H. Improvement of the acetylbromide method for lignin determination within large scale screening programmes. Holz als Roh und Werkstoff 1999, 57, 341–345. [Google Scholar] [CrossRef]
  312. Sluiter, A.; Hames, B.; Ruiz, R.; Scarlata, C.; Sluiter, J.; Templeton, D.; Crocker, D. Determination of structural carbohydrates and lignin in biomass. Lab. Anal. Proc. 2008, 1617, 1–16. [Google Scholar]
  313. Kelley, S. Rapid analysis of the chemical composition of agricultural fibers using near infrared spectroscopy and pyrolysis molecular beam mass spectrometry. Biomass Bioenergy 2004, 27, 77–88. [Google Scholar] [CrossRef]
  314. Rials, T.G.; Kelley, S.S.; Cheng, Z.-M.; Kim, J.-Y.; Li, Y. FT-IR imaging and pyrolysis-molecular beam mass spectrometry: New tools to investigate wood tissues. Wood Sci. Technol. 2005, 39, 61–76. [Google Scholar]
  315. Sykes, R.; Kodrzycki, B.; Tuskan, G.; Foutz, K.; Davis, M. Within tree variability of lignin composition in Populus. Wood Sci. Technol. 2008, 42, 649–661. [Google Scholar] [CrossRef]
  316. Xiao, L.; Wei, H.; Himmel, M.E.; Jameel, H.; Kelley, S.S. NIR and Py-mbms coupled with multivariate data analysis as a high-throughput biomass characterization technique: A review. Front. Plant Sci. 2014, 5, 388. [Google Scholar] [CrossRef]
  317. Franklin, G.L. Preparation of Thin Sections of Synthetic Resins and Wood-Resin Composites, and a New Macerating Method for Wood. Nature 1945, 155, 51. [Google Scholar] [CrossRef]
  318. Guay, D.; Sutherland, N.R.; Rantanen, W.; Malandri, N.; Stephens, A.; Mattingly, K.; Schneider, M. Comparison of fiber length analyzers. In Proceedings of the TAPPI Practical Papermaking Conference, Milwaukee, WI, USA, 22–26 May 2005. [Google Scholar]
  319. Hirn, U.; Bauer, W. A review of image analysis based methods to evaluate fiber properties. Lenzinger Berichte 2006, 86, 96–105. [Google Scholar]
  320. Chen, Z.-Q.; Abramowicz, K.; Raczkowski, R.; Ganea, S.; Wu, H.X.; Lundqvist, S.-O.; Mörling, T.; De Luna, S.S.; Gil, M.R.G.; Mellerowicz, E.J. Method for accurate fiber length determination from increment cores for large-scale population analyses in Norway spruce. Holzforschung 2016, 70, 829–838. [Google Scholar] [CrossRef]
  321. Nabavi, M.; Dahlen, J.; Schimleck, L.; Eberhardt, T.L.; Montes, C. Regional calibration models for predicting loblolly pine tracheid properties using near-infrared spectroscopy. Wood Sci. Technol. 2018, 52, 445–463. [Google Scholar] [CrossRef]
  322. Kibblewhite, R.P.; Evans, R. Dimensional relationships among radiata pine wood tracheid, and chemical and TMP pulp fibres. Appita J. 2001, 54, 297–303. [Google Scholar]
  323. Ladell, J.T. A new method of measuring tracheid length. Forestry 1959, 32, 124–125. [Google Scholar] [CrossRef]
  324. Wilkins, A.P.; Bamber, R.K. A comparison between Ladell’s wood section method and the macerated wood method for tracheid length determination. IAWA Bull. 1983, 4, 245–247. [Google Scholar] [CrossRef]
  325. Gärtner, H.; Cherubini, P.; Fonti, P.; Von Arx, G.; Schneider, L.; Nievergelt, D.; Verstege, A.; Bast, A.; Schweingruber, F.H.; Büntgen, U. A Technical Perspective in Modern Tree-ring Research—How to Overcome Dendroecological and Wood Anatomical Challenges. J. Vis. Exp. 2015, 97, e52337. [Google Scholar] [CrossRef]
  326. von Arx, G.; Crivellaro, A.; Prendin, A.L.; Čufar, K.; Carrer, M. Quantitative wood anatomy—Practical guidelines. Front. Plant Sci. 2016, 7, 781. [Google Scholar] [CrossRef]
  327. Gärtner, H.; Nievergelt, D. The core-microtome: A new tool for surface preparation on cores and time series analysis of varying cell parameters. Dendrochronologia 2010, 28, 85–92. [Google Scholar] [CrossRef]
  328. Gärtner, H.; Lucchinetti, S.; Schweingruber, F.H. New perspectives for wood anatomical analysis in dendrosciences: The GSL1-microtome. Dendrochronologia 2014, 32, 47–51. [Google Scholar] [CrossRef]
  329. von Arx, G.; Carrer, M. ROXAS—A new tool to build centuries-long tracheid-lumen chronologies in conifers. Dendrochronologia 2014, 32, 290–293. [Google Scholar] [CrossRef]
  330. Huang, C.L.; Kutscha, N.P.; Leaf, G.J.; Megraw, R.A. Comparison of microfibril angle measurement techniques. In Proceedings of the IAWA/IUFRO International Workshop on the Significance of Microfibril Angle to Wood Quality, Westport, New Zealand, 21–25 November 1997. [Google Scholar]
  331. Hein, P.R.G.; Bouvet, J.-M.; Mandrou, E.; Vigneron, P.; Clair, B.; Chaix, G. Age trends of microfibril angle inheritance and their genetic and environmental correlations with growth, density and chemical properties in Eucalyptus urophylla S.T. Blake wood. Ann. For. Sci. 2012, 69, 681–691. [Google Scholar] [CrossRef] [Green Version]
  332. Cramer, S.; Kretschmann, D.; Lakes, R.; Schmidt, T. Earlywood and latewood elastic properties in loblolly pine. Holzforschung 2005, 59, 531–538. [Google Scholar] [CrossRef]
  333. Gorman, T.M.; E Kretschmann, D.; Green, D.W.; Wiemann, M.C. Effect of site characteristics on juvenile wood transition in lodgepole pine in the inland northwest. Wood Fiber Sci. 2018, 50, 180–192. [Google Scholar] [CrossRef]
  334. Amishev, D.; Murphy, G.E. Implementing Resonance-Based Acoustic Technology on Mechanical Harvesters/Processors for Real-Time Wood Stiffness Assessment: Opportunities and Considerations. Int. J. For. Eng. 2008, 19, 48–56. [Google Scholar] [CrossRef]
  335. Carter, P.; Wang, X.; Ross, R.J. Field application of processor head acoustic technology in forest harvest operations. In Proceedings of the 18th International Nondestructive Testing and Evaluation of Wood Symposium, Madison, WI, USA, 24–27 September 2013. [Google Scholar]
  336. Burger, J.; Gowen, A. Data handling in hyperspectral image analysis. Chemom. Intell. Lab. Syst. 2011, 108, 13–22. [Google Scholar] [CrossRef]
  337. Lindgren, O.; Seifert, T.; Du Plessis, A. Moisture content measurements in wood using dual-energy, C.T. scanning—A feasibility study. Wood Mater. Sci. Eng. 2016, 11, 1–6. [Google Scholar] [CrossRef]
  338. Defoirdt, N.; Sen, A.; Dhaene, J.; De Mil, T.; Pereira, H.; Van Acker, J.; Bulcke, J.V.D. A generic platform for hyperspectral mapping of wood. Wood Sci. Technol. 2017, 51, 887–907. [Google Scholar] [CrossRef]
  339. LaForce, B.; Masschaele, B.; Boone, M.N.; Schaubroeck, D.; Dierick, M.; Vekemans, B.; Walgraeve, C.; Janssen, C.; Cnudde, V.; Van Hoorebeke, L.; et al. Integrated Three-Dimensional Microanalysis Combining X-Ray Microtomography and X-Ray Fluorescence Methodologies. Anal. Chem. 2017, 89, 10617–10624. [Google Scholar] [CrossRef]
  340. Raymond, C.A.; Schimleck, L.R.; Muneri, A.; Michell, A.J. Nondestructive sampling of Eucalyptus globulus and E. nitens for wood properties. III. Predicted pulp yield using near infrared reflectance analysis. Wood Sci. Technol. 2001, 35, 203–215. [Google Scholar] [CrossRef]
  341. Schimleck, L.R.; Mora, C.; Daniels, R.F. Estimation of the physical wood properties of green Pinus taeda radial samples by near infrared spectroscopy. Can. J. For. Res. 2003, 33, 2297–2305. [Google Scholar] [CrossRef]
  342. Li, Y.; Apiolaza, L.A.; Altaner, C. Genetic variation in heartwood properties and growth traits of Eucalyptus bosistoana. Eur. J. For. Res. 2018, 137, 565–572. [Google Scholar] [CrossRef]
  343. Walker, T.D.; Isik, F.; E McKeand, S. Genetic Variation in Acoustic Time of Flight and Drill Resistance of Juvenile Wood in a Large Loblolly Pine Breeding Population. For. Sci. 2019, 65, 469–482. [Google Scholar] [CrossRef]
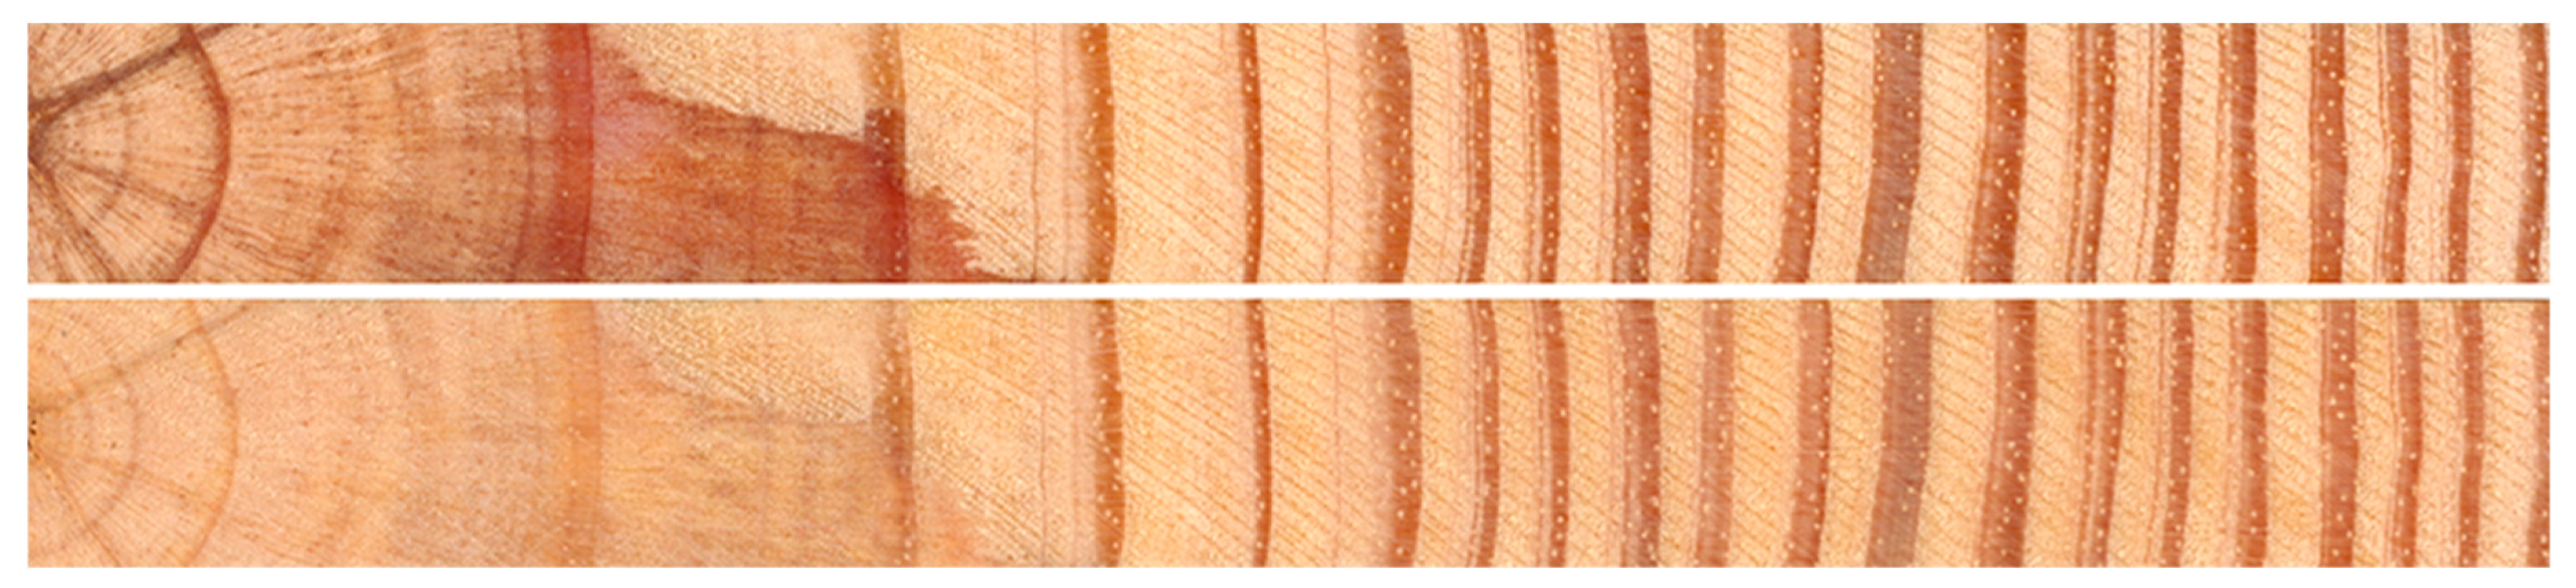
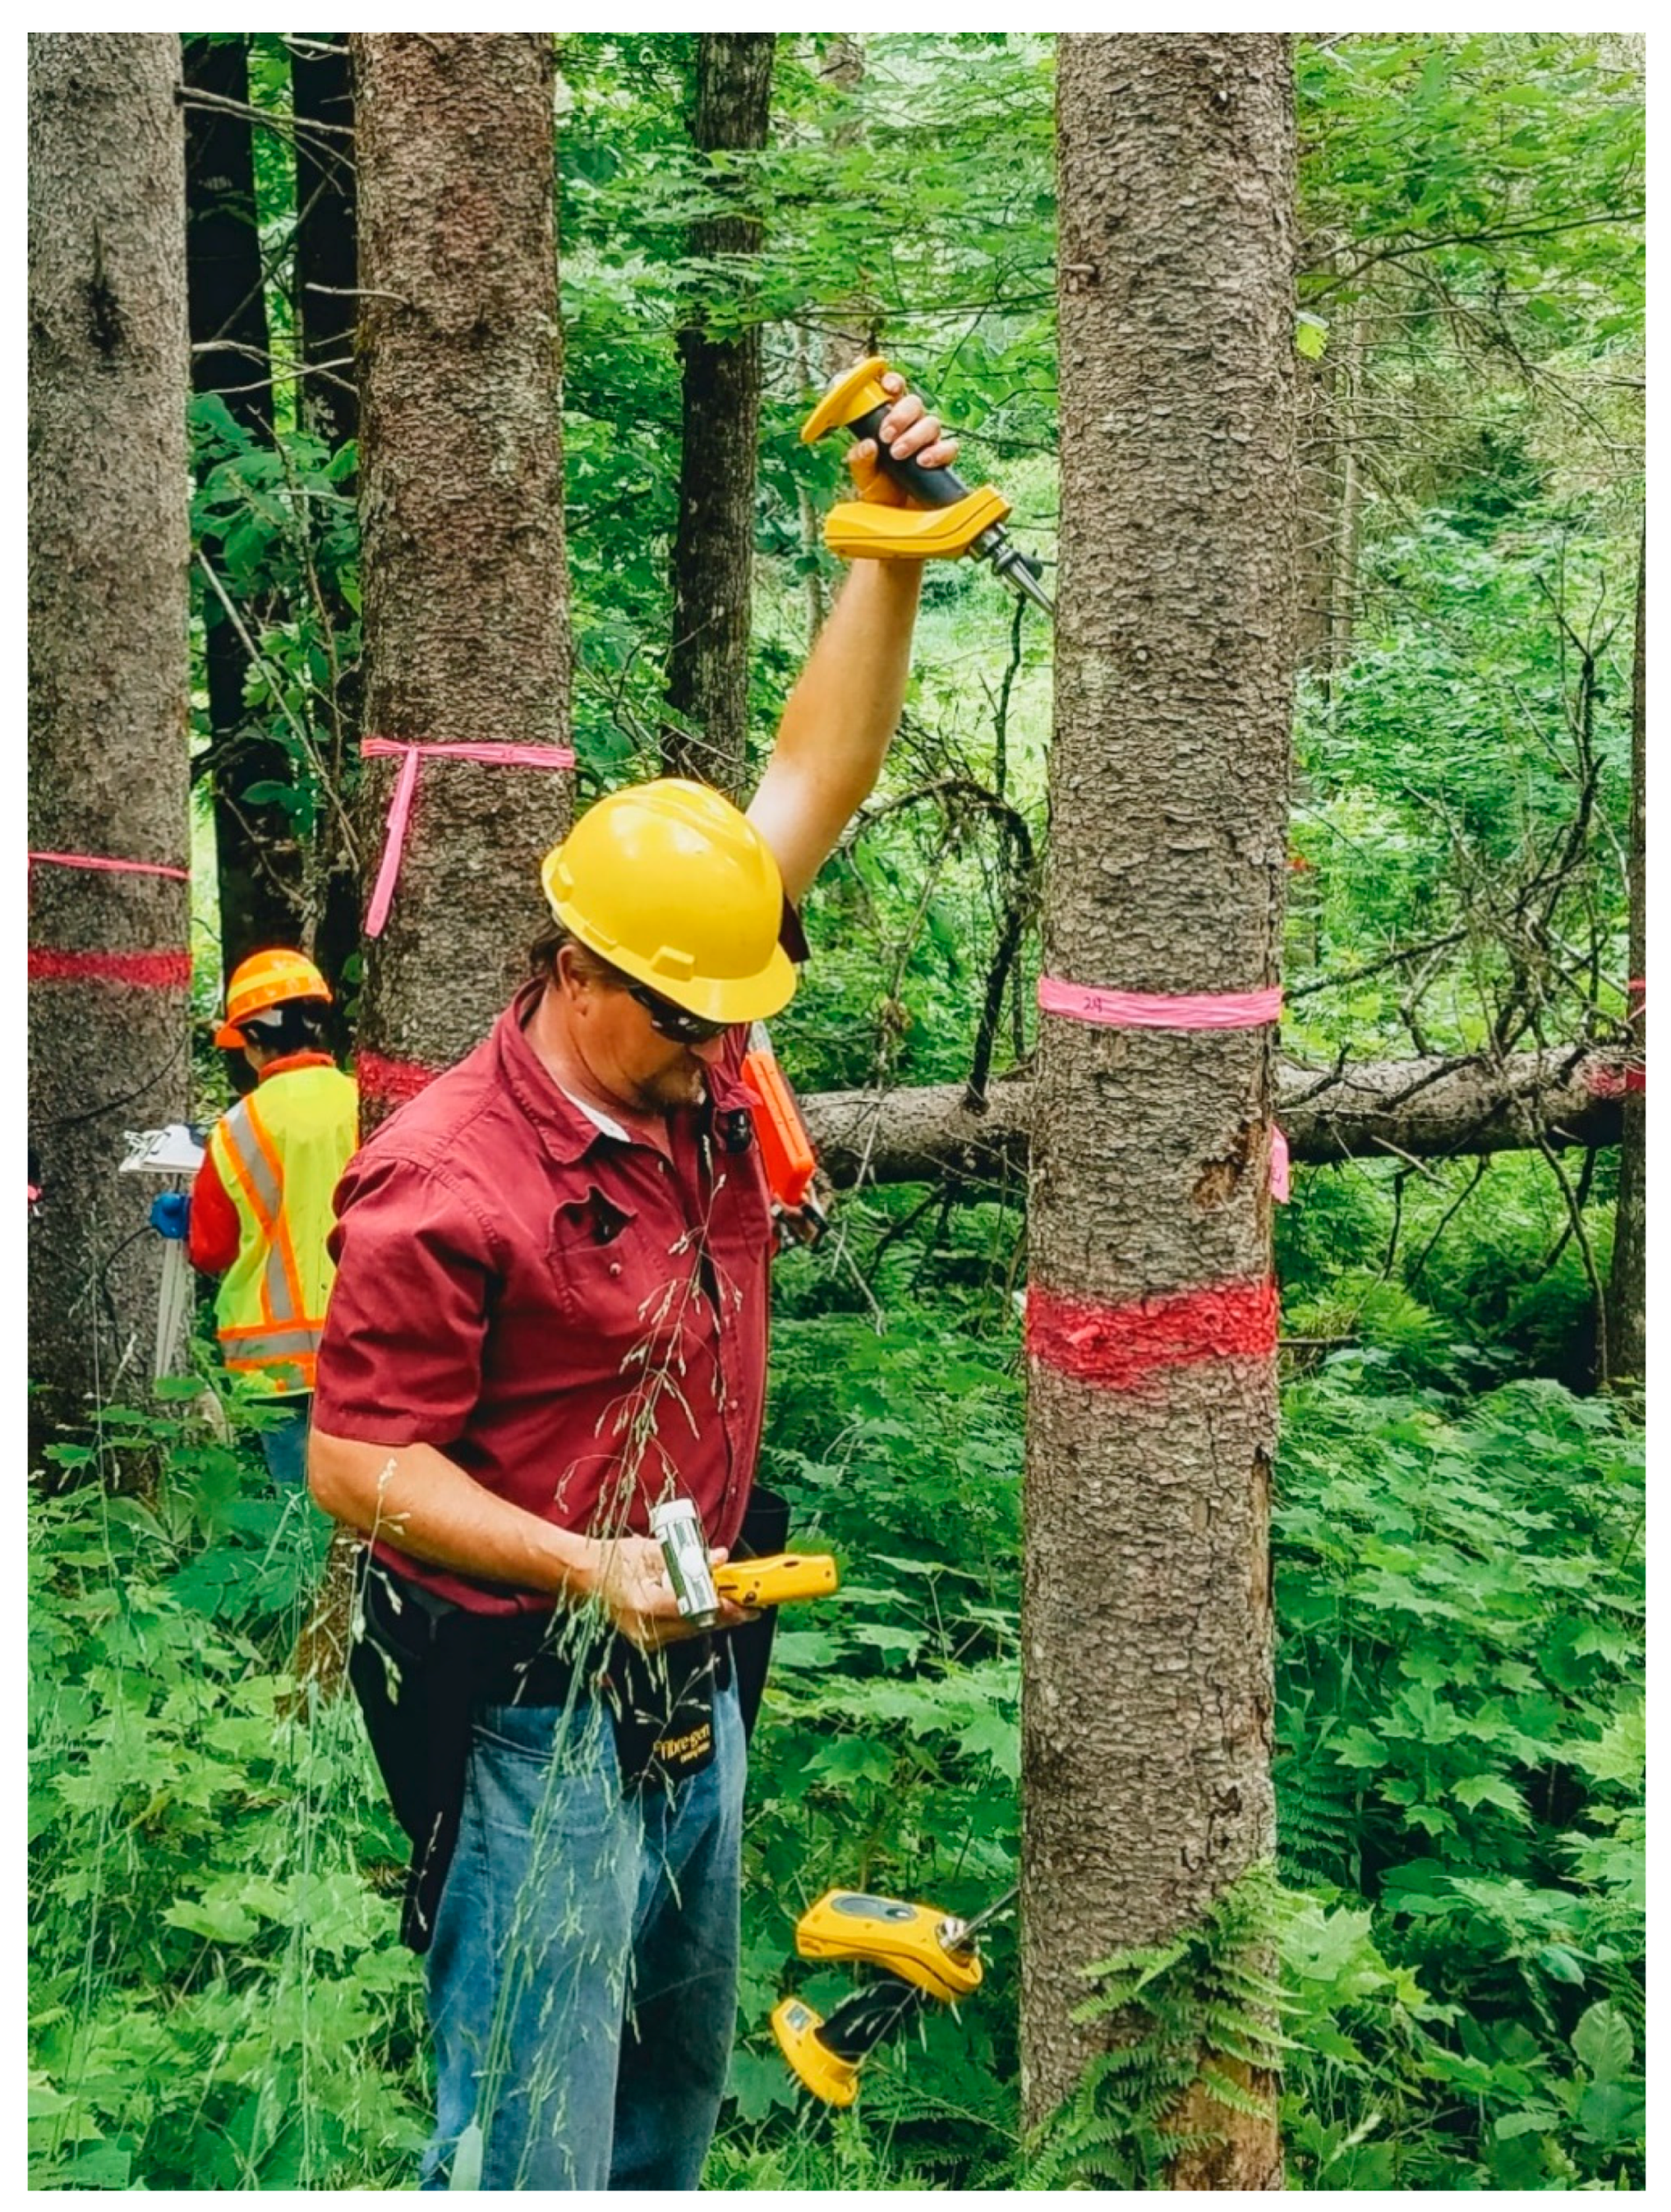
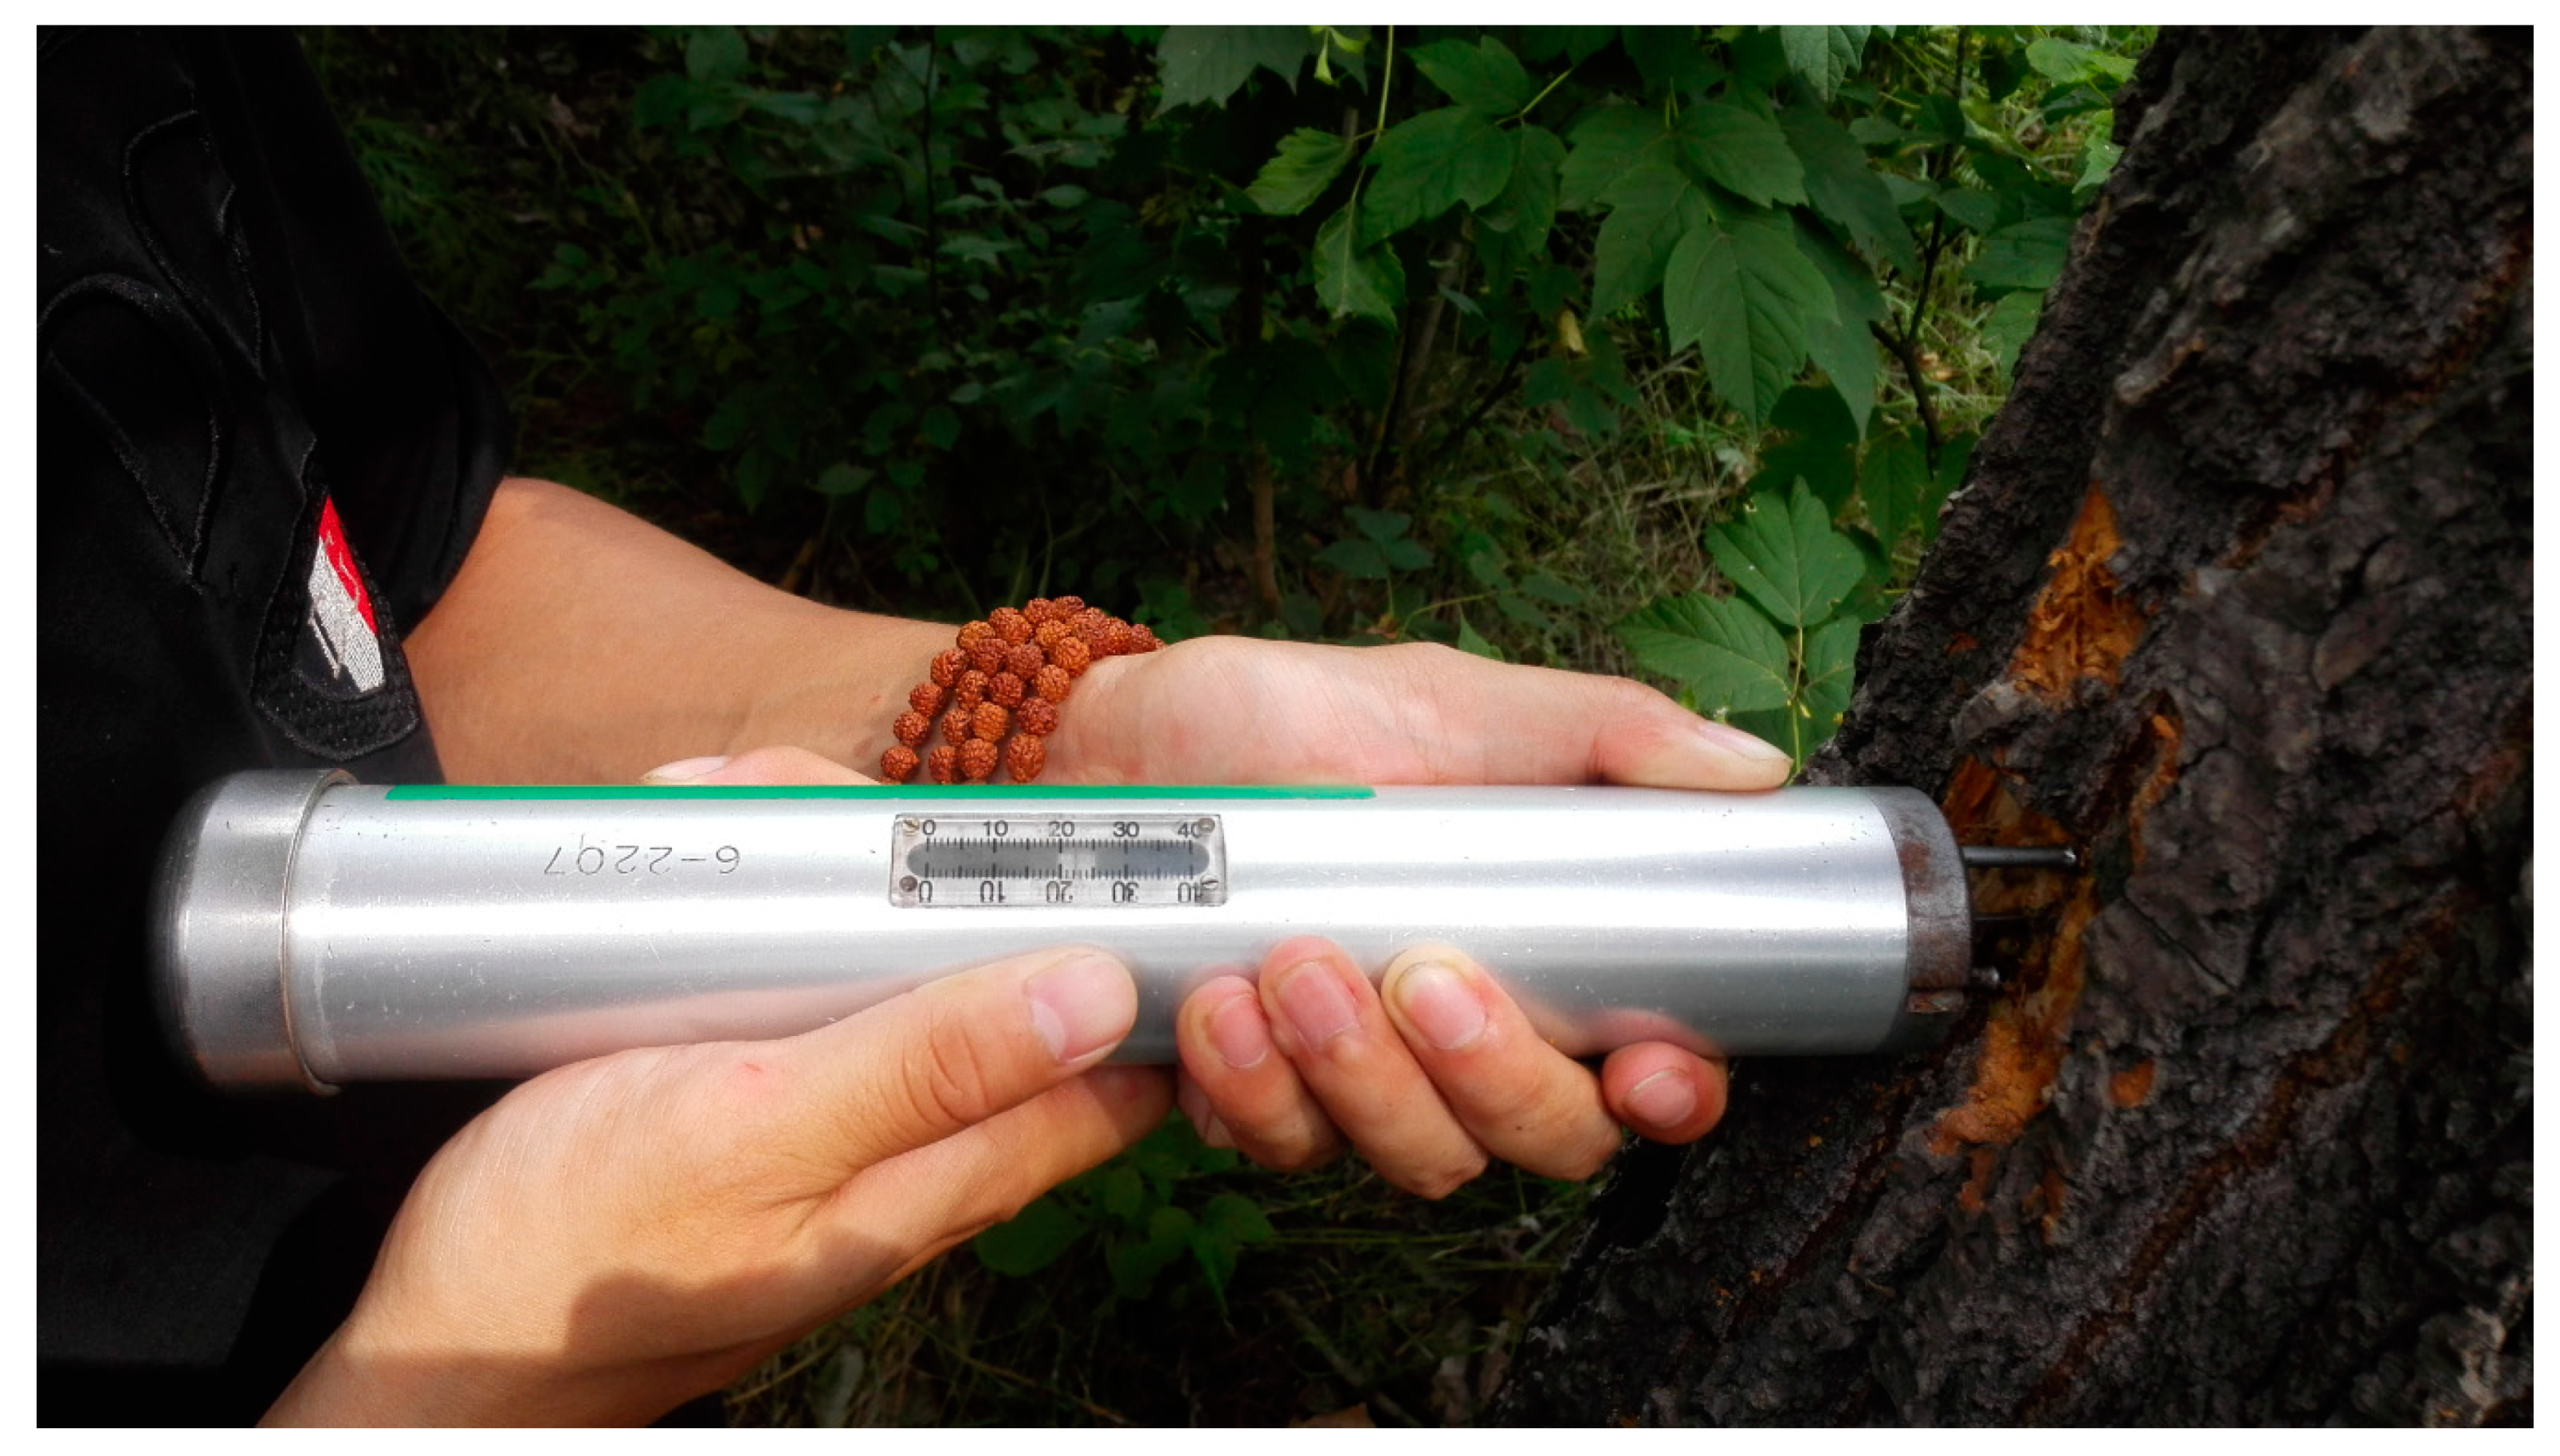
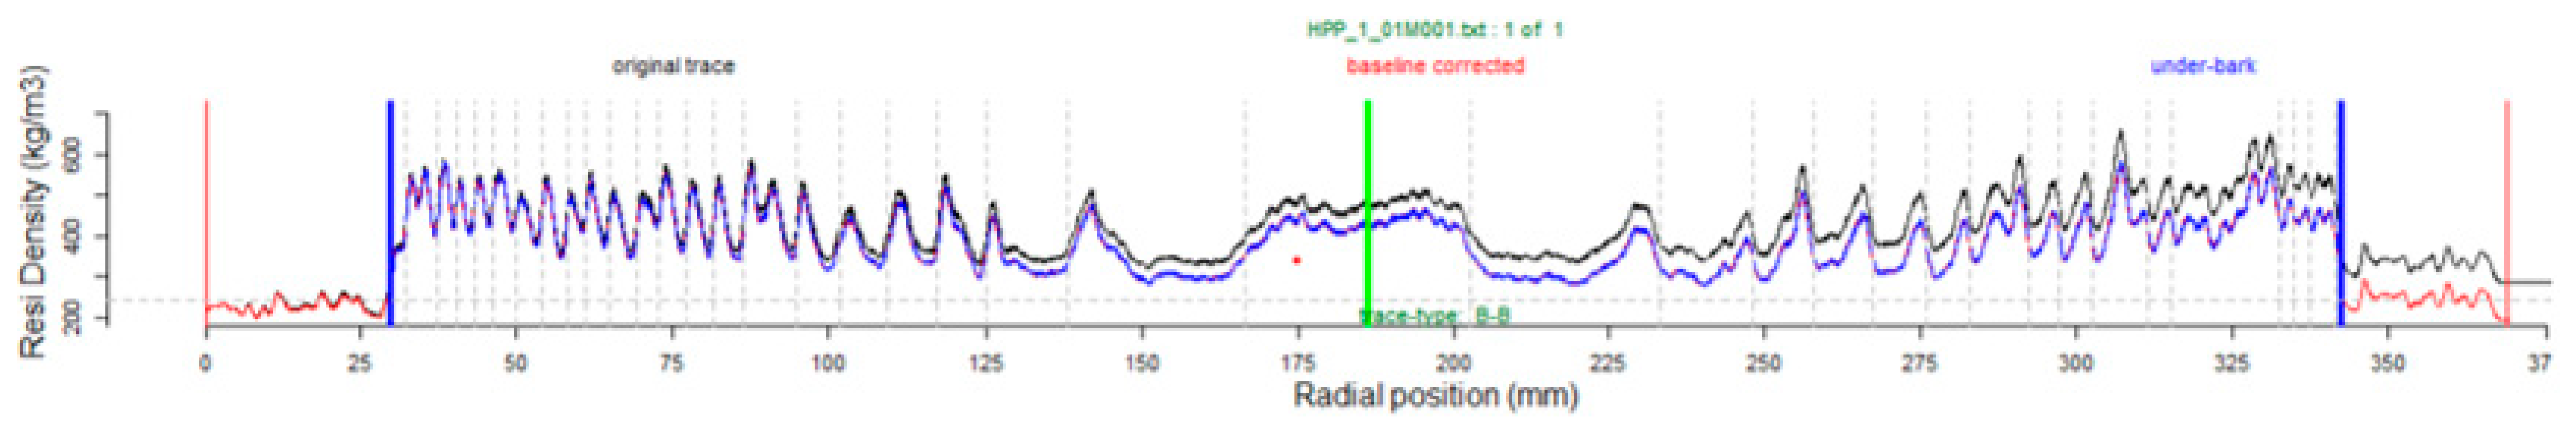
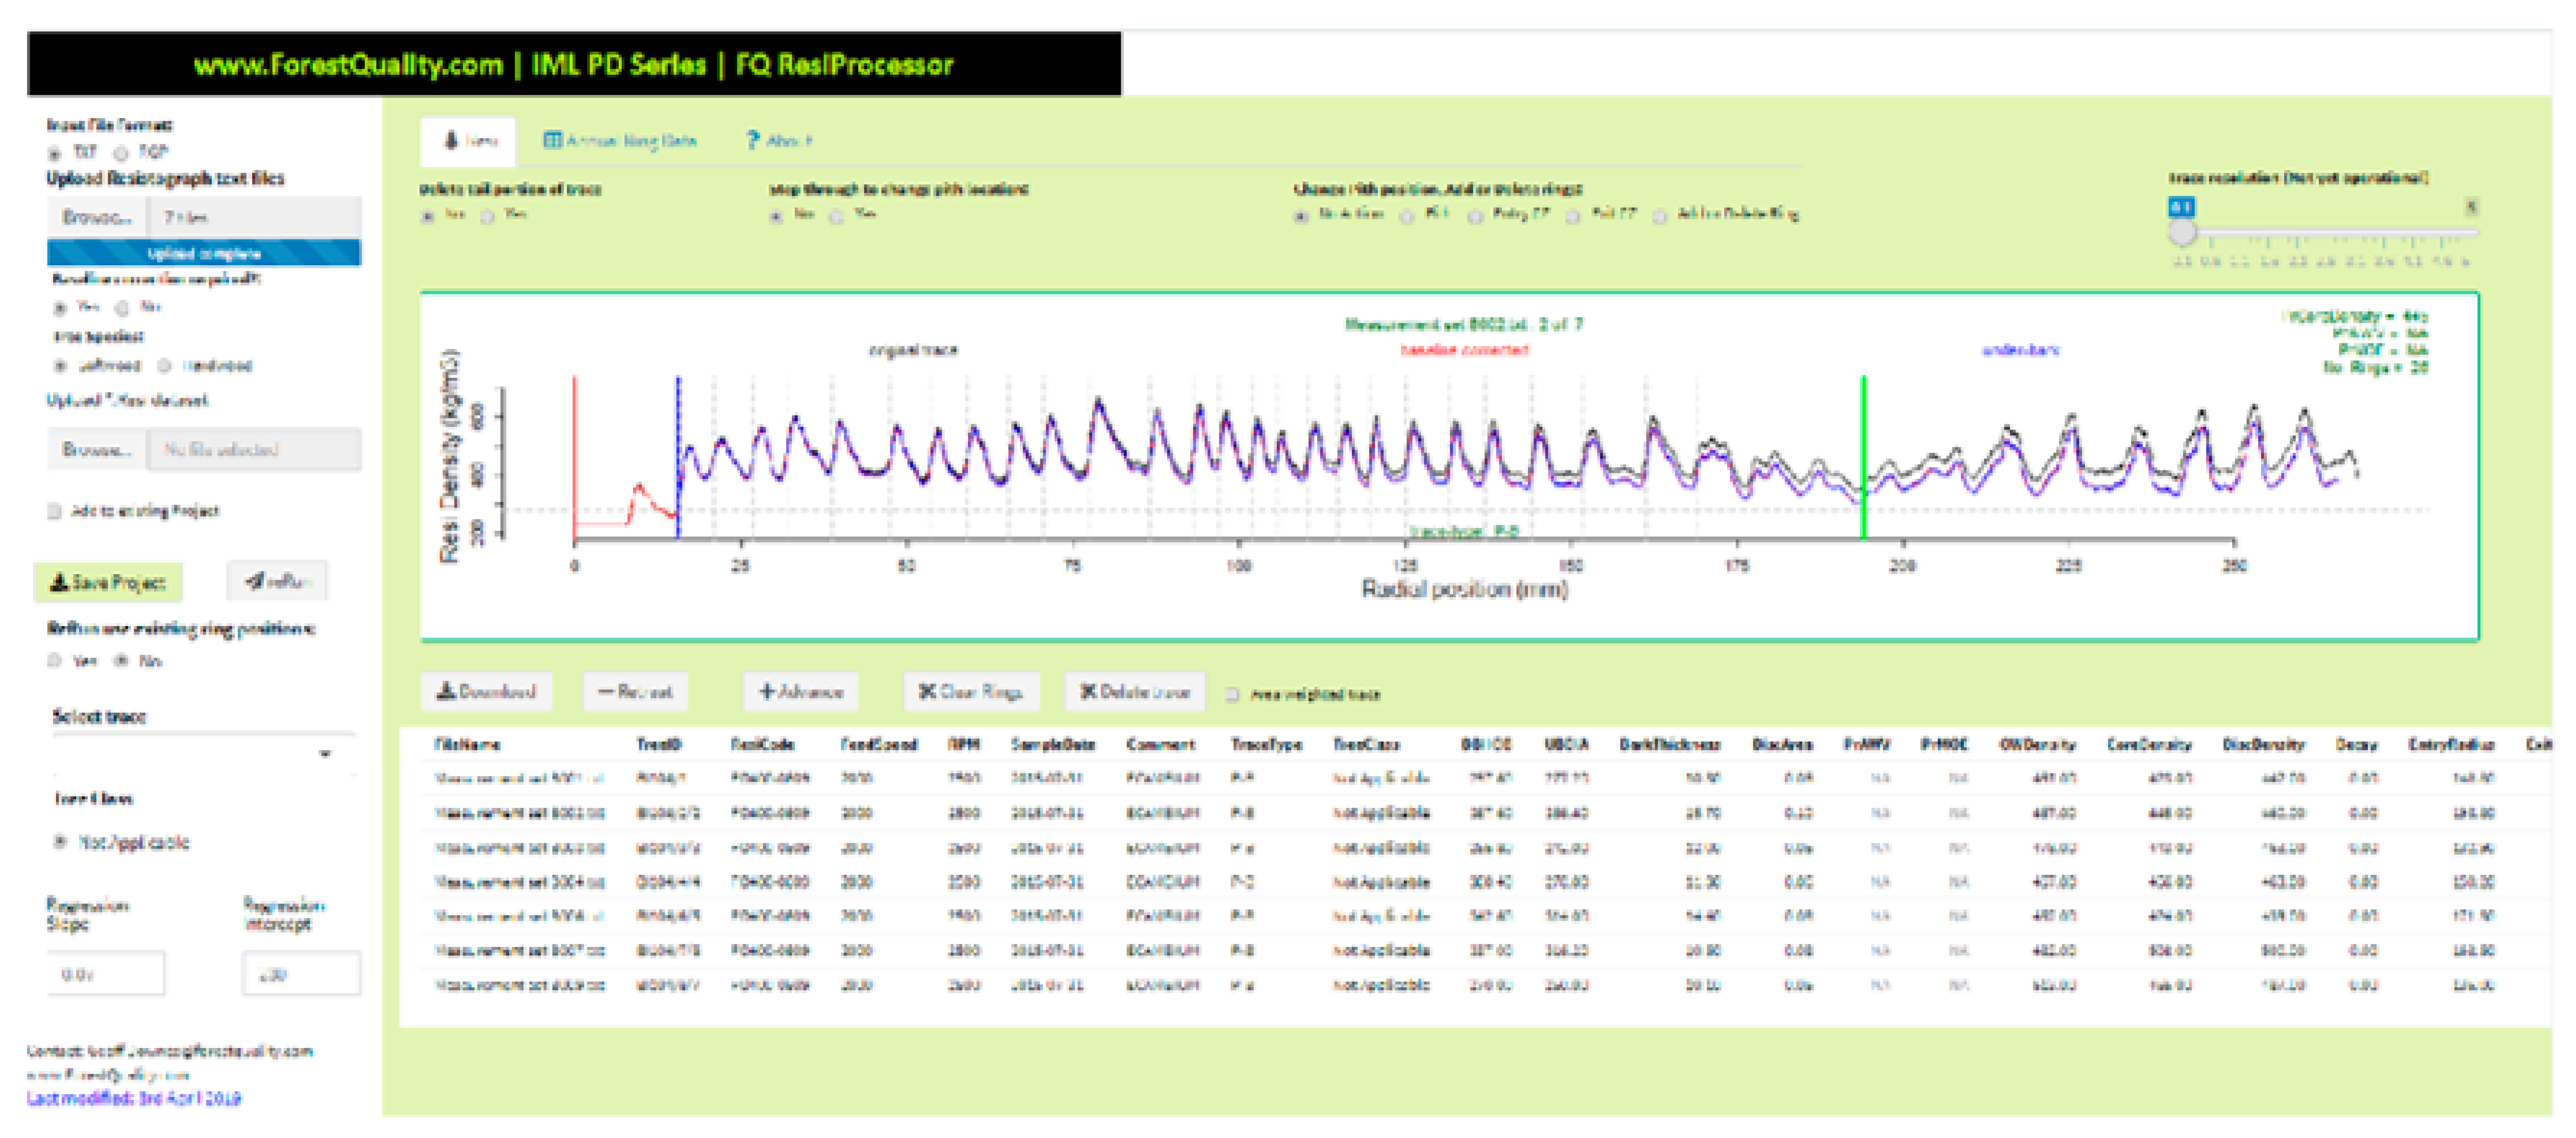
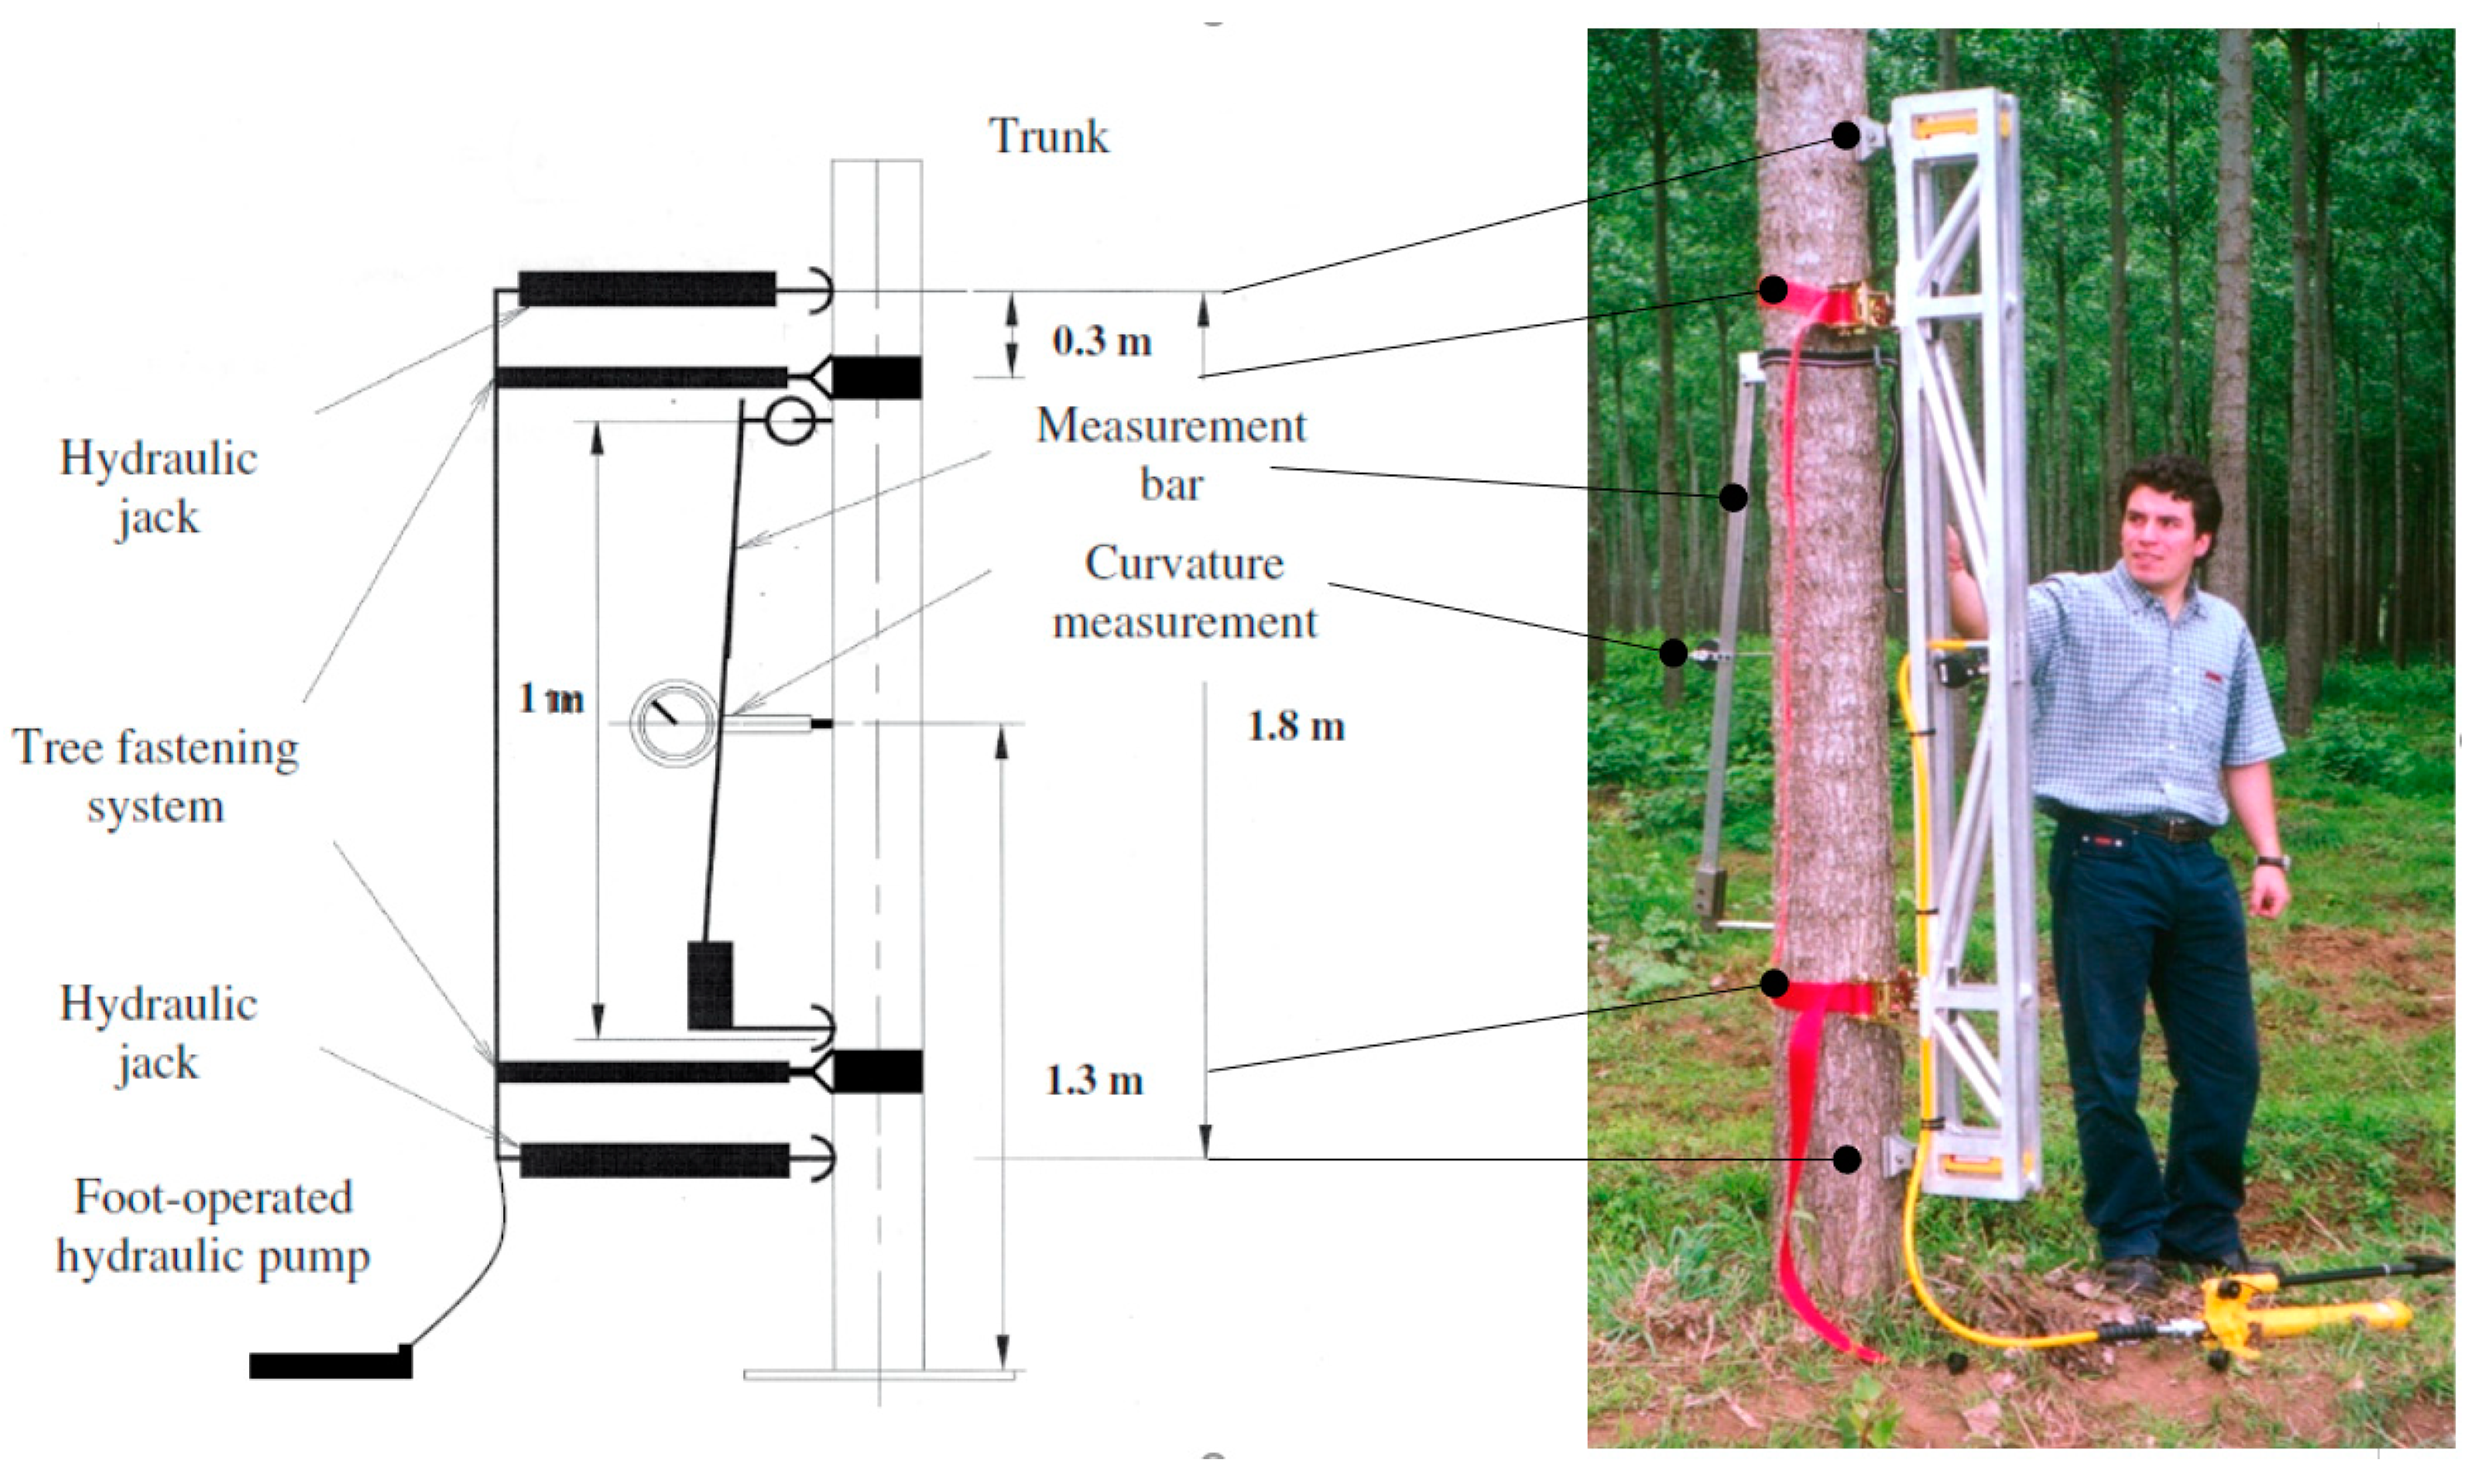
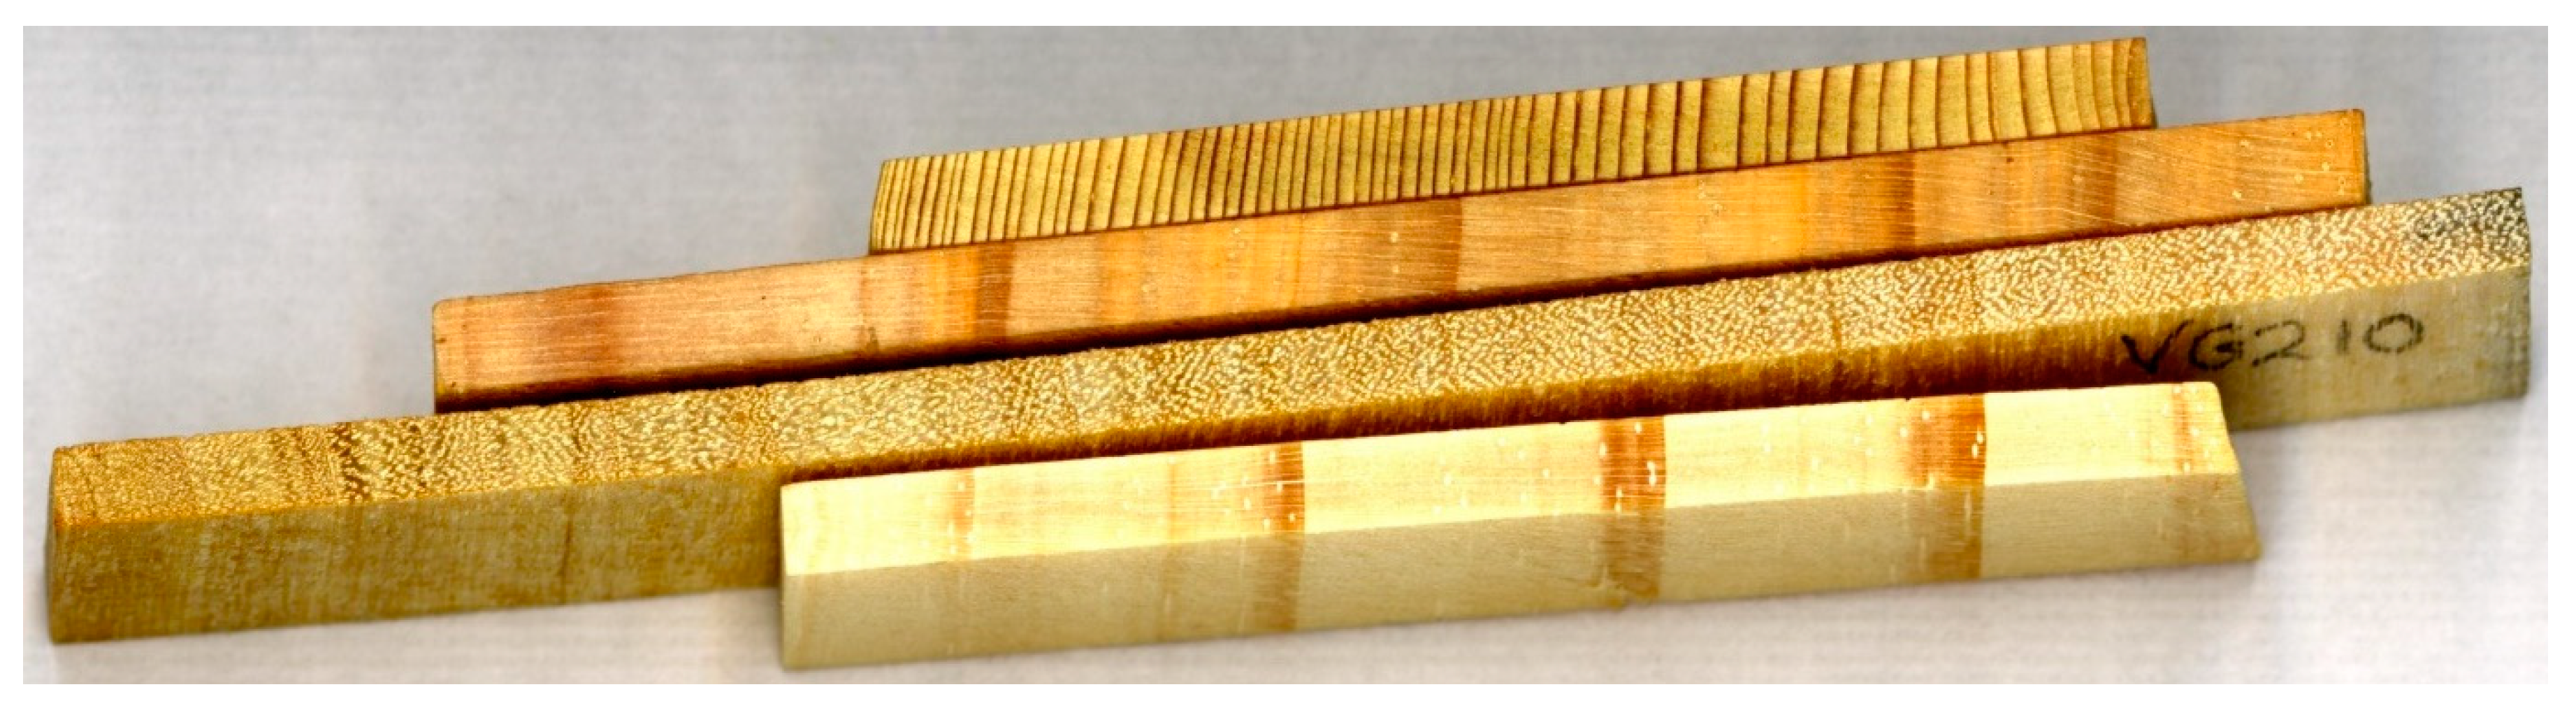
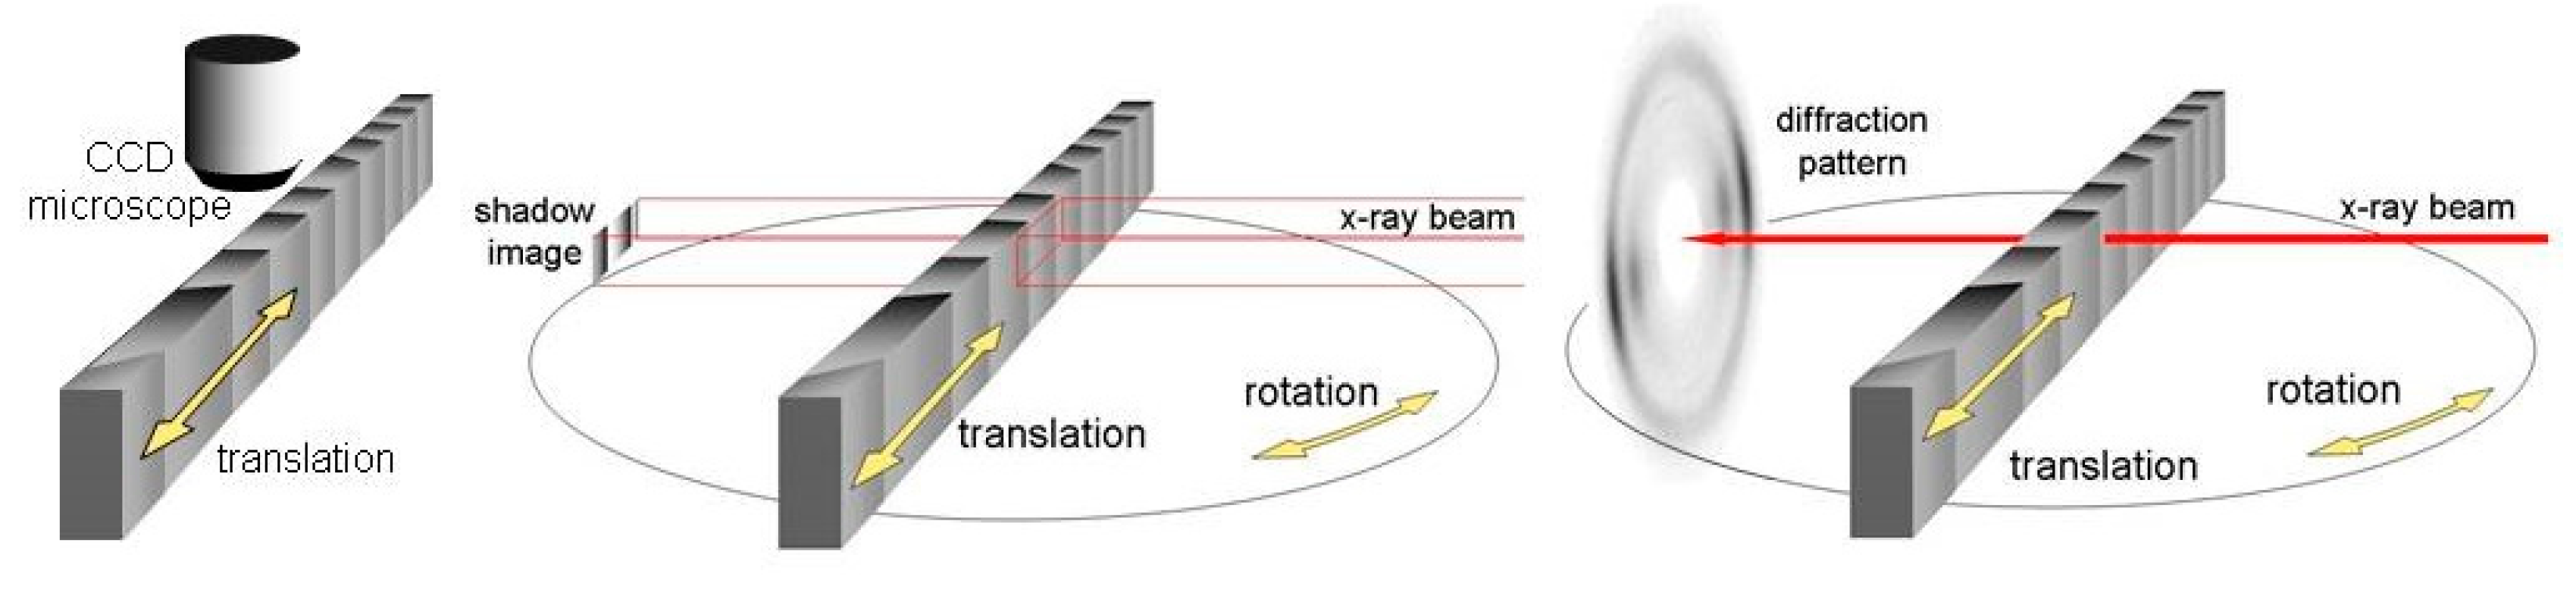
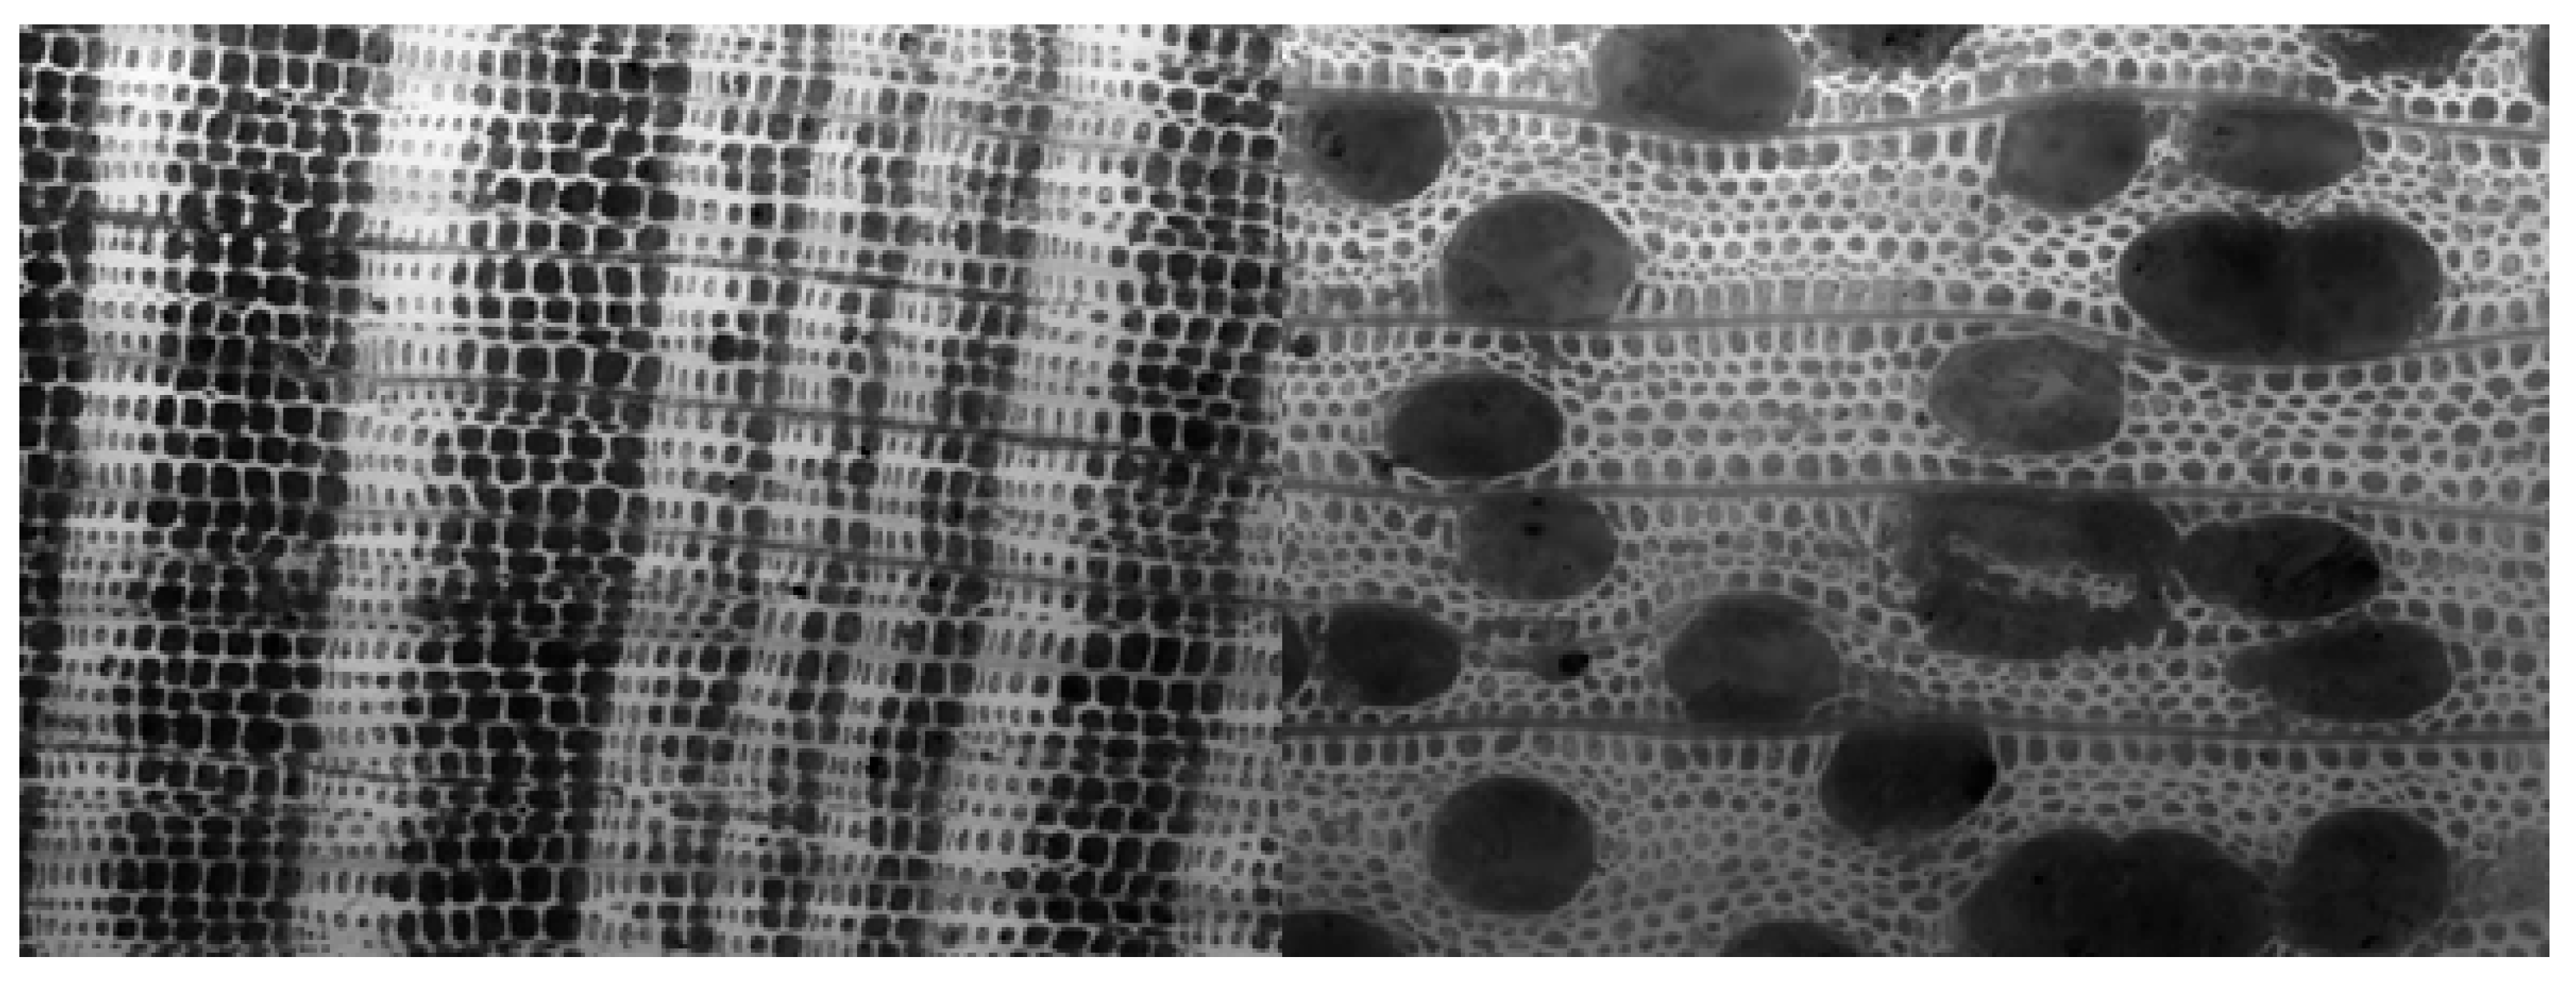
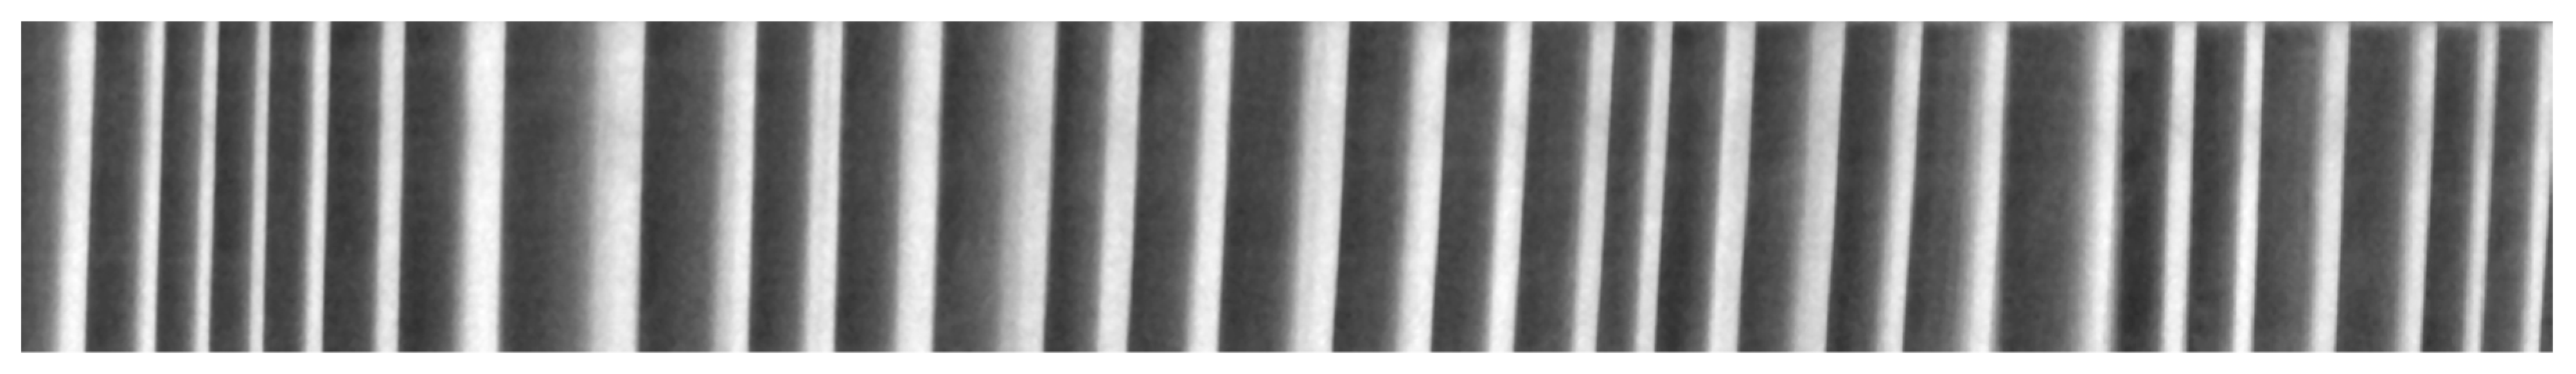
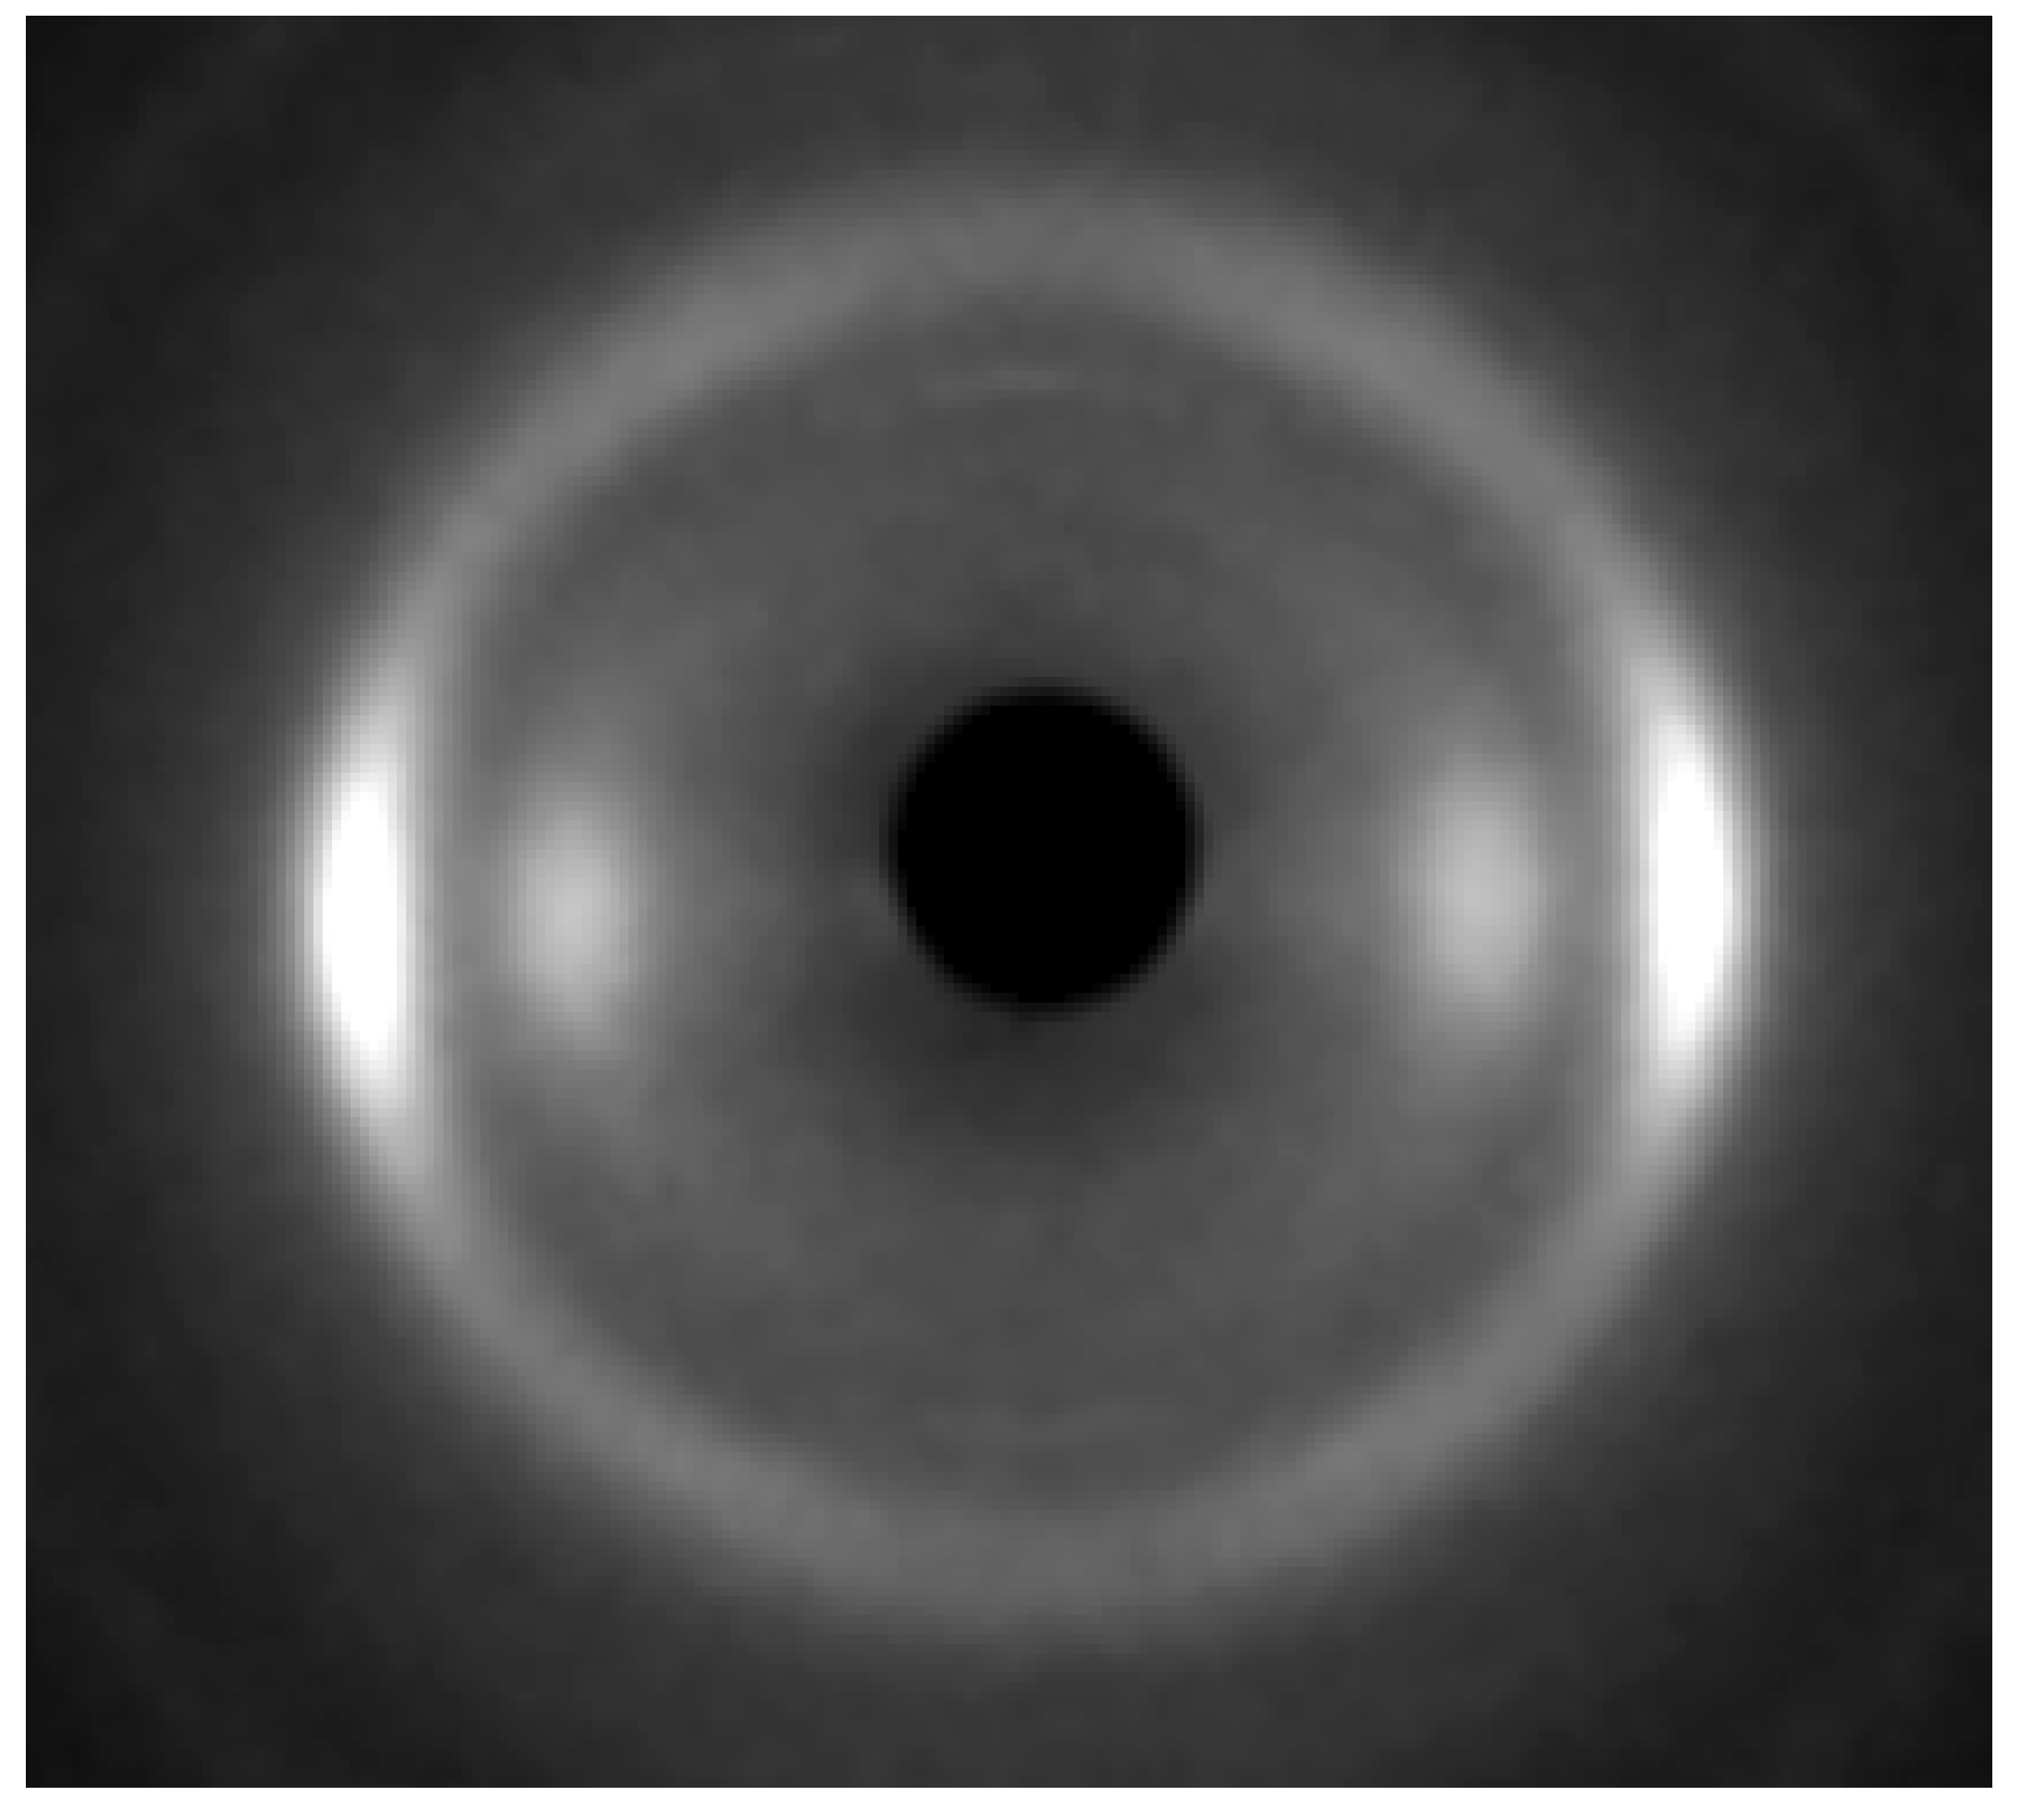
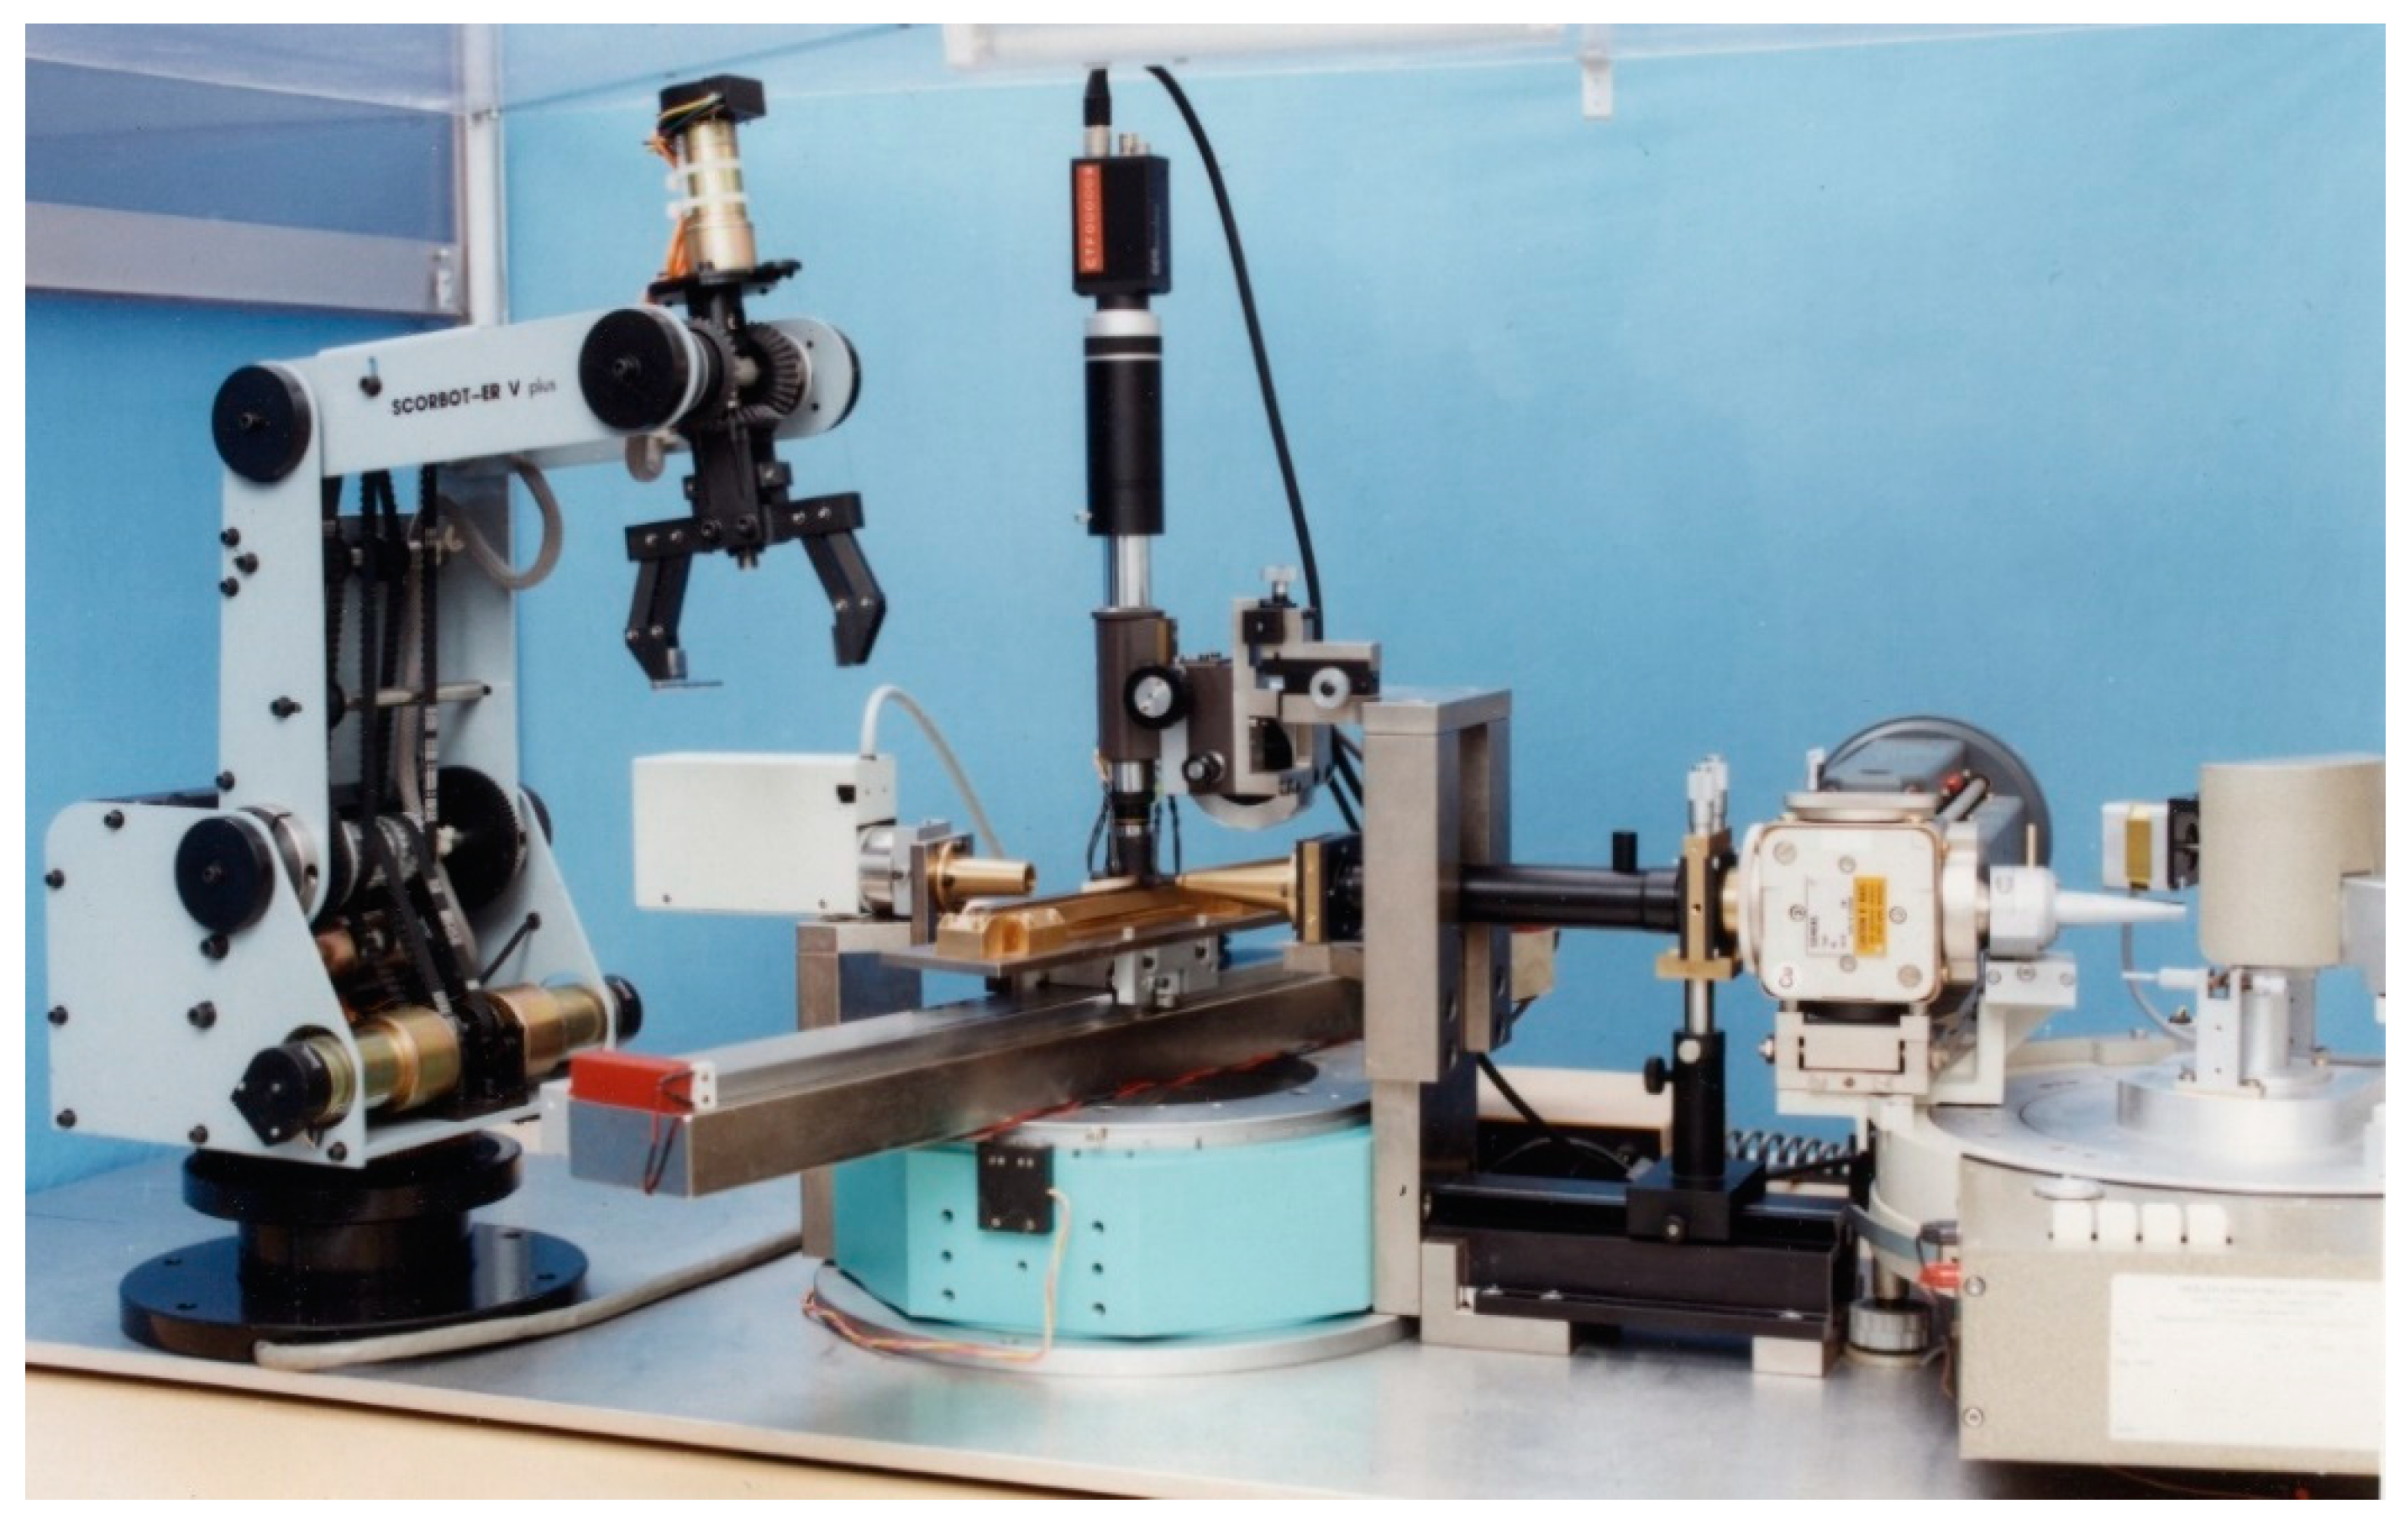
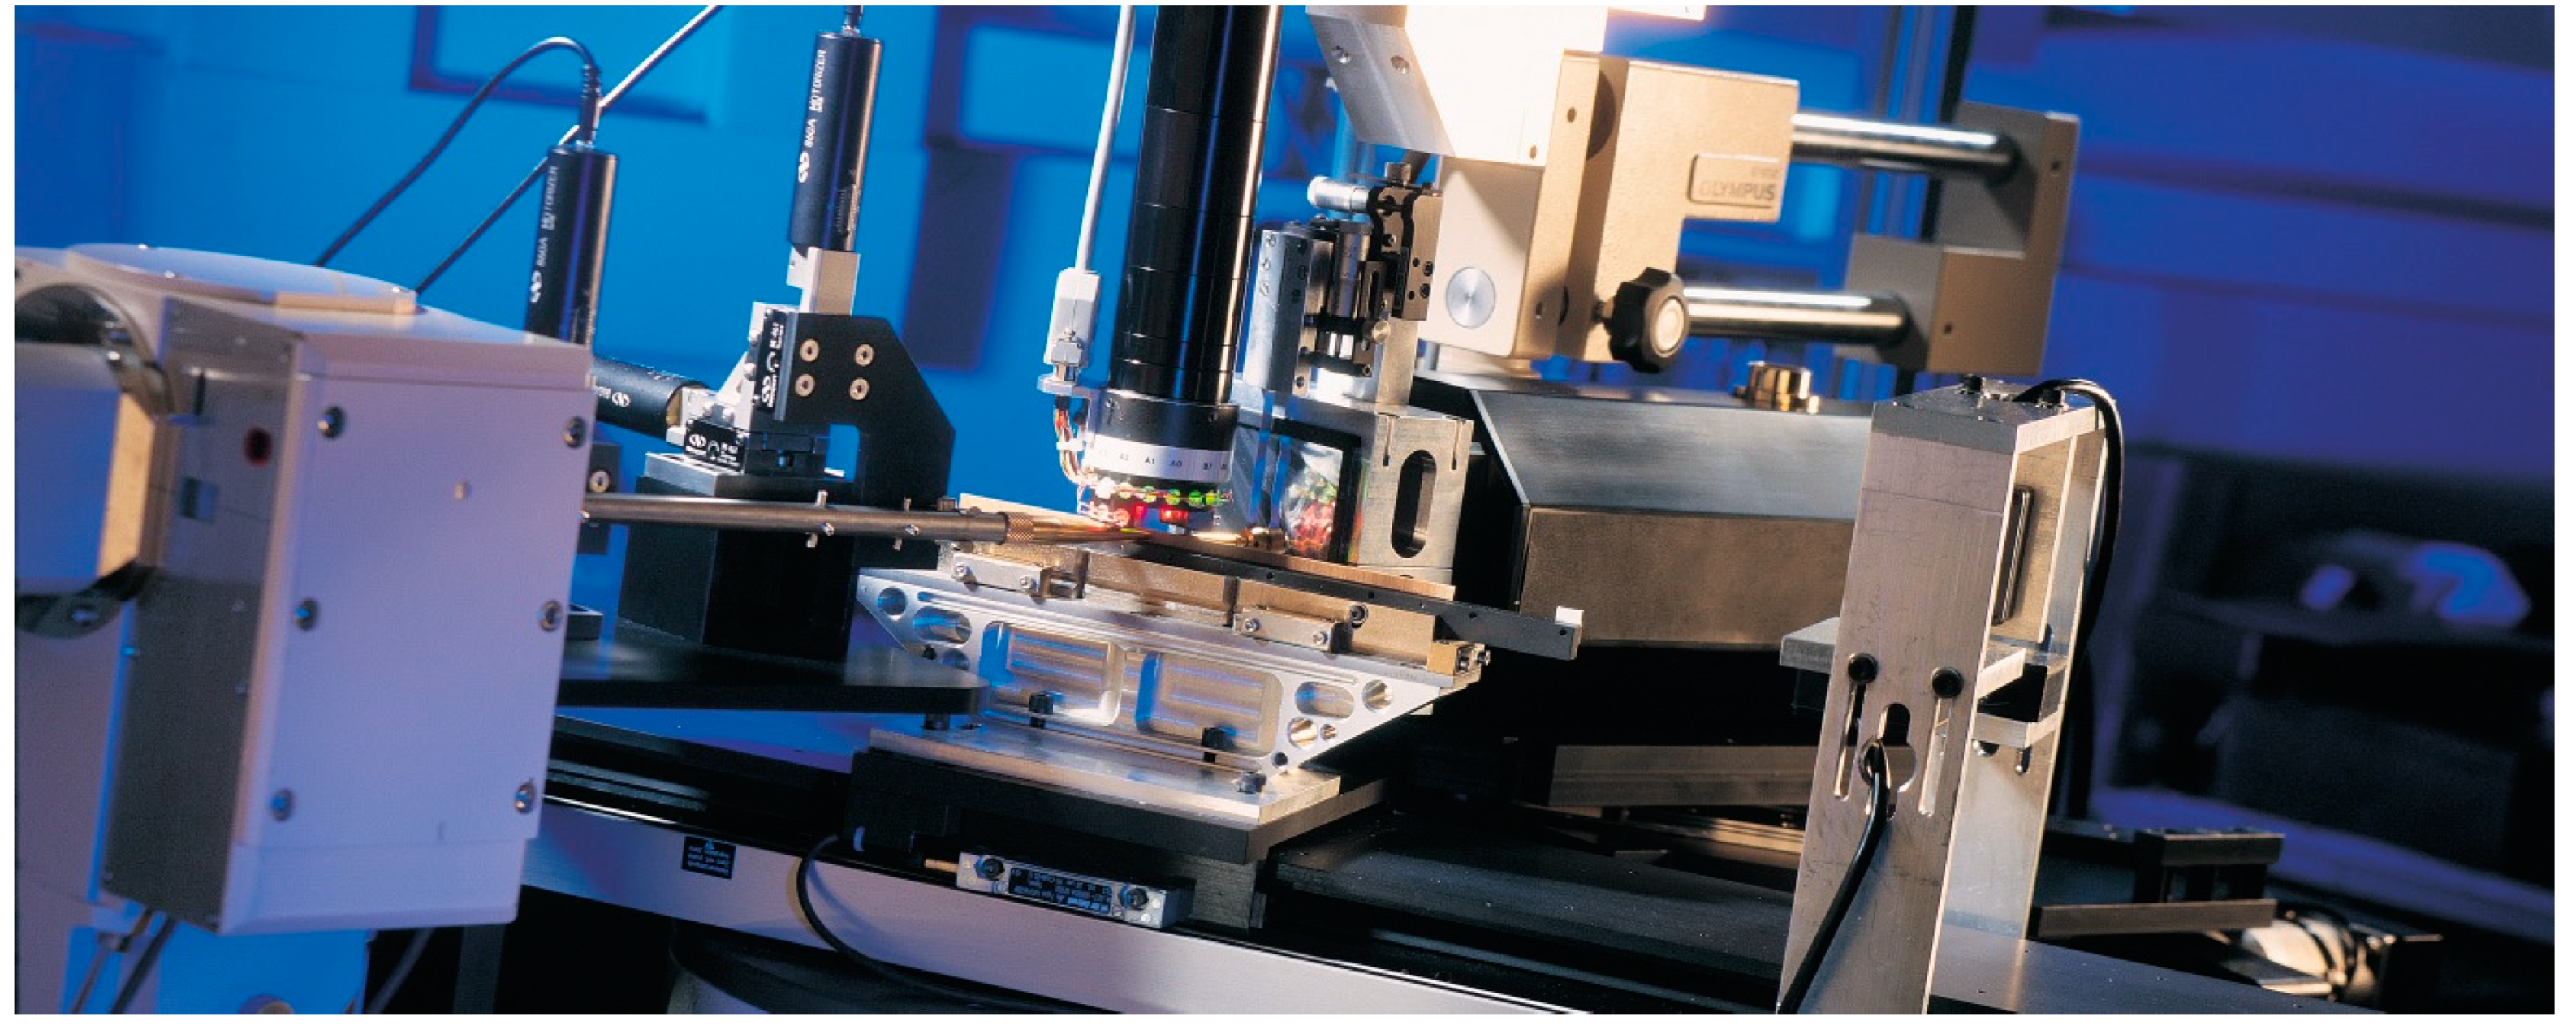
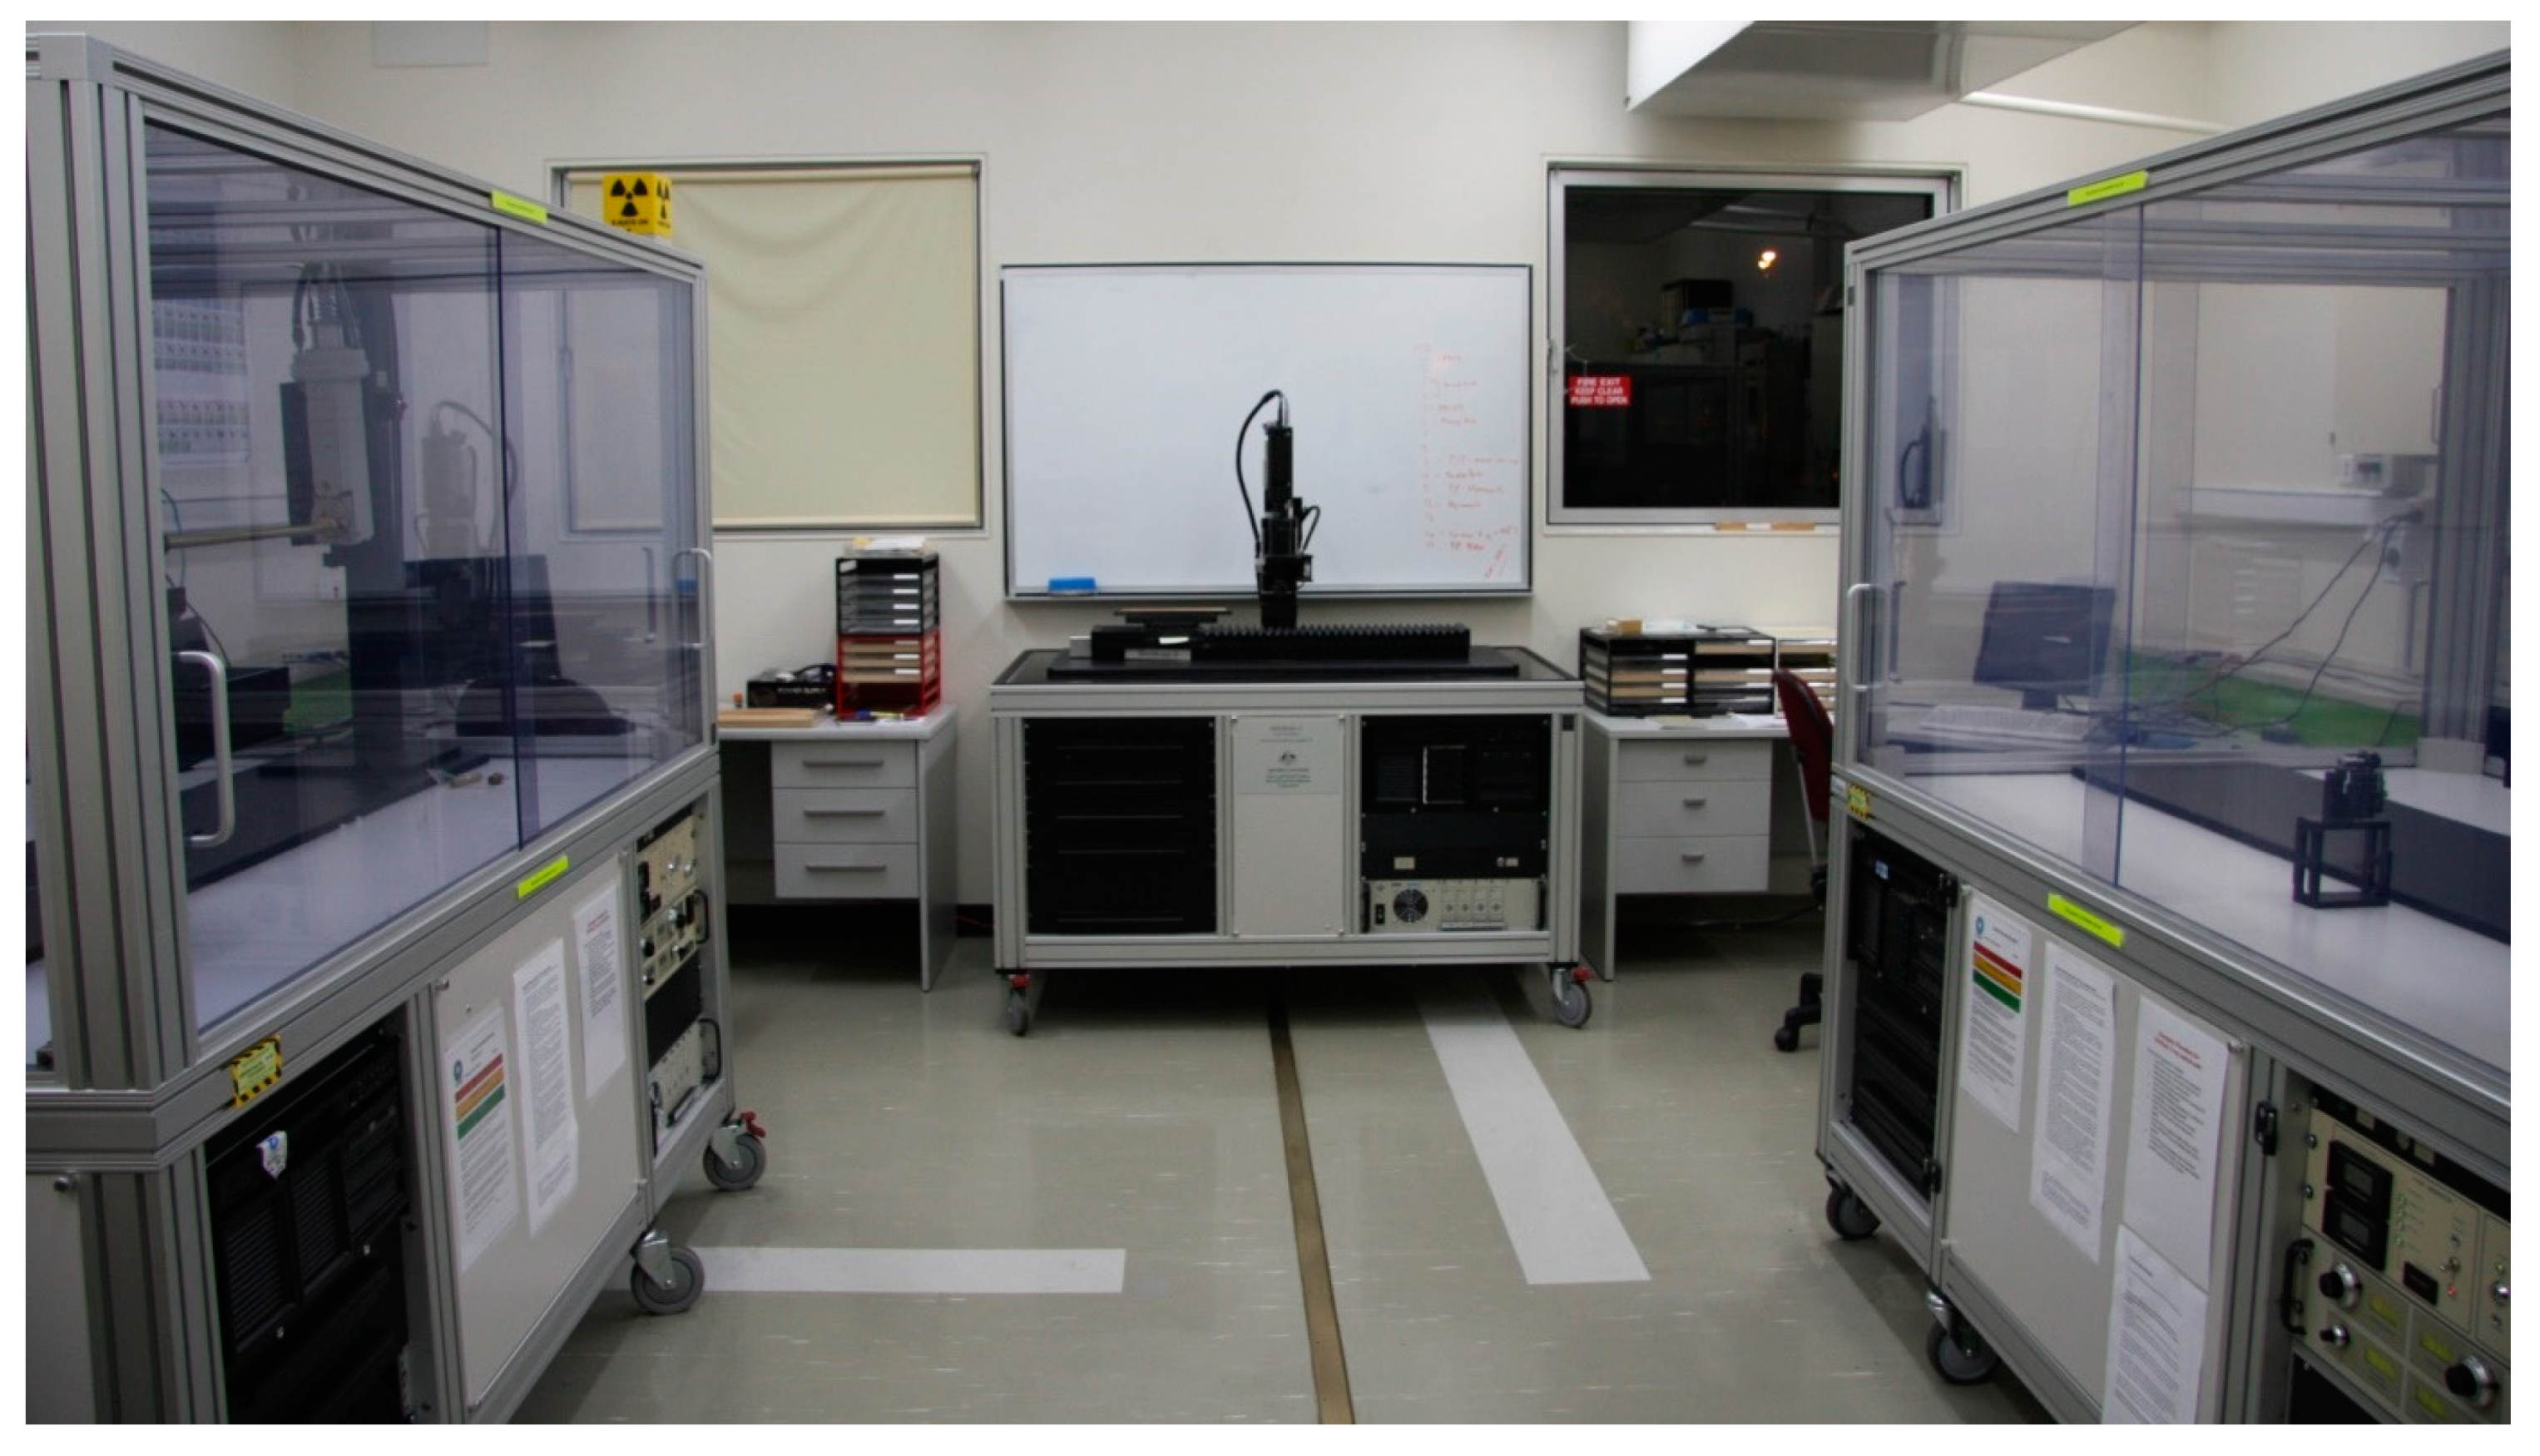
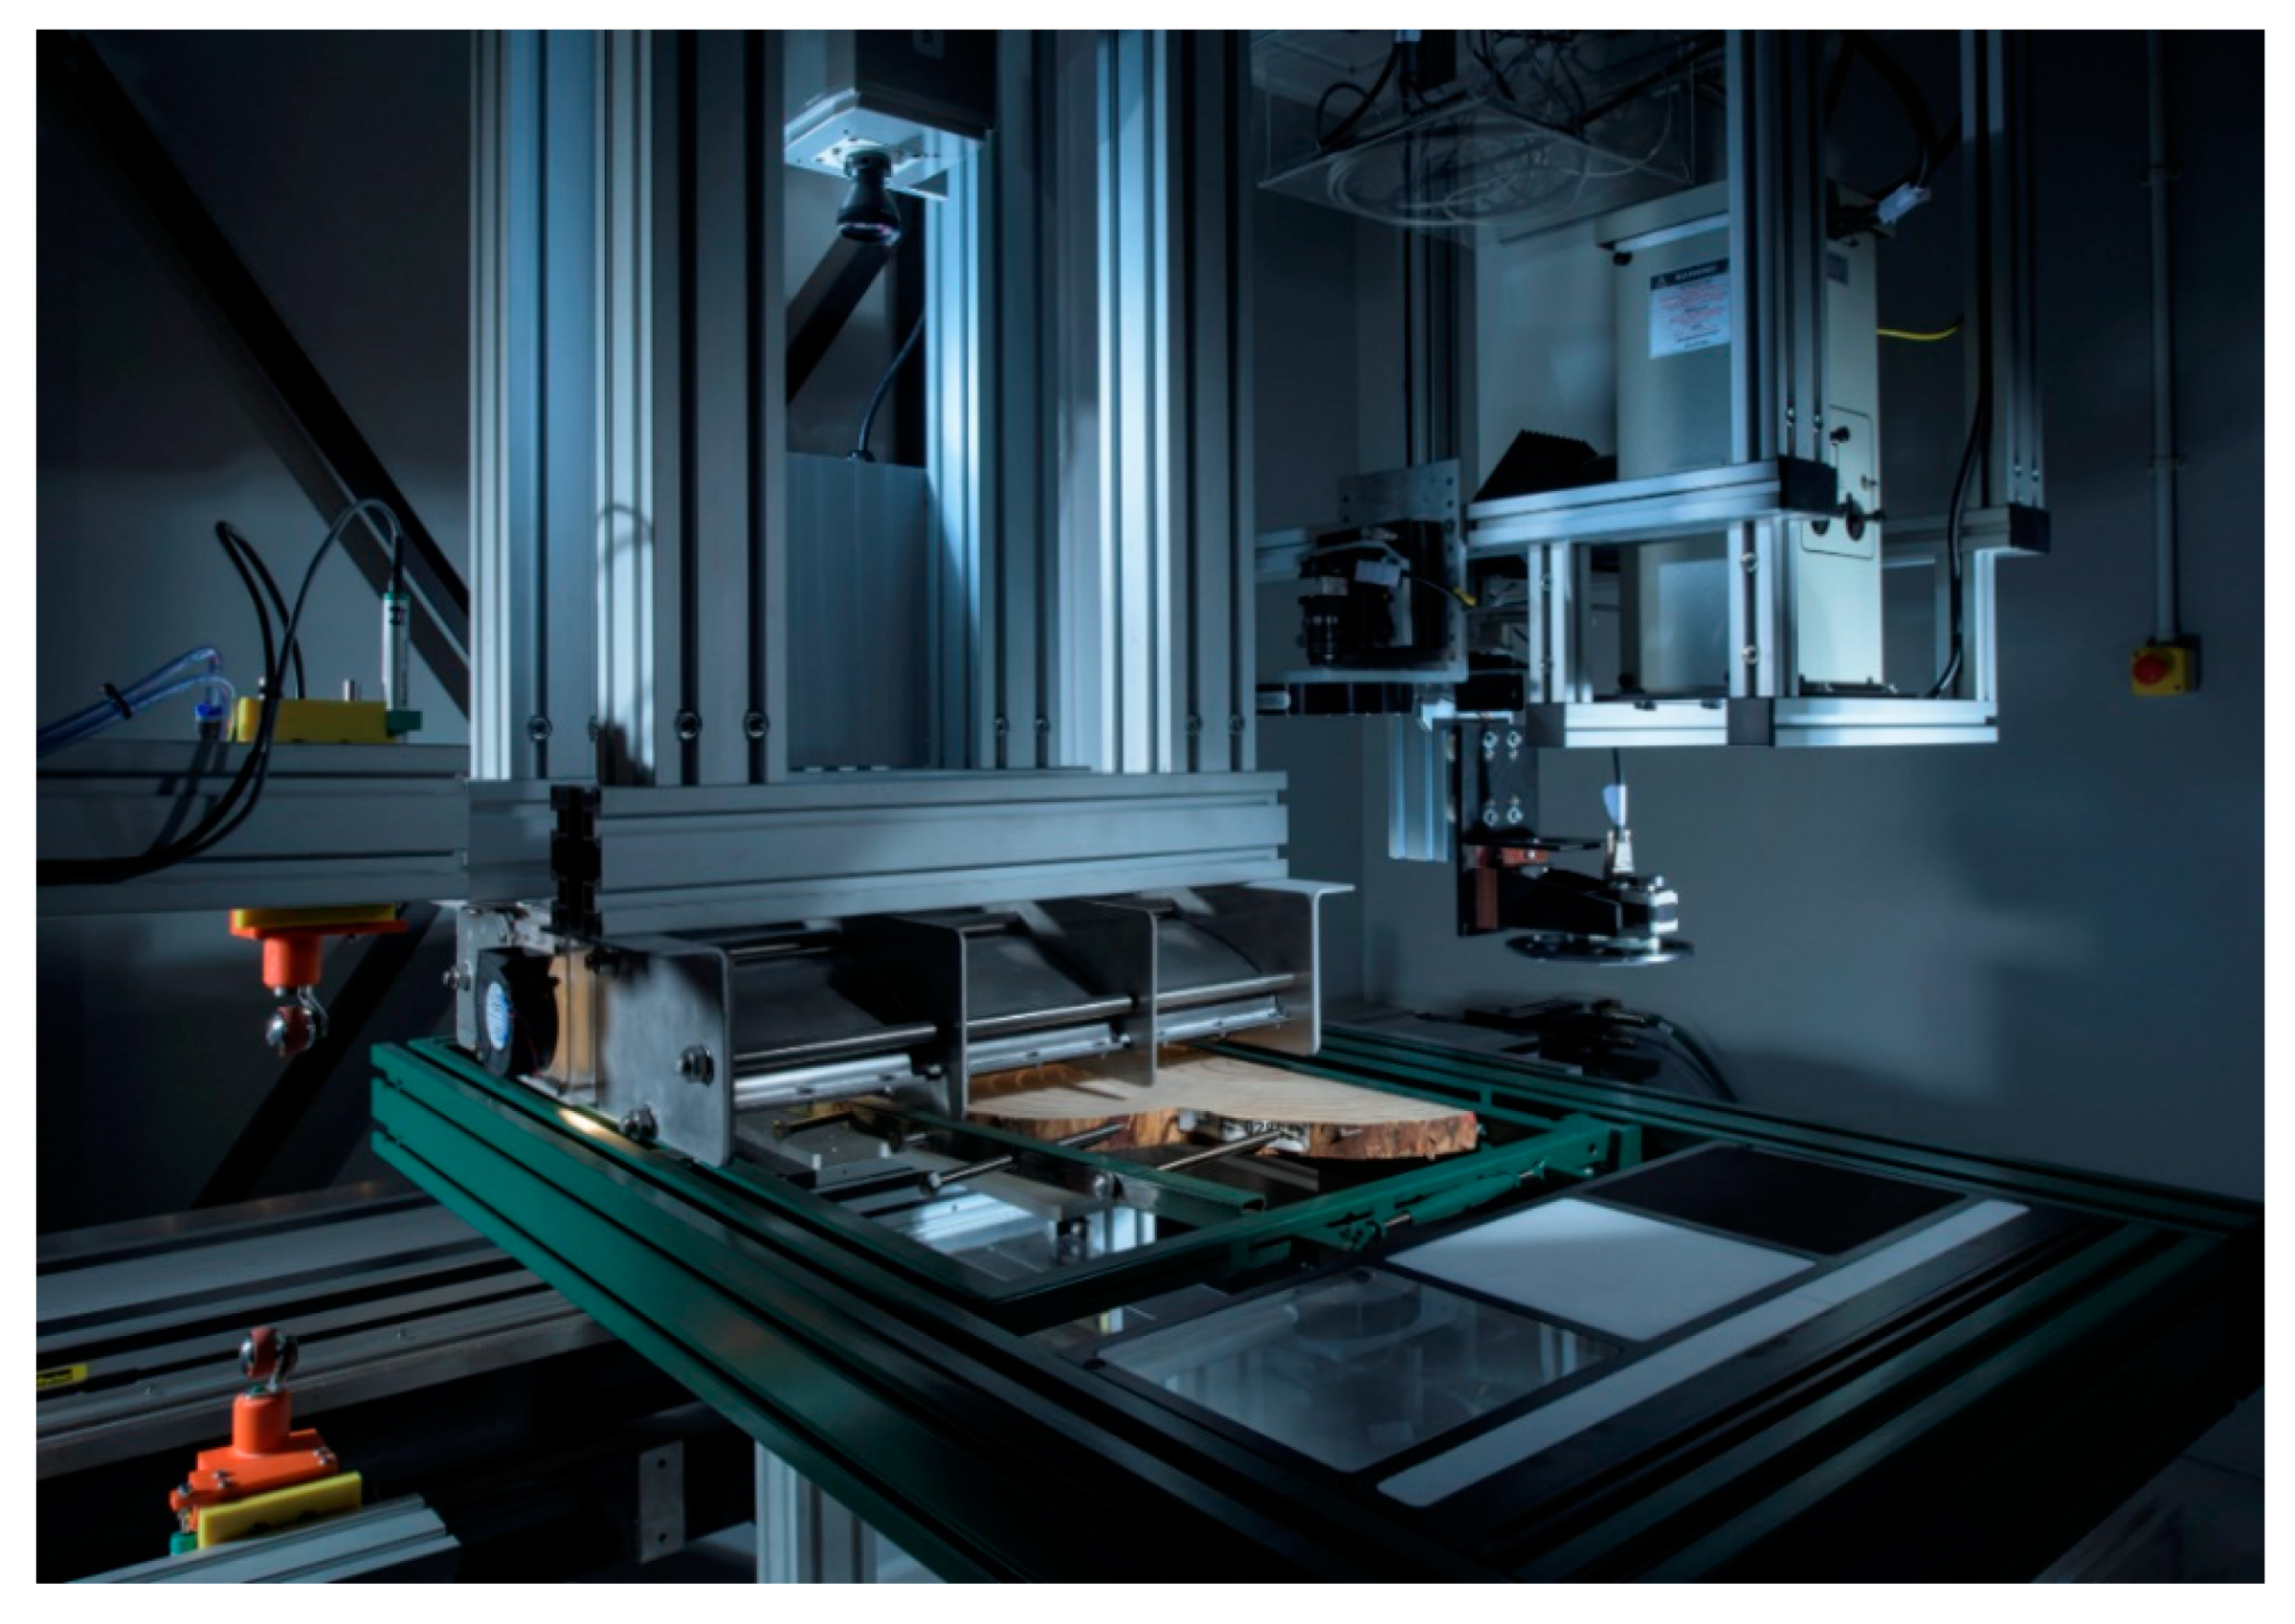
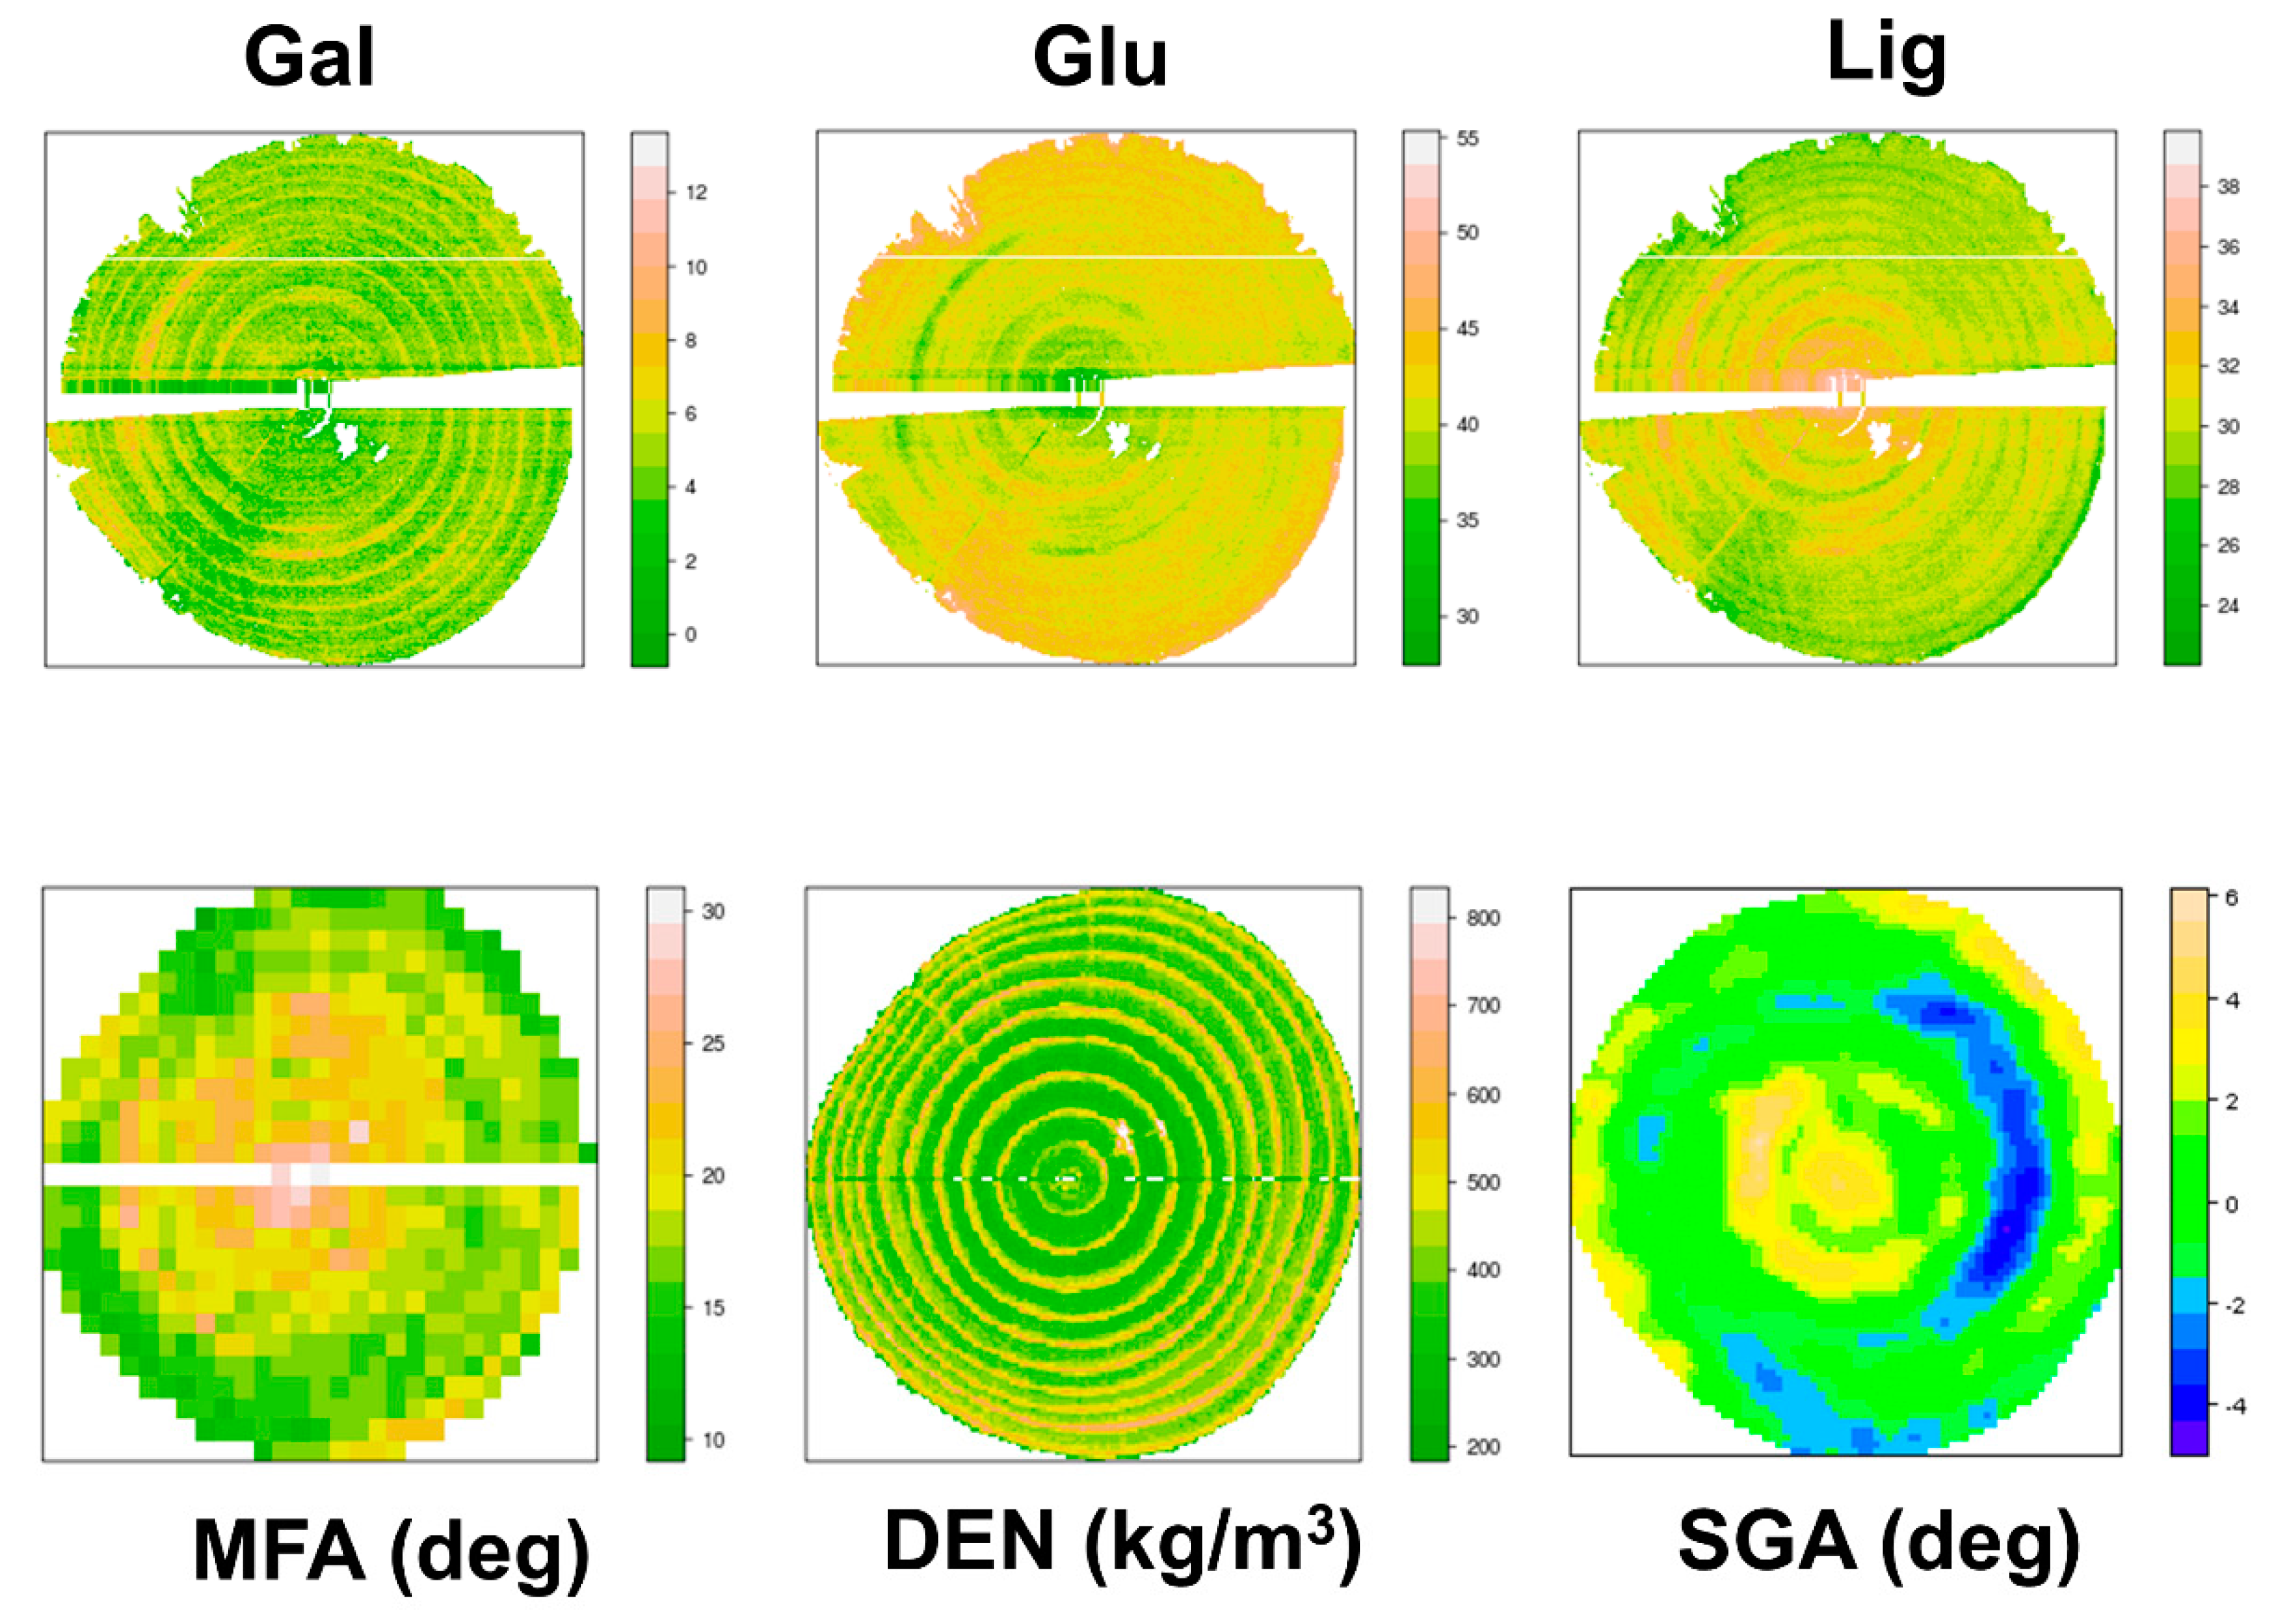
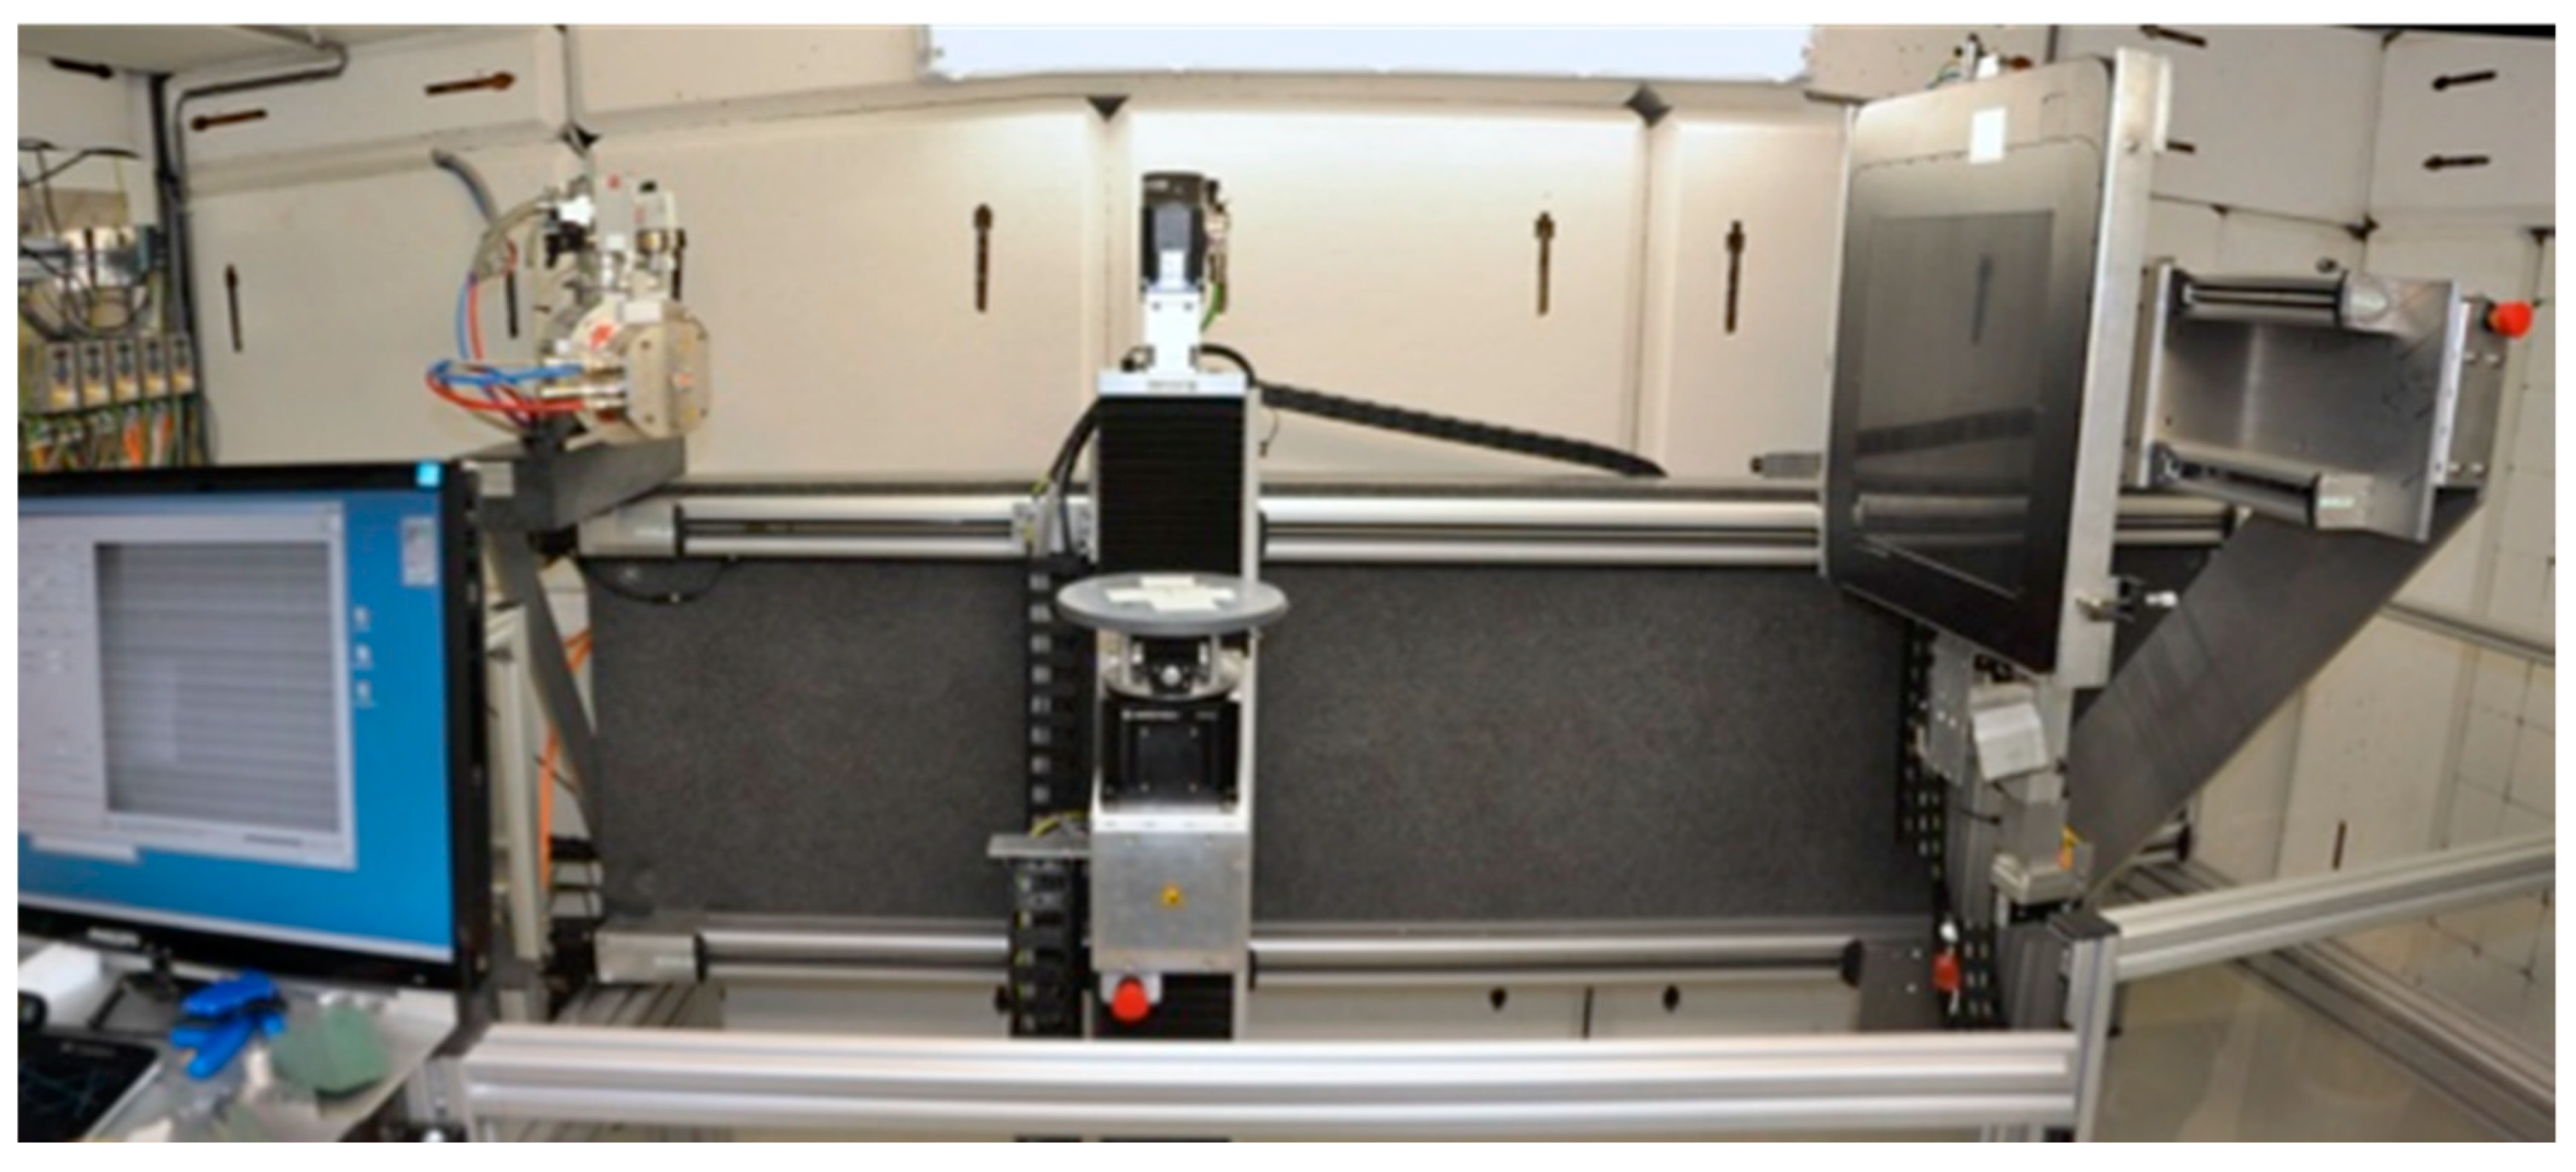
Figure 1. Loblolly pine radial strip before (top) and after (bottom) extraction.
Forests 10 00728 g001
Figure 2. A portable time of flight (TOF) acoustic tool for measuring acoustic velocity (AV) in standing trees (photo credit: Xiping Wang).
Forests 10 00728 g002
Figure 3. The Pilodyn wood tester (photo credit: Shan Gao).
Forests 10 00728 g003
Figure 4. Typical trace taken from breast height in a radiata pine grown in NSW, Australia.
Forests 10 00728 g004
Figure 5. User interface of a web-based platform for processing Resi traces to obtain trace-level metrics.
Forests 10 00728 g005
Figure 6. Characteristics of the Rigidimeter in its final version (from Pâques and Rozenberg, 2009) and setting up in an experimental trial of Populus in Chile.
Forests 10 00728 g006
Figure 7. Samples prepared for SilviScan analysis.
Forests 10 00728 g007
Figure 8. The three analysis components of SilviScan (Cell Scanner, Densitometer, Diffractometer).
Forests 10 00728 g008
Figure 9. Transmitted light images of a typical softwood (spruce) and hardwood (poplar).
Forests 10 00728 g009
Figure 10. Composite density image of a spruce sample (radial/longitudinal section). Brightness is proportional to density.
Forests 10 00728 g010
Figure 11. X-ray diffraction pattern of wood with fiber direction approximately vertical.
Forests 10 00728 g011
Figure 12. SilviScan-1.
Forests 10 00728 g012
Figure 13. SilviScan-2.
Forests 10 00728 g013
Figure 14. Left to right: SilviScan-3 Densitometer, Cell Scanner, Diffractometer.
Forests 10 00728 g014
Figure 15. Scion’s (New Zealand Forest Research Institute Limited) DiscBot.
Forests 10 00728 g015
Figure 16. Examples of wood property maps produced by the DiscBot for galactan content (Gal), glucose content (Glu), lignin content (Lig), microfibril angle (MFA), density (DEN), and grain angle (SGA).
Forests 10 00728 g016
Figure 17. A micro-computed tomography (µCT) system in use at Ghent University [285].
Forests 10 00728 g017
Figure 18. A 3D increment core of oak scanned at 35 µm resolution showing bark, early-wood vessels, and small and wide growth rings.
Forests 10 00728 g018
Table 1. Wood properties criteria used for early selection in a number of countries. Only criteria and tools used frequently are listed.
CountrySpeciesCriteria (Tool)Operational
ArgentinaEucalyptus globulus, E. grandis, E. dunniiCellulose and lignin content for genomic models (NIR)Research
AustraliaPinus radiataWood density (Resistograph)
Standing-tree AV with ST300/TreeSonic
Yes
Yes
Eucalyptus globulusWood density (resistograph)Yes
Eucalyptus nitensStanding-tree AV with Fakopp
Wood density (Resistograph)
Opportunistic
Research
Pinus elliottii var. elliottii × Pinus caribaea var. hondurensis hybrid
Pinus caribaea var. hondurensis
Pinus caribaea var. caribaea
Standing-tree AV with ST300
MOE (Resistograph, NIR, ultrasound)
Yes
Research
ChilePinus radiata
Eucalyptus globulus
Wood density, pulp yield, specific consumption (NIR)
S/G ratio, cellulose (NIR),
Wood density (Resistograph)
Yes
Research
Pinus radiata
Eucalyptus globulus
Standing-tree AV
Wood density, pulp yield (NIR)
Yes
Yes
FranceLarix sp.Wood density (Pilodyn, X-ray microdensitometry)
MOE (Rigidimeter)
Heartwood extractives (NIR)
Yes
Yes
Yes
Pinus pinasterWood density (Resistograph)
Spiral grain (Spiralite)
Lignin and cellulose content (NIR)
Microdensity to relate growth and climate (X-ray cores)
Yes
Yes
Research
Research
New ZealandPinus radiataWood density (Resistograph)
Standing-tree AV with ST300/Treetap
Yes
Yes
Eucalyptus bosistoanaExtractives content (NIR)Yes
USAPinus taeda
Pseudotsuga menziesii
Tsuga heterophylla
Wood density (Resistograph)
Standing-tree AV Treesonic
Standing-tree AV with Tree
SonicStanding-tree AV with TreeSonic
Yes
Yes
Yes
Mostly
Note: AV = acoustic velocity and MOE = modulus of elasticity.
Table 2. Applicability of different field based non-destructive evaluation (NDE) tools to operational and/or research scenarios.
Acoustics (TOF) (Velocity)Acoustics (Log) (Velocity)Pilodyn (Density)Resistograph (Density)Rigidimeter (Stiffness)
Scenario 1: large-scale assessment of plantation resource (note end use—solid wood or pulp will determine properties of interest)Possible to assess regional variation in velocity if large number of trees across the landscape are sampled at the same stand age.Post-harvest, more consistent velocity assessment compared to TOF.Outer wood density only limits applicability.Increasingly used to assess regional density variation. Only field tool giving radial variation data. Set-up time prohibitive to large scale-assessment.
Scenario 2: examination of radial/longitudinal variation within trees and development of maps depicting within-tree variationN/AN/AN/APotential to be used for examining within-tree variation.N/A
Scenario 3: assessment of silvicultural treatments on wood propertiesStand-level comparisons of silvicultural treatments.Stand-level comparisons of silvicultural treatments.N/APotential to be used for stand-level comparisons.Potential to be used for stand-level comparisons.
Scenario 4: utilization in breeding programs/tree improvement, (estimation of genetic parameters, ID of best families or clones)Provide ranking by velocity within stands. Heritability estimates for velocity.Heritability estimates for velocity.Assessment of outer wood density in young trees.Increasingly used in breeding programs as a surrogate for density, ranking.Provide ranking of individual tree stiffness. Genetic improvement of stiffness.
Scenario 5: correlation with product properties e.g., segregation of high/low stiffness materialN/AModerate relationships between log velocity and lumber and veneer stiffness.N/APotential to be used for correlation with product properties.N/A
Table 3. Applicability of different lab-based NDE tools to operational and/or research scenarios.
SilviScan (SS) (Density, Stiffness, MFA, Cell Properties *)NIR Spectroscopy (Wood Chemistry, MFA, Mech Props)DiscBot (+NIR) (Wood Chemistry, MFA, Mech Props, Spiral Grain)Ultrasonics (Radial) (Velocity)CT Scanning + (Density)µCT Scanning (Density, Cell Dimensions)
Scenario 1: large-scale assessment of plantation resource (end use—solid wood or pulp will determine properties of interest).High resolution and multiple properties. High cost vs. field options may limit application.Only tool to assess PY variation. High cost (NIR calibration required) vs. field options. Reduced resolution vs. SS but higher throughput. High cost but greater resolution vs. field options.Reduced resolution but lower cost than SS.Reduced resolution but lower cost than SS.Overly detailed information not required for scenario.
Scenario 2: examination of variation within trees and development of maps depicting within-tree variation.Data can examine within-tree variation at high resolution. Detailed tree maps. Lower resolution than SS. Can provide data for 2D or 3D mapping wood property variation within trees.Lower resolution than SS. Can provide data for 3D mapping of wood property variation within trees.Lower resolution than SS. Can provide data for 2D or 3D mapping.Lower resolution than SS or densitometry. Can provide data for 2D or 3D mapping.High-resolution measurements. Best suited for unique properties.
Scenario 3: assess impact of silvicultural treatments on wood properties.Resolution/accuracy sufficient to detect treatment differences (within-ring) for all properties (MFA costly).Resolution/accuracy sufficient for juvenile wood ring-level responses, groups of rings in mature wood (successful use not reported).Resolution/accuracy sufficient for juvenile wood ring-level responses, groups of rings in mature wood (use not reported).Resolution/accuracy sufficient for juvenile wood ring-level responses, groups of rings in mature wood (use not reported).Resolution/accuracy sufficient for juvenile wood ring-level responses, groups of rings in mature wood (use not reported).Resolution/accuracy sufficient but use not reported.
Scenario 4: dendrochronological study of environmental effects on wood properties.Resolution/accuracy sufficient.Resolution /accuracy not sufficient.Resolution not sufficient.Resolution not sufficient.Resolution not sufficient.Resolution/accuracy sufficient but use not reported.
Scenario 5: utilization in breeding programs/tree improvement, (estimation of genetic parameters, ID of best families or clones).Estimation of genetic parameters, often at ring-level.Assessment of PY and extractives, genetic parameters for many wood properties provided calibration exists. Use not reported but could provide data for all properties measured.Use not reported but could provide data.Use not reported but could provide data.Use not reported but could provide data. Other tools better suited.
Scenario 6: utilization in breeding programs for detection of genetic markers (QTL’s) and association mapping for wood properties.Data used to detect markers for properties measured.Data used to detect markers for properties (NIR calibration required).Use not reported but could provide data for all properties measured.Use not reported but could provide data.Use not reported but could provide data.Use not reported but could provide data.
Note: MFA = microfibril angle, PY = pulp yield, mech props = mechanical properties and includes density, modulus of elasticity (stiffness) and modulus of rupture (strength). * Tracheid properties measured by SilviScan include: wall thickness, tangential diameter, radial diameter, coarseness, specific surface area, and cell population. + CT scanning can be expensive but processing samples in batches would reduce cost.
Table 4. Summary of key features of each NDE tool.
Availability (Yes = Tool on Market, No = In-House Solution)Ease of Setup (High = Easy to Setup, Low = Expert Required)Sample Preparation (Varies for Lab-Based Tools Based on Property)Number of Samples per Day (Approximate)ResolutionRelative Cost (In-House Development = Higher Costs)
In-field
Acoustics (tree)YesHighNone50mLow
Acoustics (log)YesHighNone2500 (logs cut to length)
15 small trees (2 people, fell trees, delimb)
mLow
PilodynYesHighNone800 (young trees, bark intact)
150 (trees older must debark)
cmLow
ResistographYesHighNone300–400 (if entering tree ID’s)mmLow to Medium
RigidimeterYesMediumNone50mMedium
Lab-based
NIR spectroscopyYes (but in-house calibration required)LowModerate 1/variable (solid or milled wood) 25–35 (intact cores, 1 mm steps)
100 (drill swarf/shavings)
25 (wood chips or cores)
Includes grinding and analysis
mmMedium (in-house calibration can be costly)
SilviScan (SS) (operations separate)NoLowVaries (polished surface for image analysis)(Assume 100 mm long sample)
SS Cell imagingNoLowSurface quality critical15–20µmHigh
SS DensitometryNoLowModerate 130 (ring orientation tracked)–140µmMedium
SS Diffractometry (MFA)NoLowModerate 160–100 (10 mm steps)
15–30 (2 mm steps)
4–9 (0.5 mm steps)
1–2 (0.1 mm steps)
mm
mm
mm
mm
Medium-High
High
High
High
X-ray densitometryYesMedium to LowModerate 115 (20 µm steps)
45 (60 µm steps)
Ring counting separate
µmMedium
Acoustics (radial)NoLowModerate 160mmMedium
DiscBot (DB)NoLowModerate 150mmHigh
Spiral grain (DB)NoLowModerate 150mmMedium
CT ScanningYesMedium to LowMinimalSeveral 1000 (mm resolution)mmMedium
Micro CT ScanningYesMedium to LowMinimal150 (60 µm resolution)µmHigh
1 Consistent preparation required.

