Does Land Use Change Affect Green Space Water Use? An Analysis of the Haihe River Basin

1
School of Economics and Management, Beijing Forestry University, Beijing 100083, China
2
Institute of Geographic Sciences and Natural Resources Research, CAS, Beijing 100101, China
3
University of Chinese Academy of Sciences, Beijing 100049, China
*
Author to whom correspondence should be addressed.
Forests 2019, 10(7), 545; https://doi.org/10.3390/f10070545
Submission received: 29 May 2019
/
Revised: 21 June 2019
/
Accepted: 26 June 2019
/
Published: 28 June 2019
(This article belongs to the Special Issue Watershed Scale Forest Restoration and Sustainable Development)
Abstract
:Research Highlights: Land use/cover change (LUCC) has an impact on the water use efficiency (WUE) of green space in the Haihe River Basin. Background and Objectives: The Haihe River Basin has historically been one of the most water-stressed basins in China. With the increase in green space and economic development, land use and water use in the Haihe River Basin have changed significantly. In order to contribute to the sustainable development of basin water management, the impacts of LUCC on the WUE of the Haihe River Basin were assessed with the goal to support decision makers with regard to water resources planning and watershed management. Materials and Methods: (1) Moderate Resolution Imaging Spectroradiometer (MODIS) data and land use data were used to produce land use/land cover and other related maps. (2) The WUE equation was used to calculate the green space WUE. (3) The contribution rates of changes in land use were assessed to illustrate how LUCC affected green space WUE. Results: (1) Artificial surfaces increased and large areas of farmland were converted to non-agricultural use, accompanied by the addition of green space. (2) Green space WUE increased significantly from 2005 to 2015. The average annual WUE exhibited a relatively uniform spatial distribution in the Haihe River Basin. Except for the central area of urban land, the WUE of most areas exhibited an increasing trend. (3) The impact of LUCC on WUE was mainly a result from the conversion of farmland and artificial surfaces and the increase in green space. Ecological restoration and crop adjustment contributed greatly to the improvement in green space WUE in the basin. Conclusions: Green space WUE of the Haihe River Basin was significantly affected by LUCC and there is room for improvement in the WUE of green spaces in the basin. The paper concludes with recommendations for further research to assist in planning for green space to promote sustainable development related to land use and water management.
1. Introduction
The shortage of water resources threatens economic development and the overall wellbeing of humankind in many parts of the world [1,2,3]. According to the World Water Assessment Plan (WWAP) report released by the United Nations in 2019, severe water shortages affect approximately four billion people, accounting for nearly two-thirds of the world’s population [4]. The sustainability of water consumption is an urgent goal [5,6]. River basins are associated with the birthplace of human civilization and they have become more prominent with regard to water management issues [7]. River basin planning plays an important role in promoting sustainable development and utilization of water resources, and gives full opportunity to the maximum comprehensive efficiency of a river basin [8]. However, global changes such as climate change and land use/cover change (LUCC) have already had an identifiable impact on ecosystems and the role of green spaces in environmental management and livability have become apparent [9,10]. Green space is one of the basic elements of river basins and includes urban forests, suburban farmland, green gardens, and vertical planting [11]. For every 10% increase in the average income of residents, the demand for green space will increase by 1% [12]. In addition, the development of green spaces is often accompanied by a rapid increase in water use [13,14]. According to the census bulletin, the annual ecological and environmental water consumption in China reached 10.64 billion m3 and is growing rapidly [15]. Coordinating the development of green space and the sustainable use of water resources becomes a necessary means to achieve sustainable development of the basin.
Many countries have developed specific management plans for river basins according to natural and social conditions, and economically developed watersheds are better targets for collaborative governance or autonomous management [16,17]. In China, watershed management has been mostly focused on the restoration of ecosystems; for example, in the Poyang Lake Basin, the implementation of the Mountain-River-Lake (MRL) Program have significantly increased the forest area, which decreased ecological risk in the basin [18]. In addition, many researchers have paid attention to watershed dynamics: Some have focused on vegetation dynamics and groundwater fluctuations [19], whereas others are committed to achieving water balance in the basin [20]. Keys et al. [21] showed that nearly a fifth of annual average precipitation falling on land is the result of vegetation-regulated moisture recycling, while Jenerette et al. [22] claimed that increasing vegetation is one strategy for moderating regional climate change and simultaneously providing multiple ecosystem services. With regard to green space, there has been a greater focus on water-related ecosystem services, such as the cool island effect and rainwater-runoff reduction [23,24]. Researchers used the Luan River Basin in China as an example to evaluate the water ecosystem services and their value. It was found that almost all the economic value of ecosystem services came from water, and the proportions of the economic values of water-related ecosystem services to the total value of ecosystem services exceeded 5% [25]. Although there is growing recognition of the importance of green space planning and water resources, there are few analyses of the inclusion of these parameters in plans and strategies from the perspective of land use and development [26]. In addition, water use efficiency (WUE) has been defined as the ratio of the weight of dry matter produced to the amount of water transpired [27], which is considered as an essential indicator of the hydrological cycle responding to environmental changes [28,29]. Many experts and scholars have investigated WUE of different river basins [30,31] and some studies have researched agricultural irrigation efficiency [32]. The results indicate that more researchers are focused on assessing the WUE in different regions, but few studies have linked WUE changes with human activities.
The Haihe River basin of Northern China has experienced rapid economic transition in recent decades. The river basin is considered the political, economic, and cultural center of China. The area can be described as “the circle of economy around the capital” and is also the largest and most dynamic region in northern China [33]. The Haihe River basin has historically been one of the most water-stressed basins in China [34]. With less than 1.3% of Chinese water resources, the Haihe River Basin serves 10% of the Chinese population and 11% of the farmland, and provides 13% of China’s Gross Domestic Product (GDP). Water shortage is the major bottleneck that limits sustainable development in the basin [35]. In order to improve the environment, large-scale forest plantation projects were implemented at the end of the 20th century in China. In recent years, the Three-North Shelter Forest Project (TNSFP), Beijing-Tianjin Sandstorm Source Control (BTSSC) Project, Plain Afforestation in Beijing Project (PABP), and others have been completed on schedule and provided social and ecological benefits. As a result, there is growing pressure on environmental water use in the Haihe River Basin, which increased from 1.0% in 2005 to 9.1% in 2017 [36]. With the increase in green space and economic development, both land use and water use in the Haihe River Basin have changed dramatically. Since the Haihe River Basin is a heavily urbanized area in China, the comprehensive management of land use and water resources requires our attention [37].
In this study, our goal was to contribute to the sustainable development of basin water management by assessing the impacts of LUCC on the WUE of the Haihe River Basin. In particular, the objectives are 1) to determine LUCC from 2005 to 2015 in the Haihe River Basin, 2) to determine the temporal and spatial variation of green space WUE, and 3) to assess the influence of LUCC on the WUE. The link between WUE and LUCC is vital to obtain a better understanding of how and why WUE varies and to support decision makers with regard to water resource planning and management.
2. Materials and Methods
2.1. Study Area
The Haihe River basin (Figure 1) is located between 112° E–120° E and 35° N–43° N and is the largest river system in North China. It is bounded by the Bohai Sea in the east, the Yellow River in the south, the Taihang Mountains in the west, and the Mongolian Plateau in the north [38]. The area of the Haihe River Basin is 318,000 km2, accounting for 3.3% of China’s total area. The climate of the Haihe River Basin is a temperate East Asian monsoon climate. It is the region with the least amount of precipitation on the eastern coast of China and is located in a semi-humid and semi-arid zone [39]. The Haihe River Basin is densely populated and there are many large and medium cities. It holds an important strategic position in national economic and social developments [40]. In addition, the Haihe River Basin is also an important food production area in China. The basin provides numerous food crops (wheat, rice, corn, etc.) and cash crops (cotton, peanuts, sesame, etc.) to adjacent areas. The area of crop cultivation accounts for nearly half of the basin, which leads to a large amount of irrigation water. Agricultural water consumption exceeds 60% of the total water consumption [36]. The Haihe River basin is one of the most water-stressed regions in China and the per capita total water resources are less than 300 m3 [41]. Population growth and economic developments have caused changes in water consumption patterns in the basin [42]. The water environment has deteriorated significantly in recent years due to limited runoff and uneven temporal and spatial rainfall distribution. This has caused a number of severe environmental problems in the basin, such as the drying-up of the river system, land subsidence due to over-exploitation of groundwater, and degradation of lakes and wetlands [43].
2.2. Data Collection and Preprocessing
The water resources and precipitation data in the Haihe River Basin were derived from the Haihe River Water Bulletin and the Haihe River Water Conservancy Commission (MWR) [36]. The land use data (resolution: 1 km) in 2005 and 2015 were provided by the Data Center for Resources and Environmental Sciences (RESDC) at the Chinese Academy of Sciences (CAS) [44], and the classification system was the land use classification of the CAS. For the net primary productivity (NPP) data (resolution: 1 km) for the Haihe River Basin from 2005 to 2015, we used the Moderate Resolution Imaging Spectroradiometer (MODIS)17A2-8 days products and the evapotranspiration (ET) data (resolution: 500 m) were the MODIS16A2-8 days products [45].
In order to obtain accurate results for the relationship between the dynamic change of the green space WUE and land use/cover, we preprocessed the data. The ET data were resampled to 1 km resolution. We eliminated the outliers in the MODIS data and set null values. In consideration of the lower resolution of remote sensing image of the basic data, the green space was divided into four classes: woodland, grassland, farmland, and water; artificial surface and bare land were taken as the background types for analysis. However, since our focus was the water use of green space, the water was removed from the land use/cover types during processing.
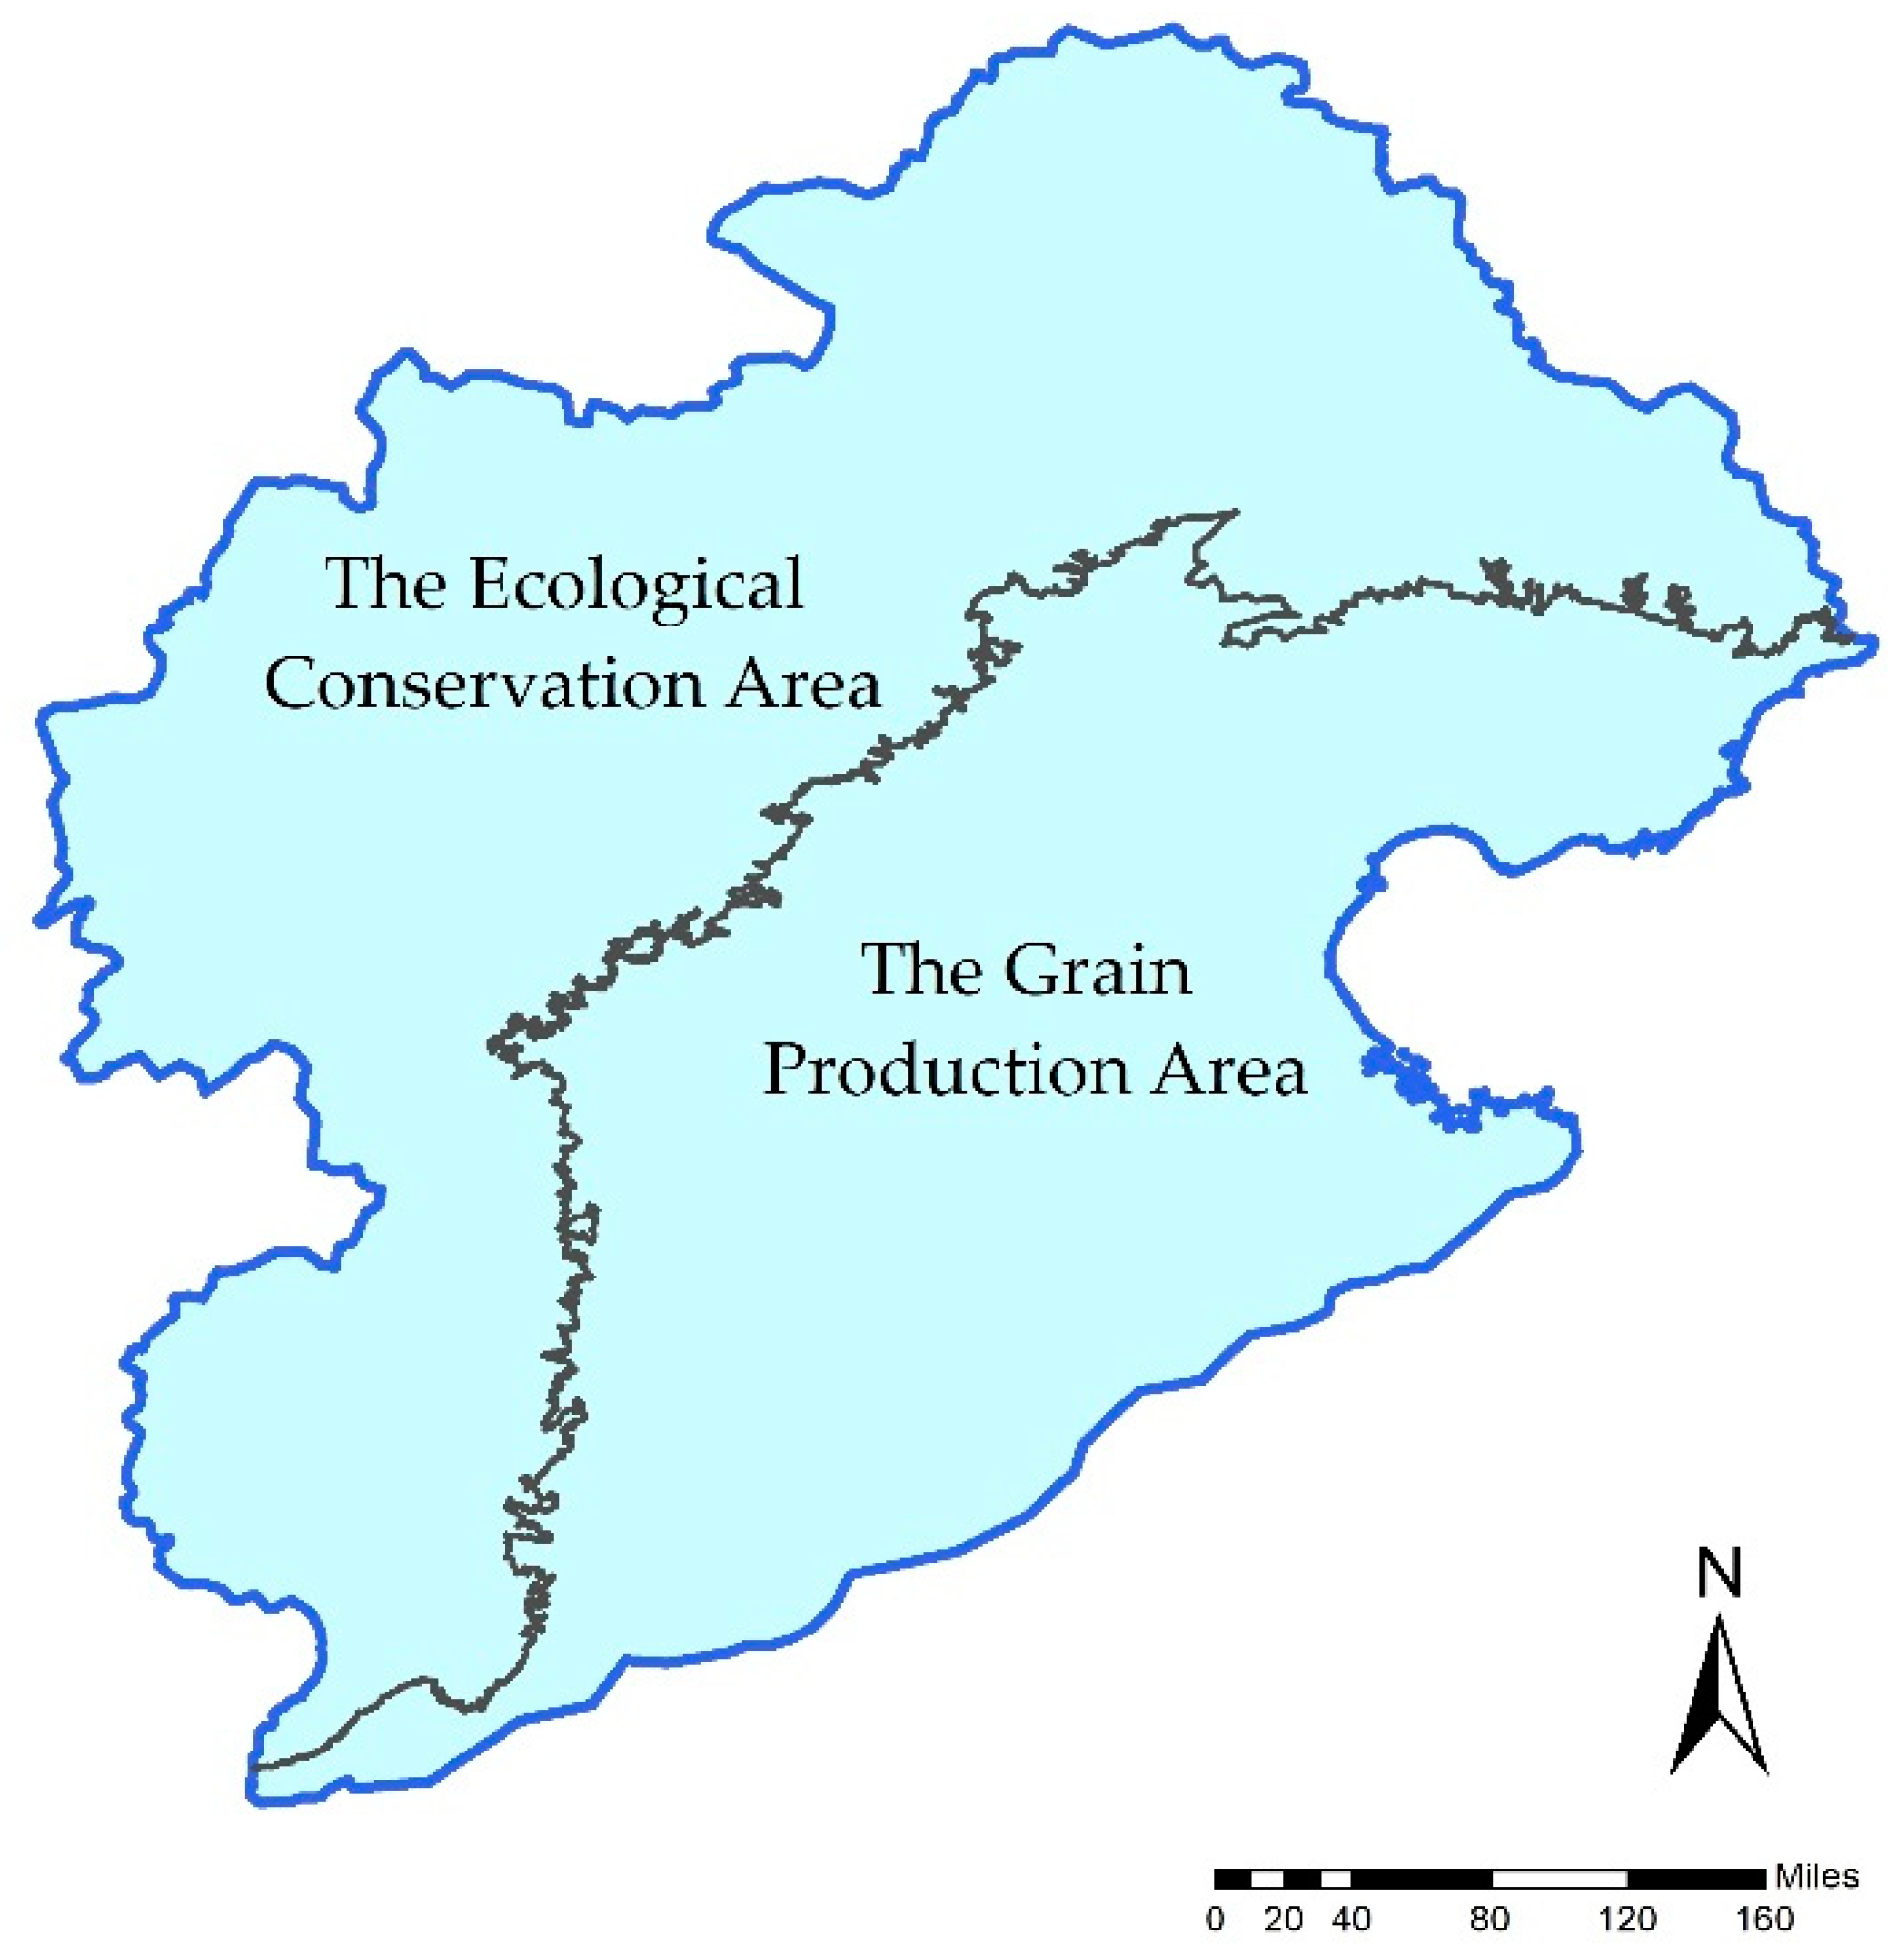
In order to eliminate the influences of temporal and spatial variation on green space WUE, we divided the Haihe River Basin into two areas, namely, the grain production area and the ecological conservation area (Figure 2). The grain production area is the North China Plain area with an altitude of less than 200 m and the ecological conservation area is the North China Mountain area with an altitude higher than 200 m. The grain production area is almost entirely covered by farmland; winter wheat/summer maize and cotton are grown in the southern and central regions and fruit trees, vegetables, and rice are grown in the northern region, which also has little parts of forested areas. The ecological conservation area consists of the Taihang Mountains in the west, the Yanshan Mountains and hilly areas in the north, and a small part of the Bashang Grassland on the northernmost boundary; the land use/cover consists of trees, shrubs, grass, and some farmland.
2.3. Data Analysis Methods
2.3.1. Land Use Transition Matrix
In this study, a land use/cover transition matrix was used to investigate the LUCC in 2005 and 2015; the matrix was generated by overlaying the land use maps of the two periods in ArcGIS (Table 1) [46]. The land use/cover transition matrix lists the areas of change between the classes in a matrix and reflects the transformation between different classes. Land use transition matrices are widely used in the studies of landscape ecology and Geographic Information System (GIS) [47].
In the matrix, rows A1-An represent the land use type at time T1, while columns A1-An at time T2. Diagonal Pii is the area of the land use type that has not changed during the period. Pij (Pji) is the area where Ai (Aj) converted to Aj (Ai). Rows P1-Pn represent the total area of corresponding types at time T2, while columns A1-An represent the area at time T1.
2.3.2. Water Use Efficiency (WUE)
The green space WUE was calculated by using the WUE equation [48]. We used the ordinary least squares (OLS) method to estimate the trends of change in the WUE from 2005 to 2015 [49]:
where is the mean annual green space water use efficiency (g C mm−1 m−2); is the mean annual net primary productivity (g C m−2); is the mean annual evapotranspiration (mm); is the study year and 1 represents 2005, 2 represents 2006, …, and 11 represents 2015.
In the OLS estimation, represents the slope of the linear regression equation, where is the number of years (n = 11), is the year, and is the green space WUE for the year. If slope > 0, it means that the trend of the green space WUE is increasing, and vice versa.
In addition, standard deviation was used to reflect the dispersion of the NPP, ET, and WUE [50].
2.3.3. Contribution Rates of Changes in Land Use
Contribution rates of changes in land use have been widely used to evaluate the responses of the environment to certain influencing factors [51]. We used the contribution rates of changes in land use/cover to illustrate how LUCC affected WUE in the Haihe River Basin. The contribution rate refers to the changes in the green space WUE caused by a certain type of land use transition and is defined as follows:
where indicates the contribution rates of changes in land use/cover to changes in the WUE. and respectively refer to the average annual WUE of the final (Aj) and initial (Ai) land use types in the study period in the Haihe River Basin. is the area of the changed type. TA is the total area of the Haihe River Basin.
3. Results
3.1. Land Use Changes in the Haihe River Basin
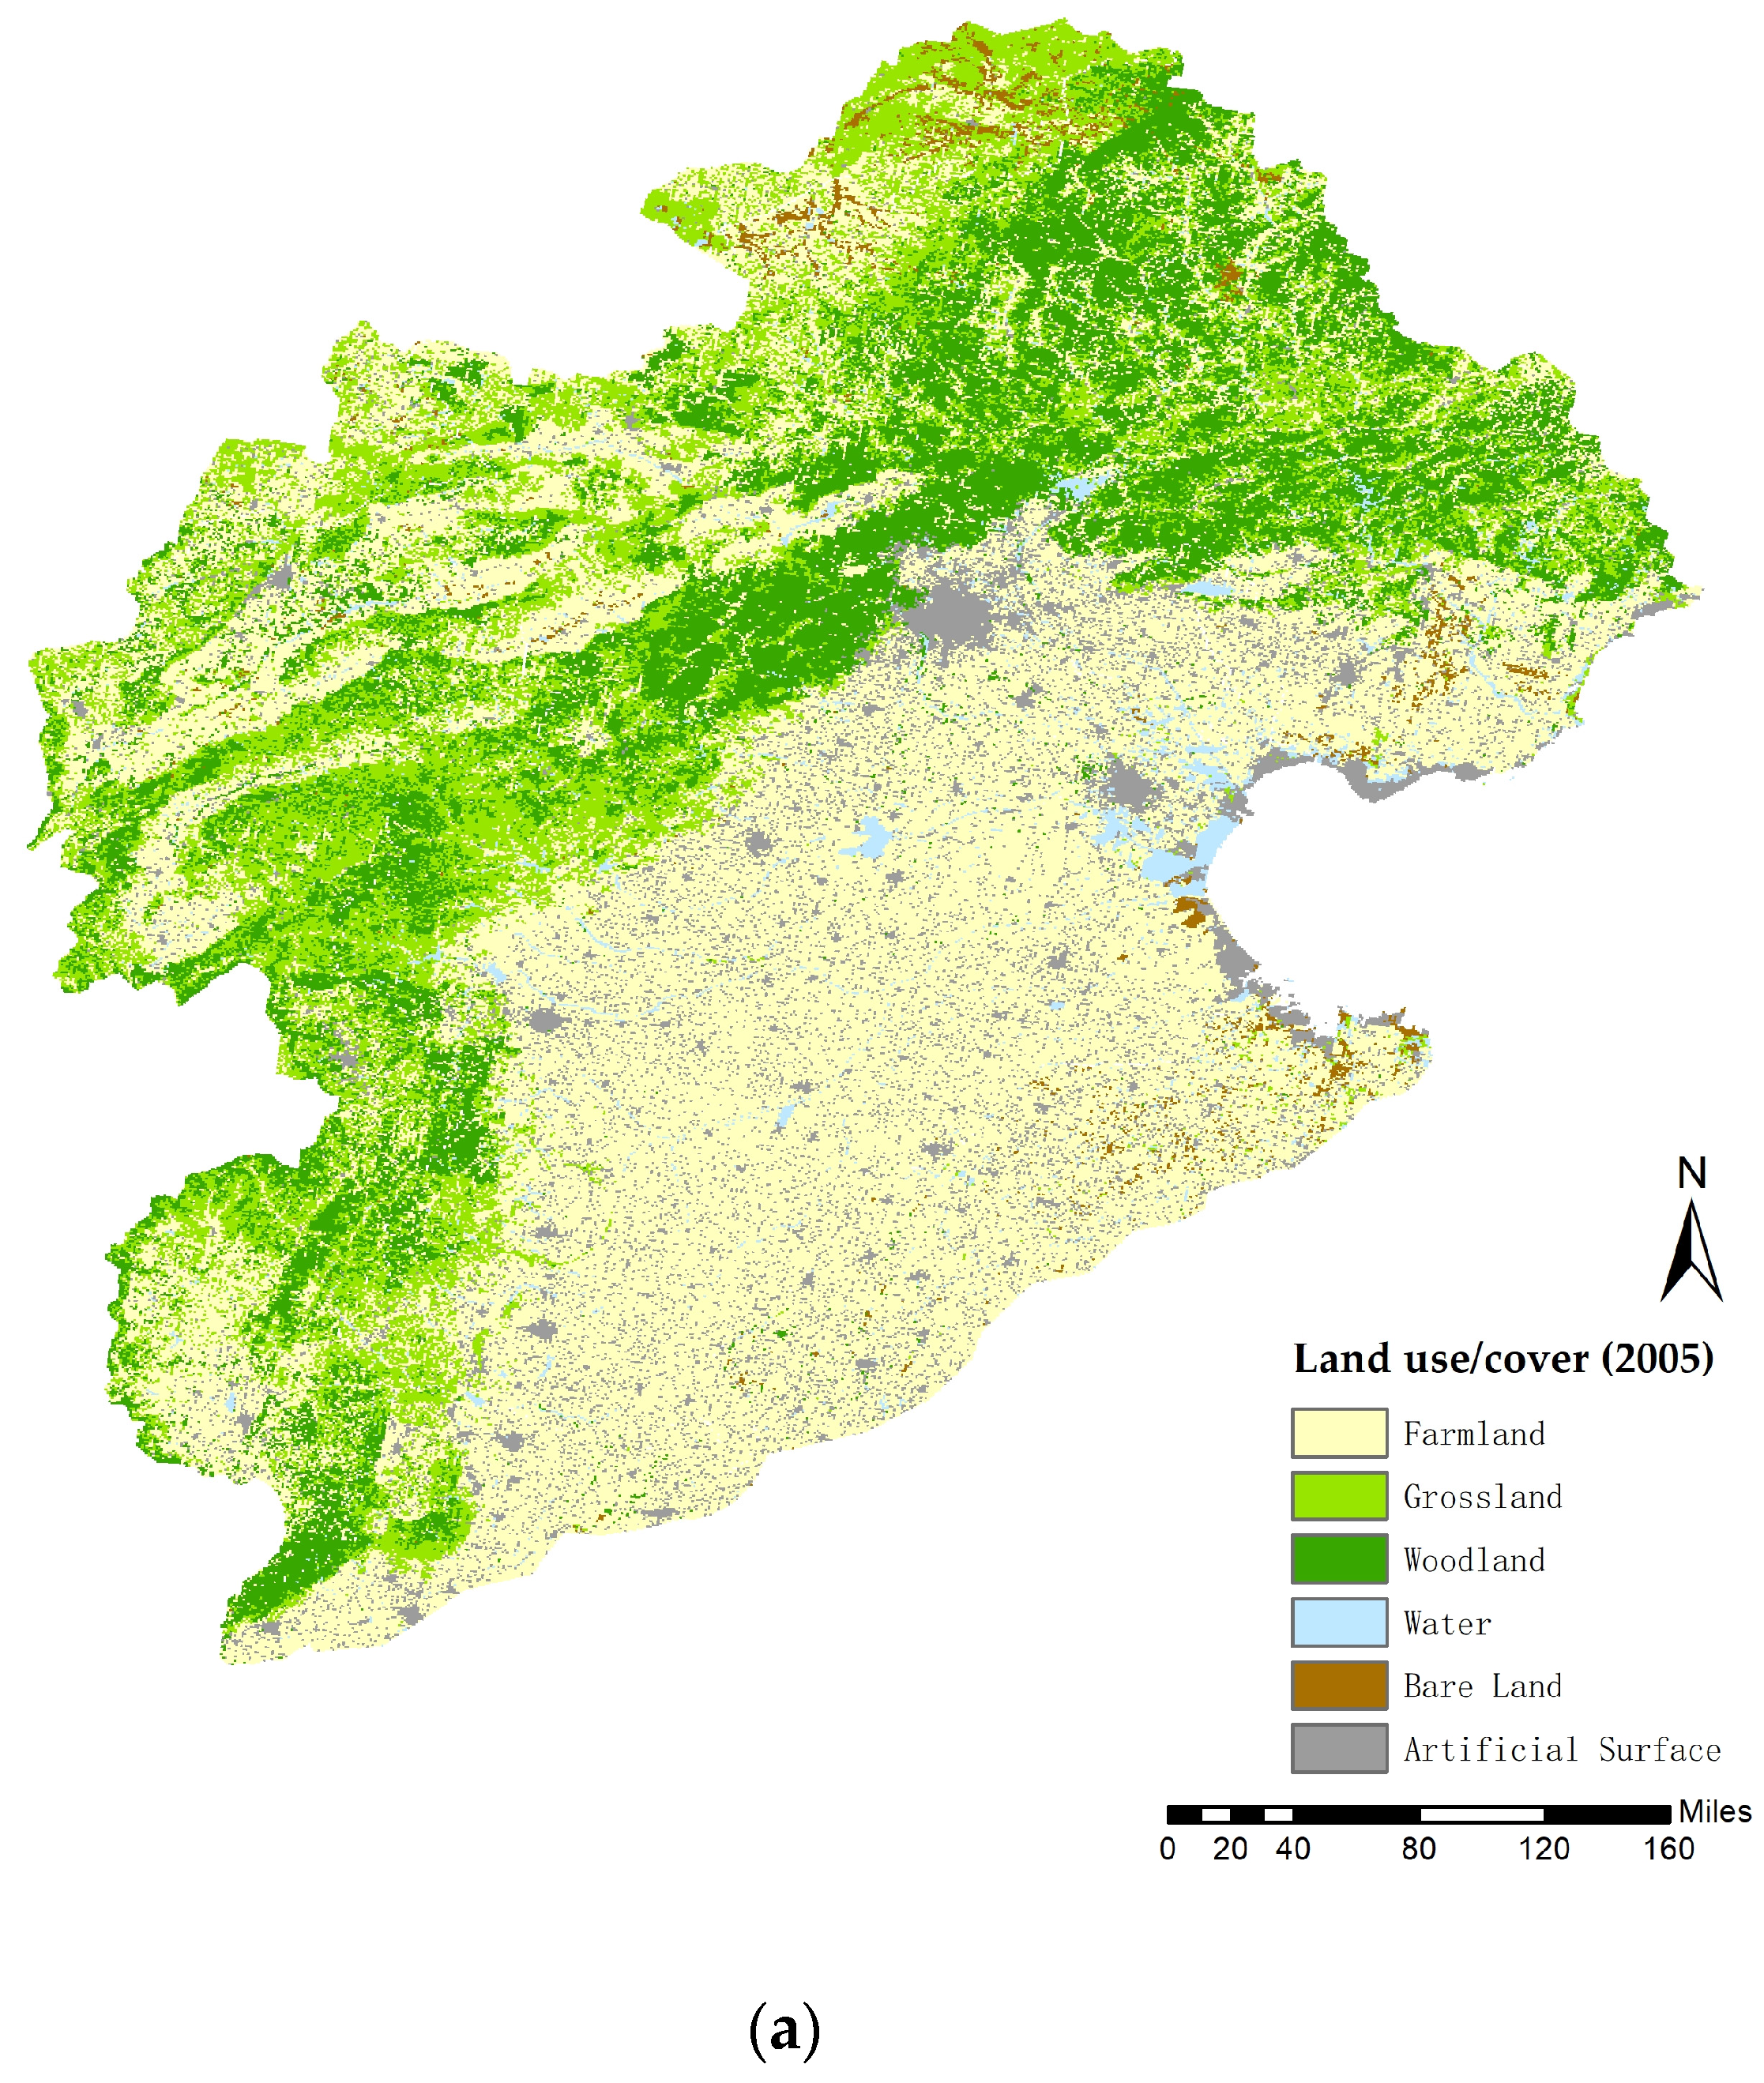
The spatial pattern of the land use/cover in 2005 and 2015 are shown in Figure 3a,b and the LUCC is shown in Figure 3c. In recent years, the land use structure of the Haihe River Basin was dominated by farmland, woodland, and grassland. Artificial surfaces were scattered throughout the basin but were mostly concentrated in Beijing, Tianjin, and the Bohai Sea coastal areas. In addition to the Haihe River, there are also several reservoirs in the basin.
Overall, the spatial distribution of land use/cover in the Haihe River Basin remained stable from 2005 to 2015 and only a few land use types changed significantly. Artificial surfaces expanded dramatically, which mostly occurred near the cities. New farmland that transitioned from other land types occurred in Tianjin in the northeast of the grain production area. In areas around reservoirs in Tianjin, such as Yuqiao and Tuanpowa, much new farmland was developed in woodland and grassland areas. There were large areas that were transformed from other classes to woodland and grassland around the reservoirs in Tianjin. New woodland also occurred in the northwest of the Taihang Mountain in Shanxi, while new grassland was observed in the northernmost point of the ecological conservation area in the Bashang Grassland.
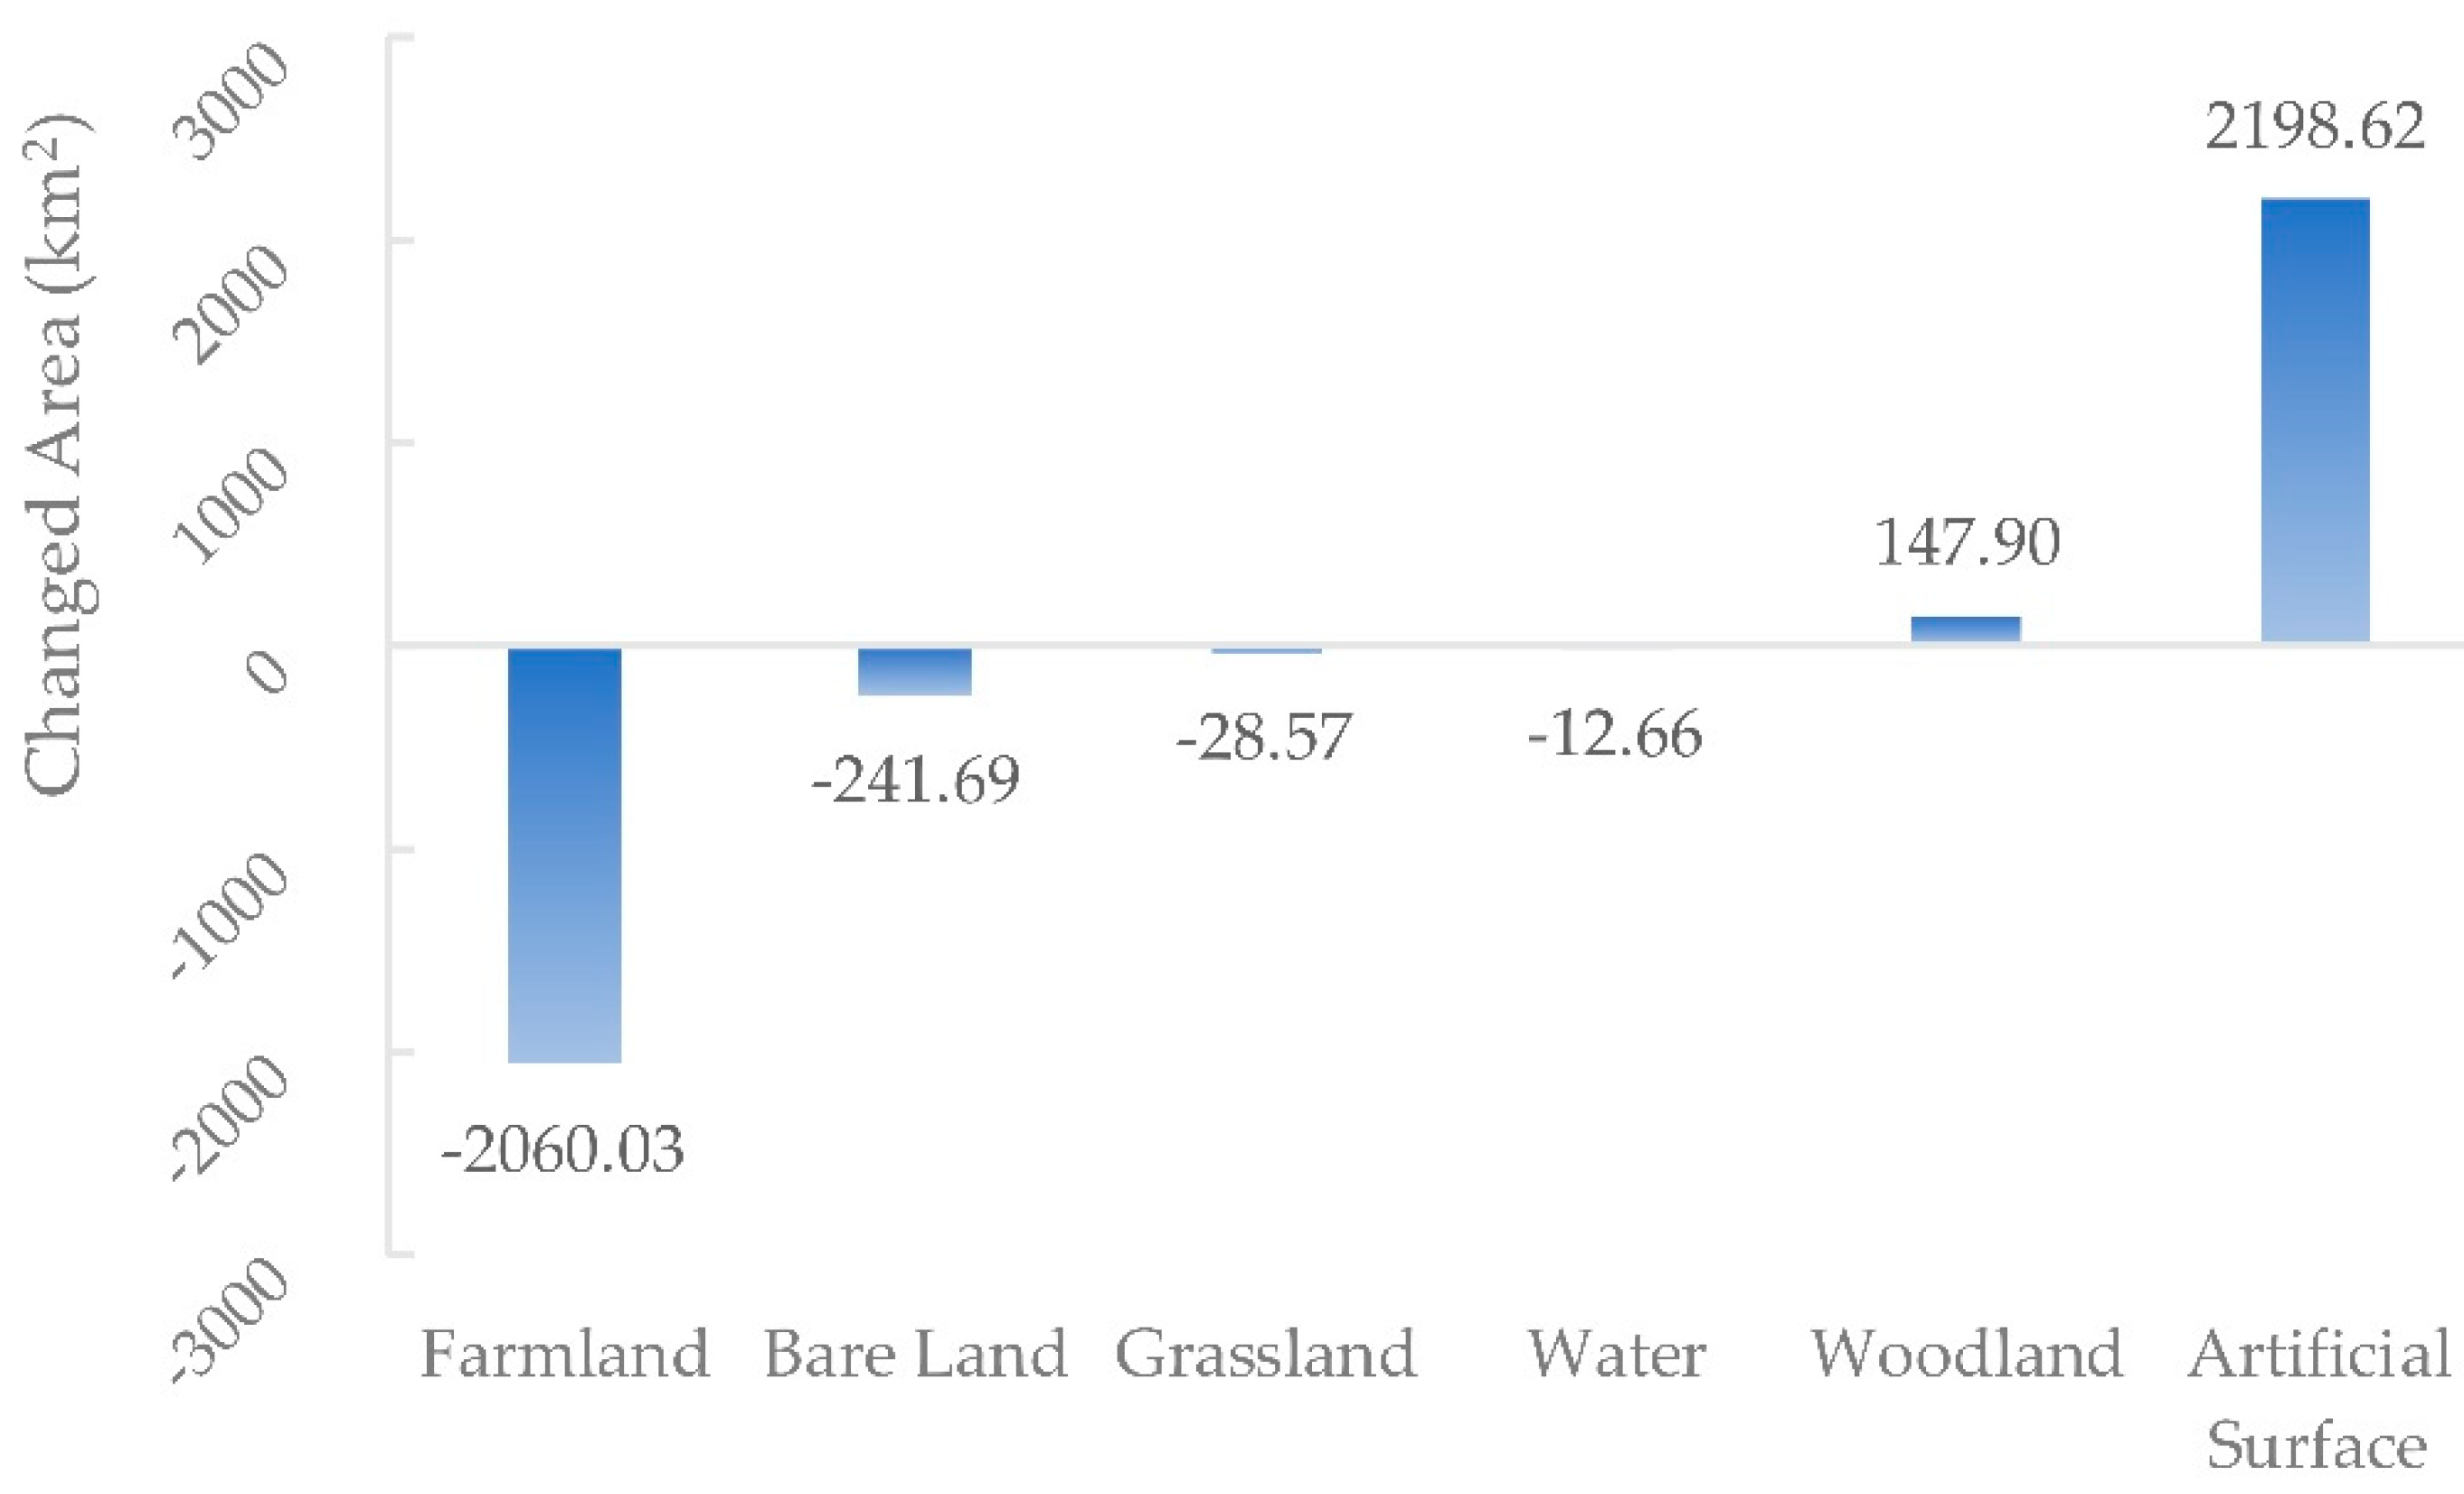
The land use/cover transition matrix (Table 2) shows the area of the land use/cover changes and the total area changes of each type are shown in Figure 4. In Figure 4, the most significant features are the increase in the artificial surfaces and the reduction in farmland. As shown in Table 2, the largest area of change was the transition from farmland to artificial surfaces, followed by the transition from artificial surfaces to farmland; these two transitions accounted for about 1/3 of the total transition area. The non-agricultural transformation of farmland is an obvious feature of LUCC. Areas that transitioned from farmland were generally larger than other types of transitions, for example, changes from farmland to woodland and grassland accounted for approximately 300 km2. Meanwhile, much of the bare land was converted to other land use types.
3.2. Temporal and Spatial Variations of WUE, NPP, and ET
3.2.1. Interannual Variations
The annual NPP varied from 166.69 g C m−2 to 413.32 g C m−2 from 2005 to 2015 (Figure 5). The variation of NPP fluctuated considerably. The mean NPP was 285.41 g C m−2 and standard deviation (SD) was 97.04. The minimum (166.69 g C m−2) occurred in 2007, following a continuous decline from 2005. There was a slight decline from 2005 to 2010 and an increase from 2010 to 2015. In 2012, the NPP suddenly increased and reached the maximum (413.32 g C m−2). The NPP was stable around 400 g C m−2 in the second half of the study period and the numerical value was significantly higher than during the first half. The annual average precipitation (P) in the Haihe River Basin exhibited slight fluctuations during the period. The maximum of P (601.3 mm) appeared in 2012 and a significant decrease occurred only in 2014. The Annual ET in the Haihe River Basin was stable around 300 mm. The mean annual ET was 301.53 mm and SD was 27.38. The maximum (362.66 mm) occurred in 2013 and the minimum (249.06 mm) in 2007. The minimum NPP occurred one year after the minimum ET.
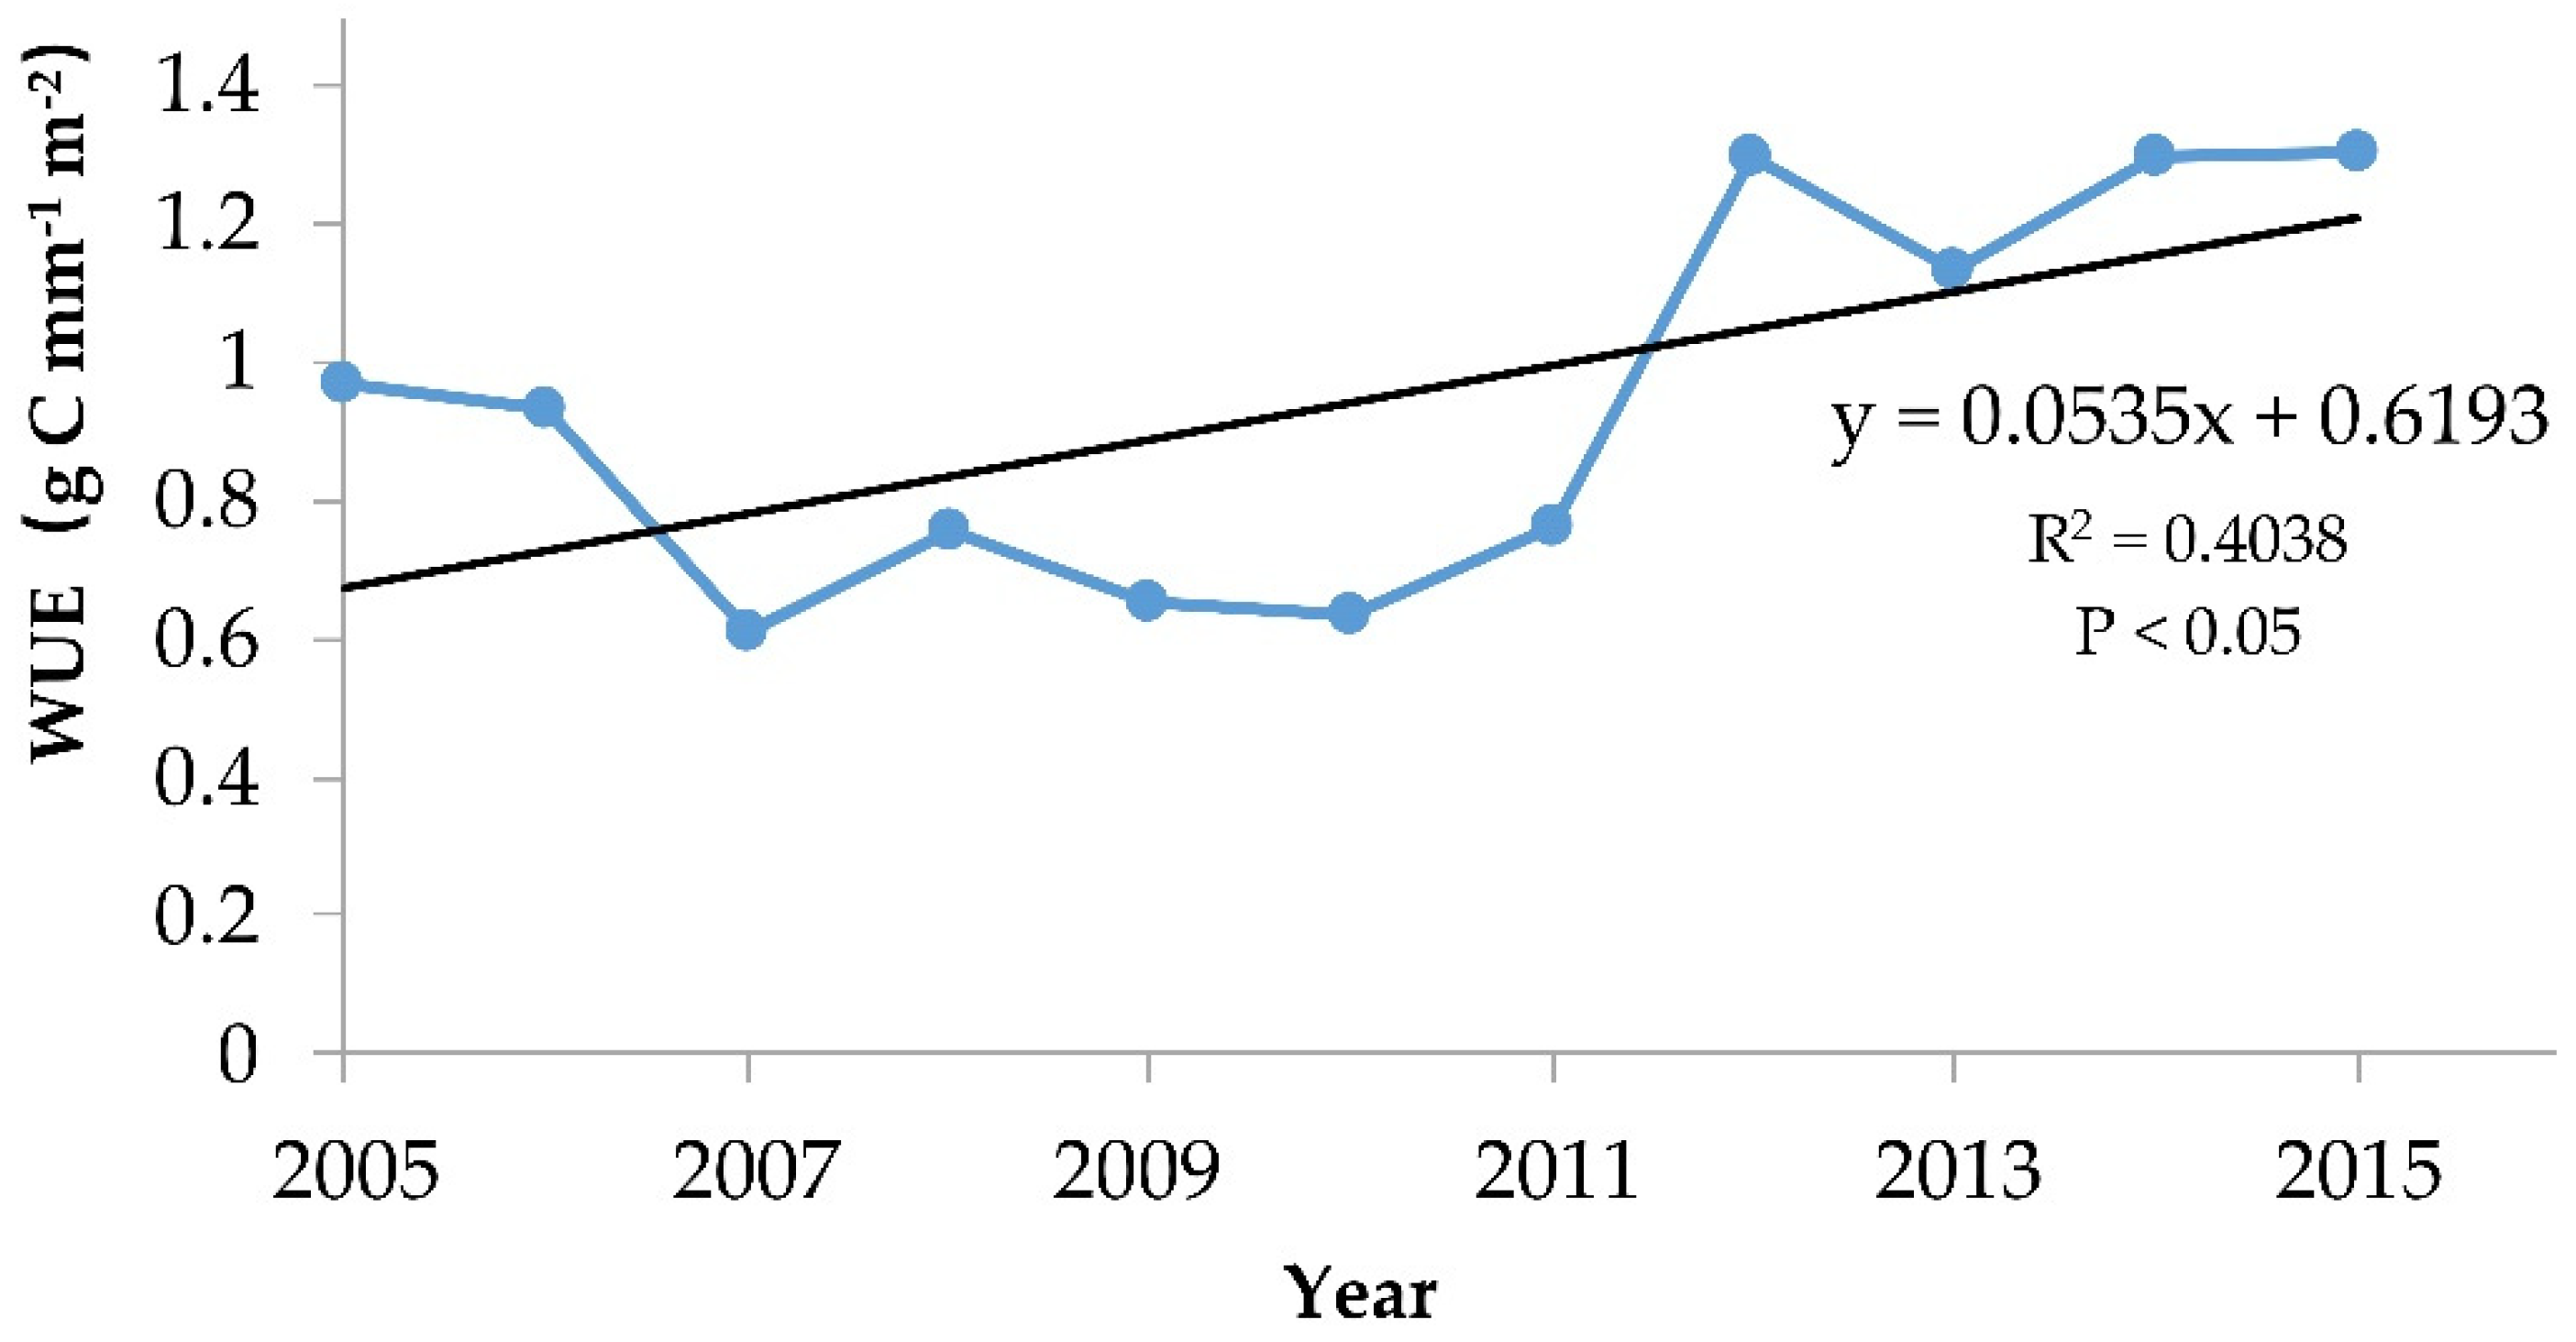
The temporal variation in the green space WUE from 2005 to 2015 is shown in Figure 6. There were considerable fluctuations in the WUE. The mean annual WUE was 0.94 g C mm−1 m−2 and the SD was 0.27. The WUE decreased in the first half of the study period and increased in the second half. The WUE reached the lowest point in 2007 (0.61 g C mm−1 m−2). The maximum WUE (1.30 g C mm−1 m−2) occurred in 2015 and the WUE in 2012 was very close to the maximum WUE. The trend of the WUE was similar to the NPP trend. Since ET commonly is the largest component of the ecosystem water balance, the inter-annual variability of the catchment’s hydrologic response should be strongly related to ecosystem function and productivity. As a result, NPP should be the main factor causing the variation in the WUE.
The green space WUE of the Haihe River Basin exhibited considerable changes. Overall, the WUE exhibited an increasing trend from 2005 to 2015. The OLS estimation showed that the slope of the regression equation of the WUE was about 0.0535 and the result was significant at the 95% level (p = 0.0356). The green space WUE of the Haihe River Basin increased significantly during the study period.
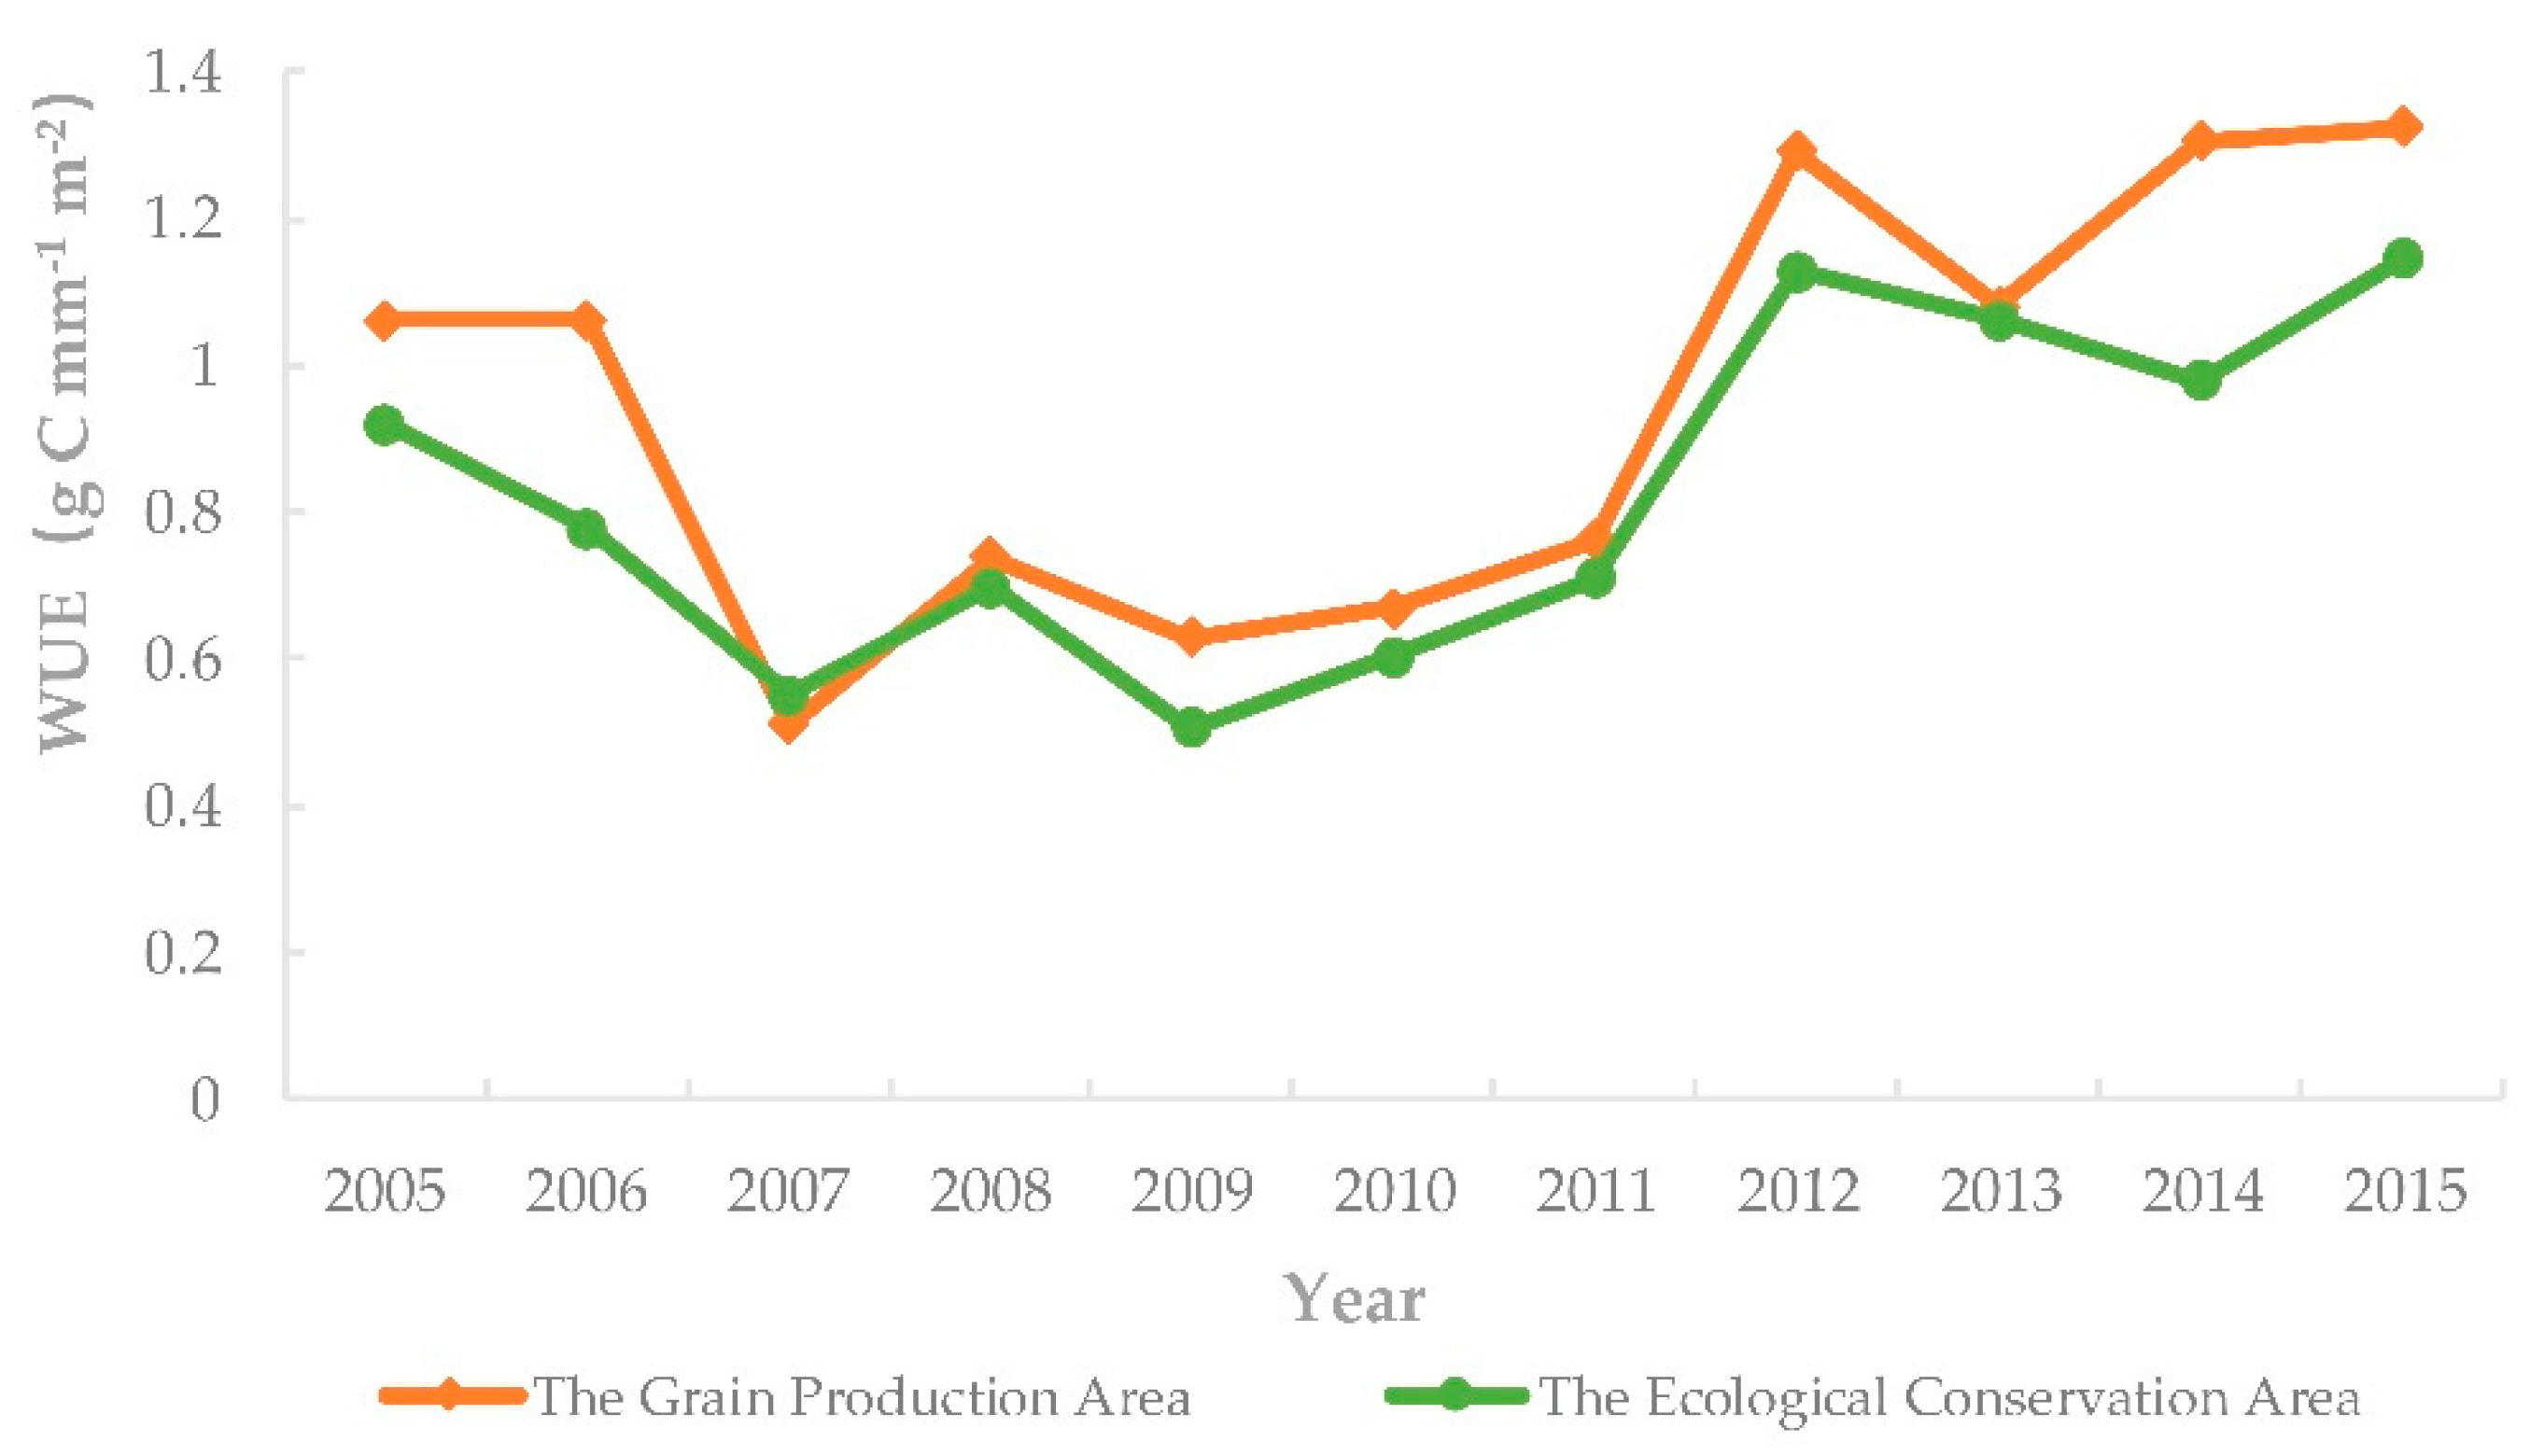
The temporal variation of green space WUE of the two areas (the grain production area and the ecological conservation area) is shown in Figure 7. Overall, WUE was slightly higher for the grain production area than the ecological conservation area, except for 2007. The trend of the green space WUE in the two areas was consistent with that of the Haihe River Basin. The highest WUE of both the grain production area and the ecological conservation area occurred in 2015 and the values were 1.33 g C mm−1 m−2 and 1.15 g C mm−1 m−2, respectively.
3.2.2. Spatial Distributions
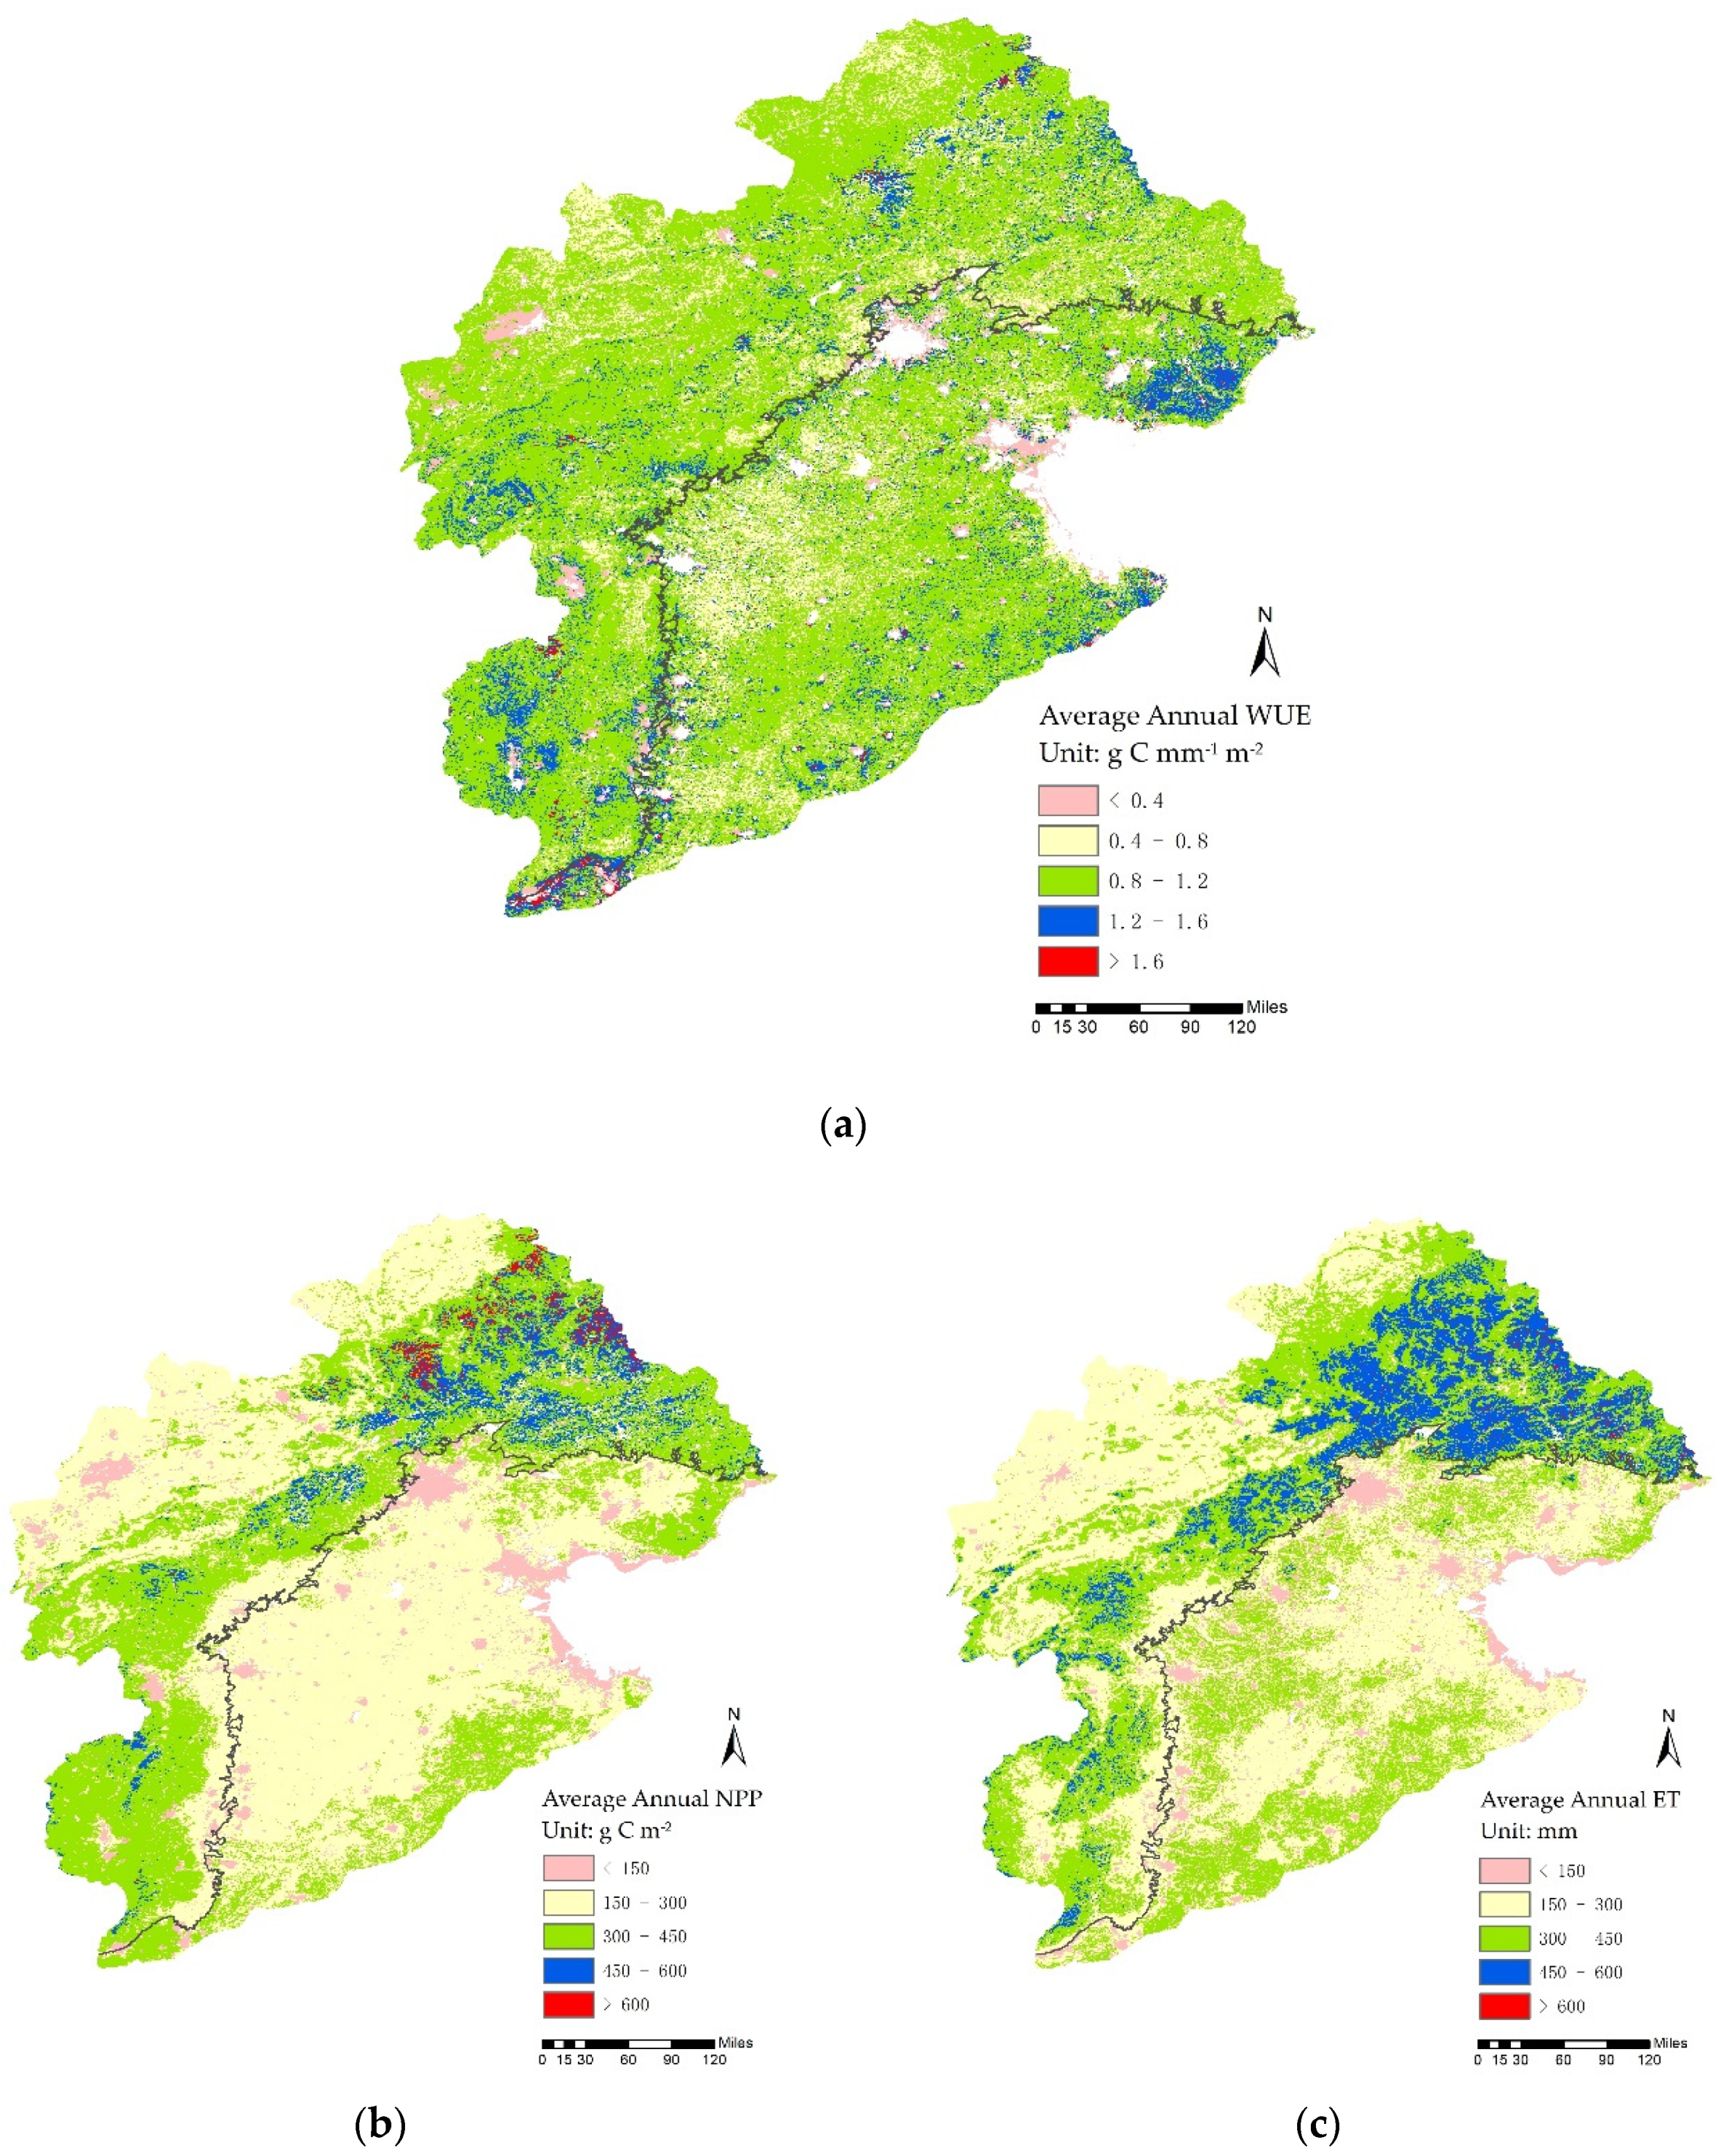
The spatial distributions of the green space WUE, NPP, and ET from 2005 to 2015 in the Haihe River Basin are shown in Figure 8.
The average annual WUE exhibited a relatively uniform spatial distribution. The value of the average annual WUE was 0.94 g C mm−1 m−2 (ranging from 0.14 g C mm−1 m−2 to 2.90 g C mm−1 m−2). For the grain production area and the ecological conservation area, the green space WUE values were 0.95 g C mm−1 m−2 and 0.93 g C mm−1 m−2, respectively. The WUE in most of the Haihe River Basin was between 0.4 g C mm−1 m−2 and 1.6 g C mm−1 m−2 and 60% of the area had a WUE value between 0.8 g C mm−1 m−2 and 1.2 g C mm−1 m−2. These areas were almost all grassland, woodland, and some farmland. They were mainly located in the northern, western, southwestern, and eastern parts, representing a circle surrounding the Haihe River Basin. The regions of lower WUE, i.e., values between 0.4 g C mm−1 m−2 and 0.8 g C mm−1 m−2, were concentrated in the western and central part of the grain production area. This region occupied about 18% of the total area and was secondary in terms of overall distribution. A large number of winter wheat/summer maize is grown in the lower WUE area. Higher WUE regions (1.2 g C mm−1 m−2 ≤ WUE < 1.6 g C mm−1 m−2) occupied about 10% of the total area and were located in the northeast of the grain production area and the southwest of the ecological conservation area, in addition for few other areas. Areas with the lowest and highest WUE values comprised less than 1% of the total area. The highest WUE regions (WUE ≥ 1.6 g C mm−1 m−2) were scattered near the southern boundary and in a few other areas. The lowest WUE regions (WUE < 0.4 g C mm−1 m−2) were sporadically distributed over the entire area and were concentrated in the large and medium cities. Among the cities, Beijing and Tianjin were examples of low WUE areas.
Compared with the WUE, the NPP and ET exhibited substantial spatial variability. The average annual NPP in the Haihe River Basin was 285.08 g C m−2. As shown in Figure 8b, the higher NPP regions were located in a band in the ecological conservation area and the highest NPP area (NPP ≥ 600 g C m−2) was located in the northeast. A comparison of the land use/cover map (Figure 3) and the NPP (Figure 8b) indicates that regions with higher NPP (NPP ≥ 300 g C m−2) were areas of woodland and grassland. In contrast, farmland had lower NPP (150 g C m−2 ≤ NPP < 300 g C m−2) and this area comprised about half of the total area. The spatial distribution of the average annual ET is similar to that of the NPP but ET distributed more decentral than NPP. If 300 mm is used as the dividing line, the areas where the ET is higher than 300 mm or lower than 300 mm comprise about half of the Haihe River Basin. The higher ET region (ET ≥ 300 mm) is located centrally in a band in the ecological conservation area similar to the high NPP regions and there are other high ET regions in the west and southern border regions of the grain production area. The highest ET values occurred in the northeast of the ecological conservation area. The lower ET areas (150 mm ≤ ET < 300 mm) were located in the northwest and central parts of the Haihe River Basin. The lowest ET area (ET < 150 mm) occurred in urban land and border areas. The spatial distribution of the areas with the lowest WUE, NPP, and ET values is consistent because the vegetation cover of urban land is lower than that of the large areas of green space in the Haihe River Basin.
3.3. Effects of LUCC on Green Space WUE
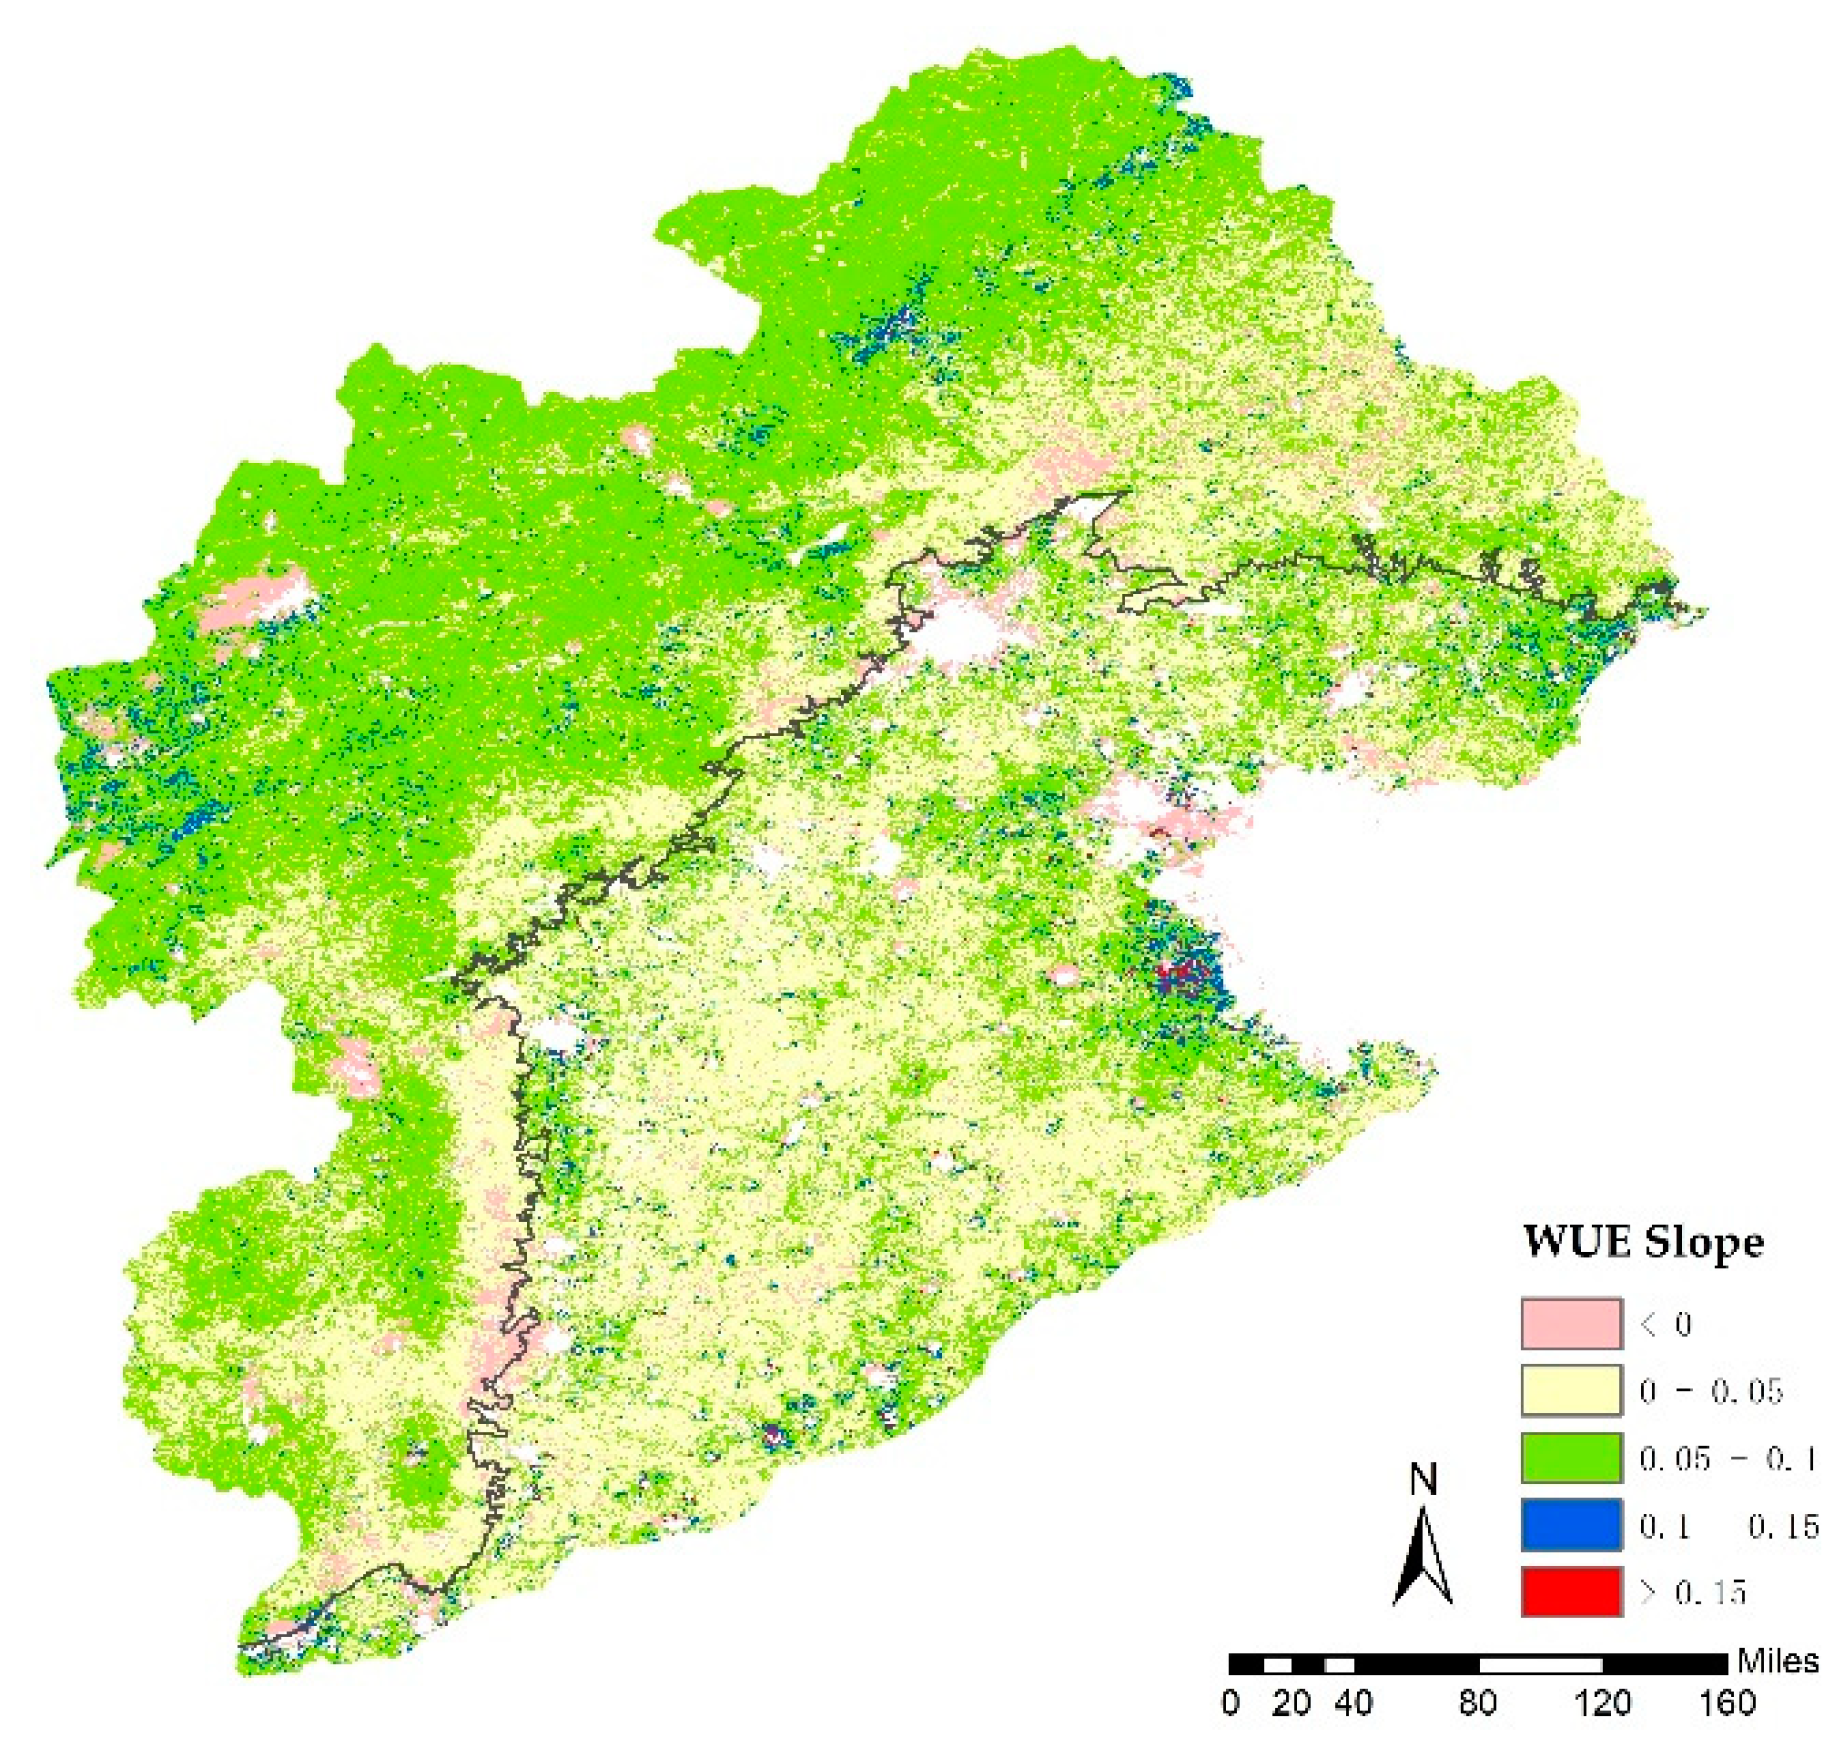
3.3.1. Spatial Distribution of WUE Variation
The spatial distribution of slope of the green space WUE is shown in Figure 9. Except for the central area of urban land, the green space WUE of most areas in the Haihe River Basin showed an increasing trend (WUE Slope > 0). It is evident that the expansion of the artificial surfaces had a negative impact on the WUE. As shown in Figure 9, the WUE slope of the ecological conservation area was greater than that of the grain production area. In the grain production area, the WUE growth in the central and western regions was relatively slow (0 ≤ WUE Slope < 0.05). A comparison of the spatial distribution of the WUE slope (Figure 9) and the LUCC (Figure 3c) shows that areas with a slow increase in WUE are mainly long-term farmland with a large amount of winter wheat/summer maize and cotton. The WUE in Tianjin and the Bohai Sea region increased considerably (0.05 ≤ WUE Slope < 0.1), which was the result of an adjustment in the land use structure and the increase in green space. In addition, areas with higher WUE growth (0.05 ≤ WUE Slope < 0.1) were scattered throughout the grain production area. The higher WUE growth may be the result of a combination of crop adjustment and irrigation technology improvements. In the ecological conservation area, the WUE showed a greater increase (0.05 ≤ WUE Slope < 0.1) in the Taihang Mountains in the west and a smaller increase (0 ≤ WUE Slope < 0.05) in the Yanshan Mountains and hilly area in the east, which may be due to the different cover types of forest and grass. Due to the existence of farmland and urban land in the low mountain area, the WUE in the southern margin of the ecological conservation area exhibited a smaller increase. Areas with a large increase in the WUE (WUE Slope ≥ 0.1) were sporadically distributed in the western and northern parts of the ecological conservation area and in the eastern part of the grain production area. As shown in Figure 3, the conversion from other land use types to woodland had led to a large increase in WUE in the western Taihang Mountains, while the reduction in high-water-consuming crops resulted in a large increase in WUE in a small area near the Bohai Sea. In general, ecological restoration and crop adjustment contributed greatly to the improvement in WUE in the Haihe River Basin.
3.3.2. Contribution Rates of Changes in Land Use/Cover to WUE
The contribution rates of changes in land use/cover to the WUE and the proportions of the transformations are shown in Table 3. The increase in WUE was mainly the result of the addition of green space, whereas the decrease in WUE was due to the increase in artificial surfaces. The addition of green space contributed 88% to the increase in WUE. The transformation from different land use/cover types to farmland comprised the largest proportion at more than 90% of the total. Because of the large transition area from artificial surfaces to farmland, the contribution rate of this type of transformation was highest. Land use changes from woodland to farmland and grassland accounted for about 10% of the WUE increase, indicating that WUE of woodland was lower than that of farmland and grassland.
The expansion of artificial surfaces was the main reason for the decline in the WUE in the Haihe River Basin. The transition from farmland to artificial surfaces caused the greatest decline in WUE, accounting for more than 80%. The proportion of the contribution rates of transitions from farmland to other types was about 83%, which showed that the WUE of farmland was higher than for other land use types in the Haihe River Basin. Changes from farmland to woodland led to the decrease in WUE, which was consistent with the previous result. The abandonment of farmland and woodland also contributed to the decrease in WUE, whereas the use of bare land for plantations caused the WUE to rise. To some extent, the increase or decrease in the green space was an important factor affecting WUE changes.
4. Discussion
4.1. Reasons for Land Use/Cover Change
LUCC in the Haihe River Basin is caused by natural factors and human influences. Natural factors are mainly related to the limitations due to soil conditions. The summer climate in the Haihe River Basin is unstable and the rainfall intensity is high, which causes soil erosion. Soil erosion does not only lead to a reduction in the amount of farmland and a decline in quality but also causes damage to natural vegetation [52]. Human influences have a greater impact on LUCC. Previous studies have shown that the Haihe River Basin is in a stage of rapid urbanization, which results in significant increases in artificial surfaces and decreases in farmland areas [53]. Deforestation and land reclamation occurred in woodland and grassland and was reflected in the conversion into farmland and artificial surfaces. The increase in woodland and grassland was mainly attributed to large-scale afforestation in China. Since the 1970s, China has been implementing large-scale green programs to mitigate the degraded environment. The TNSFP, BTSSC, and PABP projects represent typical mitigation projects and they resulted in large socioeconomic benefits in terms of the addition of green space in China [54,55]. The Haihe River Basin is located in an important strategic location in China and land use change in this area is significantly influenced by national policies and strategies. At the beginning of 2014, the proposal of the Beijing-Tianjin-Hebei integration plan and the formation of the Beijing-Tianjin-Hebei ecological coordination circle provided a guarantee for the ecological rehabilitation of the Haihe River Basin [56]. With the development of an ecological mindset and the setting of target for ecological redline, green space development has become an increasingly important goal [57]. In the future, the expansion of artificial surfaces and the rapid decline of farmland will inevitably be limited in order to ensure food security and ecological functions.
4.2. The Improvement of WUE in the Haihe River Basin
From 2005 to 2015, the green space WUE in the Haihe River Basin experienced a significant increase. The above results showed that NPP was the main factor causing the variation in WUE, which was almost consistent with the variation of WUE. The NPP experienced a dramatic growth and maintained a high level in the second half of the research period. On the one hand, related research results showed that precipitation and normalized difference vegetation index (NDVI) generally have positive impacts on NPP [58,59] and may explain the sudden increase of the NPP in 2012. The NDVI in the basin experienced a dramatic increase from 2011 to 2012, which was about 3.5% higher than before (from 0.716 to 0.741) [60]. On the other hand, the national afforestation policy and high-standard basic farmland construction contributed dramatically to the higher NPP [61,62]. Nevertheless, the impact of climatic factors on NPP is a complex process that involves the physiological processes of the vegetation. In the case of low precipitation in 2014, the high level of NPP may be caused by the hysteresis of water stress in the surrounding years [63].
The green space WUE changes in the grain production area and the ecological conservation area were similar to those in Haihe River Basin. The higher WUE in the grain production area may be caused by abundant food production in this area [64]. The WUE change of the ecological conservation area was much gentler than that of the grain production area, which may be due to the higher stability of the natural ecosystem [65]. However, the changes that occurred in different areas may have been caused by different reasons.
In the grain production area, the improvement in the green space WUE was mainly attributed to the crop adjustment, production efficiency, water-saving irrigation, and awareness by residents. The main crops in the southern part of the grain production area are cotton in the central area and winter wheat/summer maize in the surrounding eastern, western, and southern parts. The northern region is dominated by rice and some cash crops. With the adjustment in the crop structure, high-water consuming crops in the North China Plain have been greatly reduced; for example, rice production decreased by more than 20% from 2007 to 2013 [66]. Between 2010 and 2015, the North China Plain developed effective irrigation areas of more than 5 million hm2 and water-saving irrigation areas of more than 7 million hm2 [67]. In addition, while ensuring food production, lower water consumption contributed to the increase in the WUE [68]. The increased awareness of farmers regarding water conservation, such as the establishment of water-saving irrigation cooperatives, also made significant contributions [69]. The improvement in the WUE in the grain production area has played an important role in food security and water security throughout the Haihe River Basin [70].
The increase in the green space WUE of the ecological conservation area was mainly due to the addition of green space and plants species adjustment. We found that the observed responses of the WUE were largely driven by the responses of the ecosystem NPP. On one hand, in the context of global warming, more green vegetation increases productivity by fixing greenhouse gases such as carbon dioxide (CO2), thereby increasing the WUE and improving the environment. Large-scale afforestation in China contributed greatly to the increase in green spaces. Ecological restoration was the main factor driving the increase in vegetation cover [71]. On the other hand, the reason for the decline in WUE in the first half of the study period may be vegetation degradation. Optimizing vegetation composition can strengthen the ecosystem services of green spaces [72]. The increase of plant species richness can also contribute to improve rain-use efficiency (RUE) [58]. Forest plantation projects in the ecological conservation area contributed greatly to prevent bare ground and maintain the water levels and soil health and also provided favorable conditions for crop production in the grain production area.
4.3. Suggestions
The Haihe River Basin is abundant in land resources and has great potential for developing agroforestry. The coordinated development of green space and water resources should be the main targets. Since the beginning of the 21st century, the construction of water conservation facilities in the basin has increased substantially while the area of farmland has decreased gradually, resulting in non-sustainable land use. At present, the abandonment of farmland represents a serious ecological threat to the Haihe River Basin, especially the conversion from farmland into industrial land and residential land [52]. The land administration department should take effective measures to curb the inappropriate conversion of farmland in the basin and increase the green spaces so that woodland, grassland, and farmland areas can benefit by complementing each other [73]. Only in this way can we ensure the socioeconomic benefits and ecological benefits and thus achieve sustainable development of land use in the Haihe River Basin.
Agricultural water use is an important part of water resources management in the Haihe River Basin. The agricultural sector can provide advice to farmers regarding the WUE of crops. For example, winter wheat is the largest water-consuming crop in the North China Plain; 1 year of subsoiling tillage plus 2 years of strip rotary planting may be an efficient measure to increase the wheat yield and WUE [74]. Irrigation is also a top priority in agricultural water use [75]. With the development of water-saving technology, the expansion of water-saving irrigation areas is an important method to improve WUE while ensuring sufficient food production in the grain production area [76].
There is still room for development for mountain vegetation in the ecological conservation area of the Haihe River Basin. Mountain vegetation provides numerous ecosystem services for the entire basin and plays an important ecological security role for the capital region [77]. An understanding of the natural conditions and the sustainable development of vegetation resources in the ecological conservation areas can effectively improve the WUE. The relevant departments can improve the ecosystem services of green spaces by changing the vegetation structure, thereby improving the water resource conditions. For vegetation that requires artificial irrigation, advances in science and technology will contribute significantly to the improvement in the WUE [78,79]. In addition, an increase in water-saving awareness of residents by actions of the government will also contribute to improving the WUE; this has been implemented in both the grain production area and the ecological conservation area [80].
4.4. Limitations and Future Research
This study conducted a preliminary analysis and discussion on the dynamics of green space WUE and the impact of LUCC on WUE. The low accuracy of remote sensing data makes our research results crude and there may be some errors in the inversion process of the MODIS data. Meanwhile, the aforementioned WUE changes are also the combined results of ecological restoration and climate change and they likely represent a local and temporary improvement rather than a comprehensive and fundamental change. Therefore, more efforts are needed to adjust the relationship between human activities and natural resources. In addition, problems such as unsustainable development of barren hills and the poverty belt around the capital in the Haihe River Basin require further study.
5. Conclusions
In this study, we evaluated the temporal and spatial variation of green space WUE from 2005 to 2015 and focused on the effect of LUCC on the green space WUE in the Haihe River Basin. The following conclusions were drawn: (1)Artificial surfaces have expanded and a large amount of farmland was converted to other land types, accompanied by the addition of green spaces. (2) In the study period, the green space WUE increased significantly and the main reason was the increase in NPP. Except for the central urban areas, the WUE of most areas exhibited a growing trend. (3) From the perspective of land use type change, ecological restoration and crop adjustment contributed greatly to the improvement in the WUE in the basin. This indicates that there is room for improvement in the green space WUE of green spaces in the basin. The development of green space and the sustainable use of water resources represent an important link in the sustainable development of the Haihe River Basin. The improvement in the WUE in the basin reflects the effectiveness of sustainable land use and ecological restoration.
Author Contributions
Conceptualization, Y.Z., X.Z.; methodology, Y.Z., X.Z.; software, Y.Z., Y.B.; validation, Y.Z., X.Z. and Y.B.; formal analysis, Y.Z.; resources, Y.Z., X.Z.; data curation, Y.Z., X.Z.; writing—original draft preparation, Y.Z.; writing—review and editing, F.M.; visualization, Y.Z., Y.B.; supervision, F.M.; project administration, F.M.; funding acquisition, F.M.; all authors corrected the manuscript.
Funding
This research was funded by Project of Social Science Youth Foundation of Beijing Municipal, Grant No. 15JGC148.
Acknowledgments
We are grateful for the assistance of Fangzhong Shi in gathering the data. We would also like to thank the researchers of the College of Forestry of Beijing Forestry University for their technical guidance.
Conflicts of Interest
The authors declare no conflict of interest.
References
- Piao, S.; Ciais, P.; Huang, Y.; Shen, Z.; Peng, S.; Li, J.; Zhou, L.; Liu, H.; Ma, Y.; Ding, Y.; et al. The impacts of climate change on water resources and agriculture in China. Nature 2010, 467, 43. [Google Scholar] [CrossRef] [PubMed]
- Yang, Q.; Luo, S.; Wu, H.; Wang, G.; Han, D.; Lü, H.; Shao, J. Attribution Analysis for Runoff Change on Multiple Scales in a Humid Subtropical Basin Dominated by Forest, East China. Forests 2019, 10, 184. [Google Scholar] [CrossRef]
- Kummu, M.; Guillaume, J.H.; de Moel, H.; Eisner, S.; Florke, M.; Porkka, M.; Siebert, S.; Veldkamp, T.I.; Ward, P.J. The world’s road to water scarcity: Shortage and stress in the 20th century and pathways towards sustainability. Sci. Rep. 2016, 6, 38495. [Google Scholar] [CrossRef] [PubMed]
- UN-Water/Coordinating the UN’s Work on Water and Sanitation. Available online: http://www.unwater.org/ (accessed on 1 May 2019).
- Sun, G.; Vose, J. Forest Management Challenges for Sustaining Water Resources in the Anthropocene. Forests 2016, 7, 68. [Google Scholar] [CrossRef]
- Liu, J.; Yang, W. Water Sustainability for China and Beyond. Science 2012, 337, 649–650. [Google Scholar] [CrossRef] [PubMed]
- Gupta, J.; van der Zaag, P. Interbasin water transfers and integrated water resources management: Where engineering, science and politics interlock. Phys. Chem. Earth. 2008, 33, 28–40. [Google Scholar] [CrossRef]
- Braga, B.P.F.; Lotufo, J.G. Integrated River Basin Plan in Practice: The São Francisco River Basin. Int. J. Water. Resour. D. 2008, 24, 37–60. [Google Scholar] [CrossRef]
- Lindner, M.; Maroschek, M.; Netherer, S.; Kremer, A.; Barbati, A.; Garcia-Gonzalo, J.; Seidl, R.; Delzon, S.; Corona, P.; Kolström, M.; et al. Climate change impacts, adaptive capacity, and vulnerability of European forest ecosystems. For. Ecol. Manag. 2010, 259, 698–709. [Google Scholar] [CrossRef]
- Wang, G.; Mang, S.; Riehl, B.; Huang, J.; Wang, G.; Xu, L.; Huang, K.; Innes, J. Climate change impacts and forest adaptation in the Asia–Pacific region: From regional experts’ perspectives. J. For. Res. 2018, 3. [Google Scholar] [CrossRef]
- Zhang, X.; Mi, F.; Lu, N.; Yan, N.; Kuglerova, L.; Yuan, S.; Peng, Q.; Ma, O.Z. Green space water use and its impact on water resources in the capital region of China. Phys. Chem. Earth. 2017, 101, 185–194. [Google Scholar] [CrossRef]
- Choumert, J. An empirical investigation of public choices for green spaces. Land Use Policy 2010, 27, 1123–1131. [Google Scholar] [CrossRef] [Green Version]
- Byomkesh, T.; Nakagoshi, N.; Dewan, A.M. Urbanization and green space dynamics in Greater Dhaka, Bangladesh. Landsc. Ecol. Eng. 2012, 8, 45–58. [Google Scholar] [CrossRef]
- Xia, J.; Zhang, L.; Liu, C.; Yu, J. Towards better water security in North China. Water Resour. Manag. 2007, 21, 233–247. [Google Scholar] [CrossRef]
- Ministry of Water Resources of the People’s Republic of China. Available online: http://www.mwr.gov.cn/ (accessed on 4 May 2019).
- Imperial, M. Using Collaboration as a Governance StrategyLessons from Six Watershed Management Programs. Adm. Soc. 2005, 37, 281–320. [Google Scholar] [CrossRef]
- Thieme, M.L.; Rudulph, J.; Higgins, J.; Takats, J.A. Protected areas and freshwater conservation: A survey of protected area managers in the Tennessee and Cumberland River Basins, USA. J. Environ. Manag. 2012, 109, 189–199. [Google Scholar] [CrossRef]
- Xie, H.; Wang, P.; Huang, H. Ecological Risk Assessment of Land Use Change in the Poyang Lake Eco-economic Zone, China. Int. J. Environ. Res. Public. Health 2013, 10, 328–346. [Google Scholar] [CrossRef] [PubMed] [Green Version]
- Wang, P.; Zhang, Y.; Yu, J.; Fu, G.; Ao, F. Vegetation dynamics induced by groundwater fluctuations in the lower Heihe River Basin, northwestern China. J. Plant. Ecol. 2011, 4, 77–90. [Google Scholar] [CrossRef]
- Twine, T.; Kucharik, C.J.; Foley, J.A. Effects of El Niño–Southern Oscillation on the Climate, Water Balance, and Streamflow of the Mississippi River Basin. J. Climate 2005, 18, 4840–4861. [Google Scholar] [CrossRef]
- Keys, P.; Wang-Erlandsson, L.; Gordon, L. Revealing Invisible Water: Moisture Recycling as an Ecosystem Service. PLoS ONE 2016, 11, e0151993. [Google Scholar] [CrossRef]
- Jenerette, G.D.; Harlan, S.L.; Stefanov, W.L.; Martin, C.A. Ecosystem services and urban heat riskscape moderation: Water, green spaces, and social inequality in Phoenix, USA. Ecol. Appl. 2011, 21, 2637–2651. [Google Scholar] [CrossRef]
- Netzer, M.S.; Sidman, G.; Pearson, T.R.H.; Walker, S.M.; Srinivasan, R. Combining Global Remote Sensing Products with Hydrological Modeling to Measure the Impact of Tropical Forest Loss on Water-Based Ecosystem Services. Forests 2019, 10, 413. [Google Scholar] [CrossRef]
- Zhang, B.; Xie, G.; Zhang, C.; Zhang, J. The economic benefits of rainwater-runoff reduction by urban green spaces: A case study in Beijing, China. J. Environ. Manag. 2012, 100, 65–71. [Google Scholar] [CrossRef]
- Hao, C.L.; Yan, D.H.; Qin, T.L.; Zhang, C.; Yin, J. Water Ecosystem Services and their Value—A Case Study in Luan River Basin, North China. Appl. Mech. Mater. 2013, 448, 225–234. [Google Scholar] [CrossRef]
- Schuch, G.; Serrao-Neumann, S.; Morgan, E.; Low Choy, D. Water in the city: Green open spaces, land use planning and flood management—An Australian case study. Land Use Policy 2017, 63, 539–550. [Google Scholar] [CrossRef]
- EAMUS, D. The interaction of rising CO2 and temperatures with water use efficiency. Plant Cell Environ. 1991, 14, 843–852. [Google Scholar] [CrossRef]
- Keenan, T.F.; Hollinger, D.Y.; Bohrer, G.; Dragoni, D.; Munger, J.W.; Schmid, H.P.; Richardson, A.D. Increase in forest water-use efficiency as atmospheric carbon dioxide concentrations rise. Nature 2013, 499, 324–327. [Google Scholar] [CrossRef]
- Yang, Y.; Guan, H.; Batelaan, O.; McVicar, T.R.; Long, D.; Piao, S.; Liang, W.; Liu, B.; Jin, Z.; Simmons, C.T. Contrasting responses of water use efficiency to drought across global terrestrial ecosystems. Sci. Rep. 2016, 6, 23284. [Google Scholar] [CrossRef] [Green Version]
- Cai, X.; Rosegrant, M.W.; Ringler, C. Physical and economic efficiency of water use in the river basin: Implications for efficient water management. Water Resour. Res. 2003, 39. [Google Scholar] [CrossRef]
- Gleick, P.H.; Christian-Smith, J.; Cooley, H. Water-use efficiency and productivity: Rethinking the basin approach. Water Int. 2011, 36, 784–798. [Google Scholar] [CrossRef]
- Multsch, S.; Elshamy, M.E.; Batarseh, S.; Seid, A.H.; Frede, H.G.; Breuer, L. Improving irrigation efficiency will be insufficient to meet future water demand in the Nile Basin. J. Hydrol. Reg. Stud. 2017, 12, 315–330. [Google Scholar] [CrossRef]
- Bai, Y.; Ouyang, Z.; Zheng, H.; Xu, W.; Zhang, C.; Zhuang, C.; Chen, S.; Jiang, B. Ecosystems patterns and dynamics in Haihe river basin. Acta Ecol. Sin. 2010, 30, 327–334. [Google Scholar]
- Ji, Y.; Chen, L.; Sun, R. Temporal and Spatial Variability of Water Supply Stress in the Haihe River Basin, Northern China. J. Am. Water Resour. Assoc. 2012, 45, 999–1007. [Google Scholar] [CrossRef]
- Yang, Y.; Fan, J.; Hu, Y.; Moiwo, J. Sustainability of Water-Use and Food Production in the Haihe Catchment; Springer: Dordrecht, The Netherlands, 2010; pp. 231–239. [Google Scholar]
- Haihe River Water Conservancy Commission (MWR). Available online: http://www.hwcc.gov.cn/ (accessed on 15 January 2019).
- Zhu, Y.; Drake, S.; Lü, H.; Xia, J. Analysis of Temporal and Spatial Differences in Eco-environmental Carrying Capacity Related to Water in the Haihe River Basins, China. Water Resour. Manag. 2010, 24, 1089–1105. [Google Scholar] [CrossRef]
- Liu, J.; Yun, L.; Liya, S.; Zhiguo, C.; Baoqiang, Z. Public participation in water resources management of Haihe river basin, China: The analysis and evaluation of status quo. Procedia Environ. Sci. 2010, 2, 1750–1758. [Google Scholar]
- Chu, J.; Xia, J.; Xu, C.; Li, L.; Wang, Z. Spatial and temporal variability of daily precipitation in Haihe River basin, 1958–2007. J. Geogr. Sci. 2010, 20, 248–260. [Google Scholar] [CrossRef]
- Yang, Y.; Tian, F. Abrupt change of runoff and its major driving factors in Haihe River Catchment, China. J. Hydrol. 2009, 374, 373–383. [Google Scholar] [CrossRef]
- Wang, Z.; Zhu, X.; Li, W.; Luo, Y.; Zhang, M. A coupled surface-water/groundwater model for haihe river basin. Prog. Geogr. 2011, 30, 1345–1353. [Google Scholar]
- Wang, X.-j.; Zhang, J.-y.; Yang, Z.-f.; Shahid, S.; He, R.-m.; Xia, X.-h.; Liu, H.-w. Historic water consumptions and future management strategies for Haihe River basin of Northern China. Mitig. Adapt. Strat. Glob. Change 2015, 20, 371–387. [Google Scholar] [CrossRef]
- Wu, G.; Chen, S.; Su, R.; Jia, M.; Li, W. Temporal trend in surface water resources in Tianjin in the Haihe River Basin, China. Hydrol. Process. 2011, 25, 2141–2151. [Google Scholar] [CrossRef]
- Resource and Environment Data Cloud Platform. Available online: http://www.resdc.cn (accessed on 20 December 2018).
- MODIS Web. Available online: https://modis.gsfc.nasa.gov/ (accessed on 11 November 2018).
- Wang, X.; Zheng, D.; Shen, Y. Land use change and its driving forces on the Tibetan Plateau during 1990–2000. Catena 2008, 72, 56–66. [Google Scholar] [CrossRef]
- Liu, R.; Zhu, D. Methods for Detecting Land Use Changes Based on the Land Use Transition Matrix. Resour. Sci. 2010, 32, 1544–1550. [Google Scholar]
- Zhu, Q.; Jiang, H.; Peng, C.; Liu, J.; Wei, X.; Fang, X.; Liu, S.; Zhou, G.; Yu, S. Evaluating the effects of future climate change and elevated CO2 on the water use efficiency in terrestrial ecosystems of China. Ecol. Model. 2011, 222, 2414–2429. [Google Scholar] [CrossRef]
- Balestra, P. On the Efficiency of Ordinary Least-Squares in Regression Models. Publ. Amer. Statistical Assoc. 1970, 65, 1330–1337. [Google Scholar] [CrossRef]
- Clark-Carter, D. Standard Deviation; Springer: Dordrecht, The Netherlands, 2008; p. 1334. [Google Scholar]
- Lu, L.; Zhou, S.; Zhou, B.; Dai, L.; Chang, T.; Bao, G.; Zhou, H.; Li, Z. Land Use Transformation and Its Eco-environmental Responsein Process of the Regional Development: A Case Study of Jiangsu Province. Sci. Geogr. Sin. 2013, 33, 1442–1449. [Google Scholar]
- Wen, L.; Wang, Y.; Zhang, G.; Liu, H.; Wang, C. Land use and land cover changes in Haihe river basin of China. J. Northeast. Agric. Univ. 2012, 136–141. [Google Scholar]
- Zhu, Z.; Guo, W.; Zhang, H. Mapping Analysis of Land-use Changes in Haihe River Basin. J. Anhui Agric. Sci. 2012, 40, 8292–8295. [Google Scholar]
- Zeng, X.; Zhang, W.; Liu, X.; Cao, J.; Shen, H.; Zhao, X.; Zhang, N.; Bai, Y.; Yi, M. Change of soil organic carbon after cropland afforestation in ‘Beijing-Tianjin Sandstorm Source Control’ program area in China. Chin. Geogr. Sci. 2014, 24, 461–470. [Google Scholar] [CrossRef]
- Wang, X.; Chen, Y.; Chen, E.; Zhang, Y.; Luo, Y. Ecological Benefit Evaluation of Three-north Shelter Forest Project Based on GIS—A Case Study in Zhongyang County, Shanxi Province. Bull. Soil Water Conserv. 2011, 31, 171–175. [Google Scholar]
- Zhang, Y.; Liu, M.; Bai, Y.; Zhang, Y. Application of ecological conservation cooperation for Beijng-Tianjin-Hebei regional integration. Resour. Sci. 2015, 37, 1529–1535. [Google Scholar]
- Lin, Y.; Fan, J.; Wen, Q.; Liu, S.; Li, B. Primary exploration of ecological theories and technologies for delineation of ecological redline zones. Acta Ecol Sin 2016, 36, 1244–1252. [Google Scholar]
- Bai, Y.; Wu, J.; Xing, Q.; Pan, Q.; Huang, J.; Yang, D.; Han, X. Primary Production and Rain Use Efficiency across a Precipitation Gradient on the Mongolia Plateau. Ecology 2008, 89, 2140–2153. [Google Scholar] [CrossRef] [PubMed]
- Rafique, R.; Zhao, F.; Jong, R.d.; Zeng, N.; Asrar, G.R. Global and Regional Variability and Change in Terrestrial Ecosystems Net Primary Production and NDVI: A Model-Data Comparison. Remote Sens. 2016, 8, 177. [Google Scholar] [CrossRef]
- Yang, Y.; Sun, Y.; Wang, Z. The spatial—temporal variations of vegetation cover in the Haihe river basinfrom 2000 to 2013. J. Arid Land Resour. Environ. 2016, 30, 65–70. [Google Scholar]
- Feng, T.; Zhang, F.; Li, C.; Qu, Y.; Zhu, F. Spatial distribution of prime farmland based on cultivated land quality comprehensive evaluation at county scale. Trans. Chin. Soc. Agric. Eng. 2014, 30, 200–210. [Google Scholar]
- Yan, E.; Lin, H.; Dang, Y.; Xia, C. The spatiotemporal changes of vegetation cover in Beijing-Tianjin sandstorm source control region during 2000—2012. Acta Ecol Sin 2014, 34, 5007–5020. [Google Scholar]
- Yu, W.Y.; Ji, R.P.; Feng, R.; Zhao, X.L.; Zhang, Y.S. Response of water stress on photosynthetic characteristics and water use efficiency of maize leaves in different growth stage. Acta Ecol Sin 2015, 35, 2902–2909. [Google Scholar]
- Ding, X. Analysis of Water Resources Utilization Efficiency in Grain Production. Econ. Res. Guide 2018, 30–35. [Google Scholar]
- Pan, C.; Li, Y.; Peng, Y.; Gao, R.; Wu, J. Soil water holding capacity under four typical ecosystems in Wuyunjie Nature Reserve of Hunan Province. Acta Ecol. Sin 2012, 32, 538–547. [Google Scholar] [Green Version]
- Wang, H.; Pan, X.; Luo, J.; Luo, Z.; Chang, C.; Shen, Y. Using remote sensing to analyze spatiotemporal variations in crop planting in the North China Plain. Chin. J. Eco-Agric. 2015, 1199–1209. [Google Scholar]
- National Bureau of Statistics, China. Available online: http://www.stats.gov.cn/ (accessed on 20 April 2019).
- Fu, Q.; Liu, Y.; Li, T.; Cui, S.; Liu, D.; Cheng, K. Analysis of Water Utilization in Grain Production from Water Footprint Perspective in Heilongjiang Province. Trans. Chin. Soc. Agric. Mach. 2017, 48, 184–192. [Google Scholar]
- Gu, X.; Zhu, M. A Comparative study on Establishment Mode of Farmers’ Water-saving Irrigation Cooperative Based on Technology Diffusion Perspective. Water Saving Irrig. 2018, 278, 100–103. [Google Scholar]
- Fan, M.; Shen, J.; Yuan, L.; Jiang, R.-F.; Chen, X.; Davies, W.J.; Zhang, F. Improving crop productivity and resource use efficiency to ensure food security and environmental quality in China. J. Exp. Bot. 2011, 63, 13–24. [Google Scholar] [CrossRef] [PubMed]
- Aguiar, F.C.; Fernandes, M.R.; Ferreira, M.T. Riparian vegetation metrics as tools for guiding ecological restoration in riverscapes. Knowl. Manag. Aquat. Ecosyst. 2011, 402, 251–264. [Google Scholar]
- Ren, X. A gradient analysis of urban green space ecosystem services and human well-being. Master’s Thesis, Zhejiang University, Hangzhou, China, 2013. [Google Scholar]
- Zhou, X.; Wang, Y.-C. Spatial–temporal dynamics of urban green space in response to rapid urbanization and greening policies. Landsc. Urban. Plann. 2011, 100, 268–277. [Google Scholar] [CrossRef]
- Zheng, C.-Y.; Yu, Z.-W.; Shi, Y.; Cui, S.-M.; Wang, D.; Zhang, Y.-L.; Zhao, J.-Y. Effects of Tillage Practices on Water Consumption, Water Use Efficiency and Grain Yield in Wheat Field. J. Integr. Agric. 2014, 13, 2378–2388. [Google Scholar] [CrossRef] [Green Version]
- Fereres, E.; Soriano, M.A. Deficit irrigation for reducing agricultural water use. J. Exp. Bot. 2007, 58, 147–159. [Google Scholar] [CrossRef] [PubMed]
- Larson, N.; Sekhri, S.; Sidhu, R. Adoption of water-saving technology in agriculture: The case of laser levelers. Water Resour. Econ. 2016, 14, 44–64. [Google Scholar] [CrossRef]
- Ma, W.; Shi, P.; Zong, N.; Zhao, G.; Chai, X.; Geng, S. Water conservation capacity of forest ecosystems in Taihang Mountain. Chin. J. Eco-Agric. 2017, 25, 478–489. [Google Scholar]
- Wielinga, B.; Waterworth, R.; Brack, C. Fertiliser and irrigation effects on wood density at various heights for Pinus radiata. Eur. J. For. Res. 2008, 127, 63–70. [Google Scholar] [CrossRef]
- Liu, Y.; Zhang, X.; Zhao, S.; Ma, H.; Qi, G.; Guo, S. The Depth of Water Taken up by Walnut Trees during Different Phenological Stages in an Irrigated Arid Hilly Area in the Taihang Mountains. Forests 2019, 10, 121. [Google Scholar] [CrossRef]
- Chang, G.; Wang, L.; Meng, L.; Zhang, W. Farmers’ attitudes toward mandatory water-saving policies: A case study in two basins in northwest China. J. Environ. Manag. 2016, 181, 455–464. [Google Scholar] [CrossRef] [PubMed]
Figure 1.
Haihe River Basin geography and administrative divisions chart.

Figure 2.
Division of the Haihe Basin into two areas.

Figure 3.
The land use/cover in 2005 (a) and 2015 (b) and the land use/cover change (LUCC) (c) in the Haihe River Basin.
Figure 3.
The land use/cover in 2005 (a) and 2015 (b) and the land use/cover change (LUCC) (c) in the Haihe River Basin.


Figure 4.
Areas of change for land use/cover classes in the Haihe River Basin.

Figure 5.
Temporal changes in the annual average net primary productivity (NPP), annual average evapotranspiration (ET), and annual average precipitation (P) in the Haihe River Basin from 2005 to 2015.
Figure 5.
Temporal changes in the annual average net primary productivity (NPP), annual average evapotranspiration (ET), and annual average precipitation (P) in the Haihe River Basin from 2005 to 2015.

Figure 6.
Temporal changes in the green space water use efficiency (WUE) in the Haihe River Basin.

Figure 7.
Temporal changes in the green space WUE in the grain production area and the ecological conservation area.
Figure 7.
Temporal changes in the green space WUE in the grain production area and the ecological conservation area.

Figure 8.
Spatial distributions of the average annual WUE (a), average annual NPP (b), and average annual ET (c) from 2005 to 2015 in the Haihe River Basin.
Figure 8.
Spatial distributions of the average annual WUE (a), average annual NPP (b), and average annual ET (c) from 2005 to 2015 in the Haihe River Basin.

Figure 9.
Spatial distribution of the slope of the WUE based on ordinary least squares (OLS) regression from 2005 to 2015 in the Haihe River Basin.
Figure 9.
Spatial distribution of the slope of the WUE based on ordinary least squares (OLS) regression from 2005 to 2015 in the Haihe River Basin.


Table 1.
Land transfer matrix.
| T2 | Total (T1) | ||||
|---|---|---|---|---|---|
| A1 | A2 | …… | An | ||
| A1 | P11 | P12 | …… | P1n | P1 |
| A2 | P21 | P22 | …… | P2n | P2 |
| ⋮ ⋮ | ⋮ ⋮ | ⋮ ⋮ | Pij | ⋮ ⋮ | ⋮ ⋮ |
| An | Pn1 | Pn2 | …… | Pnn | Pn |
| Total (T2) | P1 | P2 | …… | Pn | Total |
Table 2.
Land use transition matrix in 2005 and 2015 in the Haihe River Basin.
| Land Use Transition Matrix (Unit: km2) | 2015 | ||||||
|---|---|---|---|---|---|---|---|
| 2005 | Grassland | Farmland | Artificial Surface | Woodland | Water | Bare Land | Total (2005) |
| Grassland | 61,055.2 | 132.7 | 246.6 | 115.4 | 43.7 | 12.7 | 61,606.3 |
| Farmland | 261.7 | 157,734.1 | 2728.1 | 306.4 | 501.3 | 35.4 | 161,567.1 |
| Artificial Surface | 37.7 | 999.5 | 20,937.3 | 32.9 | 126.3 | 12.6 | 22,146.3 |
| Woodland | 72.8 | 119.6 | 121.0 | 60,526.4 | 12.9 | 1.7 | 60,854.3 |
| Water | 16.2 | 462.1 | 232.1 | 14.9 | 5754.8 | 20.4 | 6500.4 |
| Bare Land | 137.4 | 64.9 | 69.6 | 1.0 | 48.6 | 2921.4 | 3242.8 |
| Total (2015) | 61,580.9 | 159,512.8 | 24,334.8 | 60,997.0 | 6487.6 | 3004.2 | 315,917.3 |
Table 3.
Contribution rates of the major land use transformation types to the WUE.
| Land Use Transformation Types | Contributions Rates (, %) | Proportion (%) | |
|---|---|---|---|
| WUE increase | Artificial surface → Farmland | 0.01343 | 81.13 |
| Woodland → Farmland | 0.00118 | 7.15 | |
| Woodland → Grassland | 0.00055 | 3.31 | |
| Artificial surface → Grassland | 0.00042 | 2.52 | |
| Grassland → Farmland | 0.00032 | 1.91 | |
| Bare land → Farmland | 0.00024 | 1.42 | |
| Bare land → Grassland | 0.00017 | 1.04 | |
| Artificial surface → Bare land | 0.00012 | 0.75 | |
| Artificial surface → Woodland | 0.00012 | 0.70 | |
| WUE decrease | Farmland → Artificial surface | 0.03667 | 81.15 |
| Farmland → Woodland | 0.00304 | 6.72 | |
| Grassland → Artificial surface | 0.00273 | 6.04 | |
| Grassland → Woodland | 0.00087 | 1.92 | |
| Bare land → Artificial surface | 0.00068 | 1.51 | |
| Farmland → Grassland | 0.00062 | 1.38 | |
| Woodland → Artificial surface | 0.00043 | 0.95 | |
| Farmland → Bare land | 0.00013 | 0.29 | |
| Grassland → Bare land | 0.00002 | 0.04 |
© 2019 by the authors. Licensee MDPI, Basel, Switzerland. This article is an open access article distributed under the terms and conditions of the Creative Commons Attribution (CC BY) license (http://creativecommons.org/licenses/by/4.0/).
Share and Cite
MDPI and ACS Style
Zhao, Y.; Zhang, X.; Bai, Y.; Mi, F. Does Land Use Change Affect Green Space Water Use? An Analysis of the Haihe River Basin. Forests 2019, 10, 545. https://doi.org/10.3390/f10070545
AMA Style
Zhao Y, Zhang X, Bai Y, Mi F. Does Land Use Change Affect Green Space Water Use? An Analysis of the Haihe River Basin. Forests. 2019; 10(7):545. https://doi.org/10.3390/f10070545
Chicago/Turabian StyleZhao, Yu, Xuanchang Zhang, Yang Bai, and Feng Mi. 2019. "Does Land Use Change Affect Green Space Water Use? An Analysis of the Haihe River Basin" Forests 10, no. 7: 545. https://doi.org/10.3390/f10070545
Note that from the first issue of 2016, this journal uses article numbers instead of page numbers. See further details here.