Article

Nitrogen Addition Affects Soil Respiration Primarily through Changes in Microbial Community Structure and Biomass in a Subtropical Natural Forest

1
State Key Laboratory for Subtropical Mountain Ecology of the Ministry of Science and Technology and Fujian Province, Fujian Normal University, Fuzhou 350007, China
2
School of Geographical Sciences, Fujian Normal University, Fuzhou 350007, China
3
Institute of Geography, Fujian Normal University, Fuzhou 350007, China
*
Author to whom correspondence should be addressed.
Forests 2019, 10(5), 435; https://doi.org/10.3390/f10050435
Submission received: 31 March 2019 / Revised: 18 May 2019 / Accepted: 19 May 2019 / Published: 20 May 2019

Abstract

:
Forest soil respiration plays an important role in global carbon (C) cycling. Owing to the high degree of C and nitrogen (N) cycle coupling, N deposition rates may greatly influence forest soil respiration, and possibly even global C cycling. Soil microbes play a crucial role in regulating the biosphere–atmosphere C exchange; however, how microbes respond to N addition remains uncertain. To better understand this process, the experiment was performed in the Castanopsis kawakamii Hayata Nature Reserve, in the subtropical zone of China. Treatments involved applying different levels of N (0, 40, and 80 kg ha−2 year−1) over a three-year period (January 2013–December 2015) to explore how soil physicochemical properties, respiration rate, phospholipid fatty acid (PLFA) concentration, and solid state 13C nuclear magnetic resonance responded to various N addition rate. Results showed that high levels of N addition significantly decreased soil respiration; however, low levels of N addition significantly increased soil respiration. High levels of N reduced soil pH and enhanced P and C co-limitation of microorganisms, leading to significant reductions in total PLFA and changes in the structure of microbial communities. Significant linear relationships were observed between annual cumulative respiration and the concentration of microbial biomass (total PLFA, gram-positive bacteria (G+), gram-negative bacteria (G), total bacteria, and fungi) and the microbial community structure (G+: G ratio). Taken together, increasing N deposition changed microbial community structure and suppressed microbial biomass, ultimately leading to recalcitrant C accumulation and soil C emissions decrease in subtropical forest.

Graphical Abstract

1. Introduction

Anthropogenic reactive nitrogen (N) production originated primarily from agricultural activities, fossil fuel combustion, and the growing popularity of biofuels, and has increased three- to five-fold over the past century [1]. By 2050, N deposition is projected to reach 200 Tg N year−1, especially in forest ecosystems [1,2]. Approximately twice as much C is stored in soils compared to that in the atmosphere. Soil respiration (Rs) is the primary pathway through which C is released from the soil system into the atmosphere [3]. Thus, even minor changes in Rs would have significant effects on C cycling. Given the nature of the relationship between the C and N cycles, which are highly coupled in terrestrial ecosystems [4,5], it is likely that increasing N deposition will greatly influence Rs.
N addition affects Rs through regulating forest productivity, microbial biomass, and activities that are directly related to CO2 production [6]. Meta-analyses have revealed that N addition can increase aboveground and belowground plant growth by 29% and 35.5%, respectively [7,8]. Additionally, N addition reduced microbial biomass by 20% at the global scale [9]. However, how Rs responds to rapid N addition remains unclear and previous results have been inconclusive, including acceleration [10], deceleration [11], and no change [9,12]. The conclusions mentioned above are largely dependent on N-limited regions and there is a lack of subtropical studies. Subtropical systems have high rates of CO2 exchange [13] and relatively high levels of available N in forest soils. Sun et al. [14] suggested that the main factor driving the reduction in Rs is different in N-enriched (microbe-mediated) and N-limited (plant-mediated) forests. However, Lee and Jose [15] also found that fine root production is the main factor affecting Rs in tropical forests. In our previous study, N addition promoted root biomass to utilize higher levels of P (Figure S1) [16]; however, the microbial response has not yet been described.
Large uncertainties exist in terms of belowground C cycling because soil C dynamics are often regulated by complicated microbial processes. N addition directly increases soil N availability and promotes substrate utilization for microbial decomposition [17,18,19]. However, co-limitation with other elements, such as P, may occur in subtropical forests. Moreover, N addition could elicit changes in the availability of substrates, which could accentuate C limitation of soil microbes. Although N addition increased the quantity of litter input to the soil [7,8], the quality of soil organic matter (SOM) may decline via increasing lignin content in litter and polymerization of polyphenols [20,21,22]. Furthermore, chronic N addition could enhance nitrification rates, increase inorganic N concentration, and leach base cations, eventually causing soil acidification to accompany an increase in Al3+, Mn2+, and Fe3+ [23,24], thereby suppressing microbial activity. Therefore, the magnitude of these processes determines the direction of Rs in response to N addition.
Previous studies have shown that the response of microbial activity to N addition gradients is not linear, with the highest levels of microbial activity occurring at moderate N concentration, and decreasing as N levels increase [25,26,27]. This tendency was observed not only in Rs but also in forest respiration, ectomycorrhizal fungal sporocarp production, and fungal mineralization [28,29,30]. Different magnitudes of N addition may have different effects on Rs.
In our study, we performed a manipulative experiment designed to test the effects of N addition on soil CO2 emissions in a subtropical forest. The response factors assessed consisted of Rs rates, soil microbial biomass, microbial community structure, and soil C structure. Investigating the responses of Rs and microbial traits (biomass and community structure) to N addition is critical to develop our understanding of C cycling in subtropical forests. Hence, we hypothesized that: (1) changes in Rs would coincide with changes in microbial traits; (2) the effects of N addition on Rs are mainly mediated by microbial traits, rather than roots.

2. Materials and Methods

2.1. Study Site

The experiment was carried out in the Castanopsis kawakamii Hayata Nature Reserve, which is in central Fujian Province, China (117°28′ E, 26°11′ N), over an almost three-year period (January 2013–December 2015). The study site was composed of an approximately 200-year-old undisturbed mixed stand dominated by Castanopsis carlesii Hayata and Schima superba Gardn. et Champ., with other less abundant species. Stand density and canopy coverage were approximately 1955 trees ha−1 and 89%, respectively.
The climate is classified as a subtropical monsoon, with mean annual precipitation of 1552 mm, 2141 mm, and 2025 mm in 2013, 2014, and 2015, respectively. It has distinct seasons, with most rain falling between March and August. Mean annual temperature, potential evapotranspiration, and relative humidity in this region were 18.7 °C, 1585 mm, and 79%, respectively [31]. Regional soils are Oxisols, formed from sandstone (based on the United States Department of Agriculture Soil Taxonomy), and are about 30–70 cm deep [32].

2.2. Experimental Design

Three N addition treatments (with four replicates each) were established in this forest, consisting of 0 kg ha−2 year−1 (control, CT), 40 kg ha−2 year−1 (low N, LN), and 80 kg ha−2 year−1 (high N, HN). Treatment levels were based on known background atmospheric N deposition rates in subtropical regions of China (18–53 kg ha−2 year−1), with an average deposition rate of ~40 kg ha−2 year−1 [33]. A total of 12 plots (20 m × 20 m) were established, each surrounded by a 10-m wide buffer zone and unshielded from natural atmospheric N deposition. The plots and treatments were set randomly. Beginning in November 2012, a solution of ammonium nitrate (NH4NO3), and 20 L of deionized water was distributed monthly below the canopy with a backpack sprayer, totaling 12 applications of equal volume annually, and an equivalent volume of deionized water was sprayed on the control plots.

2.3. Soil Sample Collection

Five soil cores were collected from each subplot with a 3.5-cm-diameter corer in January 2016. We removed the surface litterfall and collected soil samples from the A horizon (0–10 cm). Soil cores were then kept in portable refrigerated box until being processed in the laboratory. After removal of plant roots and stones, soil samples were sieved through a 2-mm mesh and stored at 4 °C prior to the analysis of inorganic N, dissolved organic C, and N and microbial phospholipid fatty acid (PLFA) content. Part of the soil was air-dried for measuring its pH. The remaining soil was air-dried and ground (<150 μm) for determination of total C and total N.

2.4. Soil Respiration Rate Measurement

Soil respiration rate (Rs) was measured using an automated CO2 efflux system (LI-8100, LI-COR Inc., Lincoln, NE, USA). Eight polyvinyl chloride (PVC) collars (diameter: 20 cm; height: 10 cm) were fixed in each plot in August 2011. Living plants inside the collars were removed and kept for almost 1.5 years to minimize disruption. Soil respiration was assessed once every two weeks over the course of the experimental period. Measurements were taken between 09:00 and 12:00, as soil flux over these hours has been shown to represent the mean of the whole day [34]. Soil temperatures and moisture were simultaneously monitored using a hand-held long-stem thermometer (Model SK-250WP, Sato Keiryoki Mfg. Co. Ltd, Tokyo, Japan) and a time-domain reflectometer (TDR) (Model TDR300, Spectrum Technologies Inc., Plainfield, IL, USA), respectively. The data of monthly soil temperature and annual moisture during study period are shown in Figures S2 and S3.
To examine the effects of N addition rate on Rs in sub/tropical forests, data were obtained from 15 peer-reviewed articles (Table S4) by searching Web of Science. The searched key words were combinations of, “nitrogen (N) addition,” “nitrogen (N) deposition,” “soil respiration,” “subtropical forest” and “tropical forest”. Data were selected based on the following criteria: (1) from a field study (data from incubation studies were excluded); (2) from control and simulated N addition treatments in multifactorial studies. Response ratios of Rs to N addition rate (RRs) were calculated using the following equation:
RRs = ln (RT/RC)
where RT is the treatment mean and RC is the control mean. Here, RRs > 0 means N addition increased soil respiration; RRs = 0, means N addition has no effect on soil respiration; RRs < 0 means N addition reduced soil respiration.

2.5. Phospholipid Fatty Acid Analysis

The soil microbial community was characterized using a phospholipid fatty acid (PLFA) analysis, as previously described by Wan et al. [35]. In brief, a solvent consisting of a 2:1:0.8 mixture of methanol (CH3OH), chloroform (CHCl3), and phosphate buffer (pH 7.4) was used to extract 10 g of freeze-dried soil by shaking for 2 h. The samples were centrifuged at 3500 g for 10 min, and then the supernatant was transferred to a new tube. The remaining soil was re-extracted as described above. The extracted solvents from both steps were combined and then evaporated to 1 mL under N2 gas. Then, neutral glycolipids, glycolipids-, and polar lipids were separated over a silicon hydroxide column eluted with chloroform, acetone, and methanol, respectively. Polar lipids were methylated to form fatty acid methyl esters (FAMEs) by subjecting them to 0.2 M methanolic KOH. Individual FAMEs were identified by Hewlett Packard 5890 gas chromatography, equipped with a 6890 series injector, a flame ionization detector, and an Ultra 2 capillary column (25 m × 0.2 mm inner diameter, film thickness, 0.33 µm) based on their retention times and in combination with the MIDI Sherlock Microbial Identification System (MIDI Inc., Newark, DE, USA).
Although more than 70 PLFAs, ranging from C10–C24, were identified in this experiment, only the 23 PLFAs found to be consistently present in each sample were included in the analysis. PLFAs identified as being derived from gram-positive bacteria (G+) included i14:0, i15:0, a15:0, i16:0, i17:0, and a17:0, whereas those identified as being derived from gram-negative bacteria (G) included 16:1ω9c, 16:1ω7c, cy17:0, 18:1ω7c, 18:1ω5c, and cy19:0 [36,37]. The sum of the PLFAs from G+ and G bacteria was used to as a measure of total bacteria, and those of 10Me16:0, 10Me17:0, and 10Me18:0 were selected to measure actinomycetes. We selected 18:2ω6c and 18:1ω9c as fungi markers [38]. The PLFAs 14:0, 15:0, 16:0, 16:1ω5c, 17:0, and 18:0 were detected in both bacteria and fungi; thus, they were used to assess the unclassified markers [39,40,41]. The sum of all selected phospholipids was used to estimate the total microbial biomass and for the analysis of microbial community structure. The G+:G ratio was used to estimate the G+ to G bacterial biomass (G+:G), and the fungal: bacterial PLFA ratio was used to estimate the ratio of fungi to bacteria (F:B).

2.6. Solid-State 13C Nuclear Magnetic Resonance Spectroscopy Analysis

Soil samples for solid state 13C cross polarization magic angle spinning (CP-MAS) nuclear magnetic resonance (NMR) analysis were repeatedly treated with 2% hydrofluoric acid, then rinsed with deionized water, freeze-dried, and ground into powder [42]. The powdered samples were packed into 4-mm zirconium rotors. Solid state 13C NMR spectra were acquired on a 500 MHz Bruker BioSpin Avance III spectrometer (Bruker BioSpin, Rheinstetten, Germany) equipped with a 4-mm probe. The parameters used to obtain the spectra consisted of a 13 kHz spinning rate, 1 ms ramp-CP contact time, 1 s recycle delay, and 4096 scans. Glycine was used as the external reference for chemical shift. NMR spectra were processed using a zero filling factor of 2 and 75 Hz line broadening. The NMR spectra were divided into seven regions representing the different chemical environments of the 13C nucleus (Table S1). The ratios were calculated using percentage intensity values as follows [43,44]:
A/O-A ratio = alkyl C/O − alkyl C
aromaticity = aromatic C/(alkyl C + methoxyl and N-alkyl C + O-alkyl C + Di-O-alkyl + phenolic C + aromatic C)

2.7. Additional Soil Analysis

Soil inorganic N was treated with 2 M KCl and analyzed using a Continuous Flow Analytic System (Skalar san++, Skalar, Breda, Netherlands); soil organic C (SOC) and total N (TN) were determined with an elemental analyzer (Elementar Vario EL III, Elementar, Langenselbold, Germany). Dissolved organic C (DOC) and N (DON) were extracted from 10 g of field-moist soil by mixing the soil with 40 mL deionized water at 20 °C and shaking for 30 min, then filtering the supernatant through a 0.45-μm filter membrane [45]. Soil pH was determined with a pH meter (STARTER 300, OHAUS, Pine Brook, NJ, USA) in a 1:2.5 soil: water solution. Soil moisture content was measured gravimetrically by drying for 48 h at 105 °C.

2.8. Statistical Analyses

Daily cumulative respiration (Rc) was calculated from Rs as follows:
Rc (g C m−2 d−1) = Rs (μmol m−2 s−1) × 3600 (s h−1) × 24 (h d−1) × 12/1,000,000 (g mol−1)
Soil respiration was measured every two weeks with a total of 24 samplings/year. Annual cumulative respiration was calculated by daily Rc multiplied by the number of sampling interval days. Equation used was as follows:
A n n u a l   c u m u l a t i v e   r e s p i r a t i o n = i = 1 24   daily   R c   i   × 15
The relationship between the Rs and soil temperatures was performed using following widely exponential regression model [46]:
Rs = aebt
where Rs is the soil respiration rate, t is the soil temperature at 5 cm depth, a and b are the model coefficients.
The apparent temperature sensitively (Q10) was calculated as follows:
Q10 = e10b
All statistical analyses were performed using SPSS v.21.0 (SPSS Inc., Chicago, IL, USA). All response variables were tested for normality and homoscedasticity prior to statistical analyses, and data were log-transformed when the assumptions were not met (DON, ammonium nitrogen [NH4+-N]). One-way analysis of variance (ANOVA) with the Tukey’s HSD test was used to evaluate the differences in soil physicochemical properties, annual cumulative respiration, Q10, and PLFA in response to different N-addition treatments. Linear regression model analyses were conducted to explore the relationships among PLFA and annual cumulative respiration.

3. Results

3.1. Response of Soil Physicochemical Properties to N Deposition

No significant differences in SOC, TN, ammonium N (NH4+-N), or nitrate N (NO3-N) were detected after three years of N deposition (Table 1). Soil pH decreased with increasing N, with pH significantly reduced (by 0.13 units) in the HN treatment. Soil DOC was significantly higher in the LN treatment, and soil DON increased with higher N addition, with levels in the HN treatment being significantly higher than those in the CT and LN treatments.

3.2. Response of Soil Respiration Rate and Temperature Sensitivity to N Addition

Monthly dynamics of Rs rate showed a strong seasonal pattern, with the highest rate observed in July–August and the lowest in January–February for all treatments (Figure 1). Annual cumulative Rs in the LN treatment was 15.62%, 19.16%, and 23.29% higher than in the CT treatment in 2013, 2014, and 2015, respectively, while annual cumulative Rs in the HN treatment was 11.86% and 16.68% lower relative to the CT treatment in 2014 and 2015, respectively (Figure 2). However, during the period of 2013 to 2015, the sensitivities of Rs to soil temperature were not significantly different among N-addition treatments (Table 2 and Table S2).

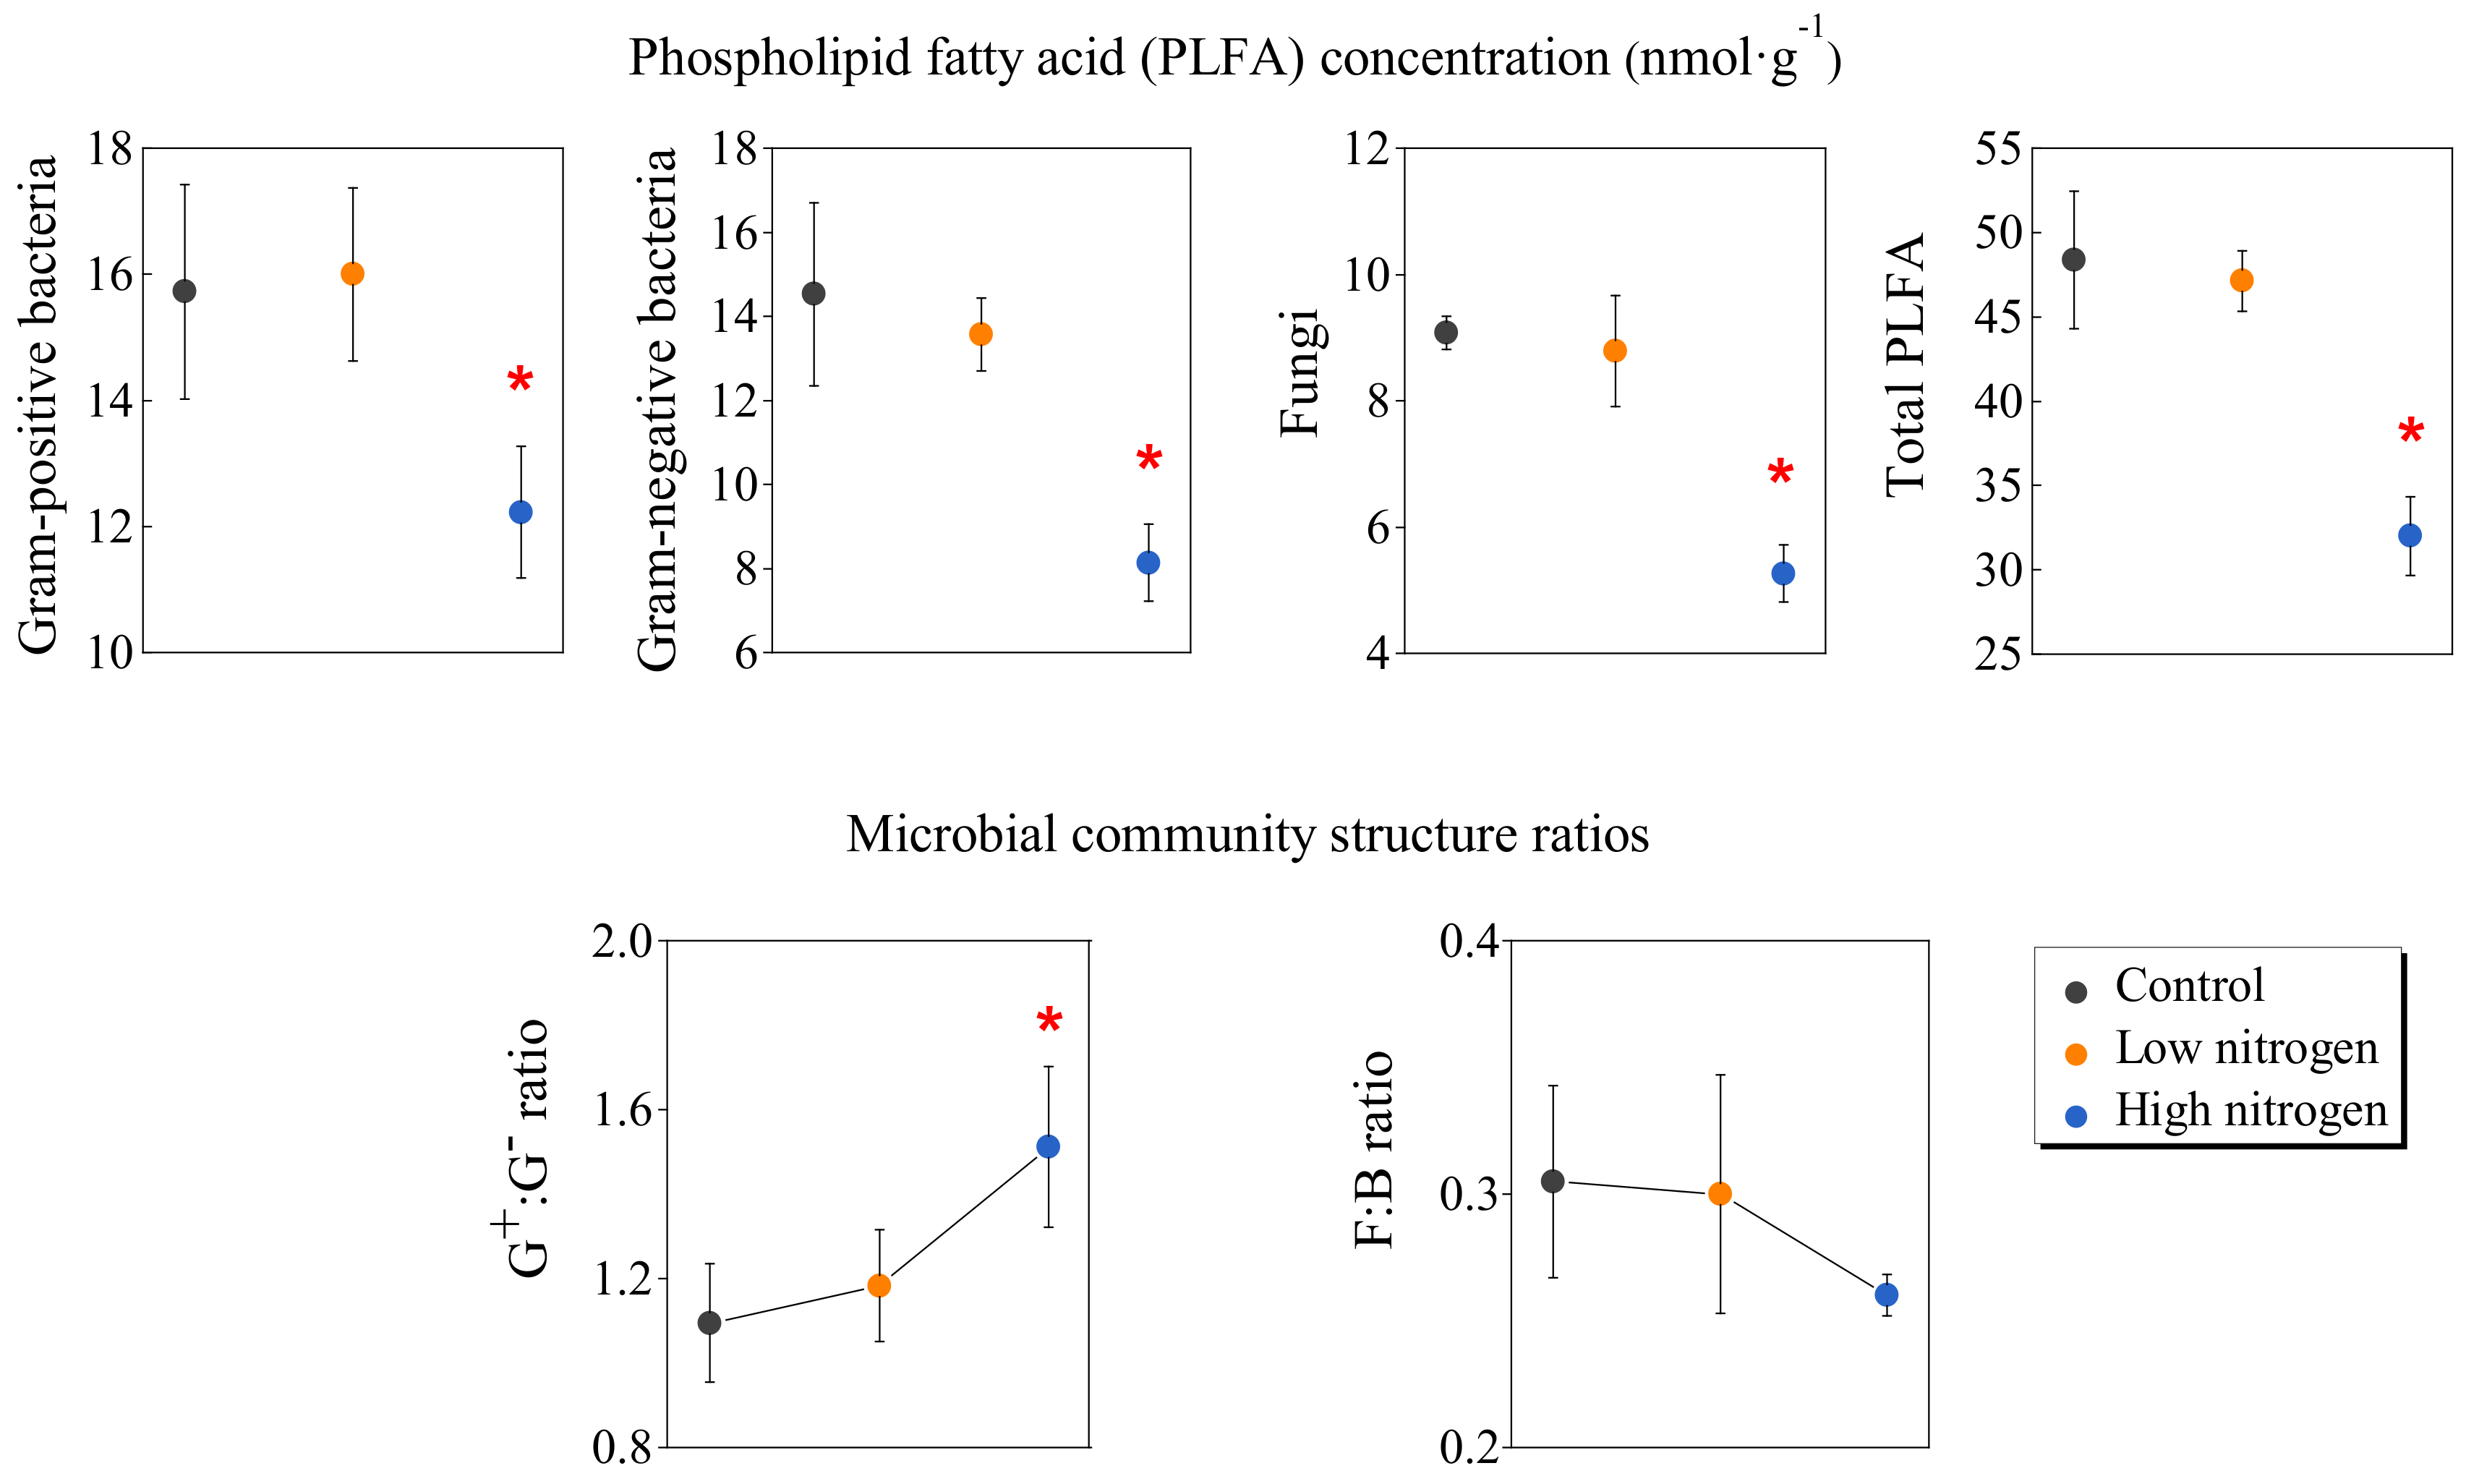
3.3. Response of Microbial Community to N Addition

The concentrations of G+, G, fungi, and total PLFA were significantly decreased in the HN treatment, but no significant differences were observed for any of the PLFA between the LN and CT treatments (Figure 3; Table S3). The ratio of G+: G was significantly higher in the HN treatment than in the CT treatment (1.5 and 1.1, respectively), but no significant difference in F:B ratio was observed among the treatments.

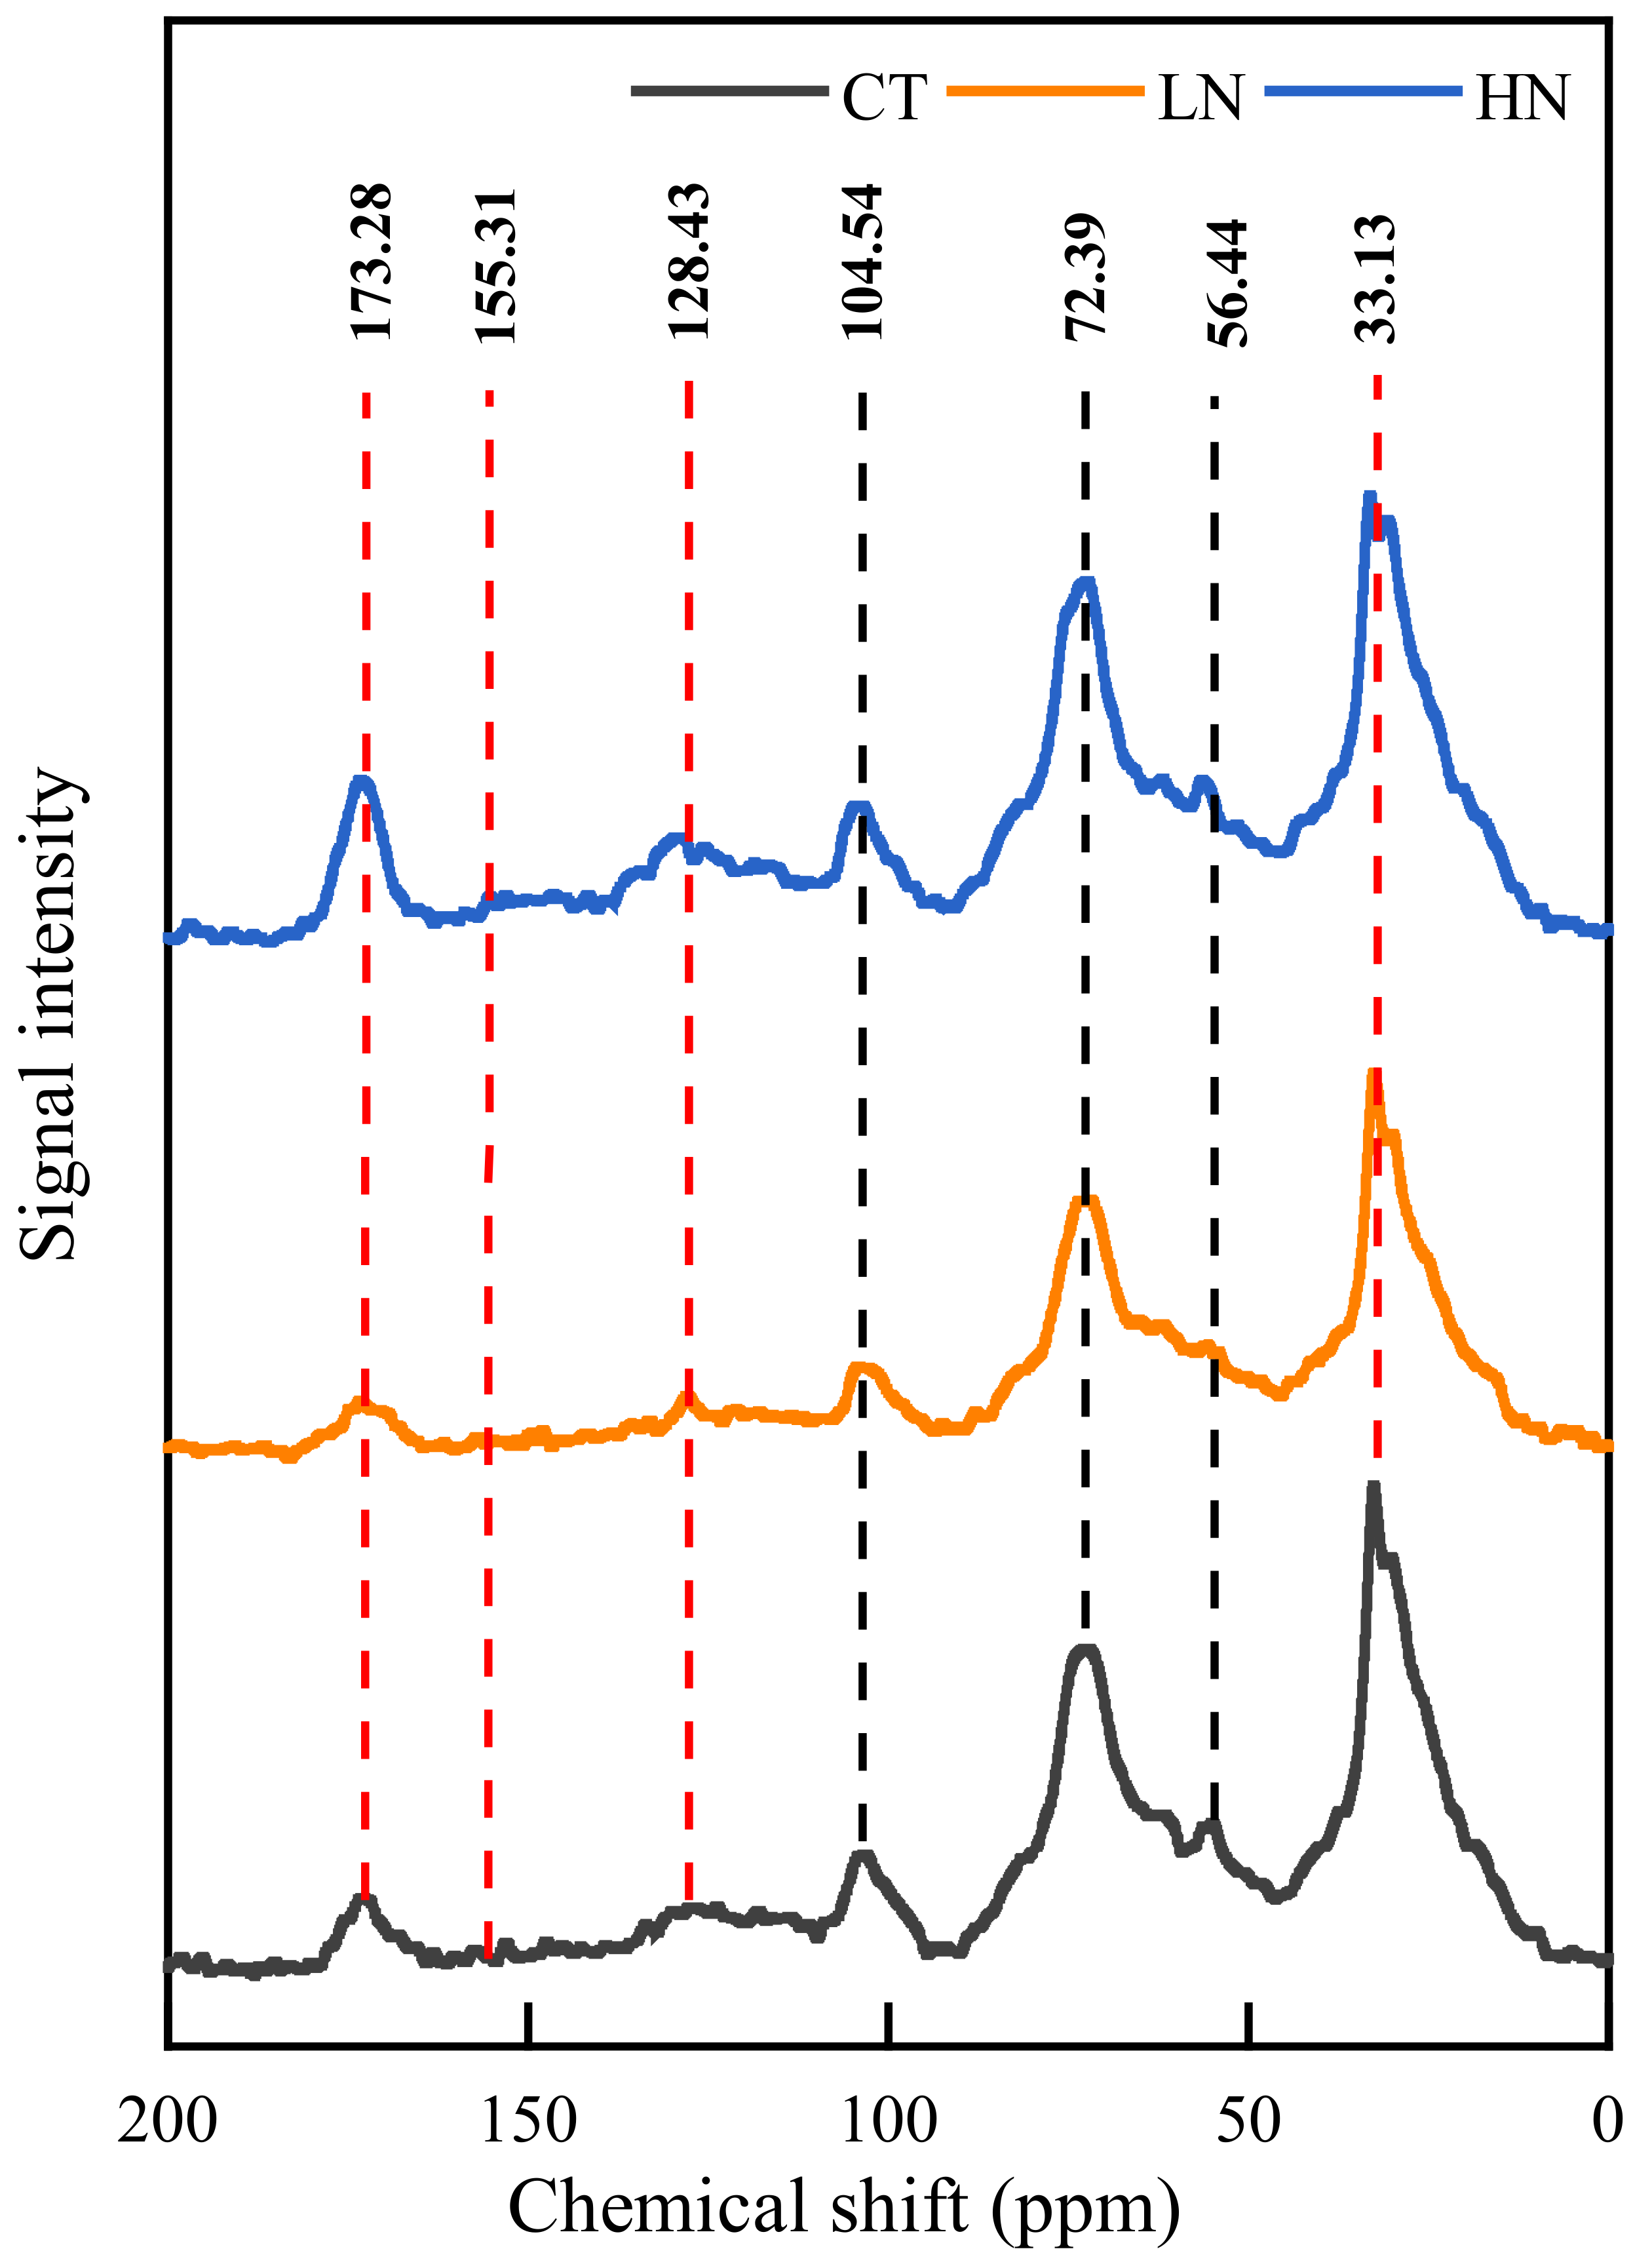
3.4. Response of Soil Chemical Characteristics to N Addition

The most dominant component was the alkyl C region (Figure 4; Table S1). Alkyl C, aromatic C, phenolic C, and carboxyl/carbonyl C exhibited major differences in the HN treatment. Thus, differences in these chemical shift regions caused a 9% reduction in A/O-A and a 5% increase in aromaticity.

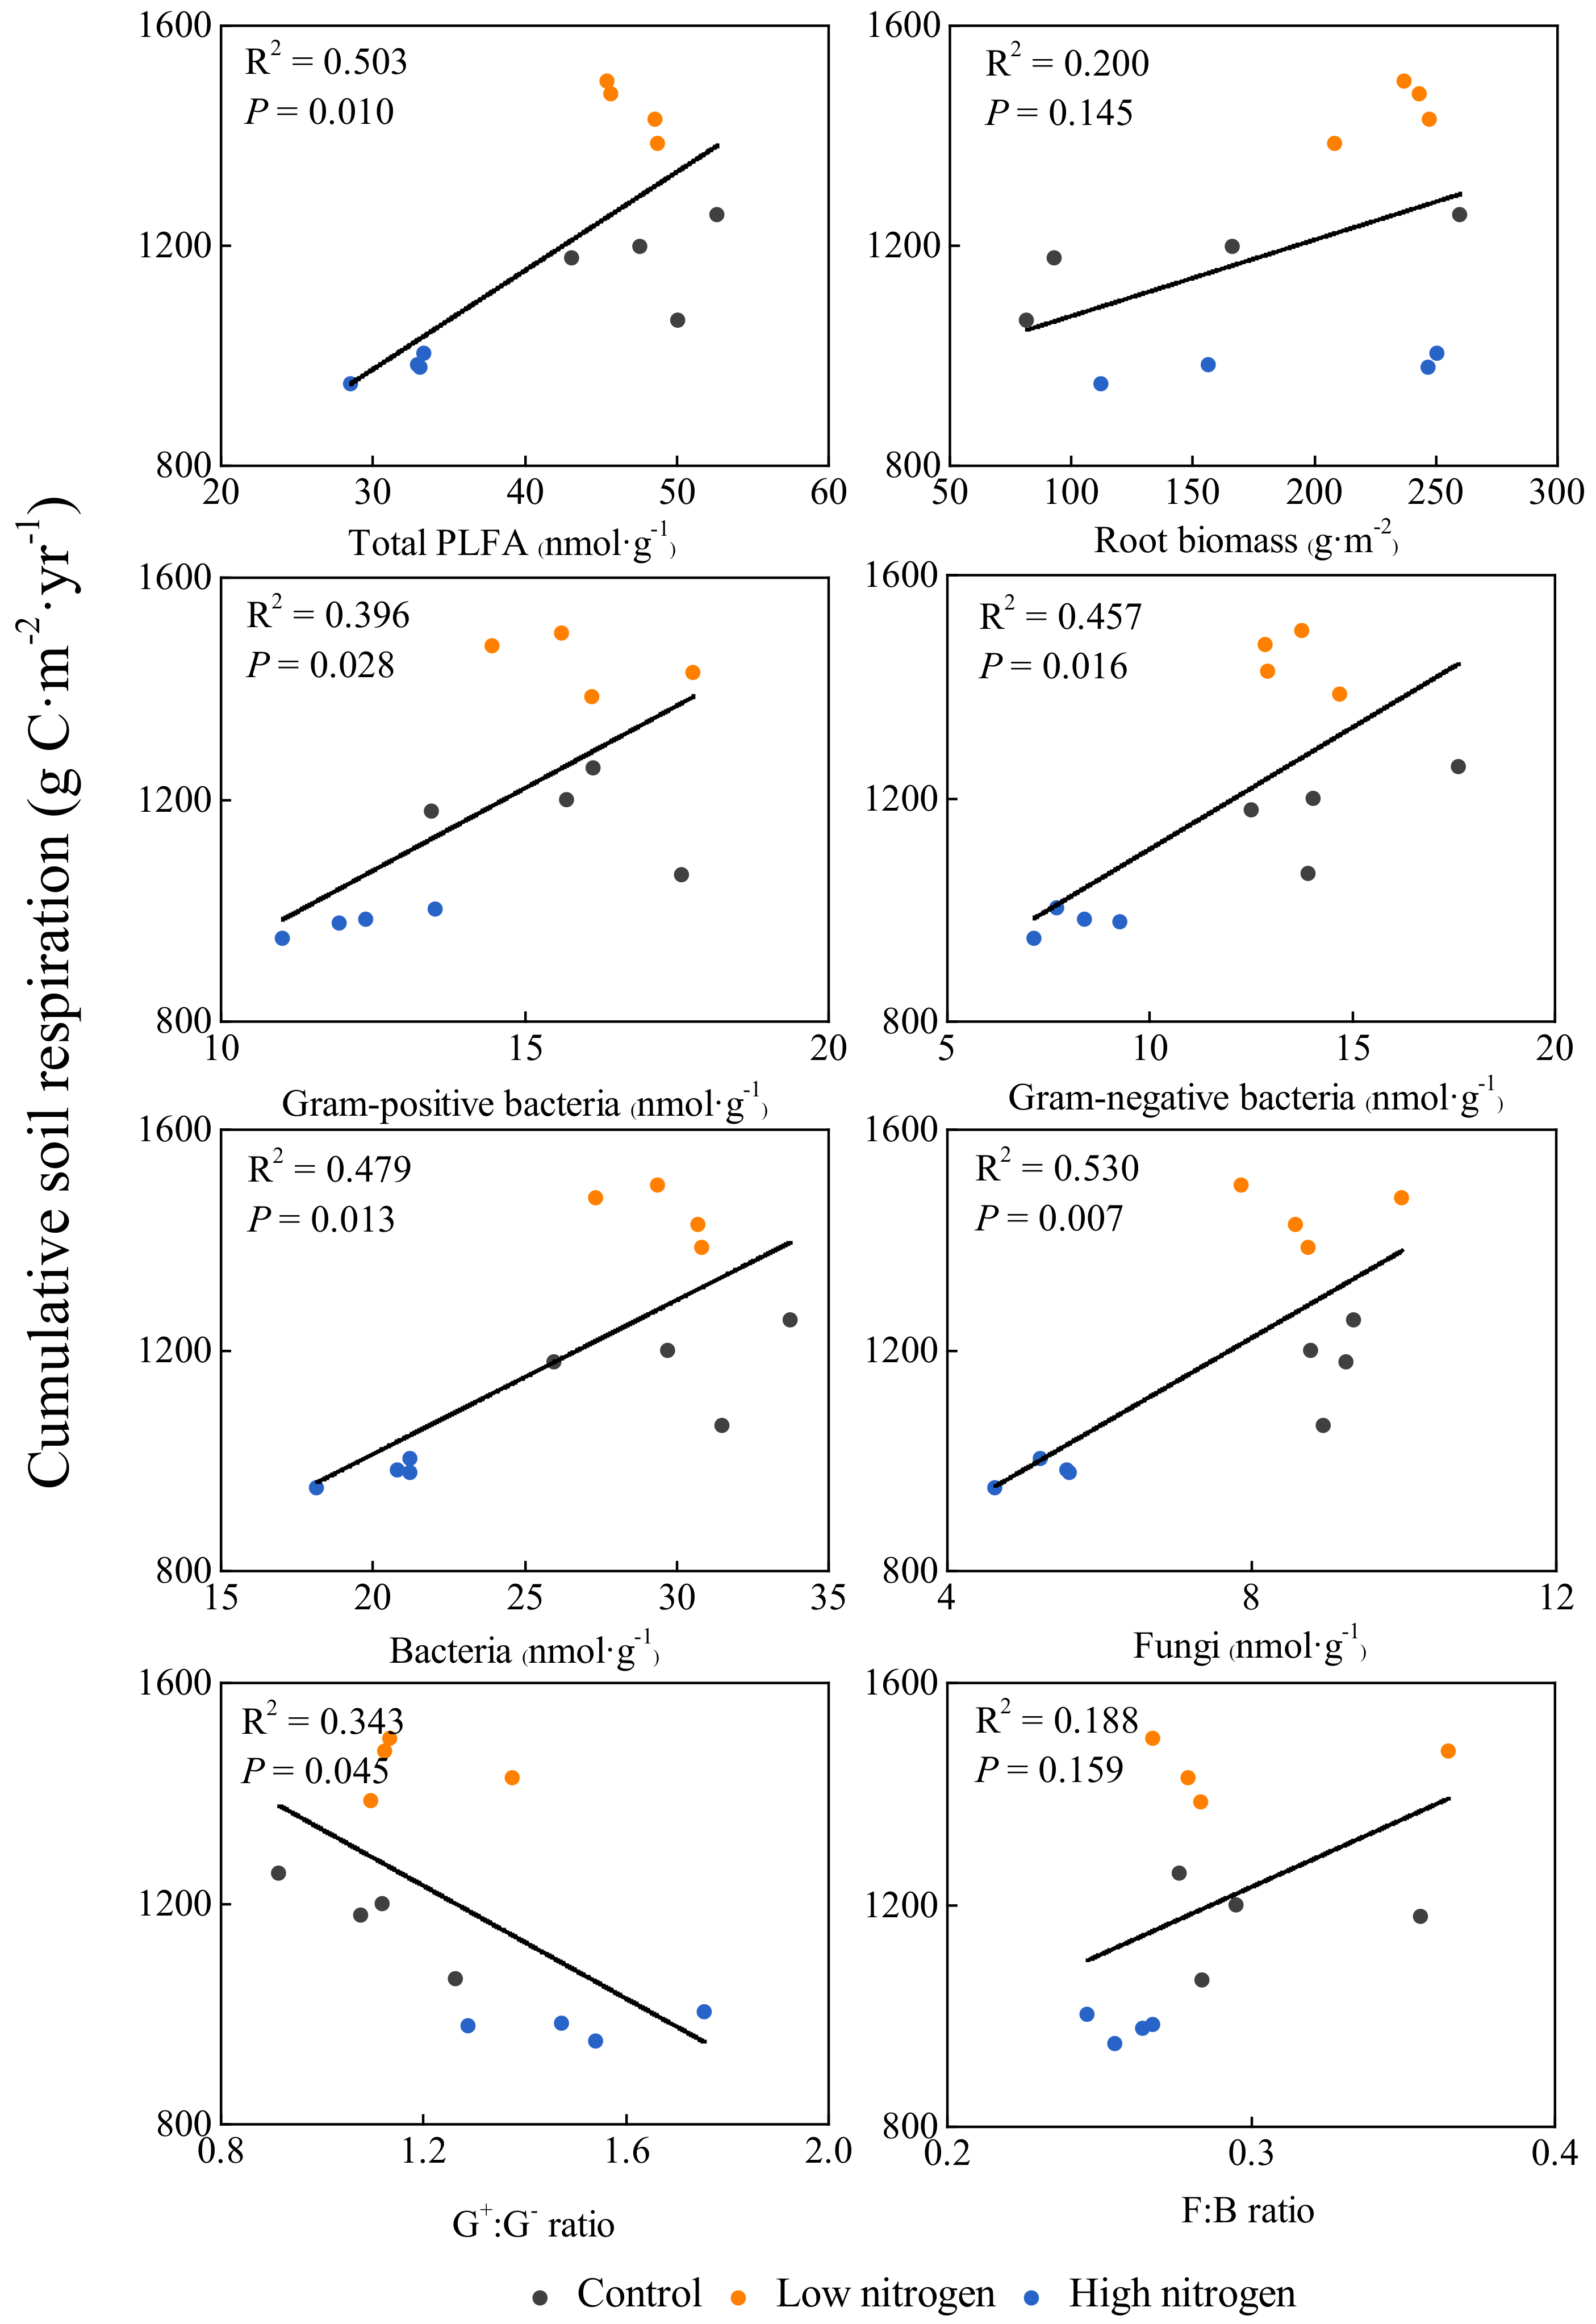
3.5. Correlation between Annual Cumulative Soil Respiration and Microbial Biomass, Root Biomass and Microbial Community Structure Ratio

Significant linear relationships were found between annual cumulative Rs and the concentration of microbial biomass (total PLFA, G+, G, total bacteria, and fungi) and the G+: G ratio according to linear regression. However, neither root biomass nor the F:B ratio was significantly correlated with annual cumulative Rs in 2015 (Figure 5).

4. Discussion

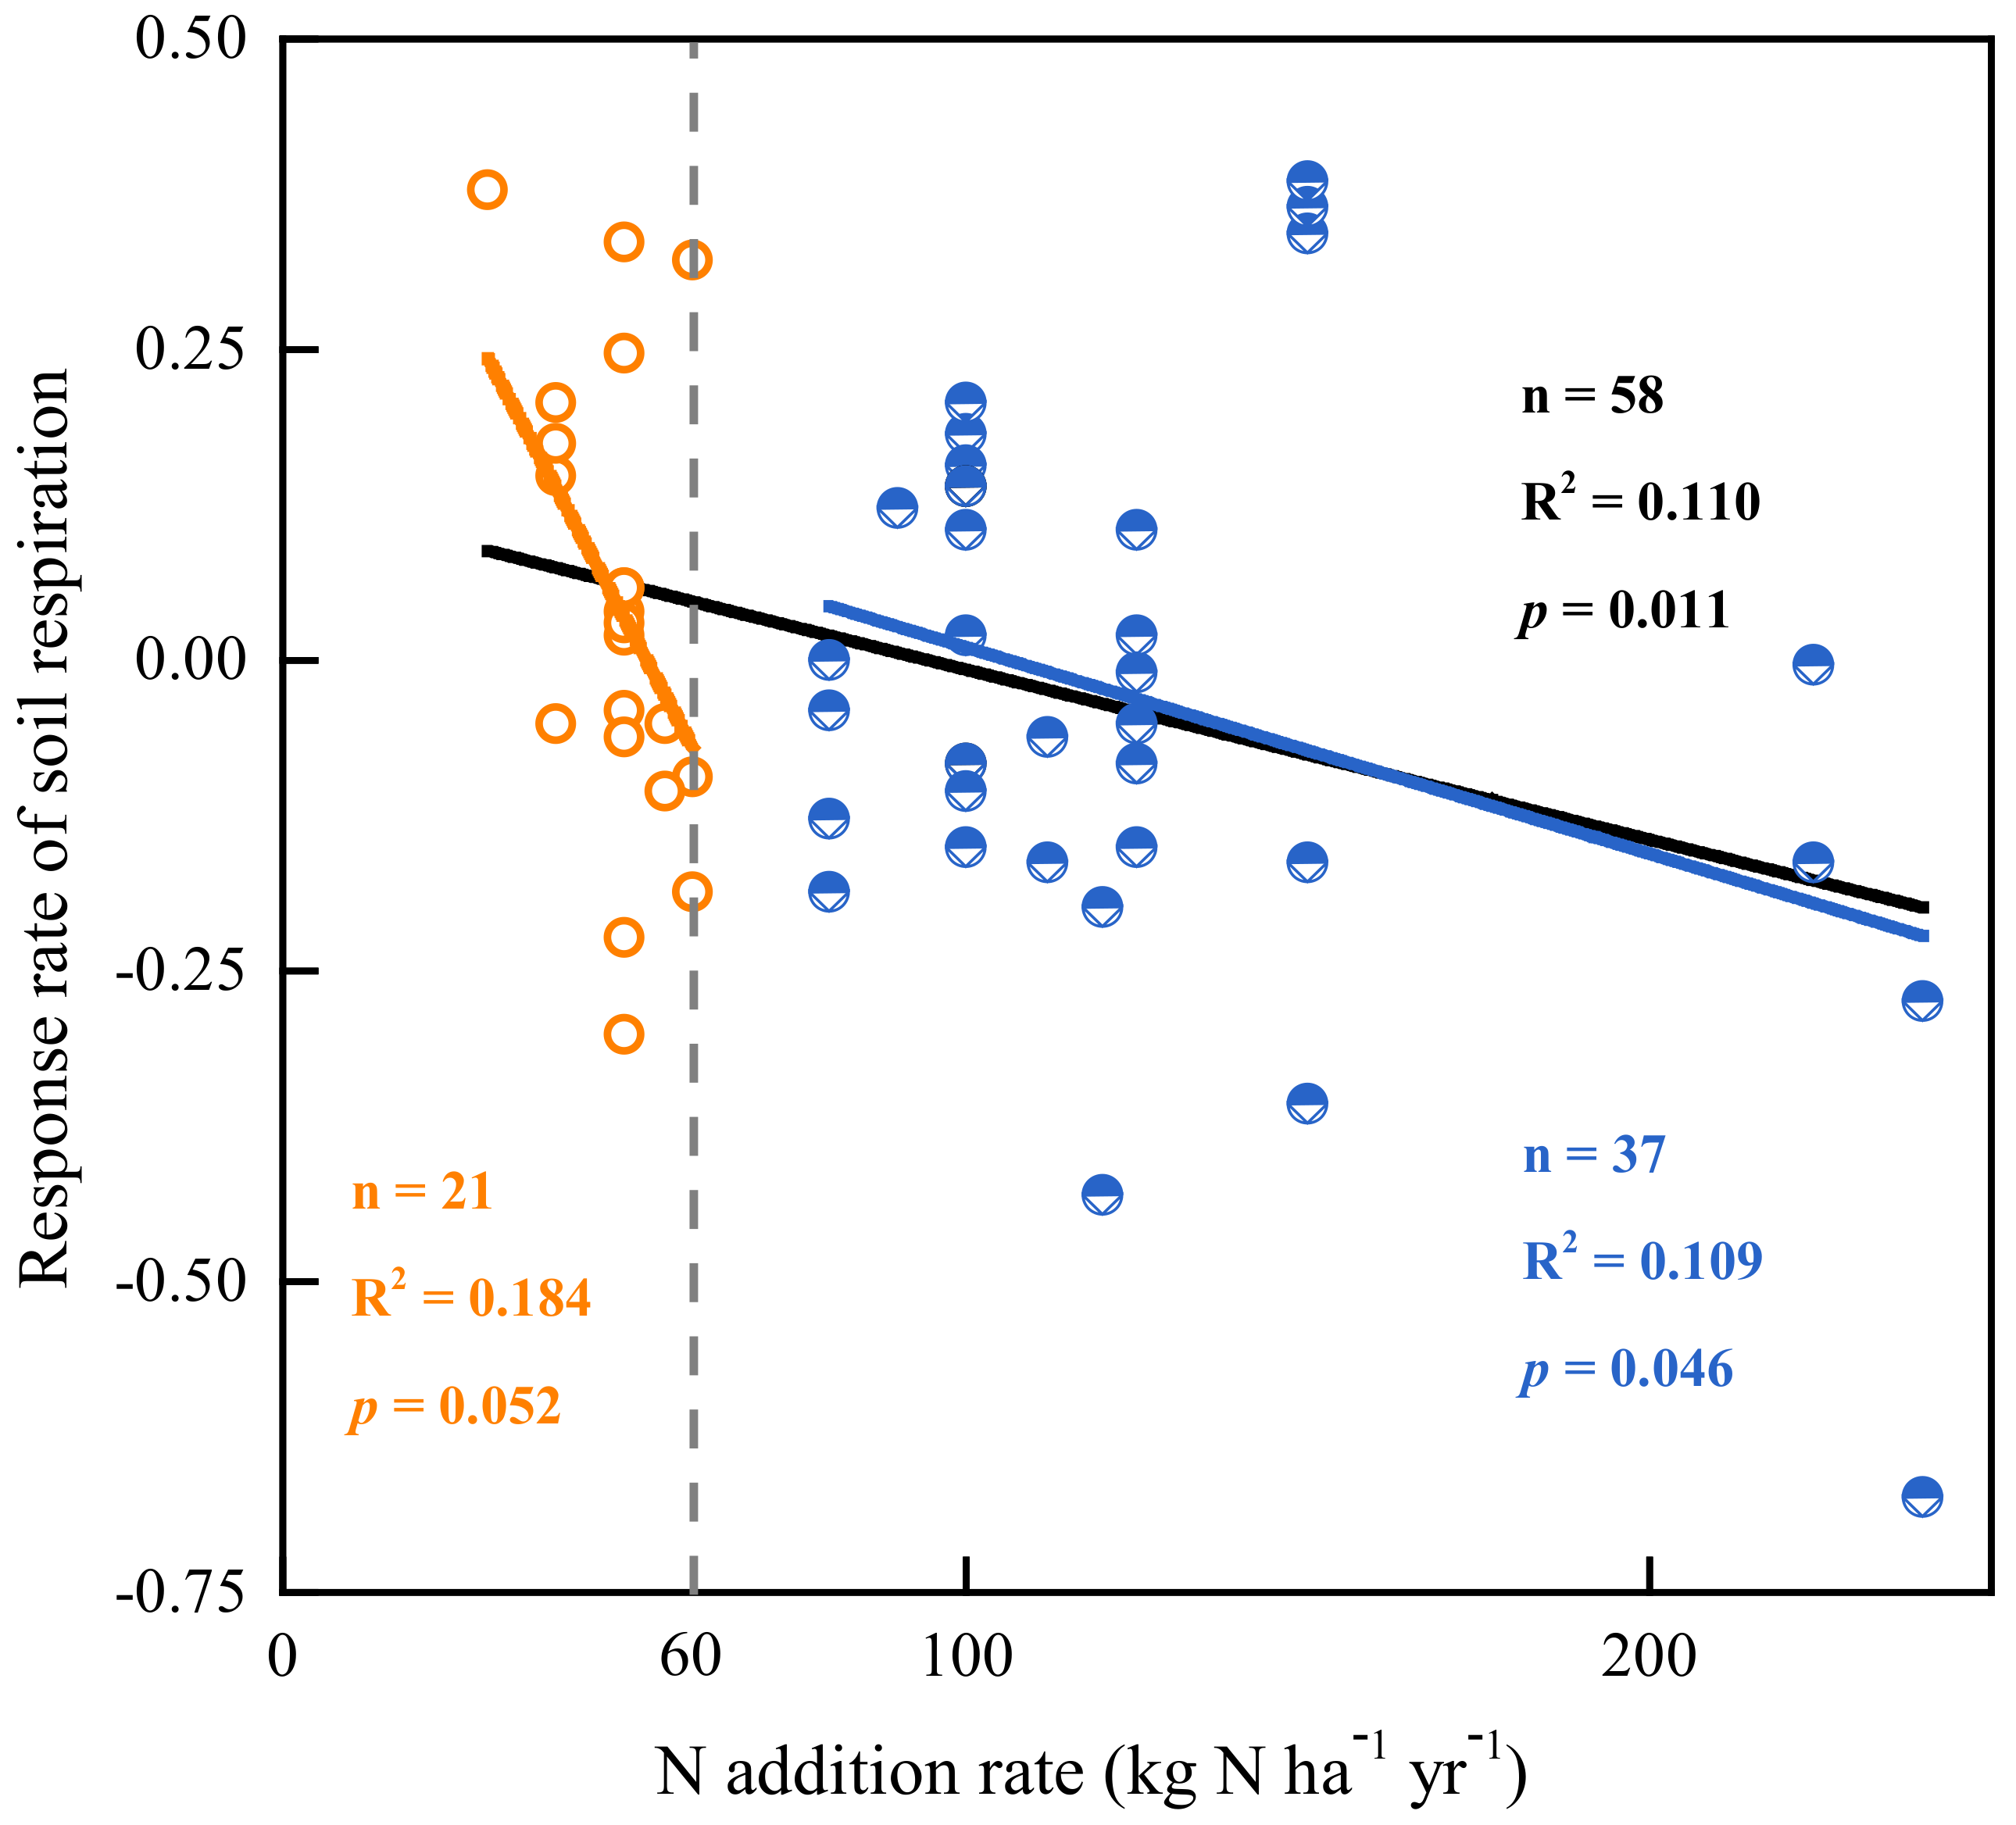
4.1. Effects of N Addition on Soil Respiration

Nitrogen deposition did not affect the seasonal patterns of Rs rates, with the highest rate observed in July–August and the lowest in January–February (Figure 1). This seasonal pattern has been reported in previous studies and can be ascribed to differences in mean temperature [47,48]. N addition induced significant changes in Rs rates (p < 0.05); however, the different rates of N addition exhibited distinct trends in terms of their effect on Rs. This discrepancy in annual cumulative respiration among the treatments continued to diverge over time, which was consistent with results reported by Allison et al. [28], Hasselquist et al. [30], Bowden et al. [48], and Maaroufi et al. [49]. This is because a certain threshold for N addition exists. For instance, in a subtropical Moso bamboo forest ecosystem, Li et al. [6] found that a N addition rate of 60 kg N ha−1 year−1 may reflect a N saturation threshold. When N addition rate exceed 60 kg N ha−1 year−1, N addition still increased Rs, but the positive effects diminished. However, in our study, a significant decrease in Rs was observed in 2014 and 2015 when N addition rate exceed 60 kg N ha−1 year−1, possibly because the bamboo plantation was N-limited and had a high demand for N [50], unlike the natural forests examined in previous research.
Previously, there have been six meta-analyses with regard to the effects of N addition on Rs [9,10,11,12,51,52]. However, these studies paid little attention to subtropical forests owing to the smaller sample sizes reported. With the increasing attention paid to subtropical forests in recent years, several studies have been carried out. We recollected a series of data from 16 study sites (including this study) and defined <60 kg N ha−1 year−1 as a low N addition rate according to a N saturation threshold of 50–60 kg N ha−1 year−1 for global aboveground net primary production [53]. We found strong evidence to indicate that N addition significantly reduces Rs in subtropical forests as observed in all examined studies (n = 58, p = 0.011; Figure 6, Table S4). However, the magnitude of N addition rate also affected the response of Rs, which mainly showed as a high N addition rate reducing Rs (n = 37, p = 0.046), while the response of Rs to low N addition rate varied (n = 21, p = 0.052). It is noteworthy that N addition rate is a dominant factor affecting soil acidification and total microbial biomass; however, Zhou et al. [54] indicated that the effect of N addition rate was ignored in several of the previous meta-analyses, such as Janssens et al. [11], Treseder [51], and Lu et al. [52]. In particular, in subtropical forest ecosystems, rapid N addition exacerbates the loss of NO3 combined base cations (K+, Na+, Ca2+, and Mg2+) through leaching, which in turn causes nutrient cations to be lost at a faster rate than minerals can be replenished [55]. A lack of base cations can be harmful to vegetative and microbial growth in subtropical forest ecosystems [56,57] leading to lower Rs.
In our control treatment, the Q10 value (2.07) was similar to that reported from a subtropical rehabilitated forest (2.1) [58], but lower than those from a subtropical disturbed forest (2.3) [58], a Moso bamboo forest (2.29) [6], a sweetgum forest (2.73) [59], and a larch forest (3.24) [14] across the temperate zone. This is in line with the observations of Wang et al. [60], in which Q10 showed a positive relationship with latitude in forest ecosystems. In addition, the C:N ratio is a dominant factor for regulating Q10, owing to the shift from C limitation to nutrient limitation with increasing latitude [60,61]. This result may support the microbial N mining theory, which suggests that microbes decompose more SOM to obtain sufficient N at high temperature in high latitude forests with low N availability [62].

4.2. Microbial Community and Carbon Structure under N Addition

In accordance with our first hypothesis, we found that the HN treatment reduced the concentration of bacteria, fungi, actinomycetes, and unclassified biomarkers (Figure 3; Table S3), leading to a significant reduction in total PLFA. Both incubation and field studies have definitively shown that Rs and microbial biomass are consistently suppressed following N addition [11,51,63]. However, a recent meta-analysis by Zhou et al. [54] revealed that a decrease in microbial biomass is not always associated with N addition suppressing microbial activity. Interestingly, the companion study reported that the C:N:P stoichiometry in microbial biomass was significantly altered in the HN treatments and enhanced microbial P limitation [32]. Additionally, high N addition significantly reduced soil pH. Therefore, these results collectively demonstrate that high N addition inhibits microbial growth.
Ramirez et al. [63] suggested that understanding how N addition induces change in soil microbial communities is imperative for better understanding soil C storage dynamics. High availability of N could alter the microbial process of SOC that is controlled by the microbial community [64,65]. In our study, the HN treatments not only inhibited microbial biomass but also shifted microbial composition (increased G+:G ratio). The two different groups of Gram-stained bacteria, classified by their cell wall compositions, have been shown to differ in their preferences regarding substrate conditions and living strategies in a changing environment [66]. G+ are well-adapted to low SOM substrates, while G prefer conditions with high organic matter availability [67,68]. Increase in the G+:G ratio under the high N addition treatment not only indicated a low quality substrate but also an acclimation of microbes to changes in substrate and nutrient availability.
Undoubtedly, the inhibition in microbial biomass and shift in soil microbial community structure affected the soil C structure, to an extent. The results of the solid state 13C NMR spectroscopy analysis showed that the relative proportions of aromatic C and phenolic C, which originate from lignin and amino acids of peptides [43,69], increased under the HN treatment (Figure 4; Table S1). Wang et al. [65] also observed that lignin-derived phenols accumulated in soil with long-term N addition (22 years). There are two plausible reasons for this observation. First, that N addition significantly increased the lignin content of the plant and litter [21], leading to lower substrate decomposition rates with higher lignin content [70]. Second, phenolic compounds are highly resistant to degradation, being susceptible only to a handful of fungal species that are more efficient at lignin decomposition [71]. Thus, non-preferred microbial substrates would accumulate under high N addition.

4.3. Correlation between Soil Respiration and Microbial Biomass, Root Biomass, and Microbial Community Structure Ratio under N Addition

A significant correlation was observed between microbial traits (biomass and community structure) and cumulative Rs rather than root biomass (Figure 5). These results supported our second hypothesis, that microbial traits are primary factors affecting Rs under N addition, which is to say that the decrease in Rs is mainly due to microbes. A reasonable explanation is that microbes may be subject to co-limiting factors in subtropical forests, such as C and P, rather than N [65,72,73]. This pattern of Rs under N addition is different in N limited ecosystems, which have often been reported to increase Rs via root products and biomass [74]. Importantly, heterotrophic respiration dominates Rs (almost 72%) [75], and the positive relationships were observed between root/fine root biomass and autotrophic respiration [15,76] and microbial biomass and heterotrophic respiration [77]. Additionally, N addition significantly increased root biomass (Figure S1) and decreased microbial biomass, which collectively suggested that heterotrophic respiration may have decreased even further under N addition.
Decreasing microbial biomass is always accompanied by decreasing microbial diversity [78]. Microbial diversity is a vital determinant of ecological function that cannot be obtained using the PLFA method [79]. Thus, it is necessary to employ nucleic-acid-based methods to link microbial diversity to function. In this study, N addition inhibited microbial biomass and shifted microbial community structure, which disrupted the microbial process of SOM, leading to a decrease in Rs and an increase in recalcitrant C accumulation, but was also beneficial to an increase in forest soil C sequestration. However, nutrient release from microbial decomposition will slow down as SOC storage increases. Especially in natural forests without intensive management practices (such as fertilization), shifts in biogeochemical cycling will alter the productivity of ecosystems.

5. Conclusions

The effects of N addition on Rs are subject to an N saturation threshold, which triggered low N addition to increase Rs and high N addition to decrease Rs in the subtropical C. carlesii forest investigated. High N addition increased P limitation and decreased pH. Additionally, high N addition led to recalcitrant C accumulation, restricting microbial utilization. These processes collectively reduced the total PLFA concentration and shifted microbial community structure (G+: G ratio). Our results suggest that microbial traits are dominant factors affecting Rs. As such, additional research on the transformations in soil microbial traits in response to increasing rates of N deposition may provide further insights into soil C emission dynamics in subtropical forests.

Supplementary Materials

The following are available online at https://www.mdpi.com/1999-4907/10/5/435/s1, Figure S1. Changes in root biomass under different N addition treatments. Values are means ± standard error (n = 4). * indicates statistically significant differences at p < 0.05. CT: control, LN: low nitrogen, HN: high nitrogen, Figure S2. Monthly soil temperature dynamics in 2013 (a), 2014 (b), and 2015 (c), Figure S3. Soil moisture under N addition from 2013 to 2015, Table S1. Relative carbon (C) distribution (%) in different chemical shift regions in 13C cross-polarization magic-angle spinning of soil under different nitrogen addition treatments, Table S2. The exponential relationship between soil CO2 emission rate and soil temperature in each subplots under different nitrogen addition treatments, Table S3 Effects of N addition on the phospholipid fatty acid biomarker concentration (nmol g−1 soil). Error bars represent standard deviation (n = 4). The different letters indicate significant differences between treatments at p < 0.05. G+: gram-positive bacteria; G: gram-negative bacteria; Bacteria: sum of G+ and G; Unclassified: unclassified biomarkers; ACT: actinomycetes; Total: total PLFA, Table S4 Characteristics of 16 studies site. RRs: Response ratio of soil respiration.

Author Contributions

Conceptualization, J.Z., X.L., Y.C. and Y.Y.; Formal analysis, J.X.; Funding acquisition, Y.C. and Y.Y.; Investigation, J.Z., X.L., M.L., Y.Z. and Z.Y.; Methodology, J.X., M.L., Y.Z., Z.Y., Y.F., C.L. and G.C.; Supervision, Y.C. and Y.Y.; Writing—original draft, J.Z.; Writing—review & editing, J.Z. and Y.C.

Funding

This research was funded in part through the National Natural Science Foundation of China (No. U1505233, No. 31670620) and the National Key Basic Research Program of China (973 Program) (No. 2014CB954003).

Acknowledgments

We would like to thank Wei Zheng, Yuhuang Ji and Guoyu Li for their help in field work and laboratory analyses.

Conflicts of Interest

The authors declare no conflict of interest.

References

  1. Galloway, J.N.; Townsend, A.R.; Erisman, J.W.; Bekunda, M.; Cai, Z.; Freney, J.R.; Martinelli, L.A.; Seitzinger, S.P.; Sutton, M.A. Transformation of the nitrogen cycle: Recent trends, questions, and potential solutions. Science 2008, 320, 889–892. [Google Scholar] [CrossRef]
  2. Sutton, M.A.; Nemitz, E.; Erisman, J.W.; Beier, C.; Bahl, K.B.; Cellier, P.; de Vries, W.; Cotrufo, F.; Skiba, U.; Di Marco, C.; et al. Challenges in quantifying biosphere-atmosphere exchange of nitrogen species. Environ. Pollut. 2007, 150, 125–139. [Google Scholar] [CrossRef] [PubMed]
  3. Bond-Lamberty, B.; Thomson, A. Temperature-associated increases in the global soil respiration record. Nature 2010, 464, 579–582. [Google Scholar] [CrossRef]
  4. Tateno, M.; Chapin, F.S. The logic of carbon and nitrogen interactions in terrestrial ecosystems. Am. Nat. 1997, 149, 723–744. [Google Scholar] [CrossRef]
  5. Cleveland, C.C.; Liptzin, D. C:N:P stoichiometry in soil: Is there a “Redfield ratio” for the microbial biomass? Biochemistry 2007, 85, 235–252. [Google Scholar] [CrossRef]
  6. Li, Q.; Song, X.; Chang, S.X.; Peng, C.; Xiao, W.; Zhang, J.; Xiang, W.; Li, Y.; Wang, W. Nitrogen depositions increase soil respiration and decrease temperature sensitivity in a Moso bamboo forest. Agric. For. Meteorol. 2019, 268, 48–54. [Google Scholar] [CrossRef]
  7. Lebauer, D.S.; Treseder, K.K. Nitrogen limitation of net primary productivity in terrestrial ecosystems is globally distributed. Ecology 2008, 89, 371–379. [Google Scholar] [CrossRef]
  8. Xia, J.; Wan, S. Global response patterns of terrestrial plant species to nitrogen addition. New Phytol. 2008, 179, 428–439. [Google Scholar] [CrossRef] [Green Version]
  9. Liu, L.; Greaver, T.L. A global perspective on belowground carbon dynamics under nitrogen enrichment. Ecol. Lett. 2010, 13, 819–828. [Google Scholar] [CrossRef] [PubMed]
  10. Zhou, L.; Zhou, X.; Zhang, B.; Lu, M.; Luo, Y.; Liu, L.; Li, B. Different responses of soil respiration and its components to nitrogen addition among biomes: a meta-analysis. Glob. Chang. Biol. 2014, 20, 2332–2343. [Google Scholar] [CrossRef]
  11. Janssens, I.A.; Dieleman, W.; Luyssaert, S.; Subke, J.A.; Reichstein, M.; Ceulemans, R.; Ciais, P.; Dolman, A.J.; Grace, J.; Matteucci, G. Reduction of forest soil respiration in response to nitrogen deposition. Nat. Geosci. 2010, 3, 315–322. [Google Scholar] [CrossRef]
  12. Yue, K.; Peng, Y.; Peng, C.; Yang, W.; Peng, X.; Wu, F. Stimulation of terrestrial ecosystem carbon storage by nitrogen addition: a meta-analysis. Sci. Rep. 2016, 6, 19895. [Google Scholar] [CrossRef] [PubMed]
  13. Townsend, A.R.; Cleveland, C.C.; Houlton, B.Z.; Alden, C.B.; White, J.W.C. Multi-element regulation of the tropical forest carbon cycle. Front. Ecol. Environ. 2011, 9, 9–17. [Google Scholar] [CrossRef] [Green Version]
  14. Sun, Z.; Liu, L.; Ma, Y.; Yin, G.; Zhao, C.; Zhang, Y.; Piao, S. The effect of nitrogen addition on soil respiration from a nitrogen-limited forest soil. Agric. For. Meteorol. 2014, 197, 103–110. [Google Scholar] [CrossRef]
  15. Lee, K.H.; Jose, S. Soil respiration, fine root production, and microbial biomass in cottonwood and loblolly pine plantations along a nitrogen fertilization gradient. For. Ecol. Manag. 2003, 185, 263–273. [Google Scholar] [CrossRef]
  16. Fan, Y.; Zhong, X.; Lin, F.; Liu, C.; Yang, L.; Wang, M.; Chen, G.; Chen, Y.; Yang, Y. Responses of soil phosphorus fractions after nitrogen addition in a subtropical forest ecosystem: Insights from decreased Fe and Al oxides and increased plant roots. Geoderma 2019, 337, 246–255. [Google Scholar] [CrossRef]
  17. Vivanco, L.; Austin, A.T. Intrinsic effects of species on leaf litter and root decomposition: A comparison of temperate grasses from North and South America. Oecologia 2006, 150, 97–107. [Google Scholar] [CrossRef]
  18. Parton, W.; Silver, W.L.; Burke, I.C.; Grassens, L.; Harmon, M.E.; Currie, W.S.; King, J.Y.; Adair, E.C.; Brandt, L.A.; Hart, S.C. Global-Scale Similarities in Nitrogen Release Patterns during Long-Term Decomposition. Science 2007, 315, 361. [Google Scholar] [CrossRef]
  19. Schimel, J.P.; Weintraub, M.N. The implication of exoenzyme activity on microbial carbon and nitrogen limitation in soil: a theoretical model. Soil Biol. Biochem. 2003, 35, 549–563. [Google Scholar] [CrossRef]
  20. Wu, N.; Filley, T.R.; Bai, E.; Han, S.; Jiang, P. Incipient changes of lignin and substituted fatty acids under N addition in a Chinese forest soil. Org. Geochem. 2015, 79, 14–20. [Google Scholar] [CrossRef]
  21. Liu, J.; Wu, N.; Wang, H.; Sun, J.; Peng, B.; Jiang, P.; Bai, E. Nitrogen addition affects chemical compositions of plant tissues, litter and soil organic matter. Ecology 2016, 97, 1796–1806. [Google Scholar] [CrossRef]
  22. Haider, K.; Martin, J.P. Synthesis and Transformation of Phenolic Compounds by Epicoccum nigrum in Relation to Humic Acid Formation1. Soil Sci. Soc. Am. J. 1967, 31, 766. [Google Scholar] [CrossRef]
  23. Bouwman, A.F.; van Vuuren, D.P.; Derwent, R.G.; Posch, M. A global analysis of acidification and eutrophication of terrestrial ecosystems. Water Air Soil Pollut. 2002, 141, 349–382. [Google Scholar] [CrossRef]
  24. Tian, D.; Niu, S. A global analysis of soil acidification caused by nitrogen addition. Environ. Res. Lett. 2015, 10, 024019. [Google Scholar] [CrossRef] [Green Version]
  25. Enrique, A.G.; Bruno, C.; Christopher, A.; Virgile, C.; Stéven, C. Effects of nitrogen availability on microbial activities, densities and functional diversities involved in the degradation of a Mediterranean evergreen oak litter (Quercus ilex L.). Soil Biol. Biochem. 2008, 40, 1654–1661. [Google Scholar] [CrossRef]
  26. Zhang, N.; Wan, S.; Li, L.; Bi, J.; Zhao, M.; Ma, K. Impacts of urea N addition on soil microbial community in a semi-arid temperate steppe in northern China. Plant Soil 2008, 311, 19–28. [Google Scholar] [CrossRef]
  27. Zhou, X.; Zhang, Y.; Downing, A. Non-linear response of microbial activity across a gradient of nitrogen addition to a soil from the Gurbantunggut Desert, northwestern China. Soil Biol. Biochem. 2012, 47, 67–77. [Google Scholar] [CrossRef]
  28. Allison, S.D.; LeBauer, D.S.; Ofrecio, M.R.; Reyes, R.; Ta, A.M.; Tran, T.M. Low levels of nitrogen addition stimulate decomposition by boreal forest fungi. Soil Biol. Biochem. 2009, 41, 293–302. [Google Scholar] [CrossRef]
  29. Ouyang, X.; Zhou, G.; Huang, Z.; Zhou, C.; Li, J.; Shi, J.; Zhang, D. Effect of N and P addition on soil organic C potential mineralization in forest soils in South China. J. Environ. Sci. 2008, 20, 1082–1089. [Google Scholar] [CrossRef]
  30. Hasselquist, N.J.; Metcalfe, D.B.; Högberg, P. Contrasting effects of low and high nitrogen additions on soil CO2flux components and ectomycorrhizal fungal sporocarp production in a boreal forest. Glob. Chang. Biol. 2012, 18, 3596–3605. [Google Scholar] [CrossRef]
  31. Liu, X.; Yang, Z.; Lin, C.; Giardina, C.P.; Xiong, D.; Lin, W.; Chen, S.; Xu, C.; Chen, G.; Xie, J. Will nitrogen deposition mitigate warming-increased soil respiration in a young subtropical plantation? Agric. For. Meteorol. 2017, 246, 78–85. [Google Scholar] [CrossRef]
  32. Fan, Y.; Lin, F.; Yang, L.; Zhong, X.; Wang, M.; Zhou, J.; Chen, Y.; Yang, Y. Decreased soil organic P fraction associated with ectomycorrhizal fungal activity to meet increased P demand under N application in a subtropical forest ecosystem. Biol. Fertil. Soils 2017, 54, 149–161. [Google Scholar] [CrossRef]
  33. Liu, X.; Lei, D.; Mo, J.; Du, E.; Shen, J.; Lu, X.; Ying, Z.; Zhou, X.; He, C.; Zhang, F. Nitrogen deposition and its ecological impact in China: An overview. Environ. Pollut. 2011, 159, 2251–2264. [Google Scholar] [CrossRef]
  34. Sheng, H.; Yang, Y.; Yang, Z.; Chen, G.; Xie, J.; Guo, J.; Zou, S. The dynamic response of soil respiration to land-use changes in subtropical China. Glob. Chang. Biolog. 2010, 16, 1107–1121. [Google Scholar] [CrossRef]
  35. Wan, X.; Huang, Z.; He, Z.; Yu, Z.; Wang, M.; Davis, M.R.; Yang, Y. Soil C:N ratio is the major determinant of soil microbial community structure in subtropical coniferous and broadleaf forest plantations. Plant Soil 2015, 387, 103–116. [Google Scholar] [CrossRef]
  36. Frostegård, Å.; Tunlid, A.; Bååth, E. Use and misuse of PLFA measurements in soils. Soil Biol. Biochem. 2011, 43, 1621–1625. [Google Scholar] [CrossRef]
  37. Ushio, M.; Balser, T.C.; Kitayama, K. Effects of condensed tannins in conifer leaves on the composition and activity of the soil microbial community in a tropical montane forest. Plant Soil 2013, 365, 157–170. [Google Scholar] [CrossRef]
  38. Swallow, M.; Quideau, S.A.; MacKenzie, M.D.; Kishchuk, B.E. Microbial community structure and function: The effect of silvicultural burning and topographic variability in northern Alberta. Soil Biol. Biochem. 2009, 41, 770–777. [Google Scholar] [CrossRef]
  39. Olsson, P.A. Signature fatty acids provide tools for determination of the distribution and interactions of mycorrhizal fungi in soil. Fems Microbiol. Ecol. 1999, 29, 303–310. [Google Scholar] [CrossRef] [Green Version]
  40. Fierer, N.; Schimel, J.P.; Holden, P.A. Variations in microbial community composition through two soil depth profiles. Soil Biol. Biochem. 2003, 35, 167–176. [Google Scholar] [CrossRef] [Green Version]
  41. Tornberg, K.; Bååth, E.; Olsson, S. Fungal growth and effects of different wood decomposing fungi on the indigenous bacterial community of polluted and unpolluted soils. Biol. Fertil. Soils 2003, 37, 190–197. [Google Scholar]
  42. Skjemstad, J.O.; Clarke, P.; Taylor, J.A.; Oades, J.M.; Newman, R.H. The removal of magnetic materials from surface soils—A solid state 13 C CP/MAS NMR study. Aus. J. Soil Res. 1994, 32, 1215–1229. [Google Scholar] [CrossRef]
  43. Preston, C.M.; Nault, J.R.; Trofymow, J.A. Chemical Changes During 6 Years of Decomposition of 11 Litters in Some Canadian Forest Sites. Part 2. 13C Abundance, Solid-State 13C NMR Spectroscopy and the Meaning of “Lignin”. Ecosystems 2009, 12, 1078–1102. [Google Scholar] [CrossRef]
  44. Dai, K.O.H.; Johnson, C.E.; Driscoll, C.T. Organic matter chemistry and dynamics in clear-cut and unmanaged hardwood forest ecosystems. Biogeochemistry 2001, 54, 51–83. [Google Scholar] [CrossRef]
  45. Jones, D.L.; Willett, V.B. Experimental evaluation of methods to quantify dissolved organic nitrogen (DON) and dissolved organic carbon (DOC) in soil. Soil Biol. Biochem. 2006, 38, 991–999. [Google Scholar] [CrossRef]
  46. Lloyd, J.; Taylor, J.A. On the Temperature Dependence of Soil Respiration. Funct. Ecol. 1994, 8, 315–323. [Google Scholar] [CrossRef]
  47. Zhang, X.J.; Hui, X.U.; Chen, G.X. Major factors controlling nitrous oxide emission and methane uptake from forest soil. J. For. Res. 2001, 12, 239–242. [Google Scholar]
  48. Bowden, R.D.; Davidson, E.; Savage, K.; Arabia, C.; Steudler, P. Chronic nitrogen additions reduce total soil respiration and microbial respiration in temperate forest soils at the Harvard Forest. For. Ecol. Manag. 2004, 196, 43–56. [Google Scholar] [CrossRef]
  49. Maaroufi, N.I.; Nordin, A.; Hasselquist, N.J.; Bach, L.H.; Palmqvist, K.; Gundale, M.J. Anthropogenic nitrogen deposition enhances carbon sequestration in boreal soils. Glob. Chang. Biol. 2015, 21, 3169–3180. [Google Scholar] [CrossRef]
  50. Song, X.; Gu, H.; Wang, M.; Zhou, G.; Li, Q. Management practices regulate the response of Moso bamboo foliar stoichiometry to nitrogen deposition. Sci. Rep. 2016, 6, 24107. [Google Scholar] [CrossRef] [Green Version]
  51. Treseder, K.K. Nitrogen additions and microbial biomass: A meta-analysis of ecosystem studies. Ecol. Lett. 2008, 11, 1111–1120. [Google Scholar] [CrossRef] [PubMed]
  52. Lu, M.; Zhou, X.; Luo, Y.; Yang, Y.; Fang, C.; Chen, J.; Li, B. Minor stimulation of soil carbon storage by nitrogen addition: A meta-analysis. Agric. Ecosyst. Environ. 2011, 140, 234–244. [Google Scholar] [CrossRef]
  53. Tian, D.; Hong, W.; Jian, S.; Niu, S. Global evidence on nitrogen saturation of terrestrial ecosystem net primary productivity. Environ. Res. Lett. 2016, 11, 024012. [Google Scholar] [CrossRef] [Green Version]
  54. Zhou, Z.; Wang, C.; Zheng, M.; Jiang, L.; Luo, Y. Patterns and mechanisms of responses by soil microbial communities to nitrogen addition. Soil Biol. Biochem. 2017, 115, 433–441. [Google Scholar] [CrossRef]
  55. Driscoll, C.T.; Driscoll, K.M.; Mitchell, M.J.; Raynal, D.J. Effects of acidic deposition on forest and aquatic ecosystems in New York State. Environ. Pollut. 2003, 123, 327–336. [Google Scholar] [CrossRef]
  56. Mo, J.; Li, D.; Gundersen, P. Seedling growth response of two tropical tree species to nitrogen deposition in southern China. Eur. J. For. Res. 2008, 127, 275–283. [Google Scholar] [CrossRef]
  57. Lu, X.; Mao, Q.; Gilliam, F.S.; Luo, Y.; Mo, J. Nitrogen deposition contributes to soil acidification in tropical ecosystems. Glob. Chang. Biol. 2014, 20, 3790–3801. [Google Scholar] [CrossRef] [PubMed] [Green Version]
  58. Mo, J.; Zhang, W.; Zhu, W.; Fang, Y.; Li, D.; Zhao, P. Response of soil respiration to simulated N deposition in a disturbed and a rehabilitated tropical forest in southern China. Plant Soil 2007, 296, 125–135. [Google Scholar] [CrossRef]
  59. Liu, Q.; Edwards, N.T.; Post, W.M.; Gu, L.; Ledford, J.; Lenhart, S. Temperature-independent diel variation in soil respiration observed from a temperate deciduous forest. Glob. Chang. Biol. 2006, 12, 2136–2145. [Google Scholar] [CrossRef]
  60. Wang, Q.K.; Zhao, X.C.; Chen, L.C.; Yang, Q.P.; Chen, S.; Zhang, W.D. Global synthesis of temperature sensitivity of soil organic carbon decomposition: Latitudinal patterns and mechanisms. Funct. Ecol. 2019, 33, 514–523. [Google Scholar] [CrossRef]
  61. Liu, Y.; He, N.P.; Zhu, J.X.; Xu, L.; Yu, G.R.; Niu, S.L.; Sun, X.M.; Wen, X.F. Regional variation in the temperature sensitivity of soil organic matter decomposition in China’s forests and grasslands. Glob. Chang. Biol. 2017, 23, 3393–3402. [Google Scholar] [CrossRef]
  62. Chen, R.; Senbayram, M.; Blagodatsky, S.; Myachina, O.; Dittert, K.; Lin, X.; Blagodatskaya, E.; Kuzyakov, Y. Soil C and N availability determine the priming effect: microbial N mining and stoichiometric decomposition theories. Glob. Chang. Biol. 2014, 20, 2356–2367. [Google Scholar] [CrossRef]
  63. Ramirez, K.S.; Craine, J.M.; Fierer, N. Consistent effects of nitrogen amendments on soil microbial communities and processes across biomes. Glob. Chang. Biol. 2012, 18, 1918–1927. [Google Scholar] [CrossRef]
  64. Fatemi, F.R.; Fernandez, I.J.; Simon, K.S.; Dail, D.B. Nitrogen and phosphorus regulation of soil enzyme activities in acid forest soils. Soil Biol. Biochem. 2016, 98, 171–179. [Google Scholar] [CrossRef] [Green Version]
  65. Wang, J.J.; Bowden, R.D.; Lajtha, K.; Washko, S.E.; Wurzbacher, S.J.; Simpson, M.J. Long-term nitrogen addition suppresses microbial degradation, enhances soil carbon storage, and alters the molecular composition of soil organic matter. Biogeochemistry 2019, 142, 299–313. [Google Scholar] [CrossRef]
  66. Feng, X.; Simpson, M.J. Temperature and substrate controls on microbial phospholipid fatty acid composition during incubation of grassland soils contrasting in organic matter quality. Soil Biol. Biochem. 2009, 41, 804–812. [Google Scholar] [CrossRef]
  67. Griffiths, B.S.; Ritz, K.; Ebblewhite, N.; Dobson, G. Soil microbial community structure: effects of substrate loading rates. Soil Biol. Biochem. 1999, 31, 145–153. [Google Scholar] [CrossRef]
  68. Kramer, C.; Gleixner, G. Variable use of plant- and soil-derived carbon by microorganisms in agricultural soils. Soil Biol. Biochem. 2006, 38, 3267–3278. [Google Scholar] [CrossRef]
  69. Baldock, J.A.; Oades, J.M.; Waters, A.G.; Peng, X.; Vassallo, A.M.; Wilson, M.A. Aspects of the Chemical Structure of Soil Organic Materials as Revealed by Solid-State 13CNMR Spectroscopy. Biogeochemistry 1992, 16, 1–42. [Google Scholar] [CrossRef]
  70. Knorr, M.; Frey, S.D.; Curtis, P.S. Nitrogen Additions and Litter Decomposition: A Meta-Analysis. Ecology 2005, 86, 3252–3257. [Google Scholar] [CrossRef]
  71. Frey, S.D.; Ollinger, S.; Nadelhoffer, K.; Bowden, R.; Brzostek, E.; Burton, A.; Caldwell, B.A.; Crow, S.; Goodale, C.L.; Grandy, A.S.; et al. Chronic nitrogen additions suppress decomposition and sequester soil carbon in temperate forests. Biogeochemistry 2014, 121, 305–316. [Google Scholar] [CrossRef]
  72. Berg, M.P.; Kniese, J.P.; Zoomer, R.; Verhoef, H.A. Long-term decomposition of successive organic strata in a nitrogen saturated Scots pine forest soil. For. Ecol. Manag. 1998, 107, 159–172. [Google Scholar] [CrossRef]
  73. Davidson, E.A.; Sabá, R.T. Nitrogen and phosphorus limitation of biomass growth in a tropical secondary forest. Ecol. Appl. 2004, 14, 150–163. [Google Scholar] [CrossRef]
  74. Zeng, W.; Chen, J.; Liu, H.; Wang, W. Soil respiration and its autotrophic and heterotrophic components in response to nitrogen addition among different degraded temperate grasslands. Soil Biol. Biochem. 2018, 124, 255–265. [Google Scholar] [CrossRef]
  75. Chambers, J.Q.; Tribuzy, E.S.; Toledo, L.C.; Crispim, B.F.; Higuchi, N.; dos Santos, J.; Araujo, A.C.; Kruijt, B.; Nobre, A.D.; Trumbore, S.E. Respiration from a tropical forest ecosystem: Partitioning of sources and low carbon use efficiency. Ecol. Appl. 2004, 14, S72–S88. [Google Scholar] [CrossRef]
  76. Zhu, J.; Yan, Q.; Fan, A.N.; Yang, K.; Hu, Z. The role of environmental, root, and microbial biomass characteristics in soil respiration in temperate secondary forests of Northeast China. Trees 2009, 23, 189–196. [Google Scholar] [CrossRef]
  77. Iqbal, J.; Hu, R.; Feng, M.; Lin, S.; Malghani, S.; Ali, I.M. Microbial biomass, and dissolved organic carbon and nitrogen strongly affect soil respiration in different land uses: A case study at Three Gorges Reservoir Area, South China. Agric. Ecosyst. Environ. 2010, 137, 294–307. [Google Scholar] [CrossRef]
  78. Wang, C.; Liu, D.; Bai, E. Decreasing soil microbial diversity is associated with decreasing microbial biomass under nitrogen addition. Soil Biol. Biochem. 2018, 120, 126–133. [Google Scholar] [CrossRef]
  79. Philippot, L.; Spor, A.; Henault, C.; Bru, D.; Bizouard, F.; Jones, C.M.; Sarr, A.; Maron, P.A. Loss in microbial diversity affects nitrogen cycling in soil. Int. Soc. Microb. Ecol. 2013, 7, 1609–1619. [Google Scholar] [Green Version]
Figure 1. Monthly dynamics of soil respiration rate under different N treatments in 2013 (a), 2014 (b), and 2015 (c). Error bars represent standard deviation (n = 4).
Forests 10 00435 g001
Figure 2. Annual cumulative soil respiration under different N treatments for the period of 2013–2015. * indicates statistically significant difference at p < 0.05.
Forests 10 00435 g002
Figure 3. Phospholipid fatty acid (PLFA) concentrations and microbial community structure ratios under different N addition treatments. Error bars represent standard deviation (n = 4). * indicates significant difference between the treatment and control at p < 0.05.
Forests 10 00435 g003
Figure 4. Solid-state 13C nuclear magnetic resonance spectra of soil under different N addition treatments. The red dashed line indicates changes in the chemical shift regions.
Forests 10 00435 g004
Figure 5. Linear relationships between annual cumulative respiration in 2015 and concentrations of PLFA, microbial community structure ratios, and root biomass.
Forests 10 00435 g005
Figure 6. Linear relationship between N addition rate and response ratios of soil respiration (RRs) in subtropical systems of the present study and other regions of the world. Orange hollow points indicate relatively low N addition (N addition rate < 60 kg N ha−1 year−1); blue points indicate relatively high N addition (N addition rate > 60 kg N ha−1 year−1); orange line indicates linear regression between relatively low N addition rate and RRs; blue line indicates linear regression between relatively high N addition rate and RRs; black line indicates linear regression between N addition rate and RRs.
Forests 10 00435 g006
Table 1. Effects of N deposition on soil physicochemical properties.
PropertiesCTLNHNContrast Test
SOC (g·kg−1)36.61(7.47)39.18(13.03)33.32(7.99)0.709
Total N (g·kg−1)2.67(0.27)2.70(0.53)2.54(0.32)0.838
pH4.08(0.06)a3.97(0.09)ab3.95(0.09)b0.096
NH4+-N (mg·kg−1)10.79(2.50)7.21(0.96)9.57(4.21)0.053
NO3-N (mg·kg−1)1.37(0.32)1.62(0.53)1.59(0.57)0.070
DOC (mg·kg−1)41.93(12.36)b66.80(3.43)a39.88(8.03)b0.003
DON (mg·kg−1)49.95(5.32)b58.66(6.98)b132.32(12.93)a<0.001
The different letters indicate significant differences between treatments at p < 0.05. Contrast test (ANOVA) was conducted between N treatments and the controls. Values are expressed as (mean ± standard deviation; n = 4). CT: control treatments; LN: low N; HN: high N; SOC: soil organic carbon; TN: total N; NH4+-N: ammonium N; NO3-N: nitrate N; DOC: dissolved organic carbon; DON: dissolved organic N.
Table 2. The soil respiration sensitivities to soil temperature for the period of 2013–2015.
TreatmentsQ10
CT2.07(0.11)
LN2.09(0.36)
HN2.00(0.12)

