
Study of Unwanted Emissions in the CENELEC-A Band Generated by Distributed Energy Resources and Their Influence over Narrow Band Power Line Communications

 , ,
, ,  , and
, and
Abstract
:1. Introduction
2. Disturbances Introduced by Distributed Energy Resources in Power Line Communications
3. PoweRline Intelligent Metering Evolution
3.1. Physical Layer
3.2. Medium Access Control Layer
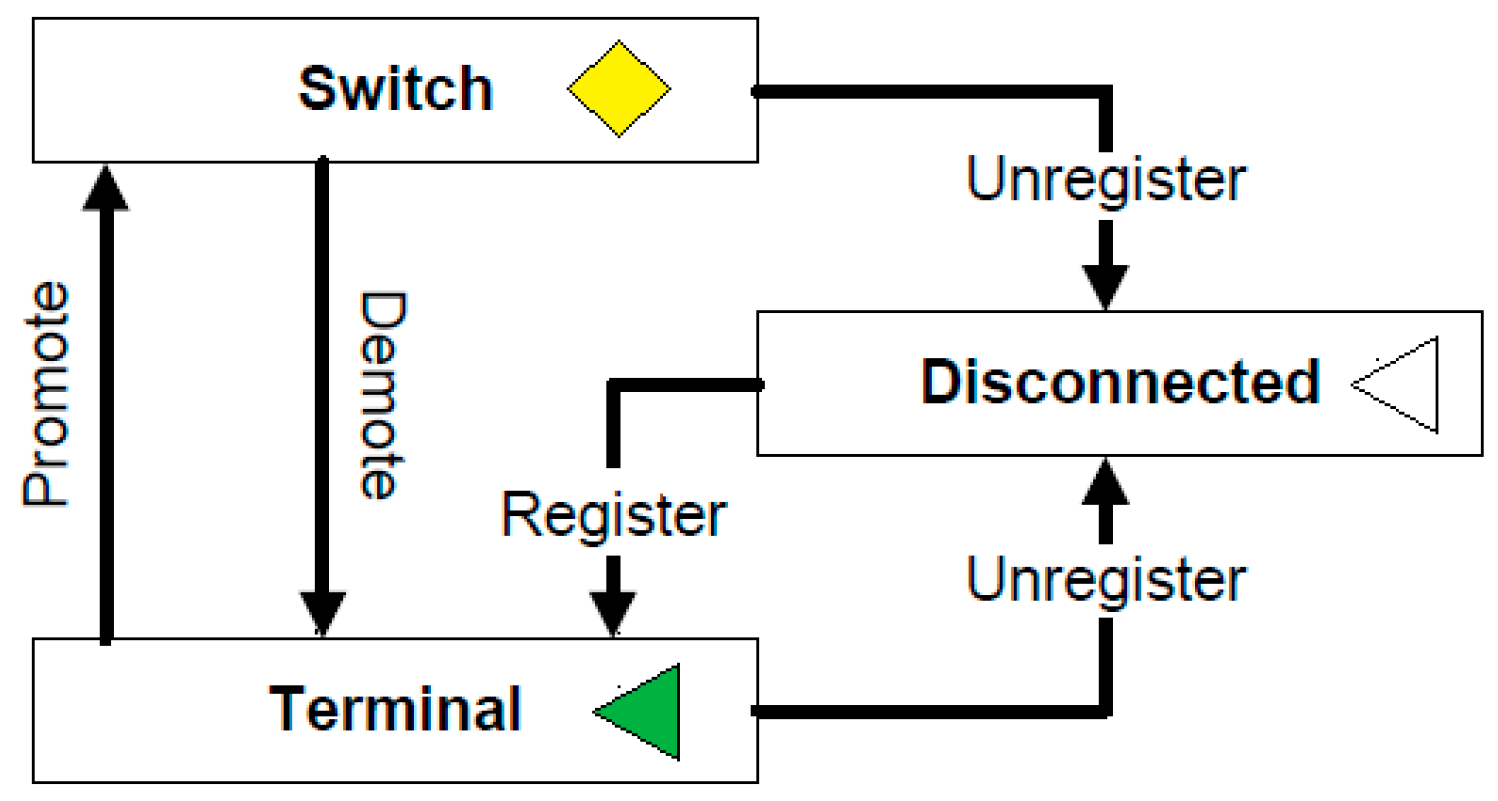
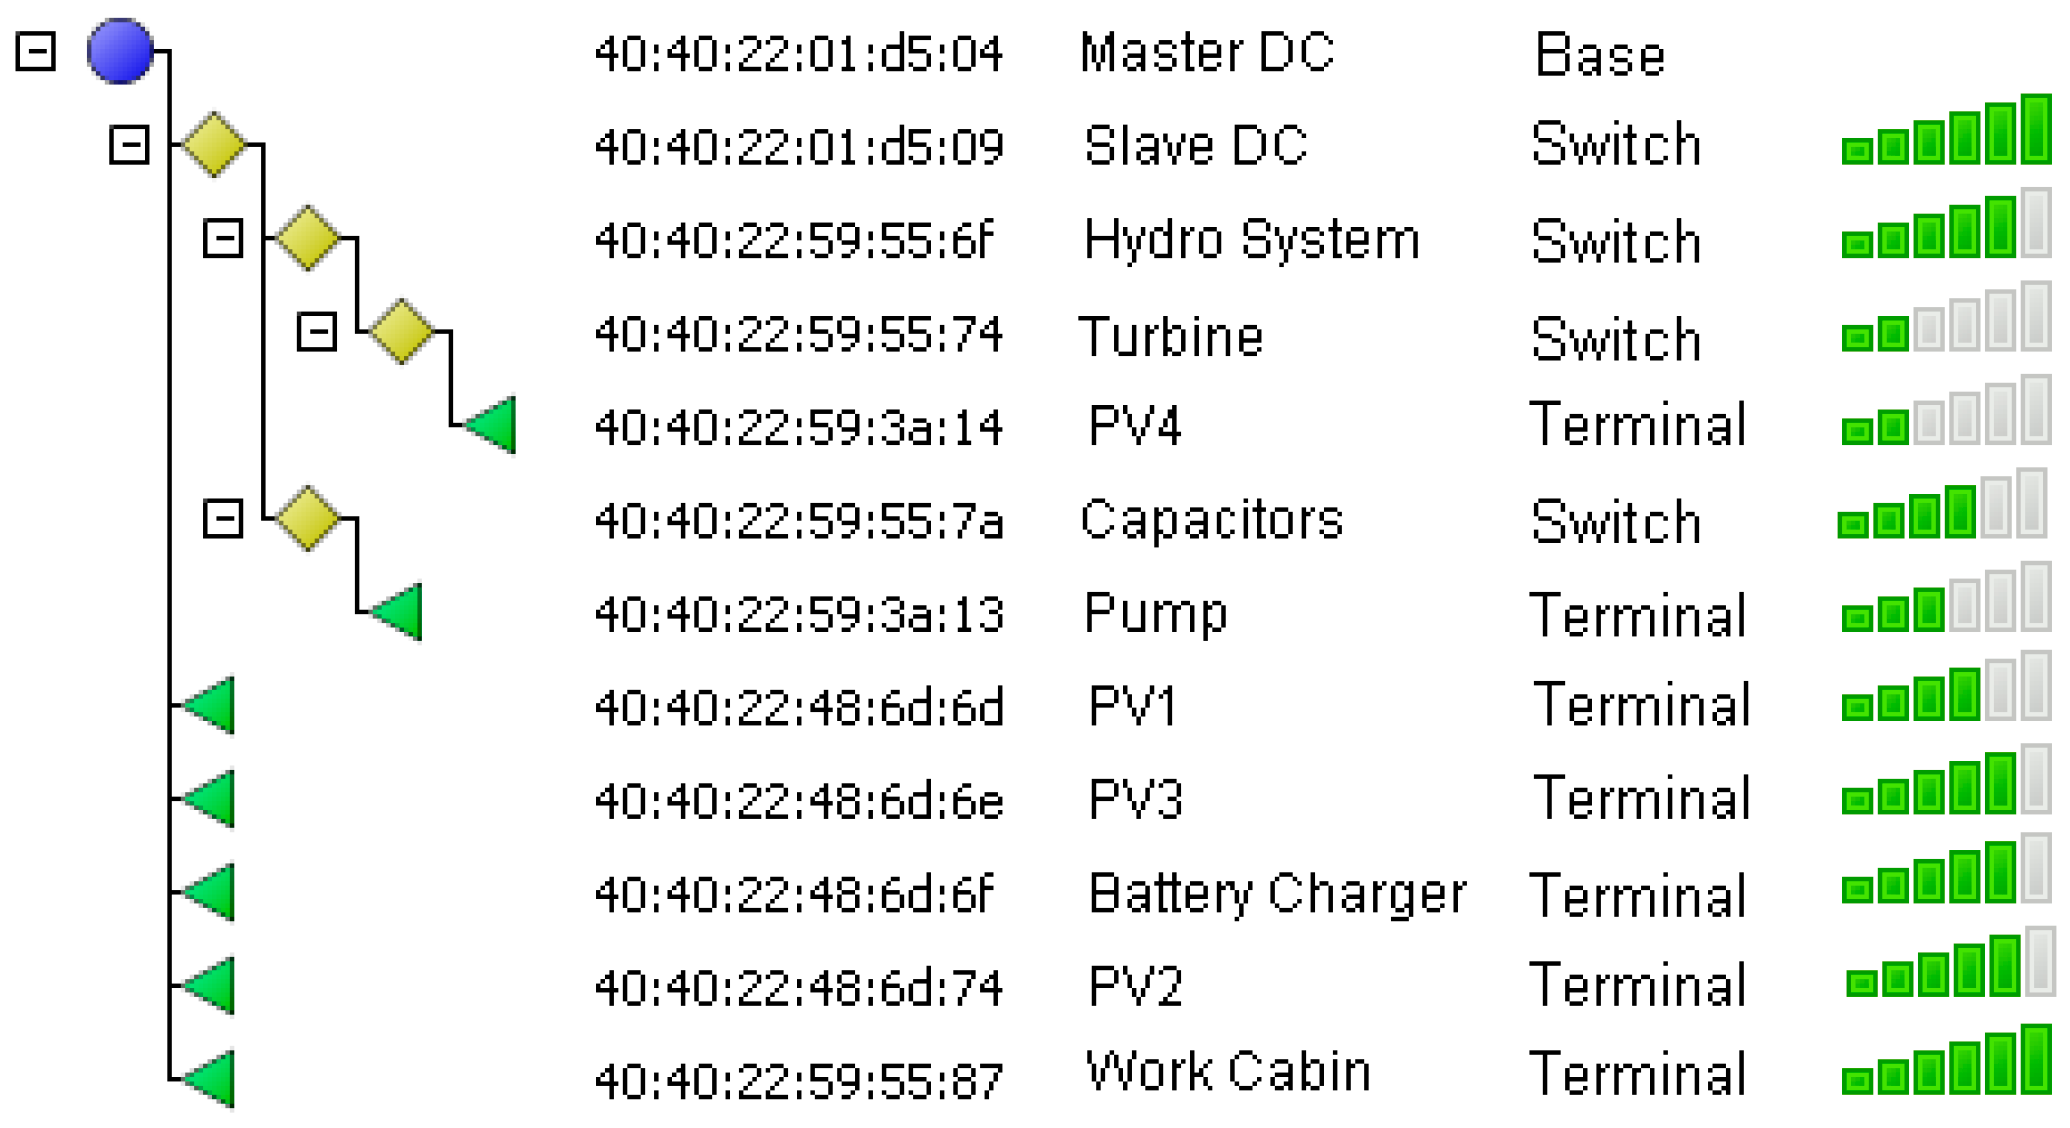
- Disconnected: it is the initial state, in which SNs are not able to communicate or switch data.
- Terminal: where SNs are able to establish connections and transmit data, but not to switch the data of other nodes.
- Switch: in this state SNs are able to forward data to and from other nodes within the subnetwork. Additionally, they keep all terminal state functions.
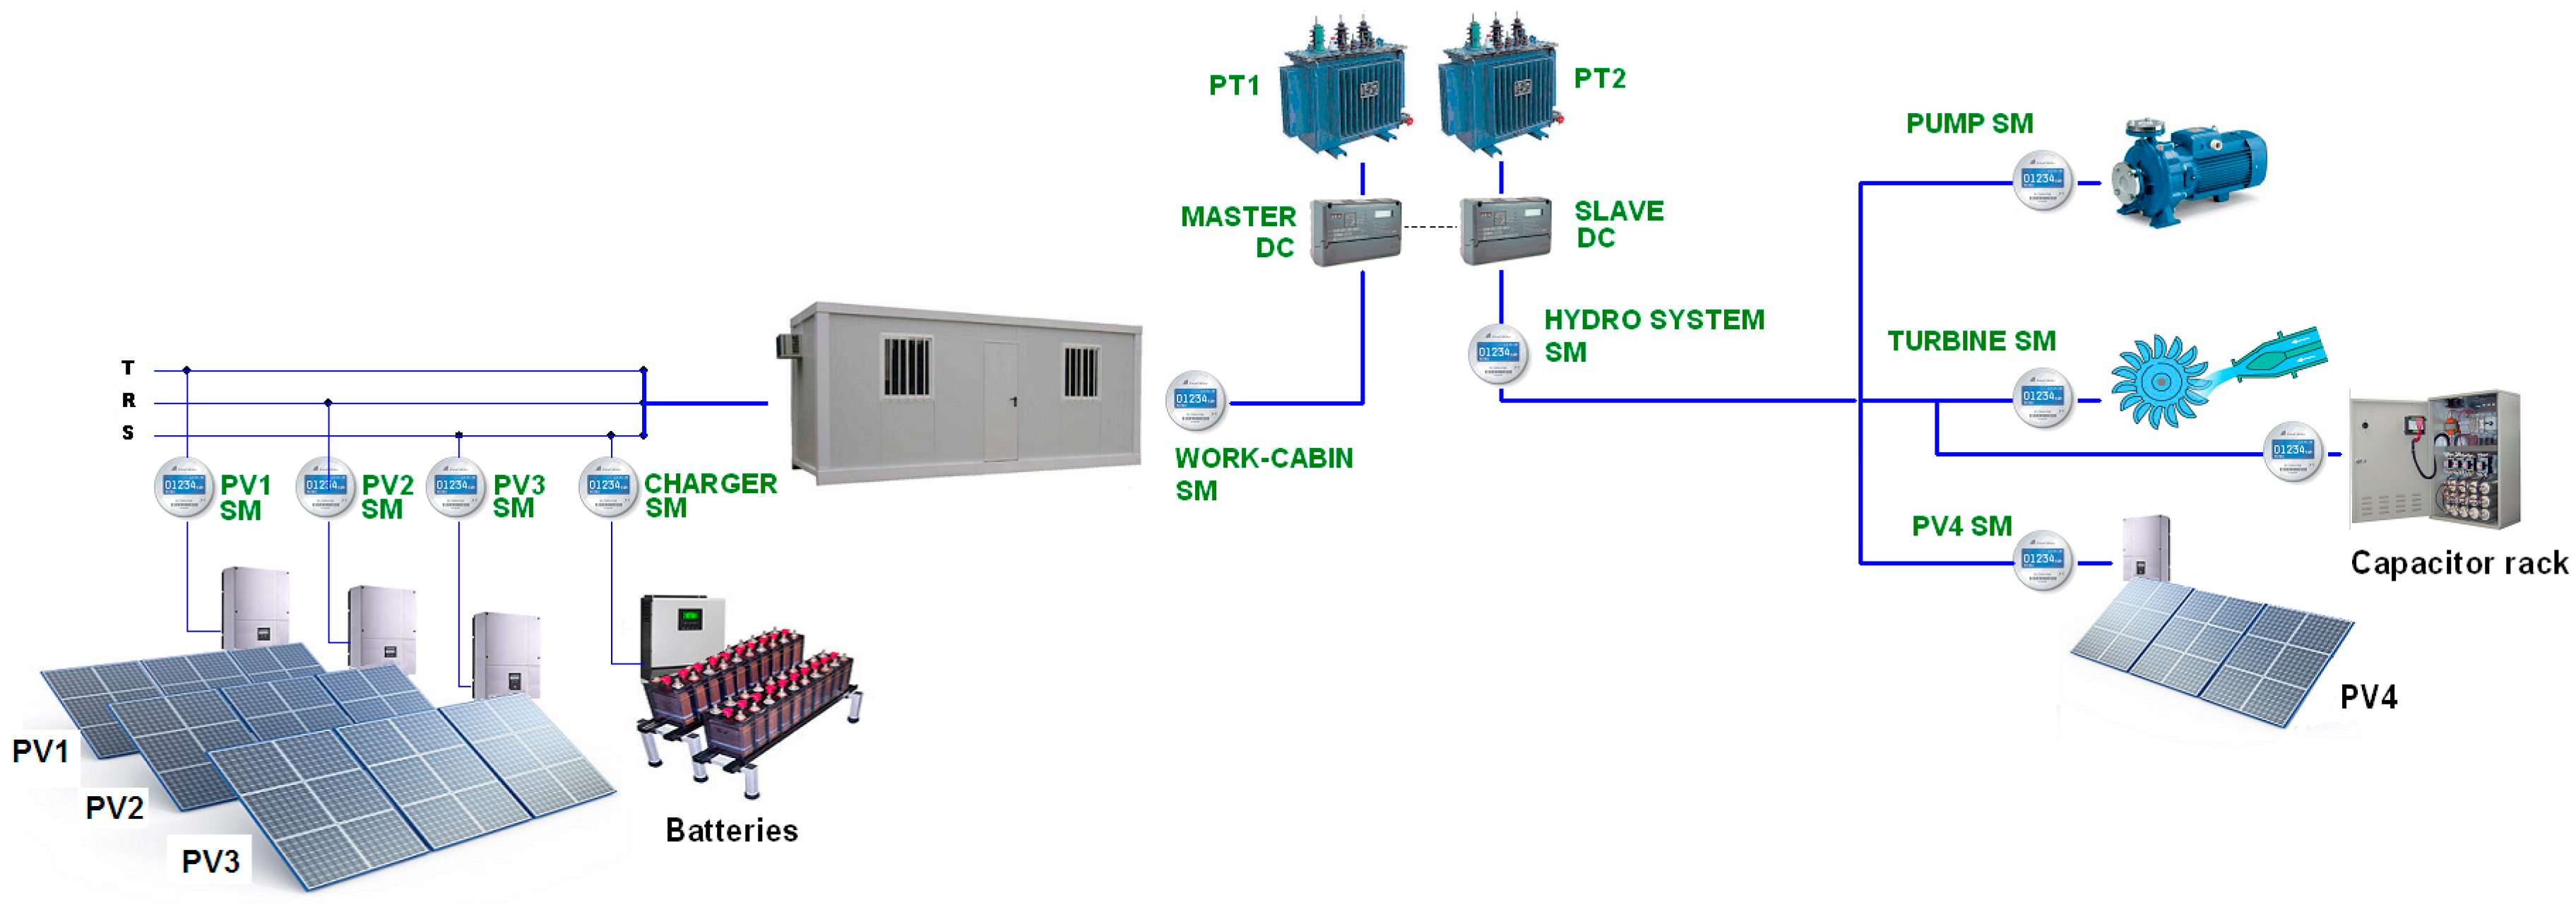
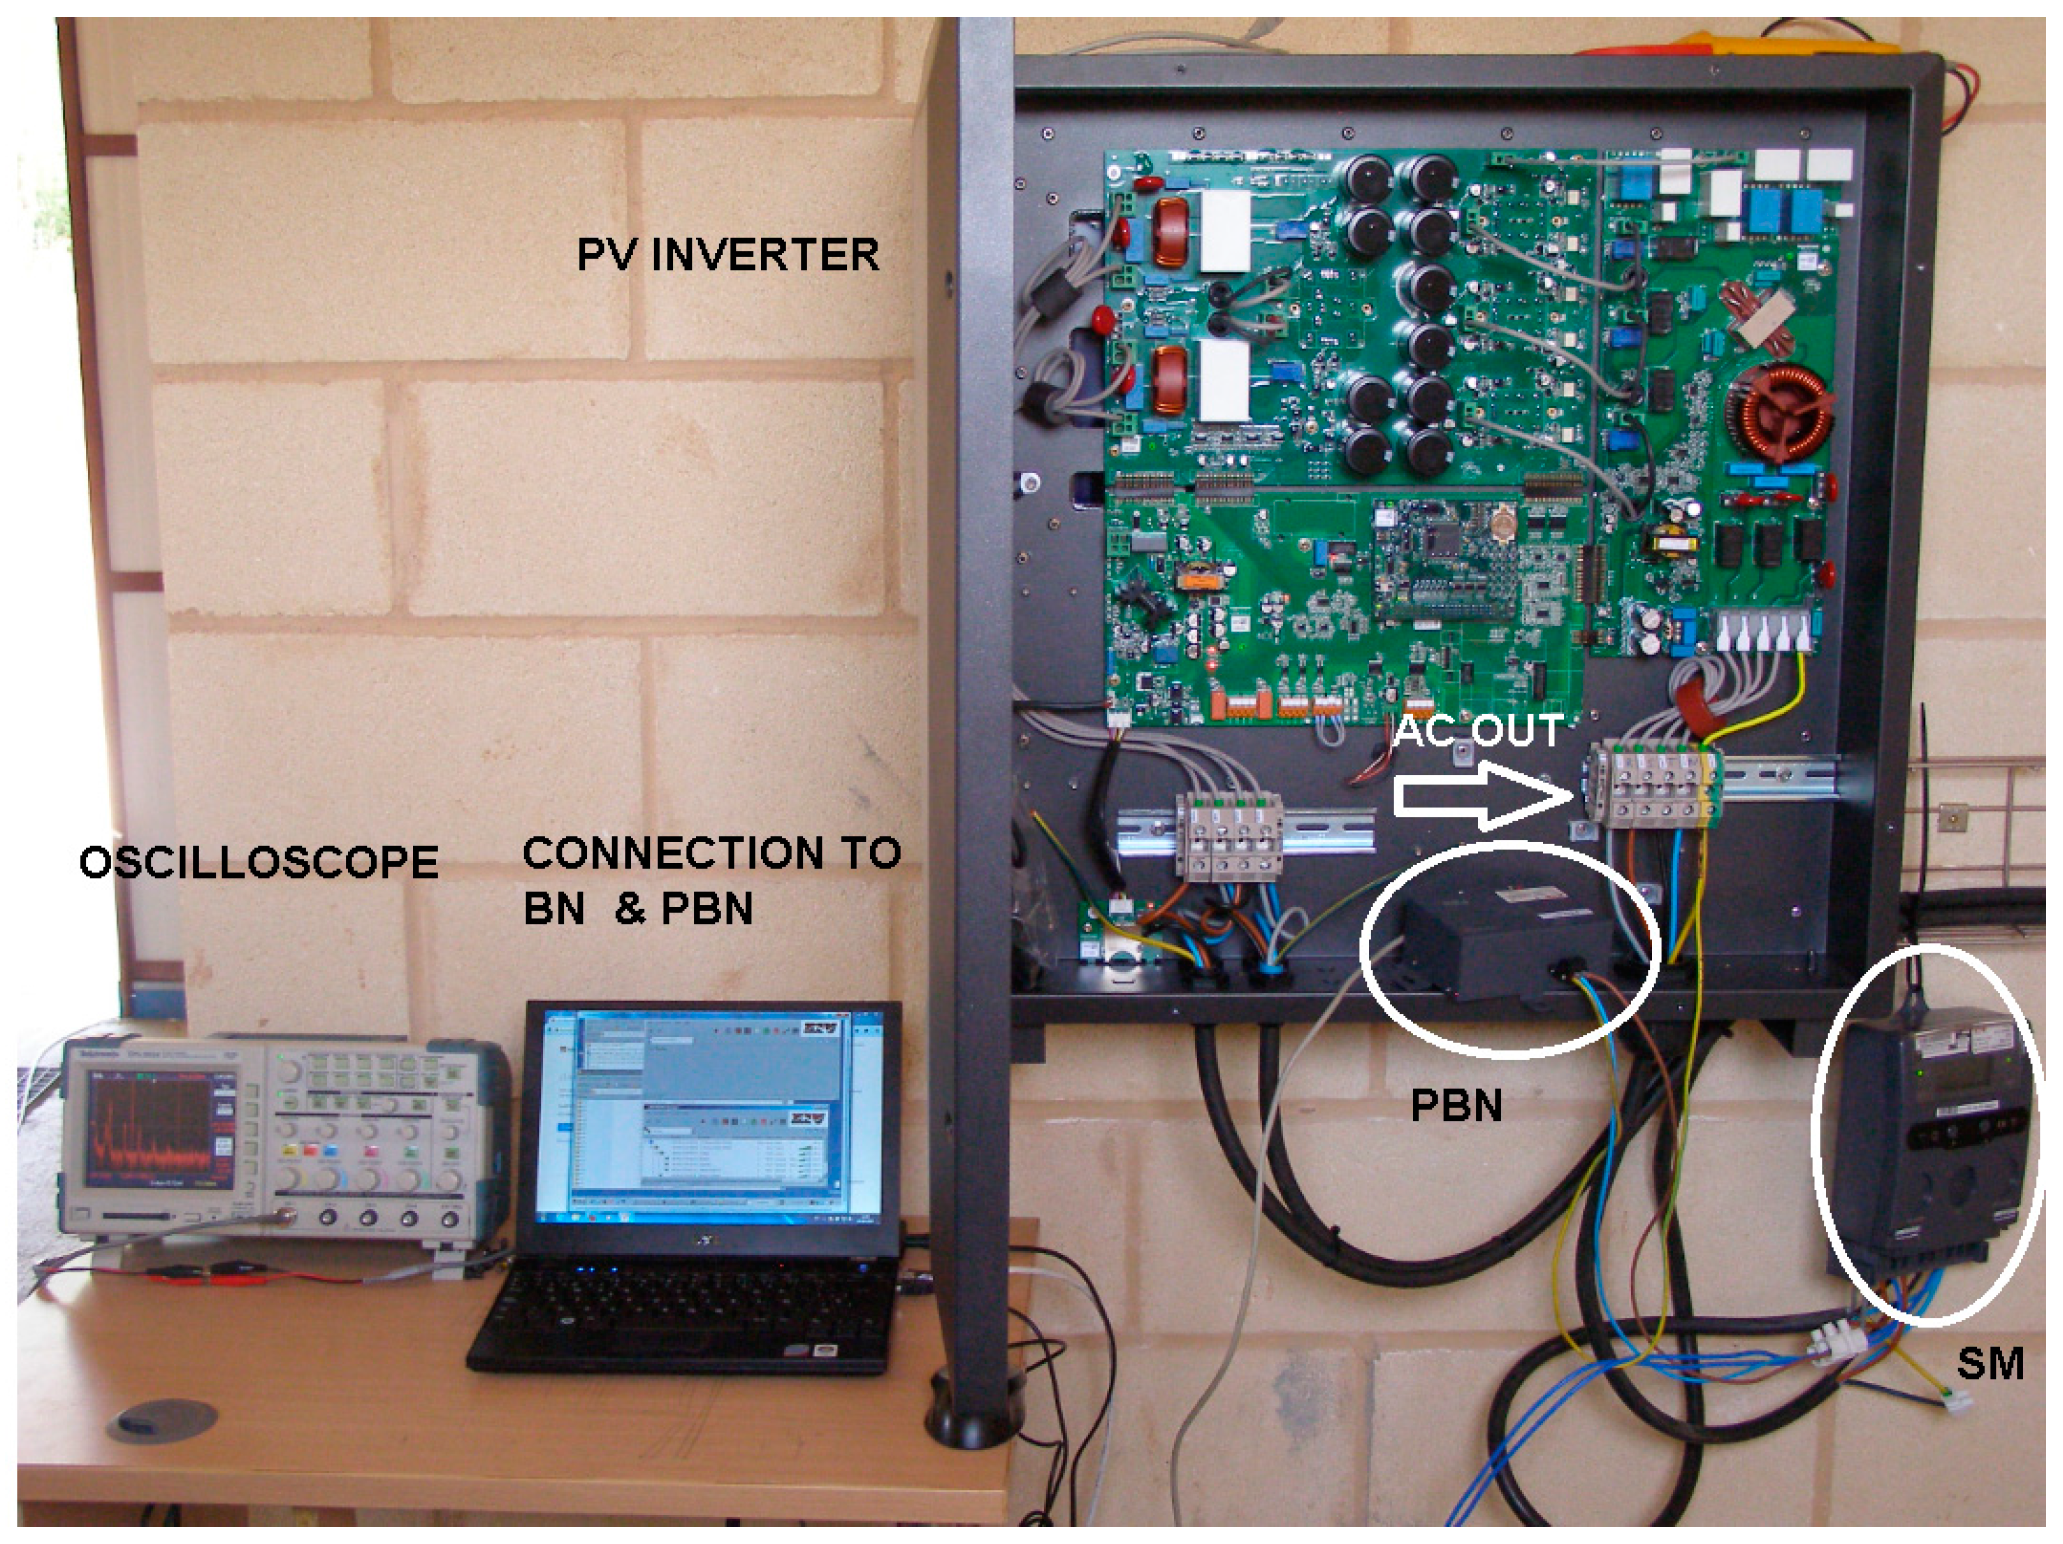
4. Measurement Setup and Methodology
- The spectral analysis is addressed by averaging fifteen measurements performed per each particular scenario. Only measurements not containing PRIME frames were considered in the averaging process.
- The potential impact on the subnetwork topology is evaluated by analyzing the evolution of the different possible roles of the nodes and its relation with the features of each scenario. Additionally, the variations in coverage level due to disturbances are addressed.
- TABT-2 capacitive coupler, which allows high-frequency measurements in LV networks and filters out frequencies below 10 kHz. This cut off frequency allows the most common switching frequencies of inverters.
- Tektronix TPS-2024 oscilloscope, which provides the spectrum of the transmission channel. The sampling rate is fixed at 1 MS/s, with 8 bits/sample. A Hanning window is applied and a 2048 FFT is internally used to assess the spectrum of the recorded signals.
- Communication sniffer, called PRIME Base Node (PBN), which provides information about MAC packets traffic.
- BN of the PRIME subnetwork, which provides information about network topology evolution and MAC packets traffic, among others. Both the sniffer and the BN are accessed through specific software via Ethernet.
5. Spectral Disturbances Introduced by Distributed Energy Resources in Narrow-Band Power Line Communications
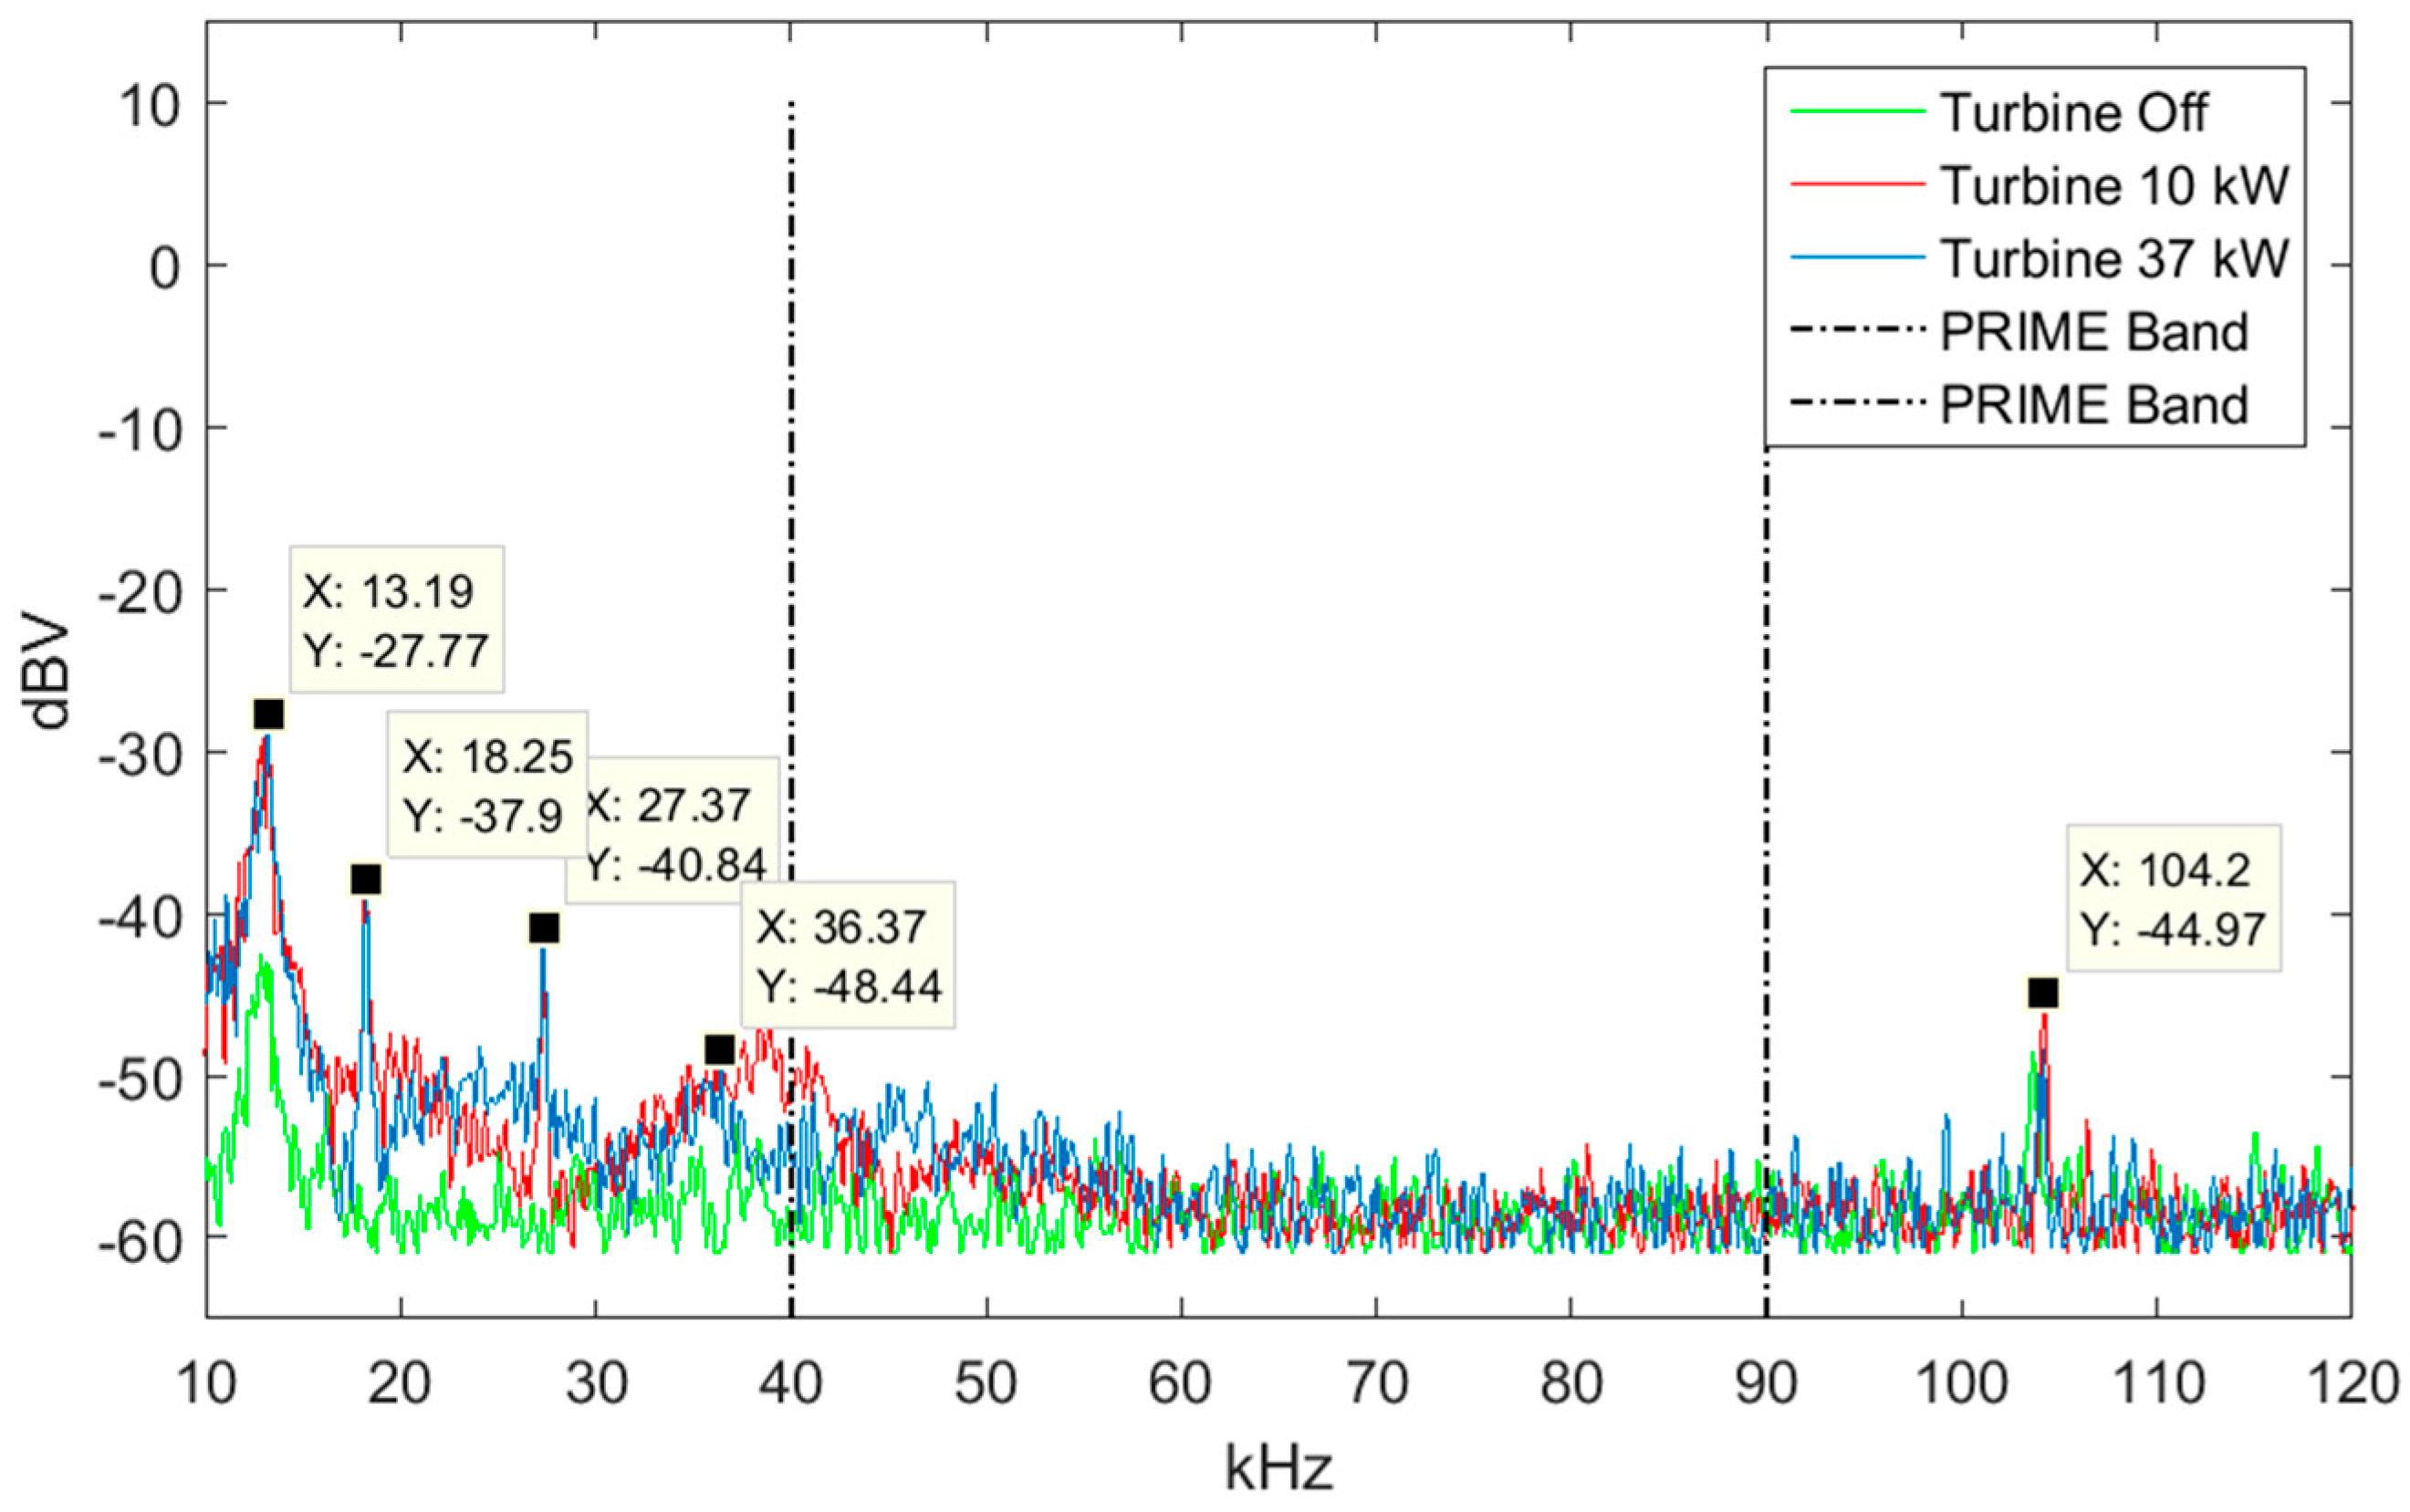
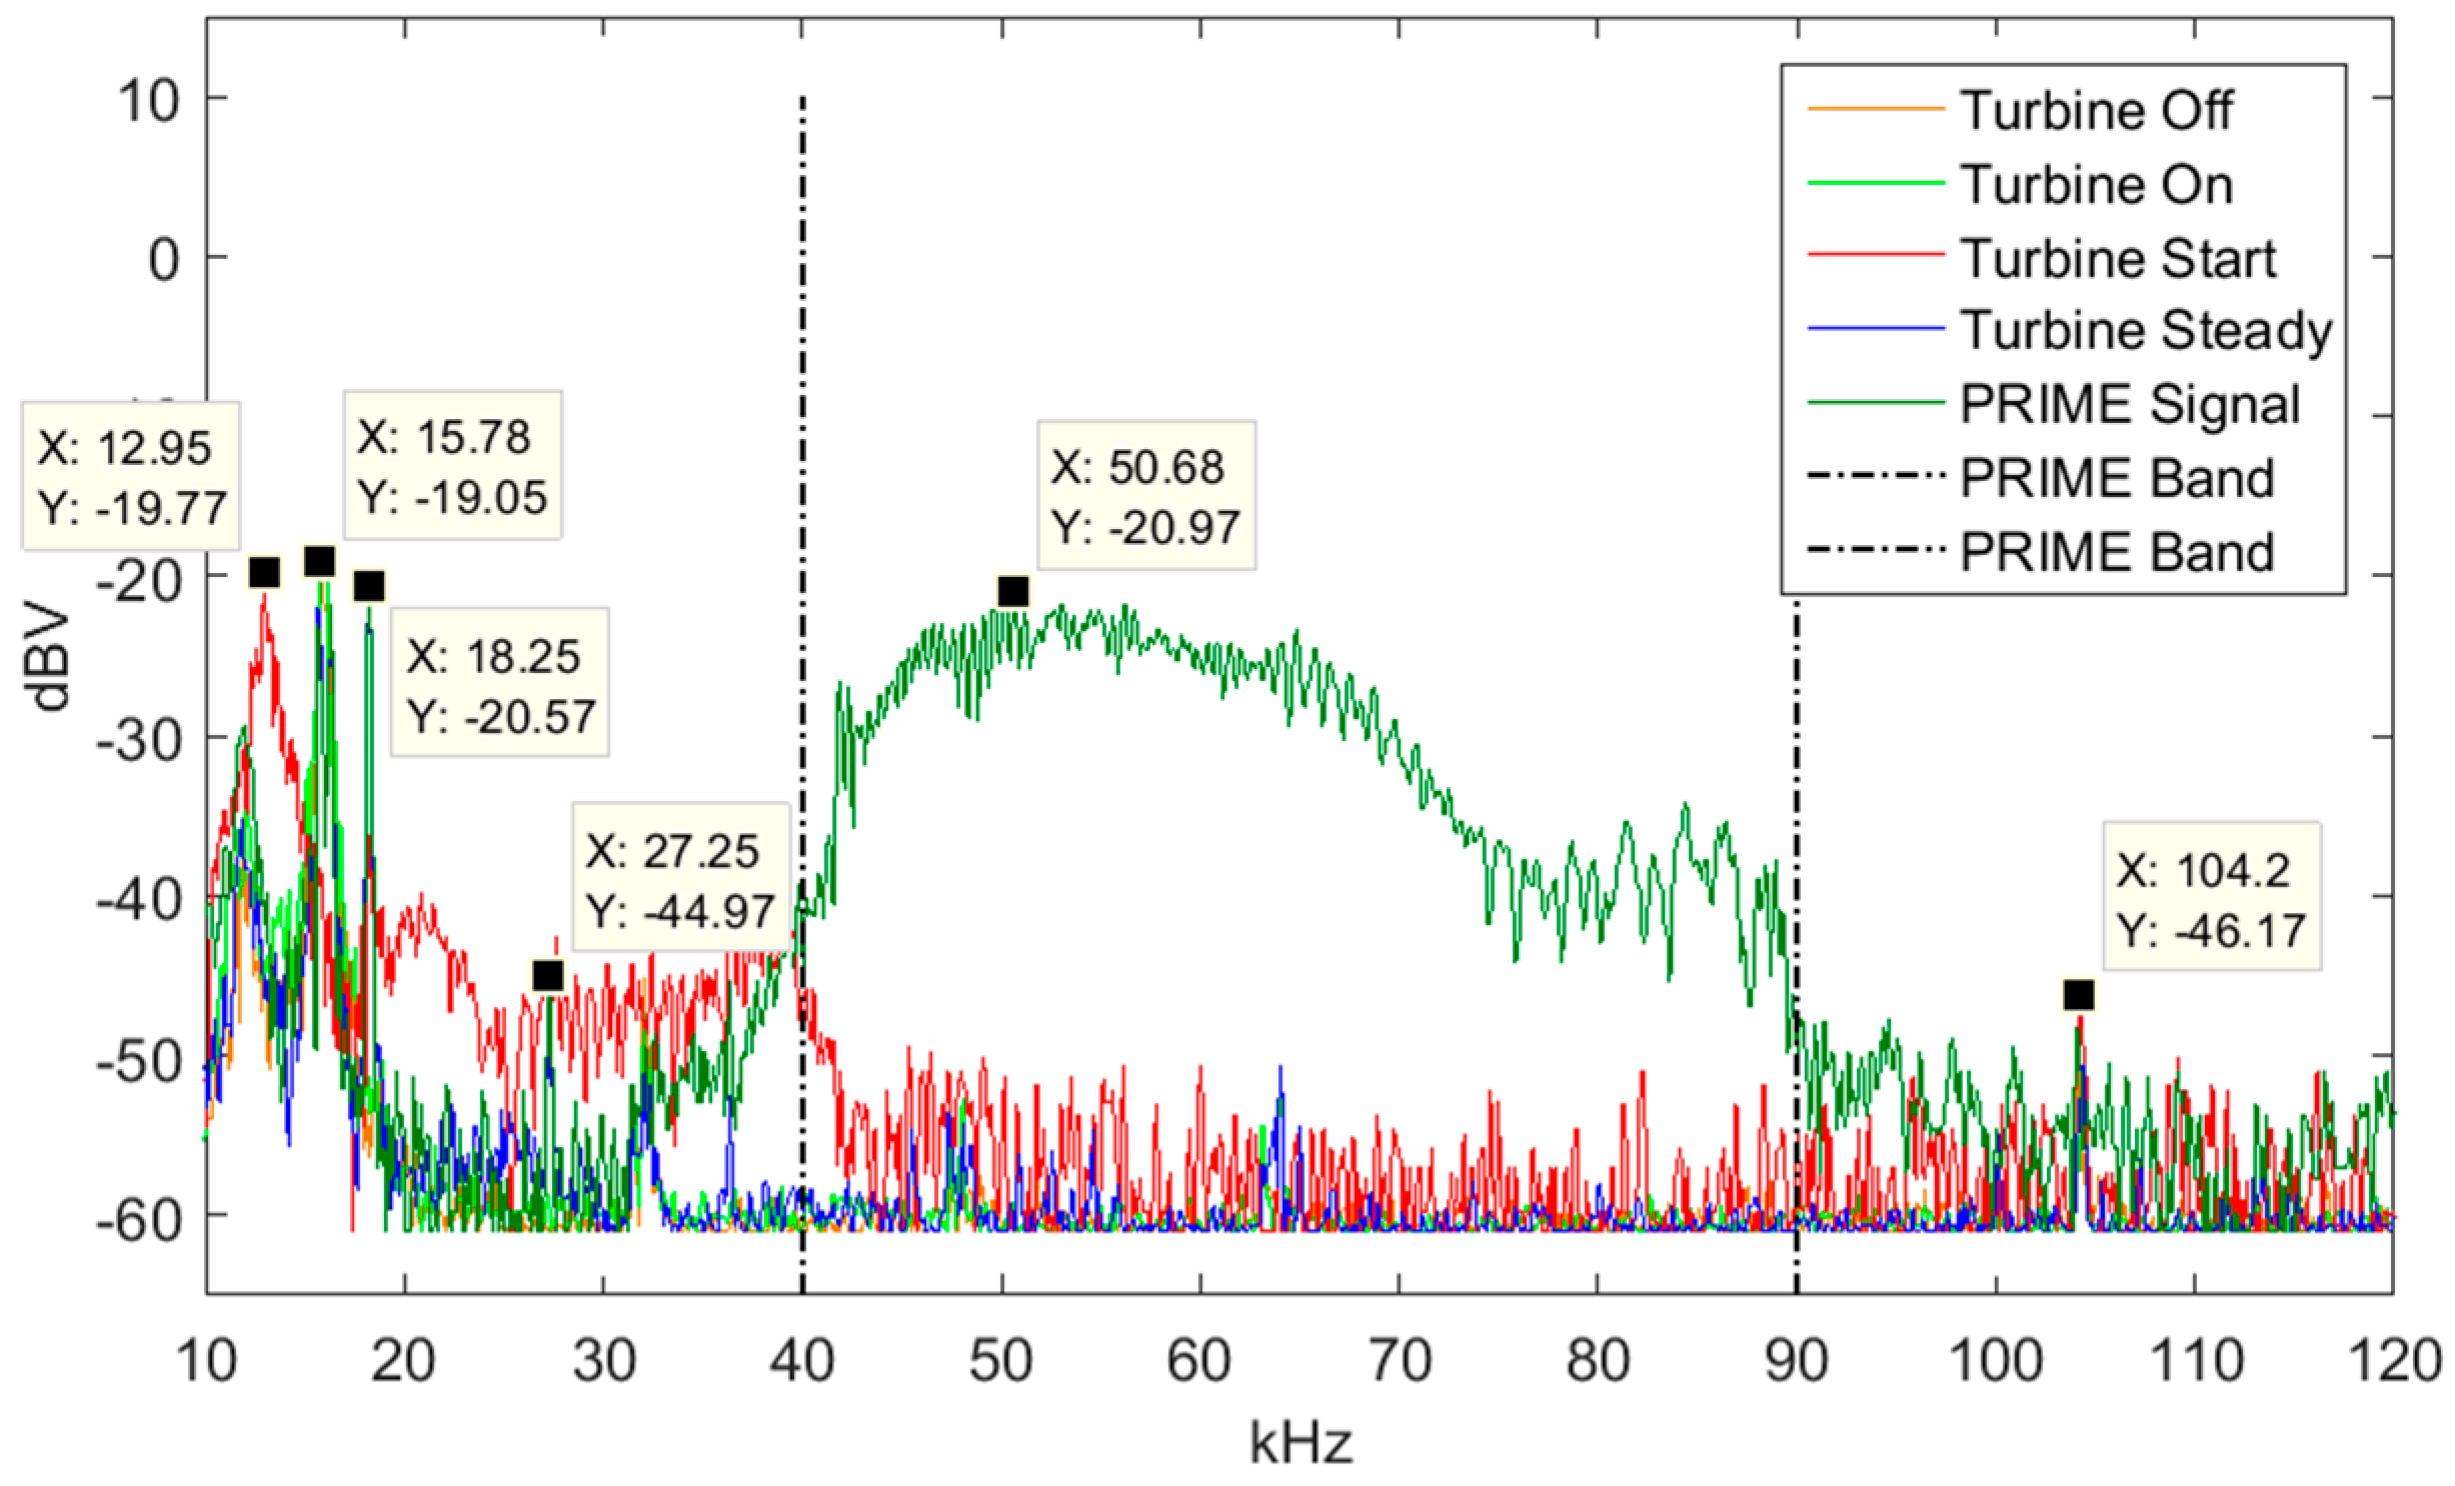
5.1. Hydropower Turbine
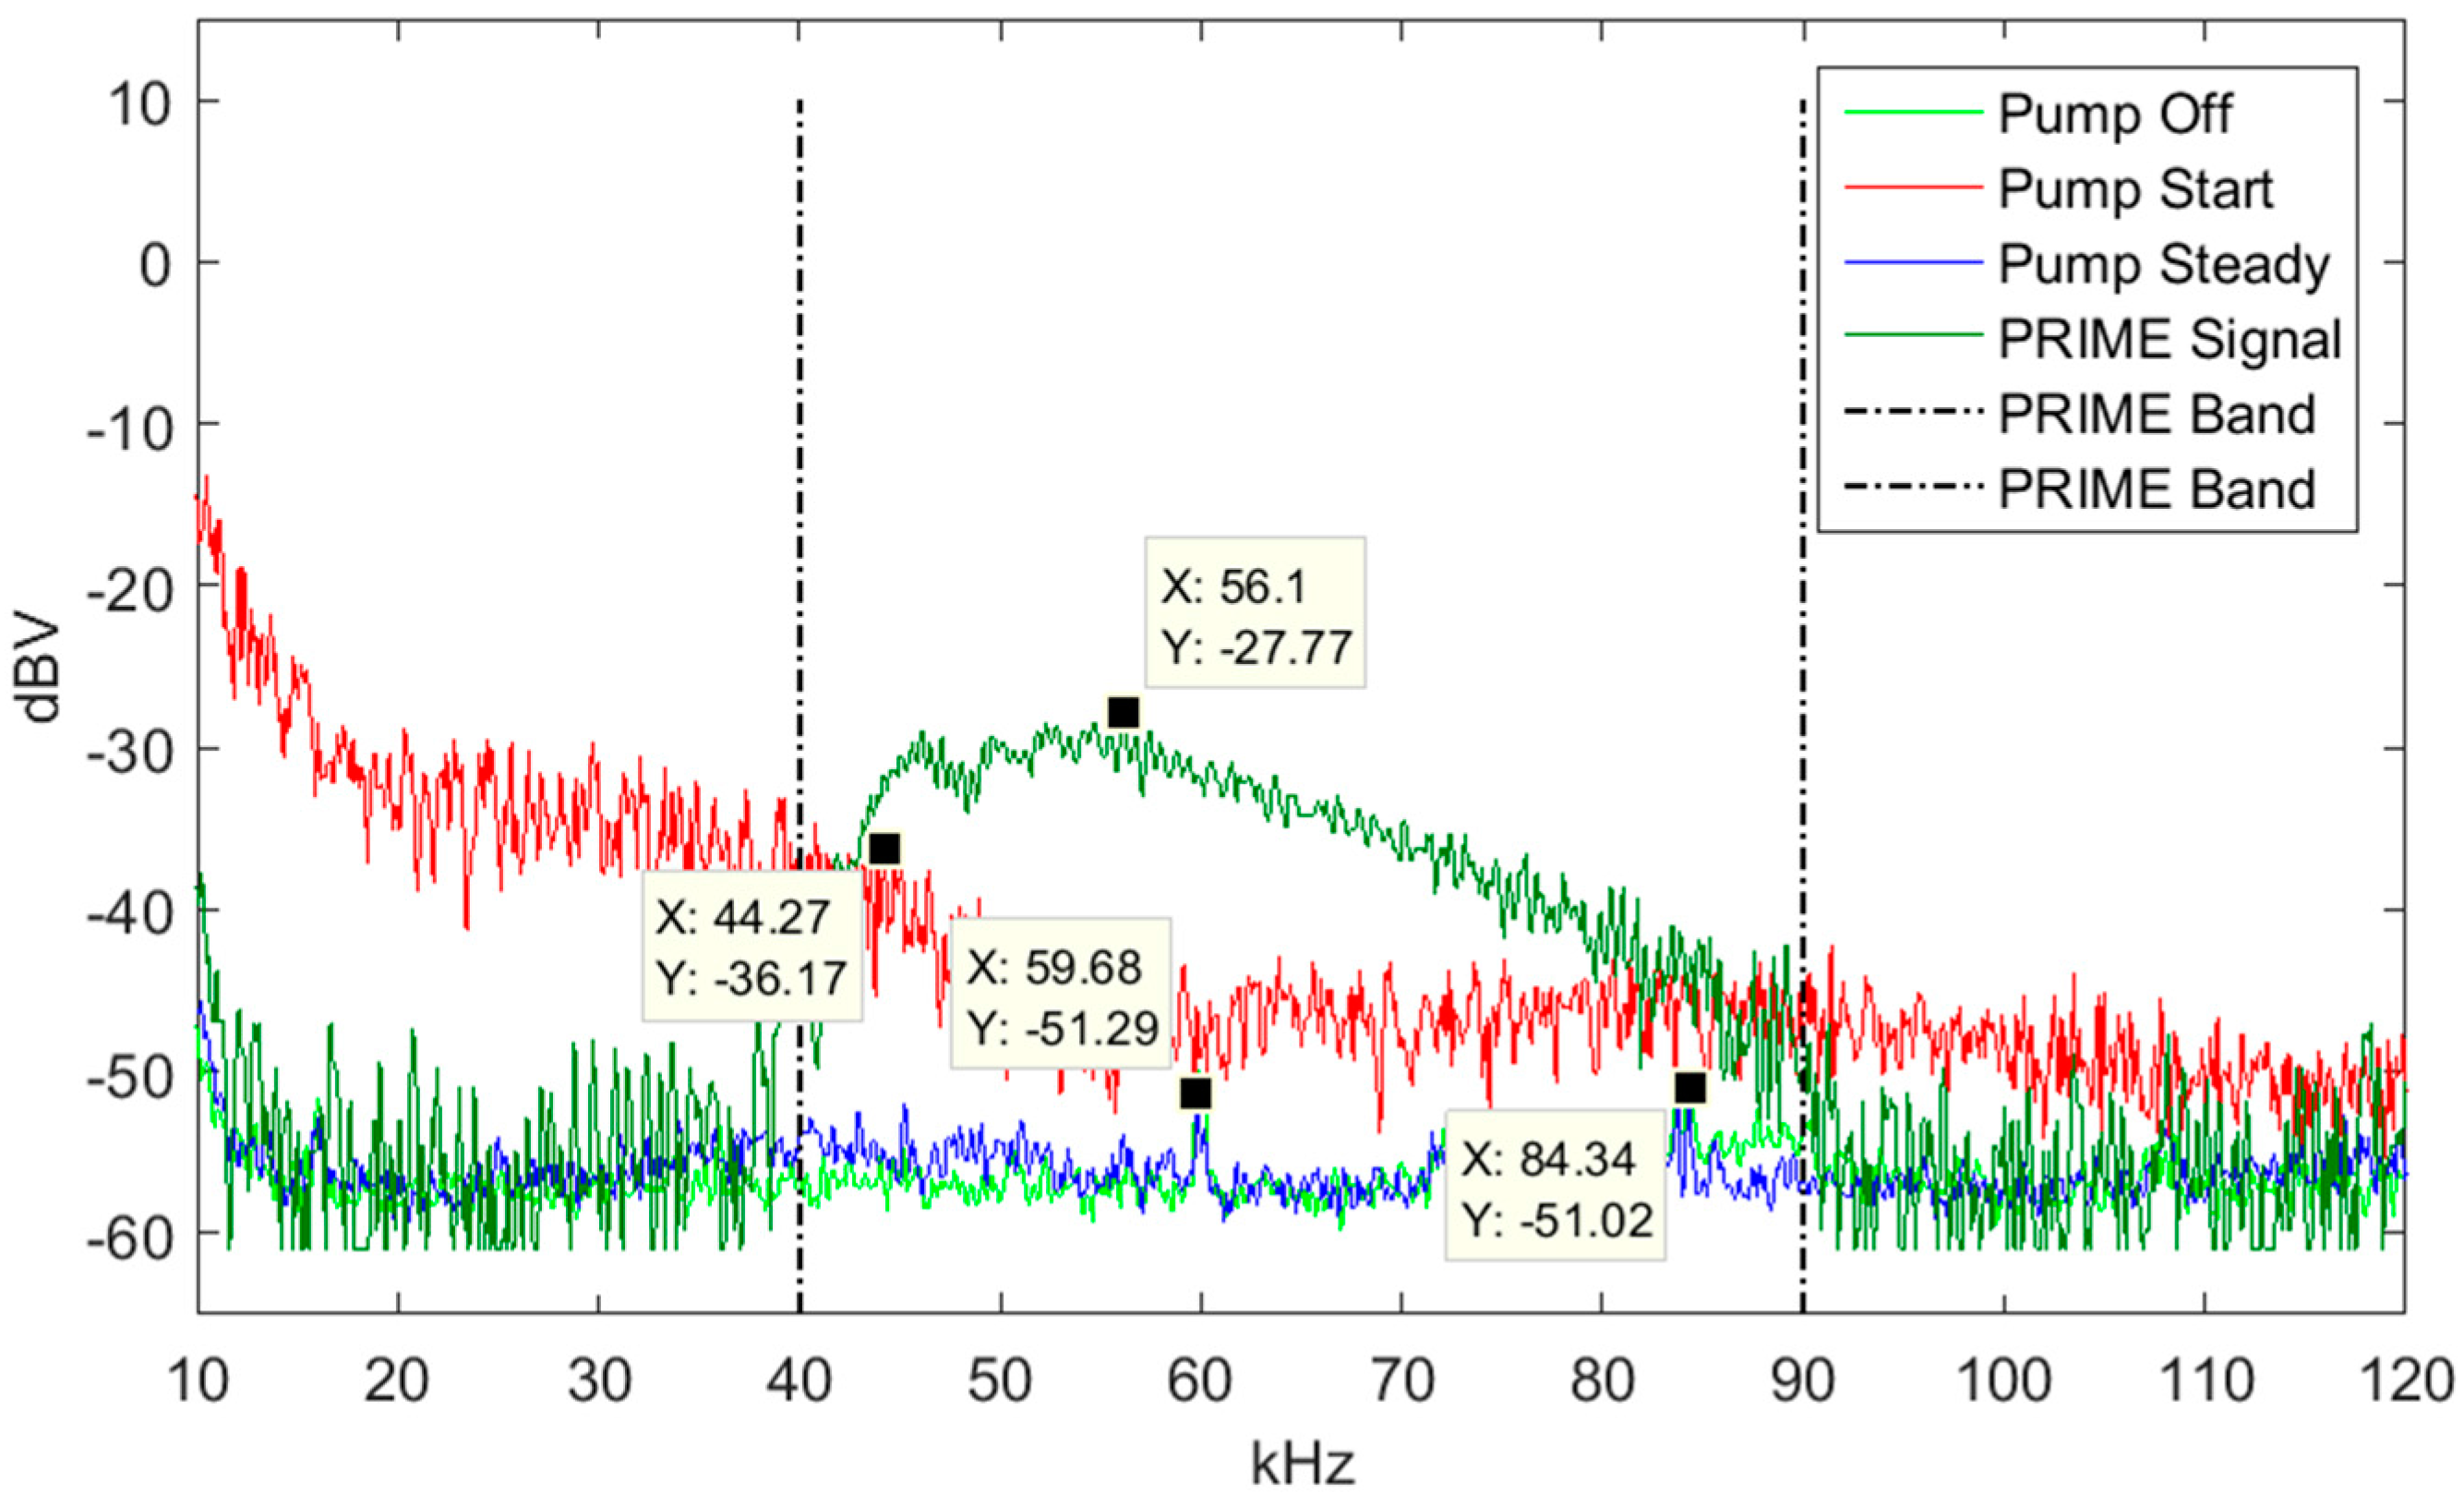
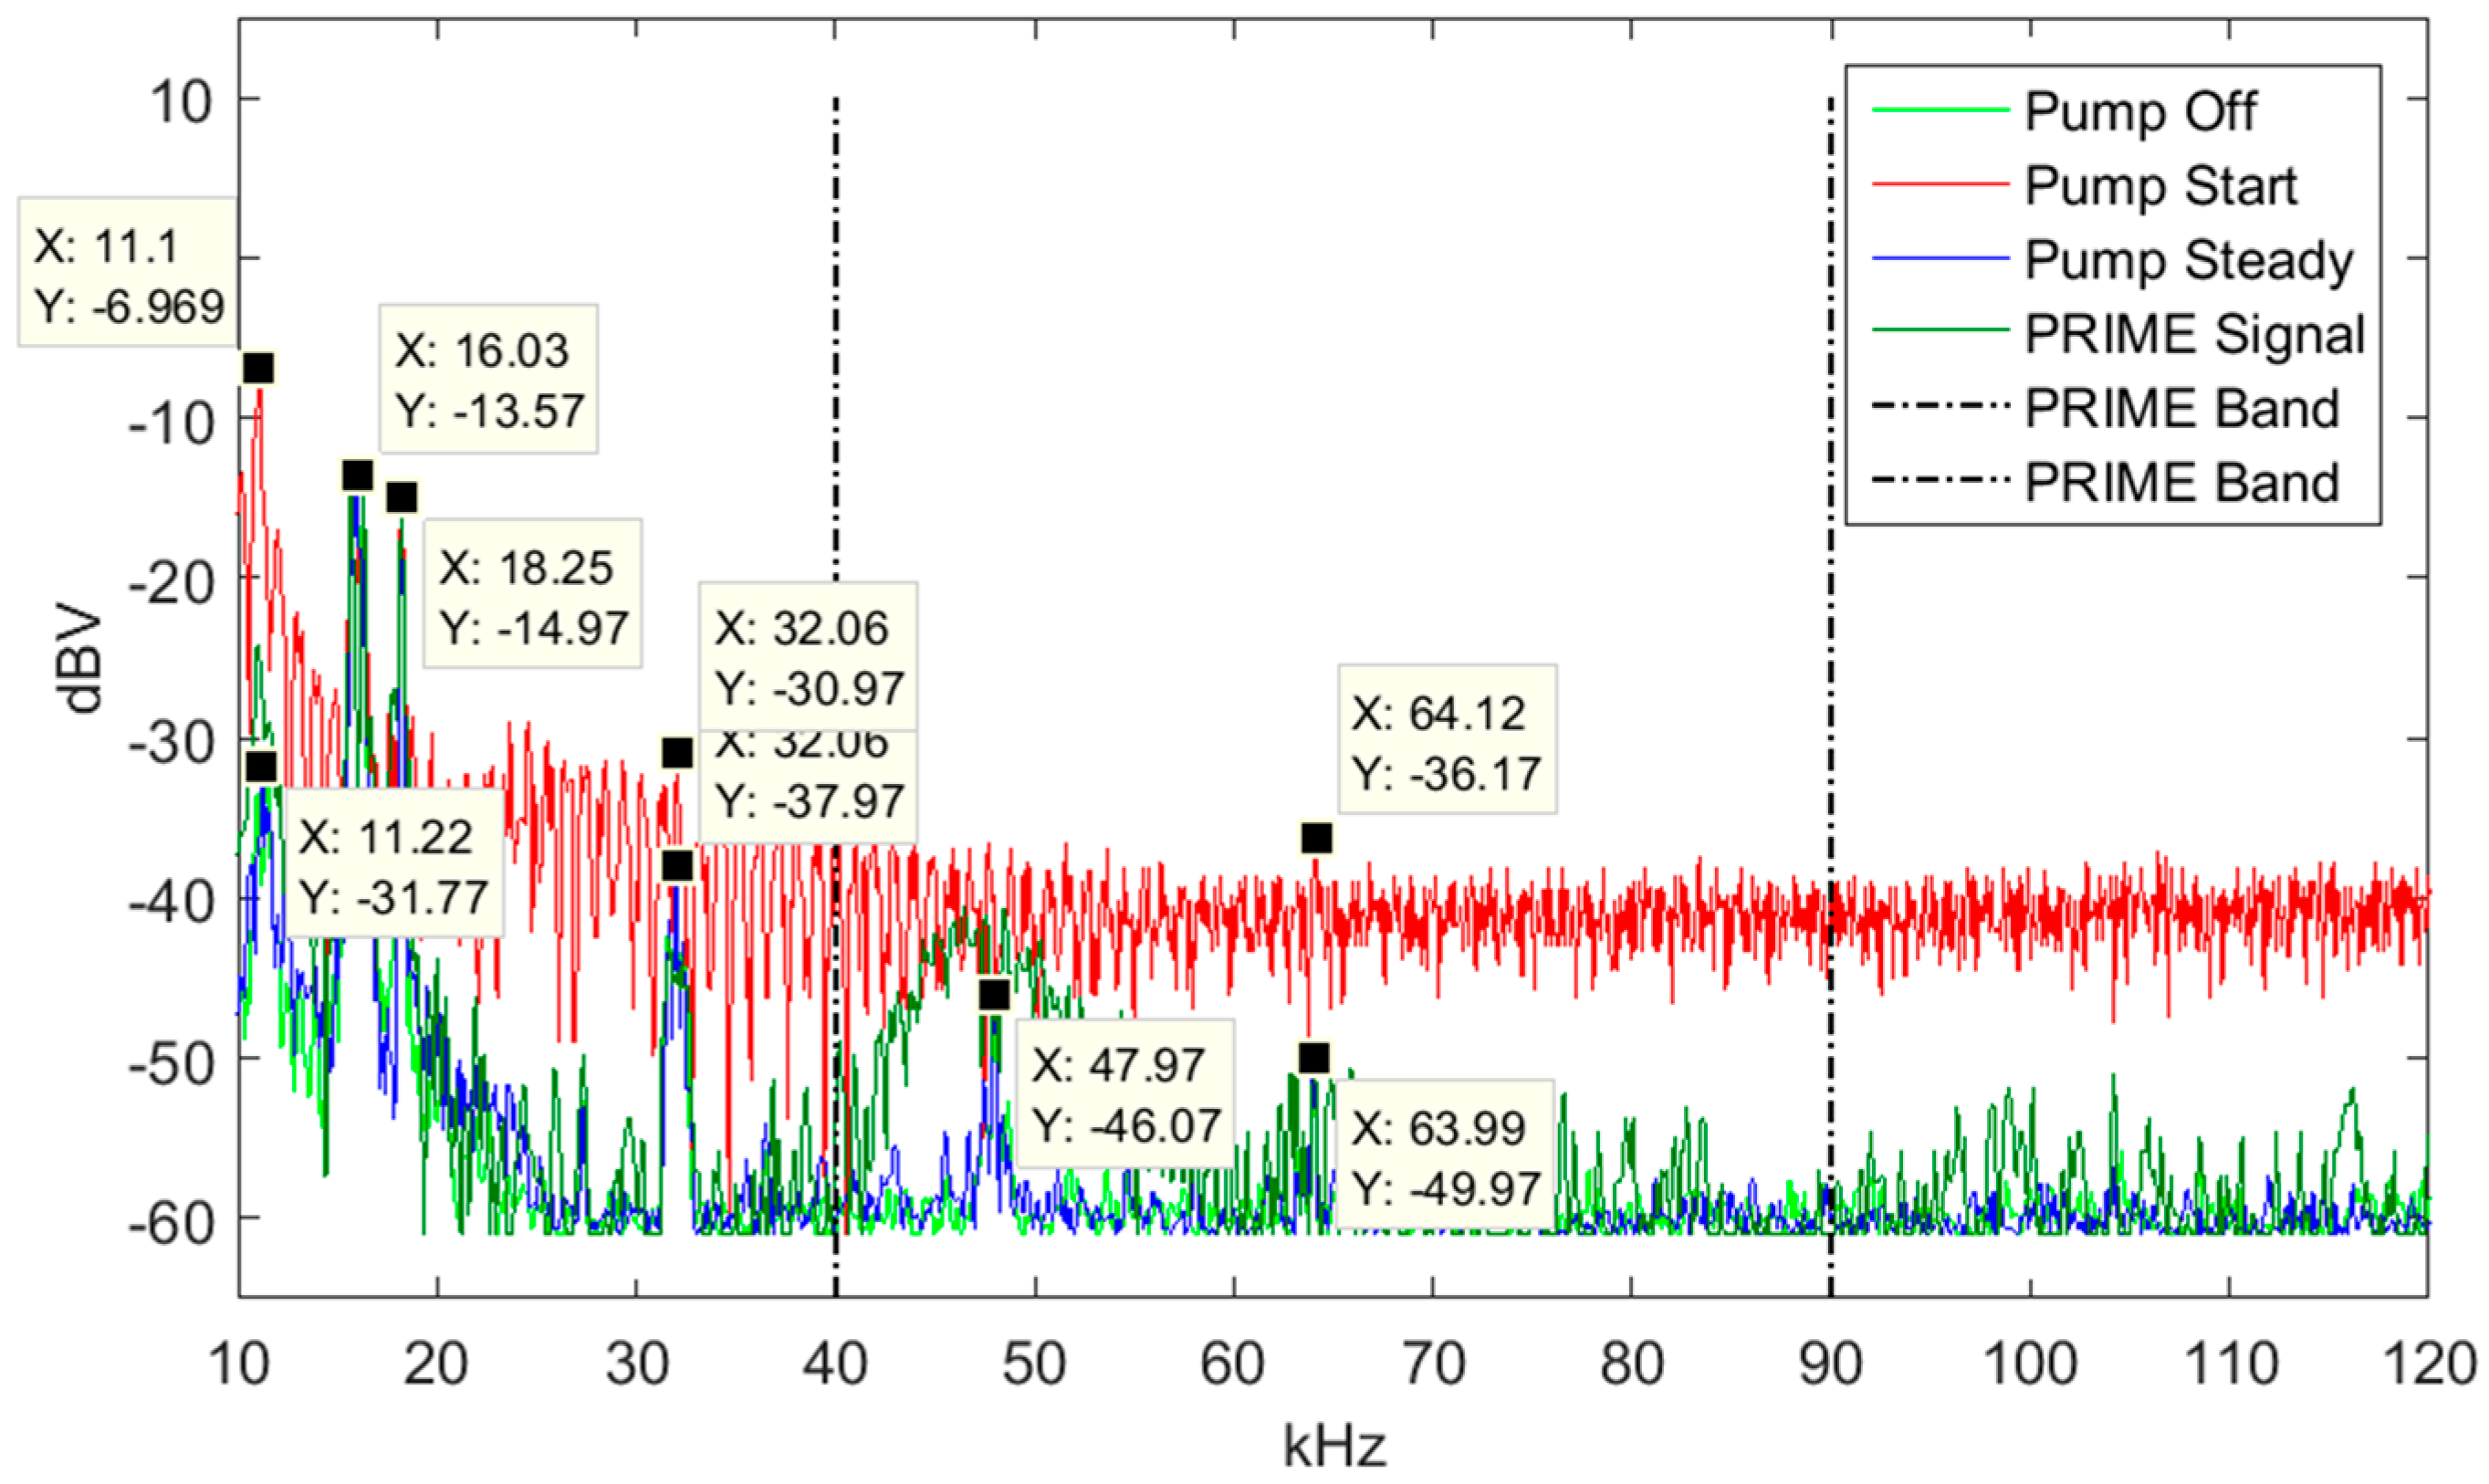
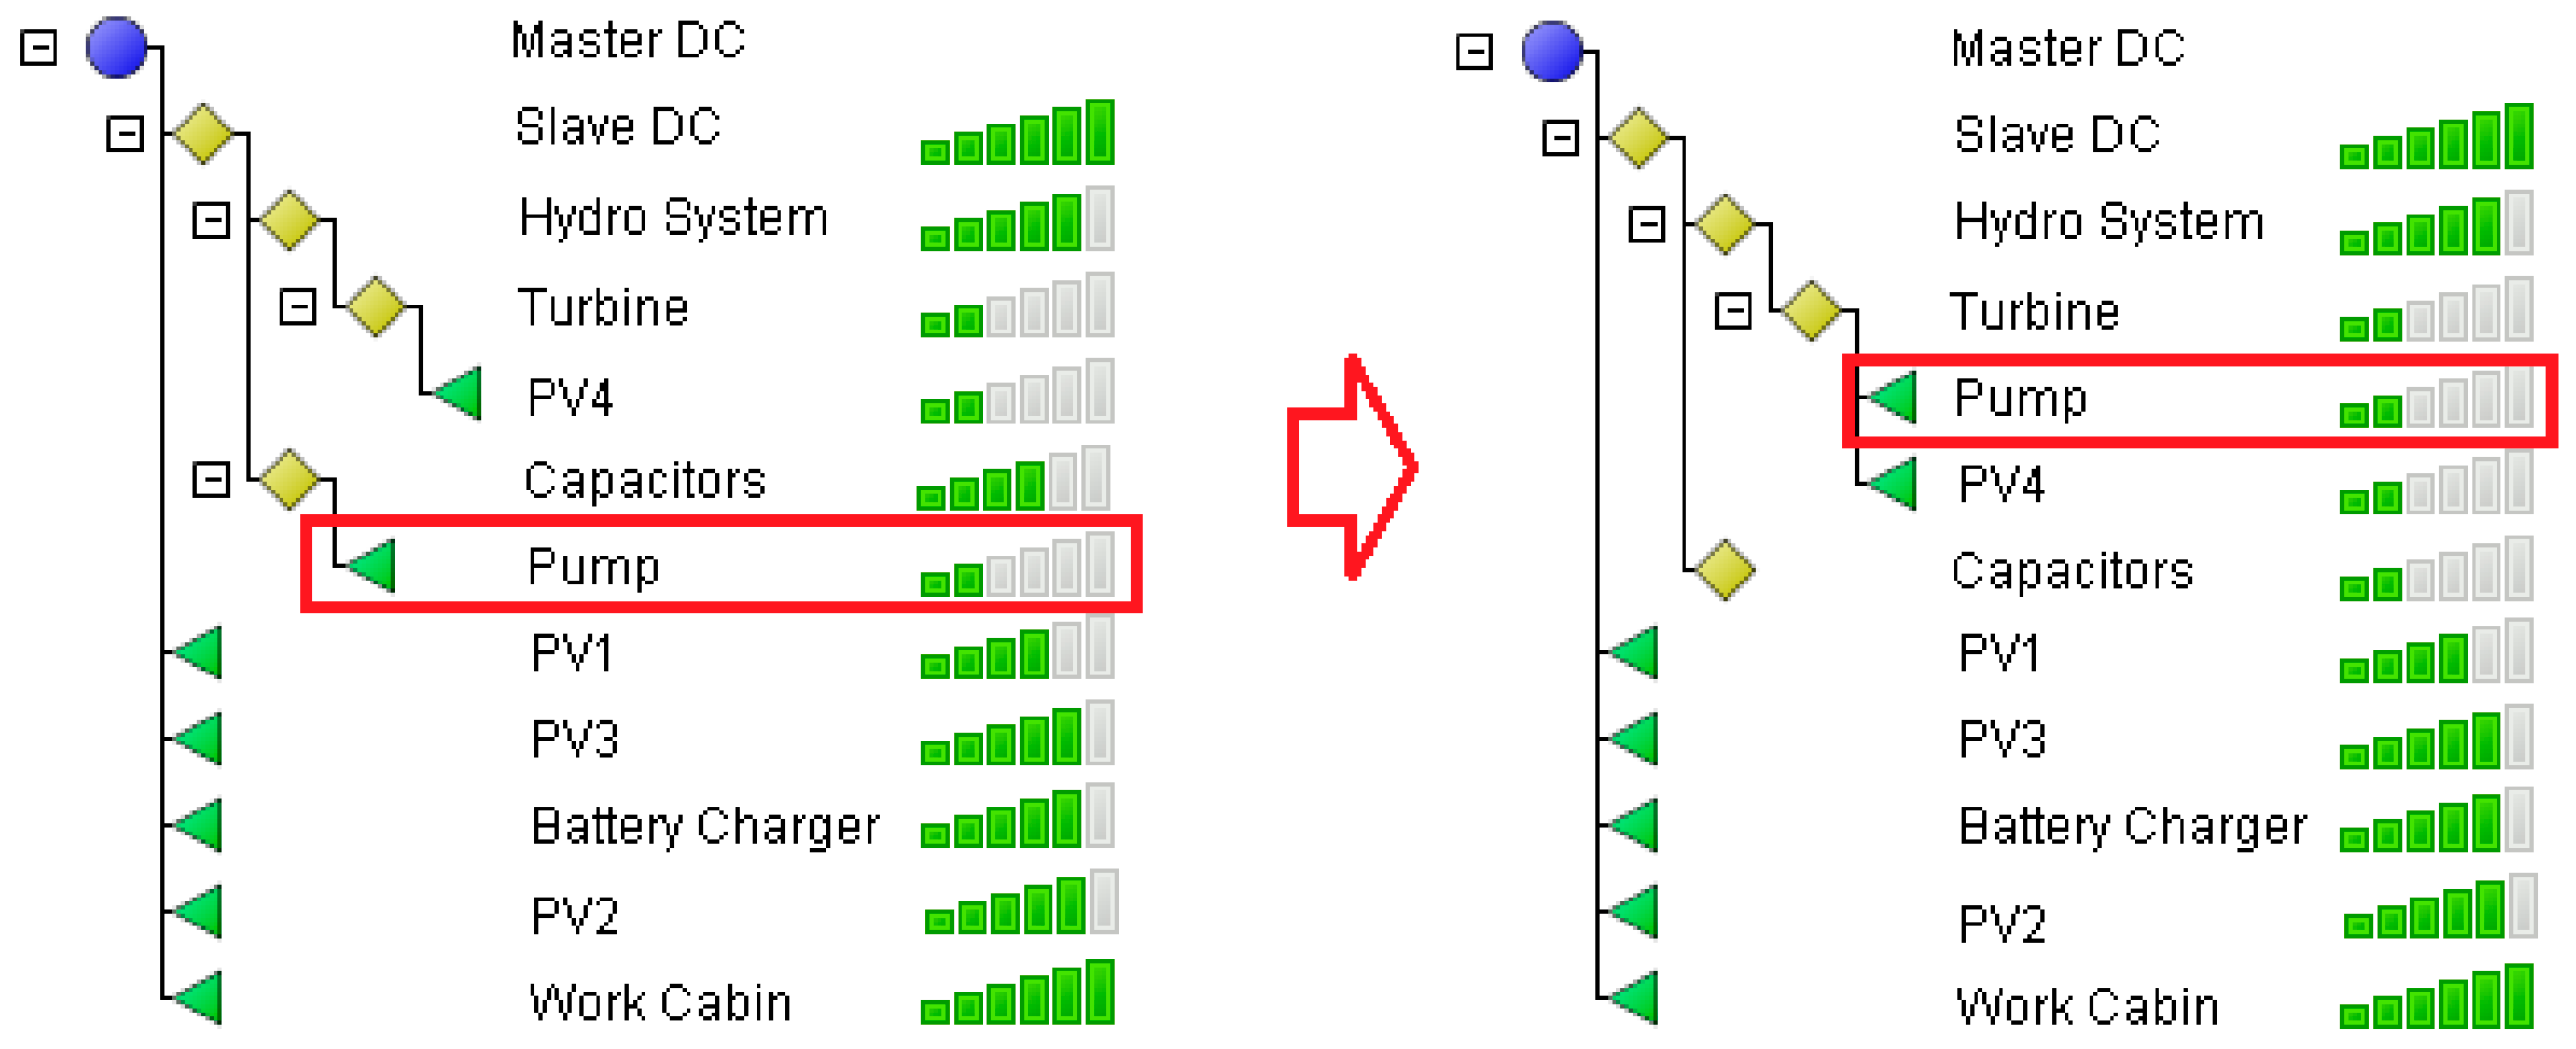
5.2. Hydropower Pump
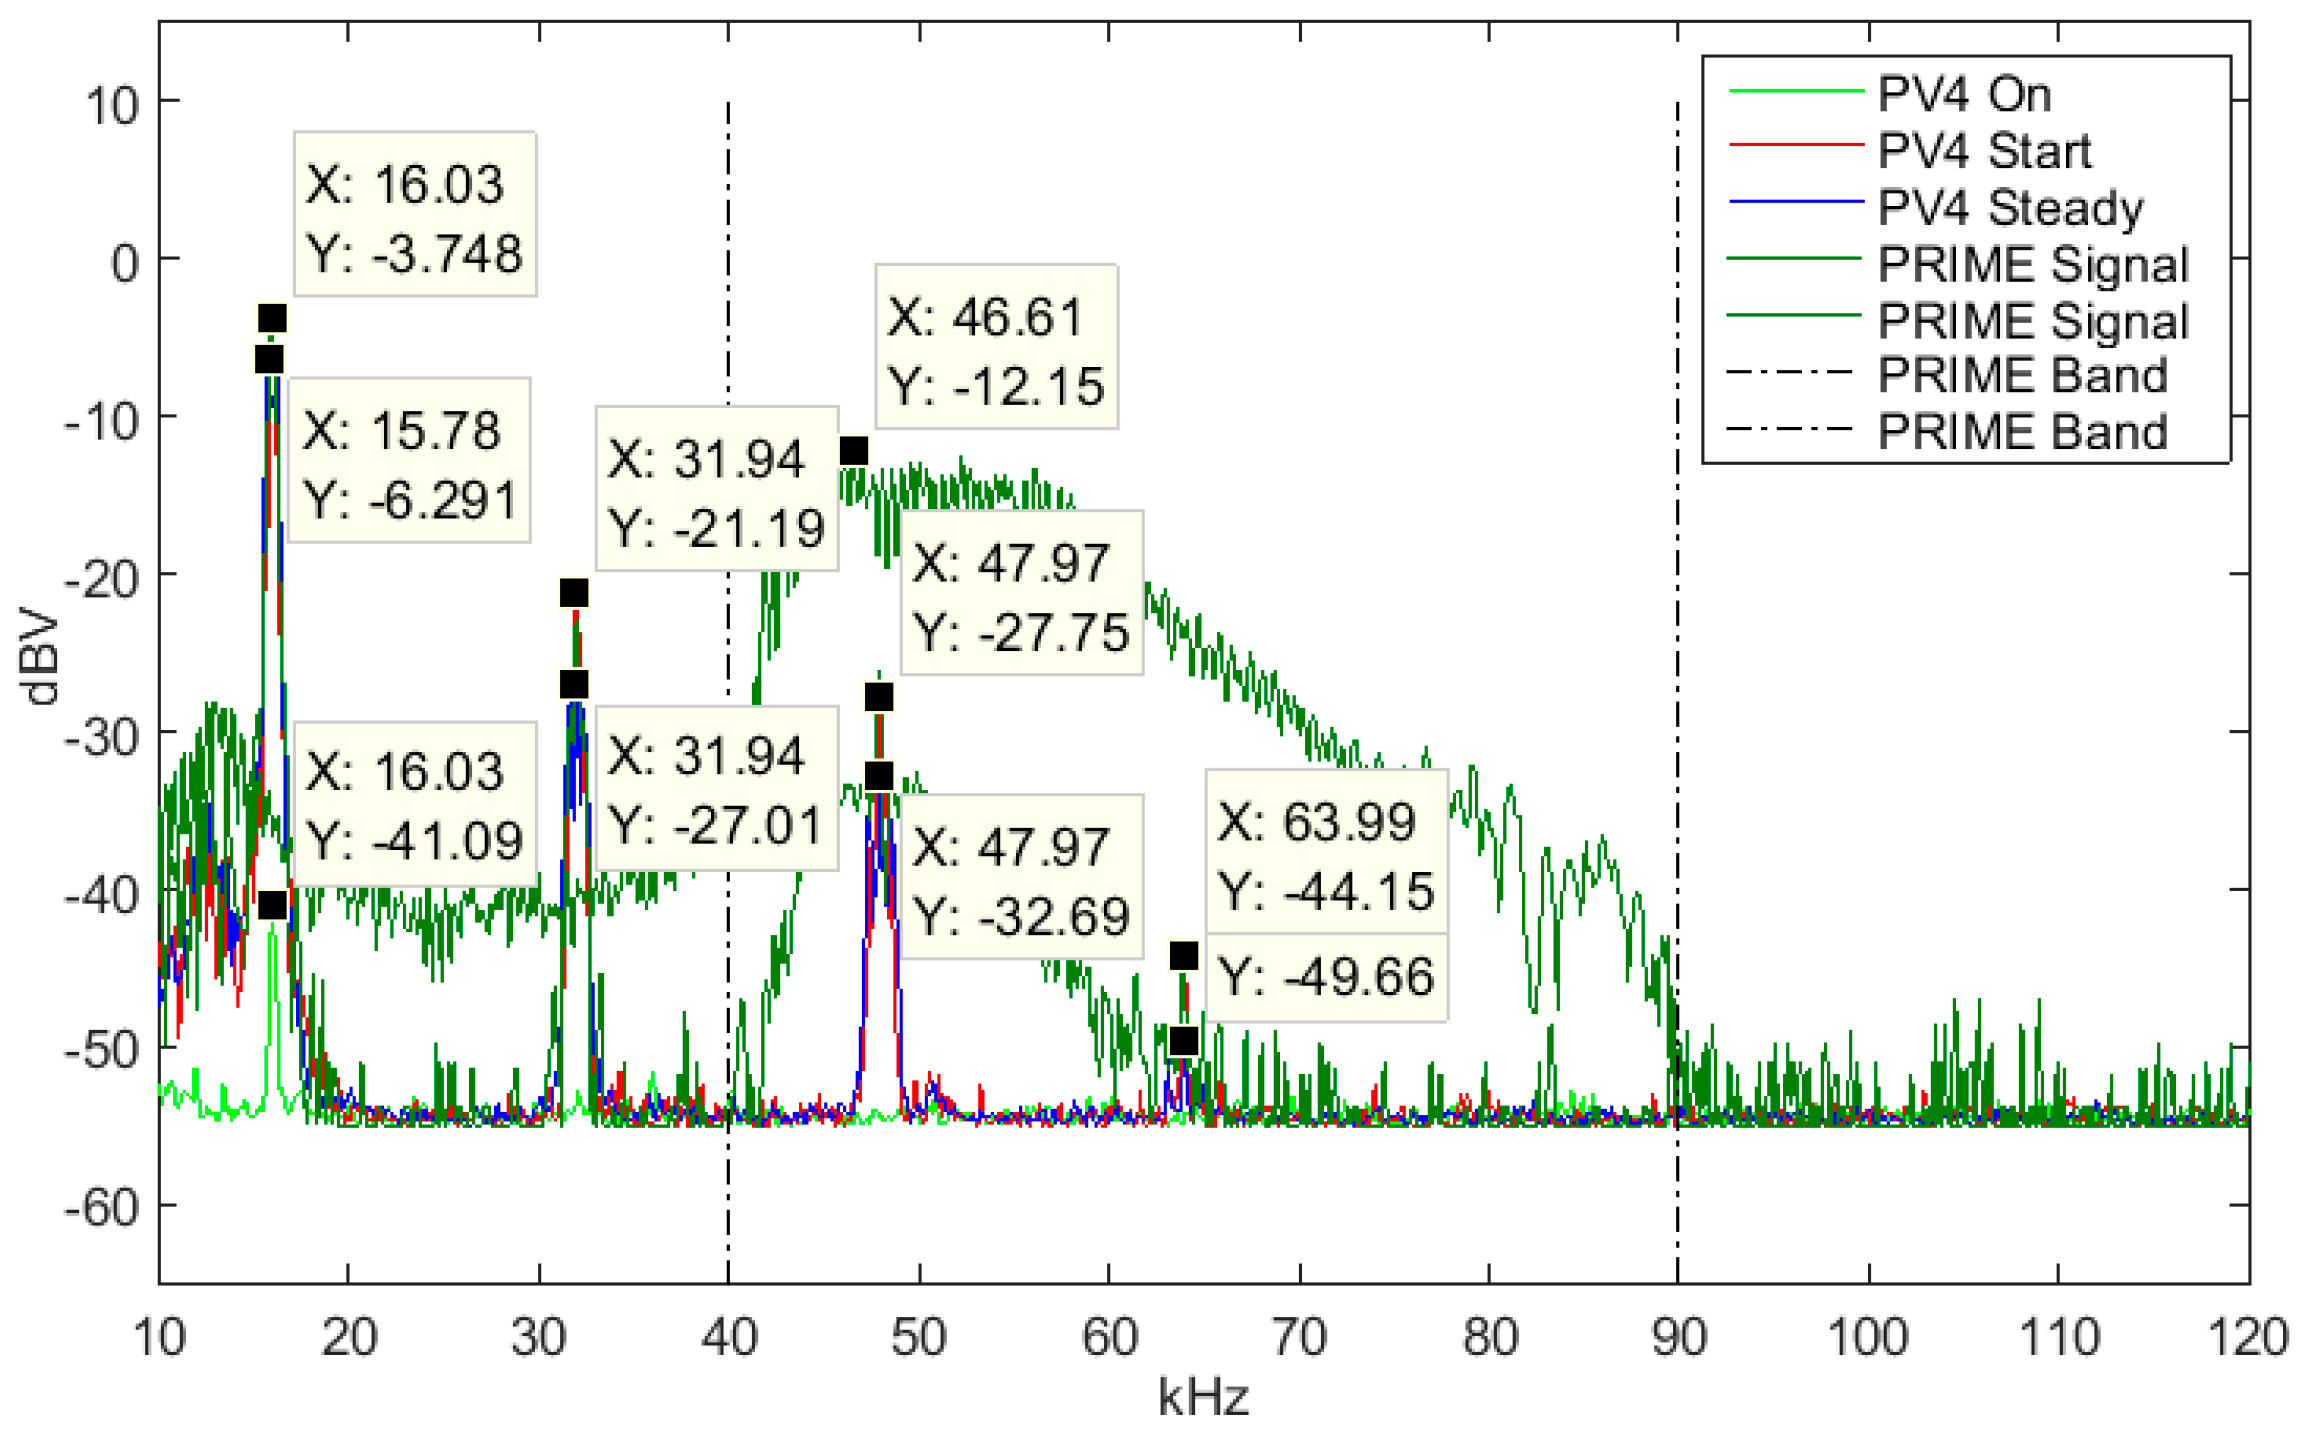
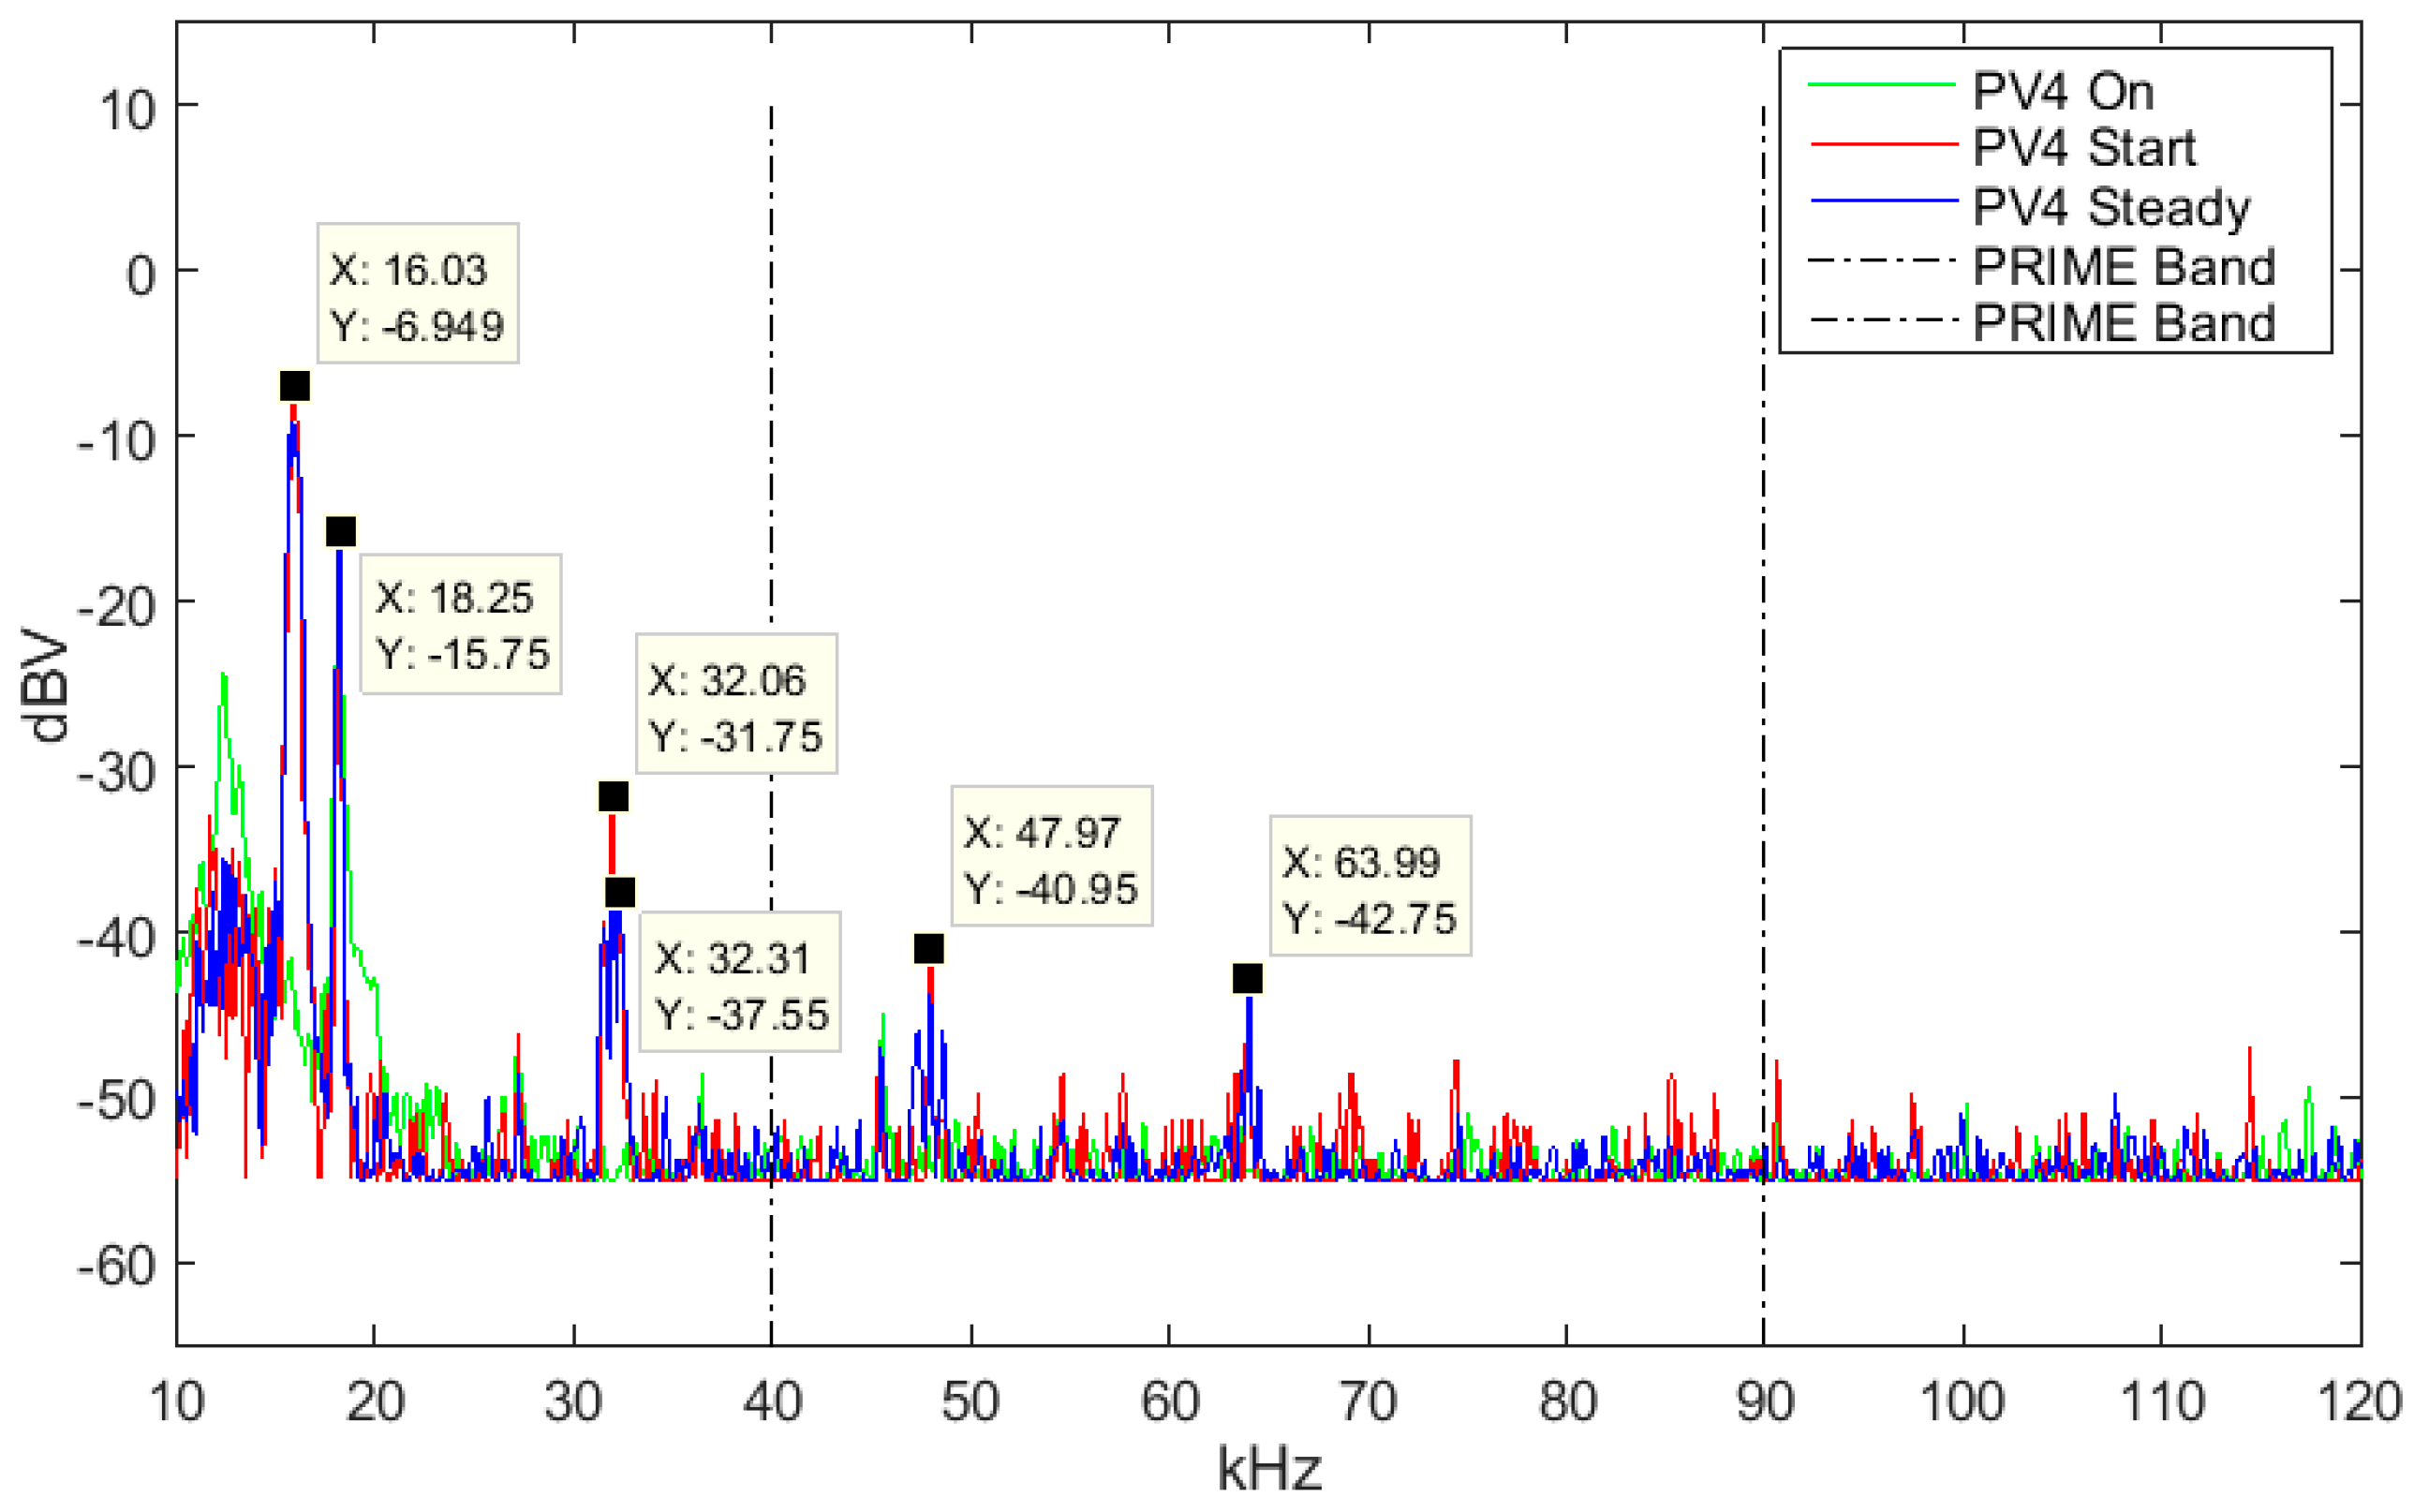
5.3. Three-Phased PV4 Inverter
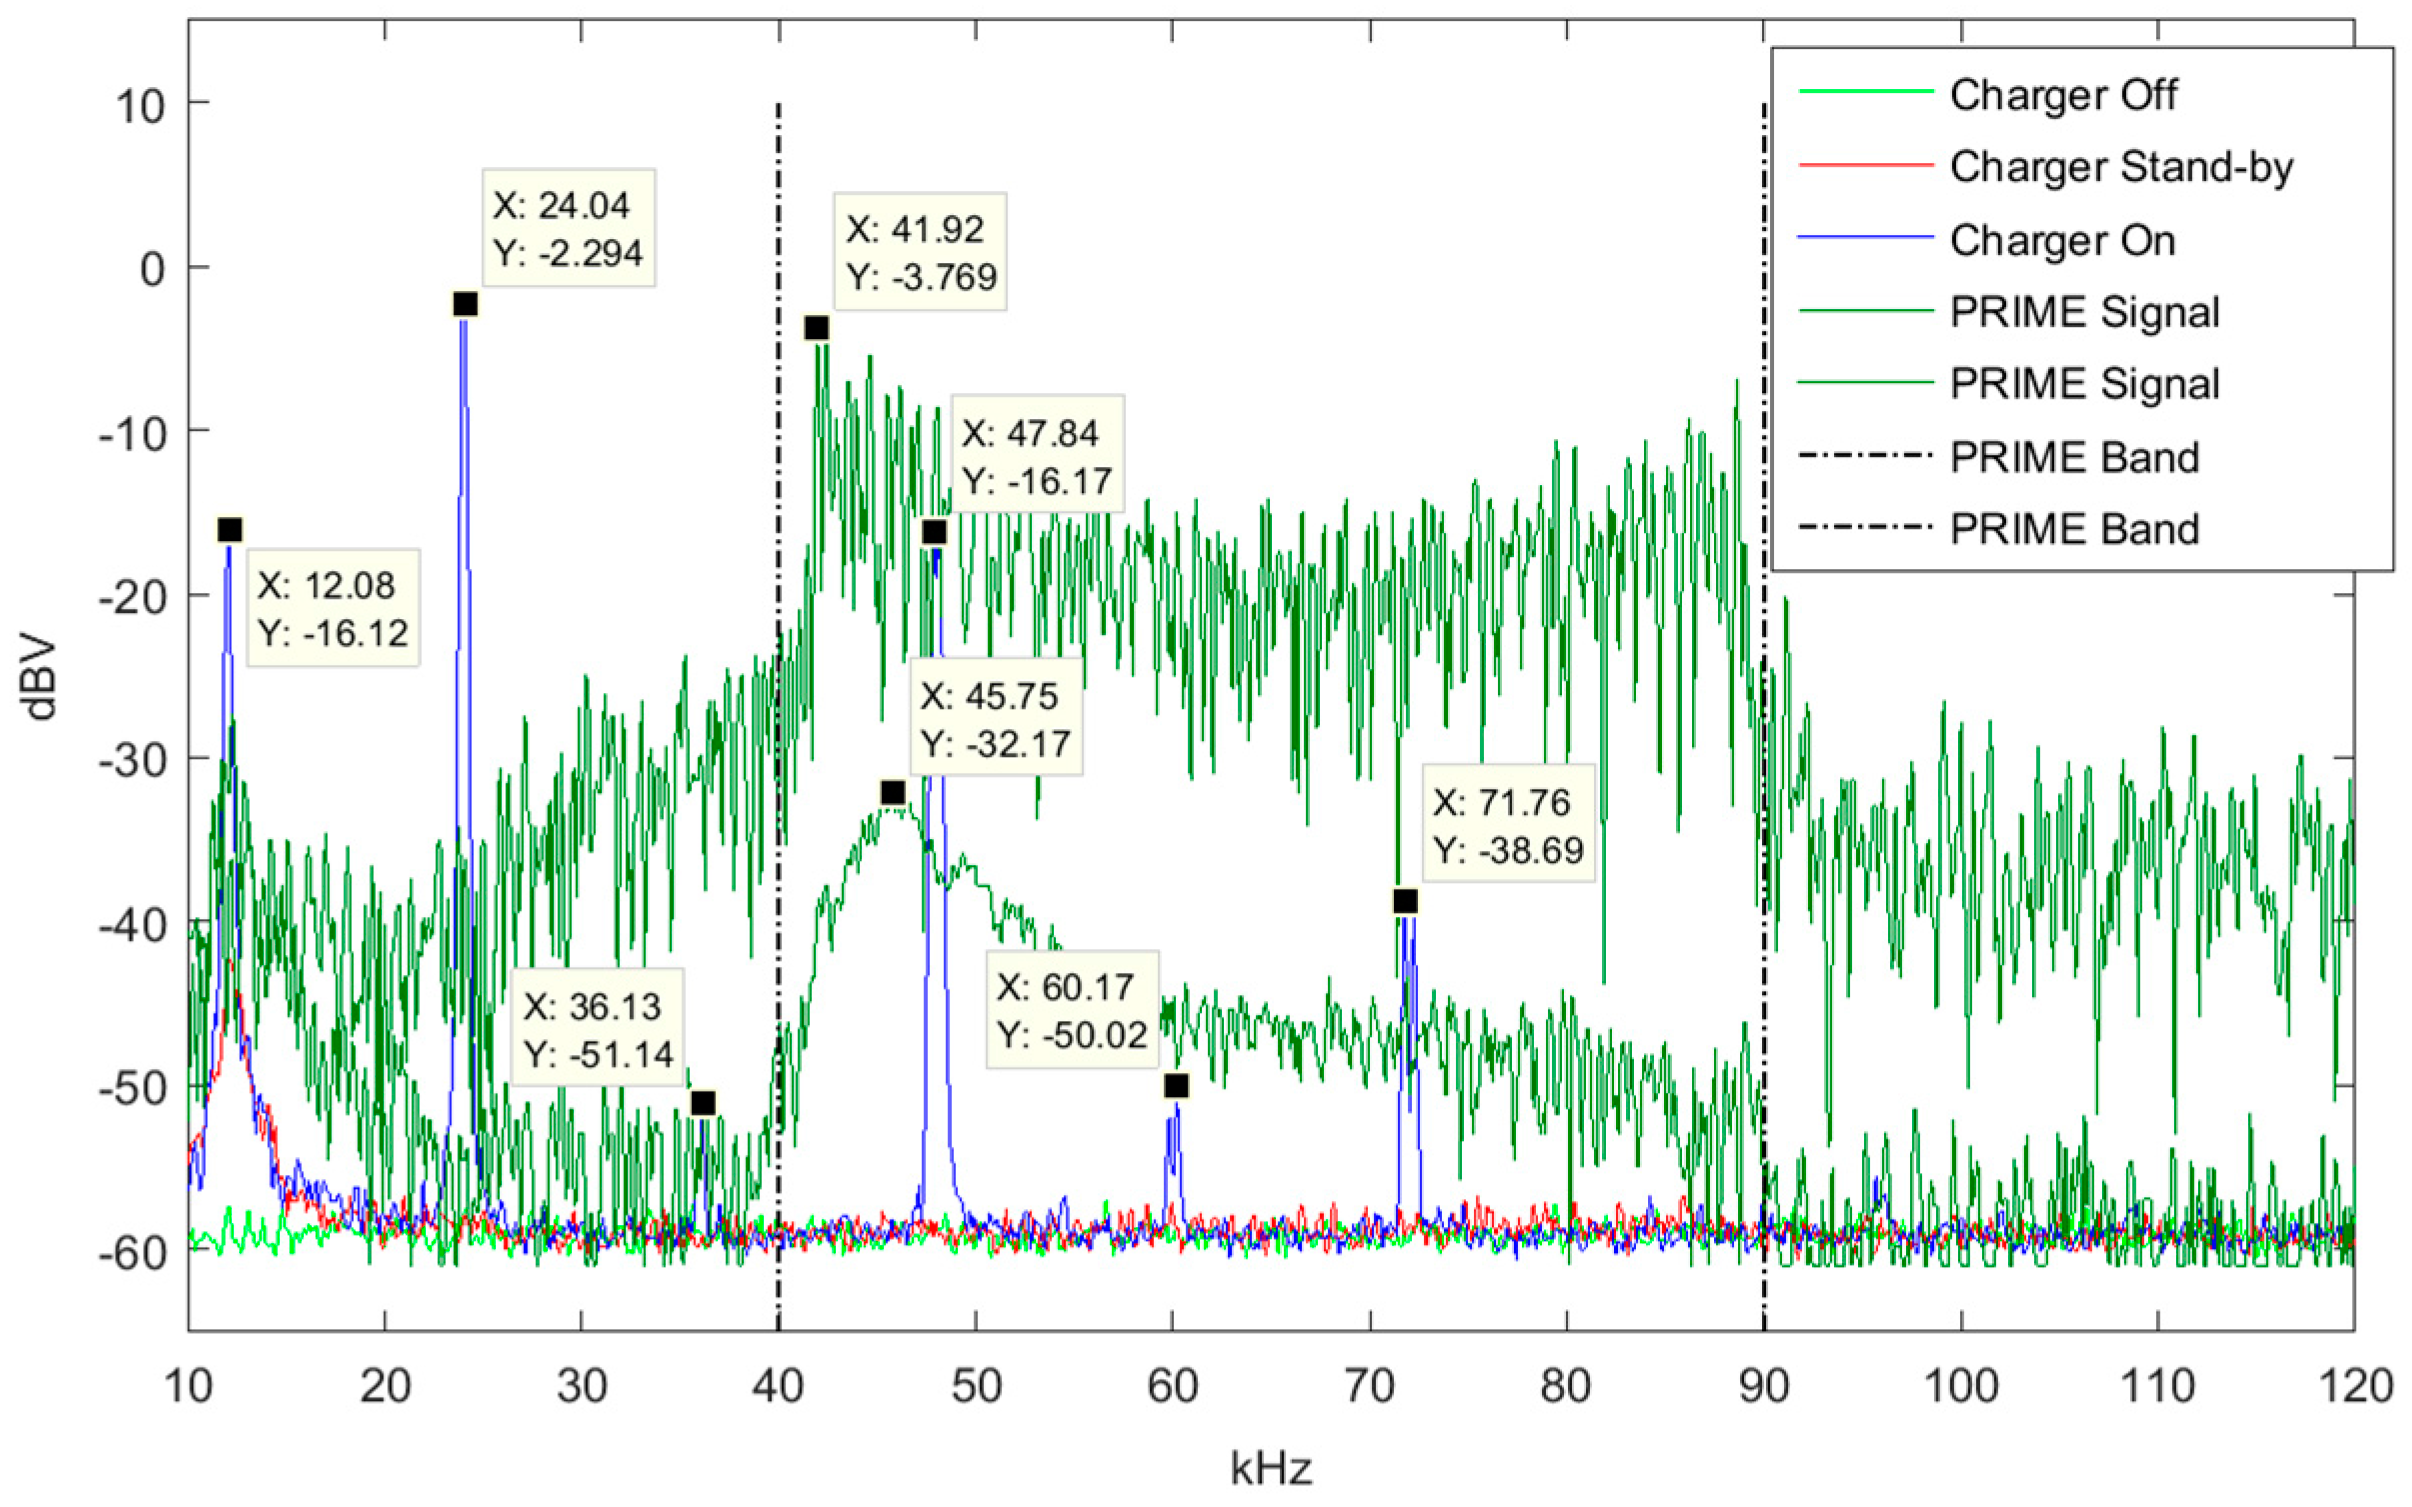
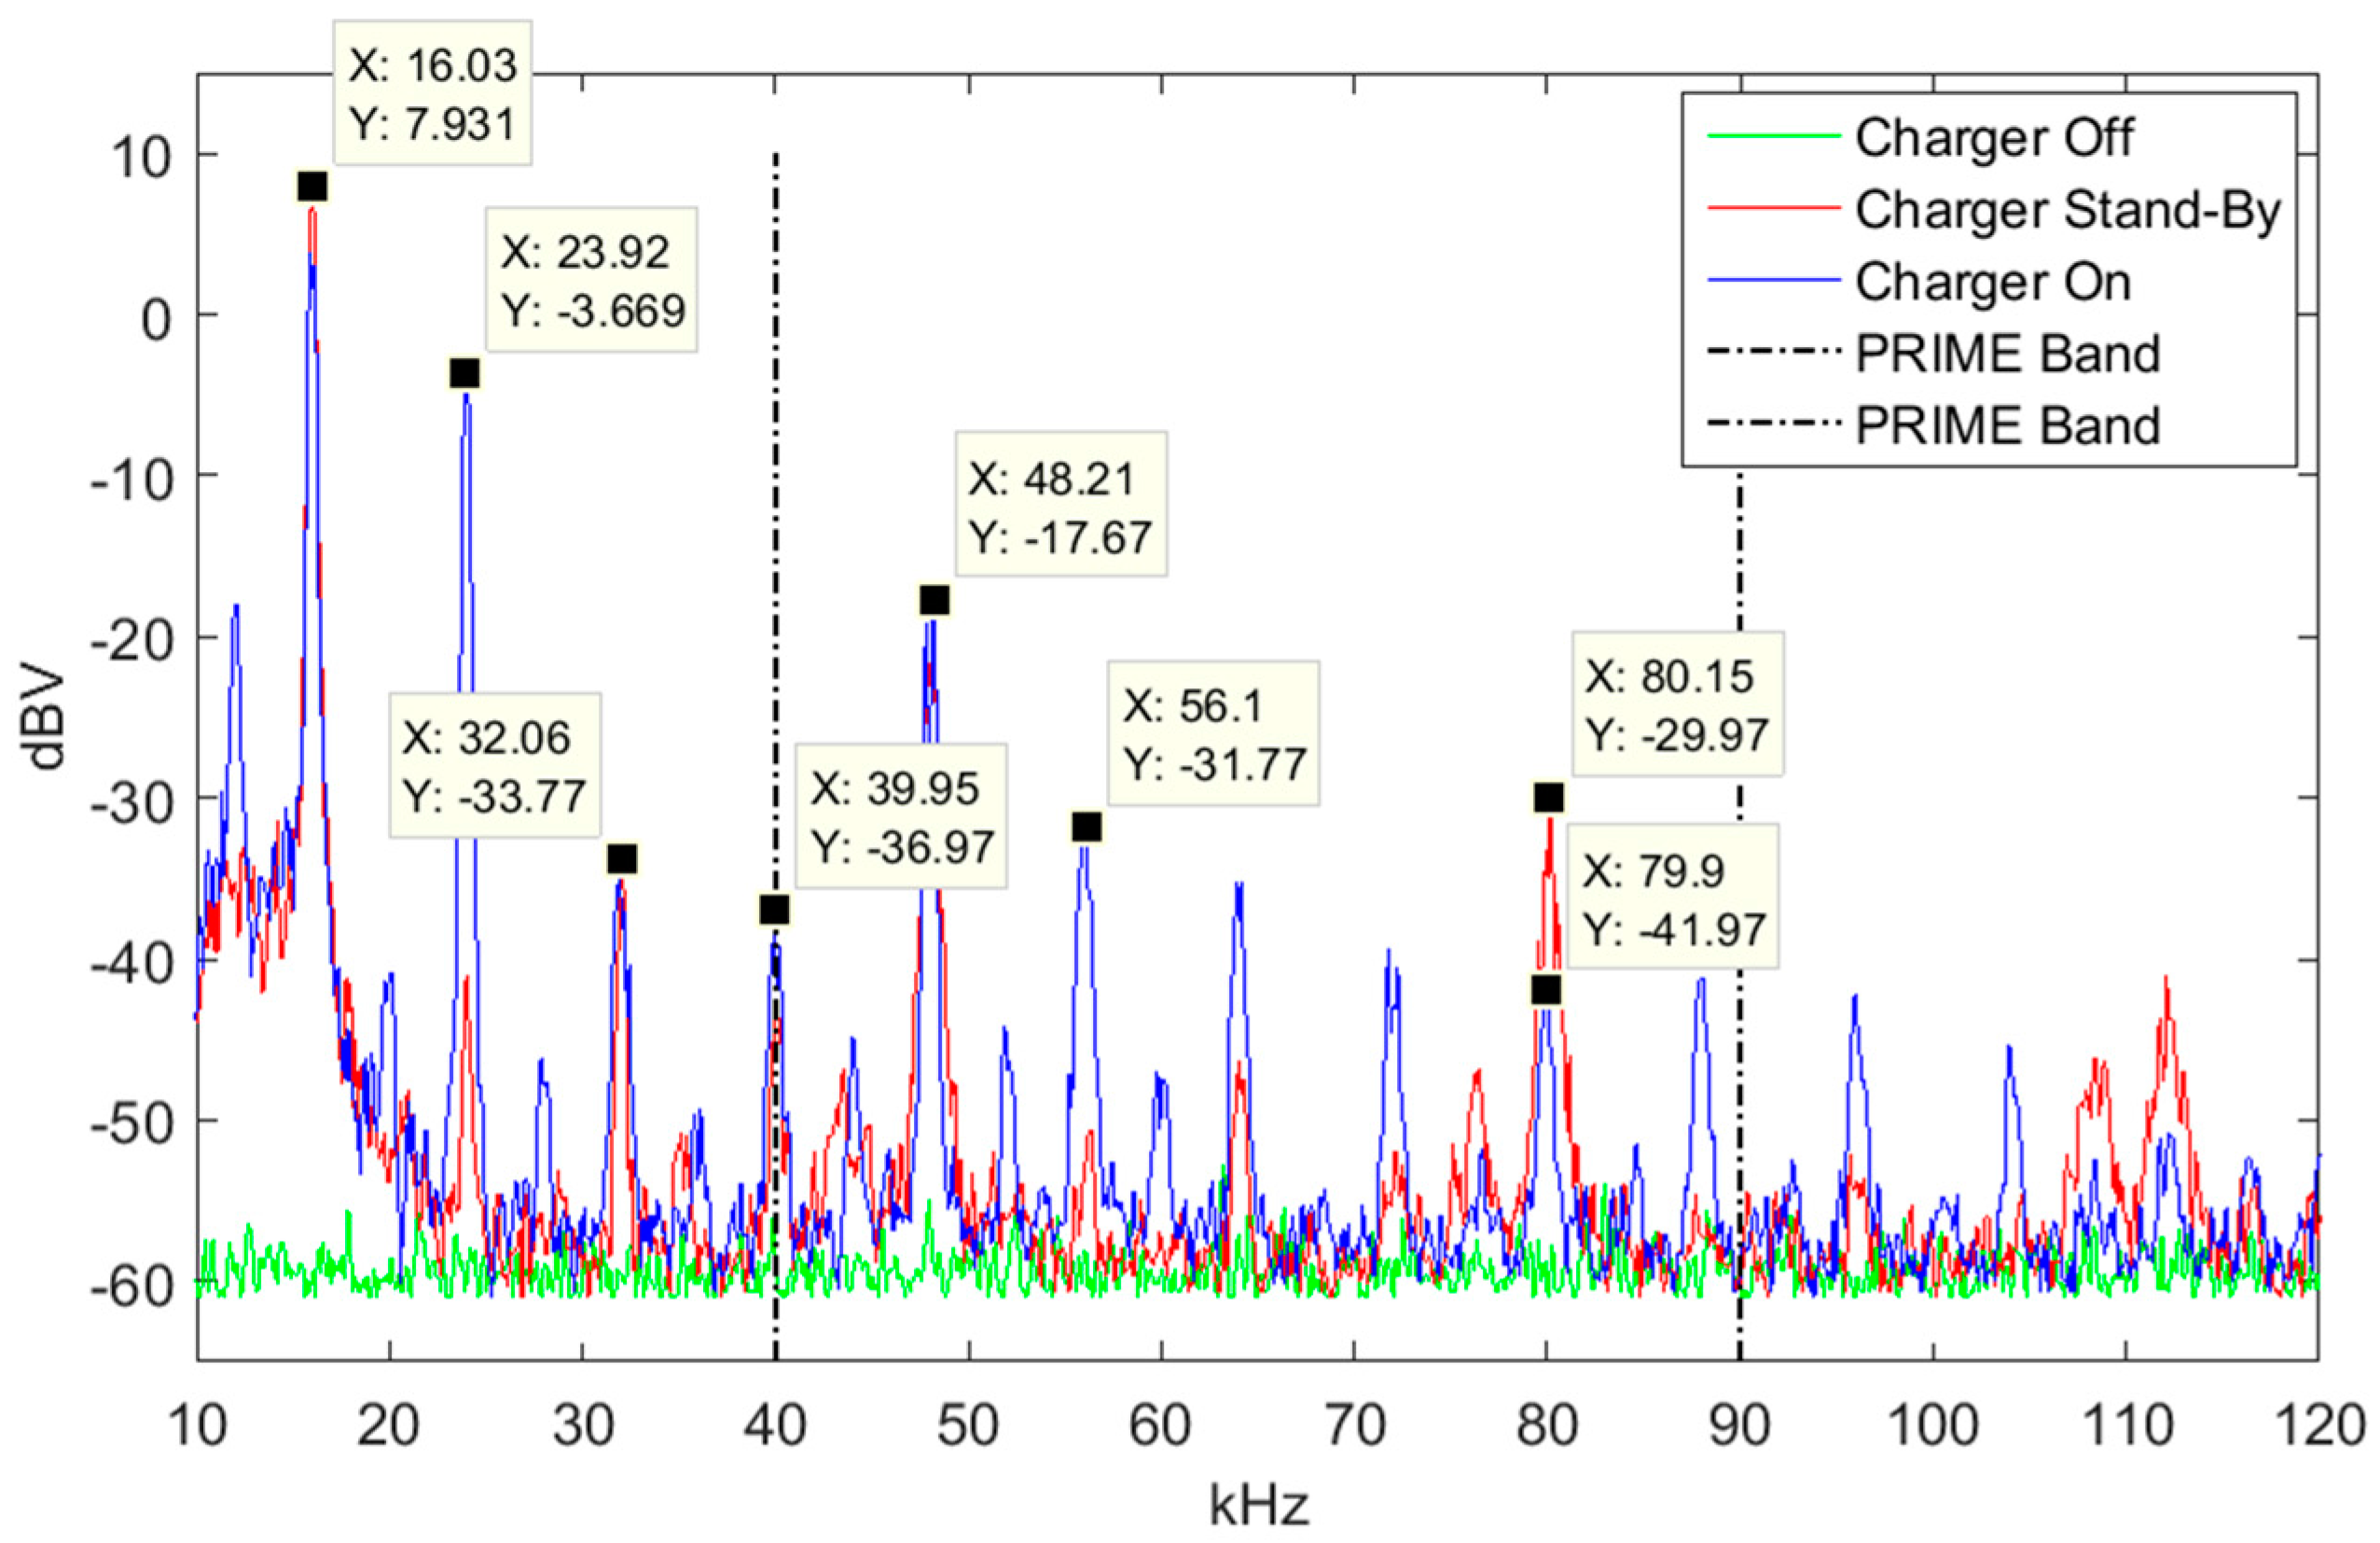
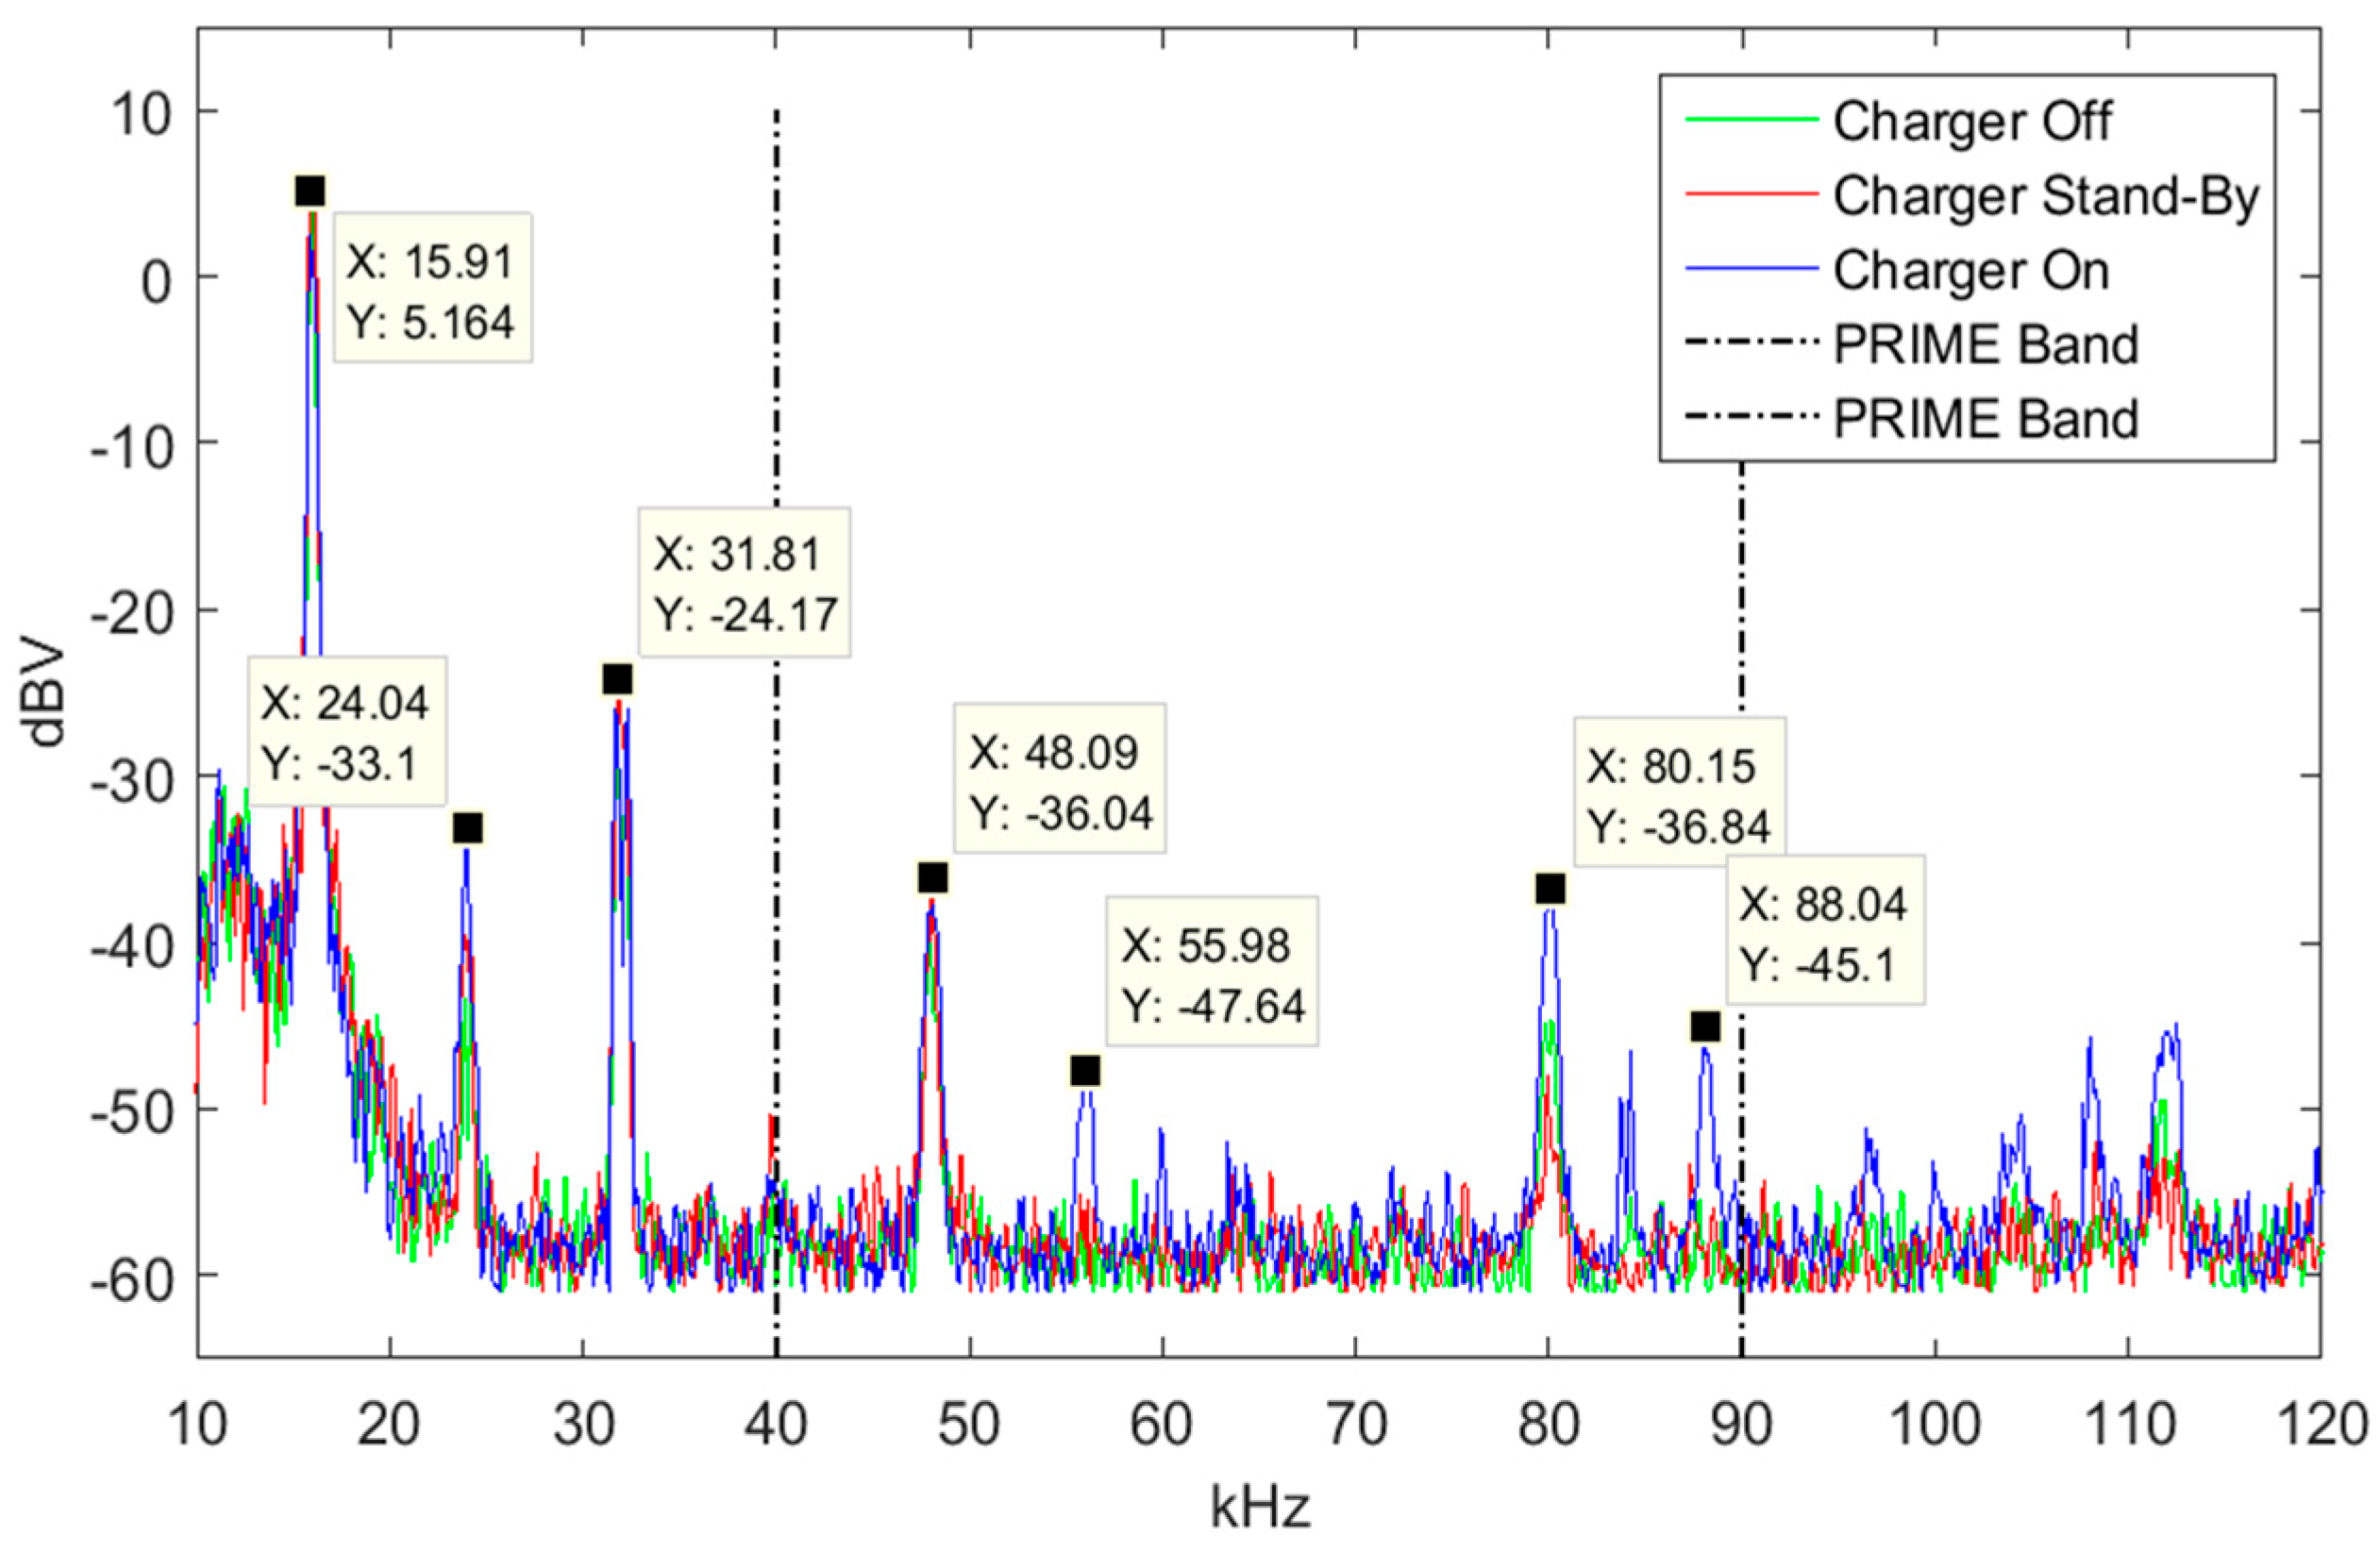
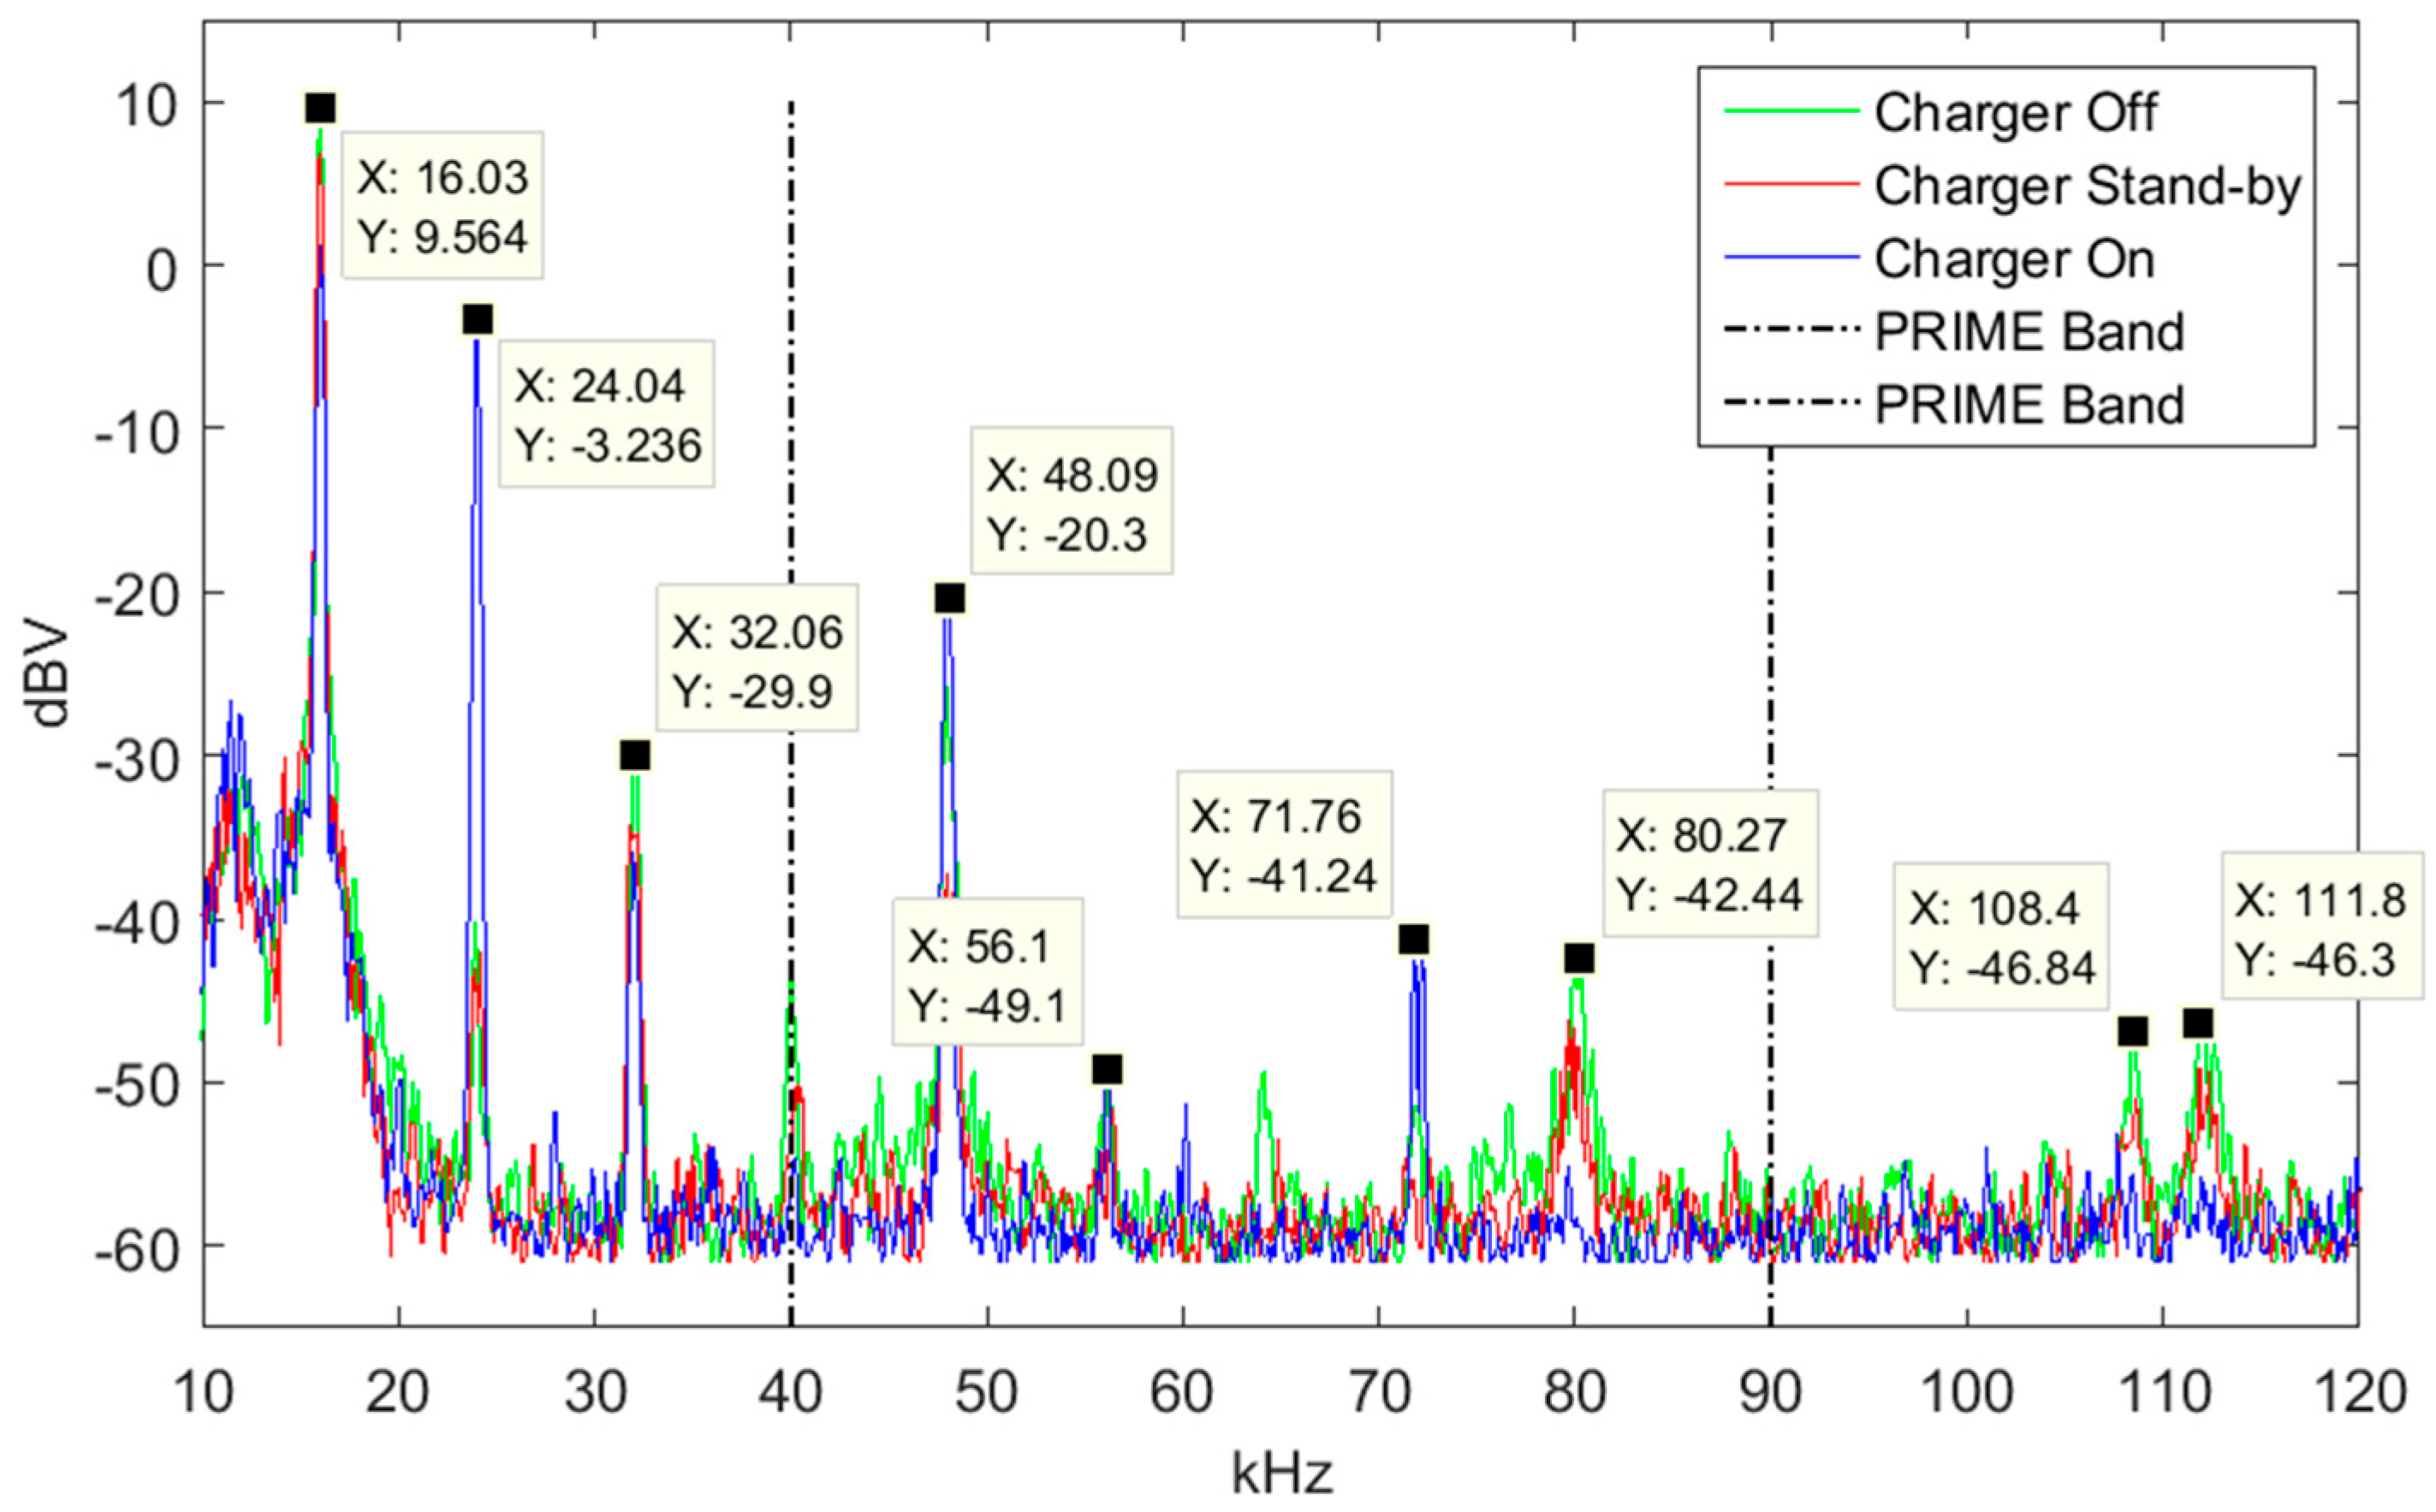
5.4. Battery Charger
5.5. Single-Phased Photovoltaic Inverters
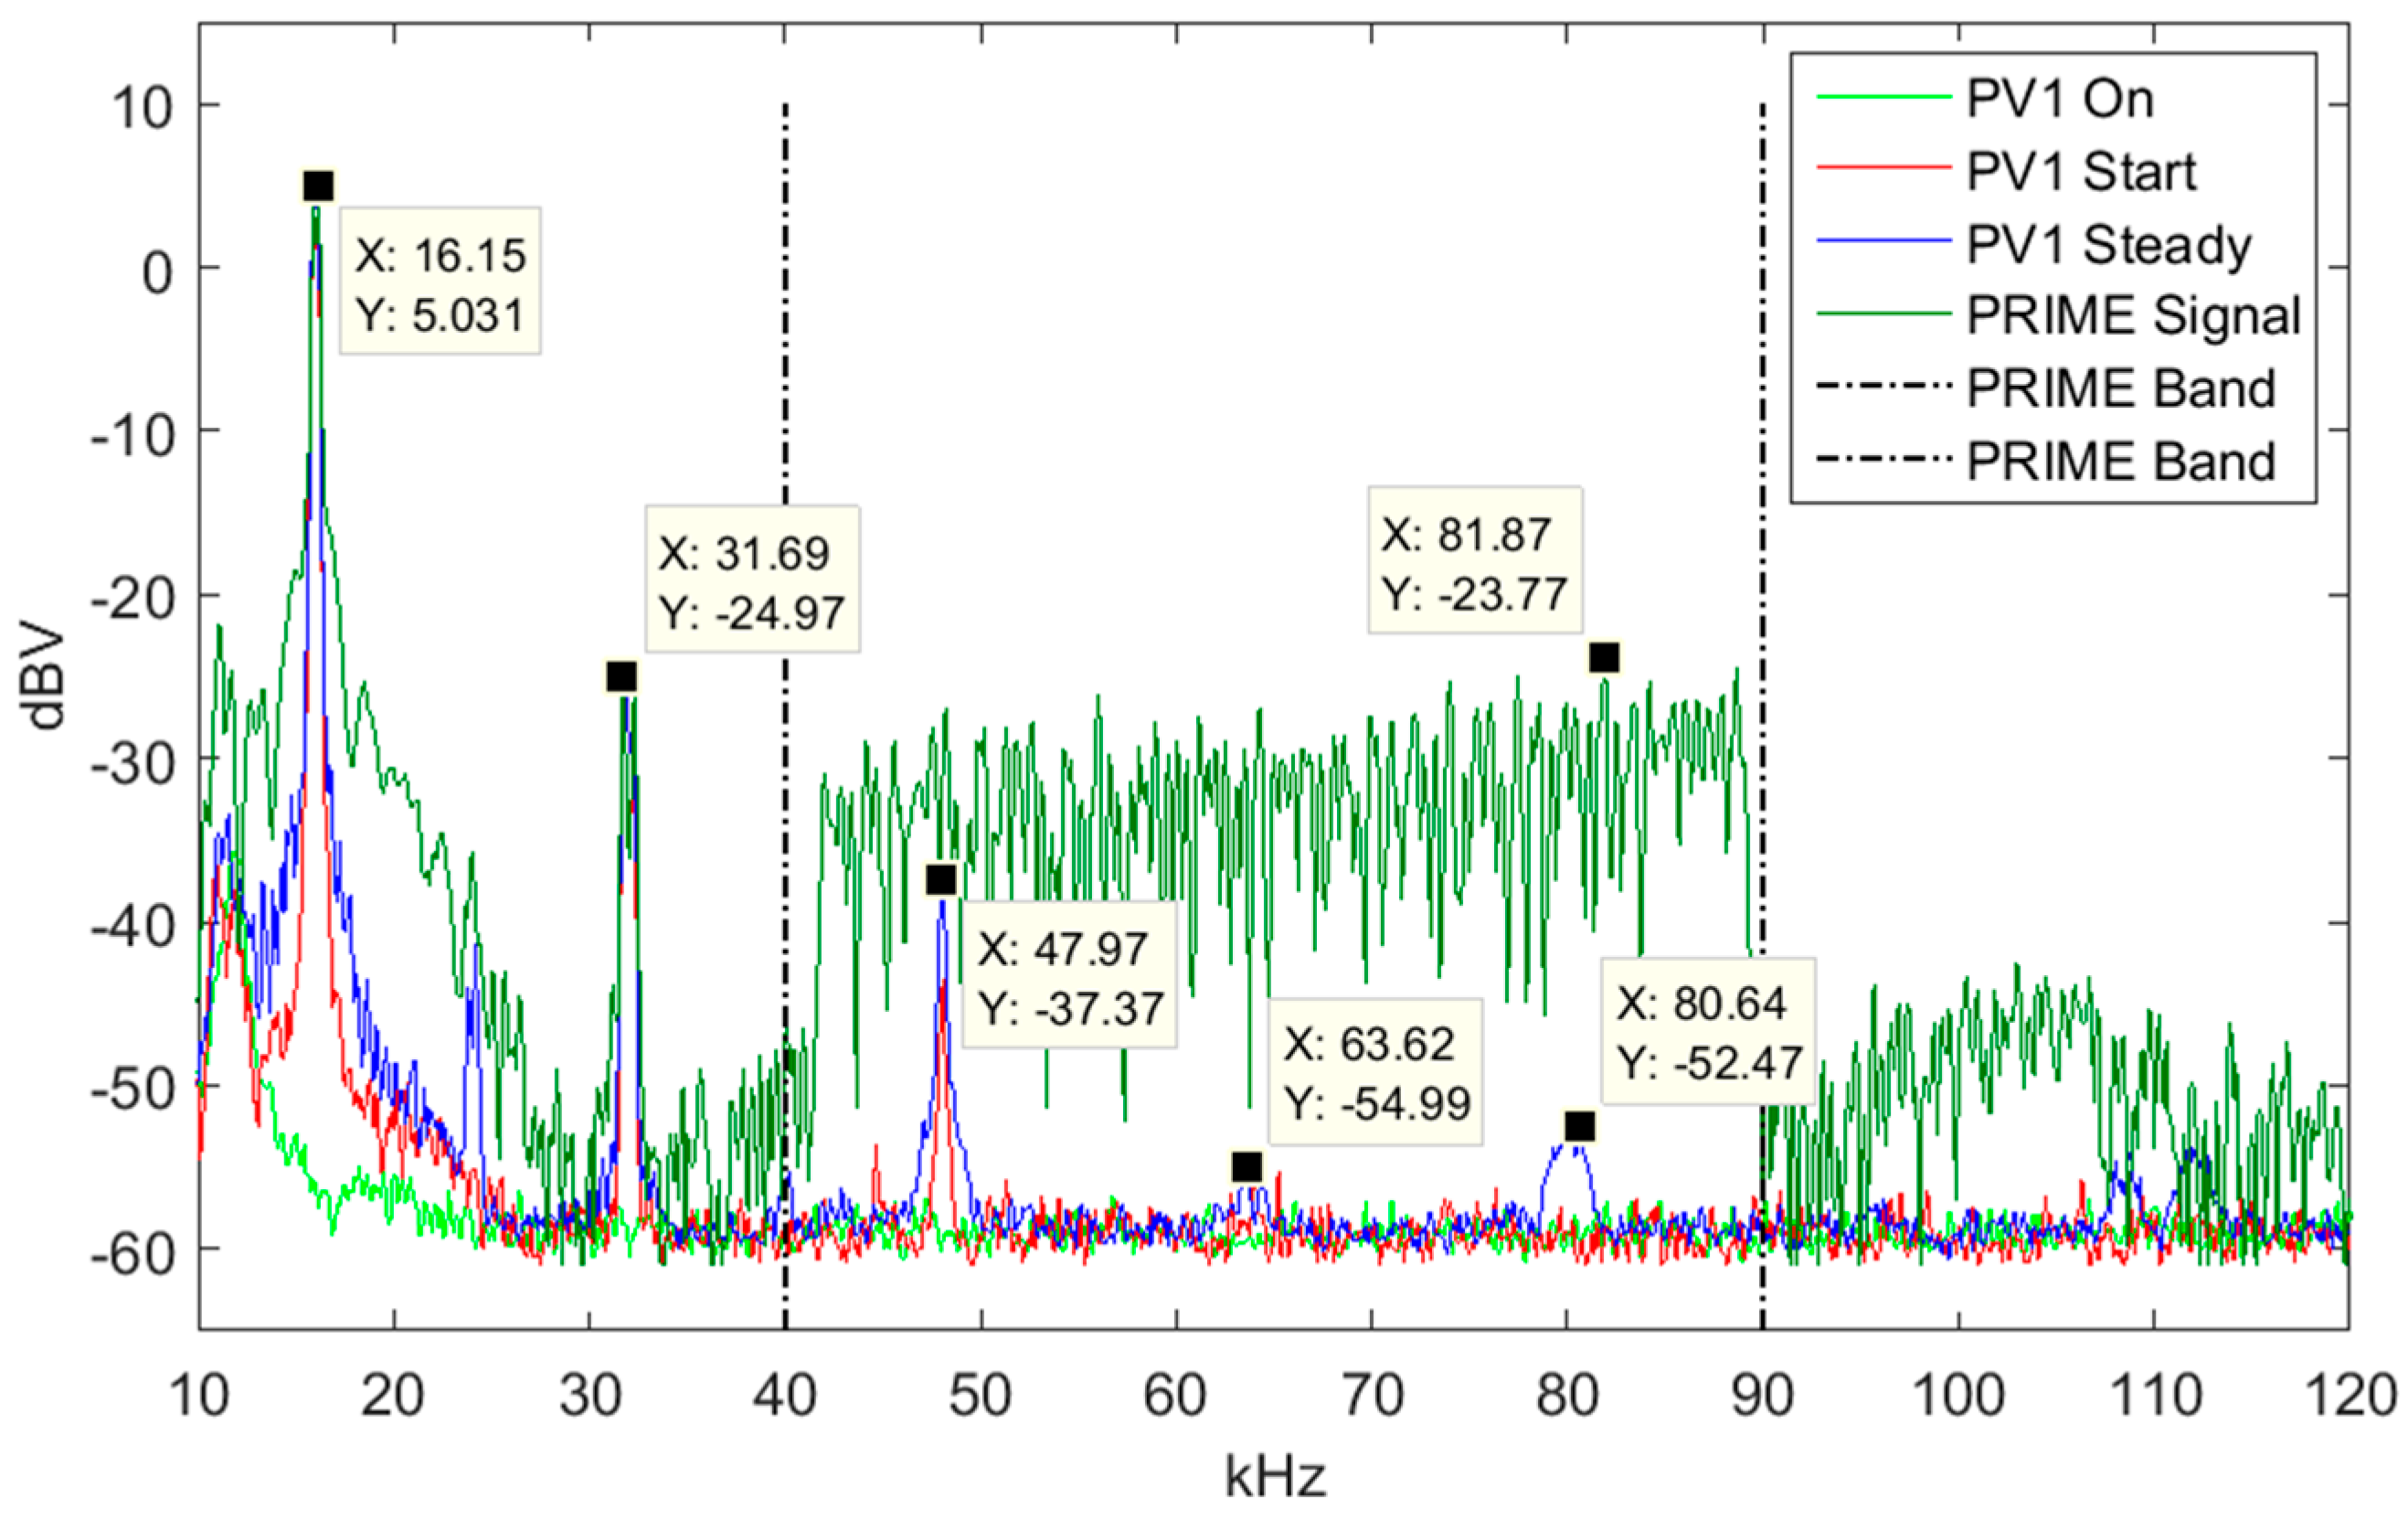
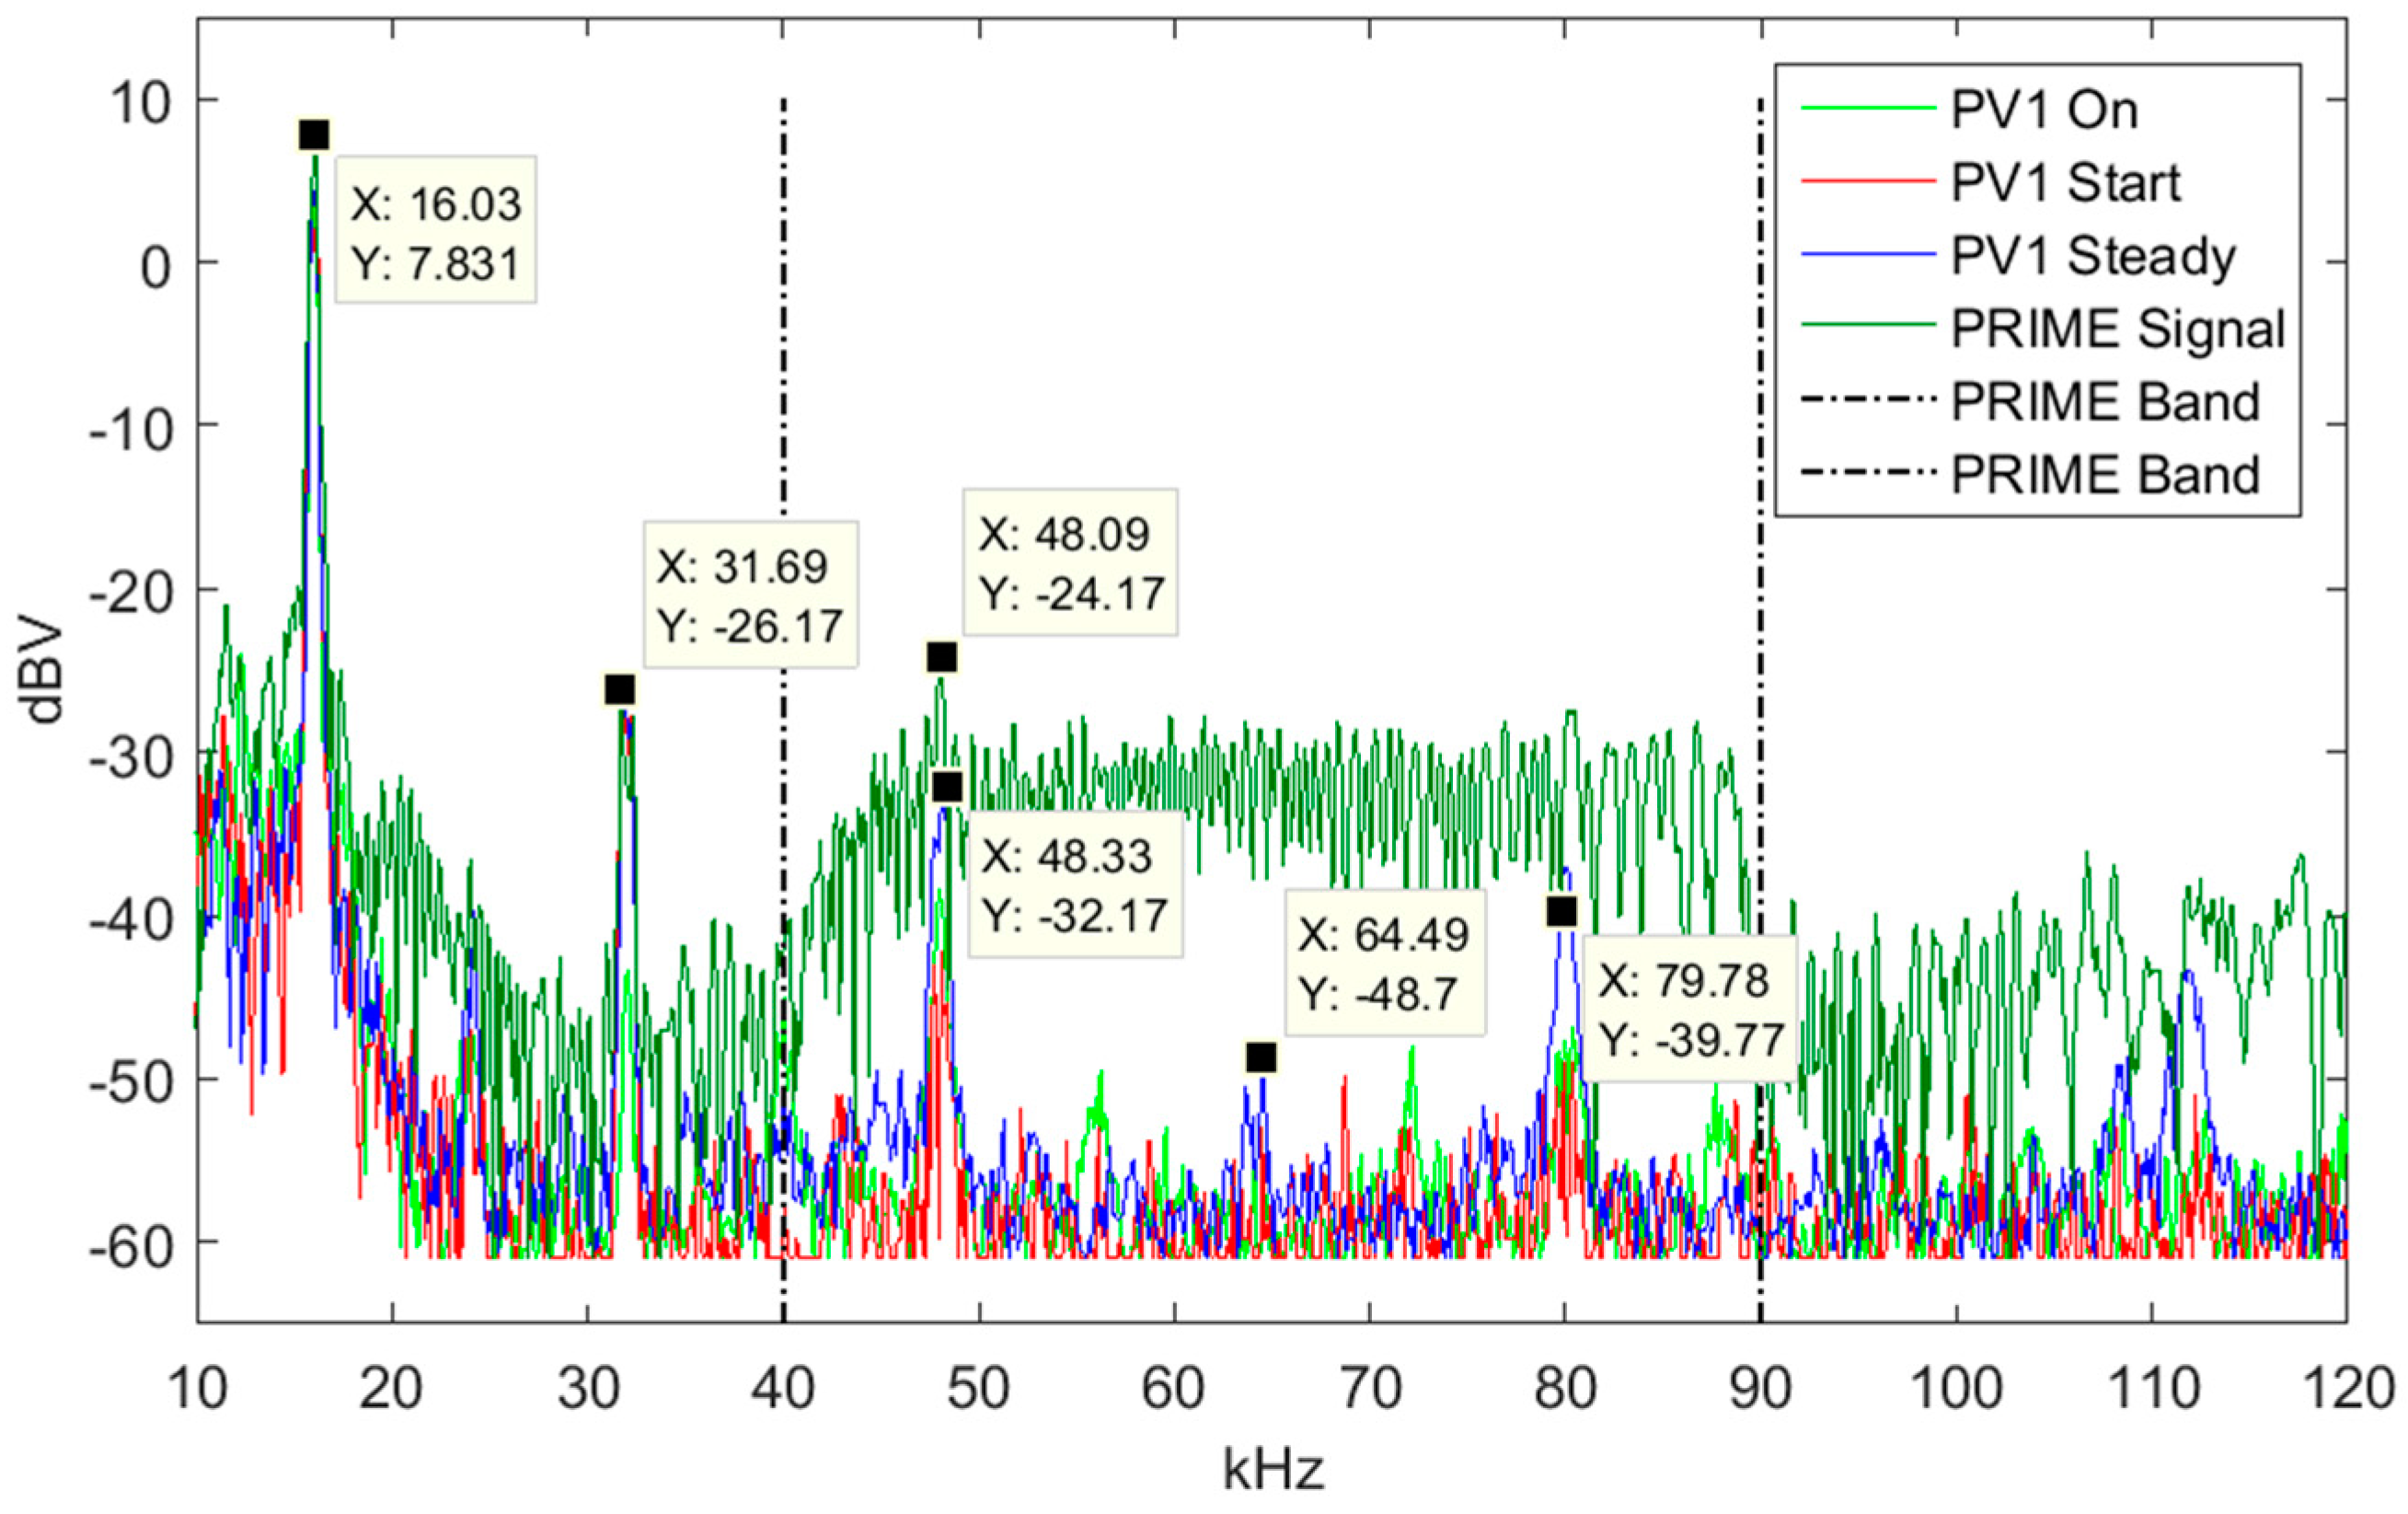
5.5.1. PV1
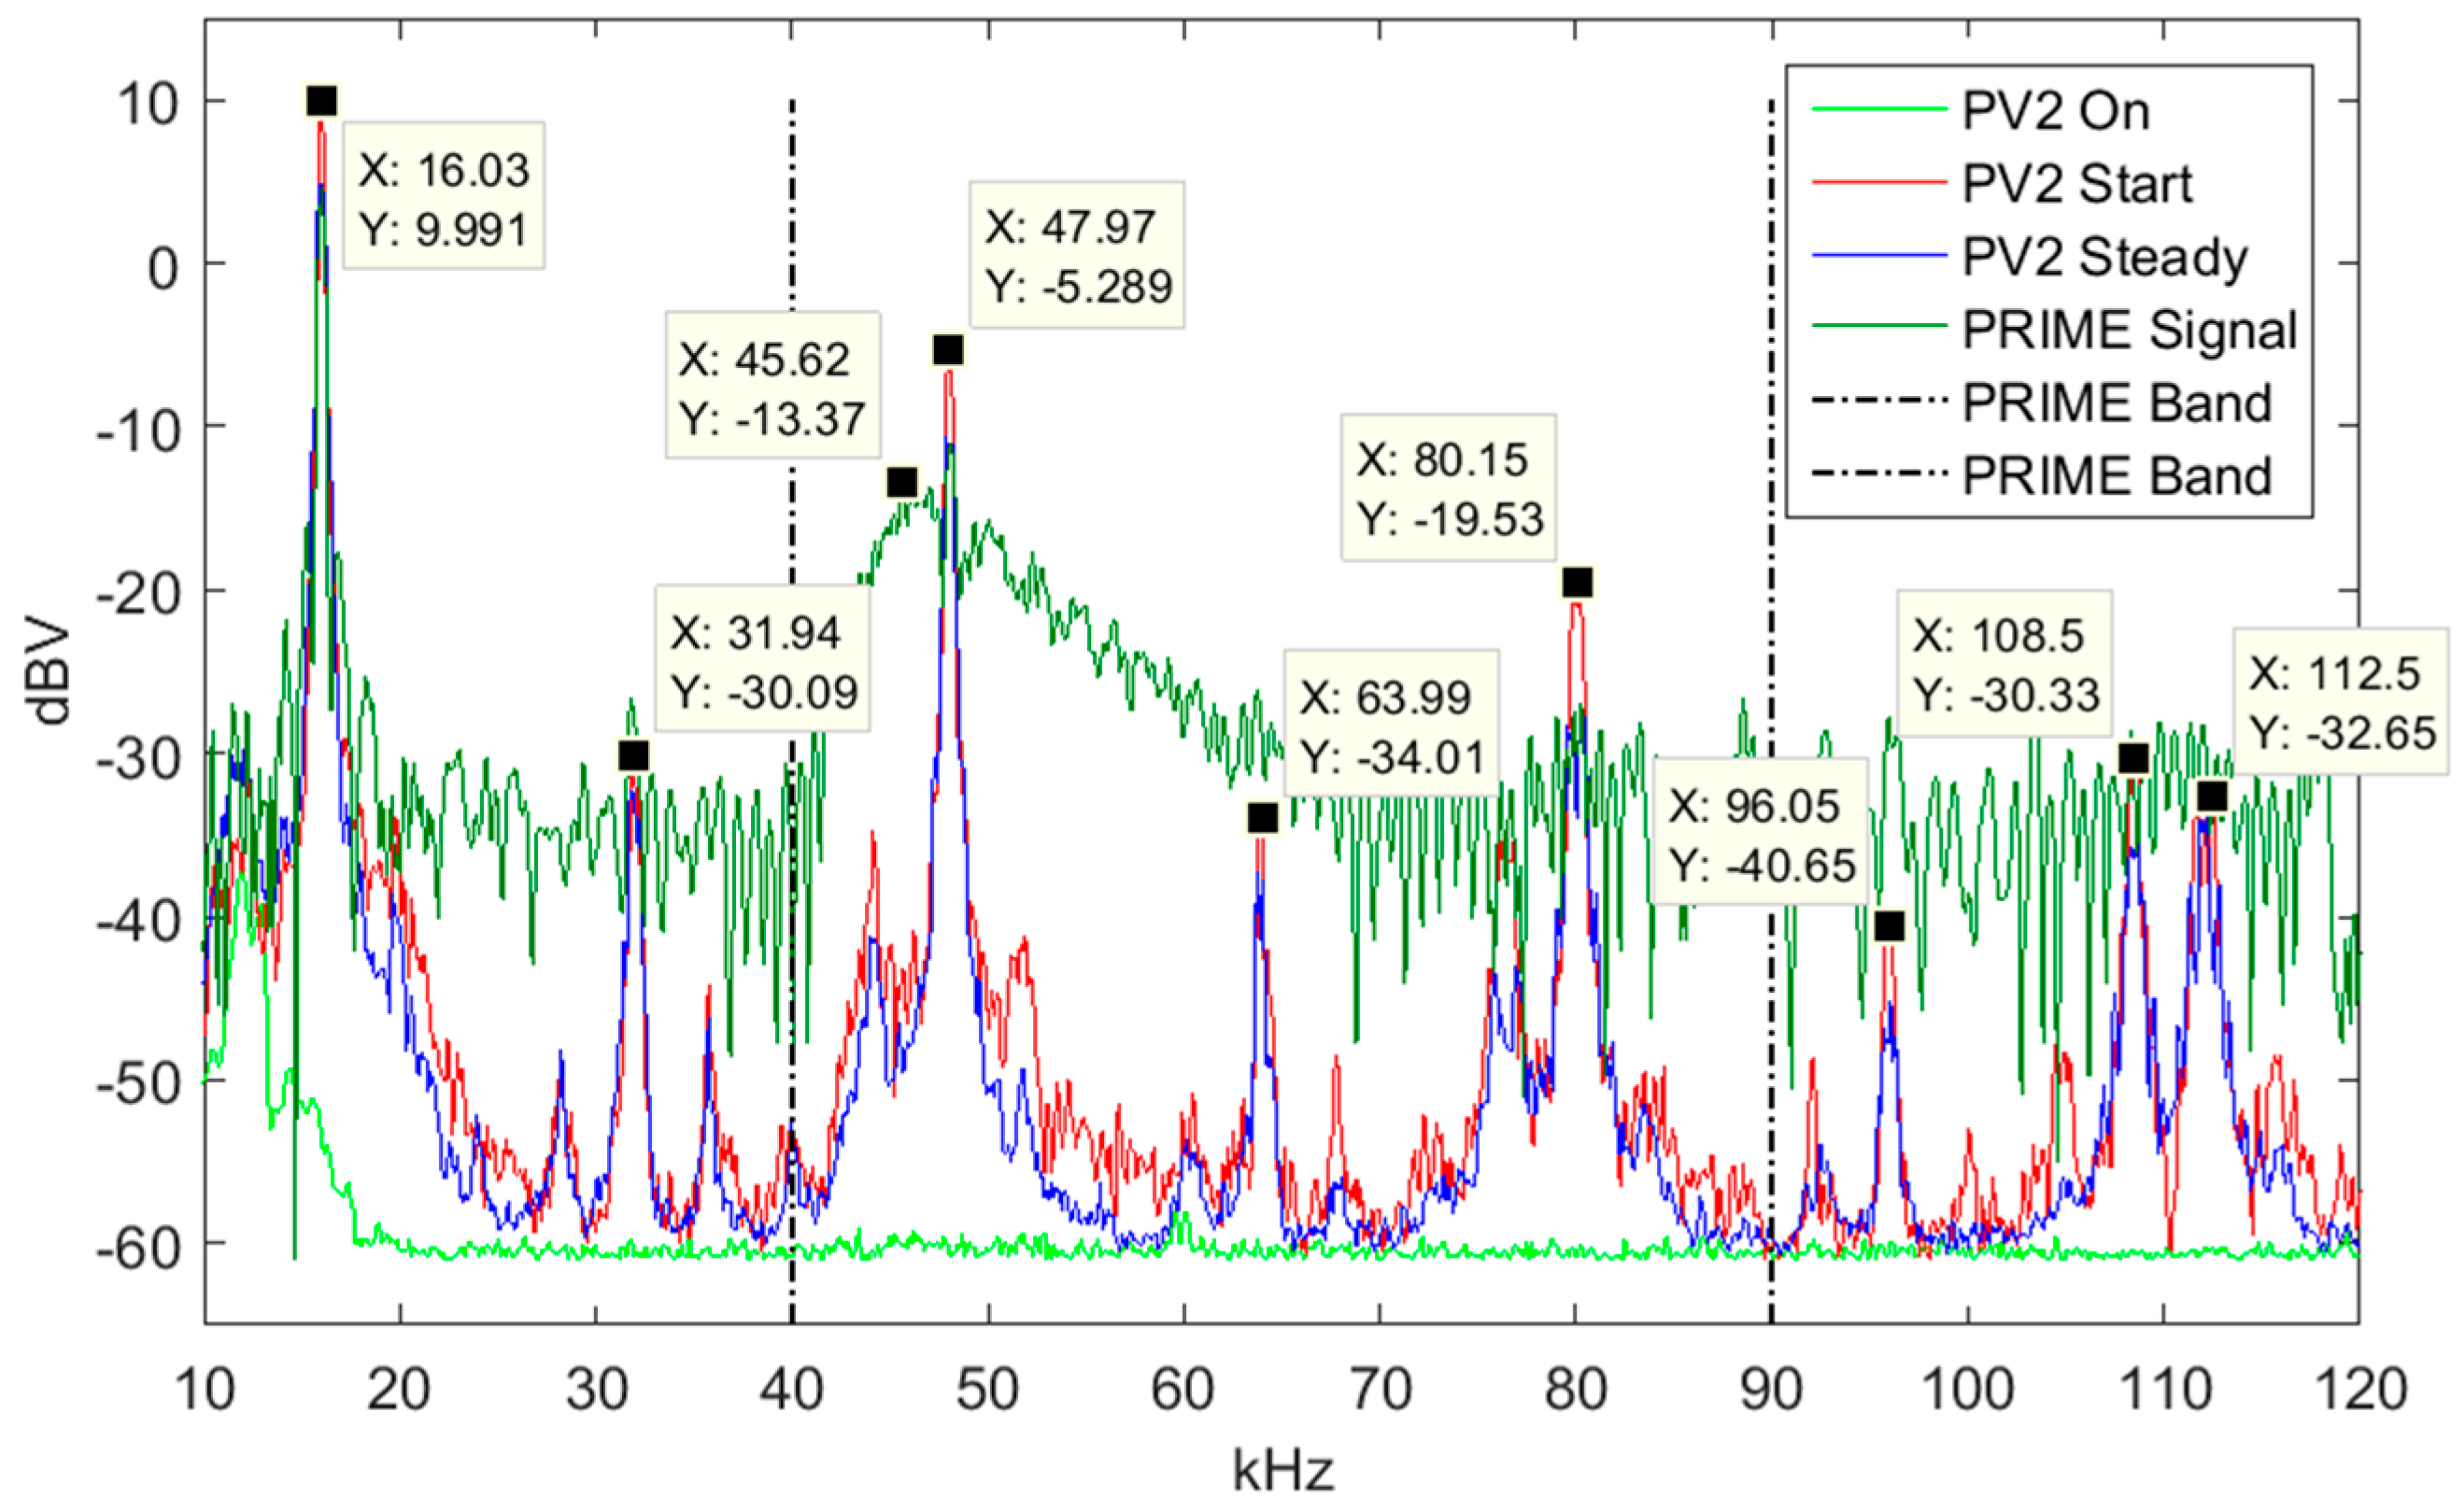
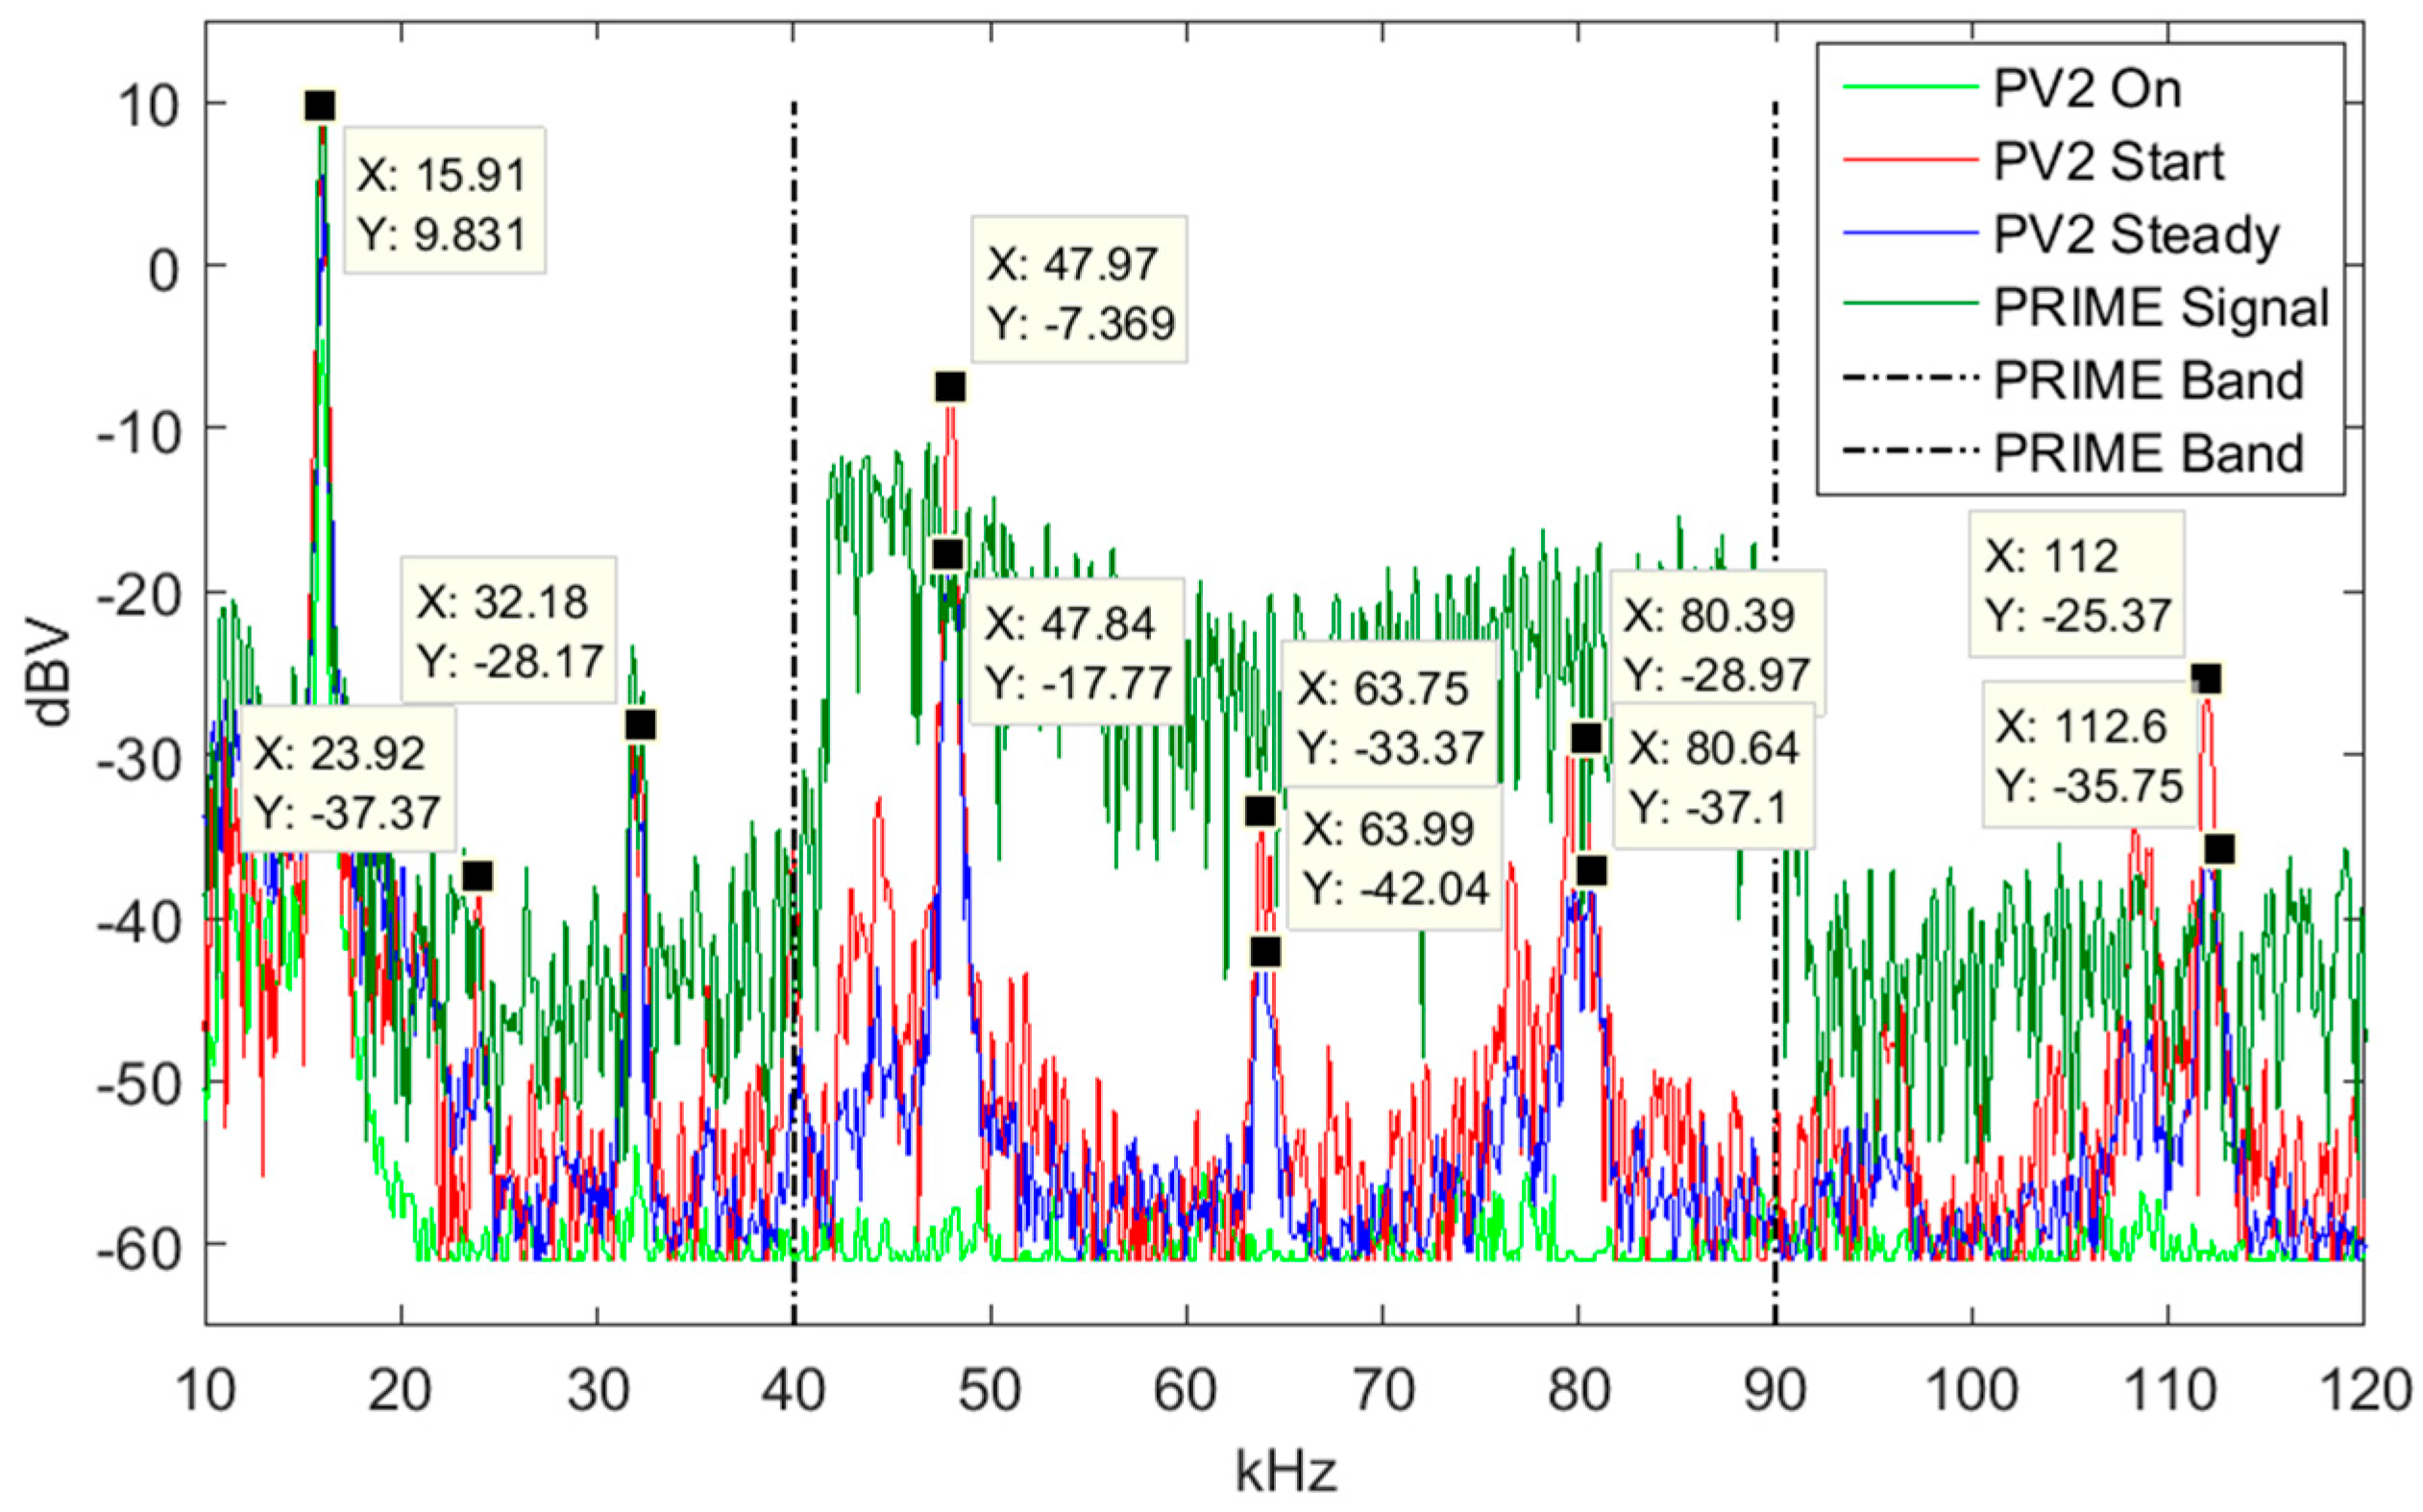
5.5.2. PV2
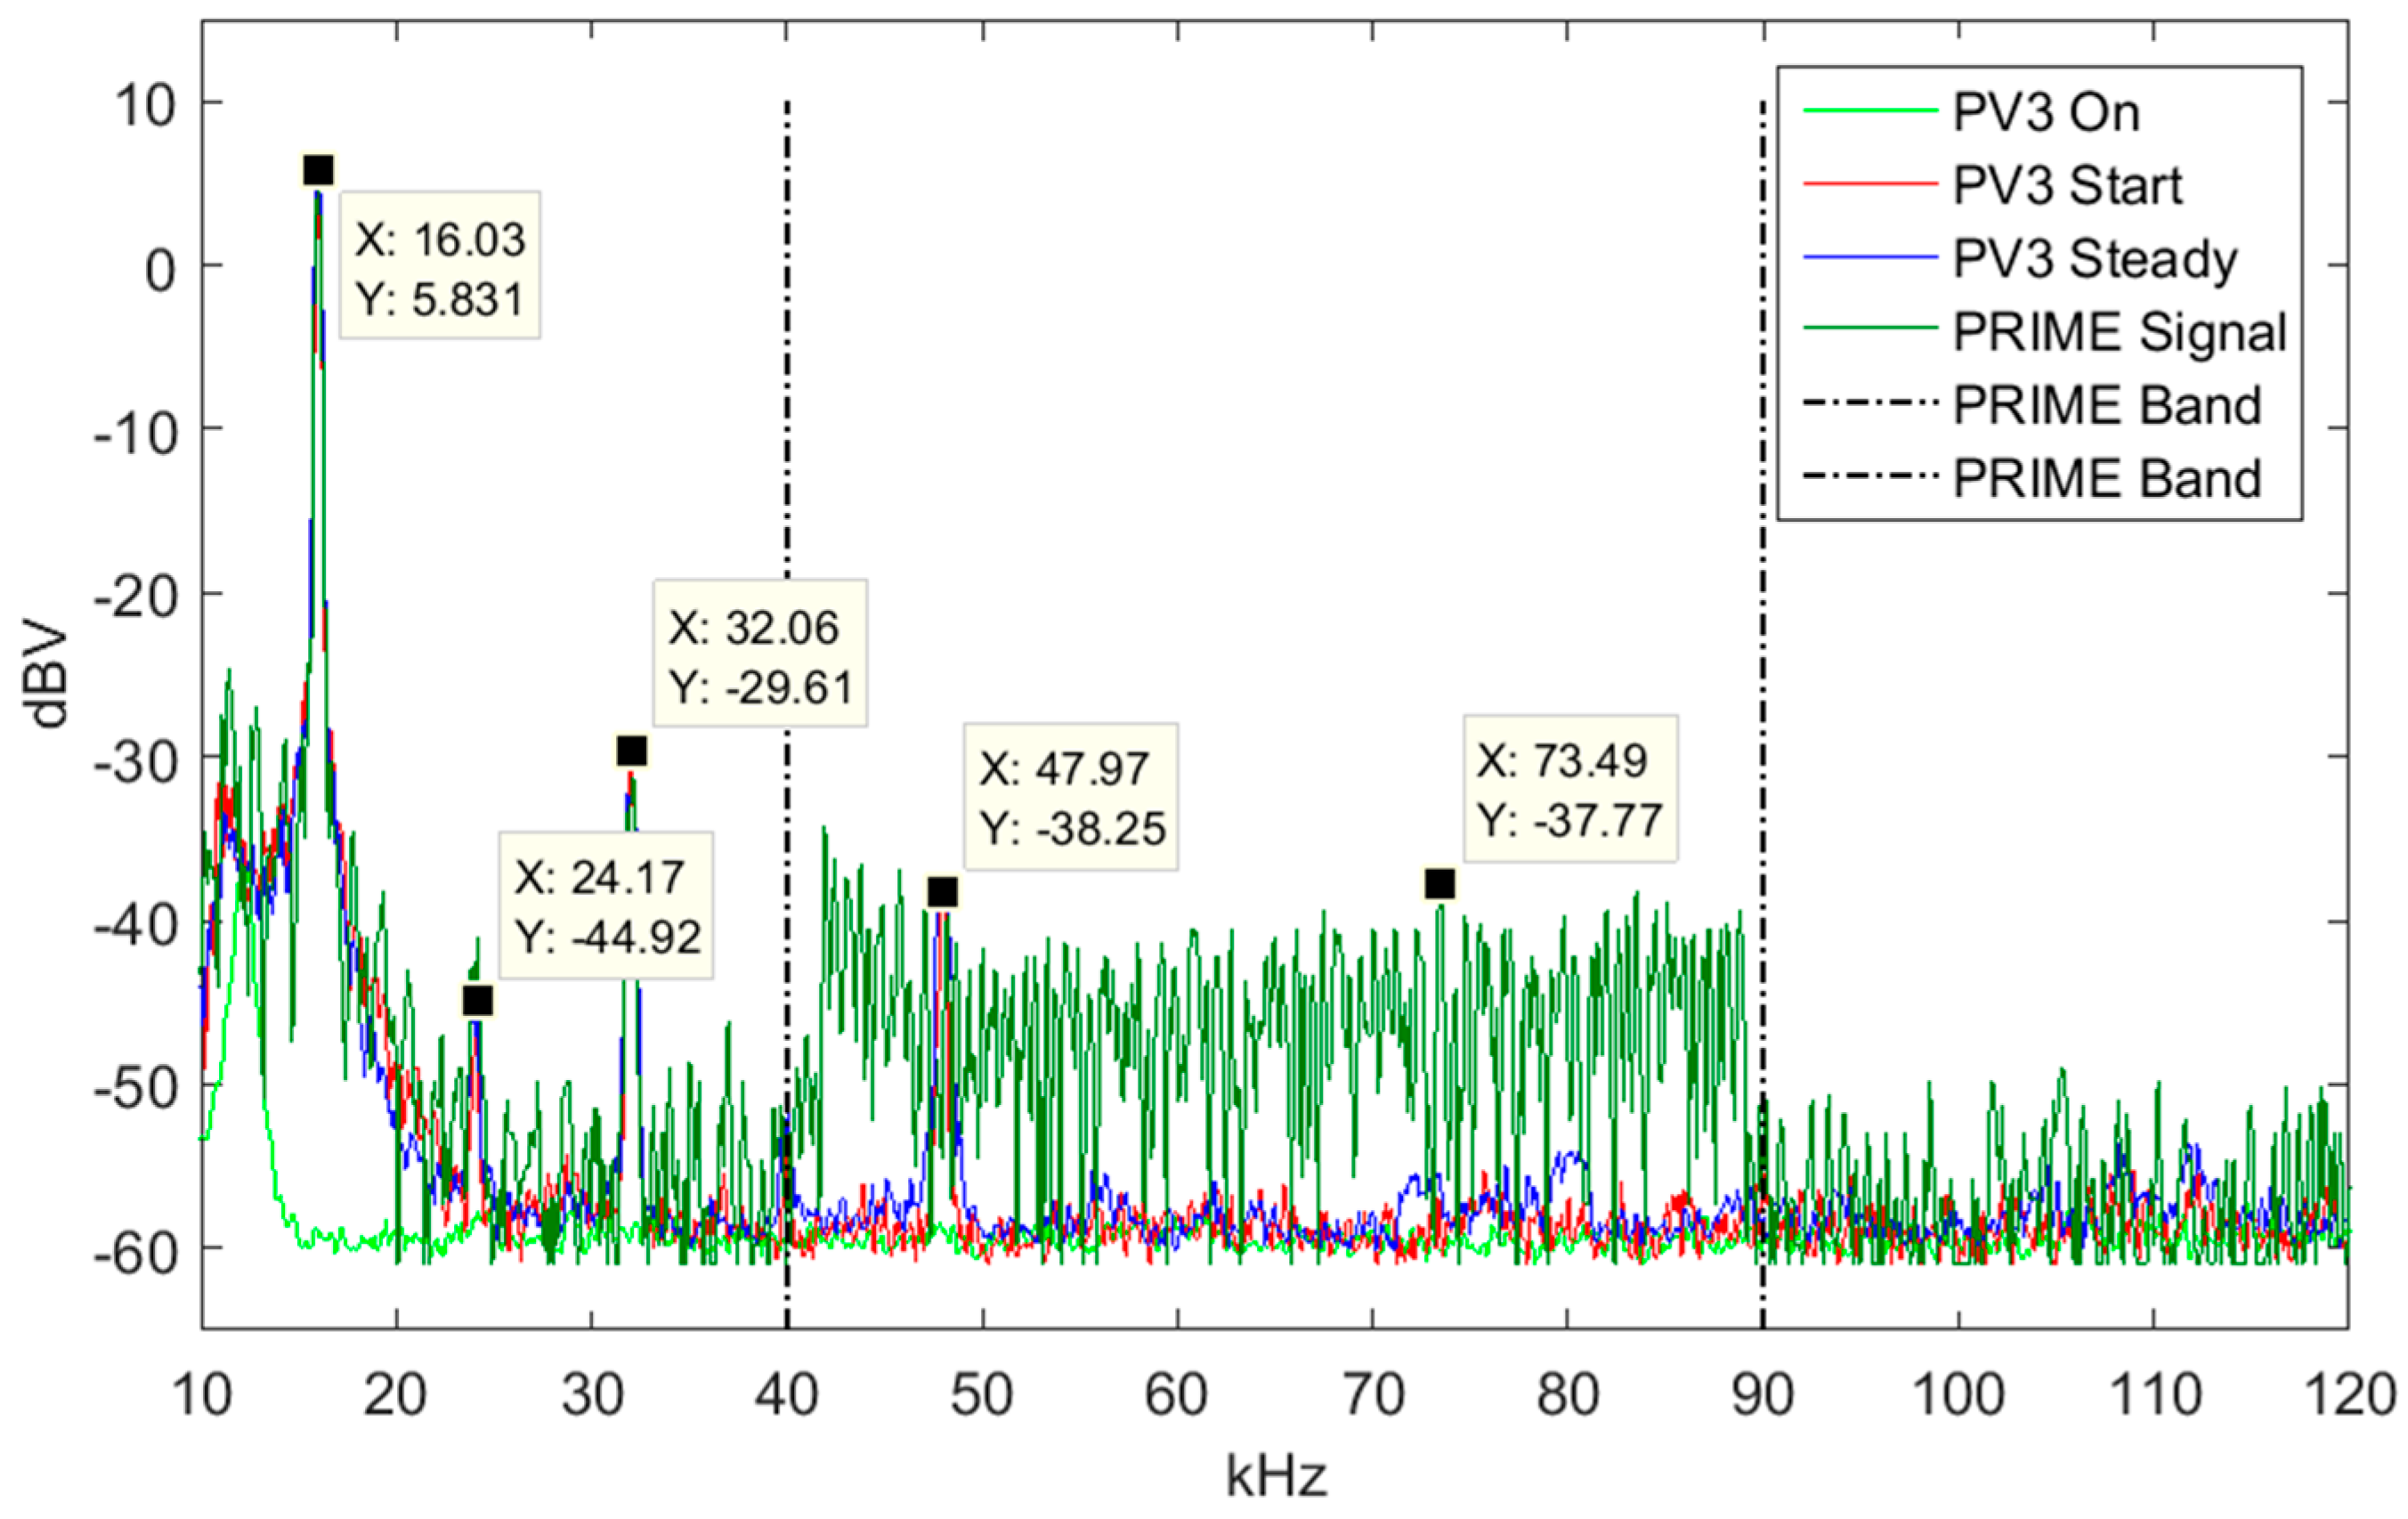
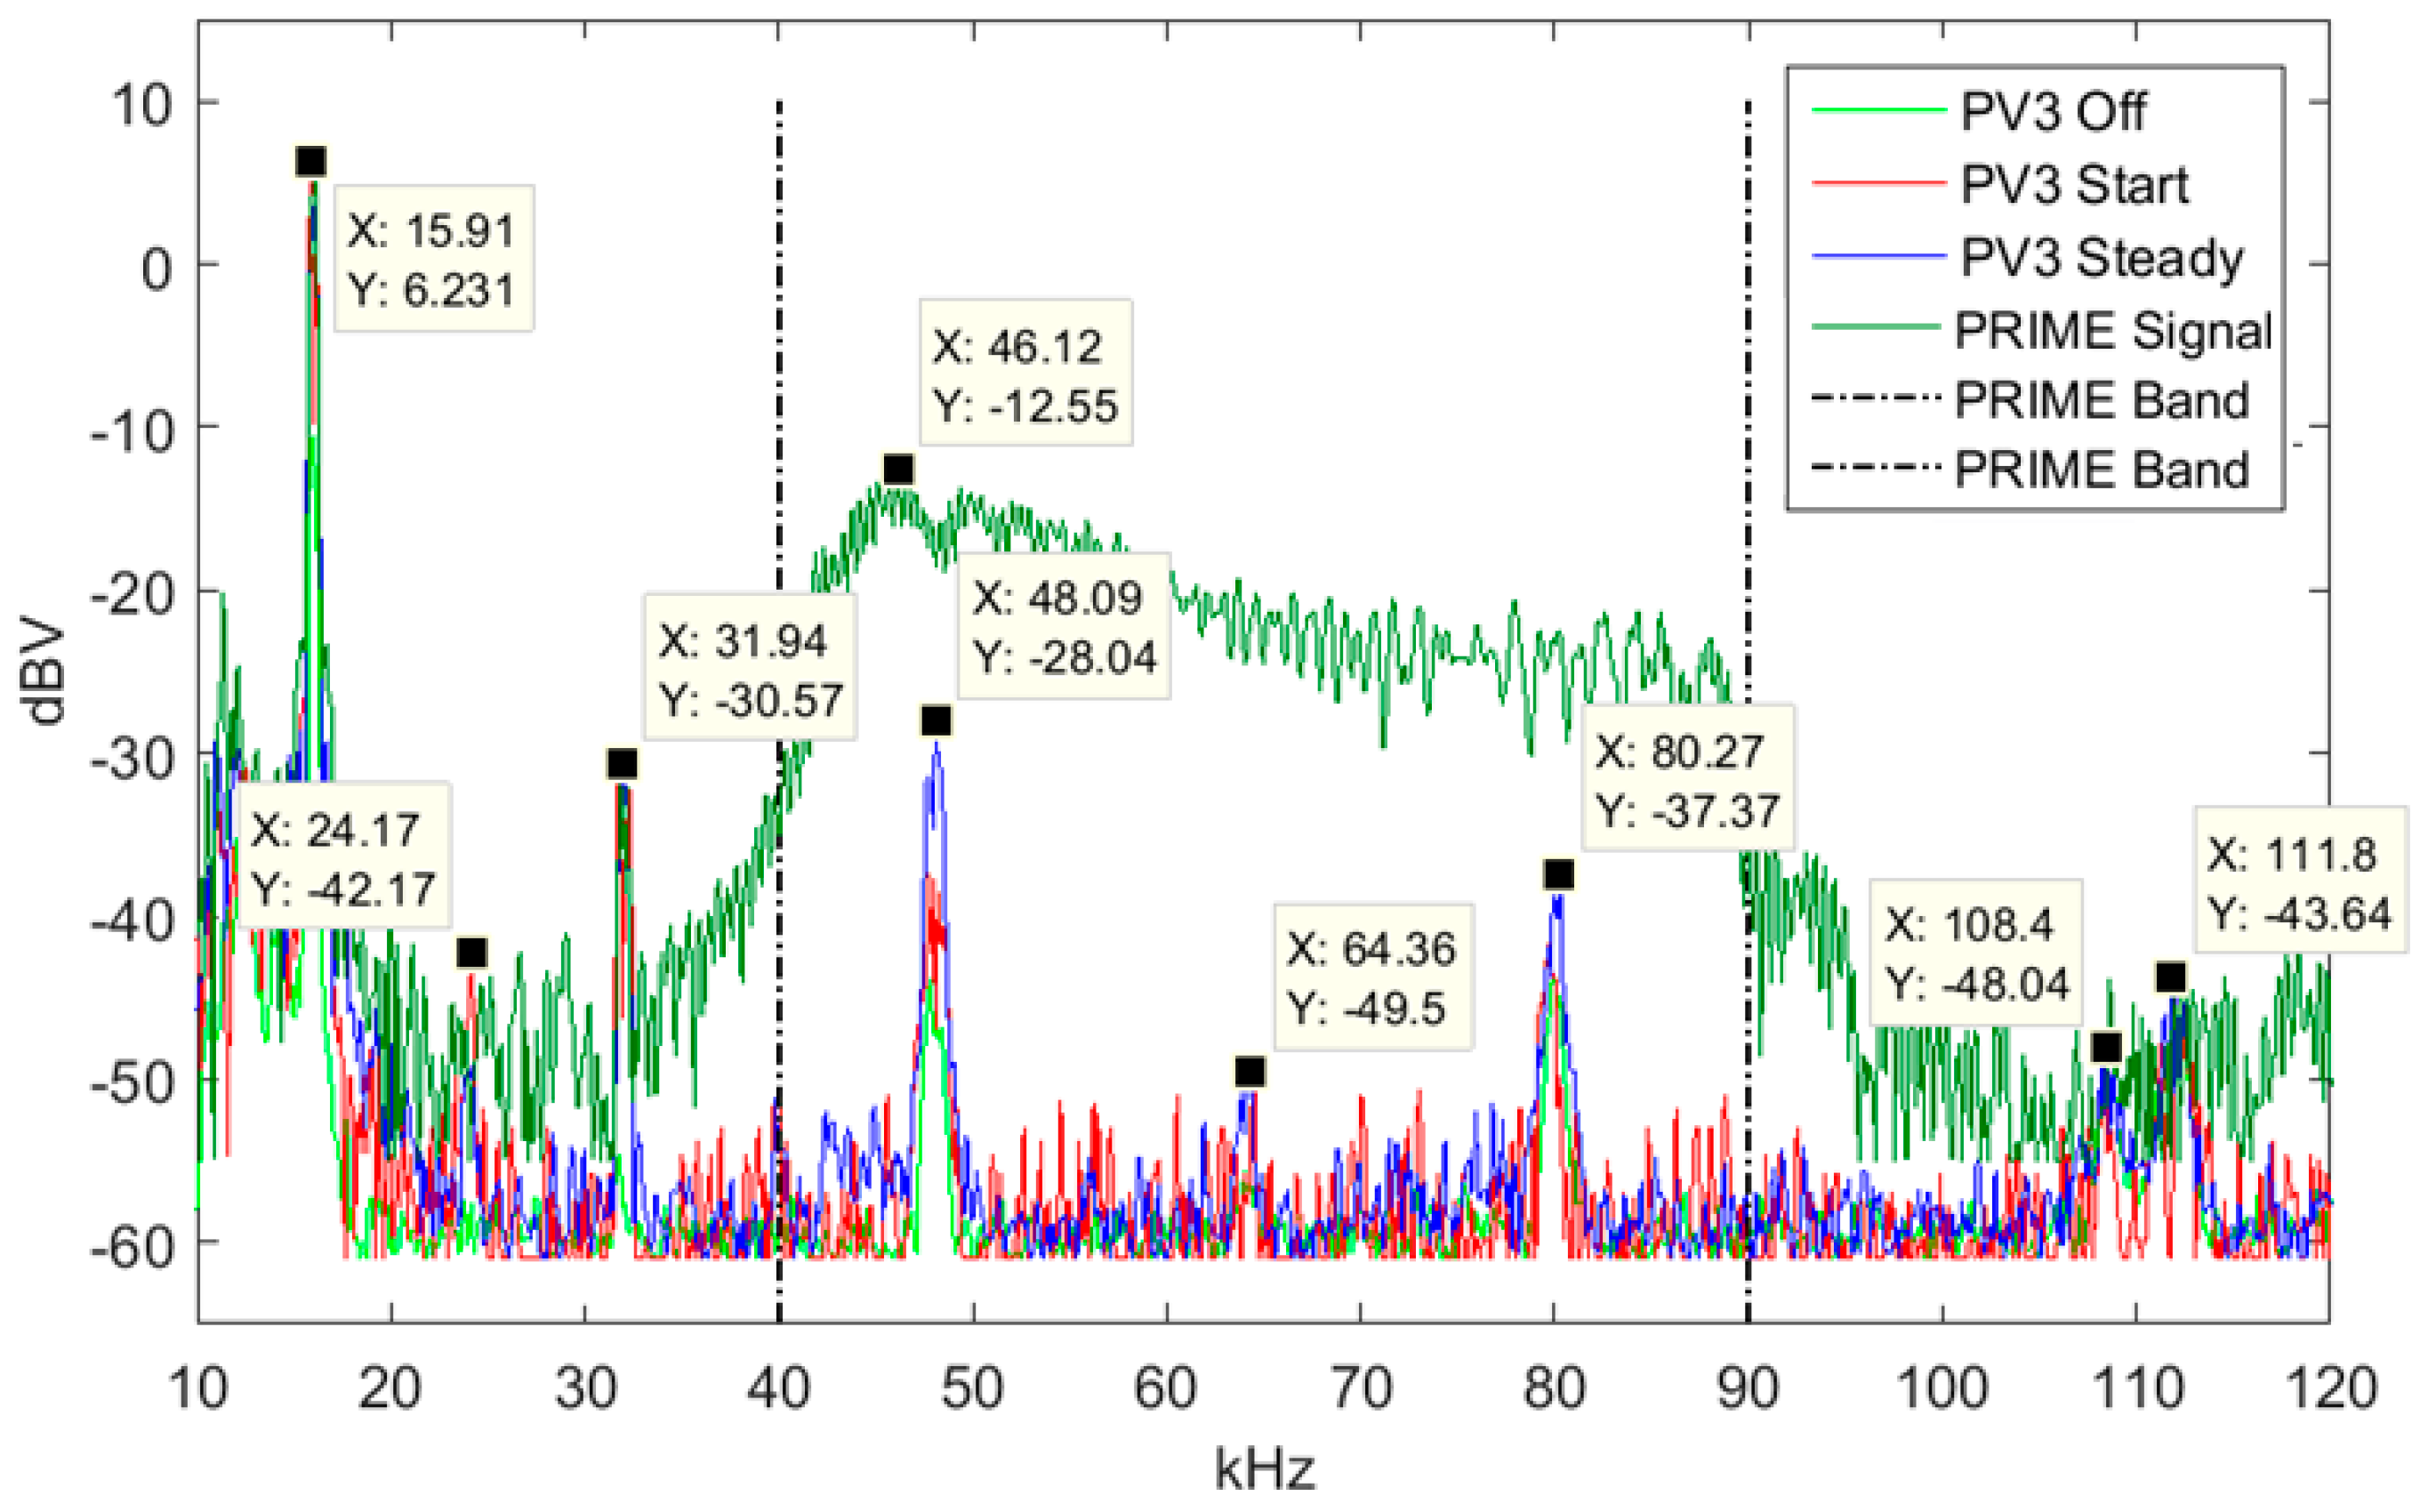
5.5.3. PV3
6. Influence of Distributed Energy Resources in Narrow-Band Power Line Communications
6.1. Hydropower Turbine Smart Meter
6.2. Hydropower Pump Smart Meter
6.3. Three-Phased PV4 Inverter Smart Meter
6.4. Battery Charger Smart Meter
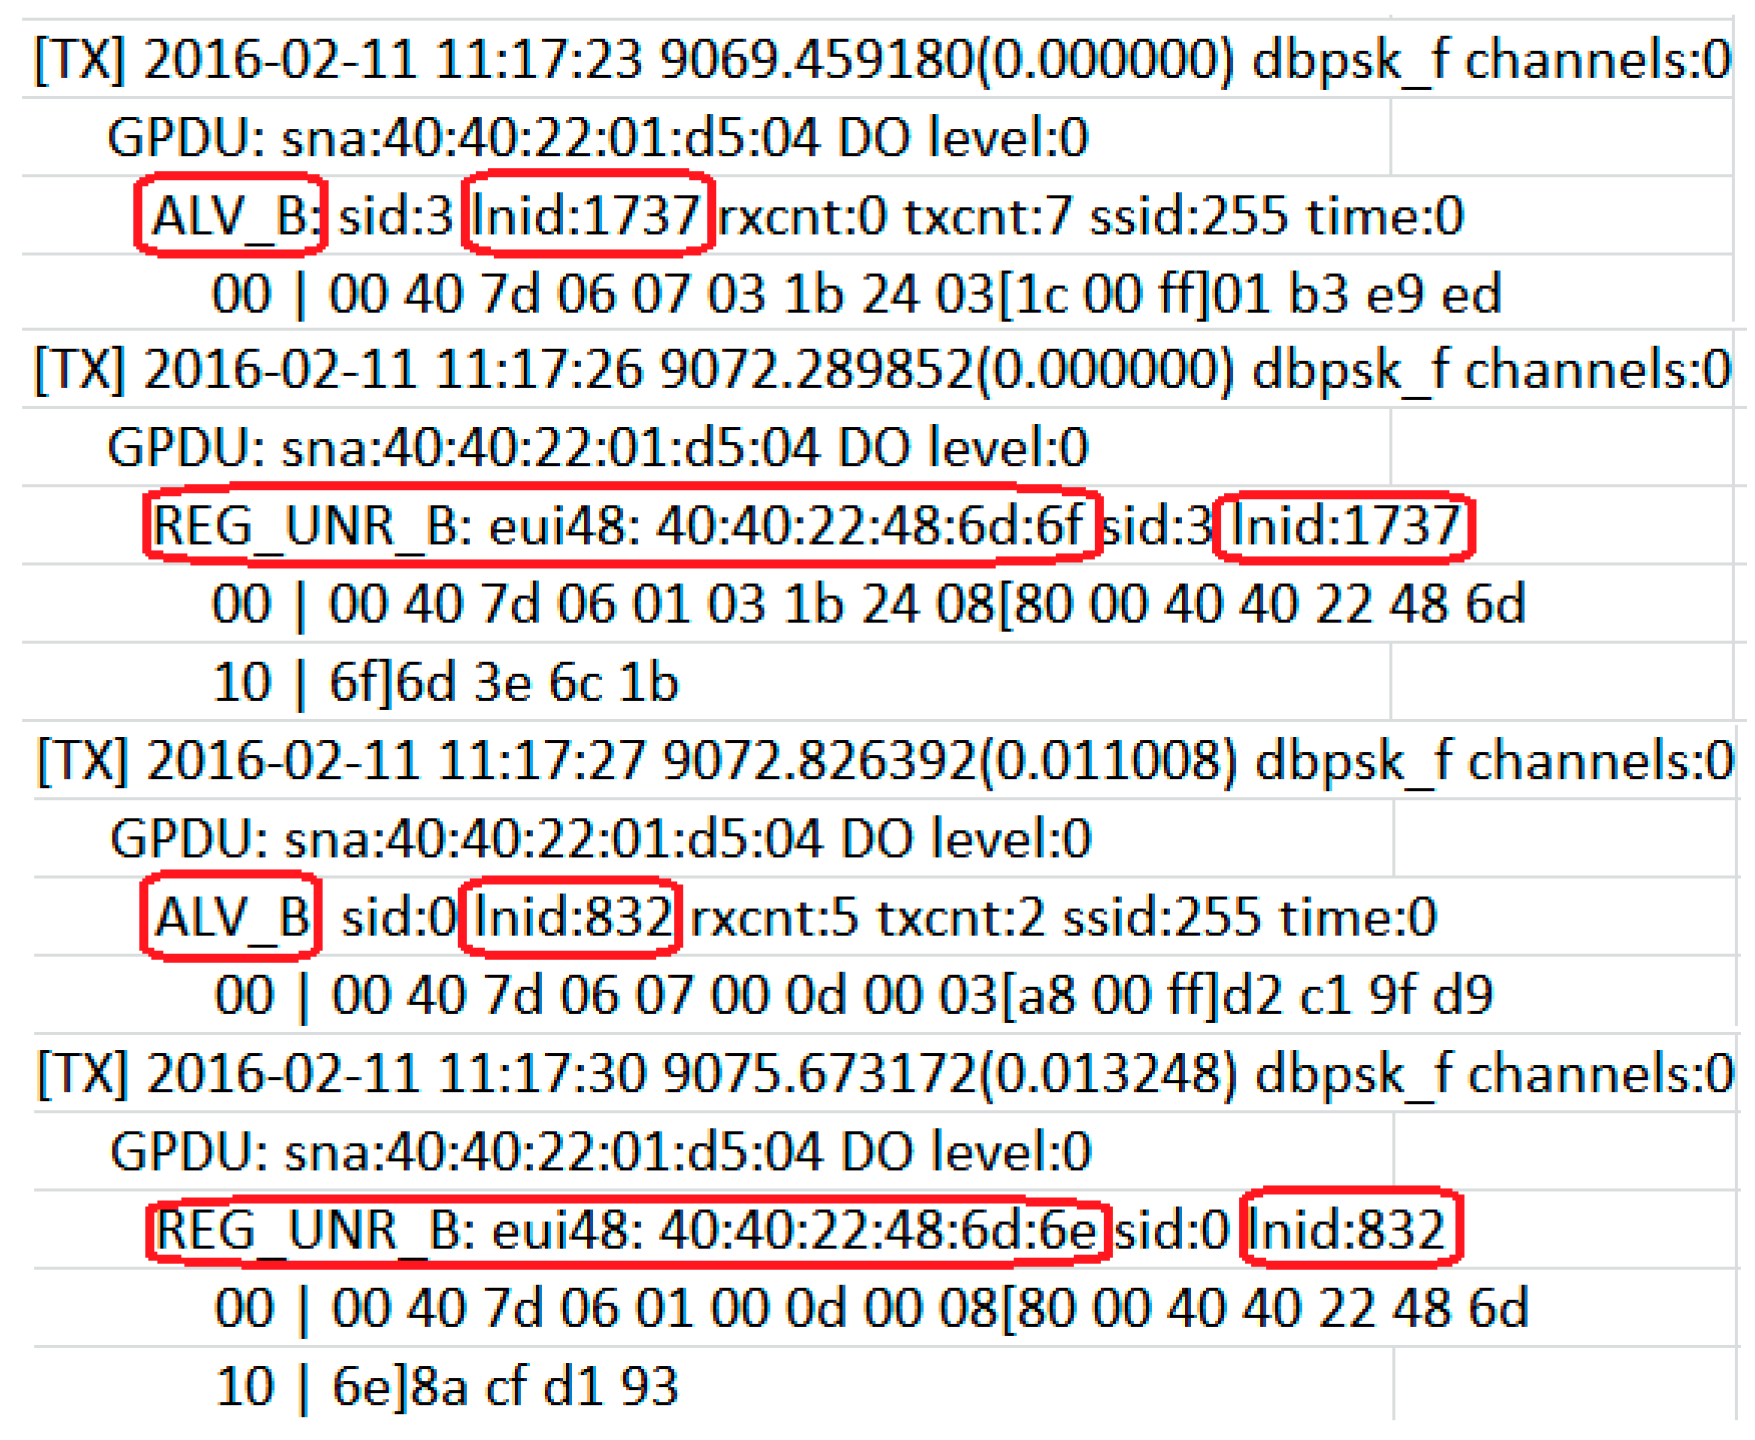
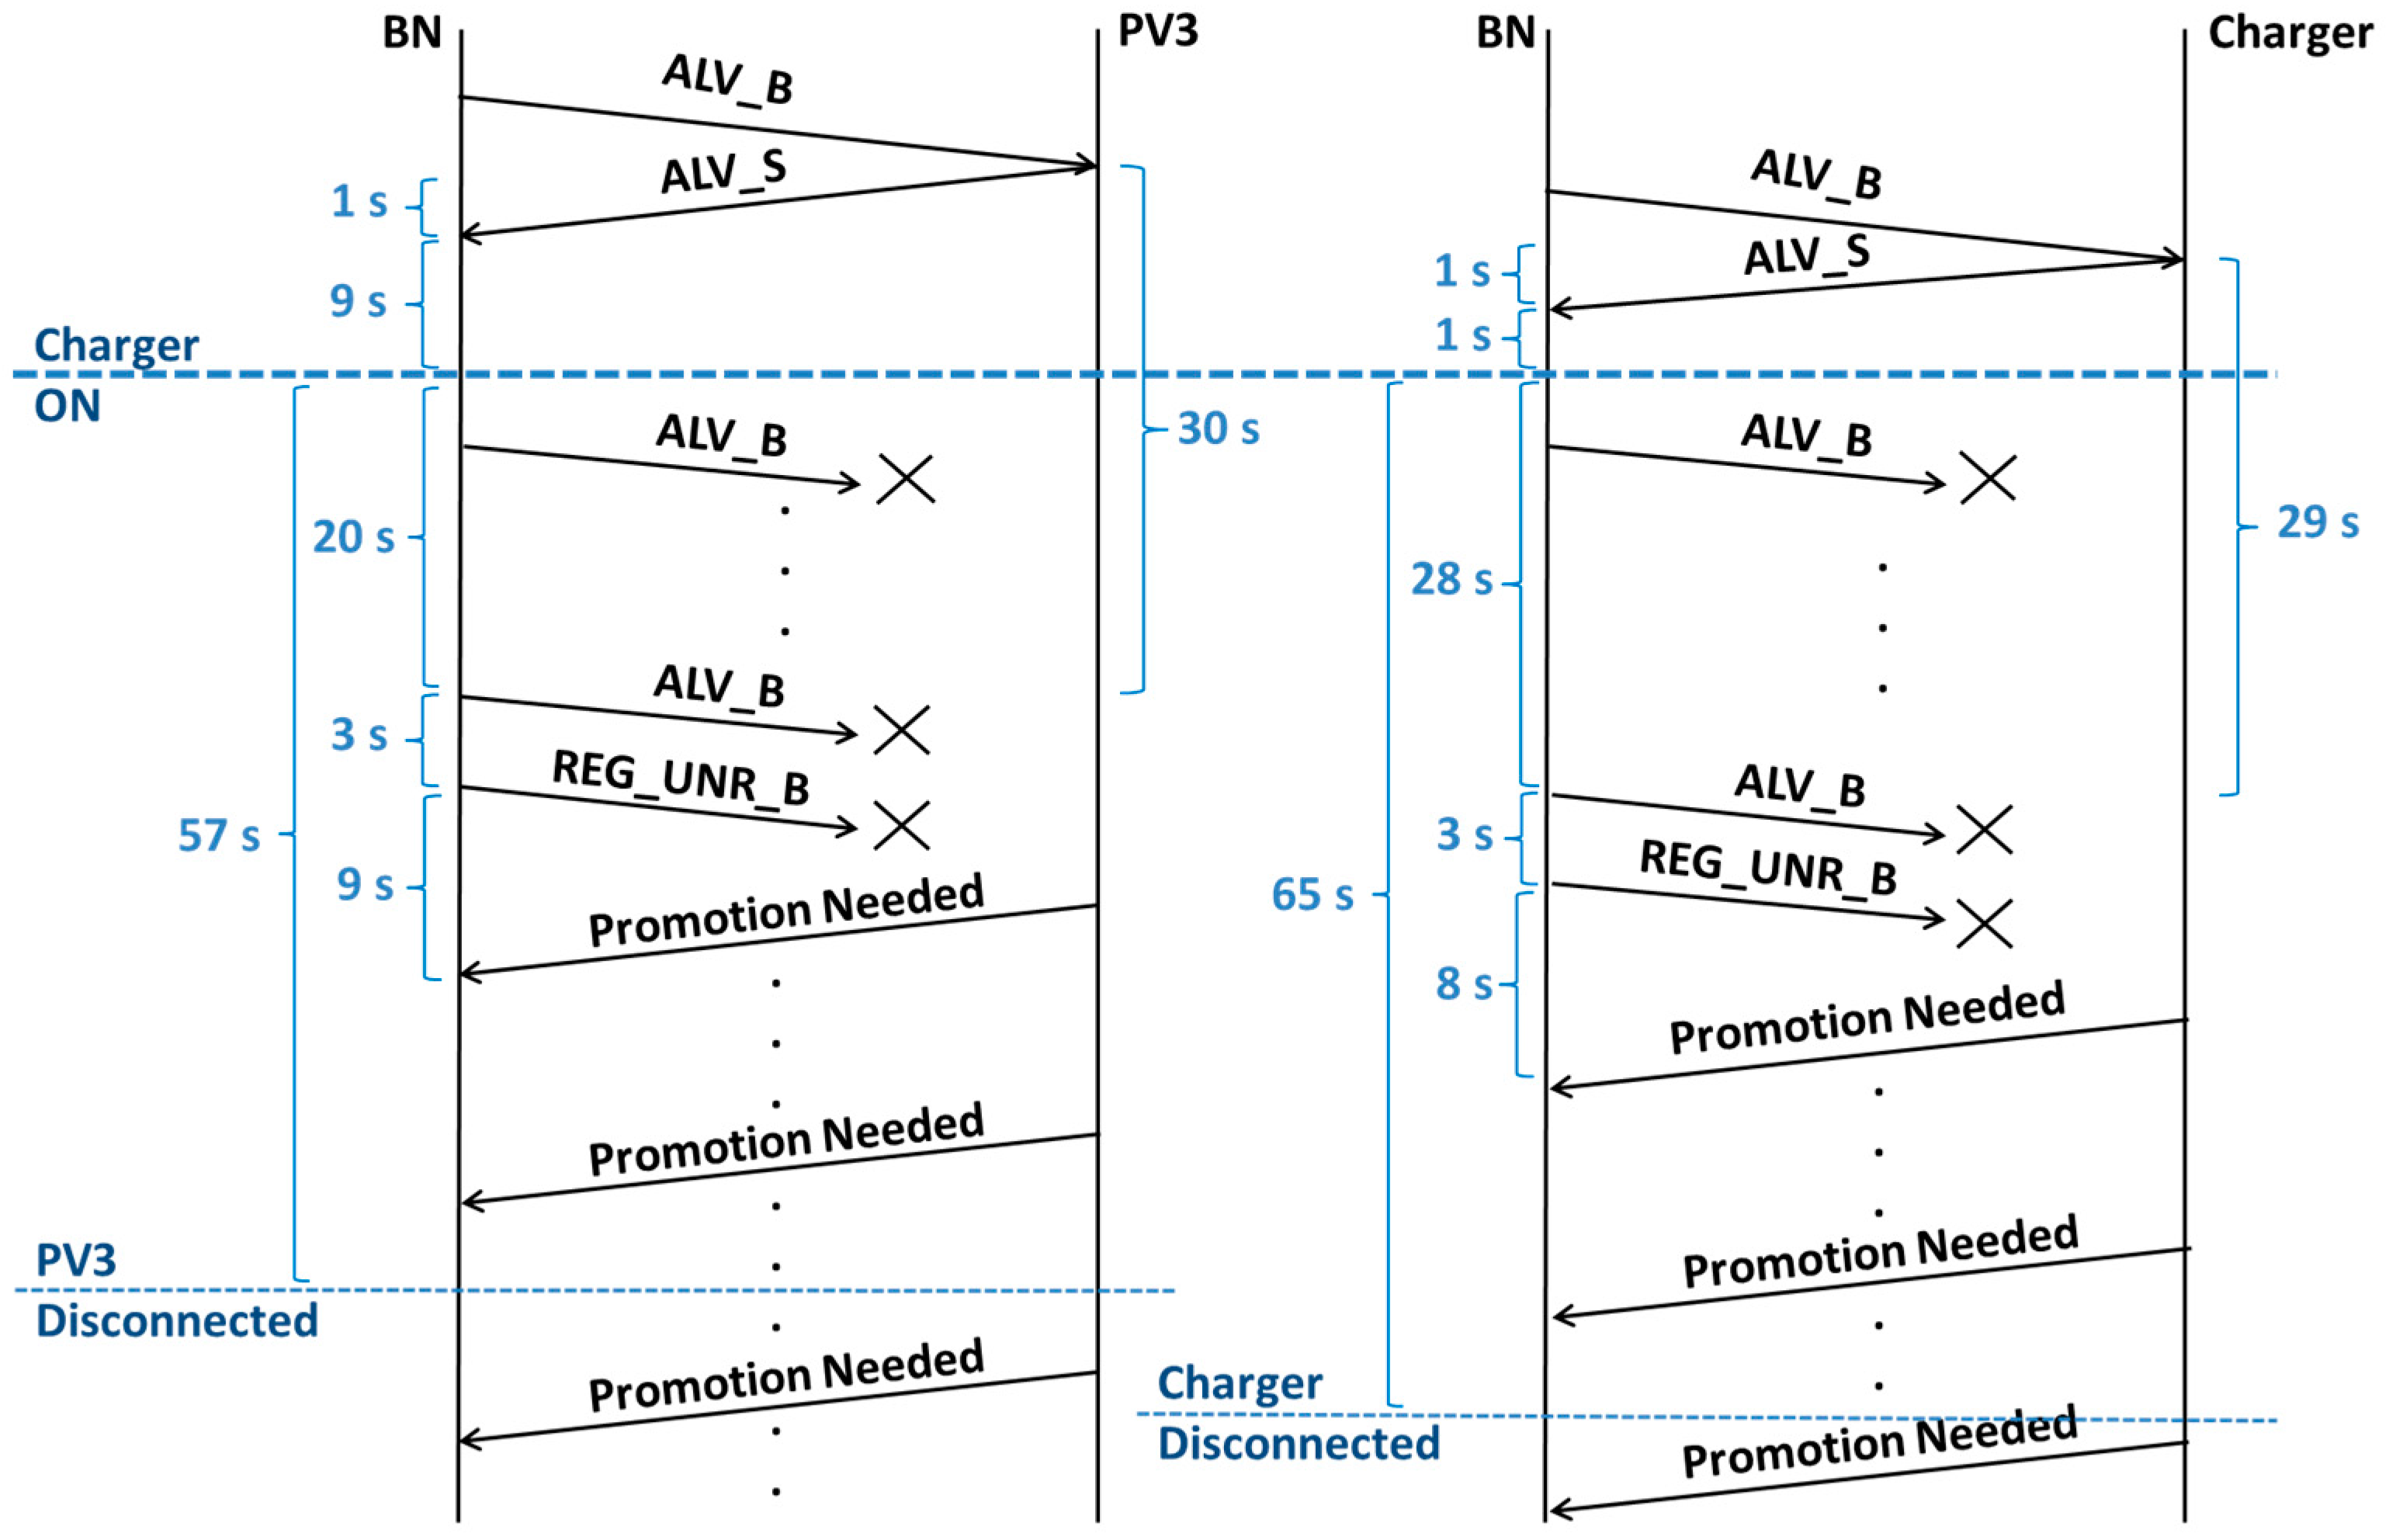
Medium Access Control Traffic Analysis
6.5. Single-Phased Photovoltaic Inverters
6.5.1. PV1
6.5.2. PV2
6.5.3. PV3
7. Discussion
- Influence of secondary emissions: the coverage level of a SN may be affected not only by its associated DER but also by surrounding emitting devices, referred to as secondary emission, as seen in the hydro-system branch. The combination of all the emitting devices affected the coverage levels of most of the SNs within the same electrical branch.
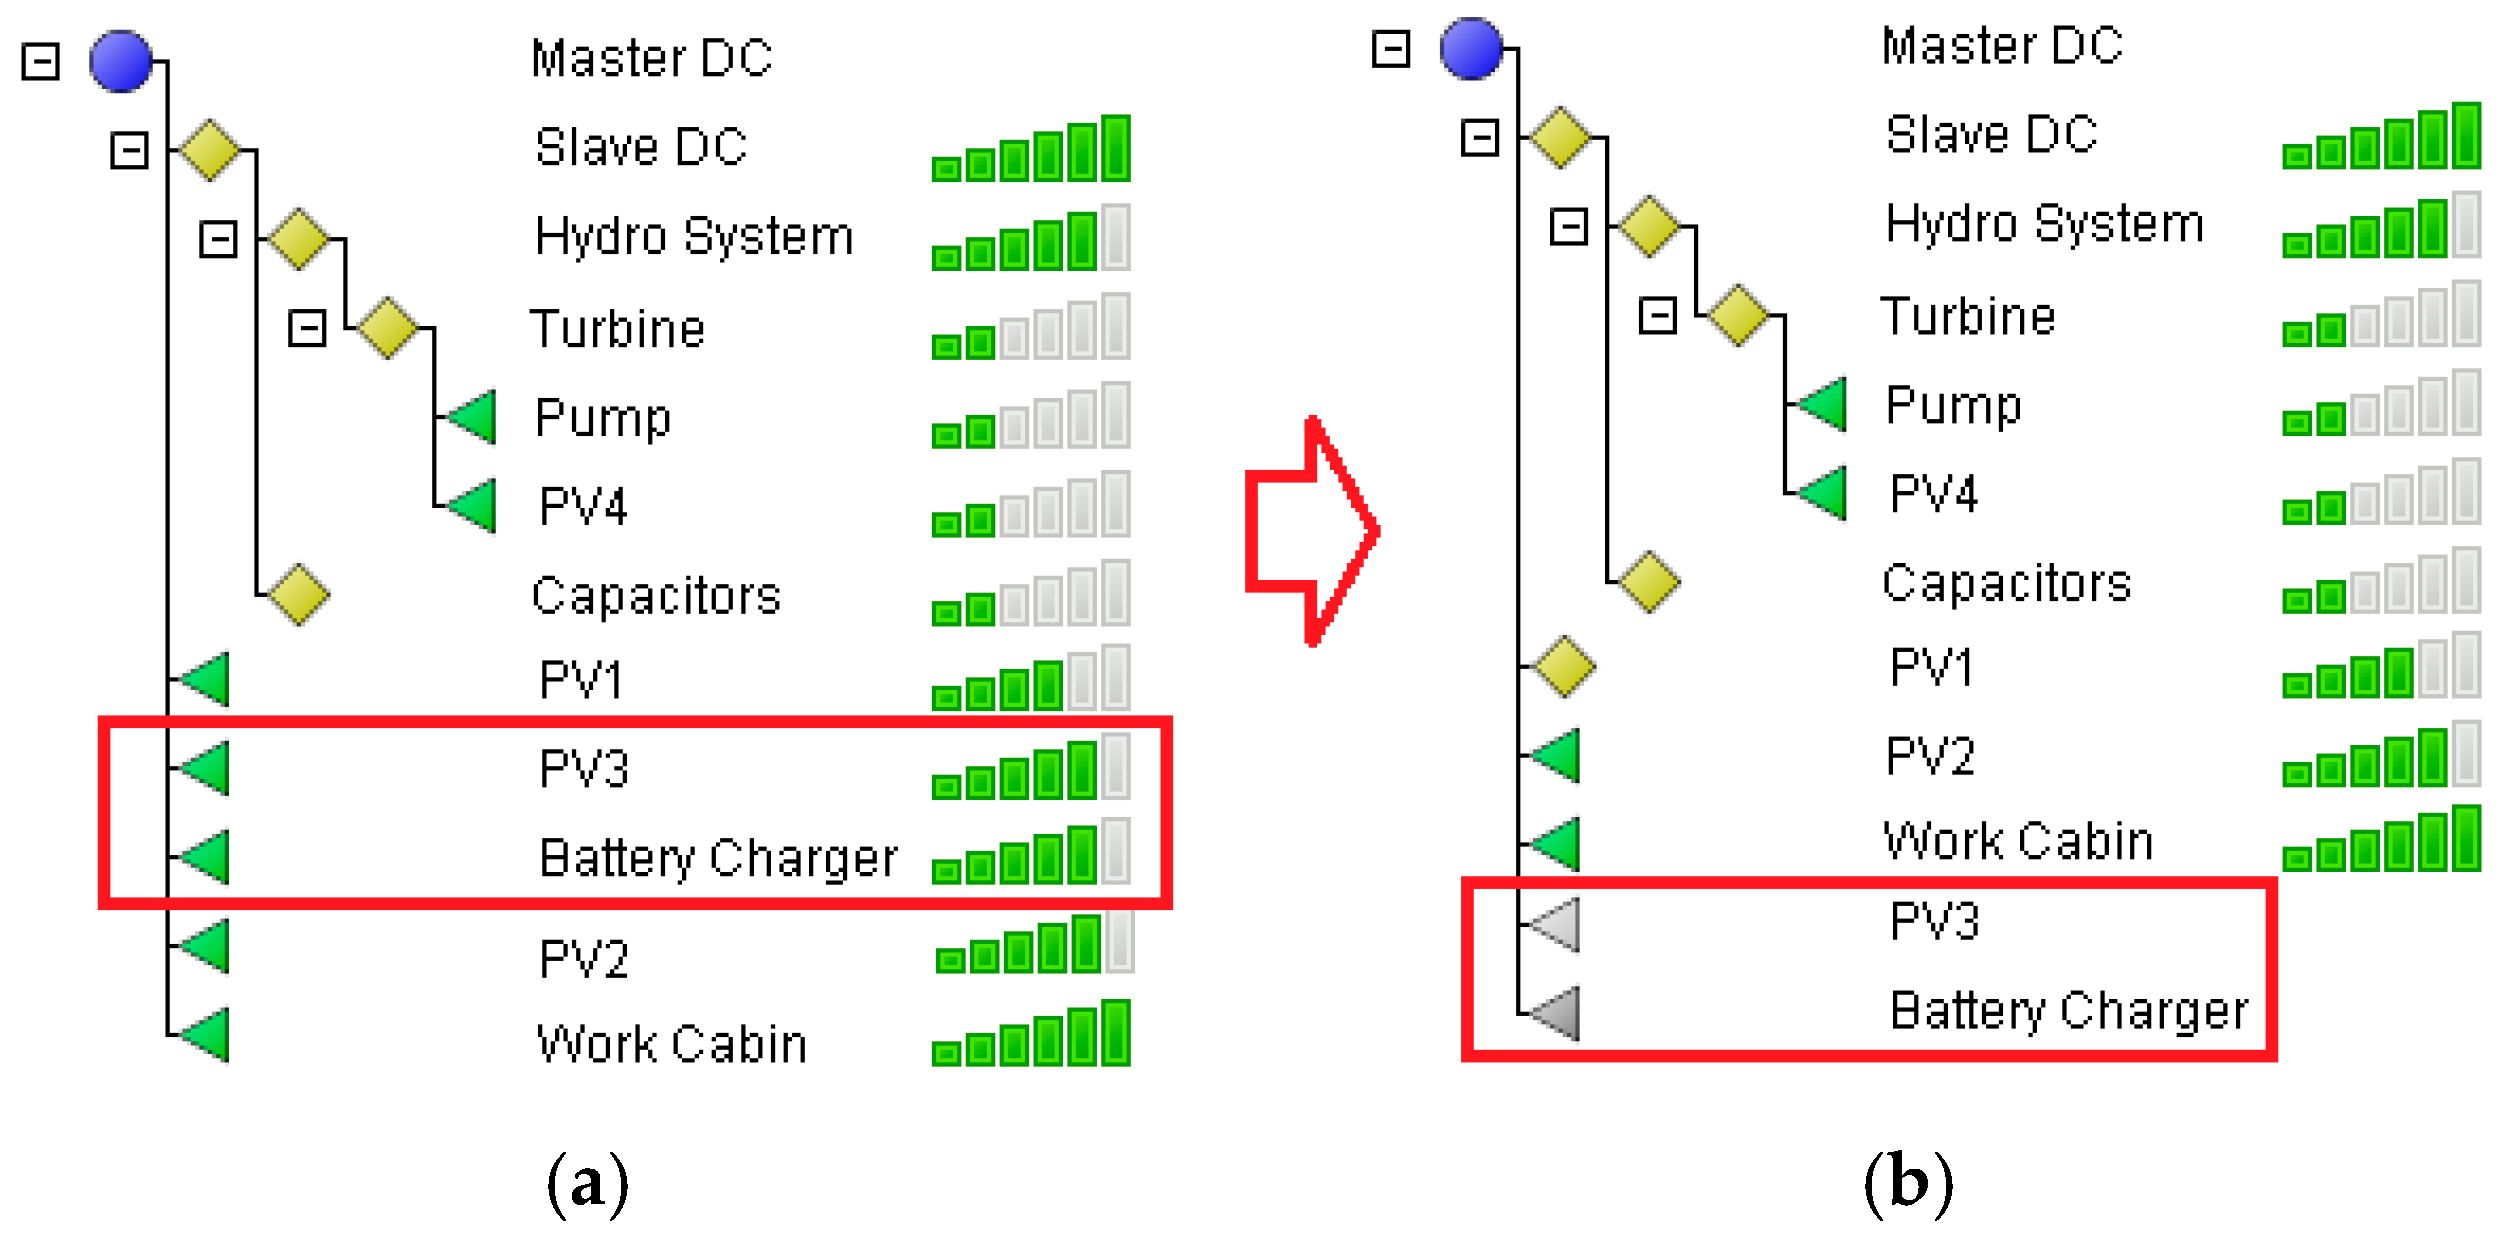
- Subnetwork topology reconfiguration: in some cases, the disturbances are faced by changes in topology, as showed in Subsection 6.2—Hydro Pump. The switch of Pump SN, whose coverage decreased due to the influence of surrounding DERs, changed to a more robust SN acting as switch. In the worst case, an emitting DER can affect the SN of a neighbour device to the point of cancelling its communications (Subsection 6.4—Battery Charger). As explained in the MAC analysis and despite all the Promotion needed requests from both the PV3 and Charger SNs, there were not changes in topology able to reconnect them to the subnetwork while the charger was working. Therefore, SNs remained inaccessible until the charger was switched off again.
- Propagation of the emissions: the influence of a single-phased DER, such as the battery charger, might also affect the coverage level of the SNs located in different electrical phases, as seen in Subsection 6.5—PV Inverters. The coverage levels of both PV1’s and PV2’s SNs decreased during charger’s operation, but that was not the case during isolated performance of the PV inverters.
- Despite an emission may not be harmful enough to block the access to a SN, it can cause changes in the topology that can isolate existing SNs. Additionally, if the blocked SN was acting as a switch, all its dependent SNs may result inaccessible as well. This is especially crucial in microgrids with a large number of DERs, regardless of their extent, since the joint action of all the emissions might block SNs.
- The influence of noise in communications goes beyond changes in topology or SN’s coverage level and accessibility, since it also affects data traffic. Firstly, disturbances can affect data packets by corrupting or cancelling them. In either case, a retransmission will be required. Secondly, the increase of data traffic (either due to changes in topology, retransmissions or both) affect the overall performance of the subnetwork since the available bandwidth is reduced. A direct consequence of the higher data traffic is the increase of the packets collision, which in turn translates into more lost data and packet retransmissions. If non-crucial data is lost, its retransmission may solve the inconvenience. In the worst case, lost data may lead to microgrid instability if control packets are affected. In these scenarios, the self-healing capabilities of the communication network will play a key role since they must be designed to overcome those problems.
- Major functionalities of microgrids such as monitoring and controlling implement a communication system. Consequently, the disturbances affecting communications may also affect them. For instance, controlling actions over a specific SN may not be possible if it is inaccessible due to surrounding emissions. This fact highlights the importance of addressing noise disturbances in microgrids.
8. Conclusions
Acknowledgments
Author Contributions
Conflicts of Interest
References
- Laverty, D.M.; Morrow, D.J.; Best, D.J.; Crossley, P.A. Telecommunications for smart grid: Backhaul solutions for the distribution network. In Proceedings of the Power and Energy Society General Meeting, Minneapolis, MN, USA, 25–29 July 2010; pp. 1–6.
- Uribe-Pérez, N.; Hernández, L.; de la Vega, D.; Angulo, I. State of the Art and Trends Review of Smart Metering in Electricity Grids. Appl. Sci. 2016, 6. [Google Scholar] [CrossRef]
- Yoon, S.; Jang, S.; Kim, Y.; Bahk, S. Opportunistic Routing for Smart Grid With Power Line Communication Access Networks. IEEE Trans. Smart Grids 2014, 5, 303–311. [Google Scholar] [CrossRef]
- Bollen, M.H.J.; Rönnberg, S.; Zavoda, F. CIGRE/CIRED C4.24—Power quality in the future grid—First introduction. In Proceedings of the Great Lakes Symposium on Smart Grids, Chicago, IL, USA, 22–25 September 2014.
- CENELEC. CLC/SC205A Study Report on Electromagnetic Interference between Electrical Equipment/Systems in the Frequency Range below 150 kHz, Edition 3. Available online: http://www.kigeit.org.pl/FTP/bu/grse/repozytorium/tc210_sec0898_inf_(clc-sc205a_study_report_ed3).pdf (accessed on 25 November 2016).
- Galli, S.; Scaglione, A.; Wang, Z. For the grid and through the grid: The role of power line communications in the smart grid. Proc. IEEE 2011, 99, 998–1027. [Google Scholar] [CrossRef]
- Rönnberg, S.; Bollen, M.H.J. Measurements of primary and secondary emission in the supraharmonic frequency range 2–150 kHz. In Proceedings of the CIRED 23rd International Conference and Exhibition on Electricity Distribution, Lyon, France, 15–18 June 2015.
- Moreno-Muñoz, A.; Gil-de-Castro, A.; Rönnberg, S.; Bollen, M.; Romero-Cadaval, E. Ongoing work in CIGRE working groups on supraharmonics from power-electronic converters. In Proceedings of the CIRED 23rd International Conference and Exhibition on Electricity Distribution, Lyon, France, 15–18 June 2015.
- Larsson, E.O.A.; Bollen, M.H.J.; Wahlberg, M.G.; Lundmark, M.G.; Ronnberg, S.K. Measurements of high-frequency (2–150 kHz) distortion in low-voltage networks. IEEE Trans. Power Deliv. 2010, 25, 1749–1757. [Google Scholar] [CrossRef]
- Varatharajan, A.; Schoettke, S.; Meyer, J.; Abart, A. Harmonic emission of large PV installations case study of a 1 MW solar campus. In Proceedings of the ICREPQ International Conference on Renewable Energies and Power Quality, Cordoba, Spain, 8–10 April 2014.
- Rönnberg, S.; Wahlberg, M.; Larsson, A.; Bollen, M.; Lundmark, M. Interaction between equipment and power line communication: 9–95 kHz. In Proceedings of the 2009 IEEE Bucharest PowerTech, Bucharest, Romania, 28 June–2 July 2009.
- Leroi, C.; De Jaeger, E. Conducted disturbances in the frequency range 2–150 KHz: Influence of the LV distribution grids. In Proceedings of the CIRED 23rd International Conference and Exhibition on Electricity Distribution, Lyon, France, 15–18 June 2015.
- Knockaert, J. High Frequency Power Quality. CE-ABLE Seminar. Ghent University, 2016. Available online: http://www.emcseminar.eu/sites/default/files/uploads/09.45%20HFPQ%202%20%E2%80%93%20150%20kHz,%20free%20of%20standards,%20but%20not%20free%20of%20troubles%20Jos%20Knockaert.pdf (accessed on 11 July 2016).
- Rönnberg, S.; Bollen, M.; Gil-de-Castro, A. Harmonic Distortion from Energy-Efficient Equipment and Production in the Low-Voltage Network; Research Report; Luleå University of Technology: Luleå, Sweden, 2014. [Google Scholar]
- Rönnberg, S. Emission and Interaction from Domestic Installations in the Low Voltage Electricity Network up to 150 kHz. Ph.D. Thesis, Luleå University of Technology, Luleå, Sweden, 2013. [Google Scholar]
- Rönnberg, S.; Bollen, M.H.J. Emission from four types of LED lamps for frequencies up to 150 kHz. In Proceedings of the 2012 IEEE 15th International Conference on Harmonics and Quality of Power (ICHQP), Hong Kong, China, 17–20 June 2012; pp. 451–456.
- Rönnberg, S.; Bollen, M.; Larsson, A. Grid impact from PV-installations in northern Scandinavia. In Proceedings of the CIRED 22nd International Conference on Electricity Distribution, Stockholm, Sweden, 10–13 June 2013.
- Rönnberg, S. Power Line Communication and Customer Equipment. Licentiate Thesis, Luleå University of Technology, Luleå, Sweden, 2011. [Google Scholar]
- Nejadpak, A.; Sarikhani, A.; Mohammed, O.A. Analysis of radiated EMI and noise propagation in three-phase inverter system operating under different switching patterns. IEEE Trans. Magn. 2013, 49, 5, 2213–2216. [Google Scholar] [CrossRef]
- Rönnberg, S.; Bollen, M.; Larsson, A. Emission from small scale PV-installations on the low voltage grid. In Proceedings of the International Conference on Renewable Energy and Power Quality (ICREP’14), Córdoba, Spain, 8–10 April 2014.
- Meyer, J.; Bollen, M.; Amaris, H.; Blanco, A.M.; de Castro, A.G.; Desmet, J.; Yang, K. Future work on harmonics-some expert opinions Part II-supraharmonics, standards and measurements. In Proceedings of the 16th International Conference on Harmonics and Quality of Power (ICHQP), Bucharest, Romania, 25–28 May 2014; pp. 909–913.
- Lindberg, E.; Anette, A.; Urban, A. Power Quality Analysis of a 110 MW Wind Farm in a 130 kV Switchyard. Elforsk Report. 2012. Available online: http://www.elforsk.se/Global/Vindforsk/Rapporter%20VFIII/13_13_report.pdf (accessed on 2 July 2016).
- Schöttke, S.; Meyer, J.; Schegner, P.; Bachmann, S. Emission in the frequency range of 2 kHz to 150 kHz caused by electrical vehicle charging. In Proceedings of the International Symposium on Electromagnetoic Compatibility (EMC Europe), Gothenburg, Sweden, 1–4 September 2014.
- Kotsampopoulos, P.; Rigas, A.; Kirchhof, J.; Messinis, G.; Dimeas, A.; Hatziargyriou, N.; Rogakos, V.; Andreadis, K. EMC issues in the interaction between smart meters and power electronic interfaces. IEEE Trans. Power Deliv. 2016, 99, 1. [Google Scholar] [CrossRef]
- Klatt, M.; Meyer, J.; Schegner, P.; Koch, A.; Myrzik, J.; Körner, C.; Darda, T.; Eberl, G. Emission Levels above 2 kHz. Laboratory results and survey measurements in public low voltage grids. In Proceedings of the CIRED 22nd International Conference on Electricity Distribution, Stockholm, Sweden, 10–13 June 2013.
- Klatt, M.; Meyer, J.; Schegner, P.; Wolf, R.; Wittenberg, B. Filter for the measurement of supraharmonics in public low voltage networks. In Proceedings of the EMC 2015 IEEE International Symposium on Electromagnetic Compatibility, Dresden, Germany, 16–22 August 2015.
- Bartak, G.F.; Abart, A. EMI of emissions in the frequency range 2 kHz–150 kHz. In Proceedings of the CIRED 22nd International Conference on Electricity Distribution, Stockholm, Sweden, 10–13 June 2013.
- Rönnberg, S.; Wahlberg, M.; Bollen, M.; Larsson, A.; Lundmark, C. Measurements of interaction between equipment in the frequency range 9 to 95 kHz. In Proceedings of the CIRED 18th International Conference on Electricity Distribution, Prague, Czech Republic, 8–11 June 2009.
- Rönnberg, S.; Bollen, M.H.J.; Wahlberg, M. Interaction between narrowband power-line communication and End-User equipment. IEEE Trans. Power Deliv. 2011, 26, 2034–2039. [Google Scholar] [CrossRef]
- Bashi, S.M. Effects of high power electronics converters on PLC signals. J. Appl. Sci. 2006, 6, 1888–1891. [Google Scholar]
- Pikkarainen, M.; Vehmasvaara, S.; Siddiqui, B.A.; Pakonen, P.; Verho, P. Interference of touch dimmer lamps due to PLC and other high frequency signals. In Proceedings of the Electric Power Quality and Supply Reliability Conference (PQ), Tartu, Estonia, 11–13 June 2012; pp. 1–6.
- Götz, M.; Rapp, M.; Dostert, K. Power line channel characteristics and their effect on communication system design. IEEE Commun. Mag. 2004, 42, 78–86. [Google Scholar] [CrossRef]
- Guibout, J.G.; García Garino, C.; Fusario, R.J.; Castro-Lechtaler, A.R.; Sevilla, G. Comportamiento de la Tecnología PLC en la Red Eléctrica. In Proceedings of the XIII Congreso Argentino de Ciencias de la Computación, Corrientes, Argentina, 1–5 October 2007.
- Szén, I.; Rácz, E. Use of the Power Line Communication System (PLC) at low voltage (0.4 kV) noisy electrical networks—Introducing a new concept at power quality. In Proceedings of the International Conference on Renewable Energies and Power Quality (ICREPQ), Santiago de Compostela, Spain, 28–30 March 2012.
- Guezgouz, D.; Chariag, D.E.; Raingeaud, Y.; Le Bunetel, J.C. Modeling of electromagnetic interference and PLC transmission for loads shedding in a microgrid. IEEE Trans. Power Electron. 2011, 26, 747–754. [Google Scholar] [CrossRef]
- Patel, S.N.; Robertson, T.; Kientz, J.A.; Reynolds, M.S.; Abowd, G.D. At the flick of a switch: Detecting and classifying unique electrical events on the residential power line. In Proceedings of the International Conference on Ubiquitous Computing, Innsbruck, Austria, 16–19 September 2007; pp. 271–288.
- Barmada, S.; Raugi, M.; Rizzo, R.; Tucci, M. Channel evaluation for power line communication in plug-in electric vehicles. IET Electr. Syst. Transp. 2012, 2, 195–201. [Google Scholar] [CrossRef]
- Panchadcharam, S.; Taylor, G.A.; Pisica, I.; Irving, M.R. Modeling and analysis of noise in power line communication for smart metering. In Proceedings of the 2012 IEEE Power and Energy Society General Meeting, San Diego, CA, USA, 22–26 July 2012; pp. 1–8.
- Korki, M.; Zhang, C.; Vu, H.L. Performance evaluation of PRIME in smart grid. In Proceedings of the IEEE International Conference on Smart Grid Communications (SmartGridComm), Vancouver, BC, Canada, 21–24 October 2013; pp. 21–24, 294–299.
- PRIME Alliance. Draft Standard for Powerline Intelligent Metering Evolution, Version R.1.3.6. Available online: http://www.prime-alliance.org/wp-content/uploads/2013/04/PRIME-Spec_v1.3.6.pdf (accessed on 12 April 2016).
- Uribe-Pérez, N.; Hernández, L.; Gómez, R.; Soria, S.; de la Vega, D.; Angulo, I.; Arzuaga, T.; Gutiérrez, L. Smart management of a distributed generation microgrid through PLC PRIME technology. In Proceedings of the 2015 International Symposium on Smart Electric Distribution Systems and Technologies (EDST), Vienna, Austria, 8–11 September 2015; pp. 374–379.


| Coverage Value | Probability P |
|---|---|
| 1 | 0 < P < 0.5 |
| 2 | 0.5 < P < 0.75 |
| 3 | 0.75 < P < 0.875 |
| 4 | 0.875 < P < 0.9375 |
| 5 | 0.9375 < P < 0.96875 |
| 6 | 0.96875 < P < 1 |
| Type of DER | Features | Configurations |
|---|---|---|
| Hydropower turbine | 60 kW, three-phased | Off/On/Start/Steady |
| Hydropower pump | 18 kW, three-phased | Off/Start/Steady |
| PV1 inverter | 5 kW, single-phased, @ 16 kHz | On/Start/Steady |
| PV2 inverter | 5 kW, single-phased, @ 16 kHz | On/Start/Steady |
| PV3 inverter | 5 kW, single-phased, @ 16 kHz | On/Start/Steady |
| PV4 inverter | 15 kW, three-phased, @ 16 kHz | On/Start/Steady |
| Battery Charger | 8 kW, single-phased | Off/Stand-by/On |
| Type of DER and Main Features | Spectrum and Effect in PRIME (DER Standalone) | ||
|---|---|---|---|
| Spectrum (10–120 kHz Range) | SN Coverage Level and Disconnection | ||
| Hydropower turbine 60 kW, three-phased | Main injection at 13 kHz | Stable (4–5) | No |
| Hydropower pump 18 kW, three-phased | Coloured noise with decreasing power level | Stable (4) | No |
| PV1 inverter 5 kW, single-phased, 16 kHz | Main injection at switching frequency and two remarkable harmonics | Stable (5–6) | No |
| PV2 inverter 5 kW, single-phased, 16 kHz | Main injection at switching frequency and four remarkable harmonics | Stable (5–6) | No |
| PV3 inverter 5 kW, single-phased, 16 kHz | Main injection at switching frequency and two remarkable harmonics | Stable (5–6) | No |
| PV4 inverter 15 kW, three-phased, 16 kHz | Main injection at switching frequency and two remarkable harmonics | Unstable (3–5) | No |
| Battery Charger 8 kW, single-phased | Main injection at 24 kHz and two remarkable harmonics | Highly affected | Yes |
© 2016 by the authors; licensee MDPI, Basel, Switzerland. This article is an open access article distributed under the terms and conditions of the Creative Commons Attribution (CC-BY) license (http://creativecommons.org/licenses/by/4.0/).
Share and Cite
Uribe-Pérez, N.; Angulo, I.; Hernández-Callejo, L.; Arzuaga, T.; De la Vega, D.; Arrinda, A. Study of Unwanted Emissions in the CENELEC-A Band Generated by Distributed Energy Resources and Their Influence over Narrow Band Power Line Communications. Energies 2016, 9, 1007. https://doi.org/10.3390/en9121007
Uribe-Pérez N, Angulo I, Hernández-Callejo L, Arzuaga T, De la Vega D, Arrinda A. Study of Unwanted Emissions in the CENELEC-A Band Generated by Distributed Energy Resources and Their Influence over Narrow Band Power Line Communications. Energies. 2016; 9(12):1007. https://doi.org/10.3390/en9121007
Chicago/Turabian StyleUribe-Pérez, Noelia, Itziar Angulo, Luis Hernández-Callejo, Txetxu Arzuaga, David De la Vega, and Amaia Arrinda. 2016. "Study of Unwanted Emissions in the CENELEC-A Band Generated by Distributed Energy Resources and Their Influence over Narrow Band Power Line Communications" Energies 9, no. 12: 1007. https://doi.org/10.3390/en9121007