1. Introduction
The ever-increasing demand for clean energy is stimulating the worldwide installation of wind generators to drive our future society. As one of the largest energy consumers, China has its own plan to install more than 150 GW wind power by year 2020 aiming to reduce fossil energy consumption and CO
2 emissions [
1]. However, in China, the wind industry cannot follow the same paths of some developed countries, such as Germany and, Denmark. In these countries, the wind resources are relatively close to the load center, so most of wind power can be consumed locally [
1,
2,
3]. In contrast, the on-shore wind resources in China are mostly concentrated in the developing western provinces, such as Gansu, Xinjiang and Inner Mongolia. The wind power generation is hence quite far away from the load centers located on the eastern coast and there are plenty of technical issues with the transmission of a large amount of wind power over long-distances [
4,
5]. By the end of 2009, more than half of the installed wind power has not been connected to the grid due to the lagging grid infrastructure [
6,
7] and the lack of appropriate grid management systems [
8,
9]. This represents a huge economic waste and impedes the achievement of China’s energy emission reduction targets.
To overcome the above problems, one of the solutions is off-grid technology, which enables high penetration of wind power integrated into an isolated system. The technology is quite attractive for the developing wind industry in China. Because an isolated power system does not require support from an external grid, huge investments for the construction of grid transmission systems can be avoided [
10]. Some other technical issues caused by long-distance transmission can also be avoided, such as voltage instability [
5] and low frequency oscillation [
4], so the wind generation can be consumed locally in the western provinces of China in an effective manner. The off-grid technology is not only valuable for China, but also widely discussed in worldwide research. From the technical aspect, some published literature [
11] has discussed on this topic. It has been verified to be feasible [
11], stable [
12], reliable [
13] and flexible [
14] in theory to integrate high penetration of wind power into diverse isolated systems. From the application aspect, the off-grid technology has also been adopted in some actual power systems. Reference [
15] introduces the applications of off-grid technology on the Canary Islands (Spain). In this study, the integration of high percentage of wind power in the Canaries is demonstrated to be practicable based on both cost and risk analysis results. Reference [
16] discusses the implementation of an isolated system located in the city of Johor Bahru (Malaysia). Seven different configurations are compared in the study and it is concluded that the hybrid energy system of PV/wind/diesel/battery only requires a reasonable investment to replace the original stand-alone diesel system and reduces the emission of CO
2, especially in a high diesel price scenario. A techno-economic assessment is presented in [
17,
18] for an off-grid hybrid generation system located on the north-eastern part of Saudi Arabia. The assessment result demonstrates that the wind-diesel system becomes economically attractive if the carbon tax is taken into account and if diesel prices keep rising. Study [
19] focuses on the electricity supply in the Brazilian Amazon Region. The authors recognize the benefits of isolated systems with wind power integrated in the Amazon Region. The off-grid technology helps to preserve the environment, whilst generating wealth and employment for the region.
In China, the primary industry sector is also the main energy consumer. During the first seven months in 2010, industrial use of electricity was 1.81 trillion kWh. Compared to the same period in 2009, it represents an increase of 22.69%, much higher than that of the tertiary industry consumption (15.39%), and that of household consumption (13.07%) [
20]. Based on the aforementioned literature review, most current off-grid technologies are used for civil applications, the system capacity of which is much lower than that of industry applications. Also, most of the isolated grid is designed based on diesel generators. The start-up, as well as the power ramping rate of diesel generators is faster than that of coal-powered generators, so diesel generators are more capable of compensating wind power fluctuations in an isolated power system [
21]. Considering that China is poor in oil but rich in coal [
22], a wind-coal powered solution would be more suitable for China to address the wind integration issue.
This paper presents an industry project of an isolated power system located in Inner Mongolian province financed by the China Power Investment Corporation, which is one of the five largest generation corporations of China [
23]. Originally, the industry system was powered by coal-fired generators for the electrolysis of aluminum, which has been categorized into the high energy consumption sector of China [
24]. Due to the rapidly rising coal prices, the investor plans to integrate more wind power to control the electrolysis costs. However, the integration of wind power raises several technical and economic issues. One major technical issue, discussed in this paper, is the power balancing of this isolated system. Since the power system is distant from the inter-connected state grid, the system will reach a wind penetration level at around 47%, without any external-grid support. The power balancing of this isolated system should be carefully investigated before the construction of such a system at this high wind penetration level. Another issue is the economic aspect. With present technologies, the construction cost of wind farms is almost twice that of conventional generators [
25]. The profitability of the hybrid wind-coal power system should be examined before the investment in wind generators. This paper hence discusses this economic issue. The methodology adopted is to study the investment profitability by calculating the economic indicators of “internal rate of return” and “payback period”. Through the techno-economical assessment, the isolated system is demonstrated to be both feasible and profitable. The investment will result in higher and cleaner profits from aluminum production using the presented wind-coal technologies.
2. The Industrial Power System and the Local Resources
This section gives a background review on the industrial power system and presents the motivation for the construction of additional generation capacity, as well as the integration of wind power.
2.1. Description of the Current Industry System
The power system is located in Zhahazhuoer (ZHZE), Tongliao (TL) Region, Inner Mongolian (IMo) province, which is one of China’s largest energy producing provinces thanks to its substantial energy resources [
26]. This system is constructed for the power supply of an aluminum electrolysis plant, which was financed by the China Power Investment Corporation in 2006. This aluminum production stimulates the local employment and brings considerable tax-revenues for TL’s government. Therefore, in 2006 this project was regarded as one of the most important industry projects of IMo province [
27]. As of 2010, the aluminum electrolysis load was around 992 MW, and total generation capacity around 1200 MW, as shown in
Table 1.
Table 1.
The load and generator profiles.
Table 1.
The load and generator profiles.
| Load Number | Load Capacity(MW) | Usage | Generator Number | Generator Capacity (MW) |
|---|
| HJL#1 | 350 | Aluminum Electrolysis | HJ#1 | 50 |
| HJL#2 | 440 | Aluminum Electrolysis | HJ#2 | 50 |
| HJLH#1~#3 | 100 | Heat | HJ#3 | 100 |
| HJG#1~#8 | 102 | Auxiliary Power | HJ#4 | 100 |
| | | | HJ#5 | 150 |
| | | | HJ#6 | 150 |
| | | | HJ#7 | 300 |
| | | | HJ#8 | 300 |
| Load in Total (MW) | 992 | | Generation in Total (MW) | 1200 |
From
Table 1, the installed generation capacity is currently enough to satisfy the consumption of aluminum electrolysis and its auxiliary facilities in 2010. However, being one of the most important construction materials, aluminum consumption in China keeps increasing rapidly with the economic bloom. The China Power Investment Corporation hence plans to expand the aluminum production in order to satisfy this ever-growing market. According to the investment blueprint, another aluminum electrolysis plant has been under construction in TL region since 2011. The electrolysis plant to be completed provides an annual production capacity of 350 kton aluminum, but requires an additional 610 MW power supply according to plant specifications. This results in a gap between the power generation and demand, since the load will be increased to 1602 MW, which is much higher than the current generation capacity.
There are three possible solutions to fill the gap between the generation and demand:
2.2. The Coal Resource
In ZHZE County, the amount of opencast coal reserves has been proven to be over 1740 Mton, 945 Mton of which is exploitable. Although ZHZE County is rich in coal, the local government still has set up strict policy regulations on the exploitation of coal mines due to the local environmental protection pressure. The maximum coal production is thus limited at 15 Mton/year to ensure the development of ZHZE County. With this limitation, all of the thermal coal has already been purchased through futures contracts and will be sold in the coal market in pursuit of higher profit. The isolated power system cannot purchase any more thermal coal from the local market.
Although the purchase of thermal coal is limited, low-grade coal, which is not profitable when sold into the market, is allowed to be traded freely. The isolated power system is hence able to purchase low-grade coal from the local market so as to satisfy part of the additional generation demand. However, due to the lower heating value of low-grade coal, power plants require longer coal grinding processes and extra processes in order to enhance the coal combustion, so additional auxiliary power is needed, and then the auxiliary power ratio of low-grade-coal fired power plants is raised from 8.5% to 12% of generator capacity compared with thermal coal fired power plants. This increases the unit generation cost so that low-grade-coal-powered plants are not as economic as thermal-coal-powered plants.
2.3. The Wind Resource
In addition to coal resources, ZHZE is also rich in wind resources, which can be demonstrated according to the measurements recorded by a local anemometer. As shown in
Figure 1, the areas circled by “A→M” and “1→4” are two areas reserved for the potential construction of two wind farms in the future. The anemometer remarked as “#5388” is close to both areas and it records the wind speed at the heights of 10, 30, 50 and 70 m, respectively. The monthly wind speeds of ZHZE are as listed in
Table 2.
Figure 1.
The geographical position of anemometer “5388#”.
Figure 1.
The geographical position of anemometer “5388#”.
Table 2.
The monthly-average wind speed in 2009 as measured by the #5388 anemometer.
Table 2.
The monthly-average wind speed in 2009 as measured by the #5388 anemometer.
| Height | JAN | FEB | MAR | APR | MAY | JUN | JUL | AUG | SEP | OCT | NOV | DEC | Average |
|---|
| 70 m | 8.91 | 8.21 | 8.51 | 7.62 | 7.92 | 7.55 | 5.43 | 6.58 | 7.65 | 6.88 | 8.12 | 8.90 | 7.67 |
| 50 m | 8.50 | 7.94 | 8.50 | 7.50 | 7.73 | 7.47 | 5.38 | 6.51 | 7.54 | 6.86 | 8.07 | 9.40 | 7.59 |
| 30 m | 8.54 | 7.84 | 8.21 | 7.26 | 7.45 | 7.23 | 5.13 | 6.24 | 7.17 | 6.49 | 7.67 | 9.03 | 7.33 |
| 10 m | 7.77 | 7.05 | 7.67 | 6.67 | 6.72 | 6.50 | 4.50 | 5.51 | 6.42 | 5.89 | 7.13 | 8.10 | 6.63 |
According to the measurement, the maximum wind speed is higher than 8 m/s in the winter season, and the minimum wind speed is higher than 6 m/s in the summer season. On average, the annual wind speed is 7.6 m/s, which corresponds to 6th level (“best-quality”) wind according to the “
The wind resource assessment method of wind farms” (GB/T18710-2002) [
29]. The instantaneous wind speed mainly concentrates within the valid wind speed region, which is defined between the cut-in and cut-out wind speed, normally from 3 to 25 m/s for a wind turbine. As shown by the statistical data in
Table 3, there are over 7000 hrs, or 80% duration per year, in which the wind speed at 70 m is within the valid wind speed region. Thus, wind turbines can effectively produce power during most of a year.
Based on the investigation of local wind resource, it is feasible to utilize the local wind power as a main power source for the electrolysis plant. However, since wind is stochastic and intermittent, wind generators harvest energy only when wind is available. Hence, wind farms cannot fully satisfy the load demand in the low wind periods and still cannot solve the problem of generation deficiency. Thus, one practical solution is building additional low-grade-coal-fired power plants to supplement the intermittent wind power.
Table 3.
The duration within the valid wind speed region.
Table 3.
The duration within the valid wind speed region.
| Height | Hours within 3–25 m/s | Hours within 4–25 m/s | Hours within 5–25 m/s |
|---|
| 70 m | 7030 | 6382 | 5776 |
| 50 m | 6938 | 6296 | 5692 |
| 30 m | 6765 | 6168 | 5524 |
| 10 m | 6575 | 6011 | 5406 |
2.4. The Wind-Coal Hybrid Energy System
A wind-coal hybrid system is hence suggested as the final solution for the power supply of the electrolysis plant. The added hybrid system includes two 400 MW wind farms located on the reserved areas shown in
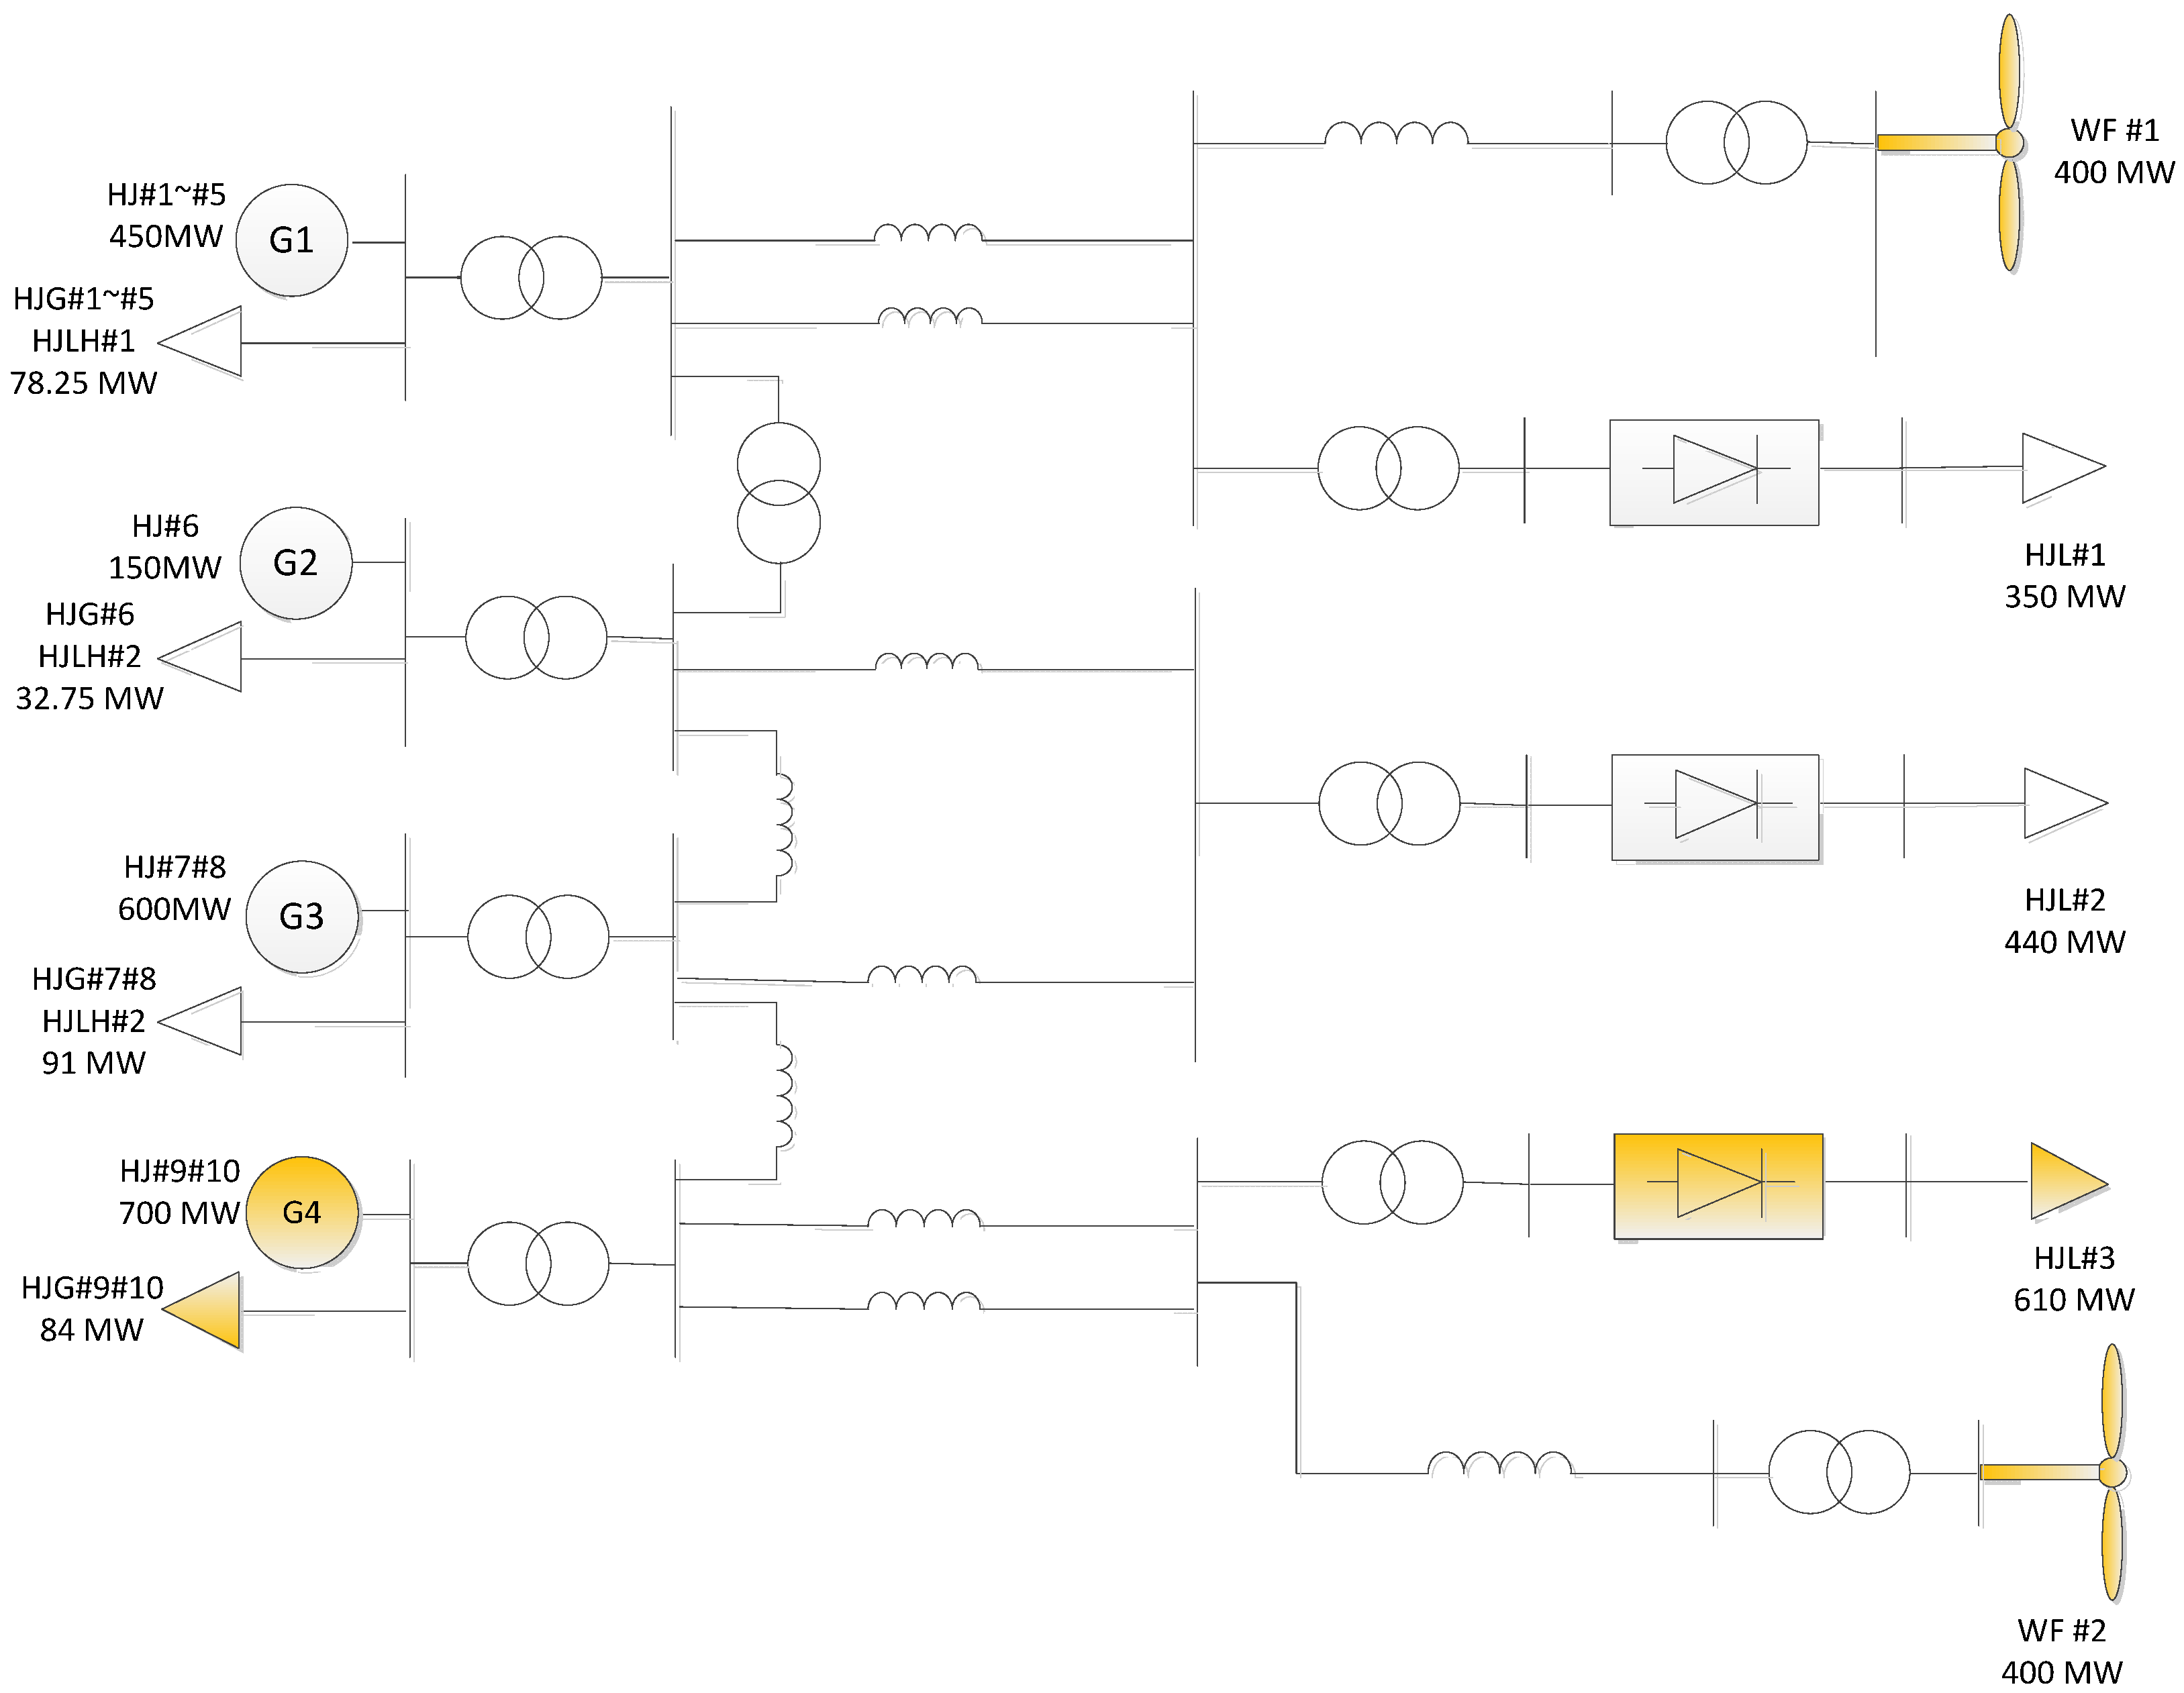
Figure 2 and 2 × 350 MW low-grade-coal-fired power plant as back-up for the intermittent wind generation. This solution is quite attractive for the investor because wind generation might substantially reduce the electrolysis cost considering the zero operational cost of wind. During the low wind period duration, the low-grade coal-fired generation can also fill the generation gap. The structure of this system is as shown in
Figure 2, in which the yellow blocks represent the components added after the system expansion.
Figure 2.
The structure of the isolated power system.
Figure 2.
The structure of the isolated power system.
The characteristics of main components are briefly described as follows:
Coal-fired power plants. There are four coal-powered power plants. G1~G3 are thermal-coal-powered and have already been constructed. The total capacity of G1 which contains five generators HJ#1~HJ#5 is 450 MW. G2 is rated at 150 MW with only one unit, HJ#6. G3 contains two 300 MW generators numbered as HJ#7 and HJ#8 respectively. G4 is a new plant to be built for the expanded aluminum production. It has two generators: HJ#9 and HJ#10, both of which are 350 MW low-grade-coal-fired generators. These four power plants are all controlled by a central dispatch center.
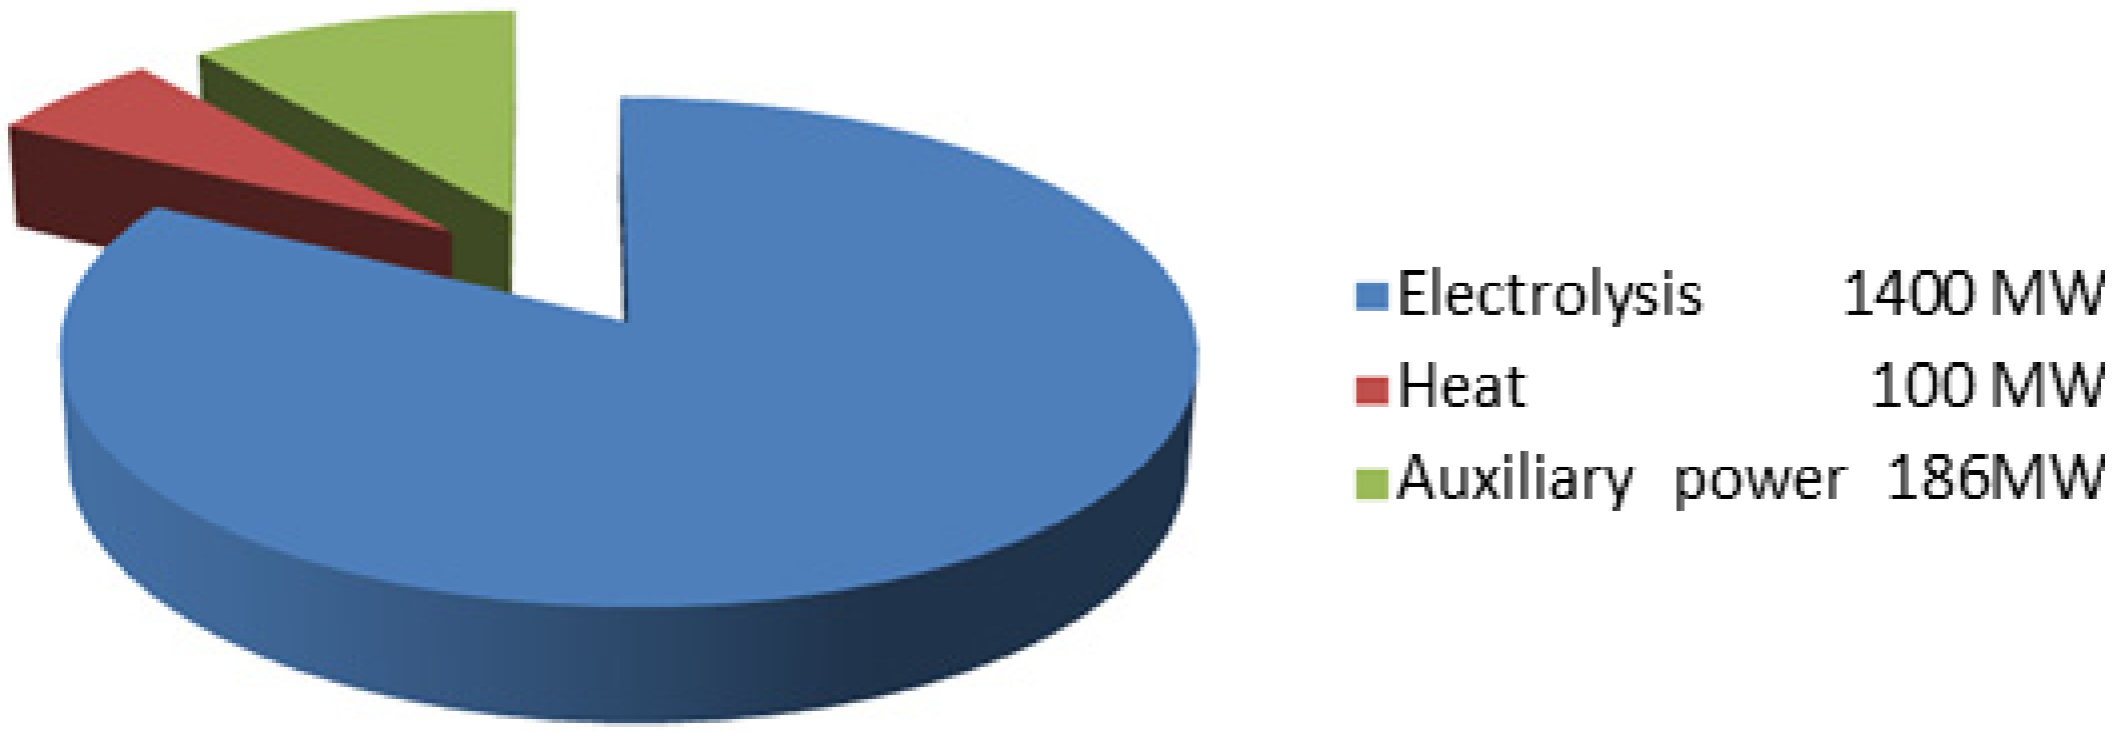
Load. The main load in this system is aluminum electrolysis load, 1400 MW in total. Among them, HJL#1 and HJL#2 have already been constructed and HJL#3 is a new electrolysis plant under construction. The electrolysis plants are driven by DC current so they are connected with the grid through a diode-rectifier. In addition to electrolytic DC load, there are also 100 MW AC heating load and a total of 186 MW auxiliary AC power for the coal-powered power plants. In terms of auxiliary power with respect to the total power plant capacity, the ratio is 8.5% for thermal-coal-fired plants and 12% for low-grade-coal-fired plants respectively.
Wind Farm. Two DFIG-based wind farms are connected to this system. Each of them has 400 MW capacity. They are about to be constructed on the reserved areas as shown in
Figure 1.
After the expansion on both the generation and load sides, the generation capacity will be increased to 1900 MW for coal-powered generators and the overall generation capacity is increased to 2700 MW after the wind generation is taken into account. Theoretically, such a generation capacity is enough to cover the electrolytic DC load of 1400 MW as well as the auxiliary AC load of 286 MW. However, considering the wind-load penetration will be over 800/1686 ≈ 67%, it is technically difficult to integrate such a high percentage of wind power into an isolated power system from the operational aspect. Also, in order to guarantee the investment return, the profitability of this wind-coal hybrid system should be carefully examined from the financial aspect considering the relatively higher investment for the construction of wind farms and the low-grade-coal-fired power plants. These technical and economic issues will be addressed in detail in the next sections.
3. The Technical Demonstration on the Power Balancing of the Isolated System
One major technical issue is how to maintain power balance within this isolated system. Since the power system is distant from the inter-connected state grid, the system will have a wind penetration level over 47%, but without any external-grid support. The power balancing of the proposed isolated system should be carefully investigated. This section hence discusses the technical feasibility of this proposal by analyzing the power balance in some typical meteorological scenarios.
3.1. The Controllability of System Components for Power Balancing
3.1.1. Electrolytic Load
As shown in
Figure 2, the electrolytic load is connected with grid through a diode rectifier and a transformer. It is difficult to control the diode rectifier system to respond to the grid frequency variation, but the rectifier’s DC output voltage can still be adjusted by the transformer tap changer to enable the electrolytic plant to participate in the power balancing control. The secure adjustment region is as low as −10% of rated capacity according to the technical specifications provided by the manufacturer. This means that it is technically safe to reduce the electrolytic load by 1400 × 10% = 140 MW and avoid load shedding.
3.1.2. Heating Load
Heating load is temperature dependent. Normally, the peak consumption of 100 MW occurs in winter, early spring and late autumn. And in summer season, there is no requirement for supplying heat.
3.1.3. Wind Generator
With present technologies, wind generators are still “semi-participants” in power balancing control. It is because wind generators are only able to reduce the power output, but find it difficult to increase the power output due to their aerodynamic limitations [
30]. Therefore, the wind generation becomes the main fluctuation source causing power imbalances in the system.
3.1.4. Coal-Fired Generator
Coal-fired generators have full capacity of participating in the power balancing control. Still, there are two limitations. Firstly, the power output must be within a valid region. The maximum output is the rated capacity and the minimum output of each generator is listed in
Table 4. In total, the minimum power output should be higher than 925 MW if all the coal-powered generators are in service. Secondly, the ramping speed is limited for each generator as shown by
Table 5. Ramping rate represents a unit’s power increasing capability (positive ramping) and the decreasing capability (negative ramping). In this isolated system, the ramping rate of generators should be ensured to be faster than the ramping rate of fluctuation sources, such as the wind power output, in order to keep the system power and load in balance.
Table 4.
The minimum power output of generators.
Table 4.
The minimum power output of generators.
| Power Plants | Generators | Capacity (MW) | Minimum output ratio | Minimum power output (MW) |
|---|
| G1 | HJ#1, HJ#2 | 50 × 2 | 60% | 60 |
| G1 | HJ#3, HJ#4 | 100 × 2 | 60% | 120 |
| G1 | HJ#5 | 150 | 53.3% | 80 |
| G2 | HJ#6 | 150 | 53.3% | 80 |
| G3 | HJ#7, HJ#8 | 300 × 2 | 45% | 270 |
| G4 | HJ#9, HJ#10 | 350 × 2 | 45% | 315 |
| | | In total | | 925 |
Table 5.
The maximum ramping rate of generators.
Table 5.
The maximum ramping rate of generators.
| Capacity | Maximum positive ramping rate (MW/5 min) | Maximum negative ramping rate (MW/5 min) |
|---|
| 50 MW | 0.92 | −11.25 |
| 100 MW | 10.00 | −10.00 |
| 150 MW | 11.67 | −17.50 |
| 300 MW | 27.50 | −27.50 |
| 350 MW | 32.10 | −32.10 |
3.2. The Investigation on Power Balancing in Extreme Scenarios
The profitability of the project strongly depends on a reliable, non-intermittent power supply to the electrolytic load. However, at a wind penetration level of 47%, any intensive wind power fluctuation might result in a system imbalance, which has been considered as one major factor that can cause load shedding or even blackouts. The power imbalance should be appropriately addressed by the coordination of the entire system. This subsection hence discusses whether the proposed wind-coal hybrid system is capable of maintaining the power balance at such a high wind penetration level.
3.2.1. Wind Power Profile
With the wind speed measurements from the “#5388” anemometer as input, the power output from the two wind farms can be roughly estimated according to the computation result from WAsP [
31], which is a widely-accepted software in the field of wind farm design. The estimated power output in 2008 is plotted in
Figure 3 and three special days are subsequently selected for the examination of system balance. These days include the day with the highest average output of wind power, the day with the lowest average output of wind power and the day with the highest wind power ramping rate. The system capability of maintaining power balance can be evaluated based on the investigation of these extreme scenarios.
Figure 3.
The wind power output in 2008.
Figure 3.
The wind power output in 2008.
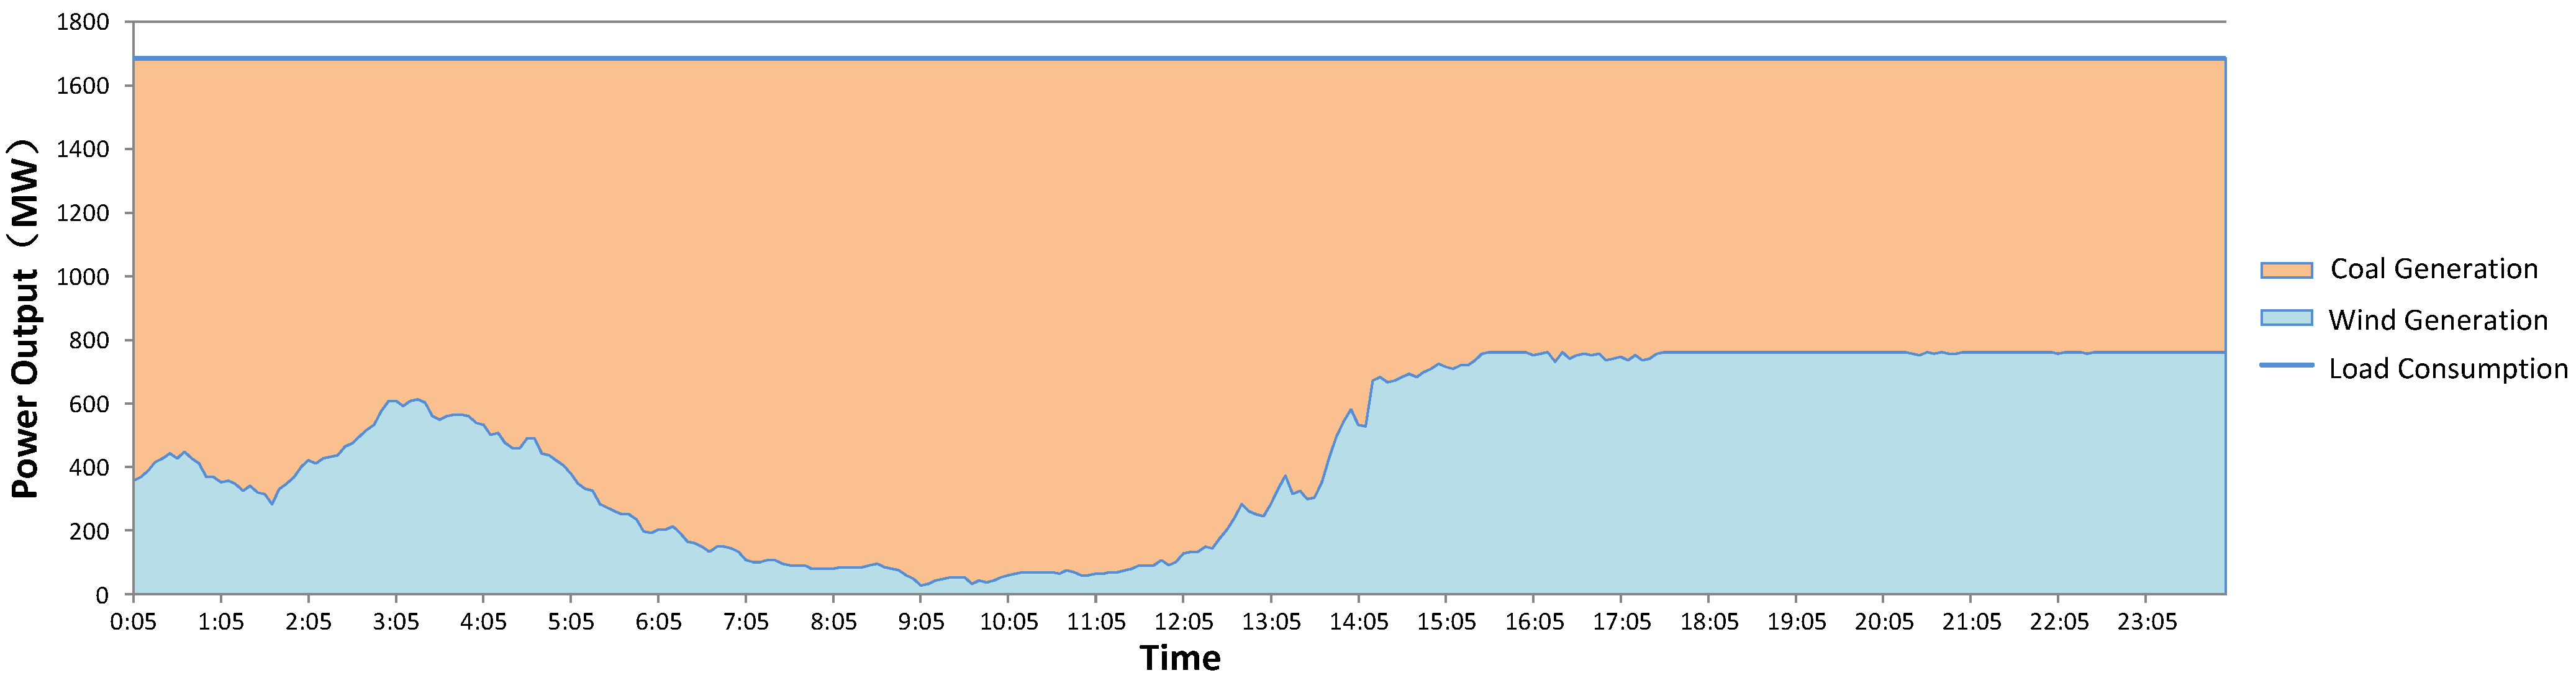
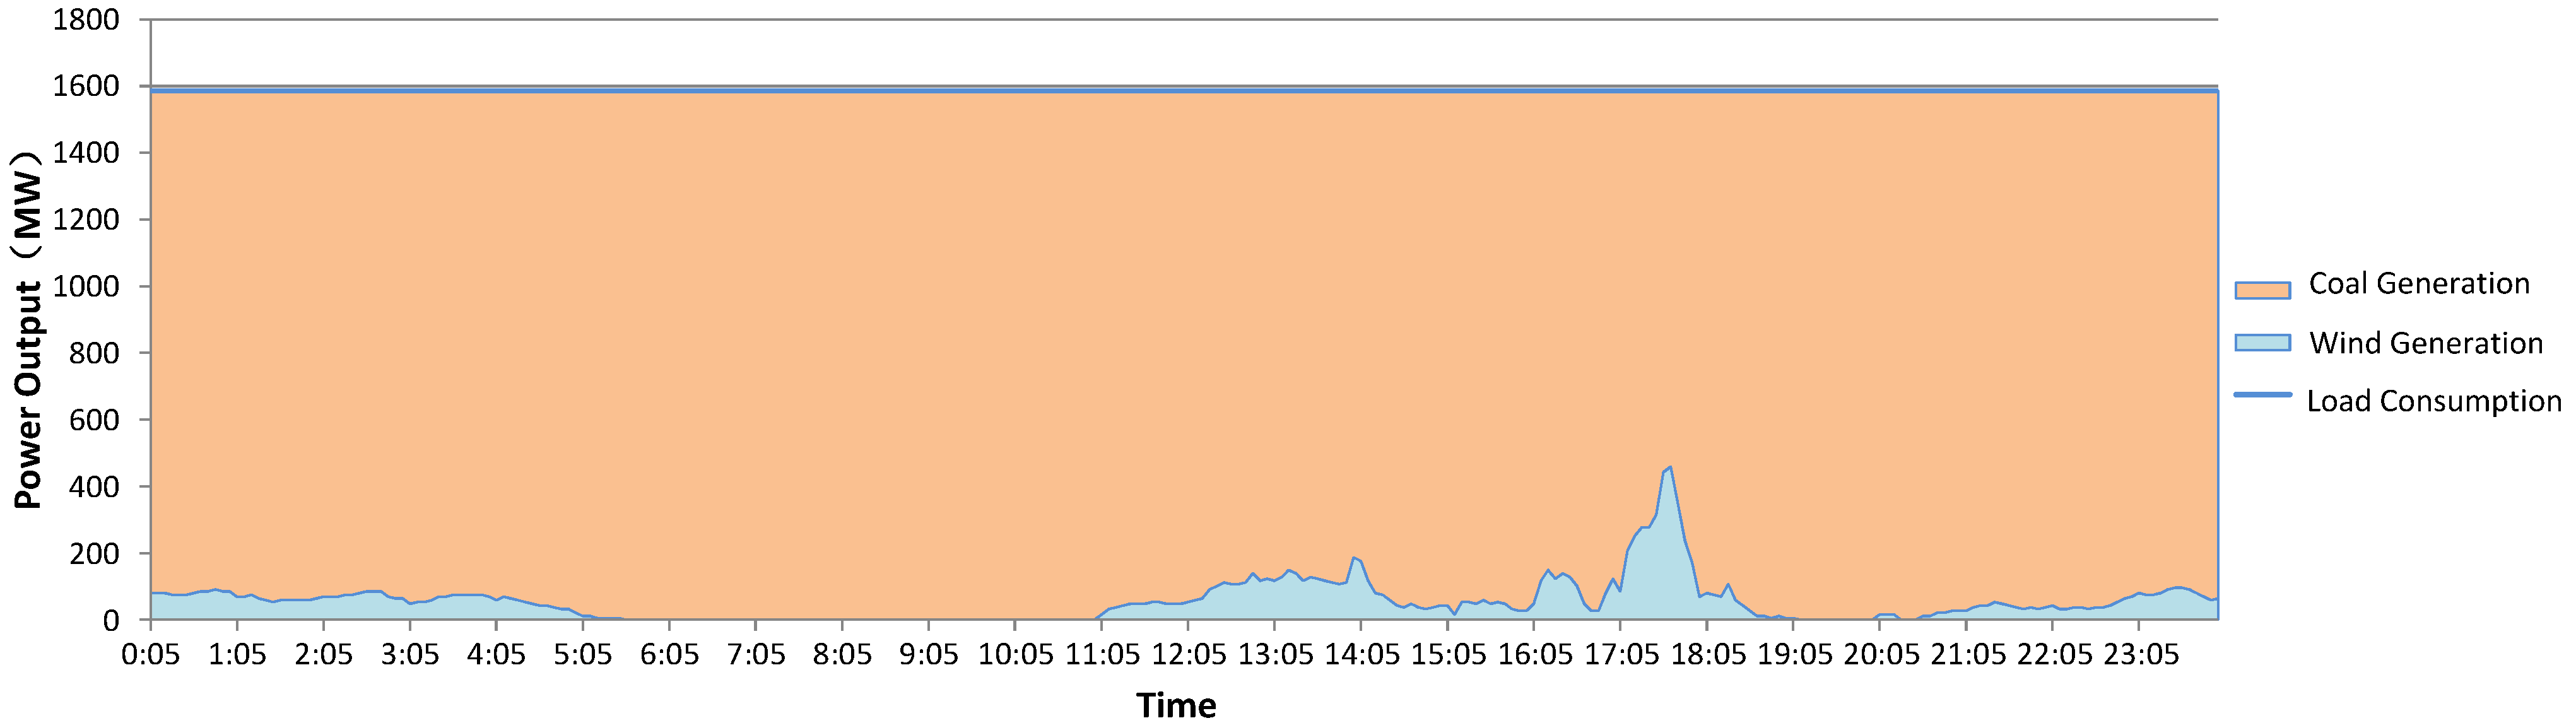
3.2.2. The Day with the Highest Average Output of Wind Power
The day with the highest average wind power output is 21 December 2008. The highest wind power output also means the highest possibility that wind curtailment will occur if the entire load demand is less than the sum of wind generation and the minimum output of coal-fired generators. The purpose for selecting the day is hence on examining whether or how much the wind spillage might occur and whether the system design should be adjusted if the wind curtailment becomes unacceptable. As shown in
Figure 4, the estimated load is 1686 MW in total, including 1400 MW electrolytic load, 100 MW heating load and 186 MW auxiliary power load.
Figure 4.
The load profile on 21 December 2008.
Figure 4.
The load profile on 21 December 2008.
The power output of wind and coal-fired generators are plotted in
Figure 5 and zoomed in
Figure 6.
Figure 5 indicates that the wind-coal hybrid system is able to satisfy the load consumption of 1686 MW. However, since the total generation from wind and the minimum output of coal generators exceeds the total load, around 30 MW wind power should be curtailed in order to keep the system balanced as shown in
Figure 6, which is a zoomed view for from 15:00 to 24:00. The curtailed wind power is only less than 30/800 = 3.75% compared to the wind farm rated capacity. The wind spillage accounts for only a little part of the entire generation capacity. This verifies that the ratio of wind generation within the hybrid system is appropriately designed.
Figure 5.
The power output of wind and coal generators in 21 December 2008.
Figure 5.
The power output of wind and coal generators in 21 December 2008.
Figure 6.
The wind curtailment of wind farms in 21 December 2008.
Figure 6.
The wind curtailment of wind farms in 21 December 2008.
3.2.3. The Day with the Lowest Average Output of Wind Power
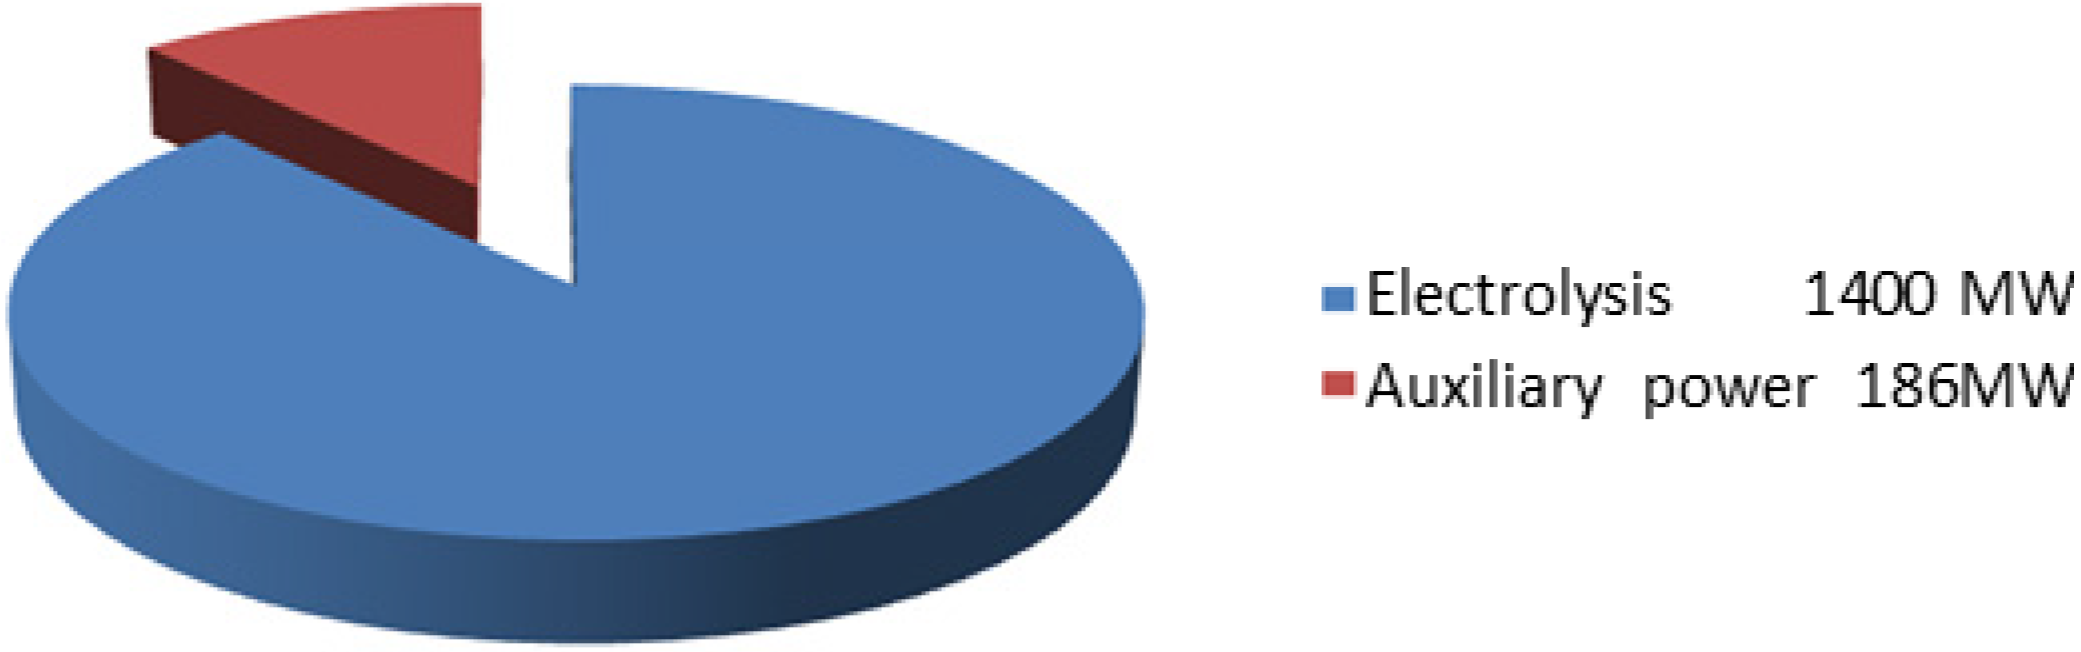
The day with the lowest average output of wind power is 14 August 2008. The purpose of selecting the day is to examine whether the load demand can be satisfied by hybrid wind-coal generation. As shown in
Figure 7, the estimated load is 1586 MW in total, including 1400 MW electrolytic load and 186 MW auxiliary power load. Heating load is not considered since the day occurs in the summer season.
Figure 7.
The load profile on 14 August 2008.
Figure 7.
The load profile on 14 August 2008.
Figure 8 shows that the wind-coal generation is capable of supplying the electrolysis plant. Even though there is no wind output, the coal-powered generators can still meet the overall load demand when all the generators are in service. In practice, another common scenario is that one generator is out of service due to maintenance or some other reason. The most serious situation is that the largest generator, HJ#9 of 350 MW in this paper, goes out of service. The scenario is simulated and plotted in
Figure 9. According to the simulation result, a load reduction of 35 MW will ensure the system balance. The reduction of 35 MW load is within the secure adjustment region of electrolysis plant so it would not result in any load shedding events, as discussed in the first part of this section. Therefore, the simulation demonstrates that the overall capacity of coal generators is appropriately designed for the proposed wind-coal hybrid system.
Figure 8.
The power output of wind and coal generators on 14 August 2008 while all generators are online.
Figure 8.
The power output of wind and coal generators on 14 August 2008 while all generators are online.
Figure 9.
The power output of wind and coal generators on 14 August 2008 assuming that HJ#9 generator is offline.
Figure 9.
The power output of wind and coal generators on 14 August 2008 assuming that HJ#9 generator is offline.
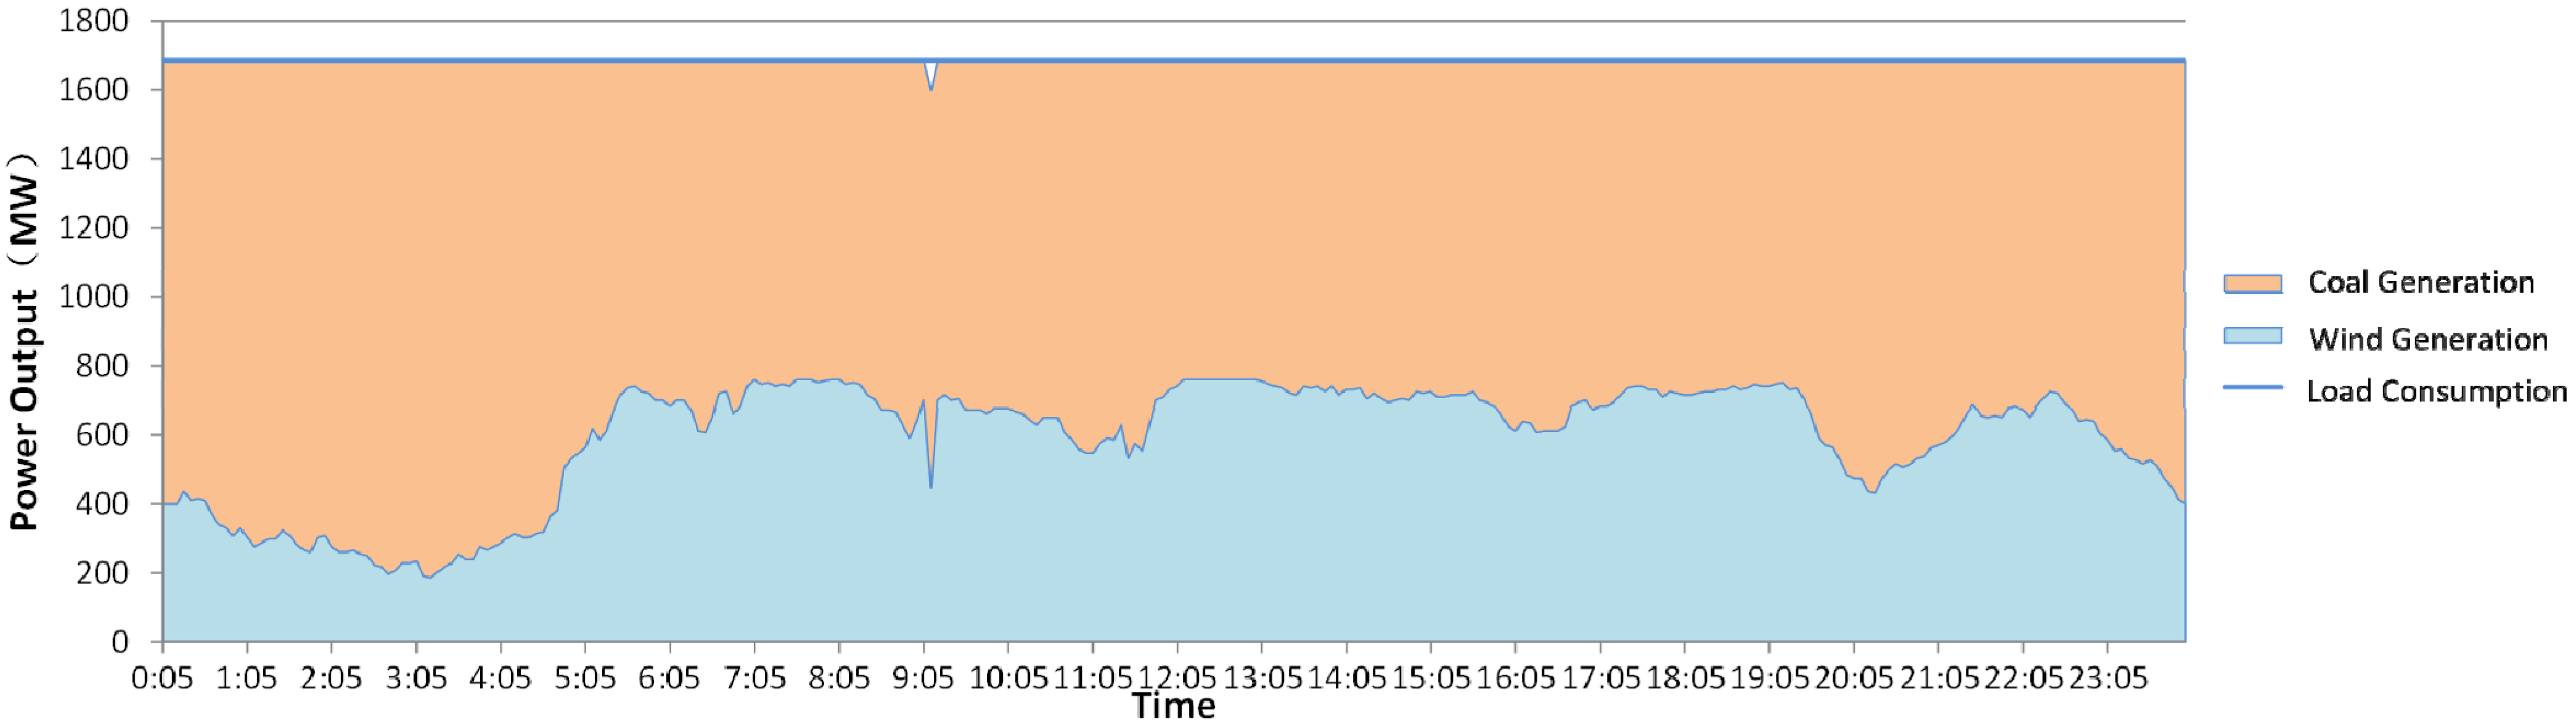
3.3. The Day with the Highest Ramping Rate of Wind Power
The day with the highest ramping rate of wind power is 8 April 2008. The purpose for selecting the day is on examining whether the power output of coal generators can ramp fast enough to track the stochastic variation of wind power.
Figure 10.
The load profile in 8 April 2008.
Figure 10.
The load profile in 8 April 2008.
As shown in
Figure 10, the estimated load is 1686 MW in total, including 1400 MW electrolysis load, 100 MW heating load and 186 MW auxiliary power load.
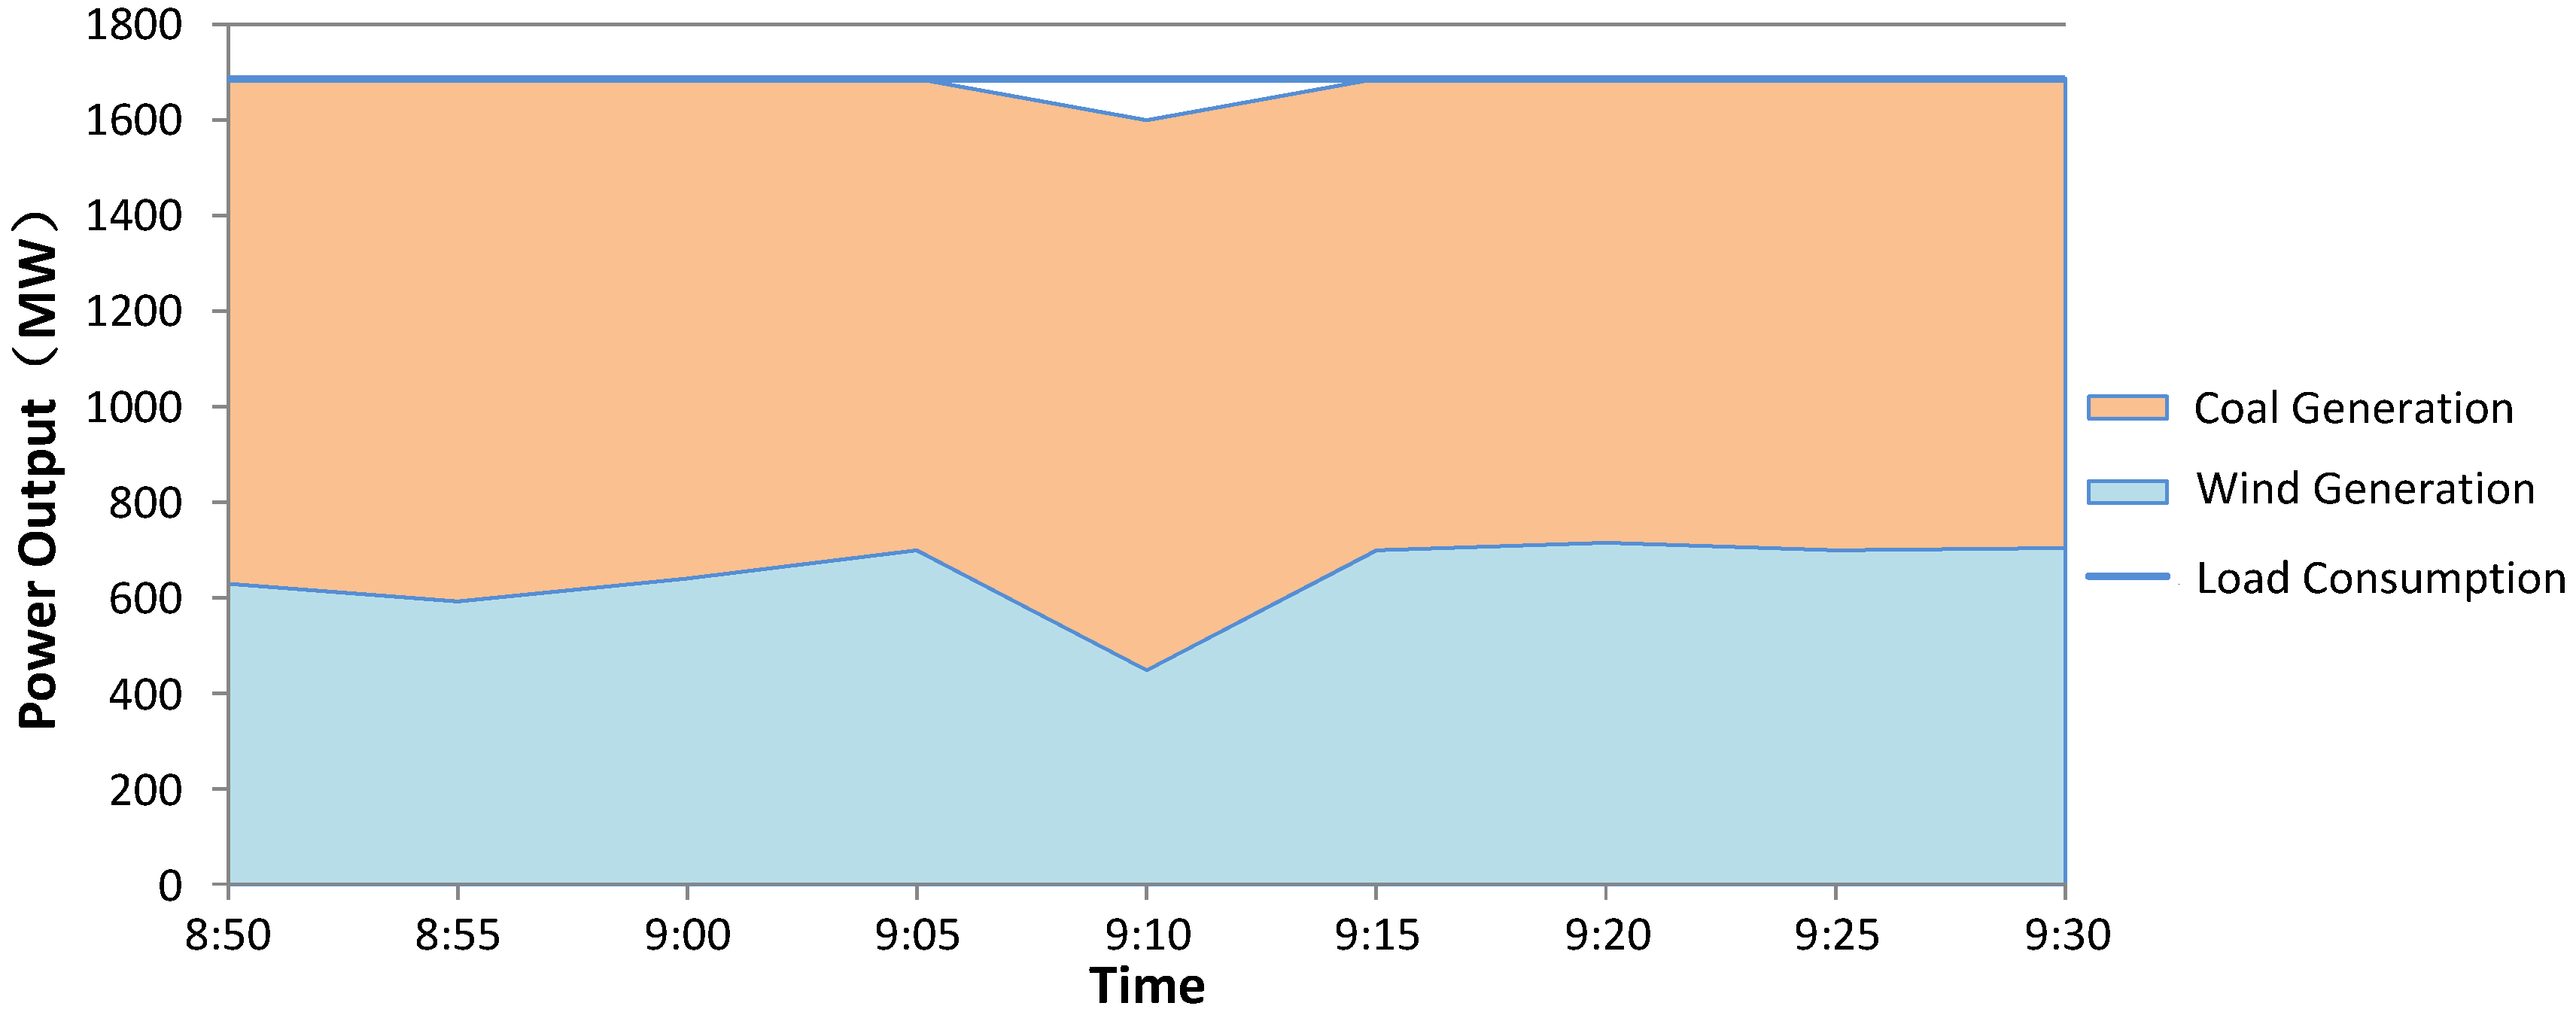
Figure 11 plots the wind power output on the day of 8 April 2008 and it shows that the highest power fluctuation, which is as fast as 283 MW/5 minutes, happens from 8:50 to 9:30. When the coal generators are all in service, the overall ramping rate is fast enough to compensate for the wind power fluctuation.
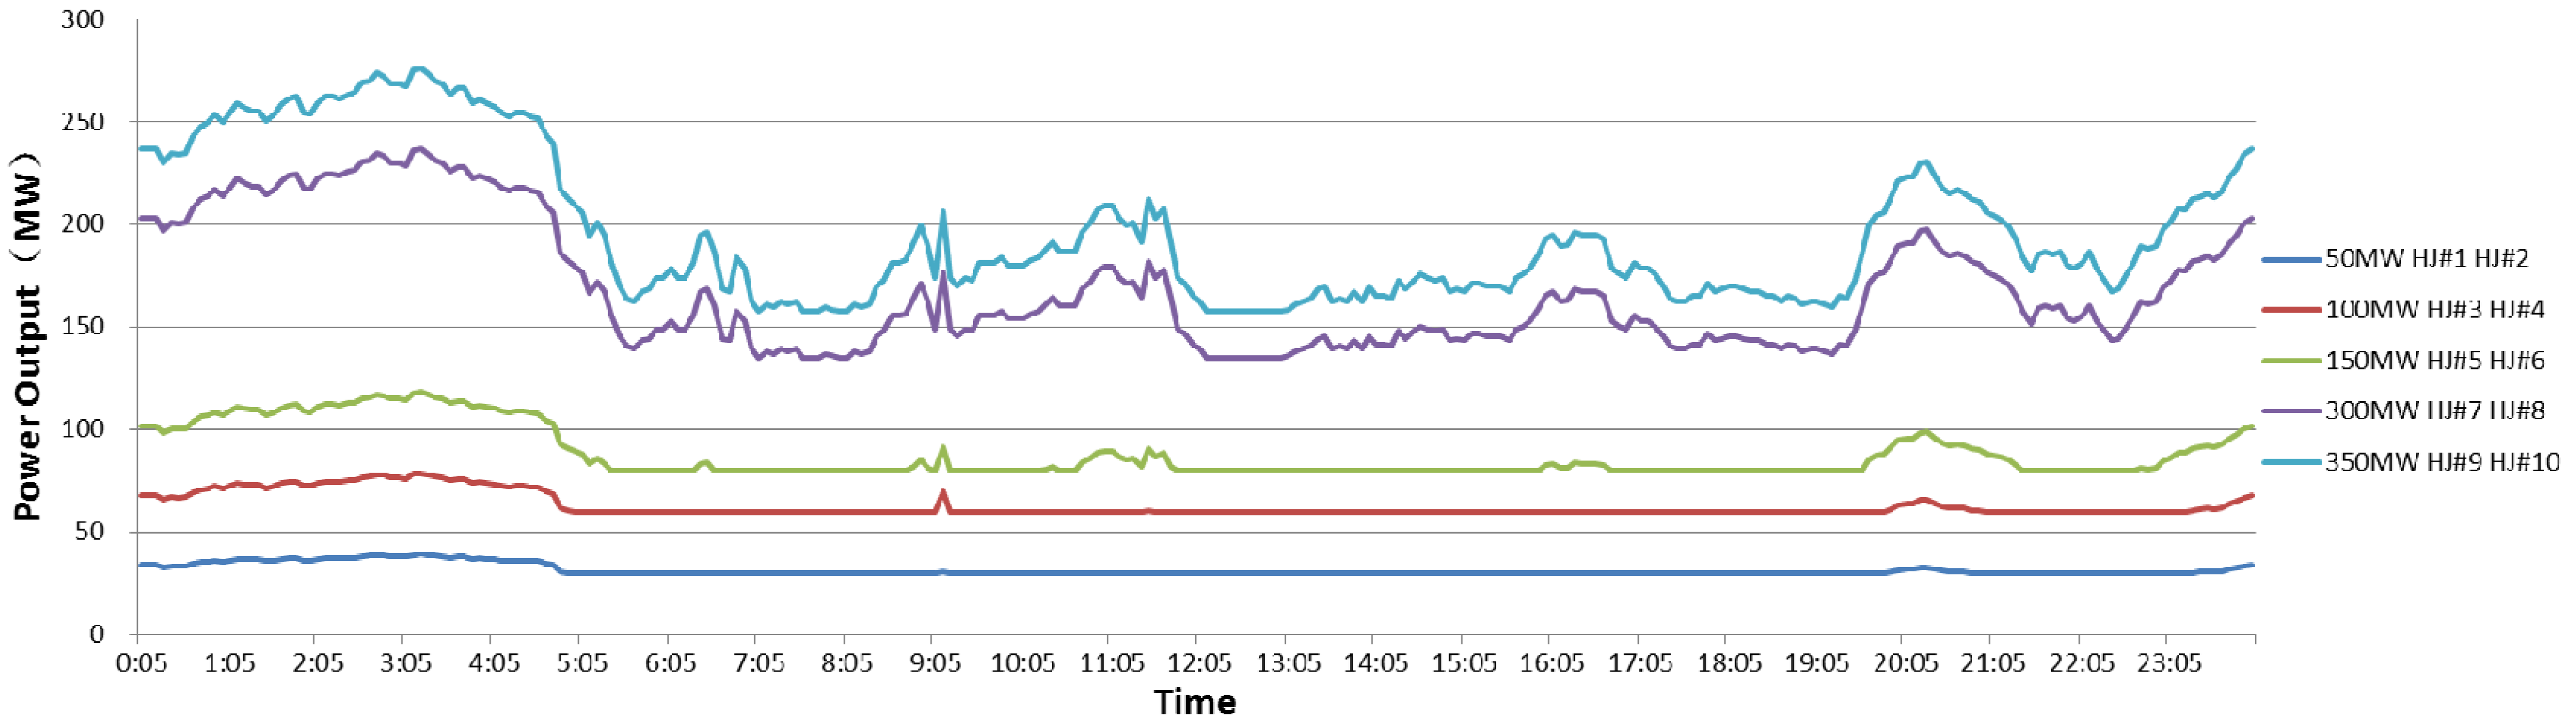
Figure 12 shows the power output of each generator through a calculation based on the ramping rates. According to
Figure 12, the maximum ramping rate is computed for each generator as listed in
Table 6, which indicates that both the positive and the negative ramping are lower than the technical limitations for all the online generators. It demonstrates that the installed generators are capable of handling the most intensive wind power fluctuation if the entire system is under normal operation.
Figure 11.
The power output of wind and coal generators on 8 April 2008 while all generators are online.
Figure 11.
The power output of wind and coal generators on 8 April 2008 while all generators are online.
Figure 12.
The power output of coal generators on 8 April 2008 while all generators are online.
Figure 12.
The power output of coal generators on 8 April 2008 while all generators are online.
Table 6.
The statistics of positive/negative ramping rate while all generators are online.
Table 6.
The statistics of positive/negative ramping rate while all generators are online.
| Capacity | Maximum positive ramping rate (MW/5 min) | Maximum negative ramping rate (MW/5 min) | Positive ramping rate limitation (MW/5 min) | Negative ramping rate limitation (MW/5 min) |
|---|
| 50 MW | 0.92 | –3.24 | 0.92 | –11.25 |
| 100 MW | 5.34 | –10.00 | 10.00 | –10.00 |
| 150 MW | 11.67 | –11.67 | 11.67 | –17.50 |
| 300 MW | 27.50 | –27.50 | 27.50 | –27.50 |
| 350 MW | 32.10 | –32.10 | 32.10 | –32.10 |
However, if the largest generator, HJ9#, is out of service, the overall ramping rate is not as fast as the rate of wind power variation according to the simulation results in
Figure 13,
Figure 14 and
Figure 15. This is because the maximum positive ramping rate, as listed in
Table 7, has reached the upper limit for each online generator.
Figure 13.
The power output of wind and coal generators on 8 April 2008 while the HJ#9 generator is offline.
Figure 13.
The power output of wind and coal generators on 8 April 2008 while the HJ#9 generator is offline.
Figure 14.
The load reduction on 8 April 2008 while HJ#9 is offline.
Figure 14.
The load reduction on 8 April 2008 while HJ#9 is offline.
Figure 15.
The power output of other coal generators on 8 April 2008 while HJ#9 generator is offline.
Figure 15.
The power output of other coal generators on 8 April 2008 while HJ#9 generator is offline.
Table 7.
The statistics of positive/negative ramping rate while HJ#9 generator is offline.
Table 7.
The statistics of positive/negative ramping rate while HJ#9 generator is offline.
| Capacity | Maximum positive ramping rate (MW/5 min) | Maximum negative ramping rate (MW/5 min) | Positive ramping rate limitation (MW/5 min) | Negative ramping rate limitation (MW/5 min) |
|---|
| 50 MW | 0.92 | –3.97 | 0.92 | –11.25 |
| 100 MW | 10.00 | –10.00 | 10.00 | –10.00 |
| 150 MW | 11.67 | –15.26 | 11.67 | –17.50 |
| 300 MW | 27.50 | –27.50 | 27.50 | –27.50 |
| 350 MW | 32.10 | –32.10 | 32.10 | –32.10 |
Though the available generation is limited, the isolated system can still compensate most of the wind power fluctuation and the unmet electrolysis load is about 118.7 MW, which is less than 144 MW, the maximum allowable reduction for electrolysis plant. Therefore, the most serious wind power fluctuation would only result in a temporary load reduction and a permanent load shedding or blackout event can be avoided. Considering that there is very little possibility that an intense wind fluctuation will coincide with a generator trip or maintenance on the same day, no additional generation is required for this isolated system in order to keep the overall power balance, based on the simulation results.
Through the above analysis, the power balance issue of the isolated system has been fully discussed and addressed. The entire system is demonstrated to be capable of satisfying the load demand from the electrolysis plant, in the scenarios of the highest average output, the lowest average output or the highest ramping rate wind power. Even if the largest generator is out of service, the system balance can still be maintained by a temporary load reduction of the electrolysis plant. There is very little possibility that load shedding or system blackouts will happen. Therefore, the isolated system is technically feasible to be operated under a wind penetration level at 47% and the proposed hybrid system is appropriately designed.


