
The European Market for Guarantees of Origin for Green Electricity: A Scenario-Based Evaluation of Trading under Uncertainty

1
Workgroup for Infrastructure Policy (WIP), TU Berlin, Straße des 17. Juni, 10623 Berlin, Germany
2
Energy, Transportation, Environment Department, German Institute for Economic Research (DIW Berlin), Mohrenstraße 58, 10117 Berlin, Germany
3
Institute for Future Energy Consumer Needs and Behavior (FCN), School of Business and Economics/E.ON Energy Research Center, RWTH Aachen University, Mathieustaße 10, 52074 Aachen, Germany
4
Department of Industrial Economics and Technology Management, Norwegian University of Science and Technology (NTNU), Sentralbygg 1, 7491 Trondheim, Norway
*
Author to whom correspondence should be addressed.
Energies 2024, 17(1), 104; https://doi.org/10.3390/en17010104
Submission received: 10 November 2023
/
Revised: 14 December 2023
/
Accepted: 19 December 2023
/
Published: 23 December 2023
(This article belongs to the Special Issue Transformation of Energy Markets: Description, Modeling of Functioning Mechanisms and Determining Development Trends – Second Edition)
Abstract
:Guarantees of Origin (GOs) were introduced in order to enhance transparency about the origin of green electricity produced in Europe, and to deliberately empower end-consumers to participate in the sustainable energy transition. The separation of electricity and the GO trade has resulted in a prosperous GO market that, however, has been characterized by non-transparency and opportunistic behavior. Historic price development has been opaque and can therefore not be used to forecast future GO prices. This paper, firstly, provides a thorough overview of the European GO market and an analysis of the historic price development; secondly, it proposes a model, the first of its kind, for determining future price developments of European GOs for different renewable energy technologies in different countries up to 2040. For household consumers, GO price determination is based on willingness-to-pay estimates from the literature, whereas for non-household consumers, the model introduces a novel approach to determine the willingness to pay for green electricity. Four different scenarios are considered (Status Quo, Sustainable Development, Full Harmonization, and Ideal Development) and annual GO data are used. The findings indicate that GO prices can be expected to increase on average in the next years, with prices ranging from 1.77 to 3.36 EUR/MWh in 2040. Sensitivity analysis shows that ‘WTP percentages’ have the highest influence on GO prices. It can be concluded that future GO prices will remain challenging to predict, even with the support of sophisticated models, due to the expected supply and demand-driven market growth affecting the market equilibrium prices for different GOs in different countries.
1. Introduction
Climate change mitigation requires, amongst other measures, energy system decarbonization by rapidly increasing shares of renewable energy generation [1]. While energy system planning remains mostly state-planned [2], European consumers can support decarbonization of one vital part of the energy system, electricity generation, by, for example, actively purchasing so-called “green” electricity, i.e., electricity generated from renewable sources such as wind, solar, hydro, or biomass [3], thereby adding pressure to utilities to expand renewable energy shares. This has been possible since 1996 when the European electricity market was liberalized [4]. However, as electricity is a homogeneous good, the origin of a specific Megawatt-hour (MWh) of green electricity from the grid cannot per se be determined [5]. Consumers who are nonetheless willing to purchase green electricity have four general options. Presented in the order of their increasing positive impact on green electricity production and additional organizational effort and costs, these are unbundled energy attribute certificates (EACs), power purchase agreements (PPAs), renewable energy offerings, and direct investments for self-consumption (on-site and off-site) [6]. Amongst commercial and industrial consumers, EACs are the most frequently used option for green electricity acquisition [7].
These EACs allow energy providers to label electricity sold to consumers as “green” [8]. Guarantees of Origin (GO) were introduced in the European Union (EU) in 2001 [9] and are the most commonly used type of EAC in the EU [10]. GOs are freely tradable across most European countries, and since their implementation, a market for GO trade has emerged [11].
This European GO market functions as follows: for every MWh of green electricity that is fed into the grid by a producer, that producer may request the issuance of one GO in the respective national registry. During its lifetime, this GO may be traded internationally between traders, utilities, and suppliers until it is canceled upon request when the corresponding MWh of green electricity has been sold and must be disclosed to a consumer. If the GO is not canceled after 12 months, it expires and is removed from the registry. The corresponding MWh of green electricity is still fed into the grid—the “greenness” of the electricity, however, has not been sold [12].
As this trade can also be conducted on an international basis in the European Energy Certificate System (EECS), an acknowledged independent institution is required to ensure the correct processing of GOs because different systems diverge from one another in terms of regulations [5]. The Association of Issuing Bodies (AIB) initially defined, and continues to refine, a regulatory framework that is in compliance with related EU and national laws [13]. As of January 2023, 27 European countries were members of the EECS, including the non-EU member states Norway, Iceland, and Switzerland [14].
It is important to note that the GO scheme differs from other green certificate schemes, such as the Norwegian-Swedish green certificate scheme that was introduced in 2003 in Sweden and 2012 in Norway. As a market-based support system, this scheme aims to promote renewable electricity generation and is separate from the European GO system [15,16].
The GO market is fully independent of the electricity market, as with GOs only the “greenness” of electricity is traded [11]. The market is characterized by non-transparent bilateral trading that is mostly conducted on private trading platforms, although an attempt to establish an open auctioning platform is currently being made [17]. Such exchange platforms might help increase transparency and liquidity in the market [18]. Despite these efforts, only limited information on GO prices is publicly available. Further, prices are subject to volatility and, as discussed in the literature, subject to opportunistic behavior. These issues can lead to significant information asymmetry in the market [19]. This assessment is supported by recent market developments observed in the second half of 2022, as the market saw unprecedented price increases over all commonly traded types of GOs, as electricity suppliers rushed to purchase supposedly shortened GO volumes when fears of an energy crisis in Europe grew [20,21,22]. Similar price developments were observed in 2018 as the prospects of low Norwegian hydro reservoir levels resulted in expectations of reduced GO supply. Once it had become clear that production would remain stable, prices returned to pre-2018 levels [11,23]. This price volatility, non-transparency, and other issues such as incomplete information of consumers, are reasons why the GO scheme is criticized as being no more than a marketing vehicle rather than a useful complementary policy tool to promote the production of green electricity [24,25].
This paper aims to reduce this non-transparency by first providing a detailed overview of the European GO market and historic price developments. While the previous literature focuses on single-issue criticisms of the GO market, the first part of this study sheds light on the criticism brought up against the GO scheme by means of an extensive literature analysis. We further provide detailed insights on GO price developments that have so far not been subject to further scrutiny in the literature. Our main contribution, however, is a novel model-based approach to forecast GO prices under non-transparent market conditions as they prevail in the GO market. Firstly, to our knowledge, no such model exists yet in the scientific literature. While some commercial providers (for example, enervis energy advisors, Berlin, Germany (https://enervis.de/en/product/price-forecast-for-european-guarantees-of-origin-for-green-electricity-goo/, last accessed on 17 June 2023) or Thema, Oslo, Norway (https://thema.no/en/energy-markets/guarantees-of-origin/, last accessed on 17 June 2023)) provide GO price projections, they give no insight into their models. We thus add transparency and new insights about the actual market mechanisms that seem to be at work by explicitly modeling GO supply and demand. Secondly, our analysis can be used by regulators to determine whether, and in what respect, the existing GO market might need reform. Other stakeholders, such as project developers and investors in renewable energy production plants, can use the model-based price projections provided to better assess the expected profitability of their intended projects.
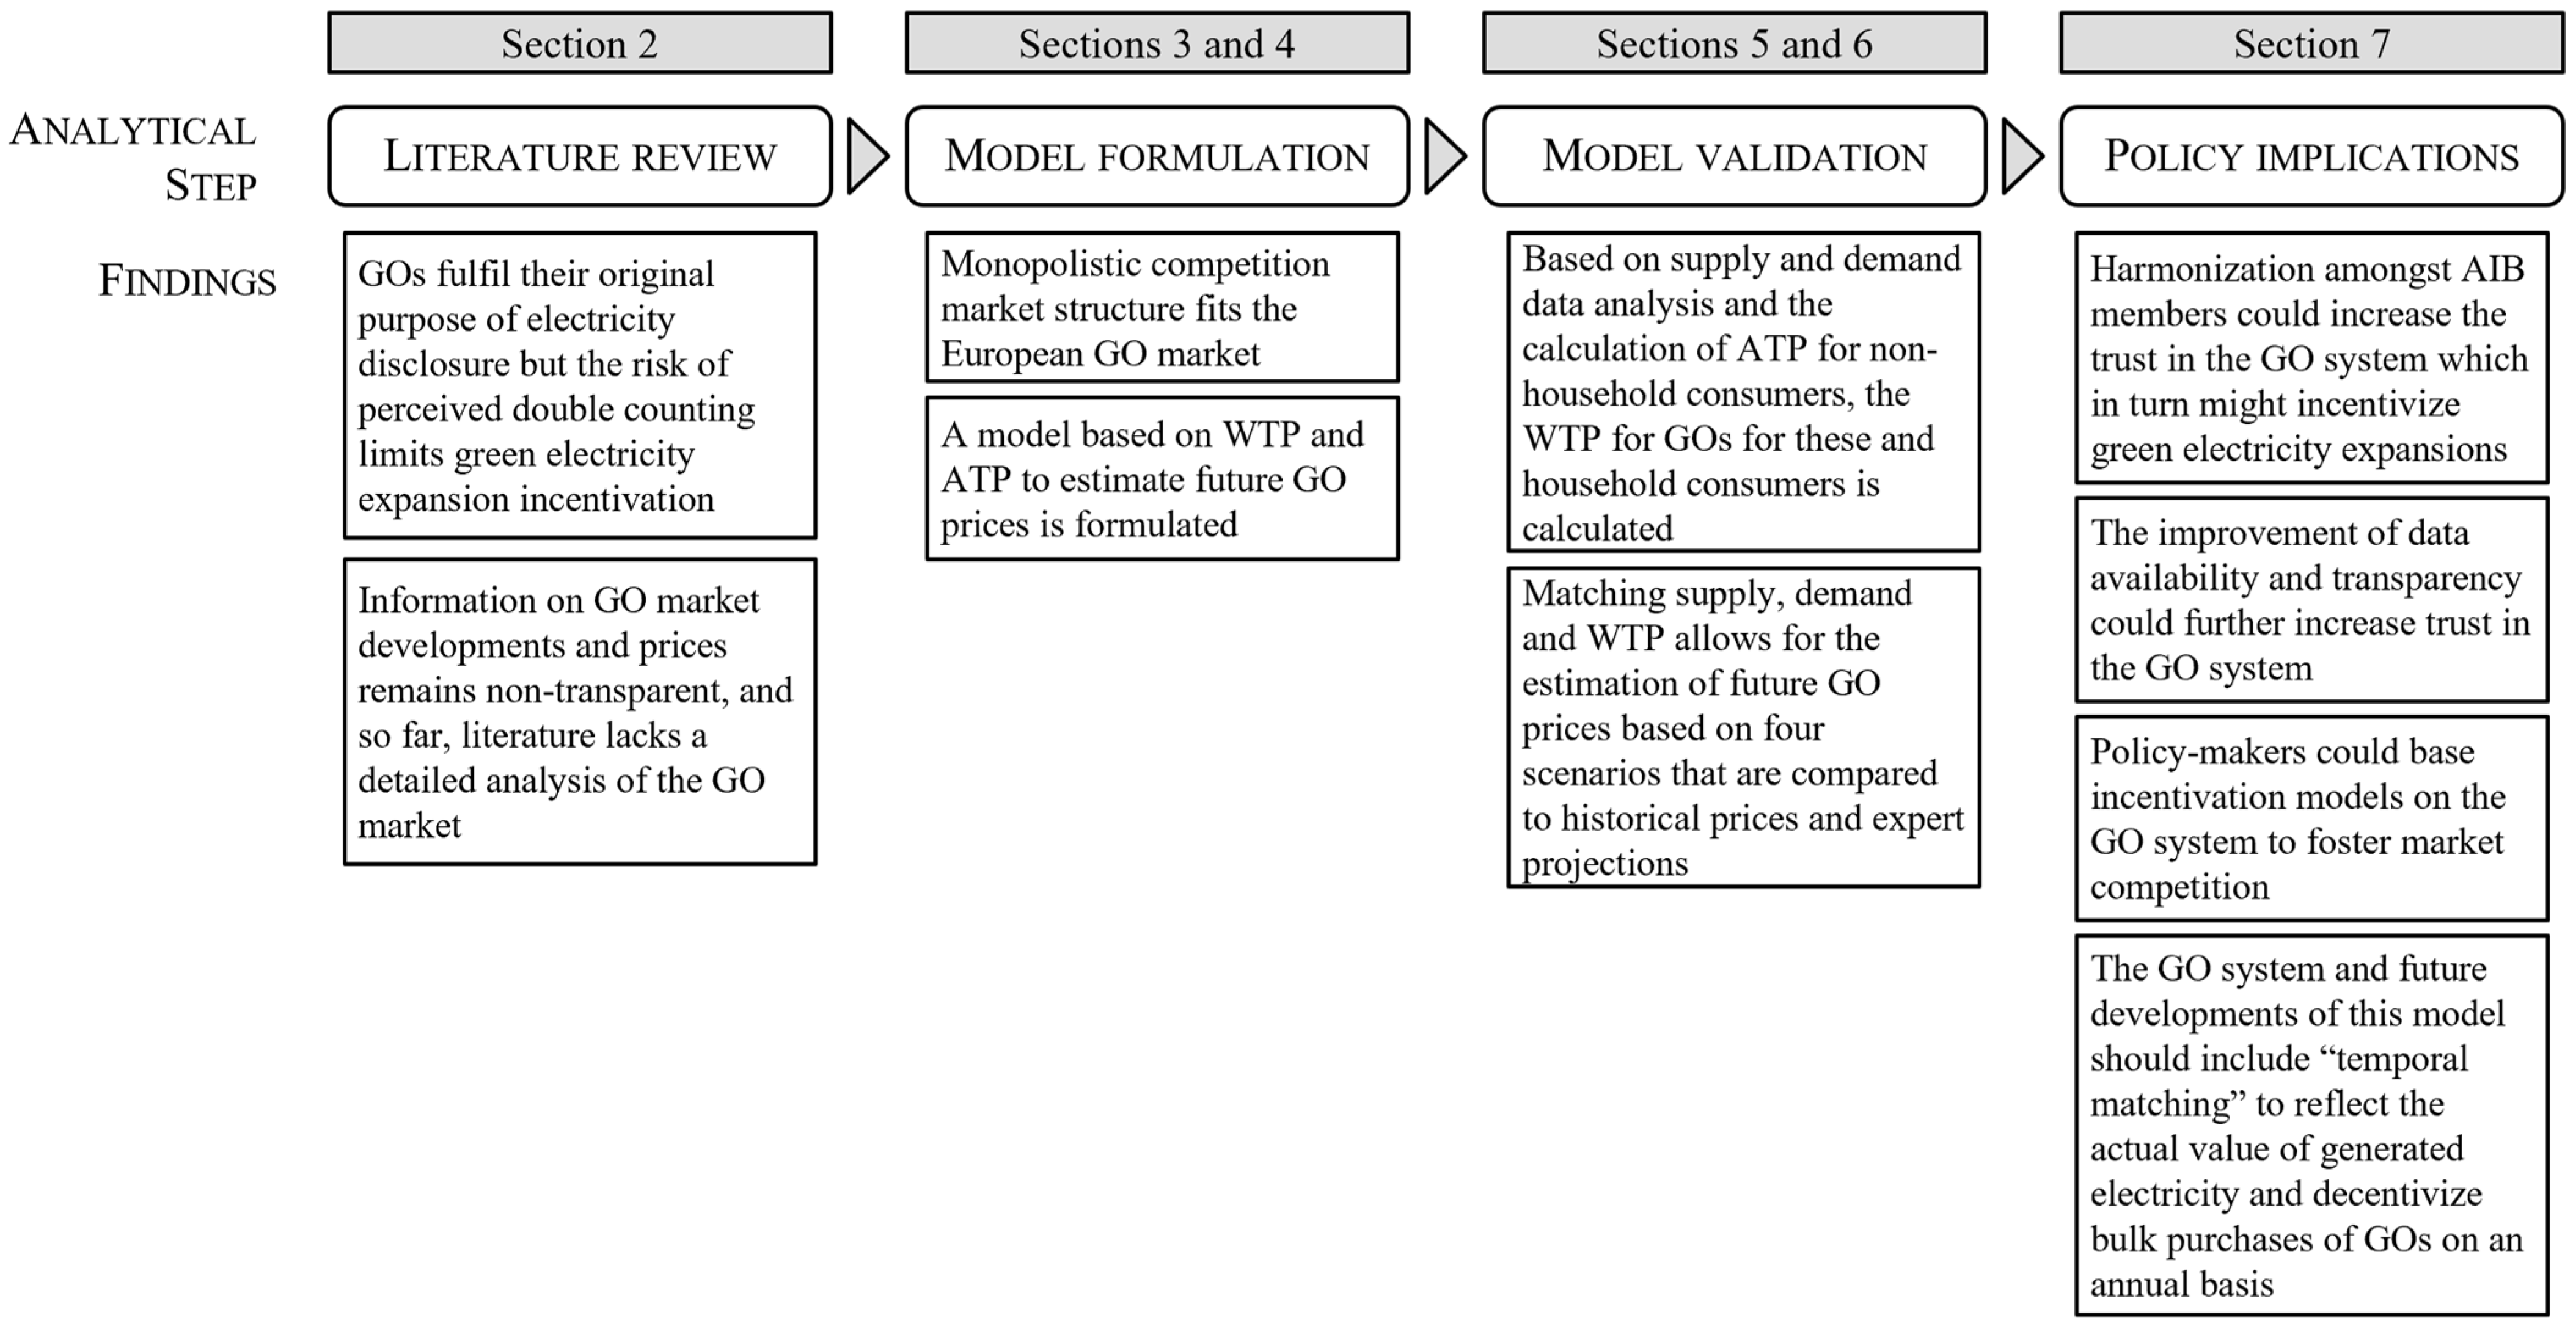
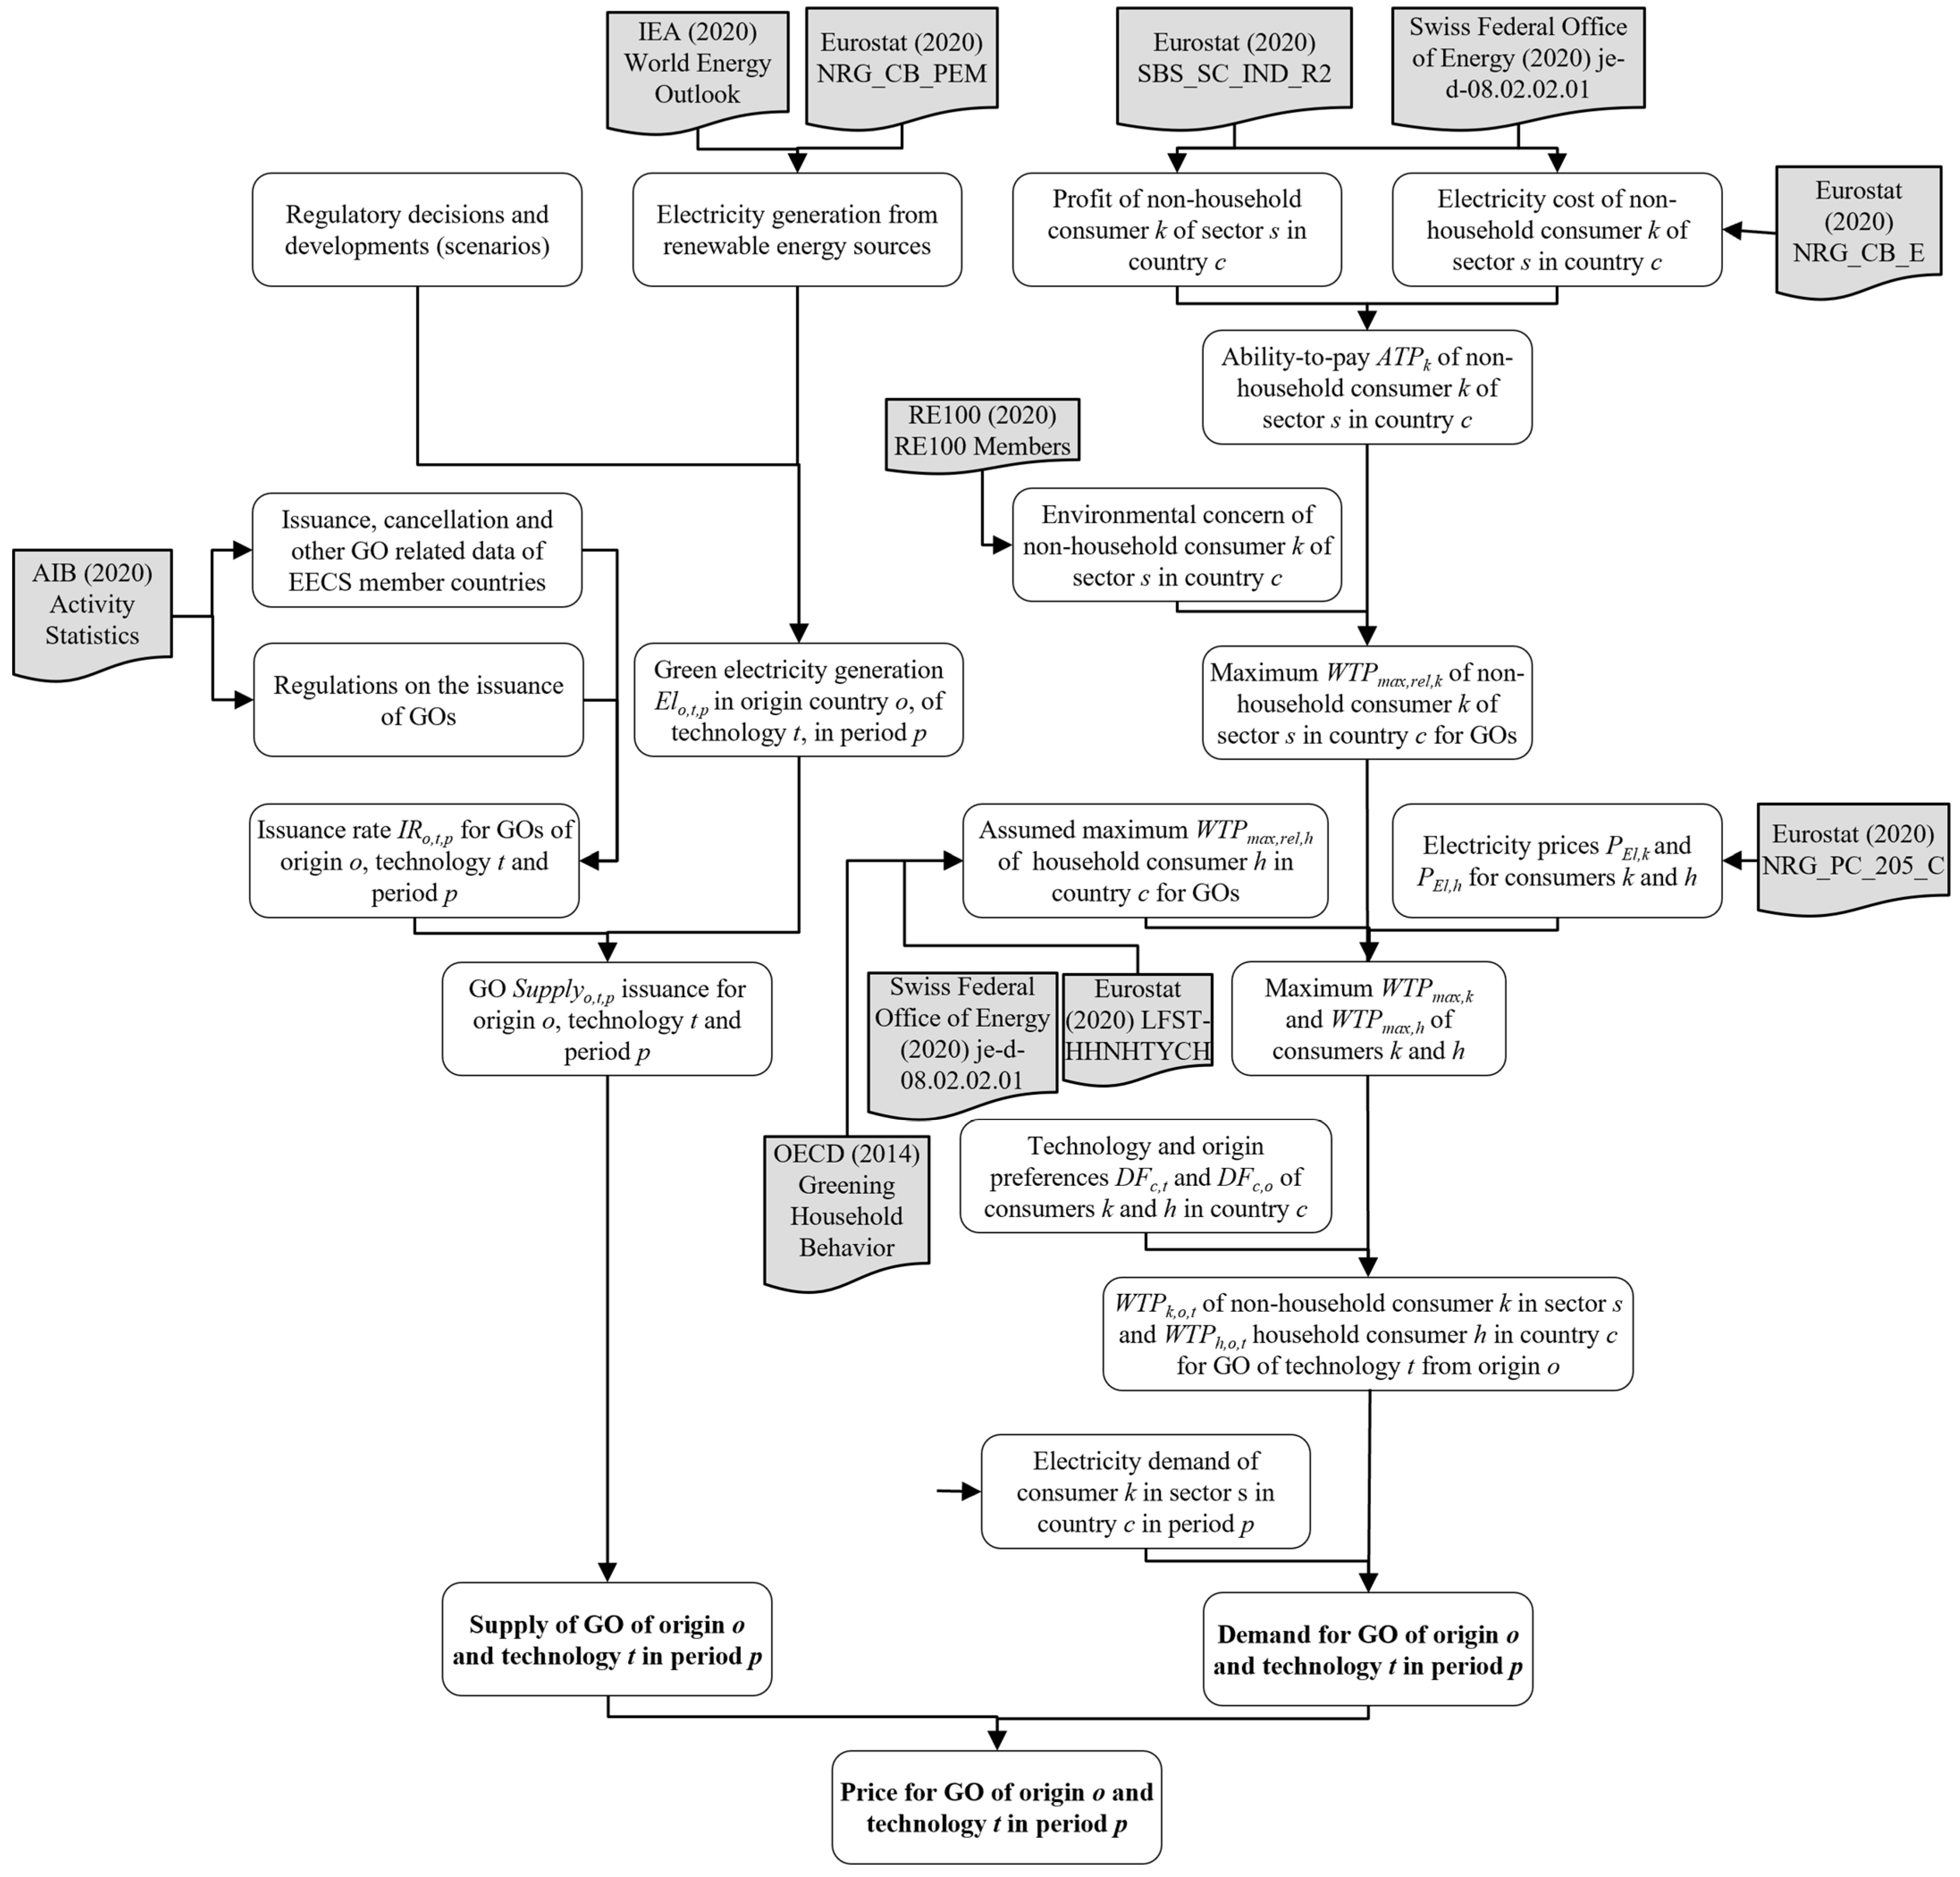
The remainder of this paper is structured as shown in Figure 1 and described as follows. Section 2 discusses relevant literature on the GO market and price development as well as willingness to pay (WTP) for green electricity. In Section 3, we introduce relevant theoretical background to our model approach. This approach is explained in Section 4, where we also introduce our four scenarios. Section 5 gives an overview of the data that was used to model possible future scenario-based GO price developments, which are then discussed in Section 6. The final section closes with a conclusion and the implications of our results for policymakers.
2. Literature Review
This section sheds new light on the criticism surrounding the current GO market design, historical and recent price developments, and the assessment of WTP for green electricity.
2.1. Critical Evaluation of GOs
Firstly, the EECS creates a misleading impression of energy production, use, and disclosure in relation to the trading of green electricity [26]. For instance, Icelandic GOs can be traded and used for disclosure in mainland Europe even without a physical grid connection [27]. This means that when consumers purchase green electricity certified by GOs, they may mistakenly believe they are supporting the production of local renewable energy when that electricity might not even be fed into the European grid [28].
Another issue is perceived double counting, where it may appear that an amount of green electricity has been certified or traded twice [29]. This can lead to further distrust in the system. Norwegian GOs, for example, can be exported to other European countries and used to disclose the production of green electricity [30]. However, consumers are often unaware of how these redistributions are calculated in the “residual mixes”. This can create confusion, as consumers in Norway assume their electricity is mostly renewable while it is actually generated from fossil fuels due to the purchase of Norwegian GOs by actors in Germany [31,32].
The low price levels of GOs are also of concern. The prices paid for hydro GOs have typically ranged from 0.05 to 0.5 EUR per MWh, which in the absence of other financial support is too low to stimulate significant investments in renewable energy production [3]. Additionally, the price volatility increases information asymmetry effects in the GO system [19].
To rebalance these critical remarks, it is important to note that the GO system was never designed with the intention to promote green electricity production, as its goal is electricity information disclosure [33]. This purpose is generally fulfilled [11]. The use of GOs in greenhouse gas protocols can also improve GHG inventories and monitor carbon footprints [25].
GOs are also necessary because the acceptance of renewable electricity production and the transition to carbon-neutral economies is based mainly on information and trust [27,34].
Furthermore, despite historically low price levels, GOs can generate additional income for producers in countries that allow the issuance of GOs alongside financial support for production from renewable energy sources (RES). Once GO prices become more economically viable than national subsidies for RES production, they may have a positive impact on renewable electricity production [35], provided that the registry fees are sufficiently low [13,25] (for details of current fees in the national registries, see [36]).
GO prices are influenced by factors such as the age, technology, and location of a power plant [37], but the fundamental concept of supply and demand plays the most significant role [38]. Dutch GOs, for example, have high prices due to limited supply and high consumer demand [26], while Norwegian GOs have low prices due to excess supply and less interest from consumers [27]. If demand for GOs increases, prices will rise and potentially promote renewable energy production [39].
2.2. Price Information and Evaluation
As this paper proposes a model to forecast GO prices, an analysis of historic GO prices was conducted, with a summary being provided in this subsection. This analysis was based on information from the literature and from commercial providers of price information about European GOs. Some countries auction GOs to bidders, such as Italy, France, and Luxembourg (see https://www.aib-net.org/facts/market-information/auctioning-gos-aib-members, last accessed on 21 January 2023) These auction results are published online and can be used as an indication of current GO prices, although they can then be resold on the international GO market, where prices might differ. Table 1 provides an overview of some GO prices; a more detailed description of these prices can be found in Table A4 in Appendix B.
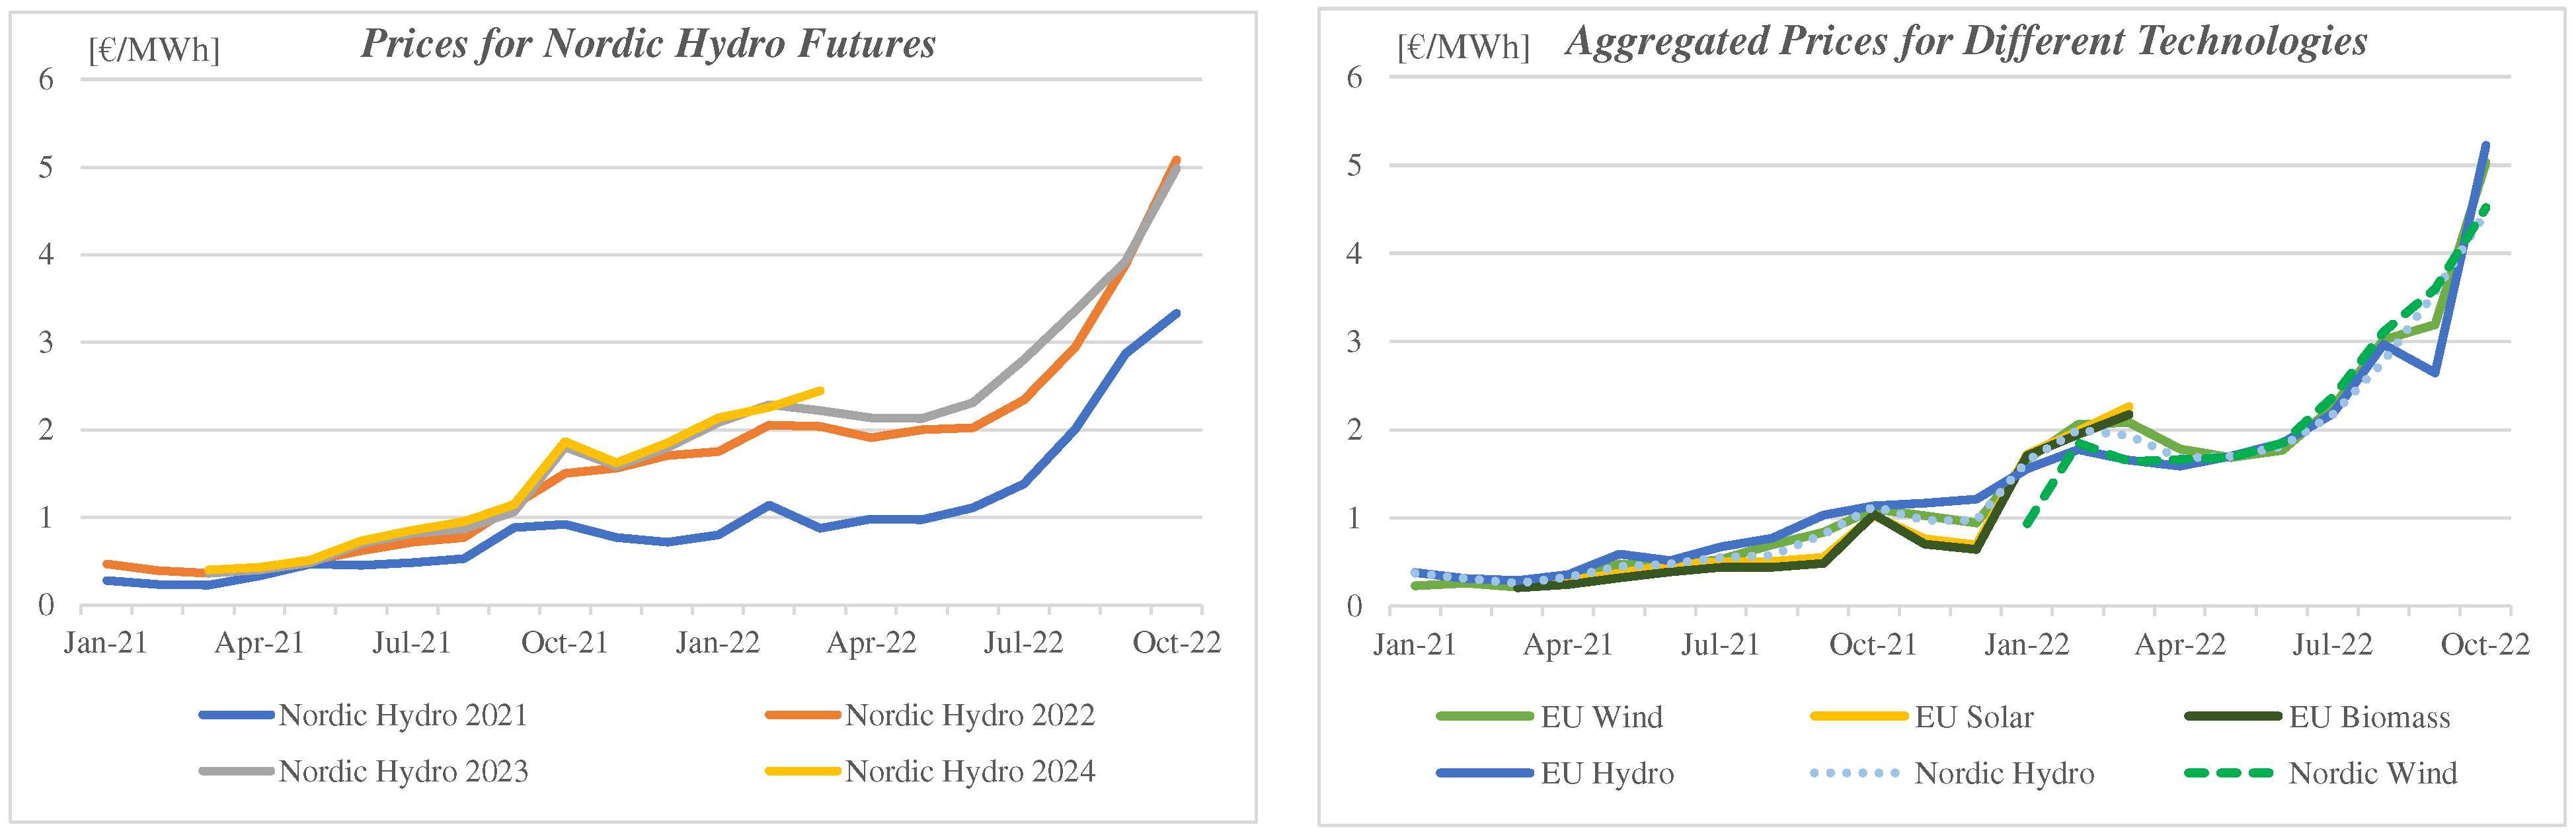
Nordic Hydro GOs, which represent green electricity generated in Denmark, Finland, Iceland, Sweden, or Norway, are the most common and serve as a benchmark for prices. Therefore, much of the available price analysis and information focuses on Nordic Hydro prices. Prices can vary for different types of GOs, depending on the location, technology, and age of the power plant. Since the introduction of the EECS, most GO prices have been relatively stable, ranging from 0.5 to 1.5 EUR/MWh. However, there have been short-term price increases in recent years, potentially due to opportunistic behavior by market participants. These increases include speculations after the Fukushima nuclear plant disaster in 2011 [23] and miscommunications regarding the United Kingdom’s GO trade [41]. In 2018, Dutch GOs reached record levels due to drought conditions and high local demand [26], the price spike also affected other GO types, although less drastically [11]. Prices also increased in 2021 due to expectations of reduced availability of Nordic hydro GOs caused by low hydro reservoir levels [42]. The Russian attack on Ukraine in February 2022 led to another significant price increase for various GO types (see Figure 2) [20,21]. These examples demonstrate the volatile nature of the European GO market.
It was found that the GO market also contains some trading activities that include futures contracts (i.e., derivatives). It is possible to trade GOs up to three years in advance, i.e., in 2022, 2025 futures could be purchased. Future prices seem to follow the current-year price level, but include a slight premium, as depicted in Figure 2. Past-year GOs can still be traded to some extent due to the lifetime of 12 months.
In 2022, the European Energy Exchange (EEX) launched a marketplace to trade GOs in an auction format through its subsidiary EPEX Spot [17]. Earlier attempts to establish such a market in 2012 failed around 2018 due to low interest [11]. This renewed attempt allows for the trade of four different types of GOs, European hydro, solar, and wind, as well as Nordic hydro, and has garnered some interest. Prices achieved in the first auction ranged from 4 to 6 EUR/MWh (auction results can be found at https://www.epexspot.com/en, last accessed on 28 February 2023), reflecting current market prices. Traded volumes are not disclosed. The high prices and increasing demand suggest that this second attempt might succeed in adding transparency to the GO market.
2.3. Willingness to Pay for Green Electricity
The determination of WTP is a central part of the proposed model as it plays an essential role in predicting the success of environmental policies and generation schemes such as GOs [43]. Here, we refer to WTP as the maximum price that a consumer is willing to pay for a certain good [44]. The literature typically focuses on the assessment of WTP for green electricity itself, not EACs, and here mostly on that of household consumers.
Calikoglu and Aydinalp Koksal [45] are an exception to this rule. They surveyed 200 Turkish industrial consumers and found that 20% of them were willing to pay extra for green electricity. They also found that WTP depends on the generation technology and highlighted heterogeneous WTP ranges and trends in different countries, impacted by various factors.
In a study conducted by the OECD [46], over 60% of consumers stated that they were willing to pay more for electricity from renewable sources than for electricity from conventional sources. This is supported by Yang et al. [47] and Sundt and Rehdanz [34], who found that, in general, people are willing to pay higher prices for green electricity.
Soon and Ahmed [48] found that WTP for green electricity varies depending on knowledge, information, awareness, and exposure to renewable energies and green electricity production, which is supported by Rowlands et al. [49], Roe et al. [43], Bollino [50], Diaz-Rainey and Ashton [51], and Knapp et al. [52]. It is therefore evident that the WTP for green electricity depends on socio-economic factors and varies between different types of consumers.
The energy source from which green electricity is generated also has an influence on the WTP [45]. Table 2 shows different WTP values in USD per month for varying green electricity sources as found by Knapp et al. [52], Grilli [53], and Borchers et al. [54].
However, it should be noted that the WTP for green electricity is limited [26]. In their study, Andor et al. [55] compared several WTP data sets from Germany and concluded that the WTP for green electricity is modest at best, and has in fact been declining. This is corroborated by Winther and Ericson [31] at the European scale, who note that Europe as a whole is failing to significantly increase consumer WTP for green electricity. In contrast to this, for North America, Yevdomikov et al. [56] estimated the development of the WTP of urban residential electricity consumers in Canada from 1991 to 2013, finding that the WTP for green electricity has been steadily increasing since 2005. The same can be said for Italian consumers who are, in general, willing to support Italian efforts to increase the production of green electricity through higher prices [57]. In their meta-analysis, Soon and Ahmad [48] conclude that, on a global average, the WTP for green electricity is in fact increasing. Finally, Hast et al. [28] find that “green electricity” products have price premiums of up to 5% compared to “standard” electricity.
2.4. Interim Conclusion on Literature
In this literature review, we discussed the information asymmetry that dominates the current GO market. Electricity consumers are seldom informed about the origin of the GOs that are used to disclose purchased green electricity, and perceived double counting reduces trust in the system. Further, we showed that the GO market, historically characterized by an oversupply, has experienced high price volatility, mainly fueled by opportunistic market behavior, with prices increasing ten-fold at times. GO prices and findings in the literature on WTP for green electricity correspond to the fact that consumers have preferences for certain technologies and origins of green electricity (and thus GOs), an essential finding for our model approach (see Section 4). All in all, while the GO system was never created as a promotional tool for green electricity, if information asymmetries were reduced by increasing price and market transparency, and GOs were not only considered as additional but often neglectable revenue schemes by producers, the concept could become a useful tool to increase renewable energy production in Europe. These findings indicate that there is a gap in the literature regarding the formulation of GO prices, and towards understanding potential drivers for supply and demand. In the remainder of this paper, we thus propose a novel model to assess the future development of GO prices in Europe until 2040.
3. Theoretical Background
The proposed model relies on certain economic theories and concepts that are discussed in the following.
3.1. Monopolistic Competition
The GO market can be interpreted as a market with monopolistic competition [58], a concept that has been used to model many different kinds of industries, but which is less well known than perfect competition. It describes a market situation where many producers compete against each other, selling products that are not perfect substitutes (i.e., that differ in branding or quality). Firms take the prices offered by the competitors as given and ignore the impact of their own prices on the prices of the other firms. Unlike in the case of perfect competition, firms maintain spare capacity. A monopolistically competitive market differs from perfectly competitive ones in two main respects: it produces heterogeneous products, and it involves a great deal of non-price competition (e.g., based on subtle product differentiation). GOs are, in their regard of usefulness to declare green electricity supply on balance sheets, homogeneous products. However, in this GO market, a firm can raise the price of its product/s without losing all of its customers because of brand loyalty, such as the preference of consumers for GOs from specific countries or technologies, implying that the supply curve might have a positive slope (from a certain price level onwards, as discussed in Section 2.1). For the demand side, however, a negative slope could occur, as customers might find alternative GO supplies at a lower cost. The theory of monopolistic competitions was thus used as guidance in the model development (e.g., regarding the slopes and shapes of the demand and supply curves, the role of transaction costs, and the modeling of technology- and country-specific GO prices).
As is the case with most other markets, the GO market is determined by the interaction of supply and demand. Normally, where supply and demand curves intersect, the market equilibrium price is found [59]. The GO market, however, has been characterized by an oversupply of GOs, as supply exceeds demand for most GO types [60]. Thus, prices in this market generally do not necessarily follow standard market-based principles, but might be influenced strongly by opportunistic behavior and transaction costs [23,41,42]. For the sake of our model (see Section 4), we argue that the GO market is characterized by a perfectly inelastic supply [61]. Here, no matter how high or low prices are, supply does not change. The historical over-supply situation mentioned above demonstrates that current GO price levels are not yet perceived as a reason to invest in new renewable energy capacity. Rather, GOs are produced more as a by-product, and income from GO sales is perceived as “nice-to-have”, especially due to low transaction costs for GO issuance [36]. The case of a change in price elasticity of supply beyond a certain boundary price could theoretically apply to the GO market, if prices were higher than the mark-ups explained, e.g., through guaranteed feed-in tariffs or feed-in premia [62].
3.2. Willingness and Ability to Pay and Environmental Concern
Although some of the findings addressed in Section 2.3 might not be directly transferable to Europe and GOs, they do indicate that environmental concern, reflected in WTP, is growing amongst the population. Research mainly focuses on household consumers, which is why studies on the WTP of industrial and commercial consumers are still scarce. The WTP for non-household consumers is estimated in our proposed model, enabling us to determine expected future GO prices reasonably well by realistically modeling the supply of GOs as well as private household and non-household sector GO demand. The WTP for household consumers is based on assumptions from the literature (see Section 5).
Our approach builds upon three general concepts: WTP, already introduced in Section 2.3, and the ability to pay (ATP), which is often referred to in public health concepts [63] and taxation [64]. ATP differs from WTP in the sense that people must have (monetary) resources that can be allocated towards a certain good or service in order to express their preferences [63], which is relevant to our study of the technology type and origin of GOs. The concept of ATP has been subject to some research in energy economics that focuses mainly on household consumers, e.g., Pederizini [65], Fankhauser and Tepic [66], and Bose and Shukla [67], while our paper, for ATP, focuses on non-household consumers. Thirdly, we rely on a measure that we refer to as environmental concern, following Rowlands et al. [49] who determined that consumers who had a high “ecological concern” were willing to pay a large premium for green electricity. Due to the lack of WTP data for non-household consumers, we introduce the parameter environmental concern as the non-household consumers’ willingness to position themselves as “green”, possibly for marketing reasons or due to supply chain regulations [68]. ATP and environmental concerns determine a consumer’s WTP, as shown in the following section.
4. Model Specification
Having demonstrated the shortcomings of the GO market and persistent price volatility, the remainder of this paper focuses on the proposed GO model design. The GO model comprises an in-depth analysis of GO issuance and calculation data, a novel approach to estimating WTP for non-household consumers, and, finally, the possibility of providing a price corridor for future GOs of different regional origin and technology. The model follows the assumption by Velazquez Abad and Dodds [37], according to whom the value of a GO depends on the size of the market, the demand for green electricity or tariffs, and the question of whether disclosure is mandatory and, if so, whether the disclosure scheme is also mandatory for complementary subsidy schemes. All this information is accounted for in our model-based approach. The model calculates average yearly prices for all types of GOs. In this set-up, depending on the observed GO type and year, situations of over-supply, as could be observed for certain types of GO in the past, such as those from Nordic Hydro, are sometimes created. For other GO types that are more desirable to consumers, such as Dutch GOs, higher prices are formed due to high demand and WTPs. Thus, in this model, if consumers have the possibility, they will always choose the type of GO that corresponds to their highest WTP. An optimization of prices does not occur.
4.1. Modeling of GO Supply
The GO market’s supply structure, characterized by monopolistic competition, must be modeled in our approach. For this, the model determines the supply of a certain type of GO for a certain point in time. GO supply is inelastic. GOs are only differentiated according to their origin o and production technology t, e.g., Spanish Solar. The amount of GOs issued in a given period p is calculated as the issuance rate of a certain country of origin o for the technology t. The issuance rate is the number of GOs issued for a technology t in relation to the produced electricity from this technology, a parameter that we assume from past data (see Section 5.1). Supplyo,t,p of a GO is then determined by multiplying the corresponding issuance rate IRo,t,p with the produced electricity Elo,t,p of technology t in period p; see Equation (1):
4.2. Modeling of GO Demand
The literature suggests that not all non-household consumers are willing to pay for green electricity [69], which our model approach addresses through the determination of the non-household consumers’ WTPs by an exogenous parameter that we earlier introduced as environmental concern, and their ATP. The ATP of a non-household consumer k is calculated at the ratio of their profits and their electricity cost (see Equation (2)) and reflects how much additional money could be spent on acquiring GOs. The values of both ATP and environmental concern range from 0 to 1.
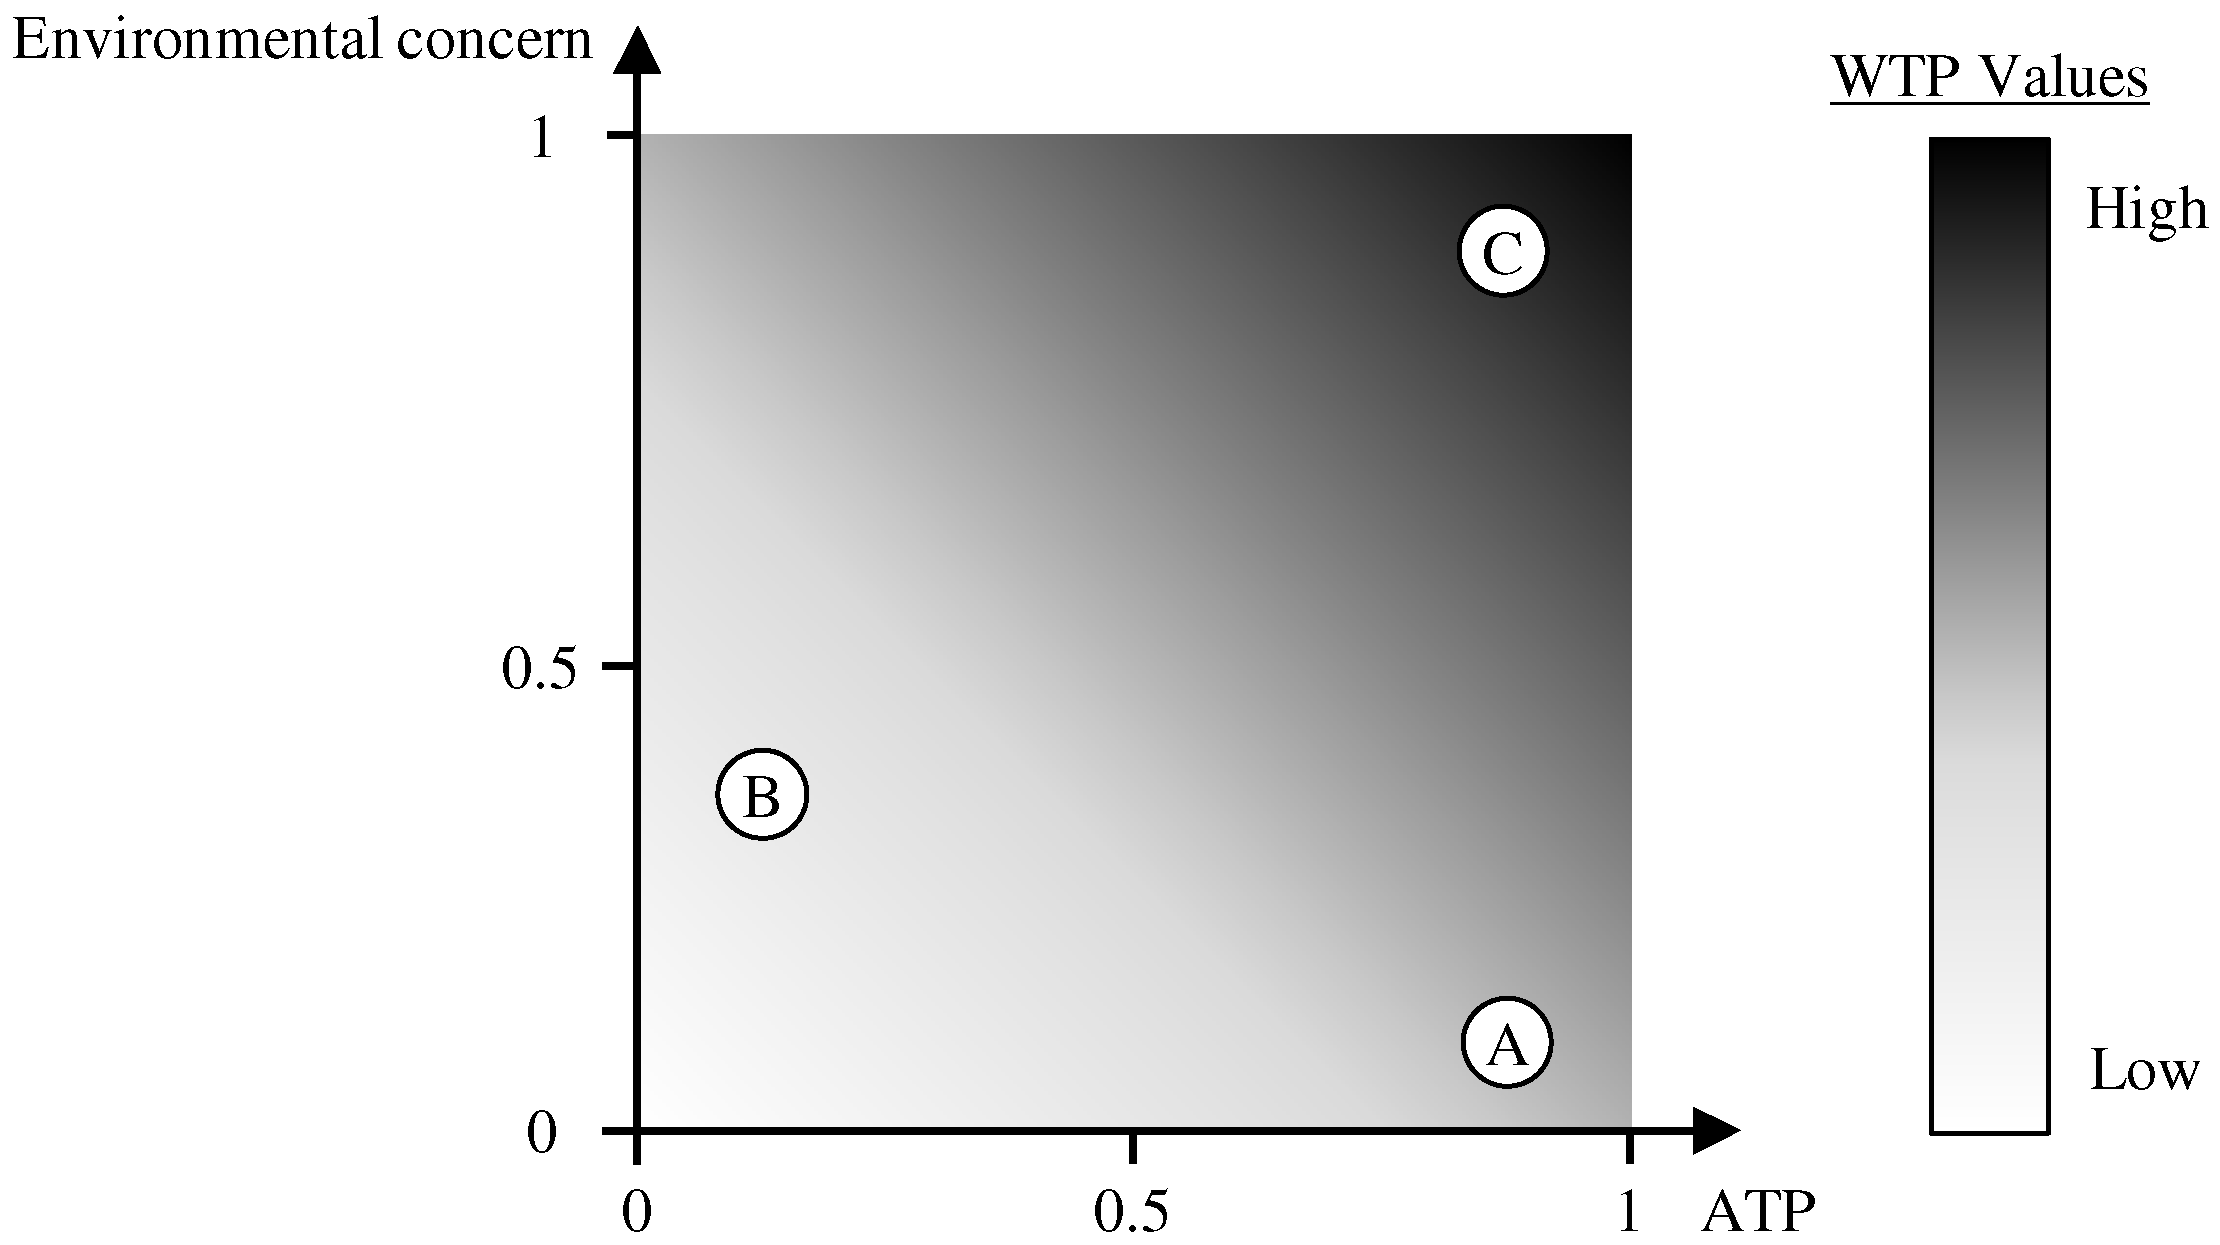
Next, the determination of the WTP from the ATP and the environmental concern is shown for three fictional non-household consumers A, B, and C in Figure 3. WTP is expressed as a share of electricity costs that will be paid extra by a consumer for the “green” nature of electricity, referred to as the relative maximum willingness to pay WTPmax,rel,k of a consumer k. In this example, A’s environmental concern value is low, but ATP is high. A is therefore willing to pay a limited surplus for green electricity, but not as much as C who has higher values for both factors, and thus the higher WTPmax,rel,k. WTPmax,rel,k can range from 0 to 1. In contrast, a household consumer h is given a fixed parameter value for WTPmax,rel,h based on assumptions from the residential WTP literature on green electricity. Thus, from here on, the approaches for household consumer h and non-household consumer k are conducted analogously (see Section 5). Obtained values for WTPmax,rel,k and WTPmax,rel,h are then multiplied with the corresponding electricity prices PEl,k in EUR/MWh to determine specific maximum WTPmax,k (see Equation (3)). In the following, to avoid redundancy, the approach will only be described for a non-household consumer k, but it also applied to household consumers.
Putting illustrative values to this, consumer C might be willing to pay an additional 30% of the electricity costs for the acquisition of green electricity, while A will pay 15% extra, B 10%, and the household sector consumer D, say, 35%. Assuming universal electricity prices of 10 EUR/MWh, A will pay an additional 1.5 EUR/MWh for green electricity, B 1 EUR/MWh, and so on. This is WTPmax,k that is then reduced by derating factors to mirror individual consumer preferences based on consumer k’s country c for GOs of origin o, DFc,o, and technology t, DFc,t, as GO prices depend on origin and technology [37]. The calculation is shown in Equation (4).
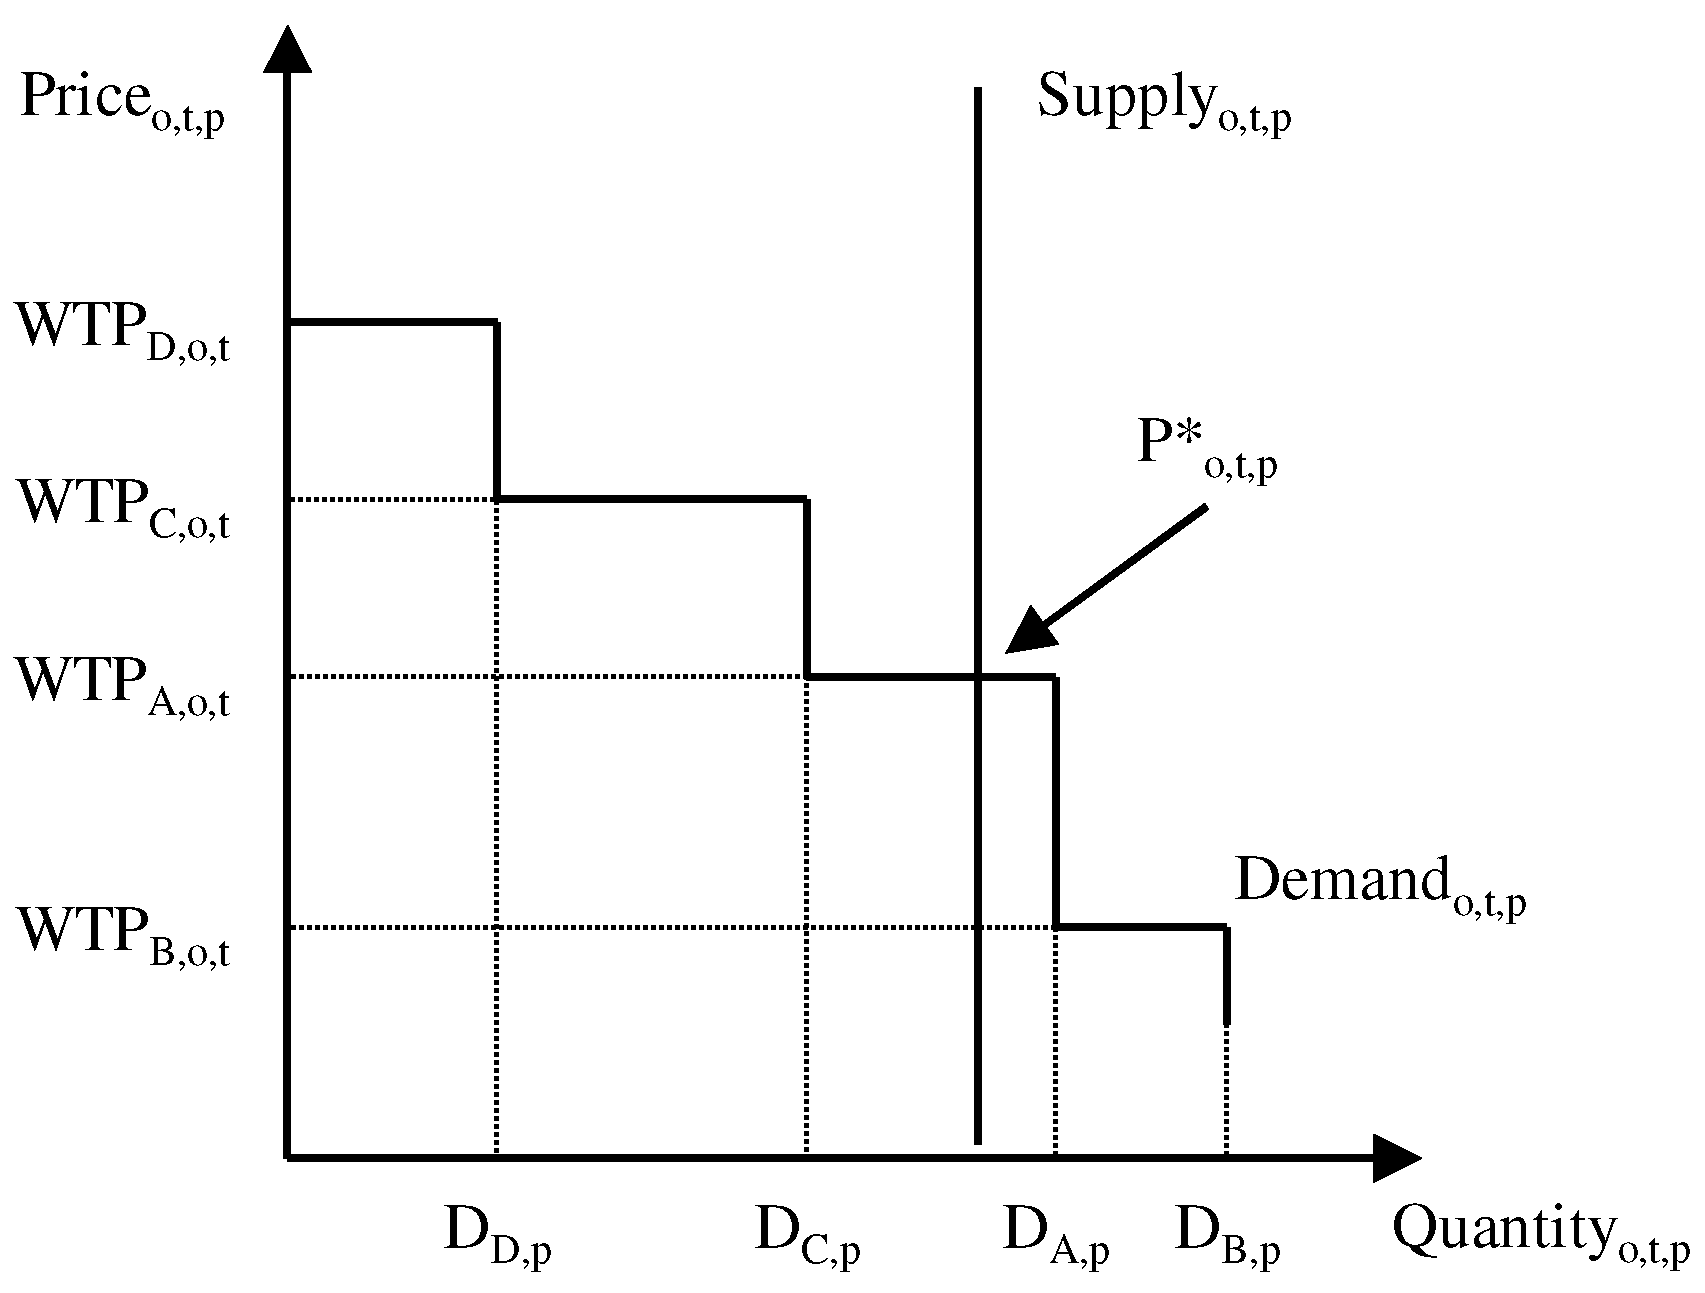
Next, the calculated WTPs are sorted in descending order. The demand of the consumer with the highest WTP for a GO of origin o and technology t is satisfied first. GO demand is assumed to be exogenous. Once this demand is satisfied, demand corresponding to the second-highest WTP, in this case consumer C, is satisfied next. This is repeated until the supply of this type of GO has been used up. The equilibrium price P*o,t,p of a GO of origin o and technology t in a period p is the smallest WTP that corresponds to the consumer who was able to satisfy at least one MWh of their demand, in this case consumer A. Demand DA,p is then decreased by the number of acquired GOs of this type and satisfied by GOs corresponding to the next-lowest WTP of this specific consumer A. This procedure is repeated for every type of GOo,t. Thus, the demand curve follows a declining step function characteristic and has a negative slope (see Figure 4).
4.3. Model Assumptions and Limitations
The assumptions provided in the section focus on limiting the model’s scope and apply to all four scenarios considered. Assumptions regarding the data and scenarios will be provided in the corresponding sections.
Considering the consistent number of expiring GOs, producers issue GOs irrespective of whether they will be able to sell them [60]. This leads to the assumption that transaction costs are negligible, although some registries do charge modest fees for the issuance and trade of GOs [36]. This behavior of GO issuance regardless of the possibility of trading is implemented into the model by applying perfect inelasticity to the supply curve, as discussed in Section 3.1. Thus, the amount of GOs issued per type of GO depends on RES production and estimated GO issuance rates only.
An analysis of GO issuance shows that seasonality exists in supply and demand. However, from AIB data it is not possible to determine whether transactions and cancellations of GOs depend on which month they were issued; one can only determine that GOs were canceled in a given country in a given month [60]. Adding to this, the lifetime of GOs is limited to 12 months. We thus argue that opting for a yearly approach is more appropriate.
For certain types of GOs, the inelastic supply curve will not be met by the remaining demand for green electricity. Thus, for some GO types, the equilibrium price will not be found and thus results in a price of 0 EUR/MWh. Therefore, we assume that demand exceeds supply from a certain year onwards. This depends on the expected development of demand.
Historically, prices for the least-desired GOs, Nordic Hydro, are at a minimum of 0.05 EUR/MWh (see Table A4 in Appendix B). In our model, prices are determined by the lowest WTP that may lie below past minimum prices. Thus, the fact that GOs seem to have a lower price boundary is neglected.
The upper price boundary is assumed to be limited by the lowest levelized cost of electricity (LCOE) for green electricity in a given year. As GOs only represent the “greenness” of electricity but do not include the physical delivery of the electricity itself, consumers will not pay a GO price that exceeds the LCOE of green electricity, as they would have to additionally purchase the physical electricity to be as well off as when buying green electricity. These LCOE values are determined by the LCOE for wind or solar photovoltaics, as these renewable technologies are expected to have the lowest LCOE [70,71].
Due to limited insight into the GO market and the lack of knowledge regarding the age of the issuing power plants, GOs are only differentiated from one another by their country of origin and technology.
The WTP values that ultimately determine the prices of future GOs are determined through an analysis of past data. Calculations and assumptions regarding the future change of WTP for GOs would add further uncertainty to the model. Therefore, calculated WTPs for GOs of certain consumers remain constant over the complete timeframe considered.
Similarly, sectoral socio-demographics also do not change over time. However, their future electricity consumption will be changing according to the literature; some recent developments are discussed in Section 5.
5. Data and Scenarios
In total, the market for GOs has been growing since its introduction in 2001 and is expected to continue to do so in the future [20]. All GO data that were used are publicly available on the AIB website. Note that the data provided to the AIB by its member states is inconsistent because some countries report fully on cancelation but neglect reporting on issuance [60]. Due to these limitations, data about individual countries’ issuance, trade, and cancellation were available on a monthly basis from 2016 onwards. Figure 5 shows the data flow diagram for our proposed model. Along the left branch, we show how data for the supply side is gathered, as described in Section 5.1, while the right branch focuses on consumer demand and WTP, for which a data overview is given in Section 5.2.
5.1. GO Data
GO data are provided in two different ways. The first type of data—the so-called production statistics—refer to the month and year when the electricity was produced. The second type of data—transaction statistics—refer to the month and year when the transaction of the GO took place. For this model, the amount of GOs currently existent in the registries connected to the AIB Hub was relevant. Thus, all analyses were conducted with transaction data [60]. Following Kuronen and Lehtovaara [79], a shifted calculation approach was used for the cancelation data. For this paper, the EECS member countries (as of end-2020) were divided into six categories, depending on their regulations regarding the issuance of GOs (see Table 3). This gives an indication of the level of regulation and harmonization in and amongst AIB member states. Issue rates, i.e., the share of issued GOs in green electricity production, vary between technologies and categories, as shown in Table 4.
The results of a more detailed analysis of the GO market in terms of issuance, cancelation, trade behavior (i.e., whether the country acts as a trade hub due to low transaction fees), and further parameters can be found in Table A7. Note that for the determination of the input data for the model, the assumed amount of future GO volumes per country and technology must be calculated first. For this, data for electricity production is taken from the IAE World Energy Outlook [73]. Future GO volumes are based on the aforementioned issuance rates and are assumed to increase by 5% annually from 2025 onwards. Countries can begin issuing GOs starting in 2025 for technologies for which they had not issued GOs previously. The development of electricity production from technologies depends on the scenario considered (see Section 5.3).
5.2. ATP-WTP Data
To calculate the ATP and eventually the WTP for GOs, Eurostat was chosen as the main data source. The data sets used for the calculation of the relevant parameters of the model are listed in Table 5. First, sector categories had to be matched between tables “nrg_cb_e” (No. 2) and “sbs_sc_ind_r2” (No. 4) in order to be able to compare revenues and the number of companies with the respective electricity consumption by following Eurostat [80], as these tables provide their metrics for different sector categories. For this study, sectors corresponding to Level 2 of the Classification of European Economic Statistics (NACE) sectors were chosen. Refer to Table A6 in the Appendix B for more details.
Next, the average electricity consumption per NACE sector was calculated on the country level by weighting the consumption provided in the energy balance (No. 2) with the respective revenues (No. 4). This allows for the distribution of average energy consumption (No. 2), given in non-NACE sectors, on a NACE-sector category level. Then, this consumption per NACE sector was divided amongst the different size categories according to the respective proportions of total sector revenues given in data set No. 4. By dividing the resulting values by the number of companies of a specific NACE sector of a specific size in a specific country, the average electricity consumption for a given company in a given sector in a given country was determined. The approach for Swiss consumers was conducted analogously.
Then, price data, taken from data sets Nos. 3 and 5, were matched to the afore-calculated average electricity consumption per sector, size, and country for determining the average electricity costs. The ATP is then calculated on the same level of detail. The average profits, derived from data set No. 4, are divided by the obtained average electricity costs, giving ATPk, as described in Section 4.2.
The environmental concern, a vital part of this model’s WTP calculation, was estimated based on assumptions of the different NACE sectors’ exposure to environmentally concerned consumers, private or commercial. For example, companies belonging to the sector “Manufacturing of basic metals” (C24) are likely to have less concern for environmental issues than companies in the sector “Manufacture of food products” (C10), as the latter are more involved with consumers who are conscious about the environmental impact of their purchases. Sectors that had representatives in the RE100 initiative were assumed to have a higher environmental concern, depending on their respective goals [81]. The values used for this analysis are reported in Table A6 in Appendix B.
As shown in Section 4.2, the WTPmax,rel for non-household consumers is assumed as a value dependent on ATP and environmental concern (see Table 6), expressed as a discrete percentage value that was then multiplied with the corresponding electricity price. The WTPmax,rel for European households was taken from OECD [46]. Derating factors to determine consumers WTPk,o,t depending on the origin o, the technology t of the GO and, for the former, the country c of the consumer are listed in Table A8 and Table A9 in Appendix B. Note that in this case, we did not differentiate technology preferences by country.
Correction factors were applied to the WTP values obtained. As prices for GOs must be paid on top of electricity prices and GOs are the least attractive form of green electricity acquisition, these WTPmax,rel values are reduced for households (see Table A5), and a correction factor of 0.15 is applied to all WTPk,o,t after multiple test runs had exceeded upper price boundaries. An exemplary calculation of the WTP for two types of consumers is described in the Appendix A.
From the above-described calculations of average electricity costs, industrial and private electricity demand could be derived until 2017. Expected future electricity demand is based on assumptions in the “Stated Policy Scenario” of the IEA World Energy Outlook [73]. Thus, this model only covers the timeframe from 2020 to 2040. The assumed initial demand for green electricity, to be covered by GOs, is assumed at 558.63 TWh (21.57% of total demand) because an overestimated demand would result in unrealistically high prices for GOs. By 2040, it is assumed that 50% of total electricity demand will be covered by GOs, resulting in a compound annual growth rate (CAGR) of 9% for the initial green electricity demand.
5.3. Scenario Description
Long-term modeling underlies unavoidable uncertainty regarding policy, demand, supply, and price development, amongst other factors [82]. To provide a range of results that could be feasible in the long term, the application of scenarios that differ from one another in terms of certain assumptions is necessary [83]. Thus, given the model’s scope to 2040, we calculate GO prices for four scenarios that differ mainly regarding demand and supply development The heterogeneity of regulations between AIB member states has been subject to criticism of the system, as discussed in Section 2.1, and is thus chosen as one variable of the scenarios below. The scenarios thus provide the extreme cases that could occur in terms of renewable energy production and regulatory harmonization amongst AIB members, thus providing bounds for expectable GO price developments.
Scenario 1 (“Status Quo”): In the first scenario, it is assumed that regulations in the AIB regarding harmonization of regulations amongst members were not put in place. Additionally, countries would not increase their RES production by introducing new technologies if they had not used that certain technology before. Industry demand and electricity supply would follow the Stated Policy Scenario of the IAE World Energy Outlook [73].
Scenario 2 (“Sustainable Development”): Scenario 2 assumes a more sustainable development of industry and household demands in alignment with the IEA’s “Sustainable Development Scenario” [73], reflected by increased demand for electricity. The production of electricity from RES is assumed to be greater than in the status quo.
Scenario 3 (“Full Harmonization”): The third scenario is characterized by full harmonization of regulations amongst AIB members concerning the issuance of GOs in the EECS, creating a level playing field for GO branding in Europe. Here, all AIB member countries are given issue rates corresponding to the average issue rates of category 5 (see Table 3 for the category definition and Table 4 for average issue rates per technology), effectively banning the issuance of GOs for subsidized electricity production. This could be perceived as one possible measure against perceived double counting.
Scenario 4 (“Ideal Development”): The fourth scenario combines assumptions made in Scenarios 2 and 3. While the development of supply, i.e., green electricity production, and demand is determined by the assumptions made in Scenario 2, GO issue rates correspond to those estimated in Scenario 3. Therefore, this scenario represents a green transition paired with full harmonization amongst AIB members.
6. Results and Discussion
In the model application runs, four scenarios were considered. Each scenario had different assumptions regarding future RES generation and the regulations of the various European GO markets. The scenarios were briefly described in Section 5.3, while the results are compared in the following. All prices are shown as weighted averages (WAVG), i.e., average prices are calculated based on the proportion of respective GO types in the total amount of issued GOs. Additionally, annual growth rates (CAGR) are calculated.
6.1. Scenario Comparison
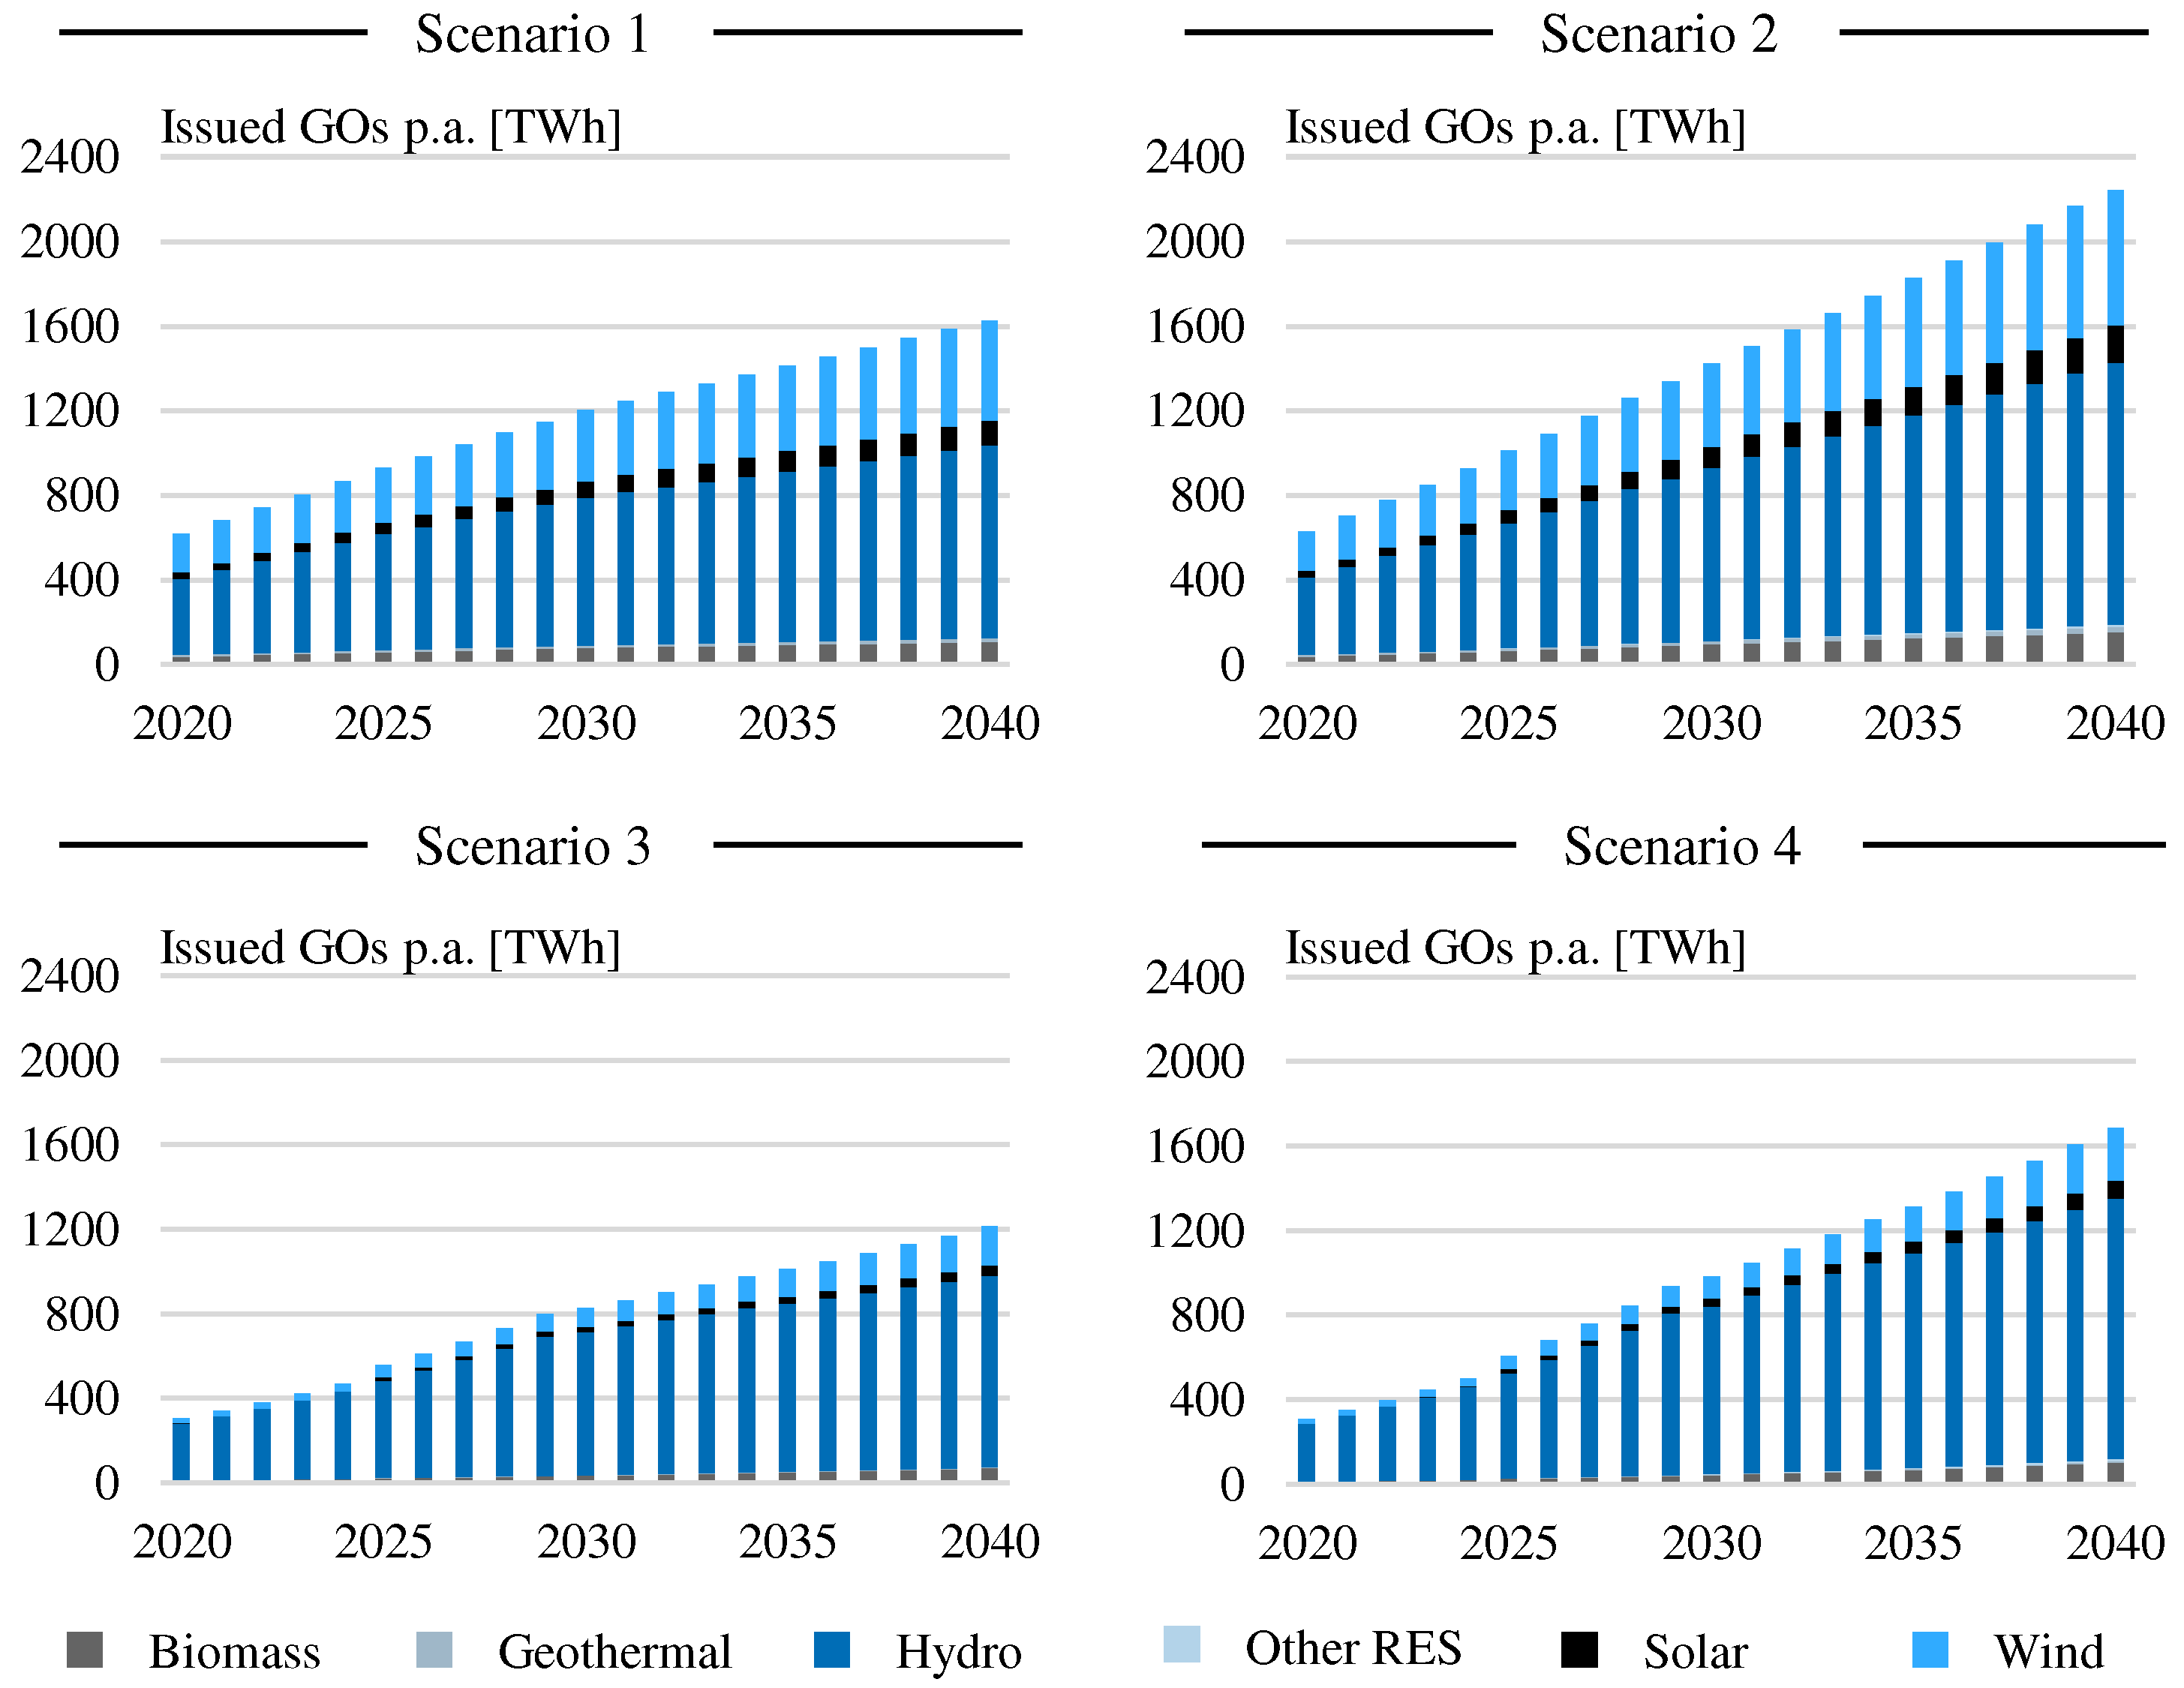
When directly comparing the amount of GOs issued amongst the different scenarios, as shown in Figure 6, these volumes vary greatly between the scenarios. The highest GO volumes were found in Scenario 2. That result is plausible, as this scenario assumes an increased production of green electricity compared to Scenarios 1 and 3, and has no further regulations concerning the limitation of GO issuance for subsidized electricity in place. This means that countries that had high issue rates in Scenario 1 issued more GOs in Scenario 2 because their electricity production from RES increased. In Scenario 3, however, green electricity generation is at the same level as the status quo, but regulations concerning the issuance of GOs for subsidized electricity are in place. This results in a reduction in the supply of GOs, as countries would produce the same amount of green electricity as in Scenario 1, but issue rates would be substantially lower than before. Scenario 4 combines the assumptions made in Scenarios 2 and 3. Initial GO volumes are at a similar level as in Scenario 3 but increase rapidly to exceed volumes seen in Scenario 1 by 2040. This is supported by the average CAGR for Scenario 4 which, with a value of 8.85%, shows the highest value amongst all scenarios. In all scenarios, hydro GOs are the most abundant ones, followed by wind GOs.
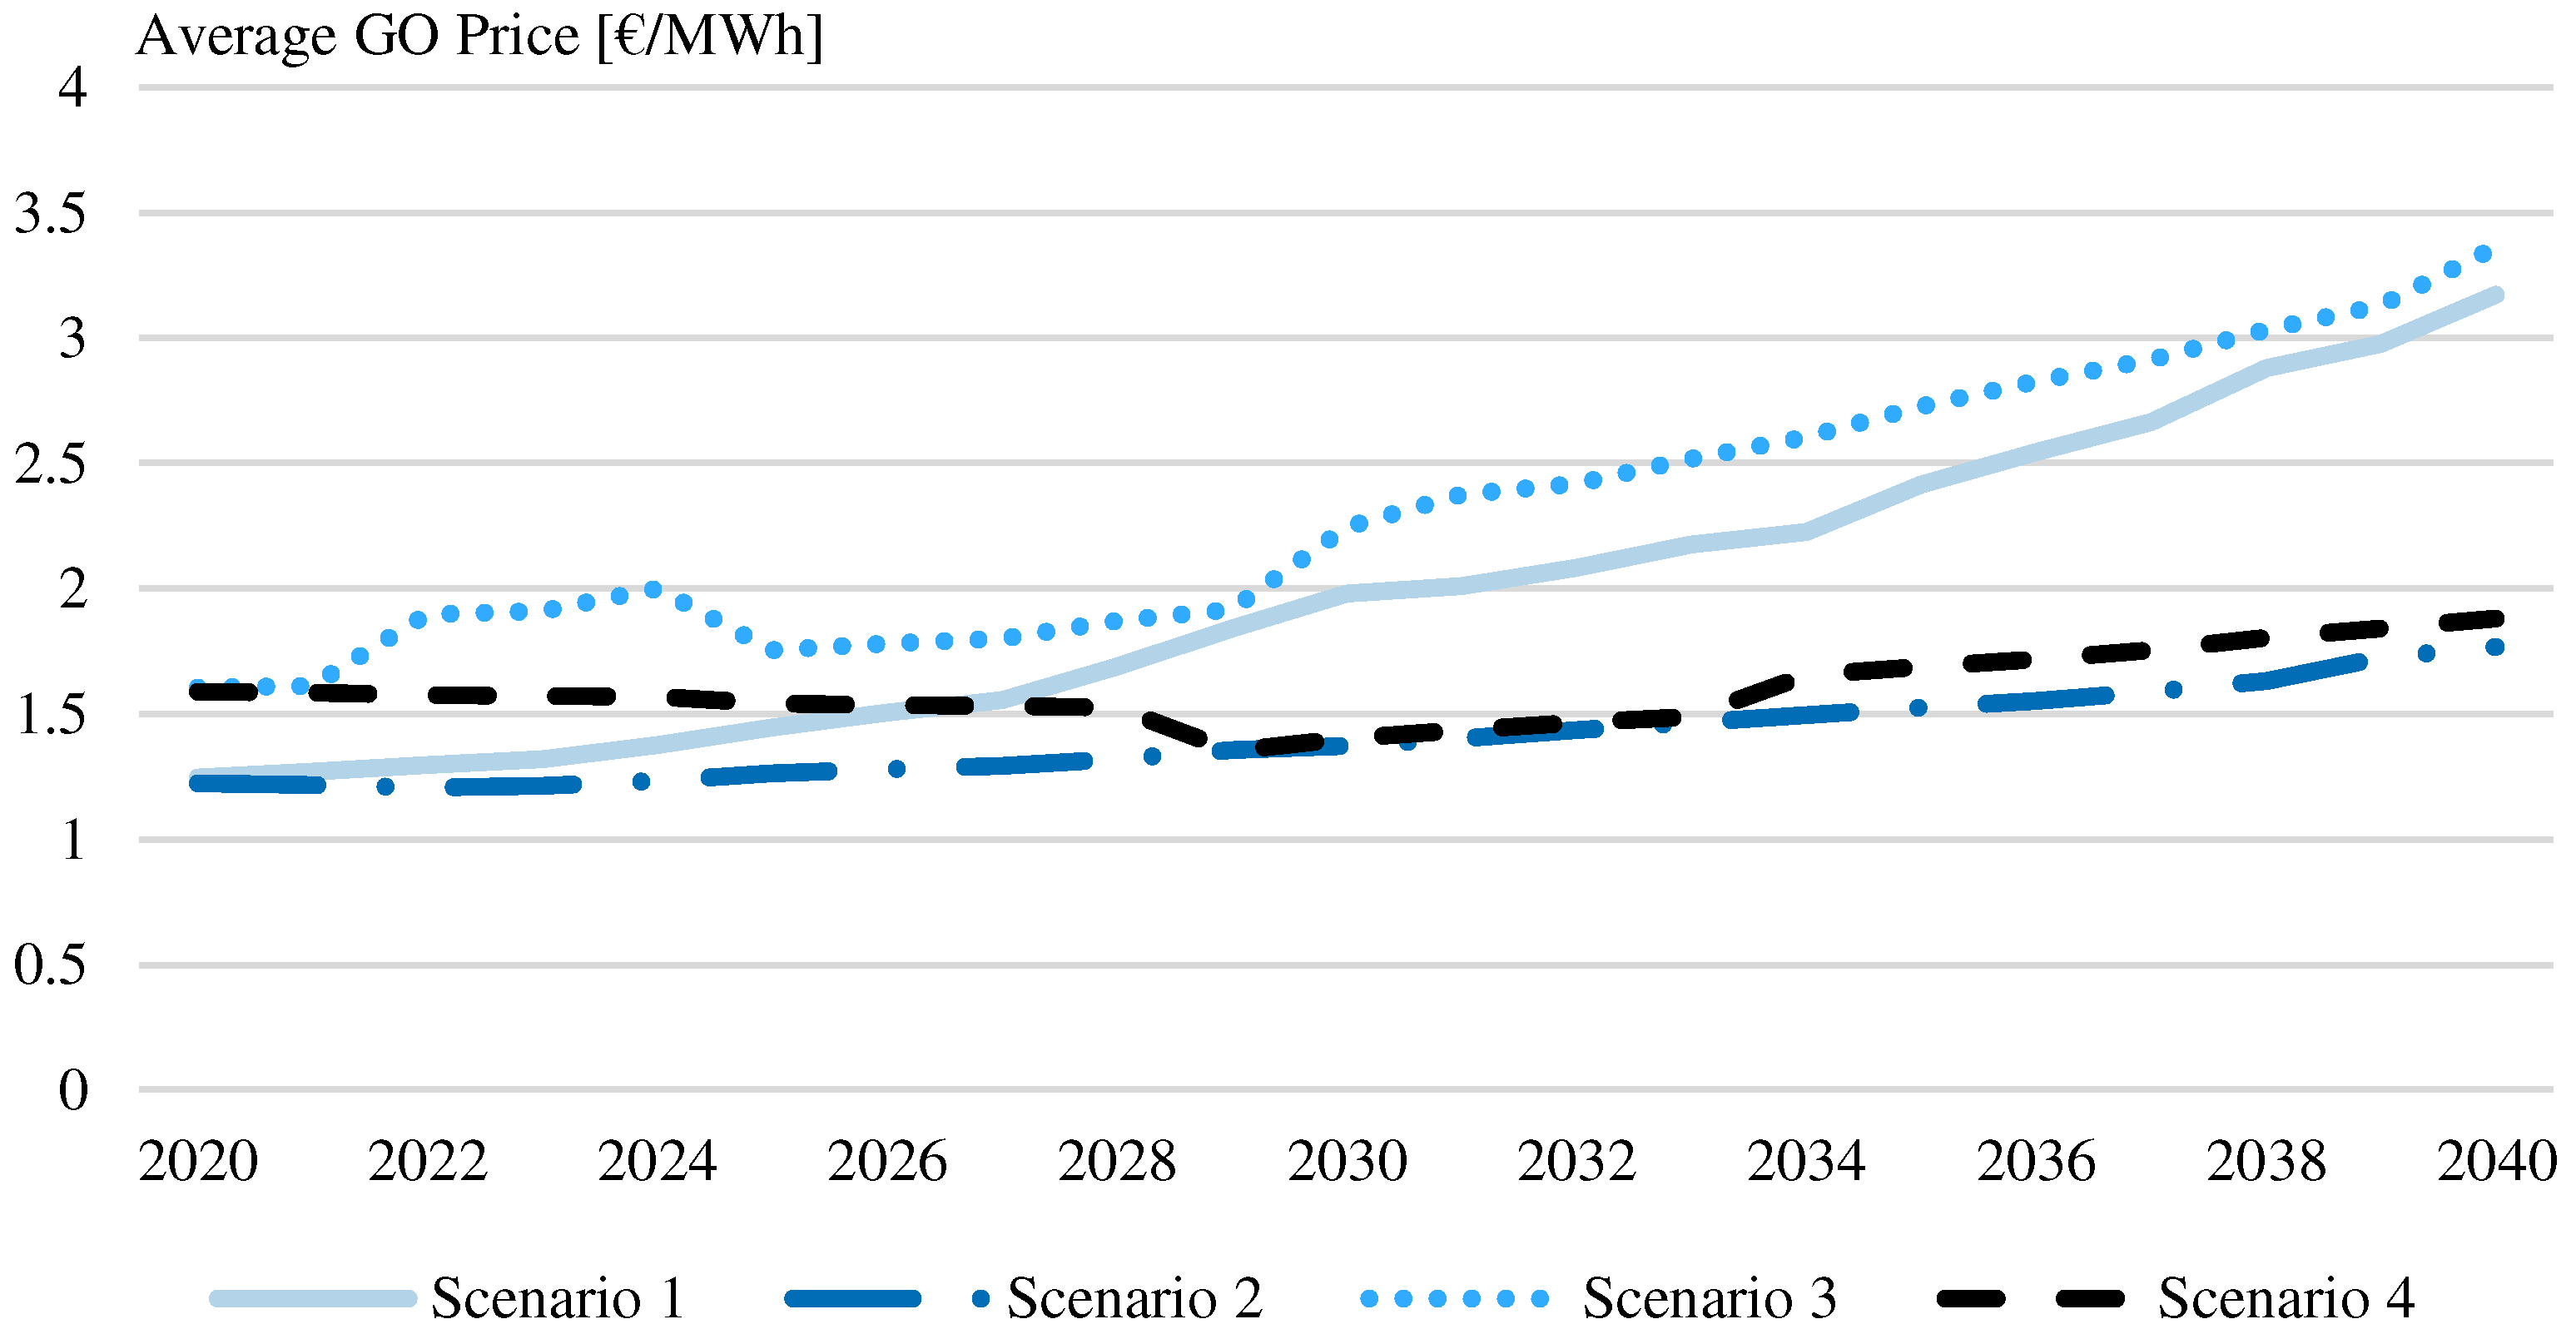
To make prices comparable, the WAVG is calculated over all technologies and countries per scenario. Across all four scenarios, the price corridor ranges from 1.22 to 1.61 EUR/MWh in 2020 and 1.77 to 3.36 EUR/MWh in 2040. This results in the price developments shown in Figure 7. Here, on average, GO prices in Scenario 3 are highest throughout the complete regarded timeframe. In this model, prices are determined mainly by the interaction of demand and supply. Therefore, it makes sense for the highest prices to occur in the scenario with the lowest supply, i.e., Scenario 3 (see Figure 6). Consequently, the lowest prices are found in the scenario with the highest supply (Scenario 2). As the initial GO supply in 2020 was lower in Scenario 4 than in Scenario 1, it is no surprise that average prices in Scenario 4 are slightly higher than in Scenario 1. With supply having increased over the years, a fall in prices is to be expected.
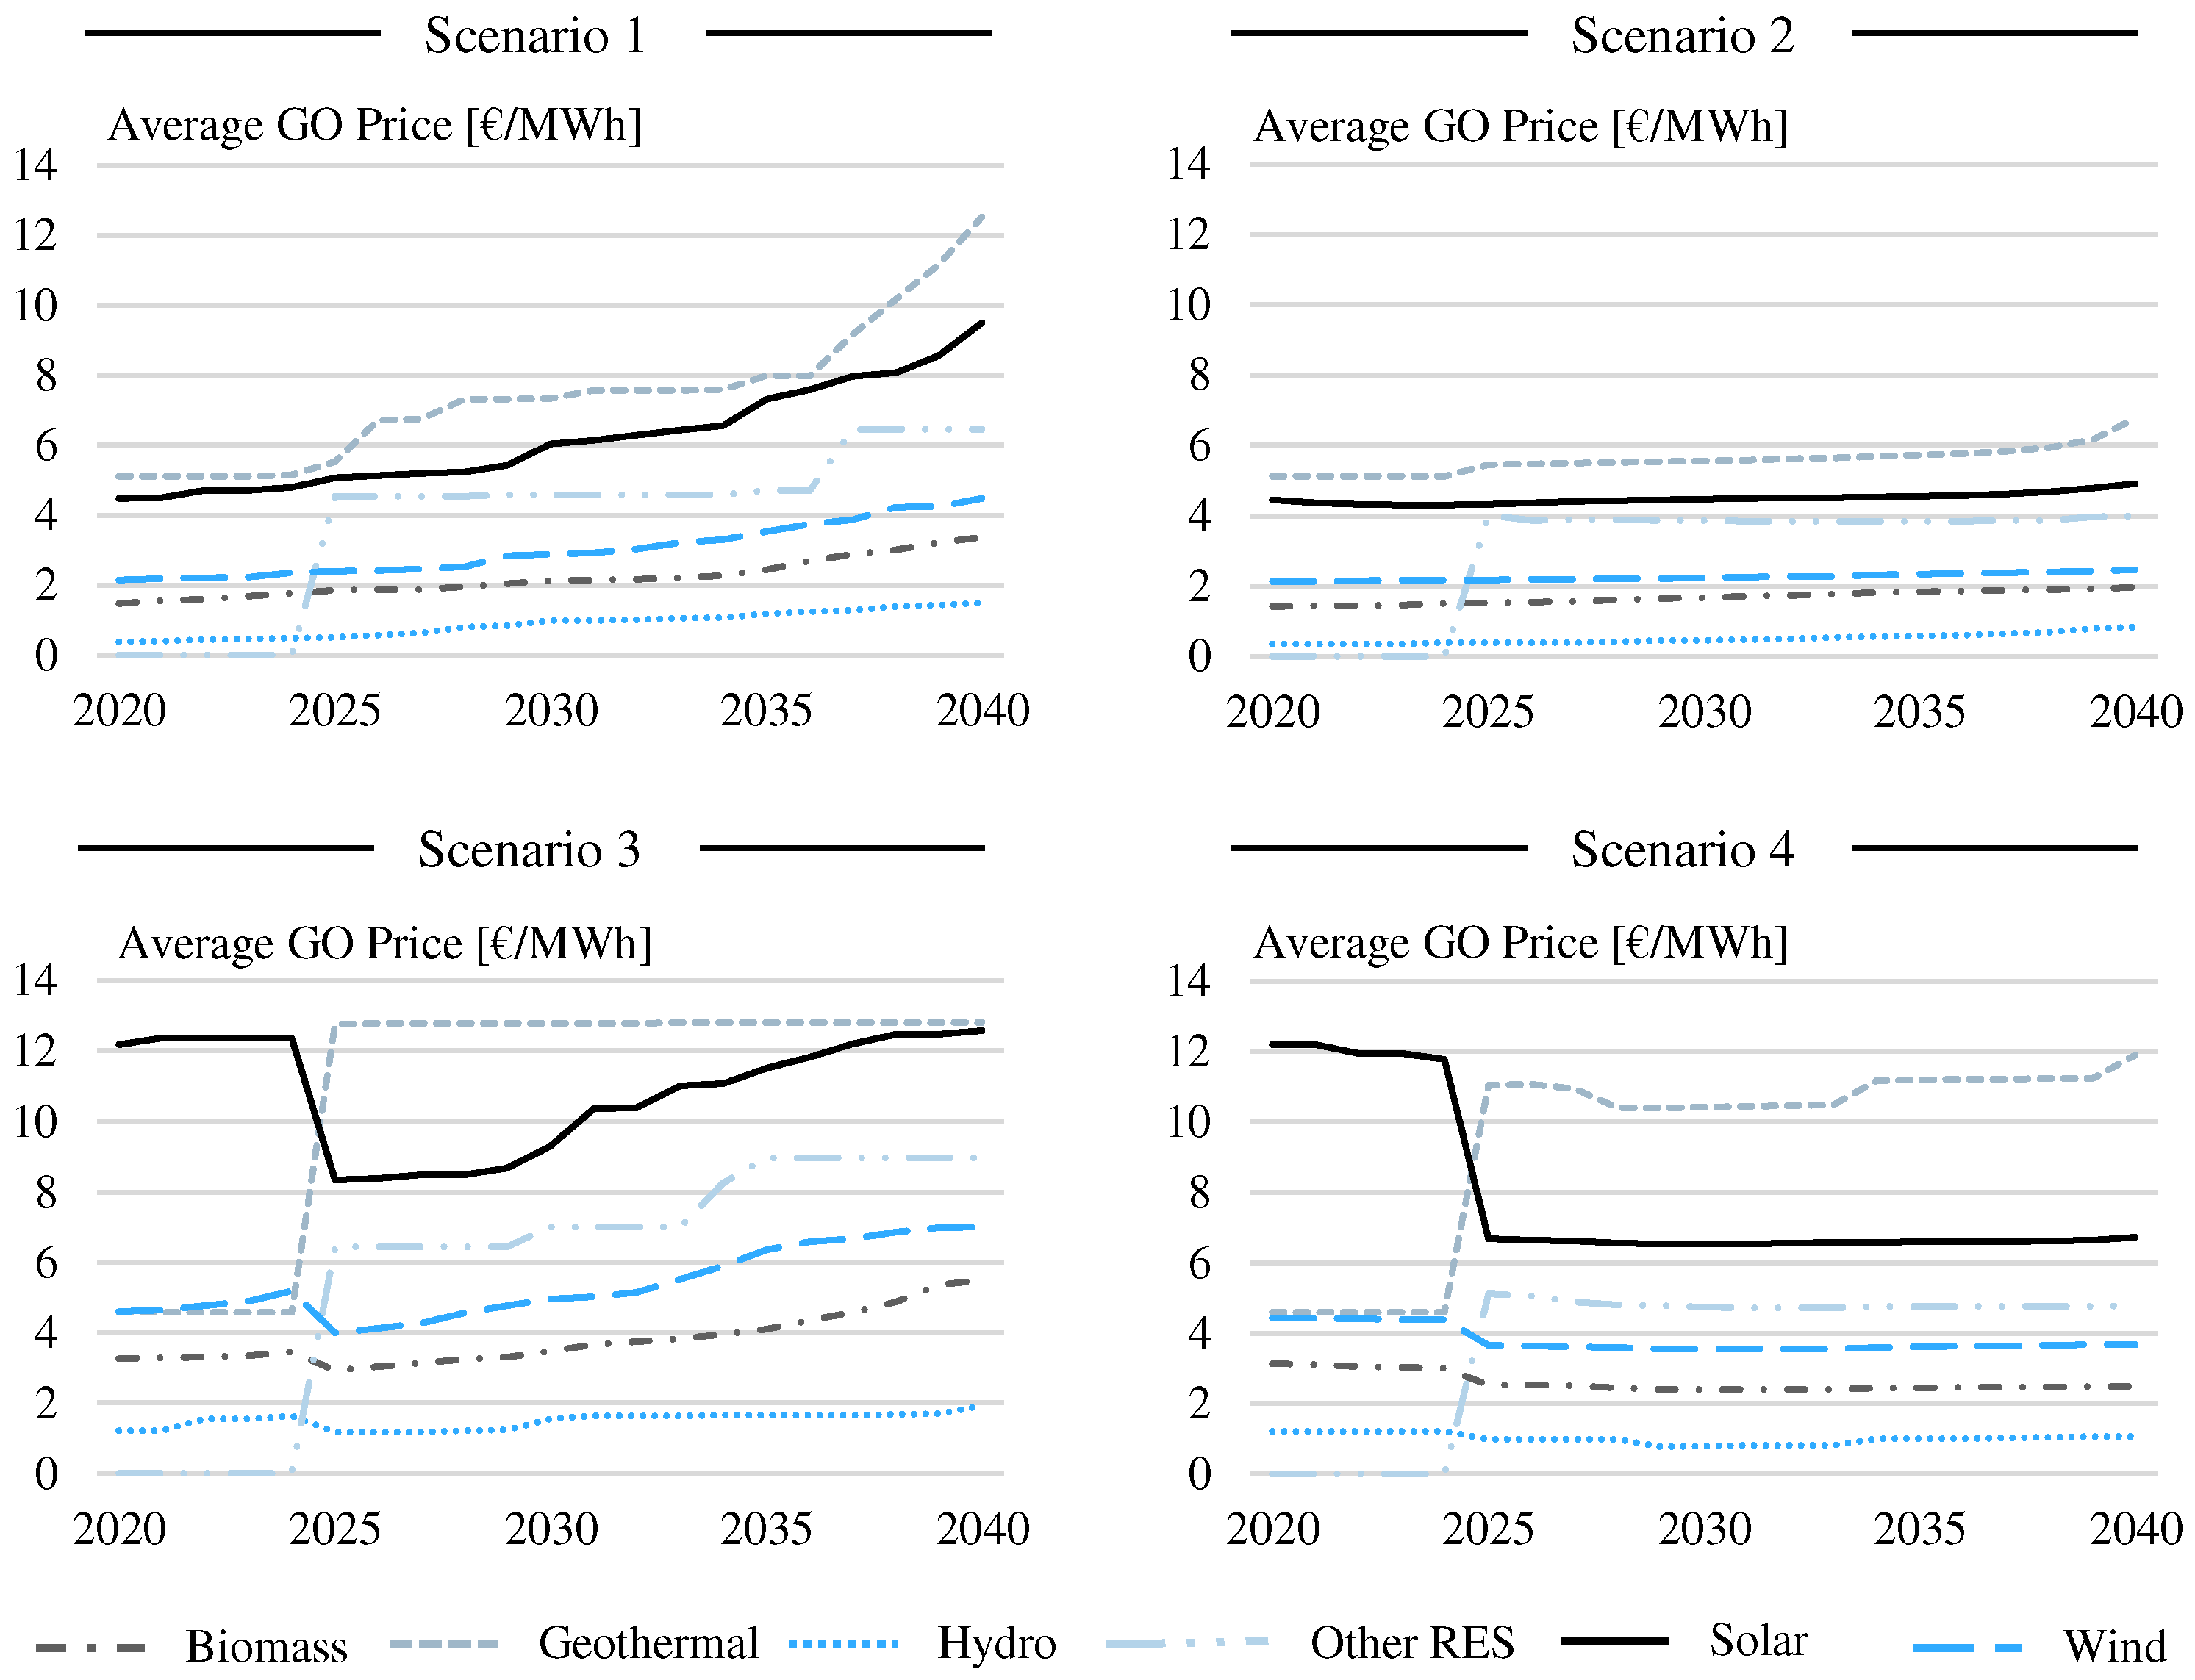
When comparing average GO prices for the different technologies, the same pattern arises amongst all four scenarios. While in Scenarios 3 and 4, in the beginning, geothermal GO prices are lower than other GO prices, they eventually surpass all other technologies and continuously fetch the highest prices from 2025 to 2040. For all scenarios considered, the next highest prices in descending order are for solar GOs, other RES, wind, biomass, and hydro GOs. In Scenario 3, however, prices for geothermal and solar GOs in 2040 are close to each other, with average prices of 12.82 and 12.57 EUR/MWh, respectively. The development of these prices for each scenario is depicted in Figure 8. Additionally, Table 7 provides an overview of prices per technology for each scenario for the years 2020, 2030, and 2040.
When closely examining Figure 8, it can be noticed that around 2025, GOs of the type “other RES”, and in Scenarios 3 and 4, also those of the types “geothermal” and “solar”, experience sudden jumps in GO price levels. For GOs of the type “other RES”, this is explained by the issuance of this type at the beginning (i.e., in 2025). The drop in solar GOs in the last two scenarios can be explained by the increase in GO supply that occurs from 2025 onwards. In these scenarios, issue rates, and thus GOs on the market, are limited by assumed harmonization measures amongst AIB members. In 2025, when countries begin issuing GOs for technologies that had previously not received any GOs, supply increases, and, as the market is demand-driven, prices are reduced. However, for geothermal GOs, the opposite price development occurs. Here, when supply increases in 2025, prices also increase. This is caused by the sudden appearance of more desired geothermal GOs on the market. From 2020 to 2024, the only geothermal GOs on the market that are available in sufficiently high quantities to affect GO market prices are from Iceland. The WTP for Icelandic GOs is low, however, compared to other countries, because of the geographical derating factors that were applied to the WTP values (see Table A8).
Consequently, when geothermal GOs from other countries enter the market, the overall price will increase because consumers have higher WTPs for these GOs. Additionally, in reality, such jumps would probably not occur. Instead, these price changes would likely follow a less steep curve, as technology portfolio diversification and increased GO issuance would happen more gradually.
On average, over all scenarios, geothermal GOs are the most expensive ones. This finding changes when looking at different countries in the scenarios. In the scenarios that assume an increase in green electricity production by adding previously unused technologies to their technology portfolio, i.e., Scenarios 2 and 4, the highest prices are ultimately determined by geothermal GOs, as the WTP for these is the highest and a scarcity of such GOs exists in all countries. However, in Scenario 1, solar GOs are the most expensive ones in Belgium, Denmark, Switzerland, Spain, and the Czech Republic, amongst others. In other countries, e.g., Ireland, wind GOs are the most expensive ones over the complete timeframe. Changes regarding technology-wise price ranking occurred in ten countries. In Germany, prices for geothermal GOs exceed those of solar GOs from 2025. In 2025, Slovenian solar GOs become more expensive than Slovenian hydro. In Scenario 3, nine countries experience a change in the most expensive GO by technology. Here, in most countries, solar GOs experience the highest prices. By 2040, only six countries feature geothermal GOs achieving higher price levels, and only four countries experience wind prices that exceed solar GO prices.
When minimum prices are regarded, a similar pattern to that in the prior maximum price analysis arises. In general, one technology is dominant: for all four scenarios, hydro GOs reach the lowest prices in most countries. Hydro GOs are currently by far the most abundant type of GO in the EECS. Therefore, when keeping the model’s design in mind, these results are to be expected. Only a few exceptions occur; the most notable in each scenario is Cyprus, where the lowest prices are for wind GOs up until 2025. Then, in Scenarios 1 and 3, biomass becomes the cheapest technology. In Scenarios 2 and 4, from 2025 onwards, hydro GOs were even cheaper.
Note that one of the assumptions in the model is that no lower price boundary exists. This becomes important when considering prices for Norwegian hydro GOs in Scenarios 1 and 2. Here, up until 2022 and 2027, respectively, prices of 0 EUR/MWh are calculated. This results from the still occurring over-supply of GOs in these two scenarios, explained by Norwegian hydro being one of the most abundant types of GO and consumers having the lowest WTP. In Scenario 2, where the number of issued GOs is highest, the same occurs for Swedish hydro GOs up until 2023.
6.2. Validation of Results
As the model addresses future price predictions, validation of the results will only be possible in the future (ex post evaluation). However, the GO market offers futures (derivatives) contracts, sometimes for up to several years into the future. Thus, these futures prices can be used as an indication of the model performance but must be treated with caution due to the aforementioned opportunistic behavior of GO market participants. Price developments are discussed in Section 2.2.
As an additional indication of the plausibility of the model-based results obtained in our study, two surveys from the literature that had asked participants to estimate the development of future GO prices were scrutinized. In the results of the first survey, conducted by Greenfact [84], expected prices for 2021 were between 0.2 and 0.3 EUR/MWh for hydro and between 0.3 and 0.4 EUR/MWh for wind GOs. In the other survey, participants were asked to state their price expectations for German GOs independently of the respective technology. For 2025, the average price was expected to be approximately 1.6 EUR/MWh. Prices were anticipated to increase to just over 2 EUR/MWh by 2030 [85]. These surveys were conducted amongst market participants and experts but can only give an indication of possible price developments, as GO prices are subject to speculation and regulatory changes and are likely influenced by external events (incl. shocks) too.
When examining prices for wind GOs in 2021, the results obtained in the scenarios greatly exceed the estimations expressed in the first survey. In Scenarios 1 and 2, average prices for wind GOs are expected to lie at 2.19 and 2.14 EUR/MWh, respectively. In Scenarios 3 and 4, price levels practically double. Here, they reach levels of 4.64 and 4.43 EUR/MWh, respectively. The lowest prices for wind GOs, and thus closest to the given estimation in the survey, are those calculated for GOs from Norway in Scenario 1. These prices are estimated at 0.97 EUR/MWh in 2021, and thus still exceed the price expectations of the market participants by more than 100%, but are in the range of the prices of the futures contracts in 2022 and 2023, and prices observed in early 2022 (but less so at the end of 2022).
On average, hydro GO prices are closer to the estimate than wind GO prices. In Scenarios 1 and 2, prices for GOs from hydropower in 2021 are calculated at 0.41 and 0.37 EUR/MWh, respectively. This is very close to the average GO price from the first survey. In both scenarios, prices for hydro GOs in Norway and Sweden reach zero. This means that the demand for these two GO types exceeds supply. In the other two scenarios, average hydro GO prices are expected to reach 1.23 and 1.22 EUR/MWh, respectively. Due to these scenarios’ assumptions regarding the harmonization of regulations, and the resulting reduction in GO issue rates amongst AIB member states, a situation of oversupply does not occur for any type of GO. However, once again, prices for Norwegian hydro GOs are the closest to the survey results. These prices were calculated at 0.24 EUR/MWh in 2021. Swedish GOs are the ones with the next lowest price at 0.6 EUR/MWh.
In general, in the model results, prices for GOs from Germany are slightly below the European average. As can be seen in Table 8, prices calculated in the first scenario are closest to the survey results. In Scenario 2, the supply of GOs is raised by increasing the production of green electricity and the diversification of technology portfolios in all countries. Consequently, GO prices are lower. The opposite occurs in Scenarios 3 and 4. Here, prices are far higher and exceed by far the survey’s results in 2025 and 2030, caused by the limitation of the supply of GOs in the EECS.
An additional validation tool is the comparison of the model results with historic prices. Prices ranging up to 8 EUR/MWh for certain types of GOs, in this case Dutch GOs, have been observed in the past. Additionally, when demand is high enough, a situation which has in the past been artificially stimulated through opportunistic behavior on the market, prices greatly exceed current levels and even surpass average prices calculated in the model presented here. When regarding prices paid for GOs issued by new power plants, i.e., those that are not older than six years, a similar observation can be made, as these prices are found to reach levels of up to 3.4 EUR/MWh. Swiss GOs even reached prices ranging up to 4 EUR/MWh, which is higher than any average result for this type of GO in any scenario of our study (see historic prices in Table A4 for a further comparison). Price levels of around 5 EUR/MWh, seen in late 2022, might give reason to assume further price increases—although the market will likely cool down, and thus prices will decrease again, as has been observed in the past.
Therefore, following the reflections in this section, we find that the GO prices obtained from the model calculations are, in general, in the range of previously seen and currently traded futures prices. For some scenarios and certain GO types, prices resemble the estimations made by market participants and experts. Some anomalies occur, such as high prices for geothermal GOs or solar GOs (in Scenarios 3 and 4). However, while geothermal GO prices cannot easily be verified or falsified due to a lack of historic price information, the solar GO prices can be explained by the scenarios’ drastic reduction in supply and consequential creation of higher prices through the limitation of GO issue rates and increased harmonization amongst AIB member states.
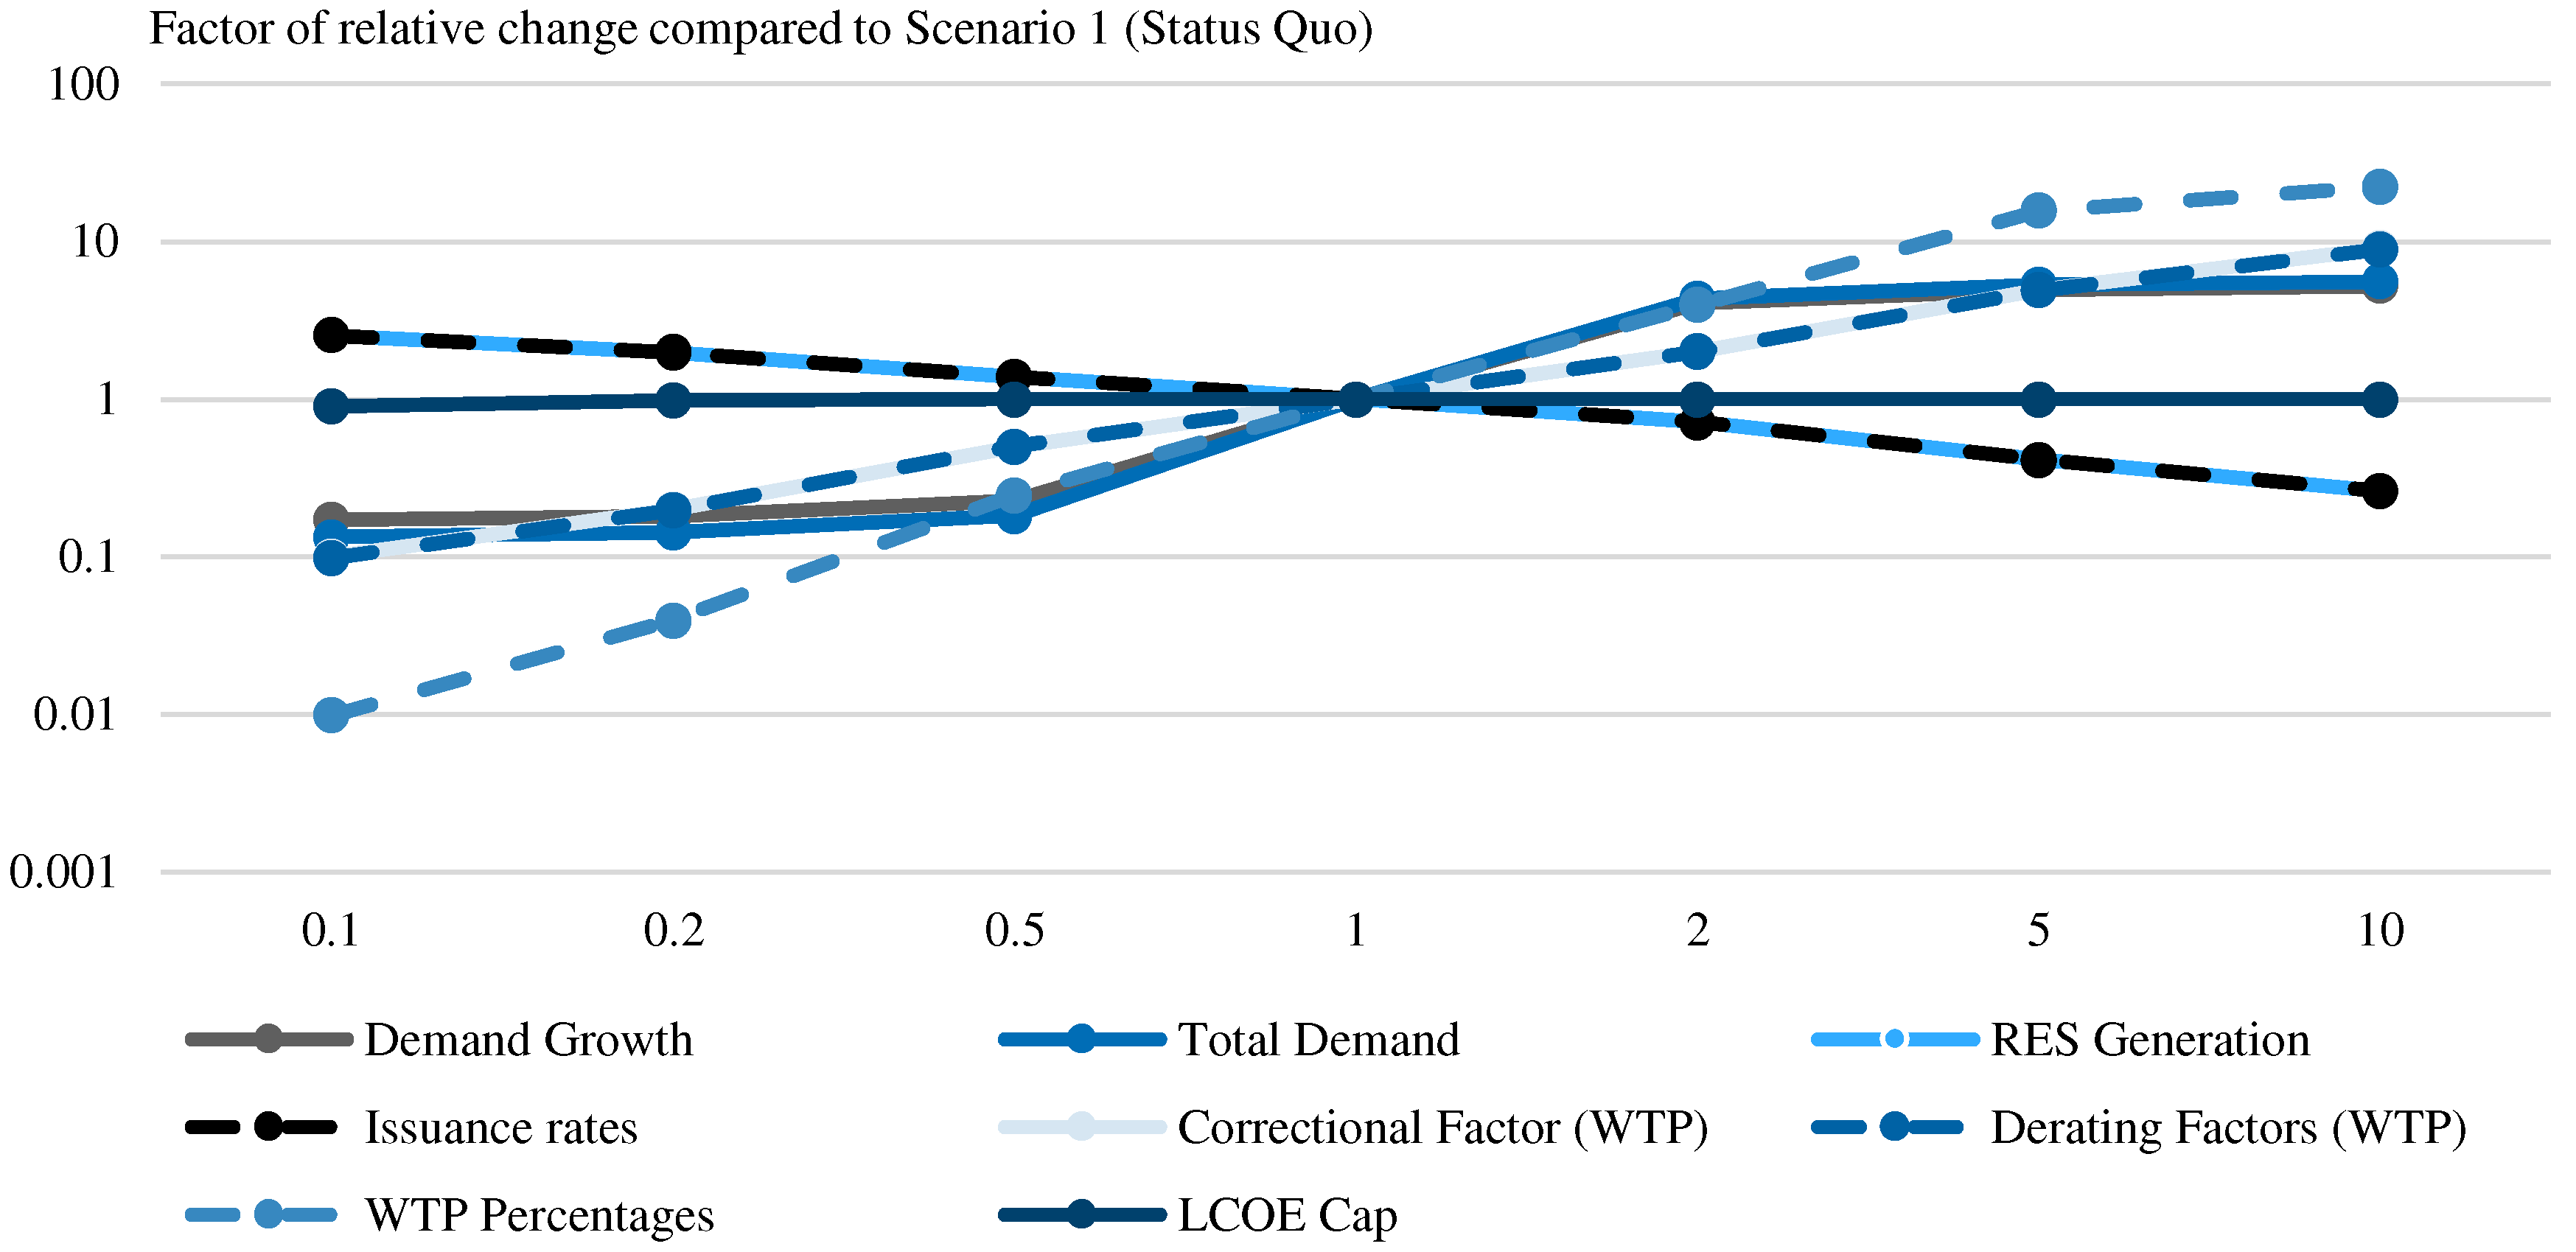
6.3. Sensitivity Analysis
A sensitivity analysis reveals the model’s dependence on different input variables. The results are shown in Figure 9. Six variations were conducted for each selected parameter or variable. The first three reduced the selected parameters’ values by factors of 0.1, 0.2, and 0.5, respectively. The other three calculations increased the same values by factors of 2, 5, and 10. The variable “WTP percentages”, setting values for WTPmax,rel, had the highest influence on GO prices, while the LCOE cap had almost no influence. This gives an indication of the robustness of the model-based results. The logarithmic scale was chosen to adequately show the price variations (it was applicable since no negative values occurred).
6.4. Limitations of the Model
The model proposed in this paper is a first attempt at bringing transparency to the opaque and volatile market that the EECS represents. By analyzing GO issuance and cancellation data as well as providing a novel approach to estimate non-household consumer WTP for green electricity, this model is an important contribution to the existing literature on GOs. Nonetheless, some necessary simplifications had to be made, either to the model itself or due to limited data availability, that should be addressed in future research using this approach.
Firstly, as most GO data is issued on a monthly basis, differences in GO prices based on seasonality could be introduced to future versions of the model. Given that GOs are valid for 12 months after issuance, a yearly approach is sufficient for the long-term estimation of a price corridor, as provided in this study, but a higher resolution could bring further accuracy to the results. This could even be extended to temporal matching, enabling to analyze proposed reforms of the GO system (see Section 7).
Secondly, future improvements to the model should include some form of price elasticity to reflect the fact that, realistically, there is an upper limit to WTP. This limit was introduced here as a cap determined by wind and solar LCOE, but price elasticity could more accurately depict consumer behavior.
Thirdly, while forecasting prices over 10–20 years into the future always brings a certain range of price uncertainty, the chosen approach of a deterministic WTP calculation could be improved by providing reference data from a survey-based determination of WTP for GOs from household and non-household consumers.
Finally, some assumptions chosen in the data could be revised, such as the constant rate of growth for green electricity demand, or the development of issuance rates from EECS member countries whose influence on the scenario results was shown in Section 6.3. Further variations and scenarios based on these factors could improve the validity of the model results.
7. Conclusions and Policy Implications
The aim of the present paper was to increase transparency in the European GO market. This was executed by first analyzing developments and shortcomings of the EECS, and then by introducing a model to estimate future GO prices. Our goal was achieved by first providing an overview of the situation in the 26 AIB member states. Based on extended analyses of European energy demand and supply, structural statistics, as well as publicly available GO data, our model-based analysis was then able to provide new insights into possible future price and volume developments of GOs for different technologies and origins on a yearly basis up until 2040. The scenario-based approach highlighted the dependency of the GO market on regulations regarding, e.g., the issuance of GOs for subsidized electricity. When examining the prices that were obtained from the model calculations, it is found that most GO types reach levels that had previously occurred in the market. Comparing these prices to expert expectations from surveys, we can conclude that these results are quite realistic when taking the uncertainty of the used data and the mentioned opportunistic behavior of market participants into account. External events, such as Europe’s energy crisis in 2022, influenced market behavior and were not foreseen by the model. The approach for determining and projecting GO prices suggested could, in principle, be easily adapted to countries or regions outside of Europe. It would require, after checking the degree of market non-transparency (a main motivation to follow the approach suggested), taking the prevailing regulatory boundary conditions and willingness to pay/ability to pay adequately into account.
Although GOs were originally introduced to disclose the production of green electricity to European consumers—a purpose that they generally fulfill—the public opinion of this system is negative, as GOs currently provide little or no incentive to increase the production of green electricity. For GOs to become relevant in green electricity producers’ investment decisions, prices must increase to levels exceeding current governmental support schemes and subsidies for RES. For wind GOs, these prices range between 15 and 25 EUR/MWh, for solar GOs from 17 to 22 EUR/MWh, and for biomass GOs up to 89 EUR/MWh [86]. However, even in Scenario 3, where full harmonization amongst participating AIB member states is assumed—and thus a substantial reduction in the supply of GOs on the market—prices are on average far off these targets, with geothermal and solar GOs achieving average prices of just over 12.5 EUR/MWh in 2040.
With increasing numbers of renewable energy plants falling out of support schemes, e.g., old wind turbines in Germany having reached the end of the 20-year subsidy period, GOs might become a possible revenue stream in addition to wholesale electricity sales. These plants are usually fully written off and do not require further subsidization to be operated profitably, and if repowering is not an option, they might continue to run, and generate GOs outside of the German Doppelvermarktungsverbot [87].
Therefore, we can conclude that under the current market regime, GOs are not likely to become a dedicated policy category for the promotion of green electricity production in Europe. Still, if policy-makers were to further increase harmonization amongst issuing AIB member states, as is currently occurring in the FaStGO project [88], GOs could lose their negative image, and the often stated arguments of (perceived) double counting and “greenwashing” could be refuted [88]. This would allow GOs to become another form of support mechanism for the much-needed acceleration of electricity system decarbonization. In July 2021, the European Commission introduced a proposal for an amendment of the Renewable Energy Directive (RED) that would effectively lead to the elimination of the German Doppelvermarktungsverbot. On the one hand, this would address the issue of heterogeneous regulations (and perceived double counting) but, on the other hand, would likely cause a drastic increase in the GO supply which would then result in significant price decreases [89].
However, if prices for GOs increased, as forecasted by the model, consumers willing to purchase green electricity at low costs might switch to other alternatives for green power acquisition, such as PPAs, that have a more direct impact on the increase in green electricity production. With corporate awareness on the rise, and companies pursuing to create a “greener” image of themselves, GO prices will likely increase further in the medium to long term. The aspects of local green electricity generation and additionality, i.e., the establishment of additional renewable power plants, are gaining importance, and can only be addressed by issuing and canceling the corresponding GOs on a regular basis.
Finally, it can be said that in the wake of European efforts to decarbonize the economy and to significantly increase the amount of RES in electricity production, the GO market volume will increase in the coming years. As both household and corporate consumers are expected to become more aware of the necessity to purchase green electricity, demand will increase and drive GO prices to higher levels.
With current policies and the actual state of harmonization in the market, however, the GO system will not be able to overcome the trust issues that it is currently experiencing. Additionally, prices will remain at levels that will have only marginal effects on the increase in green electricity production. Therefore, harmonization amongst AIB member states concerning the issuance of GOs, the provision of GO data without discrepancies, the promotion of the GO system as a provider of viable and trustworthy disclosure, and the creation of a possible further RES production incentive system based on GOs must receive higher priorities by European policy-makers. These steps would allow the GO system to become a market-driven incentive model and would free up governmental funds that could be invested in other projects concerning the decarbonization of European economies. Further, GOs could become an independent form of market-based support scheme to foster electricity system decarbonization that allows more active participation (‘empowering’) of consumers and could reduce mistrust issues in general related to the origin of green electricity. Recommendations recently published by the European Commission point towards the necessity of harmonization amongst EU member states, and the allowance of GO issuance for subsidized electricity to reduce public spending [90], while the association of European transmission system operators ENTSO-E advocates the introduction of “temporal matching” of GOs, i.e., matching GOs on an hourly (or even more frequent) basis instead of yearly, to reflect the actual value of produced electricity, and for the consideration of market barriers between countries that reflect transmission system stability [91].
Consequently, future research should focus on reducing the limitations of our proposed model and increasing its accuracy. This should include the adaptation of price elasticity. Additionally, by analyzing GO data on a monthly basis, currently the smallest available time unit, seasonal factors in the production of green electricity could be included and thus provide a more accurate depiction of the real market situation. To analyze the effect of the above-proposed policies, temporal matching on an hourly or maybe even 15 min basis could be included. A major factor of uncertainty was the determination of the WTP for green electricity—and thus also for GOs—for industrial and commercial consumers. A survey-based determination of this WTP would not only improve future GO price models’ results but could also be applied to other research focusing on alternative acquisition possibilities for green electricity, thus providing valuable new insights potentially useful in other research focusing on the promotion of RES in electricity production.
Author Contributions
A.W.: Research conceptualization, literature review, model definition, software, data gathering and curation, validation, writing—original draft and review and editing; R.M.: Research conceptualization, theoretical background, literature review, validation and supervision, writing—original draft and review and editing. All authors have read and agreed to the published version of the manuscript.
Funding
This research received no external funding and the APC was waived.
Data Availability Statement
All data described in Section 5 and the model documentation and code can be accessed at Github: https://github.com/alexwimmers/GO-Price-Forecast-Model/tree/GO-model (accessed on 18 December 2023).
Acknowledgments
The authors gratefully acknowledge helpful comments received from several anonymous reviewers and participants in the 2021 ENERDAY, in the Alpenforce conference “Energieforschungsgespräche Disentis 2022” (26–28 January 2022, Disentis, Switzerland), especially Werner Hediger, and from Siamak Sheykhha of FCN.
Conflicts of Interest
The authors have no conflict of interest to declare.
Abbreviations
| AIB | Association of Issuing Bodies |
| ATP | Ability to pay |
| CAGR | Compound annual growth rate |
| EECS | European Energy Certificate System |
| EEX | European Energy Exchange |
| EPEX | European Power Exchange |
| EU | European Union |
| GHG | Greenhouse gases |
| GO | Guarantee of Origin |
| IEA | International Energy Agency |
| LCOE | Levelized cost of electricity |
| MWh | Megawatt-hour |
| NACE | Statistical Classification of Economic Activities in the European Community (nomenclature statistique des activités économiques dans la Communauté européenne) |
| OECD | Organisation for Economic Co-operation and Development |
| PPA | Power purchase agreement |
| RED | Renewable Energy Directive |
| RES | Renewable energy sources |
| WAVG | Weighted average |
| WTP | Willingness to pay |
Appendix A. Exemplary WTP Calculation
For clarification purposes, we include two exemplary calculations for two industrial consumers. The detailed approach and data sources are described in Section 4.2 and Section 5.2, respectively. Consumer A belongs to NACE sector C24, is from France, and is a company with more than 249 employees. In contrast, Consumer B belongs to NACE sector C10, is from Slovakia, and is a company with 20 to 49 employees. In a first step, the ATP for both consumers is calculated for the years 2010 to 2017, the results of which are shown in Table A1.

Table A1.
Exemplary ATP calculation for Consumers A and B.
| Consumer | 2010 | 2011 | 2012 | 2013 | 2014 | 2015 | 2016 | 2017 | |
|---|---|---|---|---|---|---|---|---|---|
| A | Profits in EUR | 767,893.40 | 710,532.00 | 687,090.53 | 677,405.95 | 812,933.47 | 1,039,870.53 | 1,060,647.87 | 1,271,280.00 |
| Electricity cost in EUR | 818,437.58 | 690,850.18 | 744,681.60 | 757,992.45 | 789,018.15 | 874,278.53 | 790,451.80 | 856,901.92 | |
| ATP | 0.94 | 1.03 | 0.92 | 0.89 | 1.03 | 1.19 | 1.34 | 1.48 | |
| B | Profits in EUR | 15,436.30 | 18,209.15 | 12,350.88 | 18,455.85 | 20,502.86 | 23,950.27 | 19,967.06 | 23,164.93 |
| Electricity cost in EUR | 26,412.85 | 29,174.22 | 28,129.60 | 39,799.36 | 40,521.65 | 39,919.53 | 34,994.40 | 24,292.21 | |
| ATP | 0.58 | 0.62 | 0.44 | 0.46 | 0.51 | 0.60 | 0.57 | 0.95 |
After ATP has been calculated, WTPmax,rel can be calculated by matching the ATPs of Consumer A and B with their environmental concern values for each year. This value is then multiplied by the average electricity price to yield WTPmax, shown in Table A2.
Table A2.
Exemplary WTPmax calculation.
| Consumer | 2010 | 2011 | 2012 | 2013 | 2014 | 2015 | 2016 | 2017 | |
|---|---|---|---|---|---|---|---|---|---|
| A | ATP | 0.94 | 1.03 | 0.92 | 0.89 | 1.03 | 1.19 | 1.34 | 1.48 |
| Environmental concern | 0.40 | 0.40 | 0.40 | 0.40 | 0.40 | 0.40 | 0.40 | 0.40 | |
| WTPmax,rel | 0.25 | 0.25 | 0.25 | 0.25 | 0.25 | 0.25 | 0.25 | 0.25 | |
| Electricity price in EUR/MWh | 60.10 | 62.15 | 63.95 | 63.25 | 64.30 | 66.45 | 60.95 | 58.90 | |
| WTPmax in EUR/MWh | 15.03 | 15.54 | 15.99 | 15.81 | 16.08 | 16.61 | 15.24 | 14.73 | |
| B | ATP | 0.58 | 0.62 | 0.44 | 0.46 | 0.51 | 0.60 | 0.57 | 0.95 |
| Environmental concern | 0.65 | 0.65 | 0.65 | 0.65 | 0.65 | 0.65 | 0.65 | 0.65 | |
| WTPmax,rel | 0.28 | 0.34 | 0.28 | 0.28 | 0.28 | 0.34 | 0.28 | 0.40 | |
| Electricity price in EUR/MWh | 144.95 | 146.30 | 151.45 | 148.20 | 136.40 | 133.50 | 130.25 | 94.45 | |
| WTPmax in EUR/MWh | 39.86 | 49.38 | 41.65 | 40.76 | 37.51 | 45.06 | 35.82 | 37.78 |
The values for WTPmax are derated corresponding to the derating factors shown in Table A8 and Table A9. Thus, to calculate A’s demand for a hydro GO from Switzerland, derating factors of 0.8 for the origin, and 0.5 for the technology are applied. For B, assuming that wind GOs from Spain were to be purchased, derating factors of 0.6 for the origin and 0.8 for the technology are applied. This gives the values for 2010 through 2017 for a given GO, as shown in Table A3. The average value is taken to calculate future GO prices.
Table A3.
Exemplary WTPs for two consumers A and B.
| Consumer | 2010 | 2011 | 2012 | 2013 | 2014 | 2015 | 2016 | 2017 | Average |
|---|---|---|---|---|---|---|---|---|---|
| A | 6.01 | 6.22 | 6.40 | 6.33 | 6.43 | 6.65 | 6.10 | 5.89 | 6.25 |
| B | 19.13 | 23.70 | 19.99 | 19.56 | 18.00 | 21.63 | 17.19 | 18.13 | 19.67 |
Appendix B. Additional Information and Data
Table A4.
Overview of historic GO prices.
| Type of GO | Period | Price/Price Range (in EUR/MWh, unless Otherwise Specified) | Source |
|---|---|---|---|
| Alpine Hydro Power | 2017 | 0.2 | [86] |
| Austrian (unspecif.) | 2018 | 0.9–1.45 | [11] |
| Austrian Hydro (age unspecif.) | 2019 | 1.32 | [92] |
| Dutch Wind | September 2018 | 8 | [23] |
| EU Biomass (unspecif.) | 2018 | 1.62 | [92] |
| EU Hydro (age unspecif.) | 2018 | 1.24–1.25 | [11] |
| EU Hydro (unspecif.) | 2020 | 0.15–0.21 | [93] |
| EU Hydro (unspecif.) | 2018–2020 | 0.49–1.98 | [92] |
| EU (average 2021) | September 2021 | 0.75 | [42] |
| EU (average 2022) | September 2021 | 1.25 | [42] |
| German (unspecif.) | 2018 | 0.8–1.6 | [11] |
| Italian Wind Auction (weighted average) | January 2022/ March 2022/ June 2022/ October 2022/ December 2022 | 1/ 1.32/ 1.88/ 5.01/ 5.93 | [22] |
| Italian Unspecified Technology Auction (weighted average) | January 2022/ March 2022/ June 2022/ October 2022/ December 2022 | 1.03/ 1.65/ 1.93/ 5.28/ 6.42 | [22] |
| Italian Solar Auction (weighted average) | January 2022/ March 2022/ June 2022/ October 2022/ December 2022 | 1.11/ 2.01/ 2.22/ 5.32/ 6.52 | [22] |
| Italian Hydro Auction (weighted average) | January 2022/ March 2022/ June 2022/ October 2022/ December 2022 | 0.89/ 1.46/ 1.99/ 5.60/ 6.28 | [22] |
| Large Nordic Hydro | 2007–2015 | 0.05–0.6 | [41] |
| Nordic (unspecif.), new | 2018 | 2–2.7 | [11] |
| Nordic (unspecif.), new | 2018 | 2.34–3.4 | [11] |
| Nordic (unspecif.), old | 2018 | 0.55 | [11] |
| Nordic (unspecif.), retrofitted | 2018 | 1–1.9 | [11] |
| Nordic Hydro (age unspecif.) | 2015 | 0.05–0.5 | [94] |
| Nordic Hydro (age unspecif.) | 2017 | 0.22–0.38 | [11] |
| Nordic Hydro (age unspecif.) | September 2018–December 2018 | 1.24–2 | [23] |
| Nordic Hydro | 2017 | 0.31 | [86] |
| Northern Continental Europe Wind Power | 2017 | 0.45 | [86] |
| Swiss (unspecif.) | 2018 | 1.5–4 | [11] |
| Swiss Hydro | 2017–2018 | 1–4 CHF/MWh * | [23] |
| Swiss PV (unspecif.) | 2018 | 14.30 | [92] |
Abbreviations used and explanations: EU = European (in general); GO = guarantee of origin; Hydro refers to GOs from hydropower generation; Nordic refers to GOs from Denmark, Finland, Norway, or Sweden; PV refers to GOs from solar (photovoltaic) generation; unspecif. = unspecified. * 1 CHF~1.03 EUR.
Table A5.
Overview of private household WTPs for different shares of green electricity.
| WTPs for Green Electricity | |||||
|---|---|---|---|---|---|
| 0% | >0% | >25% | >50% | >75% | |
| France | 28.5 | 56 | 10.5 | 4.5 | 0.5 |
| Netherlands | 32 | 56 | 8.5 | 3 | 0.5 |
| Spain | 28 | 56 | 11 | 4 | 1 |
| Sweden | 23 | 62 | 10 | 4 | 1 |
| Switzerland | 8.5 | 72 | 15 | 4 | 0.5 |
| EU Average | 24 | 60.4 | 11 | 3.9 | 0.7 |
| Reduced WTP for GOs (% of total electr. price) | 0 | 3.75 | 11.25 | 18.75 | 24 |
Abbreviations used: GO = guarantee of origin; WTP = willingness to pay. Source: [46]: pp. 102–103, own estimation.
Table A6.
Values for environmental concern used for WTP calculation.
| Sector Description | NACE Code | Environmental Concern | Source |
|---|---|---|---|
| Mining of coal and lignite | B05 | 0.1 | Own estimation |
| Extraction of crude petroleum and natural gas | B06 | 0.1 | Own estimation |
| Mining of metal ores | B07 | 0.2 | Own estimation |
| Other mining and quarrying | B08 | 0.15 | Own estimation |
| Mining support service activities | B09 | 0.2 | Own estimation |
| Manufacture of food products | C10 | 0.65 | [81] |
| Manufacture of beverages | C11 | 0.75 | [81] |
| Manufacture of tobacco products | C12 | 0.4 | Own estimation |
| Manufacture of textiles | C13 | 0.7 | [81] |
| Manufacture of apparel | C14 | 0.55 | Own estimation |
| Manufacture of leather and related products | C15 | 0.6 | Own estimation |
| Manufacture of wood and of products of wood and cork, except furniture; manufacture of articles of straw and plaiting materials | C16 | 0.65 | Own estimation |
| Manufacture of paper and paper products | C17 | 0.4 | [81] |
| Printing and reproduction of recorded media | C18 | 0.4 | Own estimation |
| Manufacture of coke and refined petroleum products | C19 | 0.1 | Own estimation |
| Manufacture of chemicals and chemical products | C20 | 0.5 | [81] |
| Manufacture of basic pharmaceutical products and pharmaceutical preparations | C21 | 0.4 | [81] |
| Manufacture of rubber and plastic products | C22 | 0.3 | Own estimation |
| Manufacture of other non-metallic mineral products | C23 | 0.35 | Own estimation |
| Manufacture of basic metals | C24 | 0.4 | Own estimation |
| Manufacture of fabricated metal products, except machinery and equipment | C25 | 0.5 | Own estimation |
| Manufacture of computer, electronic, and optical products | C26 | 0.3 | [81] |
| Manufacture of electrical equipment | C27 | 0.4 | Own estimation |
| Manufacture of machinery and equipment n.e.c. | C28 | 0.4 | [81] |
| Manufacture of motor vehicles, trailers and semi-trailers | C29 | 0.45 | [81] |
| Manufacture of other transport equipment | C30 | 0.35 | Own estimation |
| Manufacture of furniture | C31 | 0.7 | Own estimation |
| Other manufacturing | C32 | 0.5 | Own estimation |
| Repair and installation of machinery and equipment | C33 | 0.4 | Own estimation |
| Water collection, treatment, and supply | E36 | 0.7 | Own estimation |
| Sewerage | E37 | 0.5 | [81] |
| Waste collection, treatment, and disposal activities; materials recovery | E38 | 0.7 | Own estimation |
| Remediation activities and other waste management services | E39 | 0.6 | [81] |
| Wholesale and retail trade and repair of motor vehicles and motorcycles | G45 | 0.4 | Own estimation |
| Wholesale trade, except of motor vehicles and motorcycles | G46 | 0.6 | [81] |
| Retail trade, except of motor vehicles and motorcycles | G47 | 0.7 | [81] |
| Accommodation | I55 | 0.5 | [81] |
| Food and beverage service activities | I56 | 0.5 | Own estimation |
| Publishing activities | J58 | 0.5 | Own estimation |
| Motion picture, video, and television program production, sound recording, and music publishing activities | J59 | 0.6 | Own estimation |
| Programming and broadcasting activities | J60 | 0.4 | Own estimation |
| Telecommunications | J61 | 0.8 | [81] |
| Computer programming, consultancy, and related activities | J62 | 0.8 | [81] |
| Information service activities | J63 | 0.75 | [81] |
| Legal and accounting activities | M69 | 0.3 | [81] |
| Activities of head offices; management consultancy activities | M70 | 0.65 | [81] |
| Architectural and engineering activities; technical testing and analysis | M71 | 0.45 | [81] |
| Scientific research and development | M72 | 0.65 | Own estimation |
| Advertising and market research | M73 | 0.8 | [81] |
| Other professional, scientific, and technical activities | M74 | 0.6 | Own estimation |
| Veterinary activities | M75 | 0.4 | Own estimation |
| Rental and leasing activities | N77 | 0.6 | Own estimation |
| Employment activities | N78 | 0.4 | Own estimation |
| Travel agency, tour operator and other reservation service, and related activities | N79 | 0.5 | Own estimation |
| Security and investigation activities | N80 | 0.2 | Own estimation |
| Services to buildings and landscape activities | N81 | 0.6 | Own estimation |
| Office administrative, office support, and other business support activities | N82 | 0.6 | Own estimation |
| Repair of computers and personal and household goods | S95 | 0.4 | Own estimation |
Abbreviations used: NACE = Nomenclature statistique des activités économiques dans la Communauté européenne (Classification of European Economic Statistics). Source: [81], own estimations.
Table A7.
Overview and categorization of EECS member countries as of mid-2019.
| Country (or Country Area) | Competent Body | Subsidy Category | Fees | National Certificate System | International Trade | Own Domestic Platform |
|---|---|---|---|---|---|---|
| Austria | E-Control | Cat. 1 | No | No | Yes | Yes |
| Belgium (Federal) | CREG | Cat. 4 | No | No | Yes | Yes |
| Belgium Brussels | Brugel | Cat. 4 | No | No | Yes | Yes |
| Belgium Flanders | VREG | Cat. 4 | Yes | Yes | Yes | Yes |
| Belgium Wallonia | SPW Energie/CWaPE | Cat. 4 | No | Yes | Yes | Yes |
| Switzerland | Pronovo | Cat. 1 | Yes | No | Yes | Yes |
| Cyprus | TSOC | Cat. 3 | Yes | Yes | Yes | Yes |
| Czech Republic | OTE | Cat. 4 | Yes | No | Yes | Yes |
| Germany | UBA | Cat. 5 | Yes | Yes | Yes | Yes |
| Denmark | Energinet | Cat. 1 | Yes | No | Yes | No (CMO.grexel) |
| Estonia | Elering | Cat. 1 | Yes | No | Yes | Yes |
| Spain | CNMC | Cat. 4 | No | Yes | Separation of GOs intended for import and export | Yes |
| Finland | Finextra | Cat. 1 | Yes | Yes | Yes | Yes |
| France | EEX | Cat. 2 | Yes | No | Yes | Yes |
| Greece | DAPEEP/HEDNO/CRES | Cat. 4 | No | Yes | Yes | Yes |
| Croatia | HROTE | Cat. 4 | Yes | No | Yes | No (CMO.grexel) |
| Ireland | SEMO | Cat. 5 | No | No | Yes | No (CMO.grexel) |
| Iceland | Landsnet | Cat. 6 | Yes | No | Yes | No (CMO.grexel) |
| Italy | GSE | Cat. 1 | Yes | No | Yes | Yes |
| Lithuania | Litgrid AB | Cat. 3 | Yes | Yes | Only import | No (CMO.grexel) |
| Luxembourg | ILR | Cat. 2 | Yes | No | Yes | No (CMO.grexel) |
| Netherlands | CertiQ | Cat. 4 | Yes | No | Yes | Yes |
| Norway | Statnett | Cat. 4 | Yes | No | Yes | Yes |
| Portugal | Rede Eléctrica Nacional, S.A. (REN) | Cat. 1 | Yes | Yes | Yes | Yes |
| Serbia | EMS | Cat. 5 | Yes | No | Yes | Yes |
| Sweden | Energimyndigheten | Cat. 4 | Yes | Yes | Yes | Yes |
| Slovenia | Energy Agency/Borzen | Cat. 2 | Yes | Yes | Yes | Yes |
| Slovakia | OKTE | Cat. 2 | Yes | No | Yes | Yes |
| Country (Or Country area) | Trade balance (2015–2019) | Trade hub (2015–2019) | Consumption (2015–2019) | Proportion of issuance (2019) | Proportion of cancel. (2019) | Shifted prop. of cancel. (2019) |
| Austria | Negative | Yes | Consumer | 0.021424047 | 0.037883179 | 0.032454632 |
| Belgium (Federal) | Negative | Yes | Consumer | 0.016463224 | 0.039611106 | 0.035522748 |
| Belgium Brussels | Lack of data | Lack of data | Lack of data | 0 | 0 | 0 |
| Belgium Flanders | Lack of data | Lack of data | Lack of data | 0 | 0 | 0 |
| Belgium Wallonia | Lack of data | Lack of data | Lack of data | 0 | 0 | 0 |
| Switzerland | Negative | No | Consumer | 0.095128656 | 0.088430042 | 0.083808439 |
| Cyprus | Lack of data | Lack of data | Producer | 0.000337672 | 0 | 0 |
| Czech Republic | Positive | No | Producer | 0.008335271 | 0.000983337 | 0.001864038 |
| Germany | Negative | No | Consumer | 0.022031789 | 0.173304752 | 0.158670194 |
| Denmark | Positive | No | Producer | 0.028931447 | 0.014841155 | 0.013331771 |
| Estonia | Positive | Yes | Producer | 0.004086356 | 0.000471532 | 0.000578586 |
| Spain | Positive | No | Producer | 0.143756032 | 0.125417968 | 0.120358496 |
| Finland | Positive | No | Producer | 0.040907033 | 0.04149955 | 0.037288875 |
| France | Positive | No | Producer | 0.079916686 | 0.067765929 | 0.075425313 |
| Greece | Lack of data | Lack of data | Lack of data | 0 | 0 | 0 |
| Croatia | Positive | No | Producer | 0.007435576 | 0.002644953 | 0.003194225 |
| Ireland | Negative | No | Consumer | 0.003198566 | 0.011490545 | 0.011640314 |
| Iceland | Positive | No | Producer | 0.023687093 | 0.006319384 | 0.004605022 |
| Italy | Positive | No | Producer | 0.129264574 | 0.077423193 | 0.080583479 |
| Lithuania | Negative | No | Consumer | 0.000415937 | 0.002066573 | 0.002100529 |
| Luxembourg | Negative | Yes | Consumer | 0.000665903 | 0.005062893 | 0.006328675 |
| Netherlands | Negative | No | Consumer | 0.081629158 | 0.087323332 | 0.092680187 |
| Norway | Positive | Yes | Producer | 0.188048895 | 0.109938713 | 0.105441595 |
| Portugal | Negative | Yes | Consumer | 0 | 0 | 0 |
| Serbia | Lack of data | Lack of data | Producer | 9.94 × 10⁻⁶ | 1.10 × 10⁻⁵ | 6.34 × 10⁻⁵ |
| Sweden | Negative | No | Producer | 0.099308569 | 0.106162988 | 0.09557441 |
| Slovenia | Positive | No | Producer | 0.005017581 | 0.001347882 | 0.001196152 |
| Slovakia | Lack of data | Lack of data | Lack of data | 0 | 0 | 0 |
Notes: Belgium (Federal) refers to Belgian offshore territories in the North Sea and English Channel. Trade balance = export−import. Trade hub = Import/Cancellation. If >1, Trade Hub, i.e., import of GOs to trade for export and foreign consumption. Consumption = Issuance−Cancellation. Sources: Own calculations based on [36,60,95,96,97,98,99,100,101,102,103,104,105,106,107,108,109,110,111,112,113,114,115,116,117,118,119,120,121]).
Table A8.
Derating factors DFc,o of a GO of origin o applied to consumer k’s WTPmax,k depending on k’s country c.
Table A8.
Derating factors DFc,o of a GO of origin o applied to consumer k’s WTPmax,k depending on k’s country c.
| AT | BE | DK | FI | FR | DE | UK | IT | IE | NL | NO | PO | ES | SW | CH | HR | CY | CZ | ET | GR | IC | LI | LU | SE | SK | SL | |
|---|---|---|---|---|---|---|---|---|---|---|---|---|---|---|---|---|---|---|---|---|---|---|---|---|---|---|
| AT | 1 | 0.7 | 0.6 | 0.6 | 0.7 | 0.9 | 0.4 | 0.9 | 0.2 | 0.6 | 0.2 | 0.4 | 0.4 | 0.6 | 0.9 | 0.7 | 0.4 | 0.9 | 0.7 | 0.6 | 0.3 | 0.4 | 0.5 | 0.6 | 0.9 | 0.9 |
| BE | 0.7 | 1 | 0.8 | 0.7 | 0.9 | 0.9 | 0.7 | 0.5 | 0.5 | 0.9 | 0.3 | 0.5 | 0.5 | 0.6 | 0.7 | 0.5 | 0.3 | 0.6 | 0.5 | 0.3 | 0.3 | 0.5 | 0.9 | 0.5 | 0.6 | 0.6 |
| DK | 0.6 | 0.8 | 1 | 0.8 | 0.6 | 0.9 | 0.6 | 0.5 | 0.5 | 0.7 | 0.3 | 0.4 | 0.4 | 0.8 | 0.6 | 0.4 | 0.3 | 0.6 | 0.7 | 0.3 | 0.4 | 0.7 | 0.7 | 0.4 | 0.5 | 0.5 |
| FI | 0.6 | 0.7 | 0.8 | 1 | 0.5 | 0.7 | 0.5 | 0.5 | 0.4 | 0.7 | 0.4 | 0.3 | 0.4 | 0.9 | 0.6 | 0.4 | 0.2 | 0.5 | 0.9 | 0.3 | 0.5 | 0.9 | 0.6 | 0.3 | 0.5 | 0.5 |
| FR | 0.7 | 0.9 | 0.6 | 0.5 | 1 | 0.9 | 0.8 | 0.9 | 0.5 | 0.6 | 0.2 | 0.6 | 0.7 | 0.4 | 0.8 | 0.6 | 0.4 | 0.5 | 0.4 | 0.6 | 0.4 | 0.5 | 0.9 | 0.4 | 0.5 | 0.6 |
| DE | 0.9 | 0.9 | 0.9 | 0.7 | 0.9 | 1 | 0.7 | 0.7 | 0.5 | 0.9 | 0.2 | 0.4 | 0.4 | 0.5 | 0.9 | 0.6 | 0.4 | 0.9 | 0.6 | 0.5 | 0.4 | 0.6 | 0.9 | 0.5 | 0.6 | 0.6 |
| UK | 0.4 | 0.7 | 0.6 | 0.5 | 0.8 | 0.7 | 1 | 0.6 | 0.9 | 0.8 | 0.3 | 0.5 | 0.5 | 0.4 | 0.8 | 0.4 | 0.3 | 0.5 | 0.3 | 0.2 | 0.6 | 0.3 | 0.6 | 0.4 | 0.5 | 0.5 |
| IT | 0.9 | 0.5 | 0.5 | 0.5 | 0.9 | 0.7 | 0.6 | 1 | 0.5 | 0.6 | 0.2 | 0.6 | 0.7 | 0.4 | 0.9 | 0.9 | 0.4 | 0.5 | 0.3 | 0.7 | 0.4 | 0.3 | 0.6 | 0.7 | 0.6 | 0.9 |
| IE | 0.2 | 0.5 | 0.5 | 0.4 | 0.5 | 0.5 | 0.9 | 0.5 | 1 | 0.8 | 0.3 | 0.5 | 0.5 | 0.4 | 0.6 | 0.4 | 0.2 | 0.4 | 0.3 | 0.3 | 0.7 | 0.3 | 0.5 | 0.3 | 0.4 | 0.4 |
| NL | 0.6 | 0.9 | 0.7 | 0.7 | 0.6 | 0.9 | 0.8 | 0.6 | 0.8 | 1 | 0.2 | 0.4 | 0.4 | 0.4 | 0.6 | 0.5 | 0.3 | 0.5 | 0.5 | 0.3 | 0.5 | 0.4 | 0.8 | 0.4 | 0.5 | 0.5 |
| NO | 0.2 | 0.3 | 0.3 | 0.4 | 0.2 | 0.2 | 0.3 | 0.2 | 0.3 | 0.2 | 1 | 0.2 | 0.3 | 0.5 | 0.3 | 0.2 | 0.1 | 0.2 | 0.3 | 0.2 | 0.4 | 0.3 | 0.2 | 0.2 | 0.2 | 0.2 |
| PO | 0.4 | 0.5 | 0.4 | 0.3 | 0.6 | 0.4 | 0.5 | 0.6 | 0.5 | 0.4 | 0.2 | 1 | 0.9 | 0.5 | 0.6 | 0.5 | 0.3 | 0.5 | 0.3 | 0.5 | 0.2 | 0.3 | 0.4 | 0.4 | 0.4 | 0.4 |
| ES | 0.4 | 0.5 | 0.4 | 0.4 | 0.7 | 0.4 | 0.5 | 0.7 | 0.5 | 0.4 | 0.3 | 0.9 | 1 | 0.5 | 0.7 | 0.6 | 0.4 | 0.5 | 0.3 | 0.6 | 0.3 | 0.3 | 0.5 | 0.4 | 0.5 | 0.5 |
| SW | 0.6 | 0.6 | 0.8 | 0.9 | 0.4 | 0.5 | 0.4 | 0.4 | 0.4 | 0.4 | 0.5 | 0.5 | 0.5 | 1 | 0.6 | 0.6 | 0.4 | 0.3 | 0.5 | 0.7 | 0.4 | 0.5 | 0.7 | 0.5 | 0.3 | 0.4 |
| CH | 0.9 | 0.7 | 0.6 | 0.6 | 0.8 | 0.9 | 0.8 | 0.9 | 0.6 | 0.6 | 0.3 | 0.6 | 0.7 | 0.6 | 1 | 0.6 | 0.3 | 0.7 | 0.4 | 0.6 | 0.3 | 0.4 | 0.8 | 0.5 | 0.5 | 0.5 |
| HR | 0.7 | 0.5 | 0.4 | 0.4 | 0.6 | 0.6 | 0.4 | 0.9 | 0.4 | 0.5 | 0.2 | 0.5 | 0.6 | 0.4 | 0.6 | 1 | 0.4 | 0.6 | 0.4 | 0.7 | 0.3 | 0.4 | 0.5 | 0.9 | 0.8 | 0.9 |
| CY | 0.4 | 0.3 | 0.3 | 0.2 | 0.4 | 0.4 | 0.3 | 0.4 | 0.2 | 0.3 | 0.1 | 0.3 | 0.4 | 0.3 | 0.3 | 0.4 | 1 | 0.3 | 0.3 | 0.8 | 0.1 | 0.3 | 0.3 | 0.4 | 0.4 | 0.4 |
| CZ | 0.9 | 0.6 | 0.6 | 0.5 | 0.5 | 0.9 | 0.5 | 0.5 | 0.4 | 0.5 | 0.2 | 0.5 | 0.5 | 0.5 | 0.7 | 0.6 | 0.3 | 1 | 0.6 | 0.4 | 0.4 | 0.6 | 0.7 | 0.5 | 0.9 | 0.6 |
| ET | 0.7 | 0.5 | 0.7 | 0.9 | 0.4 | 0.6 | 0.3 | 0.3 | 0.3 | 0.5 | 0.3 | 0.3 | 0.3 | 0.7 | 0.4 | 0.4 | 0.3 | 0.6 | 1 | 0.3 | 0.3 | 0.9 | 0.5 | 0.4 | 0.5 | 0.5 |
| GR | 0.6 | 0.3 | 0.3 | 0.3 | 0.6 | 0.5 | 0.2 | 0.7 | 0.3 | 0.3 | 0.2 | 0.5 | 0.6 | 0.4 | 0.6 | 0.7 | 0.8 | 0.4 | 0.3 | 1 | 0.1 | 0.4 | 0.4 | 0.7 | 0.6 | 0.6 |
| IC | 0.3 | 0.3 | 0.4 | 0.5 | 0.4 | 0.4 | 0.6 | 0.4 | 0.7 | 0.5 | 0.4 | 0.3 | 0.3 | 0.5 | 0.3 | 0.3 | 0.1 | 0.4 | 0.3 | 0.1 | 1 | 0.3 | 0.3 | 0.2 | 0.2 | 0.2 |
| LI | 0.4 | 0.5 | 0.7 | 0.9 | 0.5 | 0.6 | 0.3 | 0.3 | 0.3 | 0.4 | 0.3 | 0.3 | 0.3 | 0.7 | 0.4 | 0.4 | 0.3 | 0.6 | 0.9 | 0.4 | 0.3 | 1 | 0.4 | 0.4 | 0.5 | 0.5 |
| LU | 0.5 | 0.9 | 0.7 | 0.6 | 0.9 | 0.9 | 0.6 | 0.6 | 0.5 | 0.8 | 0.2 | 0.4 | 0.5 | 0.5 | 0.8 | 0.5 | 0.3 | 0.7 | 0.5 | 0.4 | 0.3 | 0.4 | 1 | 0.4 | 0.5 | 0.6 |
| SE | 0.6 | 0.5 | 0.4 | 0.3 | 0.4 | 0.5 | 0.4 | 0.7 | 0.3 | 0.4 | 0.2 | 0.4 | 0.4 | 0.3 | 0.5 | 0.9 | 0.4 | 0.5 | 0.4 | 0.7 | 0.2 | 0.4 | 0.4 | 1 | 0.7 | 0.7 |
| SK | 0.9 | 0.6 | 0.5 | 0.5 | 0.5 | 0.6 | 0.5 | 0.6 | 0.4 | 0.5 | 0.2 | 0.4 | 0.5 | 0.4 | 0.5 | 0.8 | 0.4 | 0.9 | 0.5 | 0.6 | 0.2 | 0.5 | 0.5 | 0.7 | 1 | 0.9 |
| SL | 0.9 | 0.6 | 0.5 | 0.5 | 0.6 | 0.6 | 0.5 | 0.9 | 0.4 | 0.5 | 0.2 | 0.4 | 0.5 | 0.4 | 0.5 | 0.9 | 0.4 | 0.6 | 0.5 | 0.6 | 0.2 | 0.5 | 0.6 | 0.7 | 0.9 | 1 |
Abbreviations used: AT: Austria, BE: Belgium; DK: Denmark; FI: Finland; FR: France; DE: Germany, UK: United Kingdom; IT: Italy; IE: Ireland; NL: Netherlands; NO: Norway; PO: Portugal; ES: Spain; SW: Sweden; CH: Switzerland; HR: Croatia; CY: Cyprus; CZ: Czech Republic; ET: Estonia; GR: Greece; IC: Iceland; LI: Lithuania; LU: Luxembourg; SE: Serbia; SK: Slovakia; SL: Slovenia. Sources: Own estimations.
Table A9.
Derating factors Dt for a GO of technology t applied to consumer k’s WTPmax,k.
| Technology t | Derating Factor Dt |
|---|---|
| Biomass | 0.7 |
| Geothermal | 1 |
| Hydro | 0.5 |
| Solar | 0.9 |
| Wind | 0.8 |
| Other | 0.8 |
Note: Technology preferences are assumed to be independent of a consumer k’s country c.
References
- Hainsch, K.; Löffler, K.; Burandt, T.; Auer, H.; del Granado, P.C.; Pisciella, P.; Zwickl-Bernhard, S. Energy transition scenarios: What policies, societal attitudes, and technology developments will realize the EU Green Deal? Energy 2022, 239, 122067. [Google Scholar] [CrossRef]
- Kendziorski, M.; Göke, L.; Hirschhausen, C.; von Kemfert, C.; Zozmann, E. Centralized and decentral approaches to succeed the 100% Energiewende in Germany in the European context—A model-based analysis of generation, network, and storage investments. Energy Policy 2022, 167, 113039. [Google Scholar] [CrossRef]
- Mulder, M.; Zomer, S.P. Contribution of green labels in electricity retail markets to fostering renewable energy. Energy Policy 2016, 99, 100–109. [Google Scholar] [CrossRef]
- Directive 96/92/EC of the European Parliament and of the Council of 19 December 1996 concerning Common Rules for the Internal Market in Electricity. 1996. Available online: https://eur-lex.europa.eu/legal-content/EN/TXT/PDF/?uri=CELEX:31996L0092 (accessed on 18 December 2023).
- Langeraar, J.; Devos, R. Guarantee of Origin: The proof of the pudding is in the eating. Refocus 2003, 4, 62–63. [Google Scholar] [CrossRef]
- IRENA. Corporate Sourcing of Renewables: Market and Industry Trends—REmade Index 2018; International Renewable Energy Agency: Abu Dhabi, United Arab Emirates, 2018. [Google Scholar]
- RE100. Annual Report.: Going 100% Renewable: How Committed Companies Are Demanding a Faster Market Response. 2019. Available online: https://www.there100.org/sites/re100/files/2020-09/RE100ProgressandInsightsAnnualReport2019.pdf (accessed on 18 December 2023).
- Markard, J.; Holt, E. Disclosure of electricity products—Lessons from consumer research as guidance for energy policy. Energy Policy 2003, 31, 1459–1474. [Google Scholar] [CrossRef]
- Directive 2001/77/EC of the European Parliament and of the Council of 27 September 2001 on the Promotion of Electricity Produced from Renewable Energy Source in the Internal Electricity Market: Directive 2001/77/EC 2001 Oct 27. Available online: https://eur-lex.europa.eu/legal-content/EN/TXT/PDF/?uri=CELEX:32001L0077 (accessed on 18 December 2023).
- Gkarakis, K.; Dagoumas, A. Assessment of the implementation of Guarantees of Origin (GOs) in Europe. In Power Systems, Energy Markets and Renewable Energy Sources in South-Eastern Europe; Németh, B., Mavromatakis, F., Siderakis, K., Eds.; Trivent Publishing: Budapest, Hungary, 2016. [Google Scholar]
- Hauser, E.; Heib, S.; Hildebrand, J.; Rau, I.; Weber, A.; Welling, J.; Güldenberg, J.; Maaß, C.; Mundt, J.; Werner, R.; et al. Marktanalyse Ökostrom II: Marktanalyse Ökostrom und HKN, Weiterentwicklung des Herkunftsnachweissystems und der Stromkennzeichnung; Abschlussbericht: Dessau-Roßlau, Germany, 2019; Available online: https://www.umweltbundesamt.de/publikationen/marktanalyse-oekostrom-ii (accessed on 18 December 2023).
- AIB. EECS Rules: Release 7: Association of Issuing Bodies. 2020. Available online: https://www.aib-net.org/eecs/eecsr-rules (accessed on 8 October 2020).
- Raadal, H.L.; Dotzauer, E.; Hanssen, O.J.; Kildal, H.P. The interaction between Electricity Disclosure and Tradable Green Certificates. Energy Policy 2012, 42, 419–428. [Google Scholar] [CrossRef]
- AIB. AIB Members: Association of Issuing Bodies. 2023. Available online: https://www.aib-net.org/facts/aib-member-countries-regions/aib-members (accessed on 17 January 2023).
- Finjord, F.; Hagspiel, V.; Lavrutich, M.; Tangen, M. The impact of Norwegian-Swedish green certificate scheme on investment behavior: A wind energy case study. Energy Policy 2018, 123, 373–389. [Google Scholar] [CrossRef]
- Ganhammar, K. The effect of regulatory uncertainty in green certificate markets: Evidence from the Swedish-Norwegian market. Energy Policy 2021, 158, 112583. [Google Scholar] [CrossRef]
- EPEX SPOT. Successful start of Pan-European Spot Market for Guarantees of Origin: First Auction Completed by EPEX SPOT with Clearing and Delivery through ECC and EEX. 2022. Available online: https://www.epexspot.com/en/news/successful-start-pan-european-spot-market-guarantees-origin (accessed on 17 January 2023).
- Frei, F.; Loder, A.; Bening, C.R. Liquidity in green power markets—An international review. Renew. Sustain. Energy Rev. 2018, 93, 674–690. [Google Scholar] [CrossRef]
- Hulshof, D.; Jepma, C.; Mulder, M. Performance of markets for European renewable energy certificates. Energy Policy 2019, 128, 697–710. [Google Scholar] [CrossRef]
- Robert, L. Guarantees of Origin Market Developments: October 2022—GO Market Review. 2022. Available online: https://portal.greenfact.com/News/2154/October-2022---GO-Market-Overview (accessed on 18 December 2023).
- Argus Media. Voluntary Renewable Power and Gas Markets: European Guarantee of Origin Trade Increases. 2022. Argus Insight. Available online: https://www.argusmedia.com/-/media/Files/white-papers/2022/european-guarantee-of-origin-trade-increase.ashx (accessed on 17 January 2023).
- GME. GSE GO Auctions. 2022. Available online: https://mercatoelettrico.org/En/Esiti/GO/EsitiGOAste.aspx (accessed on 17 January 2023).
- Münzer, A. 2018—A Historic Year for Green Energy in Europe. 2019. Available online: https://www.linkedin.com/pulse/2018-historic-year-green-energy-europe-alexandra-m%C3%BCnzer/ (accessed on 18 December 2023).
- Brander, M.; Gillenwater, M.; Ascui, F. Creative accounting: A critical perspective on the market-based method for reporting purchased electricity (scope 2) emissions. Energy Policy 2018, 112, 29–33. [Google Scholar] [CrossRef]
- Nordenstam, L.; Djuric Ilic, D.; Ödlund, L. Corporate greenhouse gas inventories, guarantees of origin and combined heat and power production—Analysis of impacts on total carbon dioxide emissions. J. Clean. Prod. 2018, 186, 203–214. [Google Scholar] [CrossRef]
- Hufen, J. Cheat Electricity?: The Political Economy of Green Electricity Delivery on the Dutch Market for Households and Small Business. Sustainability 2017, 9, 16. [Google Scholar] [CrossRef]
- Hamburger, Á. Is guarantee of origin really an effective energy policy tool in Europe? A critical approach. Soc. Econ. 2019, 41, 487–507. [Google Scholar] [CrossRef]
- Hast, A.; Syri, S.; Jokiniemi, J.; Huuskonen, M.; Cross, S. Review of green electricity products in the United Kingdom, Germany and Finland. Renew. Sustain. Energy Rev. 2015, 42, 1370–1384. [Google Scholar] [CrossRef]
- Ragwitz, M.; del Río González, P.; Resch, G. Assessing the advantages and drawbacks of government trading of guarantees of origin for renewable electricity in Europe. Energy Policy 2009, 37, 300–307. [Google Scholar] [CrossRef]
- AIB. European Residual Mixes: Results of the Calculation of Residual Mixes for the Calendar Year 2021: Association of Issuing Bodies. 2022. Available online: https://www.aib-net.org/sites/default/files/assets/facts/residual-mix/2021/AIB_2021_Residual_Mix_Results_1_1.pdf (accessed on 17 January 2023).
- Winther, T.; Ericson, T. Matching policy and people? Household responses to the promotion of renewable electricity. Energy Effic. 2013, 6, 369–385. [Google Scholar] [CrossRef]
- Aasen, M.; Westskog, H.; Wilhite, H.; Lindberg, M. The EU electricity disclosure from the business perspective—A study from Norway. Energy Policy 2010, 38, 7921–7928. [Google Scholar] [CrossRef]
- Directive 2009/28/EC of the European Parliament and of the Council of 23 April 2009 on the Promotion of the Use of Energy from Renewable Sources and Amending and Subsequently Repealing Directives 2001/77/EC and 2003/30/EC: Directive 2009/28/EC 2009 Apr 23. Available online: https://eur-lex.europa.eu/legal-content/EN/TXT/PDF/?uri=CELEX:32009L0028 (accessed on 18 December 2023).
- Sundt, S.; Rehdanz, K. Consumers’ willingness to pay for green electricity: A meta-analysis of the literature. Energy Econ. 2015, 51, 1–8. [Google Scholar] [CrossRef]
- Markard, J.; Truffer, B. The promotional impacts of green power products on renewable energy sources: Direct and indirect eco-effects. Energy Policy 2006, 34, 306–321. [Google Scholar] [CrossRef]
- AIB. AIB 2020 Member Tariffs: Association of Issuing Bodies. 2020. Available online: https://www.aib-net.org/facts/aib-member-countries-regions/aib-member-tariffs (accessed on 21 August 2020).
- Velazquez Abad, A.; Dodds, P.E. Green hydrogen characterisation initiatives: Definitions, standards, guarantees of origin, and challenges. Energy Policy 2020, 138, 111300. [Google Scholar] [CrossRef]
- Jansen, J.; Drabik, E.; Egenhofer, C. The Disclosure of Guarantees of Origin: Interactions with the 2030 Climate and Energy Framework; CEPS Special Report: Brussels, Belgium, 2016. [Google Scholar]
- Chuang, J.; Lien, H.-L.; Den, W.; Iskandar, L.; Liao, P.-H. The relationship between electricity emission factor and renewable energy certificate: The free rider and outsider effect. Sustain. Environ. Res. 2018, 28, 422–429. [Google Scholar] [CrossRef]
- Nikolay, J. An Overview of the Development of the Guarantee of Origin Market; University of Greenwich: London, UK, 2020. [Google Scholar]
- Oslo Economics. Analysis of the Trade in Guarantees of Origin: Economic Analysis for Energy Norway; OE-report 2017-58; Oslo, Norway. 2018. Available online: https://dokumen.tips/documents/analysis-of-the-trade-in-guarantees-of-origin-analysis-of-the-trade-in-guarantees.html?page=2 (accessed on 18 December 2023).
- Di Sario, F. GOs Contango Deepens as Demand-Supply Gap Shrinks. 2021. ICIS Editorial. Available online: https://www.icis.com/explore/resources/news/2021/09/20/10686145/gos-contango-deepens-as-demand-supply-gap-shrinks/ (accessed on 17 February 2023).
- Roe, B.; Teisl, M.F.; Levy, A.; Russell, M. US consumers’ willingness to pay for green electricity. Energy Policy 2001, 29, 917–925. [Google Scholar] [CrossRef]
- Breidert, C. Estimation of Willingness-to-Pay: Theory, Measurement, Application, 1st ed.; DUV Deutscher Universitäts-Verlag: Wiesbaden, Germany, 2006. [Google Scholar] [CrossRef]
- Calikoglu, U.; Aydinalp Koksal, M. Green electricity and Renewable Energy Guarantees of Origin demand analysis for Türkiye. Energy Policy 2022, 170, 113229. [Google Scholar] [CrossRef]
- OECD. Greening Household Behaviour: Overview from the 2011 Survey; OECD Publishing: Paris, France, 2014. [Google Scholar] [CrossRef]
- Yang, Y.; Solgaard, H.S.; Haider, W. Value seeking, price sensitive, or green? Analyzing preference heterogeneity among residential energy consumers in Denmark. Energy Res. Soc. Sci. 2015, 6, 15–28. [Google Scholar] [CrossRef]
- Soon, J.-J.; Ahmad, S.-A. Willingly or grudgingly? A meta-analysis on the willingness-to-pay for renewable energy use. Renew. Sustain. Energy Rev. 2015, 44, 877–887. [Google Scholar] [CrossRef]
- Rowlands, I.H.; Scott, D.; Parker, P. Consumers and green electricity: Profiling potential purchasers. Bus. Strat. Env. 2003, 12, 36–48. [Google Scholar] [CrossRef]
- Bollino, C.A. The Willingness to Pay for Renewable Energy Sources: The Case of Italy with Socio-demographic Determinants. Energy J. 2009, 30, 81–96. [Google Scholar] [CrossRef]
- Diaz-Rainey, I.; Ashton, J.K. Profiling potential green electricity tariff adopters: Green consumerism as an environmental policy tool? Bus. Strat. Env. 2011, 20, 456–470. [Google Scholar] [CrossRef]
- Knapp, L.; O’Shaughnessy, E.; Heeter, J.; Mills, S.; DeCicco, J.M. Will consumers really pay for green electricity? Comparing stated and revealed preferences for residential programs in the United States. Energy Res. Soc. Sci. 2020, 65, 101457. [Google Scholar] [CrossRef]
- Grilli, G. Renewable energy and willingness to pay: Evidences from a meta-analysis. Econ. Policy Energy Environ. 2017, 1, 253–271. [Google Scholar] [CrossRef]
- Borchers, A.M.; Duke, J.M.; Parsons, G.R. Does willingness to pay for green energy differ by source? Energy Policy 2007, 35, 3327–3334. [Google Scholar] [CrossRef]
- Andor, M.A.; Frondel, M.; Vance, C. Germany’s Energiewende: A Tale of Increasing Costs and Decreasing Willingness-to-Pay. Energy J. 2017, 38, 211–228. [Google Scholar] [CrossRef]
- Yevdokimov, Y.; Getalo, V.; Shukla, D.; Sahin, T. Measuring willingness to pay for electricity: The case of New Brunswick in Atlantic Canada. Energy Environ. 2019, 30, 292–303. [Google Scholar] [CrossRef]
- Bigerna, S.; Polinori, P. Italian households’ willingness to pay for green electricity. Renew. Sustain. Energy Rev. 2014, 34, 110–121. [Google Scholar] [CrossRef]
- Robinson, J. The Economics of Imperfect Competition; MacMillan: London, UK, 1933. [Google Scholar]
- Woeckener, B. Volkswirtschaftslehre; Springer: Berlin/Heidelberg, Germany, 2019. [Google Scholar]
- AIB. Activity Statistics: Association of Issuing Bodies. 2020. Available online: https://www.aib-net.org/facts/market-information/statistics/activity-statistics-all-aib-members (accessed on 27 August 2020).
- Parkin, M.; Powell, M.; Matthews, K. Economics, 5th ed.; Addison-Wesley: Boston, MA, USA, 2003. [Google Scholar]
- Jansen, J. Does the EU Renewable Energy Secotr Still Need a Guarantees of Origin Market? CEPS Energy Climate House: Brussels, Belgium, 2017; Policy Insights 2017-27; Available online: https://cdn.ceps.eu/wp-content/uploads/2017/07/CEPS%20Policy%20Insights%202017-25%20Guarantees%20of%20Origin%20J%20Jansen.pdf (accessed on 18 December 2023).
- Russell, S. Ability to pay for health care: Concepts and evidence. Health Policy Plan 1996, 11, 219–237. [Google Scholar] [CrossRef] [PubMed]
- Goodspeed, T.J. A re-examination of the use of ability to pay taxes by local governments. J. Public Econ. 1989, 38, 319–342. [Google Scholar] [CrossRef]
- Pederzini, Ò.M. Integrating Energy Demand and Ability to Pay in the Design of Decentralised Energy Supply: A Case Study in Rural Nepal. Master’s Thesis, School of Engineering Sciences, KTH Royal Institute of Technology, Stockholm, Sweden, 2019. [Google Scholar]
- Fankhauser, S.; Tepic, S. Can poor consumers pay for energy and water? An affordability analysis for transition countries. Energy Policy 2007, 35, 1038–1049. [Google Scholar] [CrossRef]
- Bose, R.K.; Shukla, M. Electricity tariffs in India: An assessment of consumers’ ability and willingness to pay in Gujarat. Energy Policy 2001, 29, 465–478. [Google Scholar] [CrossRef]
- European Commission. Proposal for a Directive of the European Parliament and of the Council on Corporate Sustainability Due Diligence and Amending Directive (EU) 2019/1937; European Commission: Brussels, Belgium, 2022; Feb 23 COM/2022/71. Available online: https://eur-lex.europa.eu/legal-content/EN/TXT/?uri=CELEX%3A52022PC0071 (accessed on 20 June 2023).
- Fatras, N.; Ma, Z.; Duan, H.; Jørgensen, B.N. A systematic review of electricity market liberalisation and its alignment with industrial consumer participation: A comparison between the Nordics and China. Renew. Sustain. Energy Rev. 2022, 167, 112793. [Google Scholar] [CrossRef]
- IRENA. Global Energy Transformation: A Roadmap to 2050, 2019th ed.; International Renewable Energy Agency: Abu Dhabi, United Arab Emirates, 2019. [Google Scholar]
- IRENA. Renewable Power Generation Costs in 2019; International Renewable Energy Agency: Abu Dhabi, United Arab Emirates, 2020. [Google Scholar]
- Eurostat. Net Electricity Generation by Type of Fuel—Monthly Data; NRG_CB_PEM. 2020. Available online: https://ec.europa.eu/eurostat/statistics-explained/index.php?oldid=515664 (accessed on 18 December 2023).
- IEA. World Energy Outlook 2020; International Energy Agency: Paris, Italy, 2020.
- Eurostat. Number of Private Households by Household Composition, Number of Children and Age of Youngest Child (1000). LFST-HHNHTYCH. 2020. Available online: https://ec.europa.eu/eurostat/web/products-datasets/-/LFST_HHNHTYCH (accessed on 20 October 2020).
- Eurostat. Supply, Transformation and Consumption of Electricity. NRG_CB_E. 2020. Available online: https://ec.europa.eu/eurostat/databrowser/view/nrg_cb_e/default/table?lang=en (accessed on 10 October 2020).
- Eurostat. Electricity Prices Components for Non-Household Consumers—Annual Data (from 2007 Onwards). NRG_PC_205_C. 2020. Available online: https://ec.europa.eu/eurostat/databrowser/view/nrg_pc_205_c/default/table?lang=en (accessed on 10 October 2020).
- Eurostat. Industry by Employment Size Class (NACE Rev. 2, B-E). SBS_SC_IND_R2. 2020. Available online: https://ec.europa.eu/eurostat/databrowser/view/sbs_sc_ind_r2/default/table?lang=en (accessed on 10 October 2020).
- Swiss Federal Office of Energy. Elektrizitätserzeugung: 1970–2019. je-d-08.02.02.01. 2020. Available online: https://www.bfs.admin.ch/bfs/de/home/statistiken/energie.assetdetail.13667566.html (accessed on 27 August 2020).
- Kuronen, A.; Lehtovaara, M. Development of the Guarantees of Origin Market: Key Facts Report. 2017 Update. 2017. Available online: https://recs.org/download/?file=development-of-the-guarantees-of-origin-market-2016-key-facts-report.pdf&file_type=documents&file_type=documents (accessed on 18 June 2023).
- Eurostat. Energy Balance Guide: Methodology Guide for the Construction of Energy Balances & Operational Guide for the Energy Balance Builder Tool; Eurostat: Brussels, Belgium, 2019.
- RE100. RE100 Members. 2020. Available online: https://www.there100.org/re100-members (accessed on 20 October 2020).
- Göke, L.; Weibezahn, J.; von Hirschhausen, C. A collective blueprint, not a crystal ball: How expectations and participation shape long-term energy scenarios. Energy Res. Soc. Sci. 2023, 97, 102957. [Google Scholar] [CrossRef]
- Krey, V.; Guo, F.; Kolp, P.; Zhou, W.; Schaeffer, R.; Awasthy, A.; Bertram, C.; de Boer, H.-S.; Fragkos, P.; Fujimori, S.; et al. Looking under the hood: A comparison of techno-economic assumptions across national and global integrated assessment models. Energy 2019, 172, 1254–1267. [Google Scholar] [CrossRef]
- Greenfact. The Greenfact Market Survey 2020: Current Status and Outlook within the GO Market; Greenfact: Oslo, Norway, 2020. [Google Scholar]
- Köpke, R. PPA-Barometer 2020: Gekommen, um zu bleiben. Available online: https://enervis.de/wp-content/uploads/2020/06/PPA-Barometer-2020-Energie-Management.pdf (accessed on 18 December 2023).
- Dagoumas, A.S.; Koltsaklis, N.E. Price Signal of Tradable Guarantees of Origin for Hedging Risk of Renewable Energy Sources Investments. Int. J. Energy Econ. Policy 2017, 7, 59–67. [Google Scholar]
- Linnemann, M. Post-EEG-Anlagen in der Energiewirtschaft; Springer Fachmedien: Wiesbaden, Germany, 2021. [Google Scholar]
- AIB. FaStGo: Facilitating Standards for Guarantees of Origin: Association of Issuing Bodies. 2019. Available online: https://www.aib-net.org/news-events/aib-projects-and-consultations/fastgo (accessed on 28 October 2020).
- European Commission. Proposal for a Directive of the European Parliament and of the Council Amending Directive (EU) 2018/2001 of the European Parliament and of the Council, Regulation (EU) 2018/1999 of the European Parliament and of the Council and Directive 98/70/EC of the European Parliament and of the Council as Regards the Promotion of Energy from Renewable Sources, and Repealing Council Directive (EU) 2015/652: European Commission. 2021. Available online: https://eur-lex.europa.eu/resource.html?uri=cellar:dbb7eb9c-e575-11eb-a1a5-01aa75ed71a1.0001.02/DOC_1&format=PDF (accessed on 27 June 2023).
- European Commission. Guidance to Member States on Good Practices to Speed up Permit-Granting Procedures for Renewable Energy Projects and on Facilitating Power Purchase Agreements: Accompanying the Document “Commission Recommendation on Speeding up Permit-Granting Procedures for Renewable Energy Projects and Facilitating Power Purchase Agreements”; European Commission: Brussels, Belgium, 2022. Available online: https://ec.europa.eu/info/law/better-regulation/have-your-say/initiatives/13334-Renewable-energy-projects-permit-granting-processes-power-purchase-agreements_en (accessed on 8 October 2023).
- ENTSO-E. Views on a Future-Proof Market Design for Guarantees of Origin. 2022. ENTSO-E Position Paper. Available online: https://eepublicdownloads.blob.core.windows.net/public-cdn-container/clean-documents/Publications/Position%20papers%20and%20reports/2022/entso-e_pp_guarantees_of_origin_220715%20for%20publication.pdf (accessed on 8 October 2023).
- Advantag Services GmbH. Herkunftsnachweise. 2019. Available online: https://advantag.de/de/category/co2-marktberichte/herkunftsnachweise (accessed on 10 September 2020).
- Nvalue, A.G. EU HKN Preise [€/MWh]. 2020. Available online: https://archive.org/details/nvalue-go-o-prices-03092020 (accessed on 18 December 2023).
- Klimscheffskij, M.; Van Craenenbroeck, T.; Lehtovaara, M.; Lescot, D.; Tschernutter, A.; Raimundo, C.; Seebach, D.; Timpe, C. Residual Mix Calculation at the Heart of Reliable Electricity Disclosure in Europe—A Case Study on the Effect of the RE-DISS Project. Energies 2015, 8, 4667–4696. [Google Scholar] [CrossRef]
- CREG. EECS Electricity Domain Protocol for Belgium (Offshore): Commissie voor de Regulering van de Elektriciteit en het Gas. 2018. Available online: https://www.aib-net.org/facts/aib-member-countries-regions/domain-protocols (accessed on 25 August 2020).
- E-Control. EECS Electricity Domain Protocol for Austria. 2019. Available online: https://www.aib-net.org/facts/aib-member-countries-regions/domain-protocols (accessed on 25 August 2020).
- BRUGEL. EECS Electricity Domain Protocol for Brussels. 2013. Available online: https://www.aib-net.org/facts/aib-member-countries-regions/domain-protocols (accessed on 25 August 2020).
- VREG. EECS Electricity Domain Protocol for Flanders: Vlaamse Regulator van de Elektriciteits- en Gasmarkt. 2017. Available online: https://www.aib-net.org/facts/aib-member-countries-regions/domain-protocols (accessed on 25 August 2020).
- CaWaPE. EECS Electricity Domain Protocol for Wallonia, Belgium: Commsion Wallone pour l’Energie. 2017. Available online: https://www.aib-net.org/facts/aib-member-countries-regions/domain-protocols (accessed on 25 August 2020).
- Pronovo Ltd. EECS Electricity Domain Protocol for Switzerland. 2018. Available online: https://www.aib-net.org/facts/aib-member-countries-regions/domain-protocols (accessed on 25 August 2020).
- Transmission System Operator (Cyprus). EECS Electricity Scheme Domain Protocol for Cyprus. 2012. Available online: https://www.aib-net.org/facts/aib-member-countries-regions/domain-protocols (accessed on 25 August 2020).
- Operator trhu s elektrinou, a.s. (OTE). EECS Electricity Domain Protocol for Czech Republic. 2018. Available online: https://www.aib-net.org/facts/aib-member-countries-regions/domain-protocols (accessed on 25 August 2020).
- Energienet, D.K. EECS Electricity Domain Protocol for Denmark. 2016. Available online: https://www.aib-net.org/facts/aib-member-countries-regions/domain-protocols (accessed on 25 August 2020).
- Elering, A.S. EECS Electricity Domain Protocol for Estonia. 2015. Available online: https://www.aib-net.org/facts/aib-member-countries-regions/domain-protocols (accessed on 25 August 2020).
- CNMC. EECS Electricity Domain Protocol for Spain: Comisión Nacional de los Mercados y la Competencia. 2017. Available online: https://www.aib-net.org/facts/aib-member-countries-regions/domain-protocols (accessed on 25 August 2020).
- Finextra, O.Y. EECS Electricity Domain Protocol for Finland. 2017. Available online: https://www.aib-net.org/facts/aib-member-countries-regions/domain-protocols (accessed on 25 August 2020).
- Powernext SAS. EECS Electricity Domain Protocol for France. 2019. Available online: https://www.aib-net.org/facts/aib-member-countries-regions/domain-protocols (accessed on 25 August 2020).
- DAPEEP S.A. EECS Electricity Domain Protocol for Interconnected System—Greece. 2013. Available online: https://www.aib-net.org/facts/aib-member-countries-regions/domain-protocols (accessed on 25 August 2020).
- Hrote. EECS Electricity Domain Protocol for Croatia: Hrvatski Operator Trzista Energije. 2016. Available online: https://www.aib-net.org/facts/aib-member-countries-regions/domain-protocols (accessed on 25 August 2020).
- SEMO. EECS Electricity Domain Protocol for Ireland: Single Electricity Market Operator. 2019. Available online: https://www.aib-net.org/facts/aib-member-countries-regions/domain-protocols (accessed on 25 August 2020).
- Landsnet, H.F. EECS Electricity Domain Protocol for Iceland. 2015. Available online: https://www.aib-net.org/facts/aib-member-countries-regions/domain-protocols (accessed on 25 August 2020).
- GSE. EECS Electricity Domain Protocol for Italy: Gestore dei Servizi Energetici. 2015. Available online: https://www.aib-net.org/facts/aib-member-countries-regions/domain-protocols (accessed on 25 August 2020).
- LITGRID AB. EECS Electricity Domain Protocol for Lithuania. 2018. Available online: https://www.aib-net.org/facts/aib-member-countries-regions/domain-protocols (accessed on 25 August 2020).
- Institut Luxembourgeois de Régulation. EECS Electricity Domain Protocol for Luxembourg. 2018. Available online: https://www.aib-net.org/facts/aib-member-countries-regions/domain-protocols (accessed on 25 August 2020).
- CertiQ, B.V. EECS Electricity Domain Protocol for the Netherlands. 2018. Available online: https://www.aib-net.org/facts/aib-member-countries-regions/domain-protocols (accessed on 25 August 2020).
- Statnett, S.F. EECS Electricity Domain Protocol for Statnett SF. 2018. Available online: https://www.aib-net.org/facts/aib-member-countries-regions/domain-protocols (accessed on 25 August 2020).
- Rede Eléctrica Nacional, S.A. (REN). EECS Electricity Domain Protocol for Portugal. 2020. Available online: https://www.aib-net.org/facts/aib-member-countries-regions/domain-protocols (accessed on 25 August 2020).
- Elektromreža Srbije JSC Belgrade. Domain Protocol for Serbia. 2019. Available online: https://www.aib-net.org/facts/aib-member-countries-regions/domain-protocols (accessed on 25 August 2020).
- Energimyndigheten. EECS Electricity Domain Protocol for Sweden. 2019. Available online: https://www.aib-net.org/facts/aib-member-countries-regions/domain-protocols (accessed on 25 August 2020).
- OKTE, a. EECS Electricity Domain Protocol for OKTE. a.s. 2019. Available online: https://www.aib-net.org/facts/aib-member-countries-regions/domain-protocols (accessed on 25 August 2020).
- Agencija Za Energijo. EECS Electricity Domain Protocol for Slovenia. 2017. Available online: https://www.aib-net.org/facts/aib-member-countries-regions/domain-protocols (accessed on 25 August 2020).
Figure 1.
Flowchart of the structure of the analysis, showing the analytical steps taken and corresponding findings. Abbreviations used: GO = guarantee of origin; ATP = ability to pay; WTP = willingness to pay; AIB = Association of Issuing Bodies.
Figure 1.
Flowchart of the structure of the analysis, showing the analytical steps taken and corresponding findings. Abbreviations used: GO = guarantee of origin; ATP = ability to pay; WTP = willingness to pay; AIB = Association of Issuing Bodies.

Figure 2.
GO Prices for Nordic Hydro Futures in 2021 and 2022 (left), Aggregated Prices for Different Technologies (right). Source: Own illustration, based on Argus Media [21] and Robert [20].

Figure 3.
Estimation of relative maximum willingness to pay WTPmax,rel for exemplary non-household consumers A, B, and C. Abbreviations used: ATP = ability to pay, WTP = willingness to pay.
Figure 3.
Estimation of relative maximum willingness to pay WTPmax,rel for exemplary non-household consumers A, B, and C. Abbreviations used: ATP = ability to pay, WTP = willingness to pay.

Figure 4.
Determination of the equilibrium price P*o,t,p.

Figure 5.
Data and detailed modeling workflow diagram. Abbreviations used: EECS = European Energy Certificate System; GO = guarantee of origin; ATP = ability to pay; WTP = willingness to pay. Data sets are given according to their reference number [46,63,72,73,74,75,76,77,78].

Figure 6.
Comparison of issued GO volumes, by scenario, 2020–2040. Abbreviations used: GO = guarantee of origin; p.a. = per year; RES = renewable energy sources.
Figure 6.
Comparison of issued GO volumes, by scenario, 2020–2040. Abbreviations used: GO = guarantee of origin; p.a. = per year; RES = renewable energy sources.

Figure 7.
Development of average prices over all technologies and all countries for GOs, by scenario, 2020–2040. Abbreviations used: GO = guarantee of origin.
Figure 7.
Development of average prices over all technologies and all countries for GOs, by scenario, 2020–2040. Abbreviations used: GO = guarantee of origin.

Figure 8.
Comparison of price developments per technology for all four scenarios. Abbreviations used: GO = guarantee of origin; RES = renewable energy sources.
Figure 8.
Comparison of price developments per technology for all four scenarios. Abbreviations used: GO = guarantee of origin; RES = renewable energy sources.

Figure 9.
Results from the sensitivity analysis. Abbreviations used: RES = Renewable Energy Source; WTP = willingness to pay; LCOE = Levelized Cost of Electricity.
Figure 9.
Results from the sensitivity analysis. Abbreviations used: RES = Renewable Energy Source; WTP = willingness to pay; LCOE = Levelized Cost of Electricity.

Table 1.
Overview of historic GO price ranges.
| GO Type | Period | Price/Price Range (EUR/MWh) |
|---|---|---|
| Nordic Hydro | 2015–2018 | 0.05–3.40 |
| German (Unspecified) | 2018 | 0.8–1.6 |
| Austrian (Unspecified) | 2018–2019 | 0.9–1.45 |
| EU Hydro | 2018–2020 | 0.15–1.98 |
| EU (Average), 2022 Futures | September 2021 | 1.25 |
| EU (All) | Spring 2022 | 1.7–2.3 |
Abbreviations used: GO = guarantee of origin; EU = Generic European (Origin Unspecified).
Table 2.
Varying WTP values depending on green electricity sources.
| Technology/Green Electricity Source | WTP (USD per Month) | Reference/s |
|---|---|---|
| Mixed source/“green” | 13.10 | [53] |
| Mixed source/“green” | 8.44–17.00 (Mean) | [54] |
| Mixed source/“green” | 5.10 (Low)–7.38 (High) | [52] |
| Solar | 14.40 | [53] |
| Solar | 14.68–21.54 (Mean) | [54] |
| Wind | 14.14 | [53] |
| Wind | 6.14–15.47 (Mean) | [54] |
| Biomass | 11.02 | [53] |
| Biomass | −2.22–10.59 (Mean) | [54] |
| Hydropower | 9.57 | [53] |
| Geothermal | 36.90 | [53] |
Abbreviation used: WTP = willingness to pay.
Table 3.
Categorization of EECS member countries and GO systems introduced.
| Category | Description | Countries |
|---|---|---|
| 1 | Issuance of GOs for subsidized electricity, but disclosure of subsidy reception on GOs | Austria, Denmark, Estonia, Finland, Italy, Portugal, Switzerland |
| 2 | Subsidized GOs are auctioned | France, Luxembourg, Slovenia, the Slovak Republic |
| 3 | Subsidized GOs are immediately canceled | Cyprus, Lithuania |
| 4 | No regulations on subsidies | Belgium, Croatia, the Czech Republic, Greece, the Netherlands, Norway, Spain, Sweden |
| 5 | Subsidized electricity production may not issue any GOs | Germany, Ireland, Serbia |
| 6 | No subsidy system in place | Iceland |
Abbreviations used: GO = guarantee of origin.
Table 4.
Share of GOs issued relative to green power production, by category and technology.
| Category | 1 | 2 | 3 | 4 | 5 | 6 |
|---|---|---|---|---|---|---|
| Biomass | 0.64 | 0.26 | 0.08 | 0.49 | 0.21 | No GO issuance |
| Geothermal | 0.52 | 0.03 | No GO issuance | No GO issuance | No GO issuance | 0.92 |
| Hydro | 0.78 | 0.49 | 0.35 | 0.6 | 0.63 | 0.98 |
| Solar | 0.53 | 0.05 | No GO issuance | 0.37 | 0.02 | No GO issuance |
| Wind | 0.68 | 0.28 | 0.5 | 0.73 | 0.09 | No GO issuance |
Table 5.
Data sets used for ATP/WTP, demand, and profit calculations.
| No. | Data Set | Contents | Used for… | Source |
|---|---|---|---|---|
| 1 | Household characteristics | Household distributions | WTP, demand | [74] |
| 2 | Nrg_cb_e | Electricity consumption | ATP, demand | [75] |
| 3 | Nrg_pc_205 | Electricity prices | ATP, WTP | [76] |
| 4 | Sbs_sc_ind_r2 | Structural data on European industry, i.e., average revenue and number of companies per NACE sector and size | Profit, demand, ATP | [77] |
| 5 | Swiss Electricity Statistics | Electricity consumption and prices in Switzerland | ATP, demand, WTP | [78] |
Abbreviations used: ATP = ability to pay, WTP = willingness to pay.
Table 6.
WTPmax,rel values for non-household consumers (depending on ATP levels).
| Environmental Concern | ATP | ||||
|---|---|---|---|---|---|
| x ≤ 20% | 20% < x ≤ 40% | 40% < x ≤ 60% | 60% < x ≤ 80% | 80% < x ≤ 100% | |
| y ≤ 20% | 0 | 0.025 | 0.05 | 0.075 | 0.1 |
| 20% < y ≤ 40% | 0.025 | 0.05625 | 0.0875 | 0.11875 | 0.15 |
| 40% < y ≤ 60% | 0.075 | 0.11875 | 0.1625 | 0.20625 | 0.2 |
| 60% < y ≤ 80% | 0.15 | 0.2125 | 0.275 | 0.3375 | 0.25 |
| 80% < y ≤ 100% | 0.1 | 0.15 | 0.2 | 0.25 | 0.3 |
Abbreviations used: ATP = ability to pay; x and y refer to the coordinates in Figure 2.
Table 7.
Average GO prices in EUR/MWh per technology for all four scenarios, in the years 2020, 2030, and 2040.
Table 7.
Average GO prices in EUR/MWh per technology for all four scenarios, in the years 2020, 2030, and 2040.
| Scenario 1 | Scenario 2 | |||||
|---|---|---|---|---|---|---|
| Technology | 2020 | 2030 | 2040 | 2020 | 2030 | 2040 |
| Biomass | 1.47 | 2.12 | 3.36 | 1.44 | 1.67 | 1.98 |
| Geothermal | 5.13 | 7.33 | 12.54 | 5.13 | 5.56 | 6.77 |
| Hydro | 0.4 | 0.99 | 1.51 | 0.37 | 0.47 | 0.82 |
| Other RES | 0 | 4.59 | 6.45 | 0 | 3.86 | 3.98 |
| Solar | 4.46 | 6.03 | 9.5 | 4.43 | 4.46 | 4.91 |
| Wind | 2.15 | 2.88 | 4.47 | 2.14 | 2.22 | 2.47 |
| Scenario 3 | Scenario 4 | |||||
| Technology | 2020 | 2030 | 2040 | 2020 | 2030 | 2040 |
| Biomass | 3.26 | 3.46 | 5.51 | 3.13 | 2.41 | 2.49 |
| Geothermal | 4.59 | 12.8 | 12.82 | 4.59 | 10.41 | 11.91 |
| Hydro | 1.23 | 1.55 | 1.93 | 1.23 | 0.8 | 1.06 |
| Other RES | 0 | 7 | 8.97 | 0 | 4.73 | 4.77 |
| Solar | 12.19 | 9.3 | 12.57 | 12.19 | 6.53 | 6.72 |
| Wind | 4.59 | 4.96 | 7 | 4.44 | 3.54 | 3.66 |
Abbreviations used: RES = renewable energy source.
Table 8.
GO prices in Germany obtained from a survey amongst market participants compared to the results obtained from the model calculations (EUR/MWh).
Table 8.
GO prices in Germany obtained from a survey amongst market participants compared to the results obtained from the model calculations (EUR/MWh).
| Observed Year | 2025 | 2030 |
|---|---|---|
| Survey | 1.6 | 2.02 |
| Scenario 1 | 1.03 | 1.73 |
| Scenario 2 | 0.81 | 0.83 |
| Scenario 3 | 3.32 | 3.8 |
| Scenario 4 | 3.18 | 3.17 |
Source: [85], own calculations.
Disclaimer/Publisher’s Note: The statements, opinions and data contained in all publications are solely those of the individual author(s) and contributor(s) and not of MDPI and/or the editor(s). MDPI and/or the editor(s) disclaim responsibility for any injury to people or property resulting from any ideas, methods, instructions or products referred to in the content. |
© 2023 by the authors. Licensee MDPI, Basel, Switzerland. This article is an open access article distributed under the terms and conditions of the Creative Commons Attribution (CC BY) license (https://creativecommons.org/licenses/by/4.0/).
Share and Cite
MDPI and ACS Style
Wimmers, A.; Madlener, R. The European Market for Guarantees of Origin for Green Electricity: A Scenario-Based Evaluation of Trading under Uncertainty. Energies 2024, 17, 104. https://doi.org/10.3390/en17010104
AMA Style
Wimmers A, Madlener R. The European Market for Guarantees of Origin for Green Electricity: A Scenario-Based Evaluation of Trading under Uncertainty. Energies. 2024; 17(1):104. https://doi.org/10.3390/en17010104
Chicago/Turabian StyleWimmers, Alexander, and Reinhard Madlener. 2024. "The European Market for Guarantees of Origin for Green Electricity: A Scenario-Based Evaluation of Trading under Uncertainty" Energies 17, no. 1: 104. https://doi.org/10.3390/en17010104
Note that from the first issue of 2016, this journal uses article numbers instead of page numbers. See further details here.