Review

A Comprehensive Review of the Distinctive Tendencies of the Diffusion of E-Mobility in Central Europe

1
Department of Meteorology, Institute of Geosciences, University of Debrecen, H-4032 Debrecen, Hungary
2
Institute of Applied Economics, Faculty of Economics and Business, University of Debrecen, H-4032 Debrecen, Hungary
3
ELKH-DE High-Tech Technologies for Sustainable Management Research Group, University of Debrecen, Böszörményi Street 138, H-4032 Debrecen, Hungary
4
Department of Geography in Hungarian, Faculty of Geography, Babes-Bolyai University, RO-400006 Cluj-Napoca, Romania
5
Institute of Statistics and Methodology, Faculty of Economics and Business, University of Debrecen, H-4032 Debrecen, Hungary
*
Authors to whom correspondence should be addressed.
Energies 2023, 16(14), 5421; https://doi.org/10.3390/en16145421
Submission received: 31 May 2023 / Revised: 30 June 2023 / Accepted: 7 July 2023 / Published: 17 July 2023

Abstract

:
The study introduces the current situation of electric vehicle technologies, the possibilities and possible directions of their market, as well as the economic and environmental aspects in the eastern region of the EU, with special regard to Hungary. Our calculations show that despite the higher costs of ownership, in the case of 7 years of use (among Hungarian conditions), the total cost of the Battery Electric Vehicles (BEV) is lower than that of the Internal Combustion Engine Vehicles (ICEV) in each of the four segments analysed. The purchasing power of the population in the eastern regions of the EU is clearly lower compared to the western regions, yet people in this region spend beyond their financial means on motorization. Despite its unfavourable position, Hungary is in a particularly advantageous position compared to other countries in the region per vehicle and per capita in terms of the spread of BEVs. In the long run, even taking higher prices into account, the use of electric cars, in general, has significant advantages from an economic point of view; lower maintenance costs and fuel prices (especially with increased use) make EVs more cost-effective overall.

1. Introduction

Globally, the spread of electric cars is growing exponentially annually, exceeding 16.5 million cars nowadays [1,2,3,4]. This dynamically developing industry shows significant differences between continents and countries. In the United States of America, BEVs are represented by 1.3 M cars, while there are 0.7 M cars of Plug-in Hybrid Electric Vehicles (PHEV); in China, there are 6.2 M BEVs and 1.6 M PHEVs, while in Europe, there are 3 M BEVs and 2.5 M PHEVs [5]. The spread of electric cars varies considerably between EU member states [6,7,8]. Brdulak et al. (2021) divided EU countries into groups with different development dynamics using cluster analysis [9]. The paper studied specifically the countries of Group A, which have a higher rate of development. Group B generally has fewer electric cars but is open to alternatively powered cars and has a proportionally large number of Liquefied Petroleum Gas (LPG) vehicles [10,11,12,13]. Our studies refer to the former socialist countries connected to the Central European region, and due to the different socio-economic environment, the post-Soviet states are not included. Therefore, this paper presents the experience and trends of the European Union countries in the typical Central European region, and the statistical averages of Austria [14,15,16] and the European Union were included as controls for all calculations. This is how Hungary and its neighbouring EU member states (Austria, Croatia, Romania, Slovakia, Slovenia, Poland, and the Czech Republic as V4 member states) were chosen as test subjects. Brdulak et al. (2021) determined the innovation index and the resulting ranking of each EU Member State using BEV and PHEV, as well as the first registration time of hydrogen-powered cars and the share of LPG cars. In terms of the studied countries, Austria is the absolute European number one, with Hungary at 5th, the Czech Republic at 10th, Slovakia at 11th, Poland and Romania tied for 12th, Slovenia at 14th, and Croatia bringing up the rear at 16th position [9].
The primary objective of this paper is to analyse the current situation of innovative electric vehicle (EV) technology, the possibilities and directions of its spread on the market, and its specifics in relation to the selected countries of Group B mentioned above.
Our basic hypothesis is that the spread of EVs for the countries studied differs significantly from that in Group A countries [17,18,19,20]. In the studied region, electromobility is spreading mainly via used models. Therefore, in the spread studies, in addition to new car sales, great emphasis was placed on the relatively long-established BEV and PHEV types. The main reason for this is that effective demand is significantly lower in most of the studied countries compared to the EU average, but the rate of spread gives reason to assume that society is generally open to cleaner power types, but for economic reasons only used models can spread in greater numbers.
Three main research questions were set as the objectives of this study, as follows:
  • Q1. What diffusion differences can be found in the case of electric vehicles in the studied countries compared to the EU average?
  • Q2. Is the market of the region united or diverse regarding the possibilities and speed of spread?
  • Q3. How many electric vehicles may spread in the region and what their expected share could be? What specifics do the countries in the region show in relation to the spread of electric cars?
As a result, comprehensive market research was carried out on the used and new supply of BEVs, PHEVs, and, by comparison, Internal Combustion Engine (ICE) cars representing a similar category, to create an objective picture of the purchasing power of potential buyers with the average income in the countries of the region. Purchasing power was mainly calculated only with the cost prices of individual cars since, according to data from the European Alternative Fuels Observatory (EAFO) [21], countries in this region have the most favourable electricity costs, and despite this, the spread of EVs is below the EU average. In addition, Neves et al. (2019) [22] found that there is no significant relationship between electricity prices and BEV sales in Europe [21] and, as we move towards low-income segments, future saving has an increasingly decreasing role as an incentive.
Since one of the most compelling arguments for the spread of electromobility is that it can make transport more environmentally friendly and sustainable, it is sensible to ask how much the replacement of ICVs with EVs actually helps to achieve environmental goals. Reducing emissions of carbon dioxide and other air pollutants, together with noise pollution, are among the main reasons. A number of investigations in this direction have been carried out and are ongoing. Here we discuss the most important areas of study directly related to our topic.
Answers were sought to the following questions:
  • Are indirect CO2 emissions over the entire life cycle of EVs lower than ICVs? In particular, how much GHG is generated by the electricity generation required for EVs to operate, and how much other GHG is generated during the EV’s life cycle?
  • Is the amount of other air pollutant emissions over the EV’s life cycle smaller compared to ICV?
  • Is the noise emission by EVs smaller than that of ICVs?
Studying the spatial structure and development of the charging network is also an interesting topic, but it is beyond the scope of this study.
The life cycle of accumulators, especially the excavation of raw material, and the End-of-Life (EoL) phase of accumulators are not included in the study either, as these fields have major significance on their own; however, these relate to the topic of the study indirectly.
The structure of the article contains three different issues. In the first part, the current situation of the topic was introduced; in the second, the role of infrastructure and purchasing power was analysed, and in the end, the economic and environmental sides were detailed. Wages in the CEE region are much lower than in Western Europe, so the market for used cars was particularly taken into consideration.

2. International Case Studies on the Reasons for the Spread of BEVs

Basically, several studies have already been carried out on the spread of electromobility in certain regions of the world, such as the EU, USA, and Japan. All of them point out that the spread of electromobility is strongly influenced by, among others, economic development and purchasing power [23,24,25]. Therefore, as new prices for high-end cars in the CEE region are difficult to reconcile with the purchasing power of average income earners, these are not part of the study [26,27,28,29,30,31]. The reasons for this include, among others, high unemployment rates in countries of the CEE region, infrastructural underdevelopment, migration of the population, low salaries, etc. [32]. Nothing illustrates the above statement better than the fact that, according to ACEA data, the average age of EU cars is 11.5 years, the average age of cars in Poland is 14.1 years, and in Croatia, it is 14.6 years. By contrast, cars in Slovenia are 11.7 years old on average, which is due to higher average salaries [21,33].
A study on factors influencing the spread of BEVs, analysing 40 peer-reviewed journal papers [34], found that influencing factors can be classified into three main types: demographic (e.g., gender, age, income, etc.), situational (e.g., technical conditions, costs, environmental conditions, politics), and psychological (attitudes, emotions, etc.) factors, but it can be assumed that consumers’ decisions are determined by a mixture of these factors. For example, according to research by Dutta (2021), the attitude of Taiwanese people towards EVs is to a great extent positively influenced by environmental concerns, and this has a significant impact on consumer attitudes [35].
Studying 14 major cities in the U.S., Breetz et al. (2018) found that in almost every city, higher prices for BEVs and rapid depreciation outweighed fuel savings. They highlight that public incentives are needed to make BEVs cost-competitive, which could improve in the future due to decreasing input costs as a result of technological developments [36]. Several studies [37,38,39,40] have concluded that currently, BEVs are not economically competitive against ICEVs without government subsidy incentives. According to Adepetu (2017), EV prices are a more significant barrier to acceptance than the average range of EVs, therefore, policymakers should focus more on affordability when promoting the spread of EVs [41]. According to Hardman et al. (2017), PEVs’ market share correlates with incentives [42], and Christidis (2019) argues that it correlates with income—those with higher incomes are more likely to adopt EVs [43]. G. Cecere (2018) and Ali (2022) found in six European countries and India, respectively, that richer and more educated people are more inclined to adopt EVs [44,45]. In addition, people who have a wide social network, are active online and know EV owners are more likely to buy EVs, as the opinions of their friends about EVs also have a significant influence on individual decisions [46,47]. Franzò (2022) conducted research based on market conditions in Italy, which revealed that segments A (minicars) and C (medium cars) have the lowest total cost of ownership, thanks to purchase incentives, lower prices, and operational costs [48]. For poorer social classes and poorer countries, incentives, therefore, play a significant role in the adoption of new EVs.
As described above, the high price of EVs is critical [49], yet there is consumer demand for high-end BEVs (e.g., Tesla Model S) as well, as consumers in this segment are motivated by environmental considerations, high performance, and advanced technology, while financial incentives have no impact on decisions for 75% of respondents [50]. Interestingly, the Tesla Model S sold better in the U.S. than Tesla’s sales target. In Norway, PHEV accounts for more than 80% of new car sales, although there are no supply incentives, with the aim of reaching a 100% PHEV share by 2030 [51]. It is clear that EVs can spread without incentives, but this is greatly influenced by the purchasing power of a given country.
According to a summary of the research [52], the biggest problem with incentives is that, in most cases, they are specifically available to those who would have the financial opportunity to buy EVs anyway, even without incentives. The author believes that the lower social classes, who really need incentives, are thus practically excluded from support. He examined and modelled different types of financial incentives based on eight decision criteria. Based on this, out of the five scenarios, the so-called ‘hybrid’ scenario proved to be the most successful: establishment of a charging network, support incentives for private purchases and government fleet purchases in order to increase public awareness of and familiarity with EV technology as individuals see more BEVs on the roadways [52].
According to Wu (2015), by 2025, the cost of electric vehicles may be lower than that of ICEVs. The author stresses that the purchase price plays a much larger role in individual decisions than the total cost of ownership (TCO) [53]. However, a study analysing the Chinese market concluded that the phasing out of incentives (2022) will cause small BEVs to reach parity before 2025 and medium and large BEVs around 2030 in terms of the total cost of ownership [54]. Zhe (2021) compared battery electric vehicles to internal combustion engine vehicles in terms of the total cost of ownership and found that shorter-range EVs can achieve cost parity with an equivalent internal combustion engine vehicle in as little as five years, despite the higher price [55]. However, according to Dumortier et al. (2015), the availability of information related to the total cost of ownership increases the likelihood that consumers preferring small and medium-sized cars will choose to buy Hybrid Electric Vehicles (HEV), PHEVs, or BEVs, whereas fuel-saving information for only five years of operation has proven ineffective [56].

3. Data Collection, Calculation Method

During the market research, we examined by country which electric, plug-in, and internal combustion vehicles we could expect to receive sufficient information regarding each country. Another aspect of choosing a car model was that passenger cars listed on the official website of the European Alternative Fuels Observatory (hereinafter: EAFO) should also be part of our study. We tried to find the largest second-hand advertising surfaces in each country; the data comes from 2–5 databases [57,58,59,60,61,62,63,64,65,66,67,68,69,70,71,72,73,74,75,76,77,78,79,80] per country.
In the primary study, data were collected for 16 different types for a start, but a minimal number of advertisements were found for two types in some countries. Unfortunately, meaningful data related to the Mitsubishi I-MIEV as one of the most affordable BEVs and the Toyota Prius released in 1997 as the world’s first mass-produced hybrid car were collected only from Poland and Hungary despite the worldwide sales of more than 4 million units [81]; thus, they were removed from the investigation. Fourteen types were analysed in more detail, including small, lower, middle, and upper-middle categories. Fiat 500e [82,83,84,85,86,87,88,89], Renault ZOE [90,91,92,93,94,95,96,97], Volkswagen ID.3, VW E-Golf, VW Golf GTE, VW Golf TSI [98,99,100,101,102,103,104,105], Tesla Model 3 [106], Nissan Leaf [107,108,109,110,111,112,113,114], Mitsubishi Outlander PHEV/Eclipse Cross PHEV [115,116,117,118,119,120,121,122], BMW I3, BMW 5 Series [123,124,125,126,127,128,129,130], Volvo XC60 [131,132,133,134,135,136,137,138], Toyota Aygo, and Toyota Yaris [139,140,141,142,143,144,145,146] were selected. In the case of the vehicles studied, the prices shown on the official website of the manufacturers per country were taken into account, as the new price of each model varies from country to country (depending on government and manufacturer subsidies). This is how the official new prices of the given car types in each country were obtained, and the average price of new cars was also calculated from them.
For electric models, the study was relatively simple, as there are only a few model variants that will surely become more diverse in terms of engine power and battery capacity over time. The situation is similar for the studied PHEVs. From the point of view of the investigation, the plug-in version of the Mitsubishi Outlander was replaced by the Mitsubishi Eclipse Cross in 2022, which did not cause any significant change in terms of pricing, but since 2022, the prices of the latter type were used in the calculations. The aim of the analysis of internal combustion types is to filter out the price changes of recent years (chip shortage, COVID, war, inflation, etc.); therefore, the used car situation can be compared in general, and the general price increase characteristic of the entire car market can also be excluded.
We tried to collect the average price per country for each type at least until 2013 as the first registration year, but of course, we did not consider the later models that are currently dominant in Europe. We chose 2013 as the “start” year because, based on Eurostat and EAFO databases, it was actually when EVs started to appear significantly. That is why we started to study how the average prices of cars produced in 2013 compare to today’s cars. In the study of EVs, since sales of the E-Golf lasted until 2021, it was replaced by ID.3; therefore, ID.3 prices were applied in the statistical calculations and for the 2022 and recent prices.
When examining the prices of used ICE passenger cars, the prices of each model were used to ensure an adequate amount of data, but due to the generally wide range of engines, especially for some older models, the prices of versions with several engines are also included. In the case of the Toyota Yaris, there was no difference in price between the 1.0 and 1.5 engine versions. For the Volkswagen Golf, variants with 1.0 TSI, 1.2 TSI, 1.4 TSI, and 1.5 TSI engines were also considered. In addition, where production of the given model started later (e.g., BMW G30), the prices of the predecessor model (BMW F10 as the previous generation 5 Series) were examined, since the manufacturer has the same target market for the two models.
The data were collected between 31 January and 13 February 2023 and reflect the prices of passenger cars offered for sale at that time, extracted from 24 internet databases. Where no data was found, data combing was used, and the average price for the given model was indicated. Individual outlier prices were not recorded in the database; they were sorted there by data combing, which does not reach 25%. Since the study took place at the beginning of the calendar year, we considered cars from 2022 and 2023 with less than 5 km of mileage new vehicles; therefore, we did not list the first year of registration as 2023. The list price of the given model was also compared with that on the official manufacturer’s site. This means that the official websites of the respective models for each of the eight countries were examined, and based on these, the prices of the new models for each country and the differences between countries in this respect were detected.
Regarding PHEVs and ICEVs, vehicles with more and more colourful equipment and engine power have been added to the database as we go back in time, but the different types are identical in this category. The prices of sportier vehicles with better extras have been ignored. We tried to steer the investigation toward realism. When buying a used vehicle, the condition of the vehicle in the same year is the most decisive factor in selection. It was clearly detected that equipment and engine range were less and less relevant to the difference in prices in the case of increasingly older models; these are not relevant regarding customer value.
There were significant differences between countries in the number of car ads of some types, which can be explained by the differences in the import activities of the countries.
During the age structure analysis, the methodology of the database [147] on the EAFO website was applied, which pairs 1-1 BEV and ICEV per segment in 4 segments. In this database (in addition to comparing local CO2 emissions), mainly data on maintenance costs were provided, taking into account the energy and fuel prices of the given country. Based on the EAFO database, we examined the maintenance costs of 4 + 4 cars, assuming mileage of 12,000 km/year, 18,000 km/year, and 40,000 km/year. 12,000 km/year is the average distance travelled annually by Hungarian motorists. The 18,000 km/year was based on commuting between home and work in the agglomeration, which means 70 km per day, and we calculated an average of 21.5 working days per month. This resulted in 1500 km per month, and thus 18,000 km per year. The 40,000 km reflects a fundamentally extreme case (in terms of average driving), but in the case of fleet management, it is not uncommon for the car to travel such a long distance per year. The term of “owning” the car was set at seven years. This is explained, on the one hand, by the fact that this is the maximum time limit for the EAFO calculator, and on the other hand, the average age of the Hungarian passenger car fleet exceeds seven years in any time frame examined. Based on the three years of different mileage, maintenance costs were also calculated using the energy prices of Hungary (based on EAFO data), EAFO purchase prices, and maintenance costs (which include servicing, depreciation, and insurance costs). On the one hand, these were compared with raw numbers, which showed the total cost in relation to 7 years. In addition, to illustrate the problem, by dividing the total cost by the total mileage and multiplying it by 100 km, the total cost per 100 km was calculated for each model.

4. Results

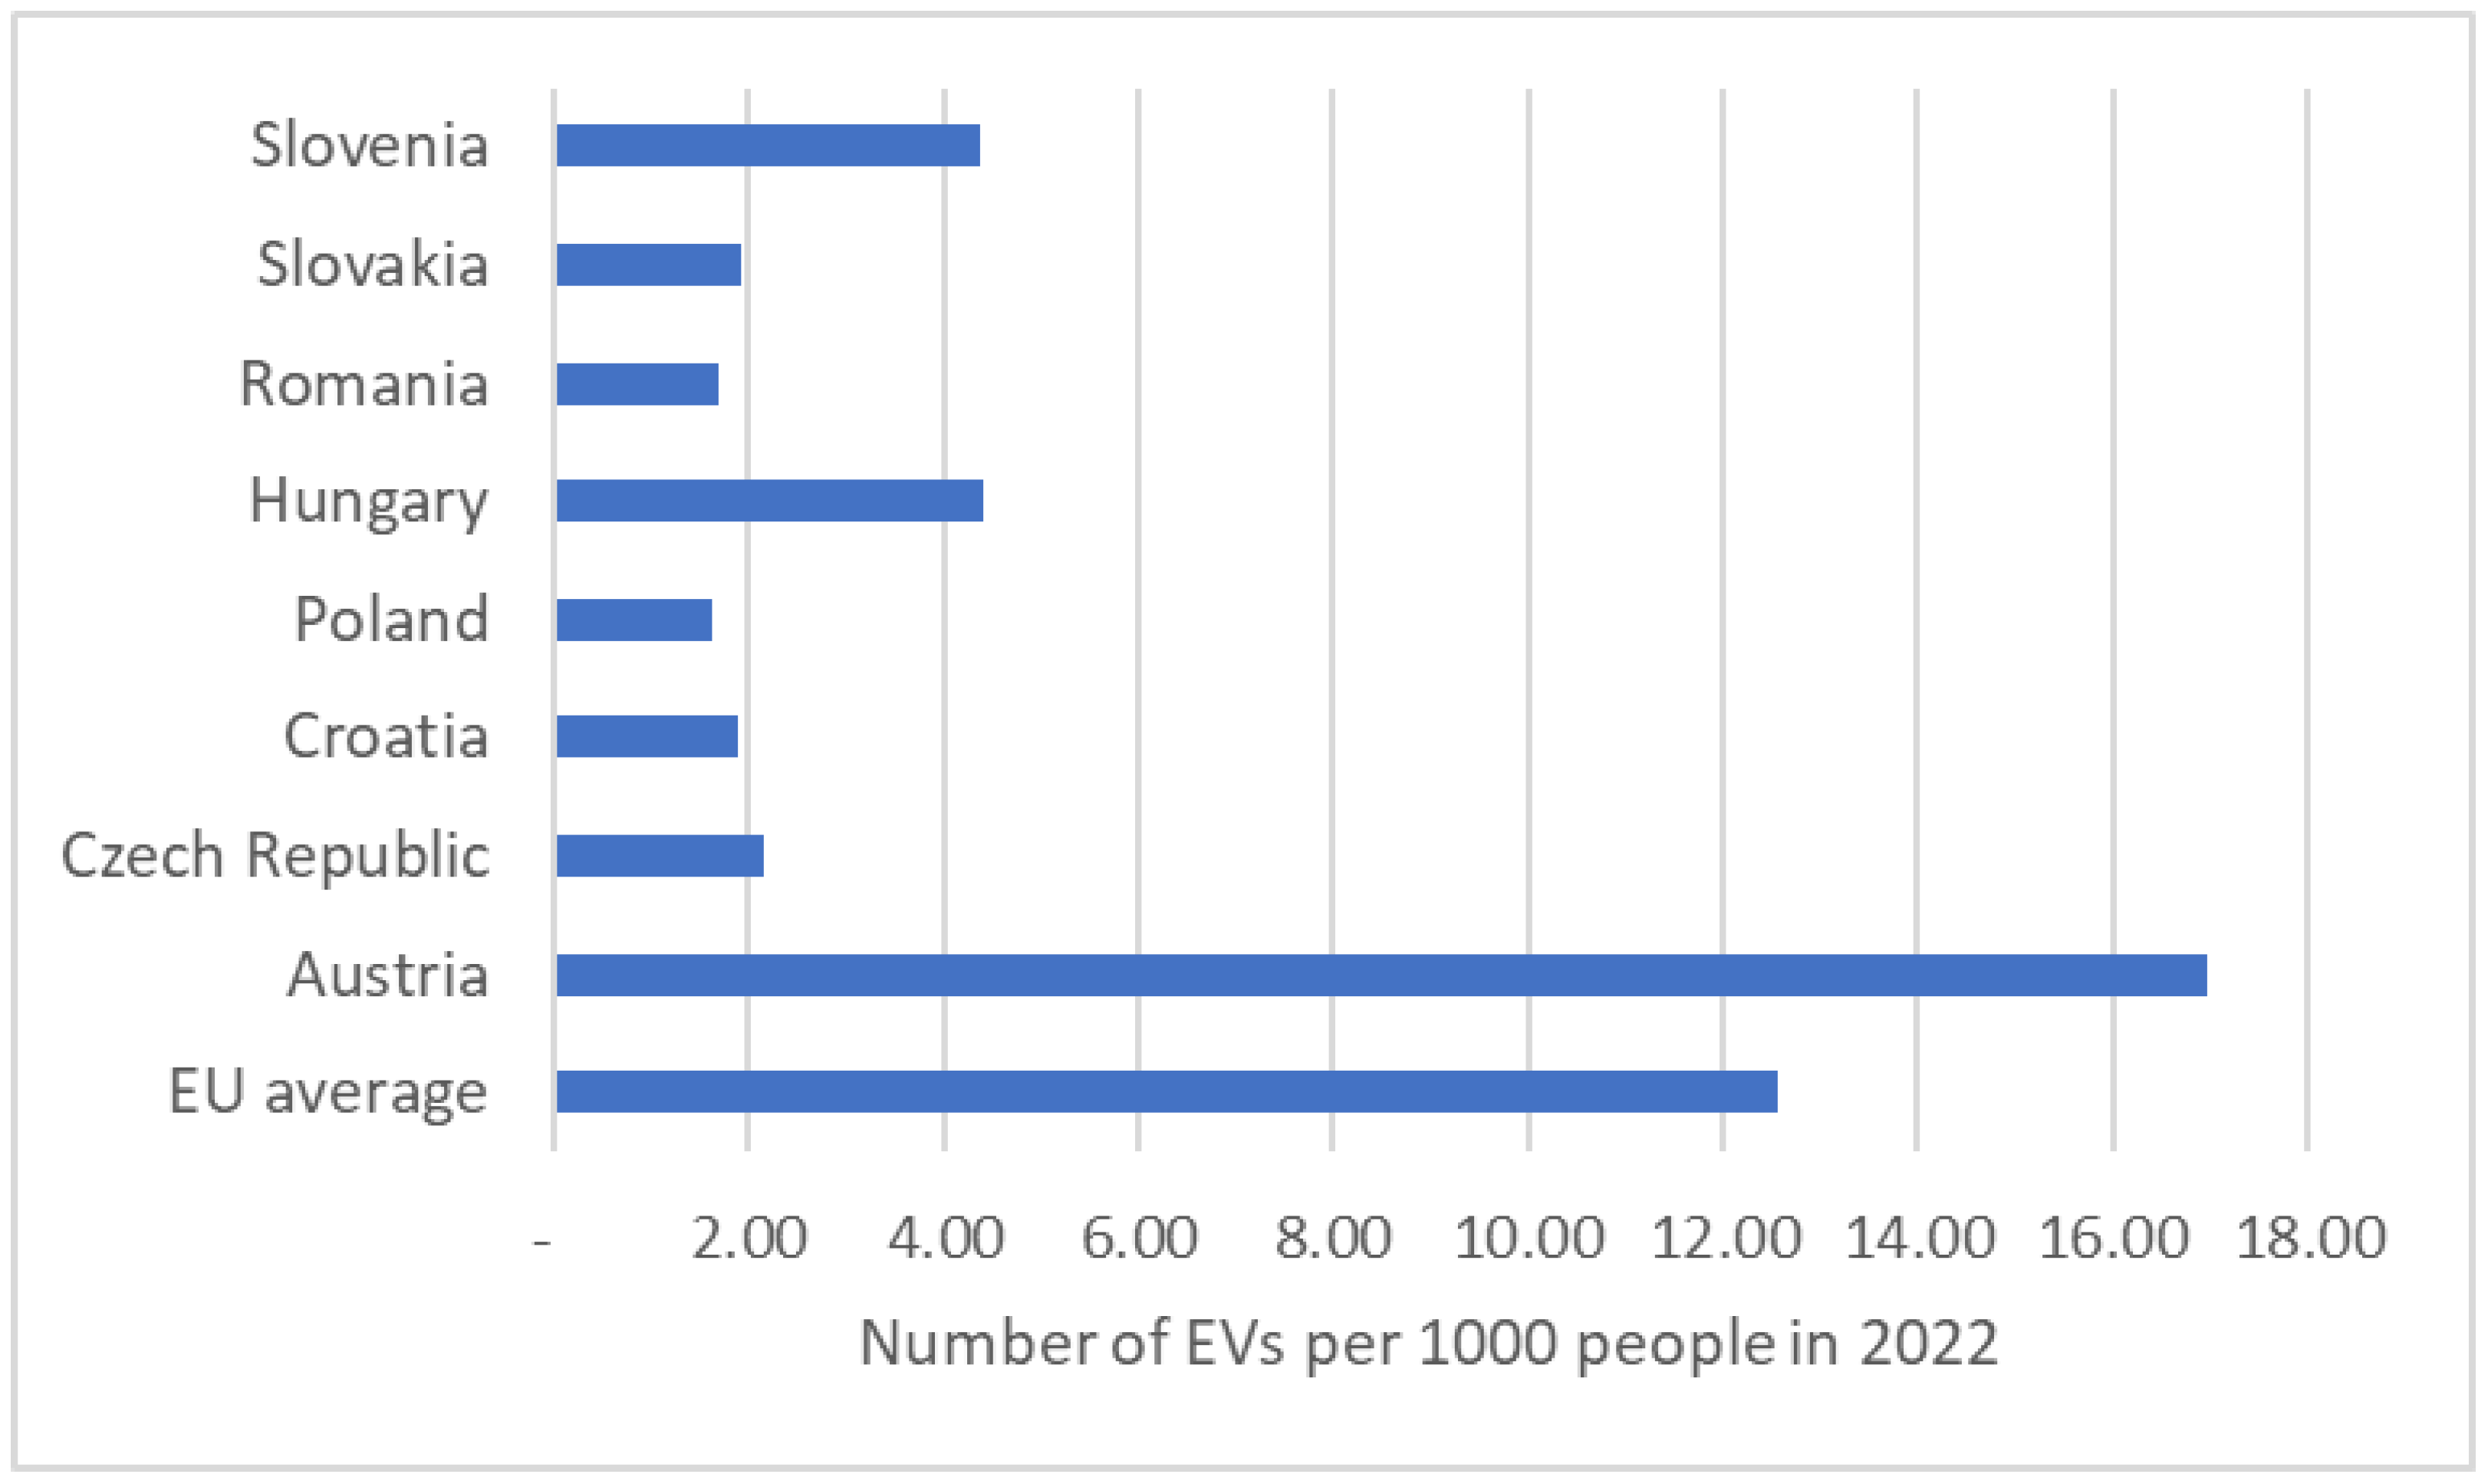
4.1. Current Situation of Electromobility

In the initial phase of electromobility expansion in the United States (USA), which was the largest PHEV market at the time, sales more than tripled in 2014 compared to 2011. Japan was the second largest market during the same period, while PHEV sales grew slowly in most Western European countries [148].
A study of the 28 countries of the EU [149] found that member states have created incentives to increase demand to promote electromobility and that taxation and infrastructure measures are important. However, the various measures are scattered, which explains the large discrepancies between countries around 2015. Germany, France, the United Kingdom, the Netherlands, and Norway have the highest European BEV and PHEV sales, which together account for 75% of new car sales [37]. In the EU, the share of EVs was less than 2% of the total car fleet between 2010 and 2017 [150]. In the EU, car ownership depends on the type of residence (highest in rural areas), but even more so on income. On the contrary, car use is dominant in EU countries for daily mobility (average 17 km) and longer distances (>100 km), except in the Czech Republic, Hungary, and Romania, where the share is less than 40% [151].
The global spread of PHEVs in the new vehicle market increased from nearly 0% in 2010 to around 4.6% in 2020 [152]. Sales of electric vehicles doubled in 2021 compared to the previous year to 6.6 million, a new record high. In 2012, only 120,000 electric cars were sold worldwide. In 2021, more were sold per week. Nearly 10% of global car sales were electric in 2021, which is four times the market share in 2019. This brings the total number of electric cars registered worldwide to 16.5 million, three times higher than in 2018. In 2022, EV sales are rising strongly, with 2 million units sold in the first quarter, which is 75% more than in the same period in 2021 [153].
Currently, there are more than 10 million electric vehicles worldwide, of which the BEV and PHEV types are the most popular and best-selling. With more than 50% of global sales, China is the largest market for electric vehicles, but Europe is becoming the fastest-growing market, with the highest number of EV sales at the end of 2020. However, an important issue for the future is the integrated development of the electric distribution network and electromobility, the use of smart grids, and V2G technology [154].
In order to compare the current state of electromobility in individual countries, it is not enough to show the increase in the number of EVs, as this alone is not enough to study the phenomenon. Therefore, in order to see and show underlying information, the population-proportional (Figure 1) and vehicle-proportional indicators of the countries concerned were examined. For population proportionality, the number of EVs per 1000 people was analysed in each country. Population data for each country were obtained from the latest available Eurostat data, which are for 2022 [155]. The number of EVs was provided by the EAFO database, which is also for 2022 [5]. As the figure shows, Austria is above the EU-27 average in terms of population-proportional values, and all other countries are significantly behind–in fact, no other country reaches half the EU average. Hungary and Slovenia are 2nd and 3rd, respectively, after Austria, but with a significant gap (while the EU average is 12.56 EVs per 1000 people, Hungary has 4.39 EVs and Slovenia has 4.38 EVs per 1000 people). Poland is in the worst position in the population-proportional EV value, with only 1.64 EVs per 1000 people, while the vehicle-proportional figures (what percentage of the total vehicle fleet are EVs) show the same.
It is clear that Poland has the lowest EV fleet in terms of both vehicle-proportional and population-proportional data. With regard to Poland, however, it has to be noted that the proportion of alternatively powered vehicles is particularly high there due to the high number and share of LPG-powered cars. Overall, there are 3.1 million registered LPG vehicles in Poland, and the number is constantly increasing [10,11,156,157]. Studying the eight countries together, there is an average of 4.38 EVs per 1000 people. The lag of the studied countries becomes even more pronounced if we do not take into account Austria (as it is an outlier country in all respects) and look at the average of the 7 countries. In this case, the indicator is 2.58 EVs per 1000 people, compared to the EU average of 12.56 EVs per 1000 people.

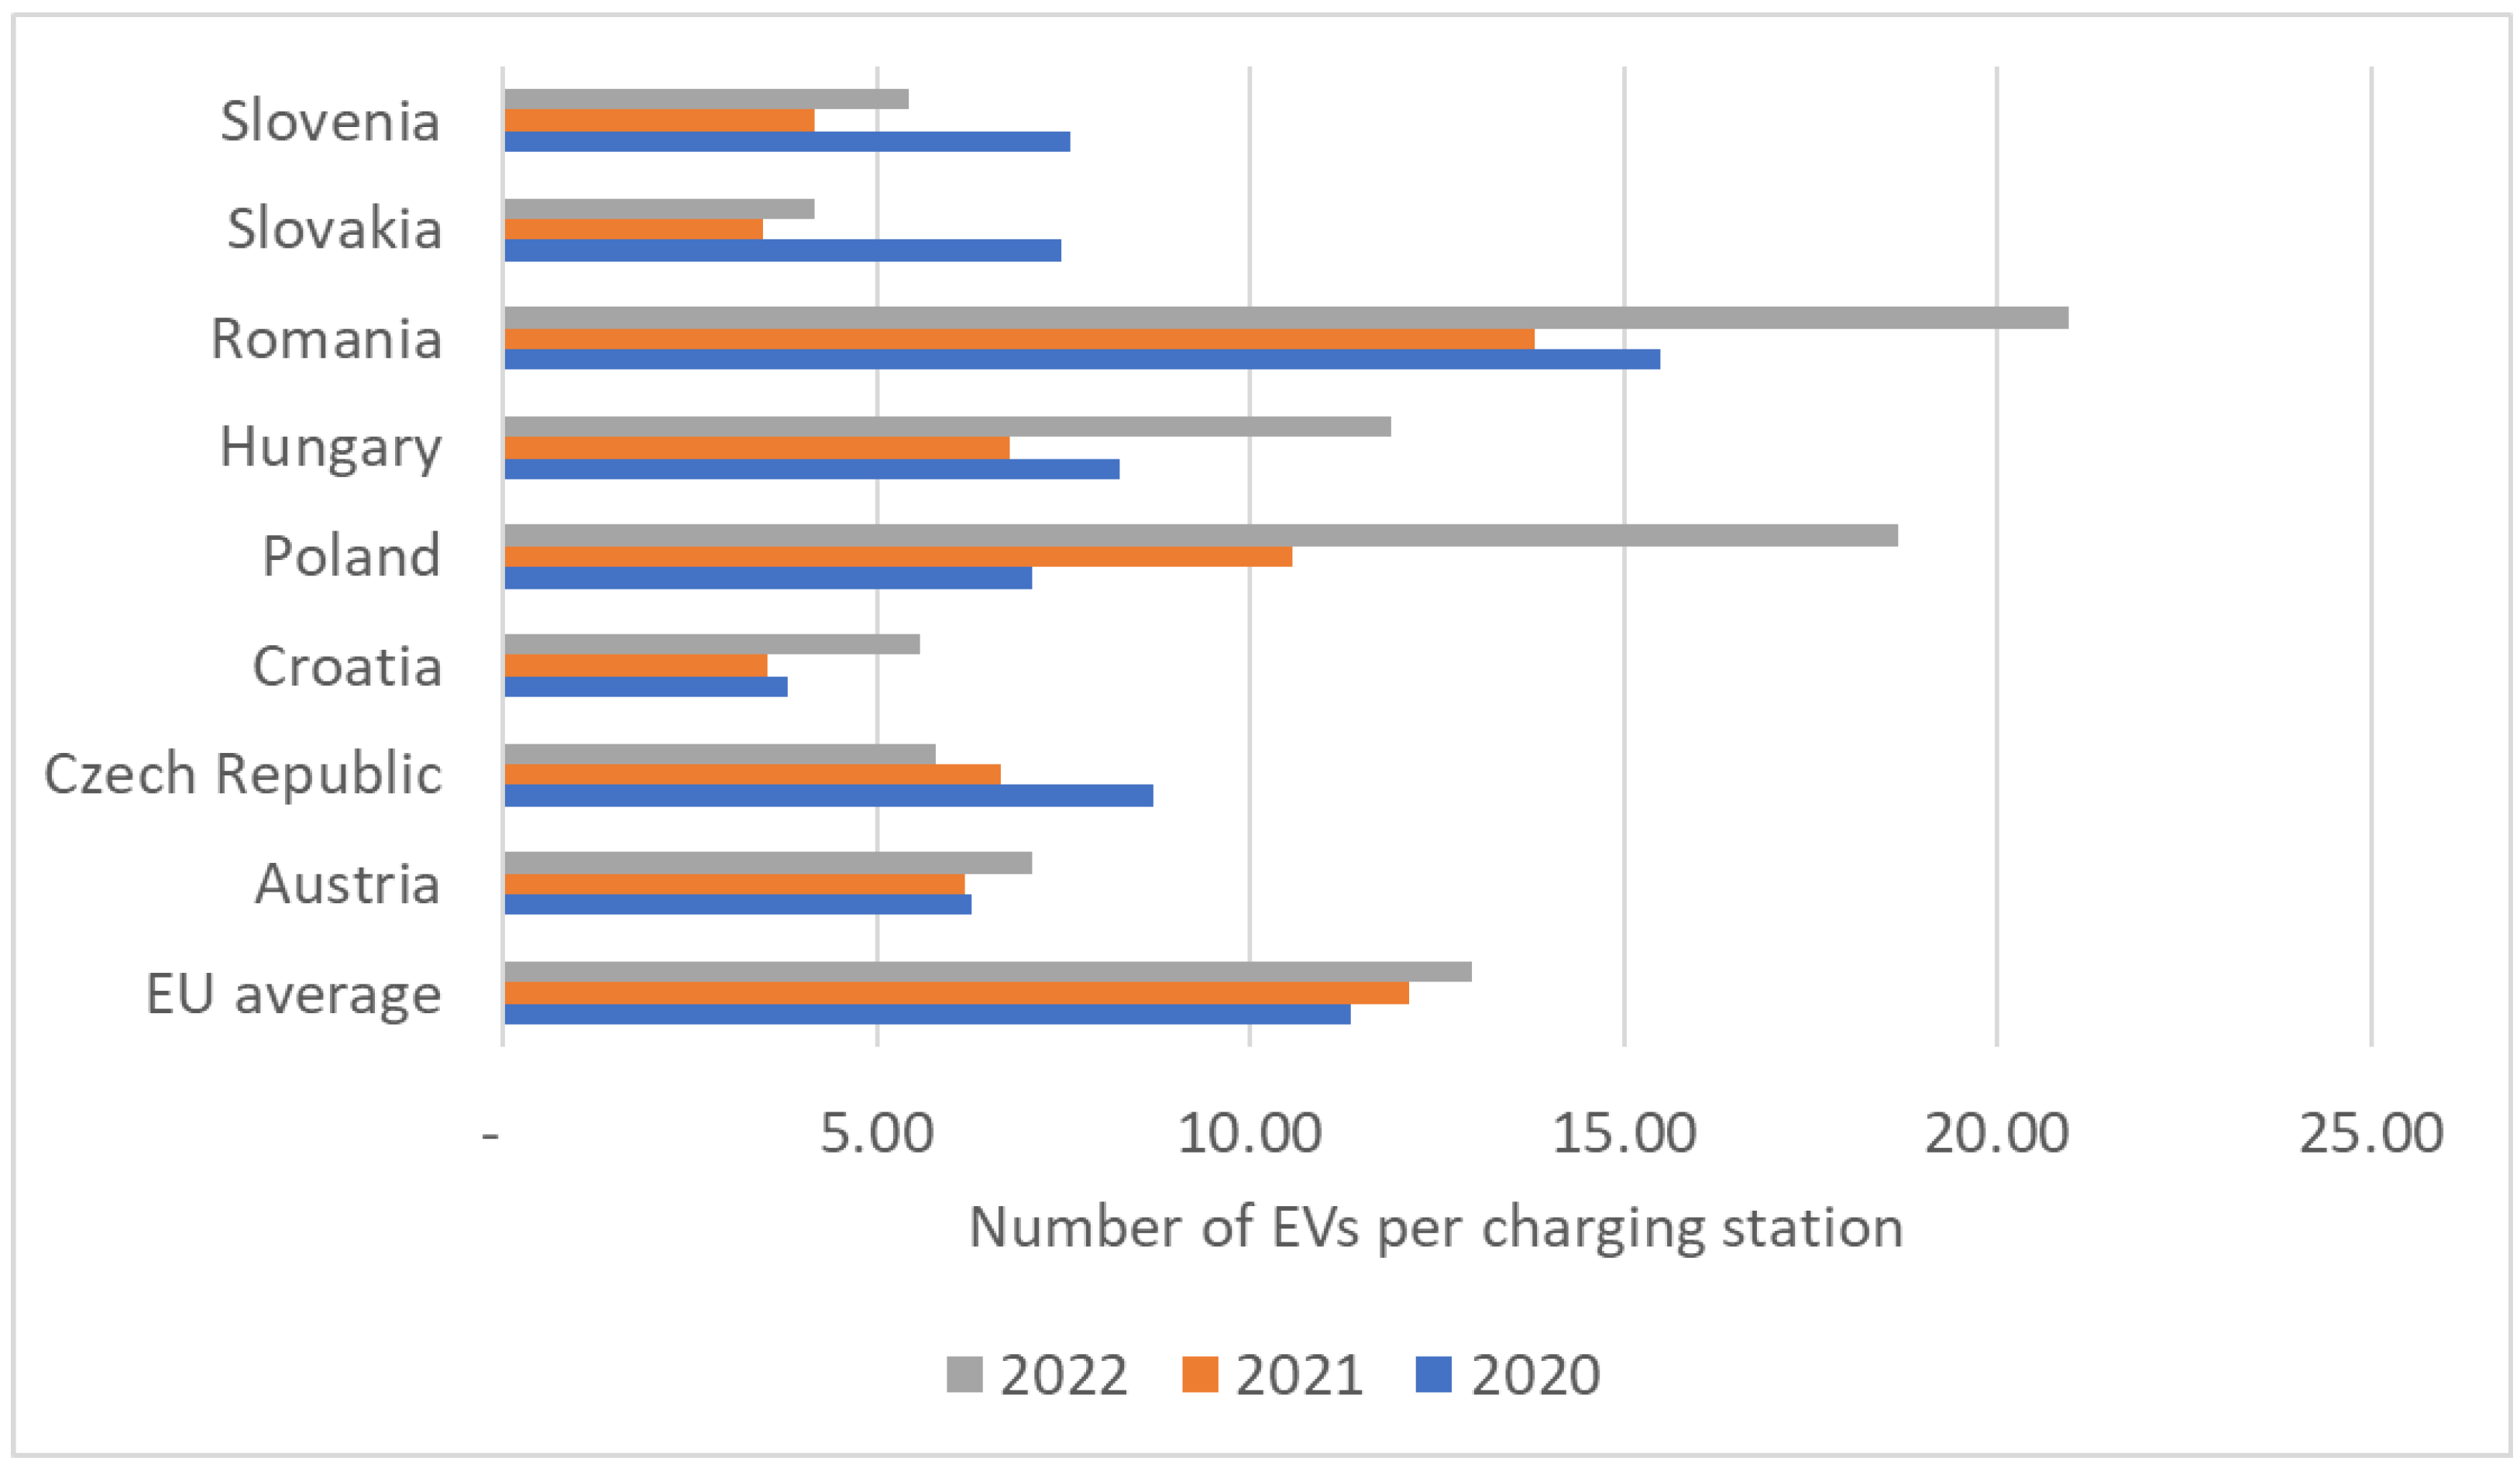
4.2. Analysis of Electromobility Infrastructure

It is not enough to look at the number and share of EVs. Looking at electric vehicles as innovations, incentive schemes to promote their spread are defined at a national level, which may include direct subsidies, tax incentives, lower insurance fees, toll discounts, free parking, or bus lane use [5,158,159,160]. On the one hand, they can contribute to differences in market shares between countries, but on the other hand, the social system in which they are introduced also plays a major role [37,161,162,163]. In addition, as the EV fleet grows, it is particularly important to increase the number of charging stations [164,165,166,167,168]. Indeed, according to the literature, the purchasing power of the population, the average range of EVs, the willingness and speed to adapt innovations, and the availability of infrastructure for electromobility, in particular increasing the number of charging stations, can be identified as the most important factors influencing the spread of electromobility in a given country [169,170,171,172]. The utility value of EVs is largely conditioned by the state of technology (reliability, range, charging speed) and charging possibilities. It can, therefore, be assumed that the development of a network of electric charging stations and an increase in the balanced spatial density of charging stations are of cardinal importance for the future spread of EVs [173,174,175,176]. However, according to Luo et al. (2023), support for charging stations should not go overboard, as it may lead to the overuse of resources [177]. Ghosh et al. (2022) propose the importance and competitiveness of equipping existing fuel stations with recharging infrastructure for electric vehicles in order to facilitate the spread of electromobility [178].
At the level of the eight Central European countries discussed in the present analysis [179,180,181], significant differences can be observed in the ratio of charging points to EVs (Figure 2) based on EAFO data. For comparison, the average data of the EU27 were included in the study, thus, the results could be interpreted in a broader context. Strikingly, in 2022, Slovakia [182], Slovenia, Croatia [183,184], the Czech Republic [185,186,187], Austria [188,189], and Hungary will have better ratios than the EU average. The two countries with the largest territorial size and population, Poland [190] and Romania [191,192,193], are lagging significantly behind. However, the standard deviation of the values is significant, with extremes of 3.87 (Slovakia) and 19.17 (Romania). Between 2020 and 2022, the number of charging points compared to EVs increased most intensively in Slovakia, the Czech Republic, and Slovenia, with a minimal decrease in Austria, the EU average, and Croatia, while in the case of Hungary and mainly Romania and Poland, the ratio deteriorated significantly.
At the same time, the fact that the analysed ratio changes dynamically over time and that a favourable charging station/EV ratio alone does not necessarily mean that a country is performing well in electromobility cannot be ignored. If only the number of charging stations is studied using 2020 as a baseline (2020 = 100%) and using EAFO [194] data, the most marked development can be detected in Slovakia (478%), but a significant increase also occurred in the Czech Republic (250%), Romania (247%), and Slovenia (222%), while even the bottom-placed Poland had 124%. It is clear from the ratios that the deployment schedule of charging stations could not always keep track of the spread of EVs year after year, but it can nevertheless be stated that over the past three years, the network of charging stations has developed spectacularly in all of the eight countries.
Looking at the development of the EV fleet between 2020 and 2022, a spectacular increase can be observed for all entities examined (Table 1). Poland (395.5%) and Slovenia (106.9%) are at the two ends of the scale. In addition to Poland, Romania (329.1%), Hungary (295.5%), and Croatia (285.5%) also experienced steep growth and stronger growth than the EU average can be detected in Slovakia. Austria has seen more modest growth in the case of EVs over the last three years, but it is a clear leader in the region in terms of electromobility among the entities studied, with both the number of EVs per 1000 people and their share of the passenger car fleet outstanding, or even above the EU average. However, as shown in Figure 2, the increase in the number of EVs is not necessarily followed by an increase in the number of charging stations in the countries studied. In this regard, Romania, Hungary, Croatia, and Poland are the countries where the increase in charging stations most likely cannot keep pace with the increase in EVs. This may prove to be a serious problem and limiting factor for EV spread in the future.
In summary, when studying the ecosystem of electromobility, the eight countries analysed can be divided into three groups. Austria stands out in every respect. For countries in the second group, disproportionate development of the ecosystem is observed. Slovenia is the most balanced, while Hungary has an underdeveloped charging point network compared to EV spread, and the Czech Republic, Slovakia, and Croatia are particularly weak in EV spread. Finally, in the case of Poland and Romania, although there is a strong growth trend, the spread of both EVs and charging stations is currently significantly lower than the regional averages.

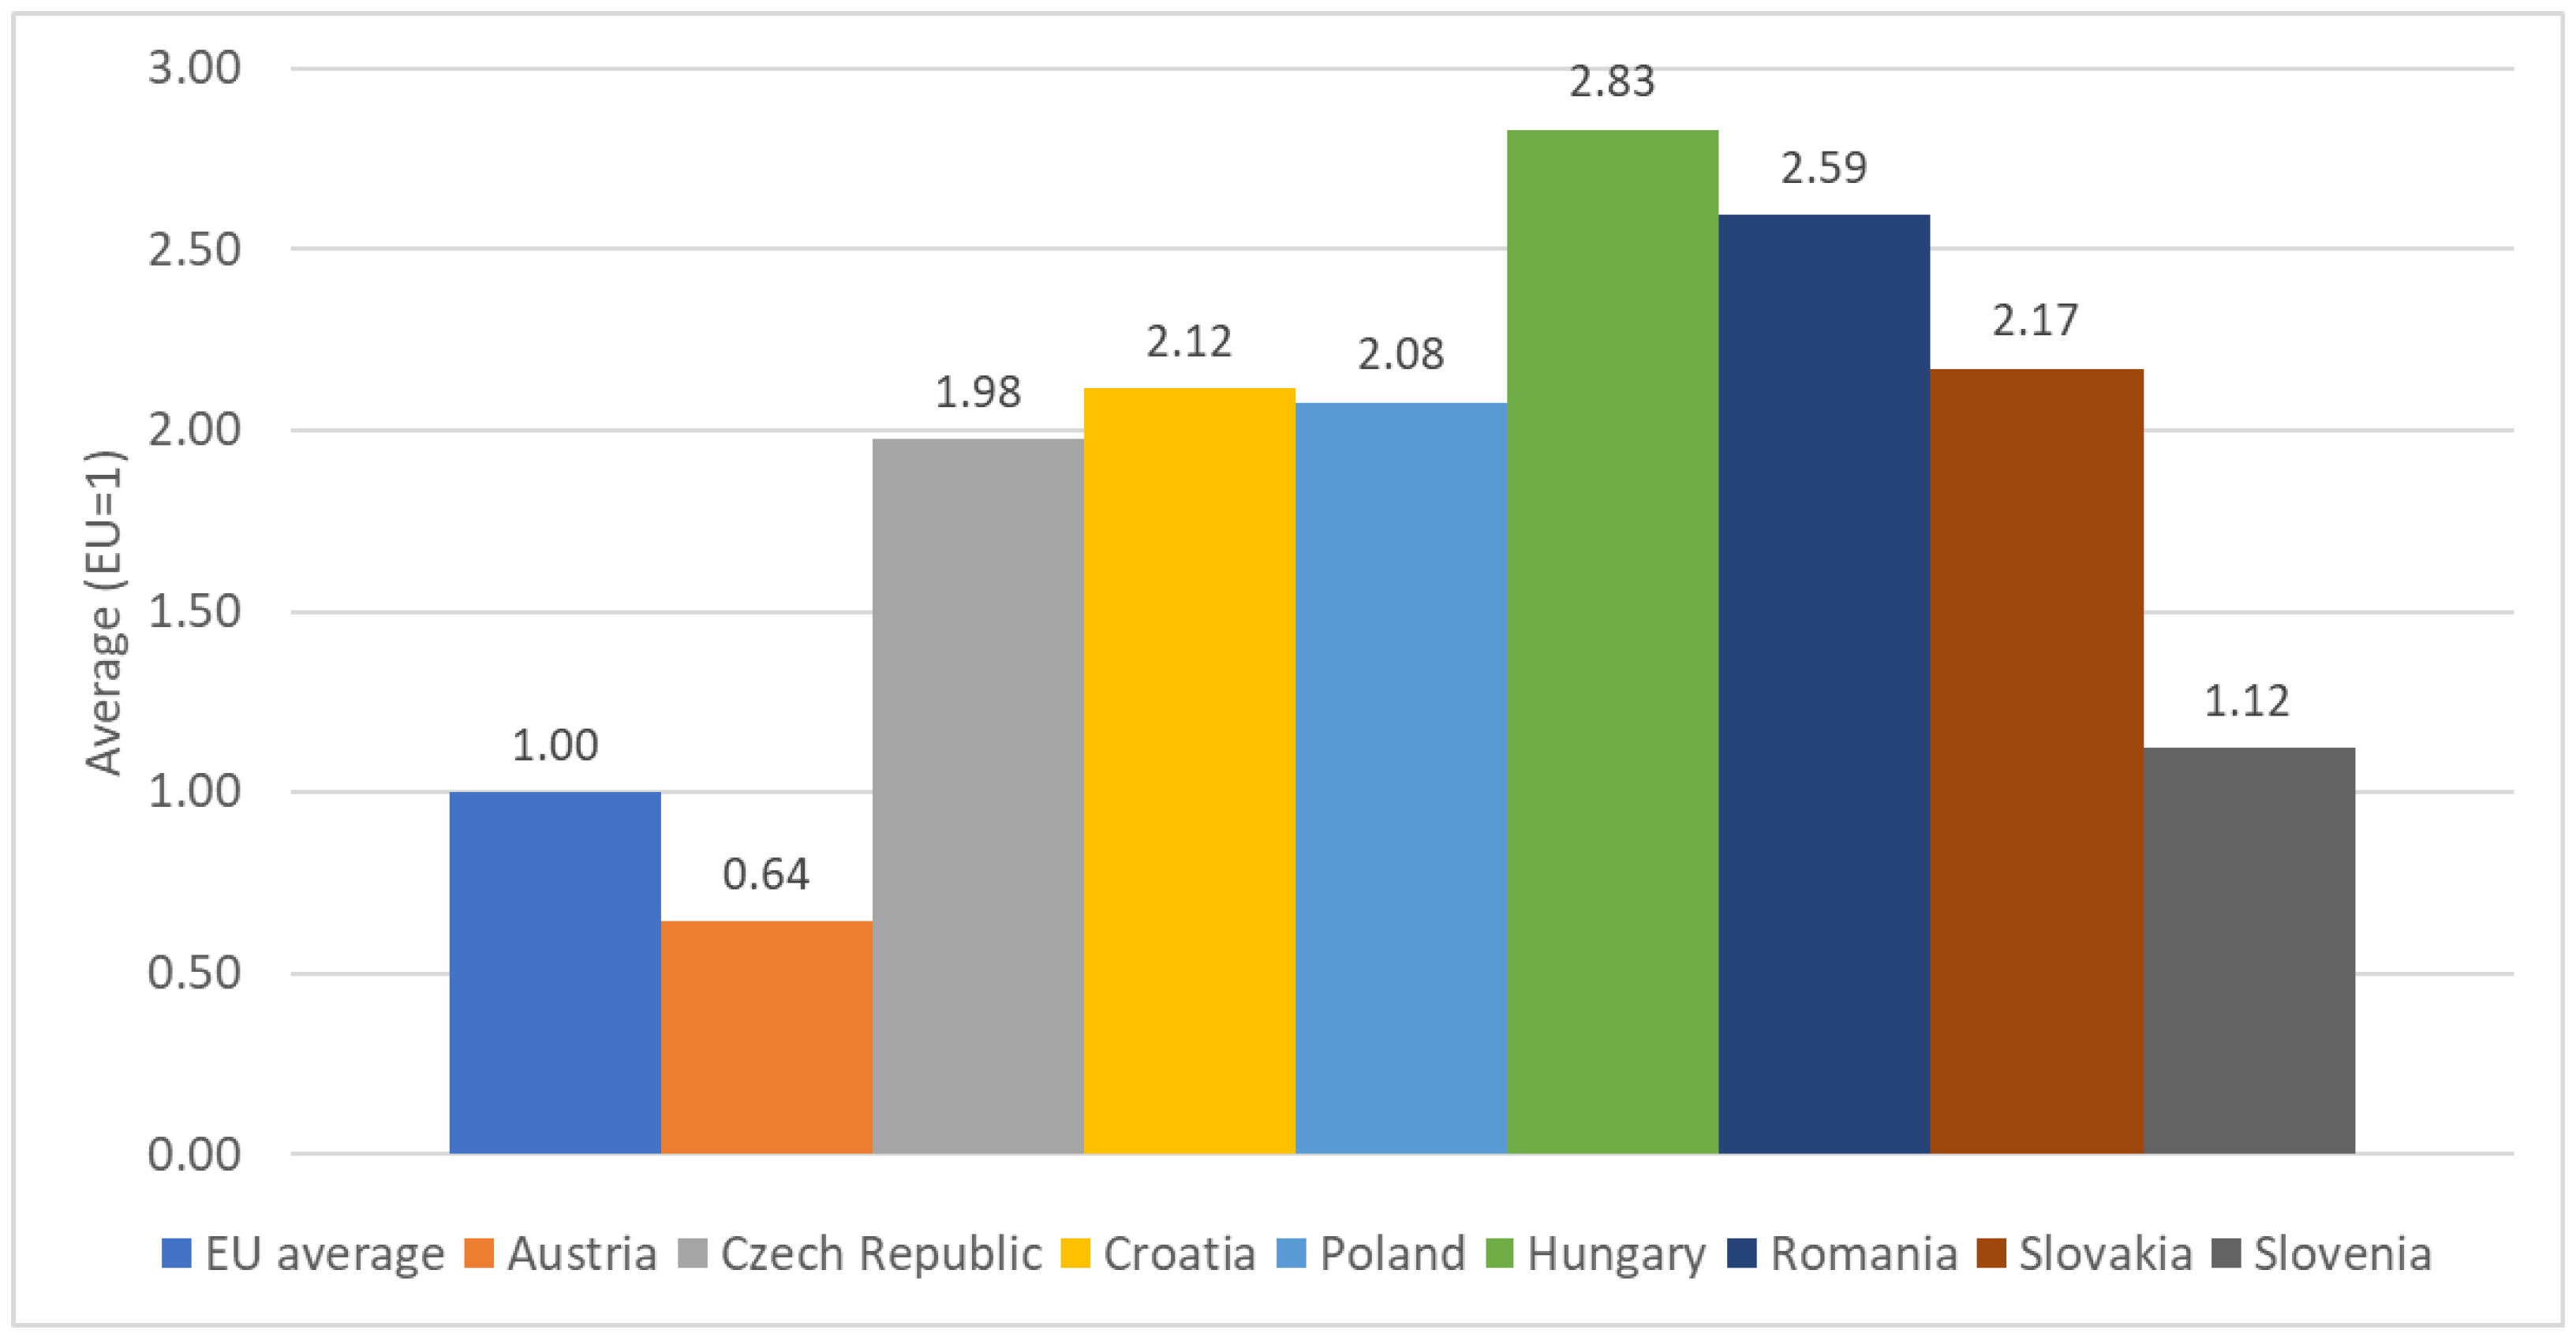
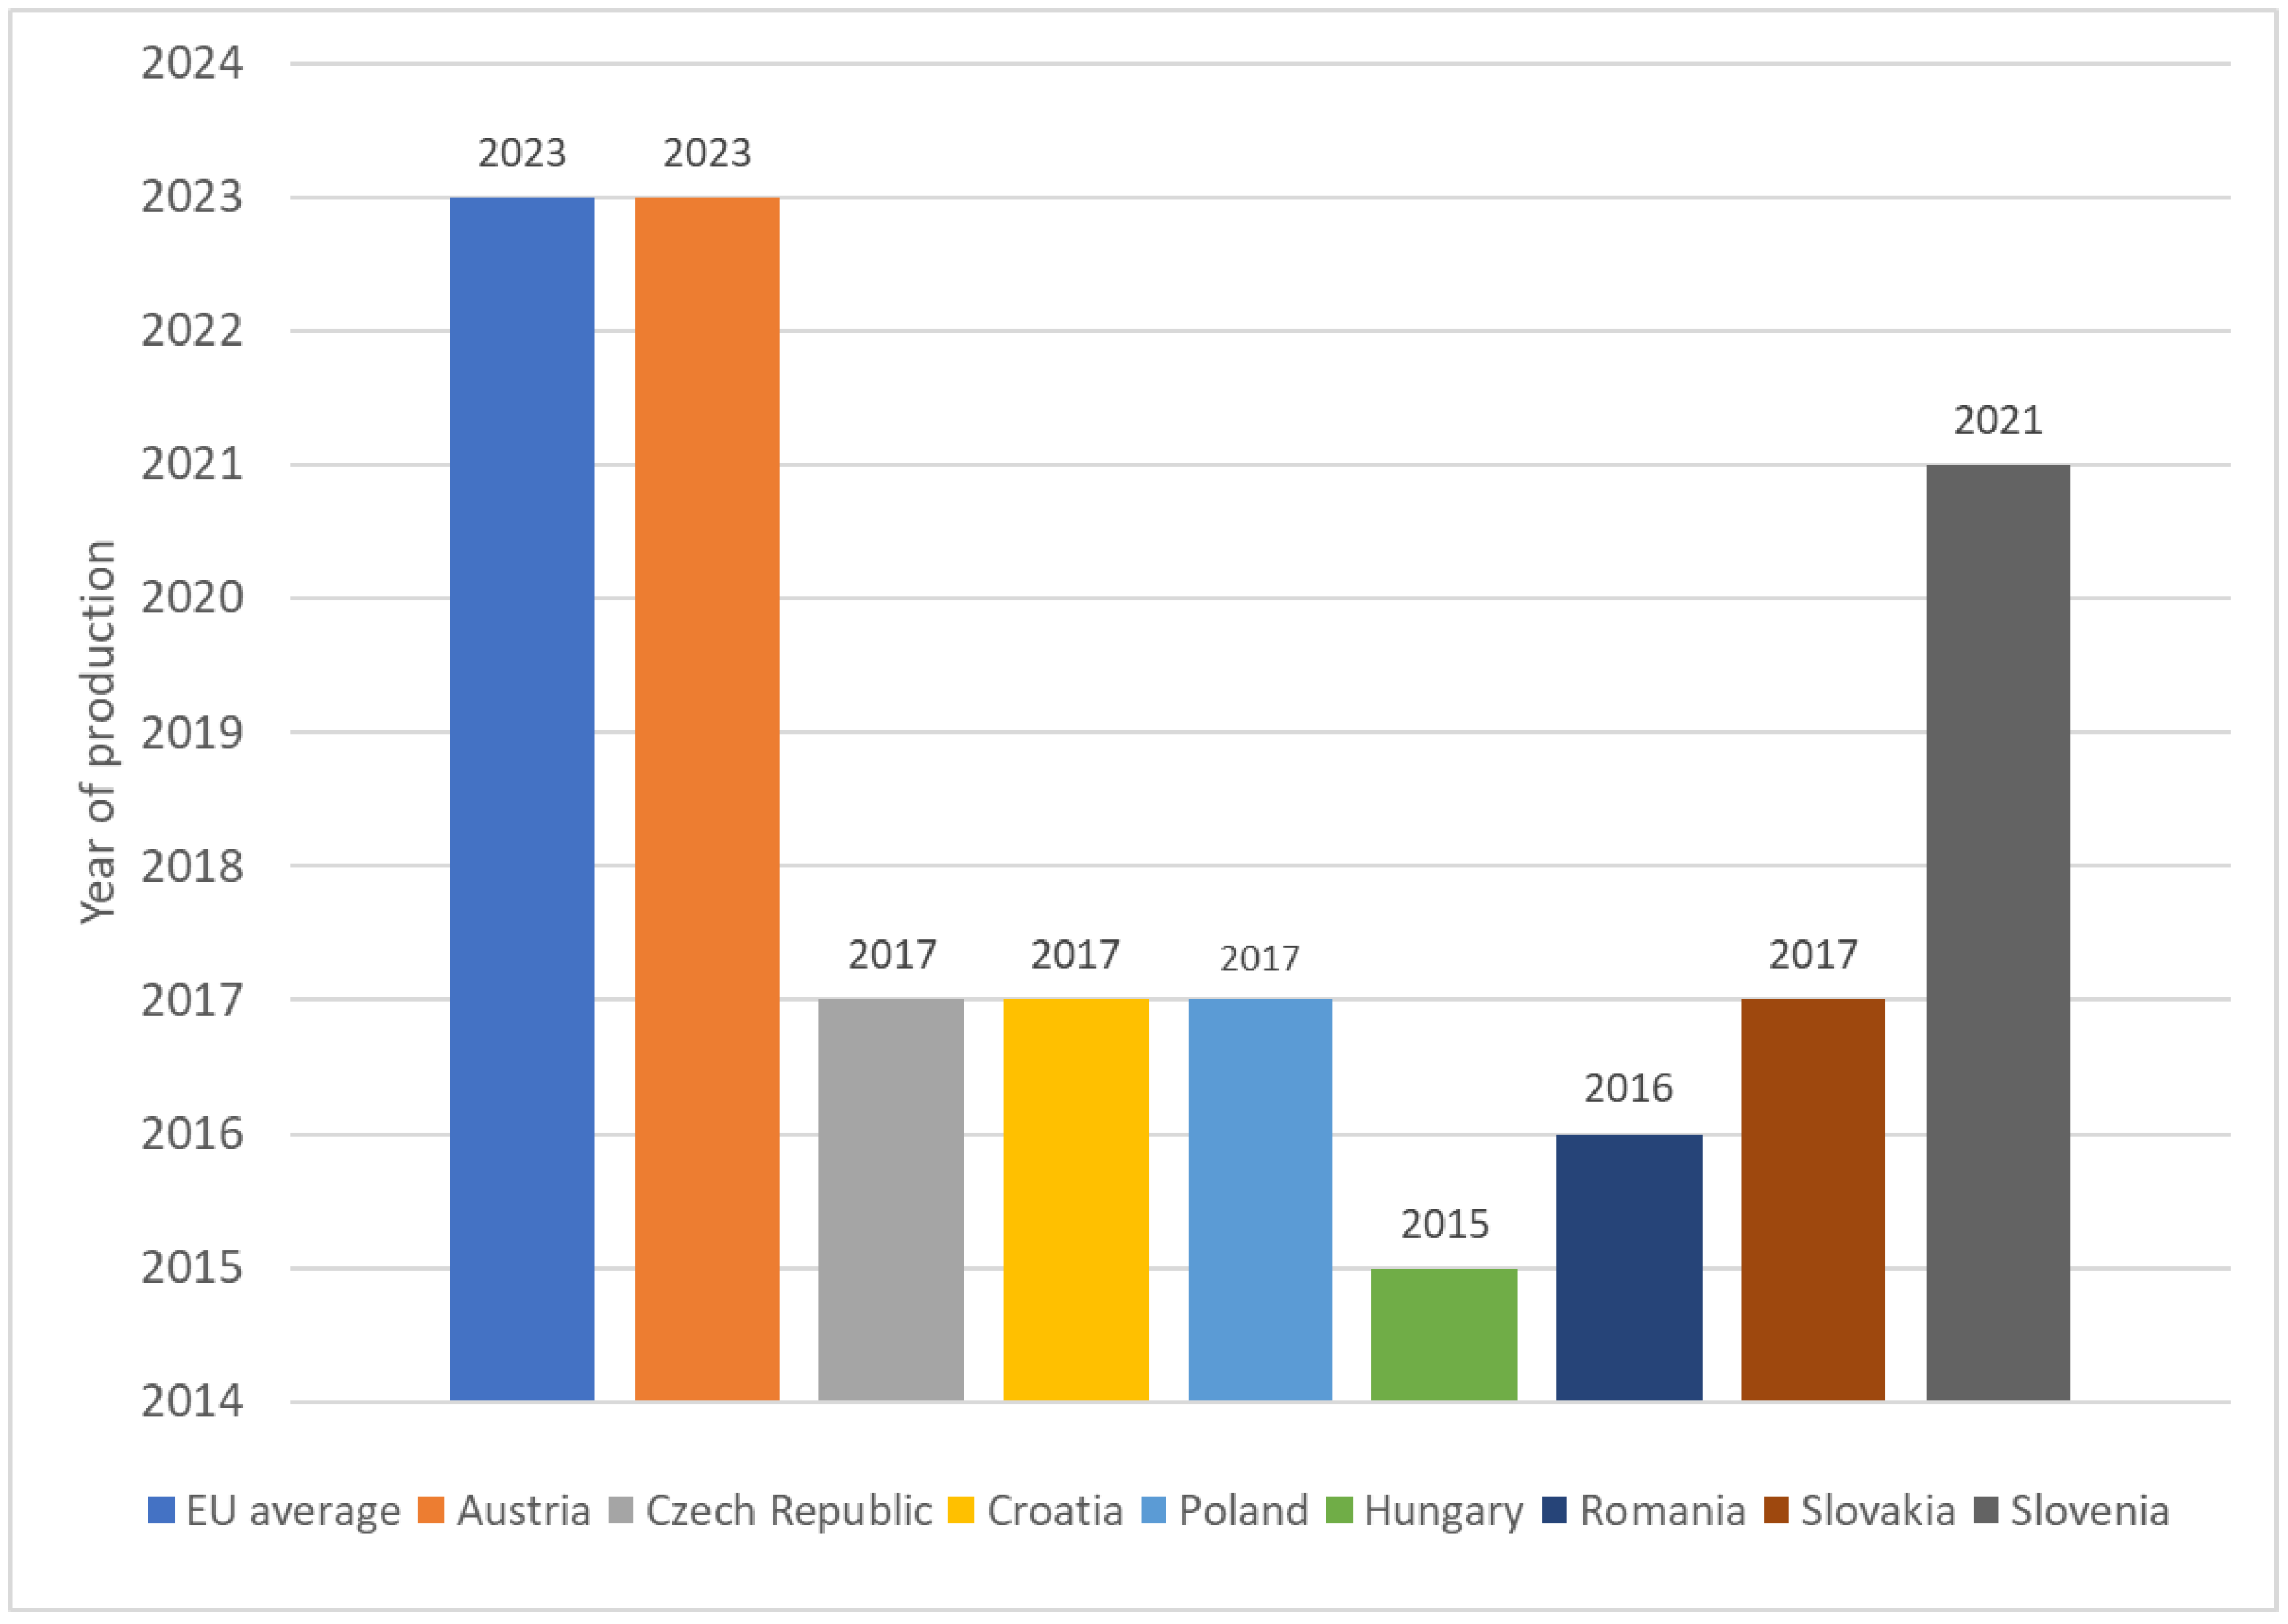
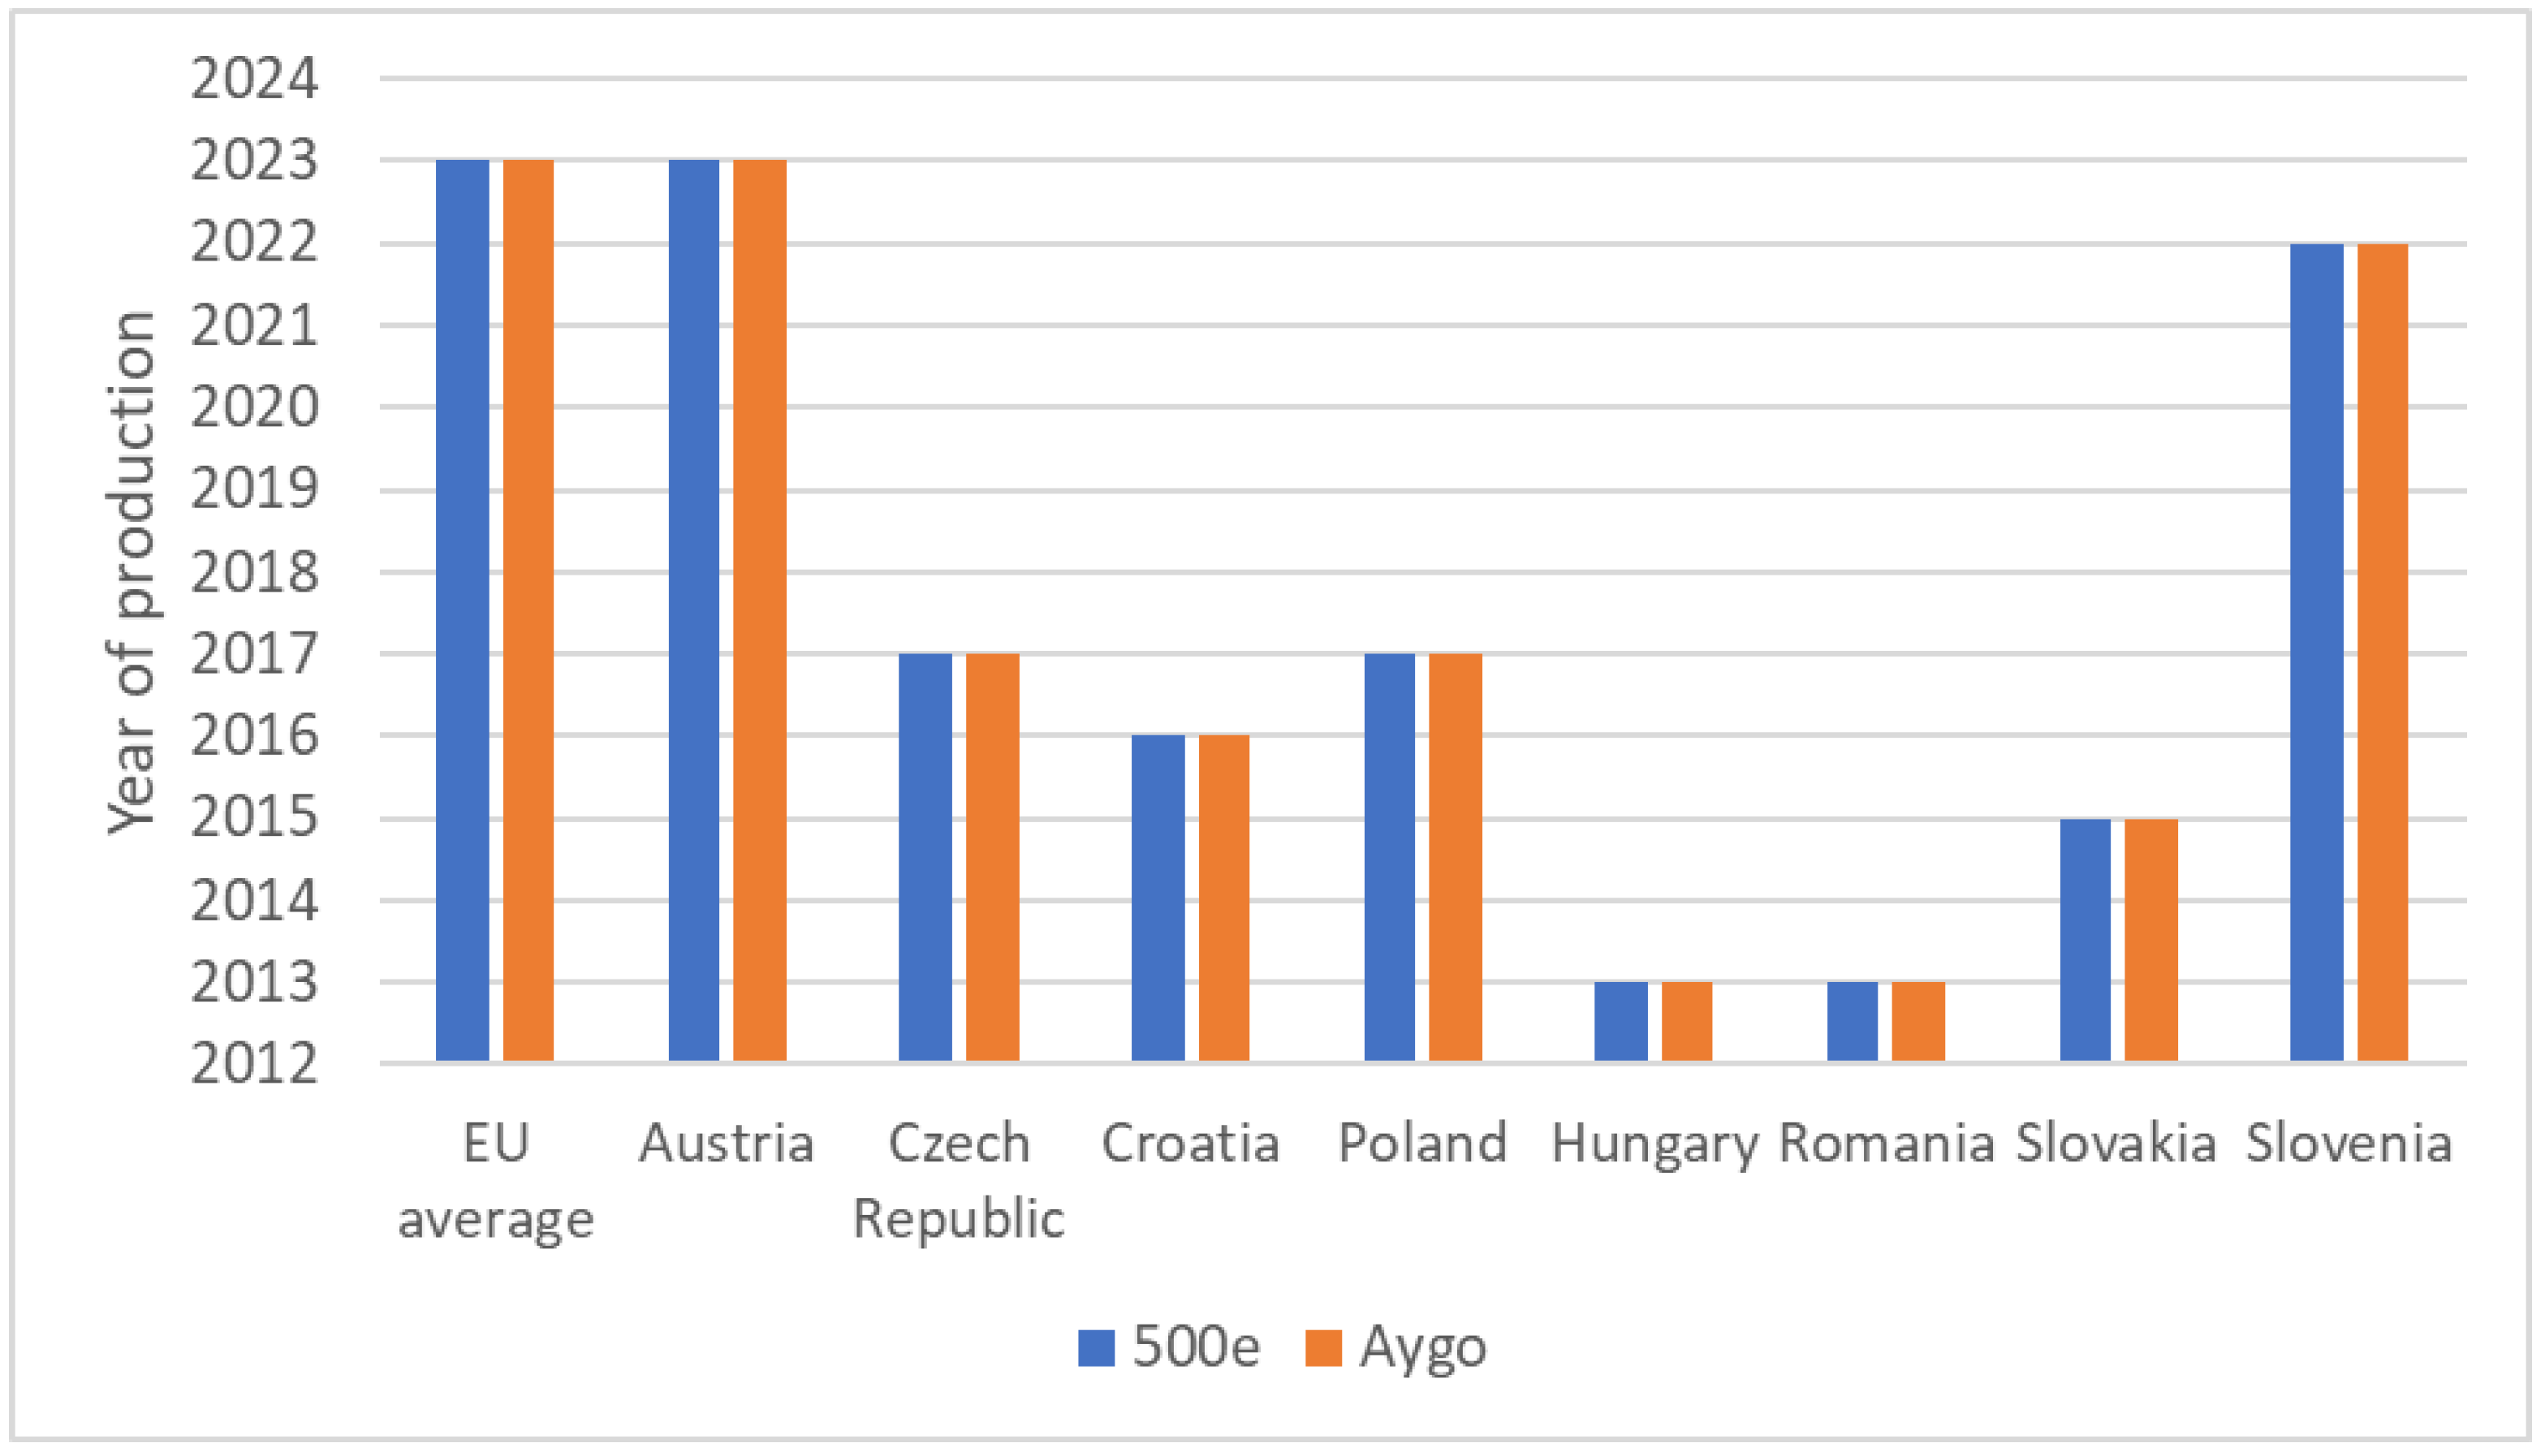
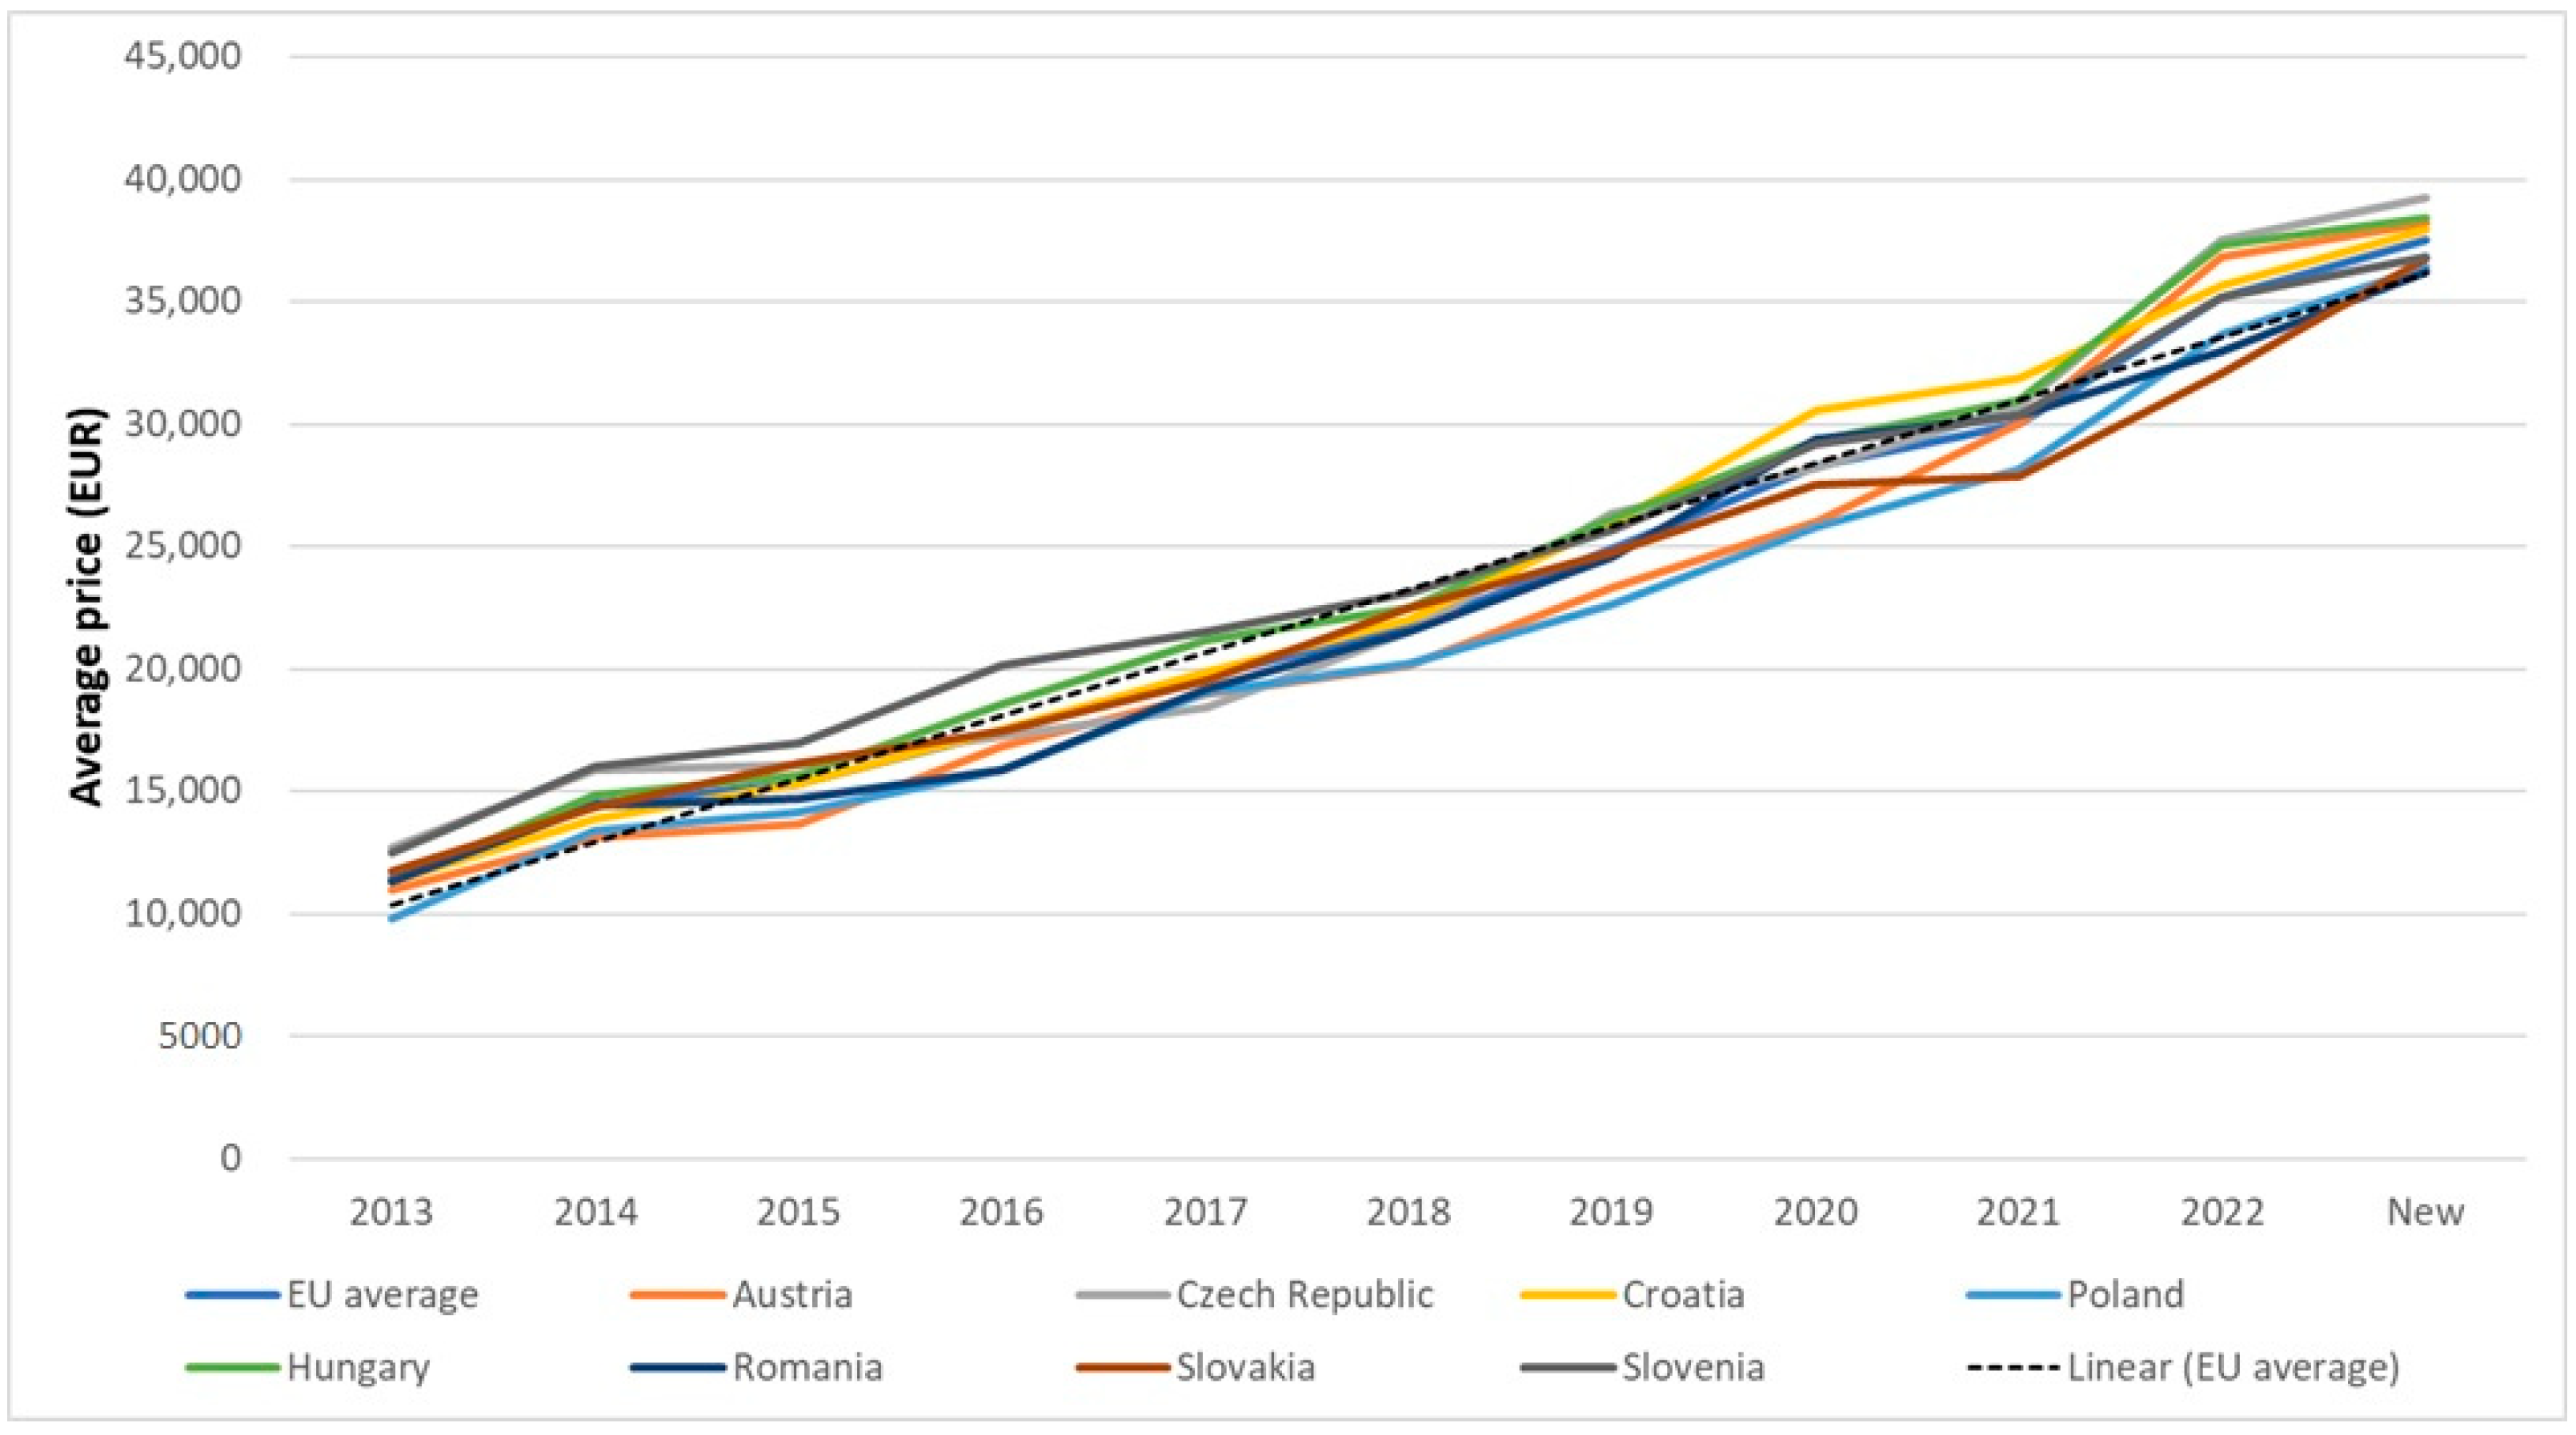
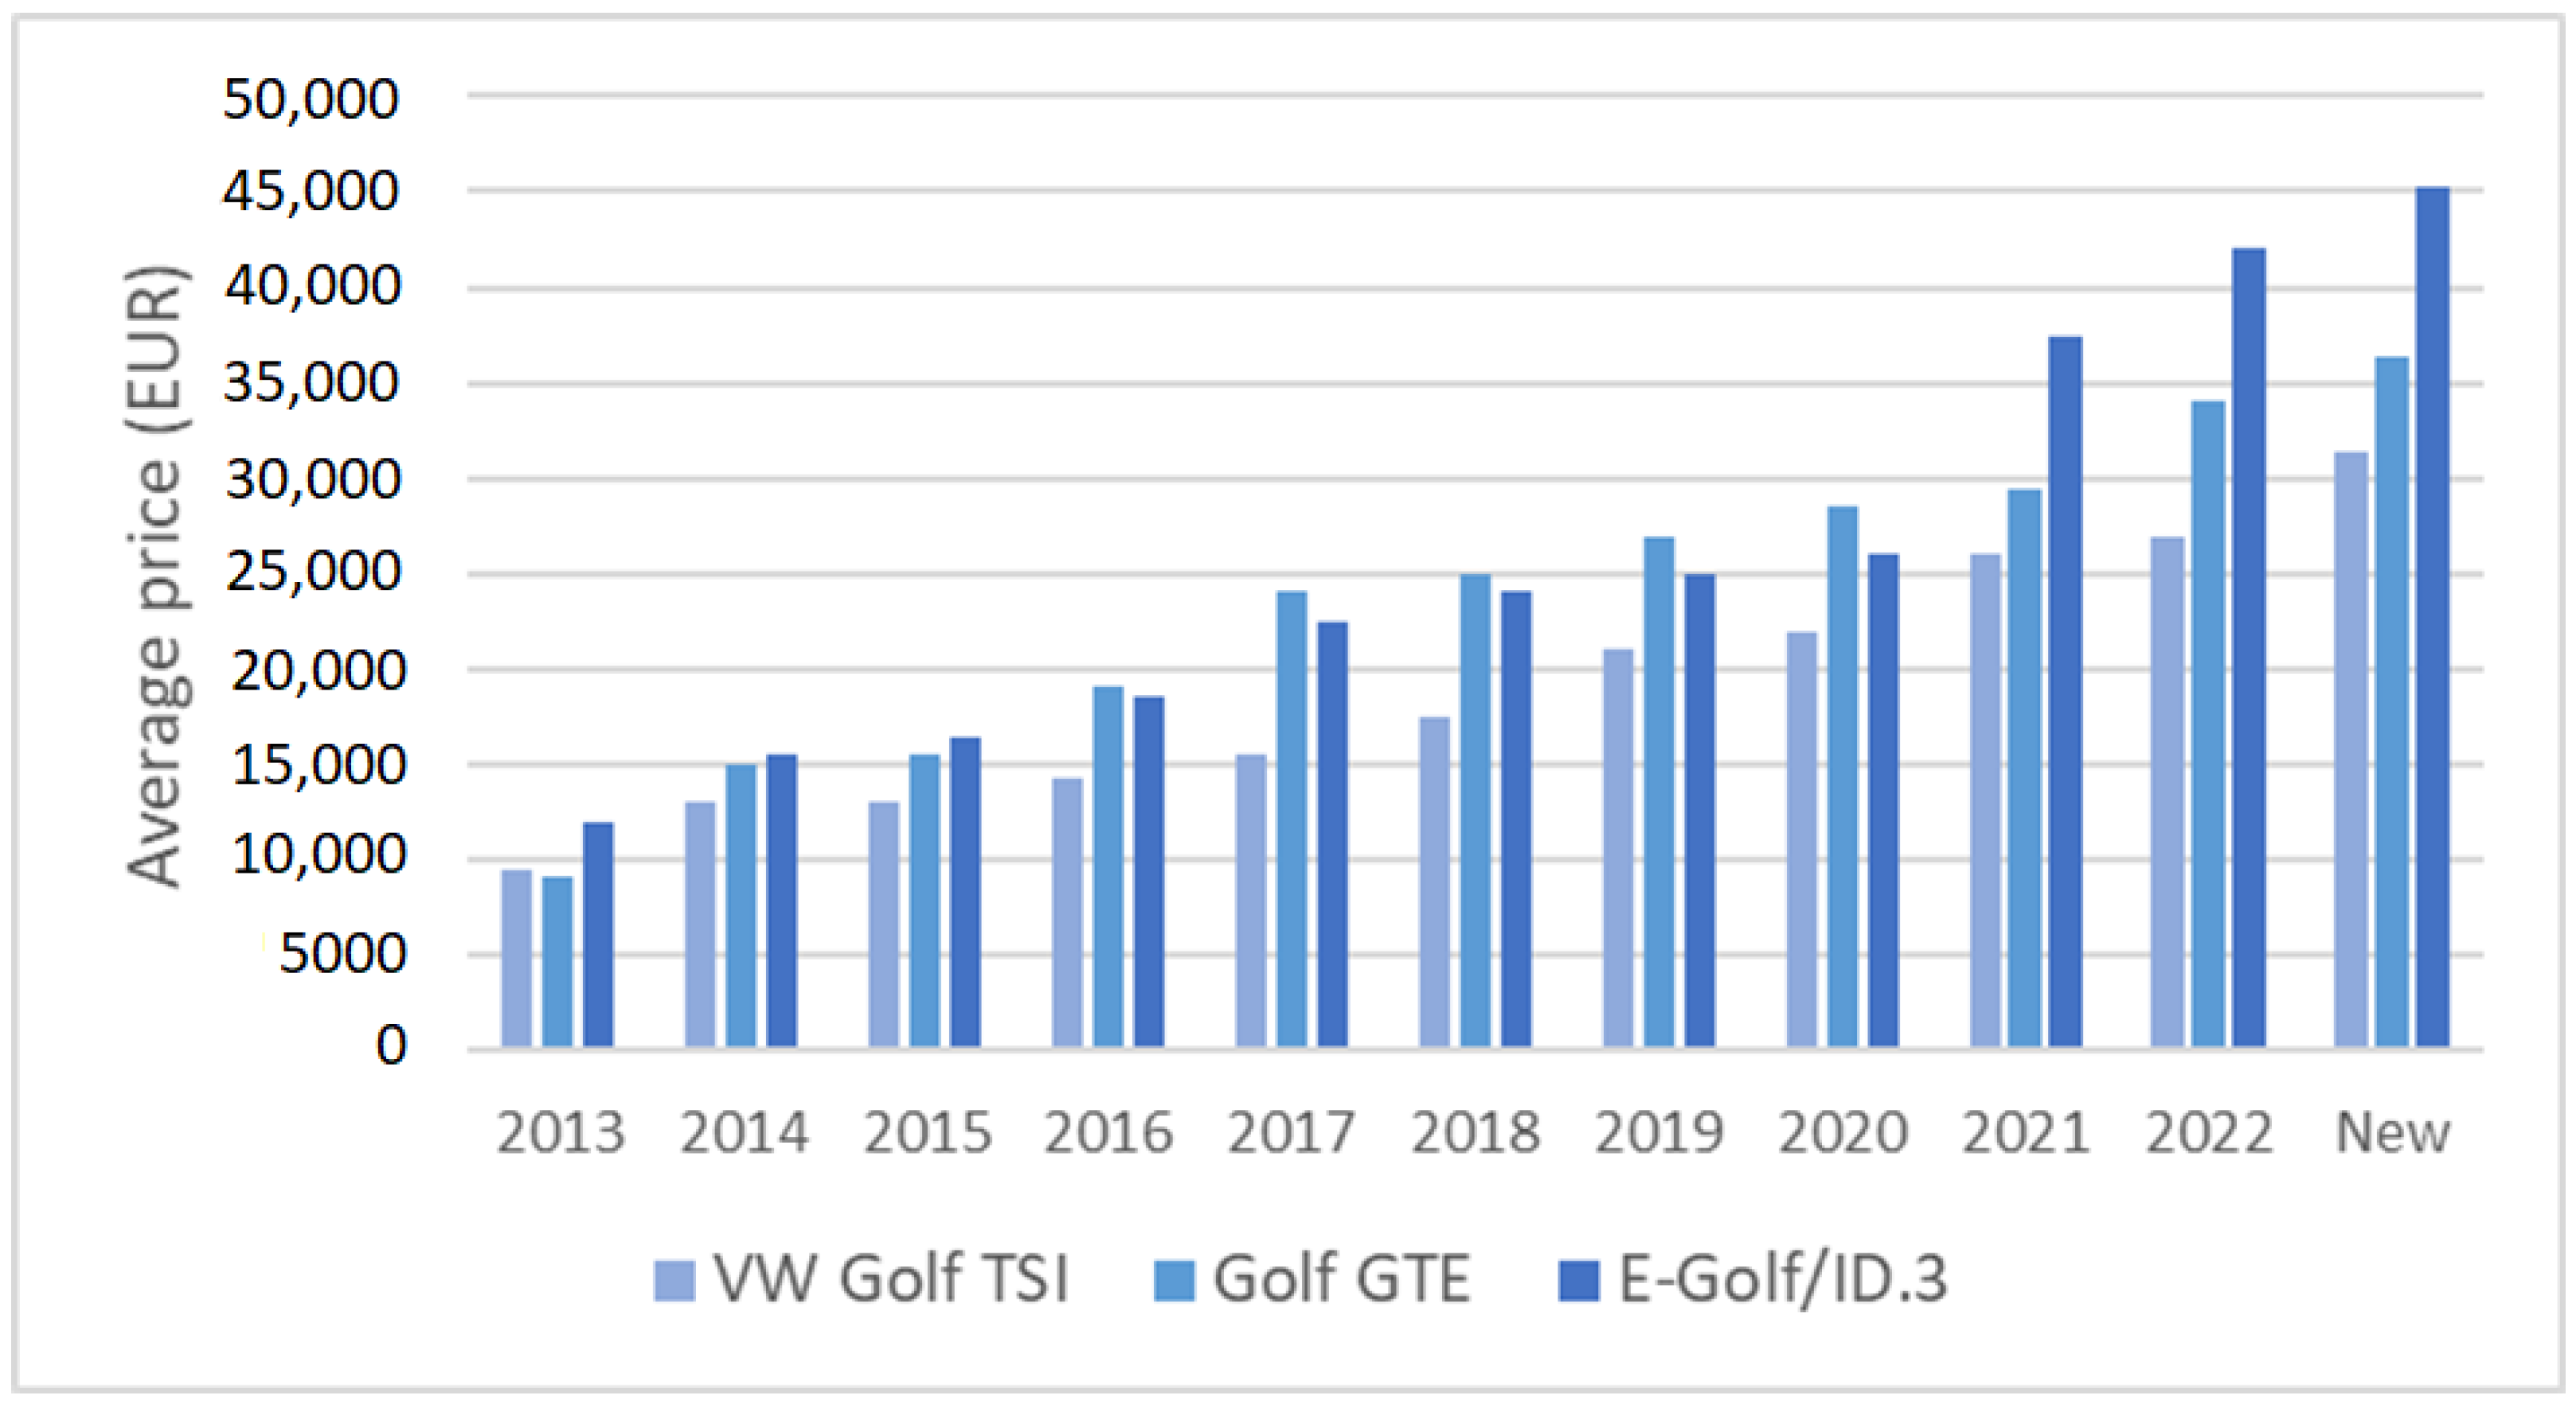
4.3. The Significance of Purchasing Power in the Spread of EVs

A major challenge to social equity is how accessible EVs are and will be to disadvantaged low-income communities. In the US, the average sales price of new BEVs increased by nearly USD 20,000 by 2020 compared to 2012, and even government subsidies cannot compensate for this increase [195]. Similarly, in European countries, buyers of electric vehicles are dominated by older, wealthier, and middle-class citizens with higher levels of education [196], for whom the most important influencing factor is the individual’s personal standards [197]. In this research, the objects of our study are countries where the purchasing power of the population is particularly low, which is precisely what gives importance to second-hand electric cars since it is extremely difficult to spread new electric cars among the lower social groups, even with subsidies and incentives, due to the high price.
The analysis of the prices revealed that, except for Poland, used cars are more expensive in the region than in Austria; for example, a used Renault Zoe is approximately 20% cheaper in Austria than in Hungary. Despite low average wages, used electric cars are more expensive than average. The list price of the Tesla Model 3, taken from the Tesla.com website, is 8.9% more expensive in Hungary than the average of all countries, and it is 16% cheaper in Slovakia. Based on the analysis of used car markets, there was an average difference of 22.5% in prices between second-hand BEVs and ICEVs of the same category.
The latest equivalent income from the Eurostat database [198], which was for 2021 at the time of query, was used in the calculation, whereby by dividing the prices per year by the monthly equivalent income for 2021, the number of months was obtained, the income of which is enough for the residents of each country to purchase a vehicle of a given age group. Here, a higher value is less favourable. Unfortunately, we were unable to obtain meaningful data even for entry-level electric cars in Romania (37.2 months) and Hungary (23.5 months) due to low incomes. In the case of the Fiat 500e, the purchase of even the 2013 model takes longer than it takes to buy a new one according to the EU average (21.1 months).
Since it would not have been possible to compare specific years, the basis for the calculation was the adjusted average salary [198], which is the salary sufficient for a decent life in a member state. The aim of the research was not to examine the differences in depth from a sociological point of view. Even with a lower average income, utilities, food, clothing, and child-rearing costs are the same. As a result, the amount you can actually save or spend on buying a car will be much less on a monthly basis with a lower average income because everyday expenses affect your salary to a greater extent.
In the case of the 14 cars studied (Figure 3), it was shown how much more time is needed for a customer with an average income in each country to purchase one compared to the EU average. In this case, again, the higher result is the worst.
The results illustrate that, except for Slovenia, in the countries of the region, typically at least twice as much work on average is needed as the EU average; Hungary and Romania are below average. Basically, looking at each power chain separately, similar results were obtained: there were no significant differences, the finding is similar in terms of purchasing power in individual cases, Austria is in a more advantageous economic position than the EU average, and Slovenia is close to the EU average in terms of purchasing cars of the same category.
In the second calculation, the average time needed to buy a new car in the EU by vehicle type and power variant was compared with the amount of time needed per manufacturing year in each country (Figure 4). We showed which car age a citizen with an average income can buy within a similar time from the average adjusted income in each country. Regardless of the types, no significant differences were observed; at most, a difference in the year could be detected.
The ratio between the average new price of the six tested electric cars in Europe and the average adjusted income in the EU was compared with the ratio between the price per country and year and the adjusted average income per country in order to compare the necessary times to show which year BEVs can be purchased in each country compared to the new price of the EU average.
In the course of the method, the nearest but not exceeding values were matched, during which it became possible to see by country what manufacture year can be assigned to a new car belonging to the EU average. The regional average is clearly 2017, so residents of the region can buy cars 5–6 years older than the EU average. Compared to the regional average, Hungary and Romania are lagging behind in terms of purchasing power. In the case of the Volkswagen ID3 and Tesla Model 3, there is not yet an old car on the market from which we could get results in the region outside Slovenia compared to the purchase of a new one.
Figure 5 shows that in the case of the Fiat 500e and Toyota Aygo (which are the low-class BEVs and ICEVs, respectively), with the time spent on buying a new 2023 car for an average EU citizen, cars manufactured in 2017 are available on average in the studied region. And if we do not take Austria into account (since it is an outlier in economic terms compared to other countries), the average citizens of the remaining seven countries will only be able to buy a model from 2016. It is worth noting the particularly weak purchasing power of Romania and Hungary, since in these two countries, people could only buy a 2013 model; thus, they are also outliers in the region based on purchasing power. Based on this, Romania and Hungary would be categorised into the same group as Bulgaria in terms of purchasing power. It can be clearly seen that the amount of purchasing power does not depend on the type of power chain, and this is almost universally true for the entire fleet of low- and medium-class passenger cars.
The average price of a new Fiat 500e in the eight countries studied is 32,000 euros, while the average price of a Toyota Aygo is less than 18,000 euros, i.e., the price of the new Fiat 500e is about 1.8 times the price of a new Toyota Aygo. At the price of a new Toyota Aygo, a 2018 model of the Fiat 500e, i.e., a 5-year-old model, can be bought. Therefore, it is clear that at the price of a new Aygo, we can only buy older cars in the same category that are alternatively powered. At the price of a new Fiat 500e, a Volkswagen Golf, among internal combustion-powered models, with a higher-equipped 1.5 TSI engine can be bought, which represents a higher category (intermediate instead of low category). However, we believe that this is not the reality for the countries in this area, but rather a maximum purchase price of 20,000 euros (22,000 euros is the average annual salary for the countries studied, which means that the purchase price of 20,000 euros can be covered by a year’s salary).
In this price category, the following ICEVs can be bought:
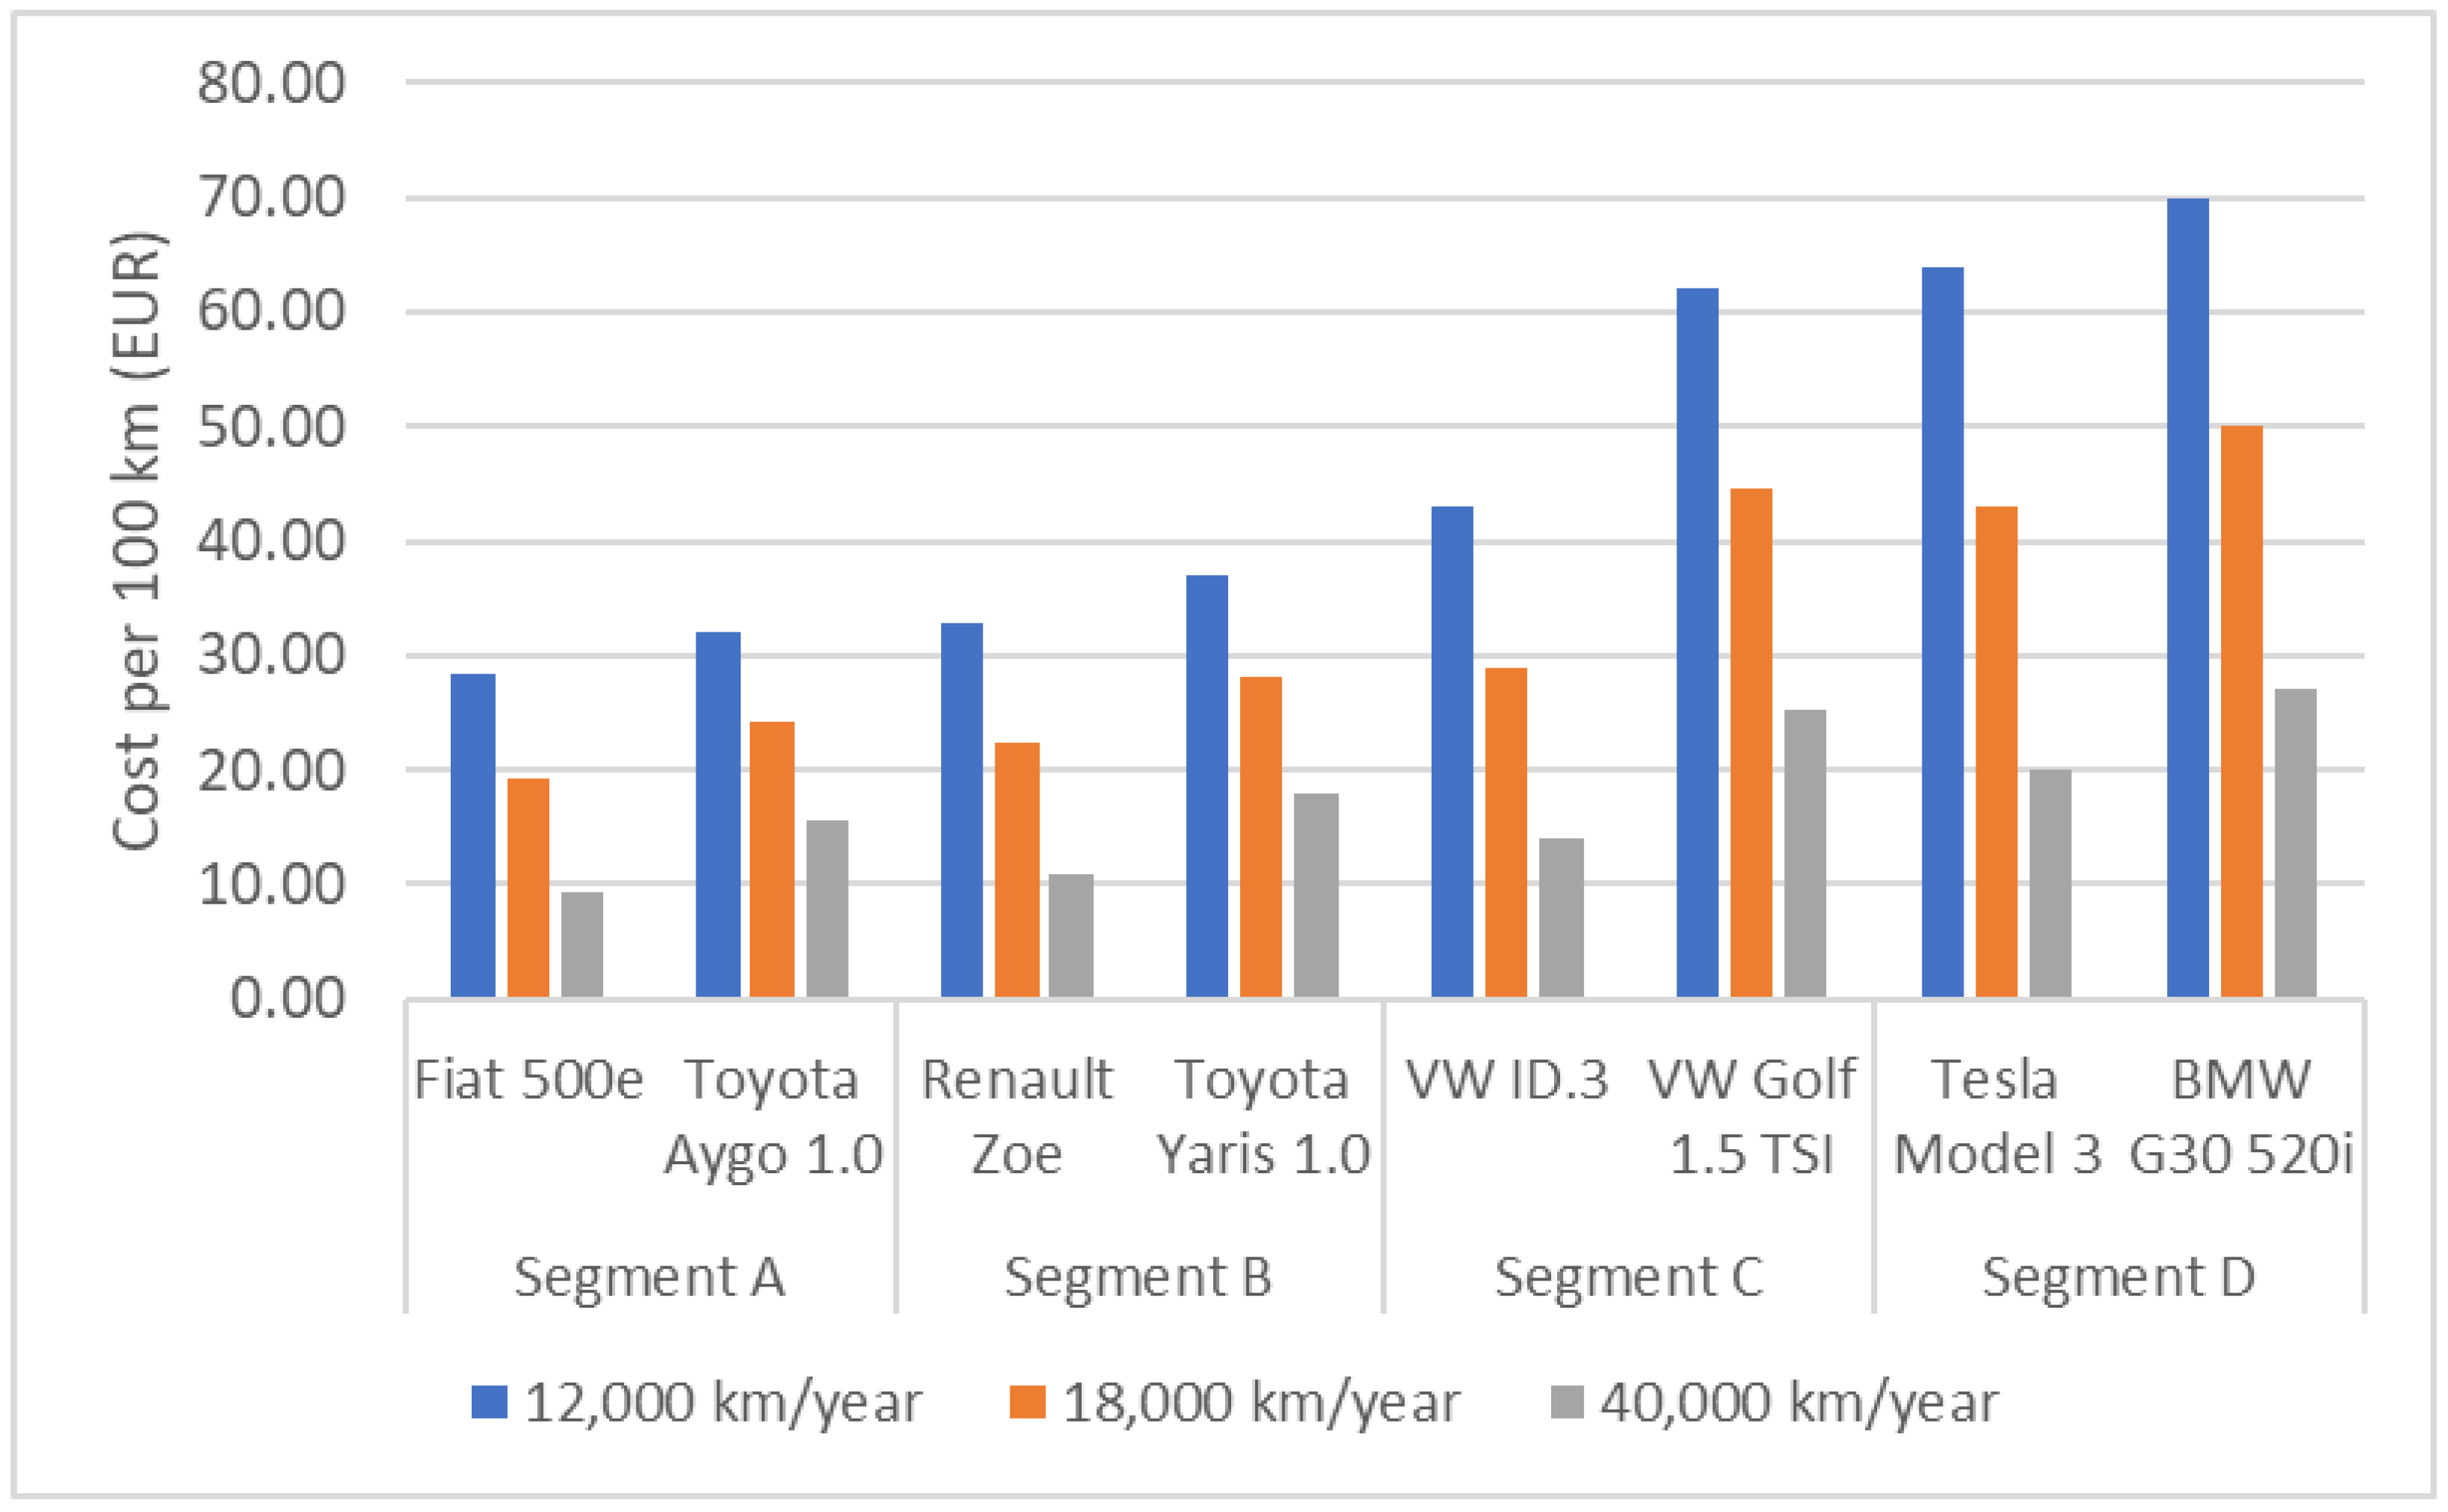
  • 2019 VW Golf 1.5 TSI
  • 2015 BMW Series 5
  • New Toyota Yaris 1.0
The following PHEV cars can be purchased:
  • 2016 Mitsubishi Outlander PHEV
  • 2016 BMW i3
  • 2016 VW Golf GTE PHEV
The following BEV cars can be purchased:
  • 2018 Nissan Leaf
  • 2017 e-Golf
  • 2019 Renault Zoe
  • 2019 Fiat 500e
Volkswagen Golf models were the most suitable to study the vehicles in the same category in more detail since we were able to examine versions of the same manufacturer and the same model with different powers. Looking at the three different powers together, an almost completely linear trend was obtained in terms of the average price per manufacturing year of the model. The trend line fitted to the chart clearly shows how well the average prices of each country fit (Figure 6). Basically, it can be stated that out of the three different powers, the ICEV version (1.5 TSI) is the cheapest for Golf. Considering the prices of new cars, the average price of the ICEV version is about 28,000 euros, the PHEV is about 39,000 euros, and the BEV is 45,000 euros. Thus, a 1.6-fold price difference can be detected between BEV and ICEV models in the same category. At the same time, one of our hypotheses was that with used, older models, the difference between the different powers would be significantly smaller. If we look at the 2016 model for all three powers (because, as mentioned, if Austria is excluded from the study, people in the remaining countries can buy the 2016 model), the Golf TSI costs 14,000 euros, the e-Golf 17,000 euros, and the Golf GTE (PHEV) 19,000 euros. Therefore, the price difference between BEV and ICEV is only 1.2 times. Thus, our hypothesis that the difference in purchase price between used BEVs and ICEV models is significantly smaller is confirmed.
Highlighting the example of a country, a comparison of the prices of the same model with three different power chains was made from Hungarian data (Figure 7). This clearly confirms that the price of a new petrol Golf can only be enough to buy a 2019 electric or a 2018 hybrid model, making the decision of customers to make cleaner driving more widespread difficult.

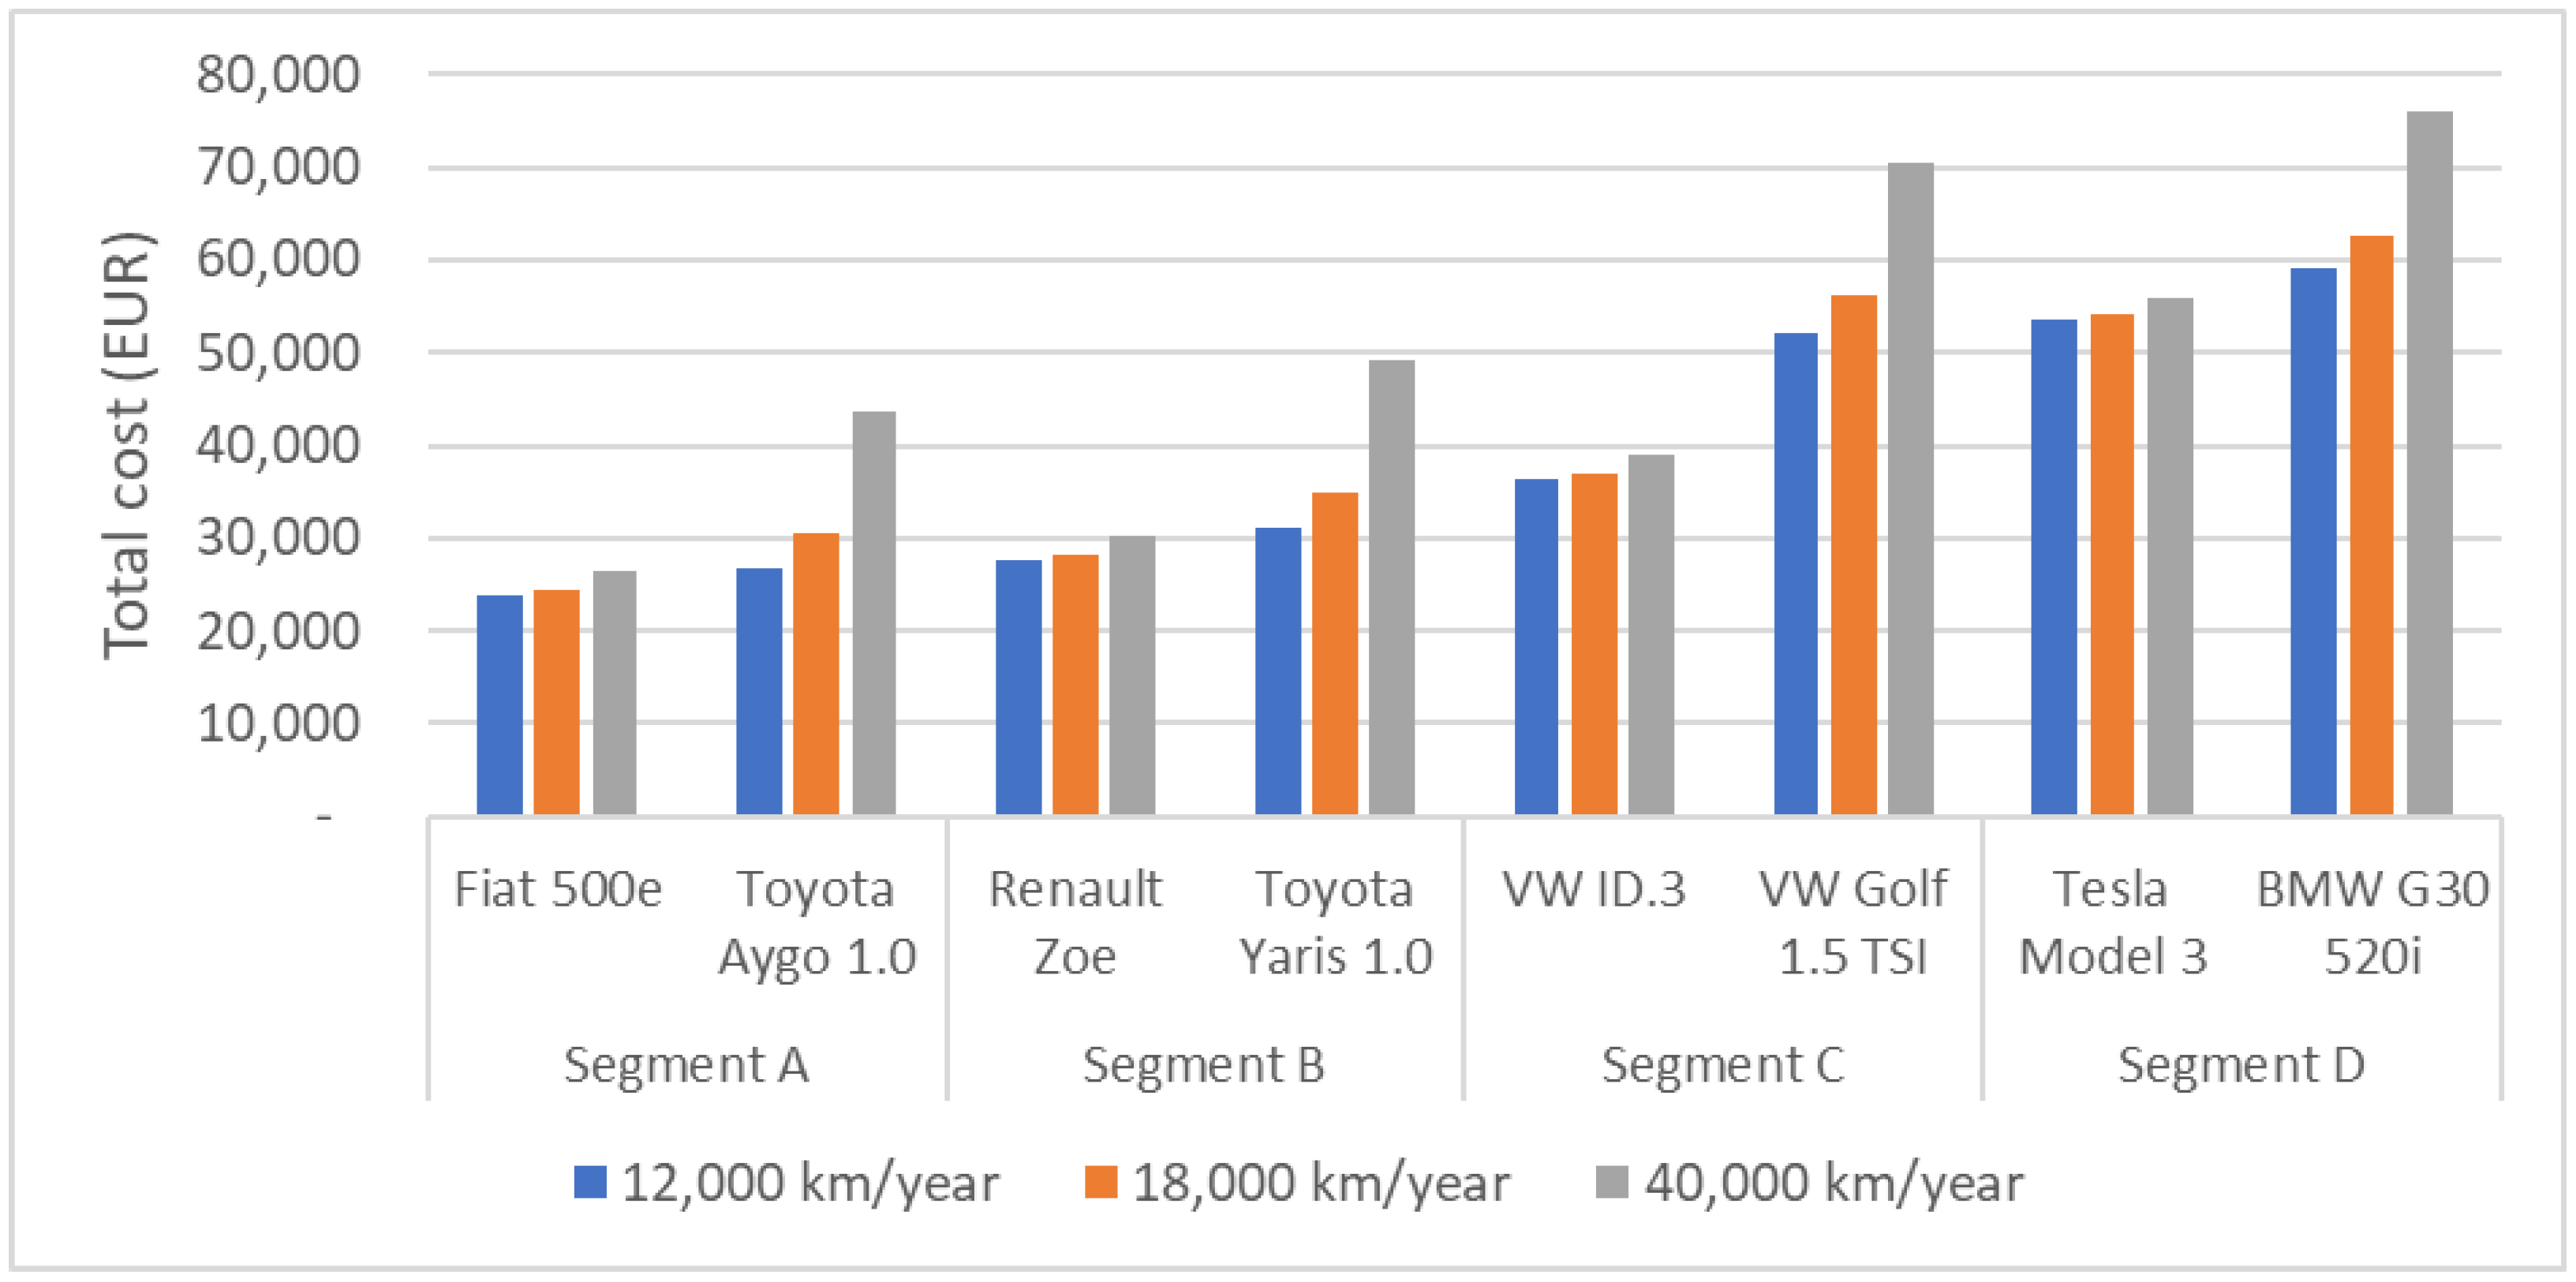
4.4. Operational Costs: Comparison between ICEV and BEV

In the spread of electromobility, the individual decisions of users, as well as the criteria and motivations determining the decision, can be considered extremely important [4,199]. We believe that in addition to environmental awareness, specific usage benefits (e.g., parking discounts, access permits, etc.), and the need to comply with social and legal norms, the cost of the decision can be considered decisive [200,201]. The research of Bjerkan et al. conducted in Norway suggests that individual decisions have mostly economic implications; e.g., Norwegian tax incentives greatly help the spread of EVs [202]. In the case of a cost-benefit analysis, it is practical to take the EV’s entire life cycle as a basis and compare it to the values of the internal combustion vehicle corresponding to the vehicle category in question. In order to be able to analyse the issue in a more representative way, a seven-year operation time was used to compare the parameters of EVs and ICEVs in four vehicle segments, in line with the EAFO methodology.
A representative EV and ICEV model was compared in each passenger car segment (Figure 8). Our calculation baselines are based on data for Hungary. Based on the results of the EAFO calculator [147], the total cost of ownership (TCO) over seven years was determined. To extract the data required for the calculations, the vehicle comparison module (opportunity cost and CO2 emissions of passenger cars) of the EAFO platform was applied at three levels of use intensity (12,000 km, 18,000 km, and 40,000 km), which cover well the different categories of use. The annual mileage of 12,000 km is a good representation of the car usage of an average user in Hungary. Urban agglomeration commuting for work purposes is of special importance, where a monthly mileage of 1500 km, i.e., 18,000 km per year, is obtained by covering 70 km per day and counting on 21.5 working days adapted to Hungarian conditions. Finally, for modelling-intensive use, the maximum allowed by the EAFO calculator, i.e., 40,000 km, was taken into account.
As expected, EVs proved to be more cost-effective than their direct competitors in all four segments studied, even at the lowest mileage (Figure 8). For seven years of use, this means a cost difference of about 3000–16,000 euros. Somewhat surprisingly, segment C registered the maximum, but even in the case of the high-end Tesla, the cost margin is larger in absolute terms than between segments A and B. As the mileage increases, the efficiency of EVs increases further compared to their competitors, with the VW ID3 reaching its maximum at 40,000 km (>31,000 euros), while the difference between other segments is reduced to a negligible level of 17,000–20,000 euros (i.e., a 3000 euro difference).
Figure 9 illustrates the total cost of ownership of 100 km in relation to a full seven-year cycle, considering different mileage levels. EV is again the most economical way to move, with cost developments showing a linear decline. Based on the results of the EAFO calculator [147], the scale ranges from 18–64 euros for 12,000 km, 19–43 euros for 18,000 km, and finally, 920 euros for the maximum of 40,000 km. In all cases, EVs in the cheaper segments proved to be more cost-effective compared to each other.
Finally, in terms of purchase price depreciation (Table 2), the VW ID3 proved to be the most advantageous. Based on the intense mileage of 40,000 km, the savings compared to the direct competitor, the VW Golf, can amount to 79% of the purchase price. Using the results of the EAFO calculator [147], even for the average mileage in Hungary, EVs are able to amortise 10–40% of their purchase price over seven years due to their relative cost-effectiveness. The calculation was based on cost items related to Hungary, and accordingly, the government subsidy for EVs, which is 6500 euros for Fiat 500e and Renault Zoe, 4000 euros for VW ID3, and no support for Tesla in segment D, was taken into account. It can, therefore, be stated that, at the level of current technology and market conditions, EVs are not only an environmentally friendly solution in the medium term but also a clearly sensible economic decision.
Based on the results, the eight countries involved in the study, except for Austria, are on a different track than the developed Western European countries regarding the penetration of EVs, where this topic receives much greater attention in both public life and scientific research. There are, however, significant differences among the analysed countries regarding both the specific share of BEVs and the charging infrastructure. These can be explained by different government incentives and differences between real salaries based on the available data. Still, it is important to reveal the processes characteristic of the analysed region since, to achieve the climate neutrality objective of the EU, a reform in road traffic will be inevitable in all countries. Results may cause some optimism since a strong development can be detected in the case of several countries (compared to their own numbers) regarding the number of registered BEVs and operating charging stations since 2018. Furthermore, a cost-effectiveness analysis based on Hungarian data has shown that EVs can be a more economical alternative to ICE in the Central European region, even in the medium term (7 years), provided that government incentives are available. We consider the research to fill a gap in the sense that few scientific studies have been published on the region so far, but we hope that in the future other scientific schools will also study the factors (socio-geographical, economic, etc.) that determine the spread of electromobility in Central Europe.

4.5. Environmental Aspects of the Spread of Electric Passenger Cars

In addition to economic aspects, one of the most important reasons for the spread of electromobility is undoubtedly that the spread of electric vehicles can also play an important role in achieving climate protection goals and significantly reducing greenhouse gas emissions.
Globally, transport, including road transport, is responsible for a significant share of anthropogenic greenhouse gas emissions. The transport sector accounted for 20.2% of total emissions in 2020 [203,204]. The transport sector accounted for 28.5% of total EU greenhouse gas emissions in 2019, of which road transport accounted for 20.5% [203]. According to data from the International Energy Agency (IEA), in 2021 the emission of nearly 7.7 Gt of CO2 can be attributed to the transport sector globally, of which road transport is responsible for about 5.8 Gt of CO2 [203]; moreover, emissions increased by 38% after the turn of the millennium until 2021. There was a temporary decrease only during the COVID-19 pandemic (0.6 Gt in 2020), but after the lifting of restrictions, an upward trend can be observed again.
According to data from the European Environmental Agency (EEA), CO2 emissions from new passenger cars registered in Europe decreased by 22 g/km between 2010 and 2016, followed by an increase of 2.8 g/km in 2017–2018, with an additional 1.6 g/km in 2019, which can be explained by the proliferation of SUVs [205]. Global greenhouse gas emissions from passenger cars peaked at 3.2 Gt in 2019 and fell to 3 Gt CO2 in 2020 [206], as shown in Figure 10. The importance of transport in reducing GHG emissions is underlined by EEA data, which show that transport’s share of GHG emissions increased from 14.8% in 1990 to 24.6% in 2018 [207].
In order to combat climate change, policymakers have introduced mandatory regulations in many areas. The Paris Agreement (2015), which follows the Kyoto Protocol, contains a comprehensive climate protection package, including GHG emission reduction measures. In the case of transport, the agreement aims to reduce GHG emissions by 60% by 2050 compared to 1990 levels, allowing EVs to achieve a total GHG emission of 95 g CO2/km [208,209]. Following the gradual tightening of gas emission standards in road transport (e.g., EURO 1–6) [210], the latest development is that the registration of an internal combustion engine motor vehicle will be prohibited in the EU from 2035 onwards as part of the Fit for 55 Package [211].
This will clearly put electromobility in a position to accelerate the transition to more sustainable transport. While it is debatable to what extent EVs can be considered climate-friendly across their entire life cycle, it is accepted as a fact that they have no GHG emission during transport [212]. Taking into account that a significant proportion of the population of developed countries lives in urban and metropolitan areas, where transport is primarily responsible for the deterioration of air quality, and that urbanisation is also characteristic of developing countries, the rise of EVs can be seen as an aspect that improves the quality of life.

4.6. Comparison of the Indirect and Direct CO2 Emission of EVs and ICVs

4.6.1. Greenhouse Gas Emission of Electricity Production Required for Operating EVs

In countries where fossil fuels account for a significant share of the energy mix, meeting the electricity demand of battery charges related to the daily use of EVs can lead to significant indirect CO2 and other air pollutant emissions [12,16,158,160,213,214,215,216]. For example, Polish researchers have found that based on a daily driving cycle of 26 km, the indirect CO2 emission of an EV ranges from 2.48 to 3.28 kg CO2/day, while an ICV emits 2.55–5.64 kg CO2/day for the same driving cycle, depending on the type and engine [213].
It was also examined how the annual mileage of 3000, 7500, and 15,000 km of petrol and electric versions of a given passenger car and the different modes of electricity generation (purely coal, purely renewable, or their combination) affected direct and indirect CO2 emissions over a 15-year operating period. According to the results, if electricity is generated at least partly from renewables and above 3000 km of annual mileage, indirect emissions of EVs are lower, while in other cases, ICV proved to be greener [217].
A study conducted for China in 2022 showed that an EV, during its life cycle and GHG emissions, consumes 40.1% less fossil energy and emits 26.6% less GHG than an ICV during its life cycle. If ICVs are replaced by EVs in China between 2040 and 2060, this could result in reductions in fossil fuel consumption and GHG emissions of 43.61–55.81% and 46.33–55.45%, respectively [218].
An analysis for the US state of Maine showed that switching the passenger car fleet there from ICV to EV would result in a 15% reduction in CO2 emissions, which is still far from the state’s target of a 45% reduction by 2030 and 80% by 2050. Therefore, increasing the share of renewables in electricity generation is essential to meet climate protection objectives [219]. Another important finding of the study is that if the number of EVs in the state increased significantly, while the role of coal in electricity generation did not decrease compared to renewables, it would even increase CO2 emissions. They found that the share of fossil fuels in electricity generation to reach the 2030 targets could be a maximum of 61%, while the 2050 target could be achieved with a maximum fossil share of 18% [219].
This is consistent with the results of Gryparis et al., who assessed the relationship between EV spread and GHG emission change for the EU. They found that EV proliferation needs to be paired with decarbonizing power generation to achieve really positive outcomes [220].
Among vehicle categories, SUVs are responsible for the highest emissions (5.64 kg CO2/day for petrol and 3.59 kg CO2/day for diesel) due to their higher consumption caused by their higher weight [221]. City-class electric cars also performed poorly, with emissions of 0.47 kg CO2/day, worse than diesel vehicles in the same category [215].
The electricity generation structure (power plants producing electricity) of a country determines the indirect emissions of CO2 and other air pollutants caused by EV charging [222,223]. During electricity generation in power plants, CO2 emissions are 953.91 kg CO2/MWh for lignite firing, 777.76 kg CO2/MWh for coal firing, 630.51 kg CO2/MWh for heating oil, and 384.68 kg CO2/MWh for natural gas [213]. By comparison, the use of biogas as a renewable energy source in electricity generation emits 468 kg CO2/MWh [213]. Thus, even among fossil fuels, there is a significant difference of approximately two and a half times in the level of GHG emissions in favour of natural gas compared to lignite.
Based on literature data [147], a compilation was prepared to compare the direct (in situ) CO2 emissions of EVs and ICVs produced at different mileages in different passenger car categories.
The eight vehicle types included in the study show significant variations in terms of environmental protection and GHG emissions. The advantage of EVs, in this case, BEVs, is evident, as they result in 0 CO2 emissions in situ [216]. In contrast, in the case of competing ICEVs, the amount of CO2 emissions is basically in direct proportion to the increase in the piston displacement of the combustion engine, and the size and weight of the vehicle (Table 3). The order of ICEVs in the four segments is broken only by the same value between the Toyota Yaris 1.0 and the VW Golf 1.5 TSI. The VW Golf owes its good performance to its more advanced technology (turbocharger). Based on an annual mileage of 12,000 km, the least environmentally harmful Toyota Aygo emits 9408 kg of CO2. For an intensively used D-segment vehicle, this figure can reach up to 12,600, and as the mileage increases, the gap between segments A and D also opens, reaching 10,640 kg at 40,000 km.
Considering the growing travel range during the lifetime of the vehicle, that of a single charge, and the rise of renewable energy sources [224], studies carried out in recent years increasingly show that indirect CO2 emissions from EVs in electricity generation are decreasing as EVs become more technologically advanced. The increasing share of renewables will also reduce the carbon footprint of EV manufacturing, of course. Today, in areas where renewable energy sources account for a significant share of electricity generation, the share of renewable energy sources may be less than the direct and indirect CO2 emissions of ICVs [220,225].

4.6.2. Other GHG Emissions Generated in the Life Cycle of EV

When the emissions associated with vehicle production are analysed, it can be seen that the production of vehicles (body, engine, transmission, chassis, etc.) causes air pollution roughly similar to that of EVs and ICVs in nature and degree [225]. The entire EV production chain and electricity generation should be fossil-free; otherwise, widespread deployment of EVs could even increase GHG emissions [224]. However, when manufacturing chains and power generation are largely decarbonized, EVs are indeed effective tools for GHG emission reduction [204,224].
The significant difference between the two types of vehicles is in the production of batteries: the production of EVs generates higher CO2 emissions due to the significant emissions associated with the production of batteries [207,217,225,226]. The amount of GHG released into the atmosphere during battery production is responsible for more than half of the emissions generated during the production of EVs [217]. In particular, battery anode production emits the most CO2 [208]. Lithium nickel-manganese-cobalt (NCM) and lithium-iron-phosphate batteries emit 150–200 kg CO2/kWh [225,226].

4.6.3. Comparison of Other Air Pollution and Noise Emission of EV and ICV

According to model analyses in China in 2010, where electricity generation is predominantly carbon-based, the spread of EVs could result in a three- to tenfold increase in atmospheric SO2 emissions compared to gasoline-powered passenger cars and a twofold increase in NOx emissions [216]. Later analyses found that, with China’s energy mix, the spread of EVs could reduce GHG emissions by up to 20% while increasing atmospheric PM10, PM2.5, NOx, and SO2 concentrations compared to ICVs [214].
In 2018, a model study was conducted in the United States to determine how air quality in the Houston metropolitan area might change by 2040 with varying degrees of electrification of transportation, business as usual (BAU), and electromobility scenarios of 50%, 75%, and 95% compared to 2013 [227]. According to the results, in the BAU case, an increase in the level of air pollution and the associated diseases and deaths can be expected, while in increasing electromobility scenarios, a decrease in atmospheric concentrations of O3 and PM2.5 and in the degree of related health problems can be expected to a different extent [227,228].
PM emissions from non-exhaust emissions (tyre, clutch, brake pad, and road surface wear) are highly dependent on vehicle weight [212,215,229]. For heavier vehicles, such emissions can exceed those of medium (1600 kg) or low-weight vehicles (1200 kg) by up to 50% [215]. EVs are, on average, 24% heavier than ICVs in the same category [229], so the problem is also more pronounced when they are used [212].
Some studies show that the environmental impact throughout the production chain of BEVs is higher than that of PHEVs or ICVs [224].
In urban agglomerations, in addition to poor air quality, high noise levels are a serious environmental problem. With the spread of EVs, there is hope not only for significant improvements in air quality in large cities but also for reduced noise levels as an associated benefit [230]. In urban environments, the main sources of noise are related to transport and industrial activity. Road vehicle traffic is the dominant factor in traffic noise due to the traffic mix. In the case of electric vehicles, the absence of a combustion engine means that only rolling and aerodynamic noise are taken into account when the vehicle is moving. Vehicle noise is concentrated in the frequency range from 500 to 1600 Hz, with a maximum of around 1000 Hz [231]. During different driving phases (acceleration, constant speed, slowing down), vehicles emit the majority of noise in different frequency ranges.
Based on the literature [232], the estimated reduction in sound pressure levels for EVs compared to ICVs in the speed range below 50 km/h is about 2 dB, but above 50 km/h this benefit is essentially eliminated due to the dominant contribution of rolling and wind noise [233,234].
The above confirms that with the current structure of electricity generation, where fossil fuels still dominate, the rapid spread of EVs does not clearly improve air pollution. The spread of EVs is a truly effective solution to reduce air pollution caused by transport if electricity generation is switched to renewable energy sources simultaneously or even before. This would not only help decarbonise the generation of electricity needed to charge and manufacture EVs but would also reduce other air pollutant emissions associated with the EV life cycle.
Since the effect of a quieter electric motor at higher speeds is offset by an increase in rolling and wind noise, in terms of noise reduction, progress can be expected mainly on inferior roads in residential areas and during rush hours with the widespread adoption of EVs.

5. Conclusions and Future Directions

Today, it has become clear that transport reform, including road transport, is essential to ensuring energy security and achieving sustainability objectives. Making transport ‘green’ is likely to be a lengthy process, with winners (countries that can reform their transport systems faster) and losers. In the research conducted, we primarily sought to answer the question of what form and pace the transition to electromobility is expected to take in Central Europe, which can be considered specific in several respects—historically, economically, socially, infrastructurally, and spatially—and whether the eight countries analysed will move along similar or different trajectories at all. While the results give us some cause for optimism, we shall not ignore the fact that, as very price-sensitive markets were analysed, government incentives play a key role in the spread of EVs. We also consider the poor rate of development of the infrastructure serving electromobility and, in the case of certain countries, its underdeveloped state to be a hindrance factor. Taking into account the purchasing power of the region, we consider economic aspects to be of key importance, as they fundamentally determine end-user attitudes towards EV adoption. The purchasing power of the Central and Eastern European region is significantly below the EU average. The purchasing power of countries with better indicators (Poland, Slovenia, Czech Republic) is also lower than the EU average–furthermore, only Austria can compete with the EU average among the countries examined.
Prices of ICEVs have risen significantly over the past few years, and the purchasing power has deteriorated. At the same time, the price gap between electric and internal combustion engine passenger cars of similar categories seems to be narrowing.
Despite the fact that average car prices in Hungary are higher than in other countries and that Hungary is lagging behind the studied Central and Eastern European countries in terms of purchasing power, the spread of electric cars ranks first both at population-proportional and vehicle-proportional levels. Its further spread is also supported by energy policy measures (expansion of power generation capacities, network development, battery plants, and electric car factories). At the same time, Austria outperforms the European average in terms of EV spread. Apart from Slovenia and Hungary, the entire Central and Eastern European region is lagging sharply in this respect, which can also be worrying from both environmental and import substitution points of view.
Calculations based on the EAFO database indicated that despite higher purchase prices for seven years of car use (taking into account Hungarian energy prices and costs), the “total cost” of BEVs is lower than that of ICEVs in each of the four segments examined. As a result, if long-term decisions are made when buying a car, it is better to buy a BEV from an economic point of view. Ultimately, individual decisions are expected to be driven by this. In addition, due to the reduction of local emissions, cities will clearly be more liveable if BEVs become widespread. Globally, this is no longer certain, and it is significantly influenced by how electricity is generated, the weight of the vehicle, and the type of model.
Due to the weak purchasing power, buying new cars is not the main reality in these countries; rather, the appearance of vehicles that are a few years old and imported from the Western market is more likely in the region.
This, by all means, makes the diffusion of electromobility slower, as BEVs/EVs are still clearly underrepresented in the used car market. There are differences between second-hand car markets in different countries. In the case of the Czech Republic, the Volkswagen Group’s share of the total market is particularly high (obviously, this is due to Skoda). In the case of Poland, the share of LPG-powered vehicles stands out; the market for LPG cars is oversaturated. Unlike in other countries, petrol-only cars were very few among the studied types. The price of all cars in Poland is significantly lower than in any of the countries studied, and the Polish market is obviously much cheaper than the average of these. At the same time, looking at the region as a whole, the average prices for each year do not differ much.
Based on the data provided by the Hungarian Statistical Office, it is clear that in Hungary (similarly to the other countries in Group B), due to lower purchasing power, the spread of new cars is slower than the EU average for any type of power. Based on the data examined, it can be seen that despite the above, there is an overwhelming investment in motorization in the region, regardless of the power, and the number of cars shows a continuous increase. It is interesting to note that although Hungary is in the bottom position in terms of purchasing power, it is nevertheless in a particularly advantageous position compared to other countries in the region regarding the vehicle- and population-proportional spread of BEVs.
The pace of electric car spread Is greatly influenced by the economic and financial situation of consumers, together with government incentives. This is exponentially true in the region studied, where the purchasing power of the population is significantly lower than in Western countries. In the long term, even taking into account higher purchasing prices, the use of electric cars is a significant advantage from an economic point of view since lower maintenance costs and fuel prices (especially with increased use) make EVs more cost-effective overall. The question arises, however, whether EVs that are more economical in the medium term can be a realistic alternative if their purchase price is too high for potential buyers. The data on the analysed vehicle fleet suggests that, unfortunately, this is not the typical scenario. That is why government incentives are critical. It is most likely that the favourable Hungarian figures in the region can be attributed to the incentives applied over the years (6500 euros for segments A and B and 4000 euros for segment C).
Since the spread of charging infrastructure is also an important cornerstone of the diffusion of electromobility, the spread of EVs proportional to the population and the number of BEVs per charging point were studied together. It can be stated that at the moment the supply of charging stations is clearly underdeveloped compared to the fleet of EVs, which is not surprising given that the charging network is expanding mainly through investments by profit-oriented market players.
Overall, it can be stated that in Central Europe, the penetration of EVs can be observed, which is characterised by a slow but at the same time developing trend, while the ecosystem of electromobility shows underdevelopment compared to the number of EVs. Therefore, the breakthrough in electromobility is yet to come in this region, the studied countries, except for Austria, lag behind the EU average.
Reviewing the results of studies analysing the environmental impact of EV spread, it can be concluded that while analyses based on the situation before 2018 generally find that the spread of EVs can even increase the carbon footprint of transport if fossil fuels dominate electricity generation, studies conducted in the last five years generally conclude that the electrification of transport improves the environmental situation in the world and in Europe, which is fully in line with the results obtained for the Central and Eastern European region studied in this paper.
This is basically due to the fact that the rapid development of EV technology has resulted in a decrease in the amount of electricity required to cover 1 km, and the share of renewable energy sources in electricity generation is growing dynamically.
Based on the above, the spread of EVs actually reduces the in situ environmental load in cities. However, in an economic environment with a high share of fossil fuels in electricity generation, it does not improve the emission situation. In this case, the result will only be that air pollution does not occur in urban environments.
Based on this, it is crucial that power generation is decarbonised in parallel with the spread of EVs, ideally even before.
In the Central and Eastern European regions examined in this study, used electric cars are expected to play an important role due to the smaller purchasing power of the population; therefore, it is necessary to develop a method capable of modelling the spread of used electric cars at the national level. The overall purchasing power available in each country resulting from their environmental commitments at the state level may show the volume of the future used electric car market.
As the studied region lags behind the EU average, it is, therefore, necessary to establish economic policy measures to encourage the spread of these vehicles in the region.
Since there are very few literature sources on the spread of EVs in the CEE countries covered in this study, and these countries (with the exception of Austria) have a low share of EVs (both as a proportion of population and vehicles) and low average income in the EU, it seems appropriate to explore in detail the socio-geographical aspects and individual motivations determining the adoption of EVs, as well as the differences at the level of individual countries.
In addition, government measures, including financial and other types of central incentives, that can deliver the best results for the expansion of electromobility should be modelled, given that these are very price-sensitive markets.
Targeted surveys can be used to assess the level of awareness of potential customers about EVs and the extent to which credible, objective information provision (which is currently not provided), including technical and total cost of ownership aspects, can stimulate future EV spread.
The data revealed suggest that EVs are more popular in urban environments in the geographical area studied, but exploring the spatial and even national distribution of electromobility requires targeted research.
In the future, it is advisable to examine how much an electric car costs in the long run compared to several countries (purchase price, maintenance cost, depreciation, fuel price, etc.) and to define the different customer segments. Comparing this with the purchasing power of the given country (the easiest way to use the average salary), a more complex picture can be obtained of a country’s economic performance and opportunities in terms of purchasing EVs.
From an environmental point of view, an important area of future research could be the decarbonisation of power generation, a deeper analysis of the correlations between trends in car production (battery development), and the reduction of GHG emissions from EVs.

Author Contributions

Conceptualization, G.H., S.S., M.Z. and T.T.; Writing original draft, G.H., A.B., S.S., I.L., C.M., L.H., M.Z., Z.G. and T.T.; Review and editing, S.S. and T.T.; Supervision, A.B.; funding acquisition, A.B. All authors have read and agreed to the published version of the manuscript.

Funding

The research of Attila Bai and Zoltán Gabnai was funded by the National Research, Development, and Innovation Fund of Hungary, project no. TKP2021-NKTA-32, financed under the TKP2021-NKTA funding scheme, and by the bilateral scientific collaboration agreement 2019-2.1.13-TÉT_IN-2020-00061.

Data Availability Statement

All the data is available within this manuscript.

Conflicts of Interest

The authors declare no conflict of interest.

Abbreviations

ICEVInternal Combustion Engine Vehicle
ICEInternal Combustion Engine
EVElectric Vehicle
BEVBattery Electric Vehicle
PEVPlug-in Electric Vehicle
HEVHybrid Electric Vehicle
PHEVPlug-in Hybrid Electric Vehicle
EUEuropean Union
GHGGreenhouse gas
EAFOEuropean Alternative Fuels Observatory
LPGLiquefied Petroleum Gas
EoLEnd of Life
CEECentral and Eastern Europe
TCOTotal Cost of Ownership
V2GVehicle-To-Grid
EEAEuropean Environmental Agency
ACEAEuropean Automobile Manufacturers’ Association
NCMLithium Nickel-Manganese-Cobalt
BAUBusiness As Usual

References

  1. Dollinger, M.; Fischerauer, G. Physics-Based Prediction for the Consumption and Emissions of Passenger Vehicles and Light Trucks up to 2050. Energies 2023, 16, 3591. [Google Scholar] [CrossRef]
  2. Kampker, A.; Heimes, H.H.; Offermanns, C.; Frieges, M.H.; Graaf, M.; Soldan Cattani, N.; Späth, B. Cost-Benefit Analysis of Downstream Applications for Retired Electric Vehicle Batteries. World Electr. Veh. J. 2023, 14, 110. [Google Scholar] [CrossRef]
  3. Maurer, F.; Rieke, C.; Schemm, R.; Stollenwerk, D. Analysis of an Urban Grid with High Photovoltaic and e-Mobility Penetration. Energies 2023, 16, 3380. [Google Scholar] [CrossRef]
  4. Ogunkunbi, G.A.; Meszaros, F. Investigating the Role of Urban Vehicle Access Regulations as a Policy Tool for Promoting Electric Mobility in Budapest. Urban Sci. 2023, 7, 39. [Google Scholar] [CrossRef]
  5. EAFO European Alternative Fuels Observatory. Available online: https://alternative-fuels-observatory.ec.europa.eu/transport-mode/road (accessed on 19 February 2023).
  6. Razmjoo, A.; Ghazanfari, A.; Jahangiri, M.; Franklin, E.; Denai, M.; Marzband, M.; Astiaso Garcia, D.; Maheri, A. A Comprehensive Study on the Expansion of Electric Vehicles in Europe. Appl. Sci. 2022, 12, 11656. [Google Scholar] [CrossRef]
  7. Hildermeier, J.; Burger, J.; Jahn, A.; Rosenow, J. A Review of Tariffs and Services for Smart Charging of Electric Vehicles in Europe. Energies 2023, 16, 88. [Google Scholar] [CrossRef]
  8. Feckova Skrabulakova, E.; Ivanova, M.; Rosova, A.; Gresova, E.; Sofranko, M.; Ferencz, V. On Electromobility Development and the Calculation of the Infrastructural Country Electromobility Coefficient. Processes 2021, 9, 222. [Google Scholar] [CrossRef]
  9. Brdulak, A.; Chaberek, G.; Jagodziński, J. BASS Model Analyssis in “Crossing the Chasm” in E-Cars Innovation Diffusion Scenarios. Energies 2021, 14, 3216. [Google Scholar] [CrossRef]
  10. Giechaskiel, B.; Lähde, T.; Clairotte, M.; Suarez-Bertoa, R.; Valverde, V.; Melas, A.D.; Selleri, T.; Bonnel, P. Emissions of Euro 6 Mono- and Bi-Fuel Gas Vehicles. Catalysts 2022, 12, 651. [Google Scholar] [CrossRef]
  11. Mądziel, M. Liquified Petroleum Gas-Fuelled Vehicle CO2 Emission Modelling Based on Portable Emission Measurement System, On-Board Diagnostics Data, and Gradient-Boosting Machine Learning. Energies 2023, 16, 2754. [Google Scholar] [CrossRef]
  12. Zimakowska-Laskowska, M.; Laskowski, P.; Wojs, M.K.; Orliński, P. Prediction of Pollutant Emissions in Various Cases in Road Transport. Appl. Sci. 2022, 12, 11975. [Google Scholar] [CrossRef]
  13. Fabiś, P.; Flekiewicz, M. The Influence of LPG and DME Mixtures on Passenger Car Performance. Energies 2022, 15, 7144. [Google Scholar] [CrossRef]
  14. Golab, A.; Zwickl-Bernhard, S.; Auer, H. Minimum-Cost Fast-Charging Infrastructure Planning for Electric Vehicles along the Austrian High-Level Road Network. Energies 2022, 15, 2147. [Google Scholar] [CrossRef]
  15. Loschan, C.; Schwabeneder, D.; Lettner, G.; Auer, H. Flexibility potential of aggregated electric vehicle fleets to reduce transmission congestions and redispatch needs: A case study in Austria. Int. J. Electr. Power Energy Syst. 2023, 146, 108802. [Google Scholar] [CrossRef]
  16. Kulmer, V.; Seebauer, S.; Hinterreither, H.; Kortschak, D.; Theurl, M.; Haas, W. Transforming the s-shape: Identifying and explaining turning points in market diffusion curves of low-carbon technologies in Austria. Res. Policy 2021, 51, 104371. [Google Scholar] [CrossRef]
  17. European Environment Agency. New Registrations of Electric Vehicles in Europe. Available online: https://www.eea.europa.eu/data-and-maps/indicators/proportion-of-vehicle-fleet-meeting-5/assessment (accessed on 27 December 2021).
  18. Lauvergne, R.; Perez, Y.; Françon, M.; Tejeda De La Cruz, A. Integration of electric vehicles into transmission grids: A case study on generation adequacy in Europe in 2040. Appl. Energy 2022, 326, 120030. [Google Scholar] [CrossRef]
  19. Mangipinto, A.; Lombardi, F.; Sanvito, D.F.; Pavičević, M.; Quoilin, S.; Colombo, E. Impact of mass-scale deployment of electric vehicles and benefits of smart charging across all European countries. Appl. Energy 2022, 312, 118676. [Google Scholar] [CrossRef]
  20. Koengkan, M.; Fuinhas, J.A.; Belucio, M.; Alavijeh, N.K.; Salehnia, N.; Machado, D.; Silva, V.; Dehdar, F. The Impact of Battery-Electric Vehicles on Energy Consumption: A Macroeconomic Evidence from 29 European Countries. World Electr. Veh. J. 2022, 13, 36. [Google Scholar] [CrossRef]
  21. EAFO European Alternative Fuels Observatory. 2022. Available online: https://alternative-fuels-observatory.ec.europa.eu/consumer-portal/fuel-price-comparison (accessed on 19 February 2023).
  22. Neves, S.A.; Marques, A.C.; Fuinhas, J.A. Technological progress and other factors behind the adoption of electric vehicles: Empirical evidence for EU countries. Res. Transp. Econ. 2019, 74, 28–39. [Google Scholar] [CrossRef]
  23. Tucki, K.; Orynycz, O. Bioenergy and Biofuels. Sustainability 2021, 13, 9972. [Google Scholar] [CrossRef]
  24. Tucki, K.; Orynycz, O.; Mitoraj-Wojtanek, M. Perspectives for Mitigation of CO2 Emission due to Development of Electromobility in Several Countries. Energies 2020, 13, 4127. [Google Scholar] [CrossRef]
  25. Tucki, K.; Orynycz, O.; Dudziak, A. The Impact of the Available Infrastructure on the Electric Vehicle Market in Poland and in EU Countries. Int. J. Environ. Res. Public Health 2022, 19, 16783. [Google Scholar] [CrossRef]
  26. Ioan, B.; Mozi, R.M.; Lucian, G.; Gheorghe, F.; Horia, T.; Ioan, B.; Mircea-Iosif, R. An Empirical Investigation on Determinants of Sustainable Economic Growth. Lessons from Central and Eastern European Countries. J. Risk Financ. Manag. 2020, 13, 146. [Google Scholar] [CrossRef]
  27. Popescu, G. FDI and Economic Growth in Central and Eastern Europe. Sustainability 2014, 6, 8149–8163. [Google Scholar] [CrossRef] [Green Version]
  28. Faragó, P.; Gálos, K.; Fekete, D. Elements of Divergence in Urbanization between Central and Eastern Europe (CEE) and the Core of the Continent. Sustainability 2022, 14, 12377. [Google Scholar] [CrossRef]
  29. Lafuente, J.Á.; Marco, A.; Monfort, M.; Ordóñez, J. Social Exclusion and Convergence in the EU: An Assessment of the Europe 2020 Strategy. Sustainability 2020, 12, 1843. [Google Scholar] [CrossRef] [Green Version]
  30. Pellényi, G.M. The Role of Central & Eastern Europe in Global Value Chains: Evidence from Occupation—Level Employment Data. Eur. Comm. Econ. Br. 2020, 62, 1–20. [Google Scholar]
  31. Astrov, V.; Holzner, M.; Leitner, S.; Mara, I.; Podkaminer, L.; Rezai, A. Wage Developments in the Central and Eastern European EU Member States; The Vienna Institute for International Economic Studies: Wien, Austria, 2019; pp. 1–68. [Google Scholar]
  32. Raszkowski, A.; Bartniczak, B. Sustainable Development in the Central and Eastern European Countries (CEECs): Challenges and Opportunities. Sustainability 2019, 11, 1180. [Google Scholar] [CrossRef] [Green Version]
  33. ACEA. Passenger Car Registrations: −13.7% Five Months into 2022; −11.2% in May. Available online: https://www.acea.auto/pc-registrations/passenger-car-registrations-13-7-five-months-into-2022-11-2-in-may/ (accessed on 13 February 2023).
  34. Li, W.; Long, R.; Chen, H.; Geng, J. A review of factors influencing consumer intentions to adopt battery electric vehicles. Renew. Sustain. Energy Rev. 2017, 78, 318–328. [Google Scholar] [CrossRef]
  35. Dutta, B.; Hwang, H.-G. Consumers Purchase Intentions of Green Electric Vehicles: The Influence of Consumers Technological and Environmental Considerations. Sustainability 2021, 13, 12025. [Google Scholar] [CrossRef]
  36. Breetz, H.L.; Salon, D. Do electric vehicles need subsidies? Ownership costs for conventional, hybrid, and electric vehicles in 14 U.S. cities. Energy Policy 2018, 120, 238–249. [Google Scholar] [CrossRef]
  37. Fluchs, S. The diffusion of electric mobility in the European Union and beyond. Transp. Res. Part D Transp. Environ. 2020, 86, 102462. [Google Scholar] [CrossRef]
  38. Bubeck, S.; Tomaschek, J.; Fahl, U. Perspectives of electric mobility: Total cost of ownership of electric vehicles in Germany. Transp. Policy 2016, 50, 63–77. [Google Scholar] [CrossRef]
  39. Danielis, R.; Giansoldati, M.; Rotaris, L. A probabilistic total cost of ownership model to evaluate the current and future prospects of electric cars uptake in Italy. Energy Policy 2018, 119, 268–281. [Google Scholar] [CrossRef]
  40. Palmer, K.; Tate, E.J.; Wadud, Z.; Nellthorp, J. Total cost of ownership and market share for hybrid and electric vehicles in the UK, US and Japan. Appl. Energy 2018, 209, 108–119. [Google Scholar] [CrossRef]
  41. Adepetu, A.; Keshav, S. The relative importance of price and driving range on electric vehicle adoption: Los Angeles case study. Transportation 2017, 44, 353–373. [Google Scholar] [CrossRef]
  42. Hardman, S.; Chandan, A.; Tal, G.; Turrentine, T. The effectiveness of financial purchase incentives for battery electric vehicles—A review of the evidence. Renew. Sustain. Energy Rev. 2017, 80, 1100–1111. [Google Scholar] [CrossRef]
  43. Christidis, P.; Focas, C. Factors Affecting the Uptake of Hybrid and Electric Vehicles in the European Union. Energies 2019, 12, 3414. [Google Scholar] [CrossRef] [Green Version]
  44. Cecere, G.; Corrocherc, N.; Guerzoni, M. Price or performance? A probabilistic choice analysis of the intention to buy electric vehicles in European countries. Energy Policy 2018, 118, 19–32. [Google Scholar] [CrossRef] [Green Version]
  45. Ali, I.; Naushad, M. A Study to Investigate What Tempts Consumers to Adopt Electric Vehicles. World Electr. Veh. J. 2022, 13, 26. [Google Scholar] [CrossRef]
  46. Habich-Sobiegalla, S.; Kostka, G.; Anzinger, N. Electric vehicle purchase intentions of Chinese, Russian and Brazilian citizens: An international comparative study. J. Clean. Prod. 2018, 205, 188–200. [Google Scholar] [CrossRef]
  47. Tu, J.-C.; Yang, C. Key Factors Influencing Consumers’ Purchase of Electric Vehicles. Sustainability 2019, 11, 3863. [Google Scholar] [CrossRef] [Green Version]
  48. Franzò, S.; Nasca, A.; Chiesa, V. Factors affecting cost competitiveness of electric vehicles against alternative powertrains: A total cost of ownership-based assessment in the Italian market. J. Clean. Prod. 2022, 363, 132559. [Google Scholar] [CrossRef]
  49. Park, E.; Lim, J.; Cho, Y. Understanding the Emergence and Social Acceptance of Electric Vehicles as Next-Generation Models for the Automobile Industry. Sustainability 2018, 10, 662. [Google Scholar] [CrossRef] [Green Version]
  50. Hardman, S.; Tal, G. Exploring the Decision to Adopt a High-End Battery Electric Vehicle: Role of Financial and Nonfinancial Motivations. Transp. Res. Rec. 2016, 2572, 20–27. [Google Scholar] [CrossRef]
  51. Graham, J.D.; Brungard, E. Consumer Adoption of Plug-In Electric Vehicles in Selected Countries. Future Transp. 2021, 1, 303–325. [Google Scholar] [CrossRef]
  52. Silvia, C.; Krause, R.M. Assessing the impact of policy interventions on the adoption of plug-in electric vehicles: An agent-based model. Energy Policy 2016, 96, 105–118. [Google Scholar] [CrossRef]
  53. Wu, G.; Inderbitzin, A.; Bening, C.R. Total cost of ownership of electric vehicles compared to conventional vehicles: A probabilistic analysis and projection across market segments. Energy Policy 2015, 80, 196–214. [Google Scholar] [CrossRef]
  54. Ouyang, D.; Zhou, S.; Ou, X. The total cost of electric vehicle ownership: A consumer-oriented study of China’s post-subsidy era. Energy Policy 2021, 149, 112023. [Google Scholar] [CrossRef]
  55. Liu, Z.; Song, J.; Kubal, J.; Susarla, N.; Knehr, K.W.; Islam, E.S.; Nelson, P.K.; Ahmed, S. Comparing total cost of ownership of battery electric vehicles and internal combustion engine vehicles. Energy Policy 2021, 158, 112564. [Google Scholar] [CrossRef]
  56. Dumortier, J.; Siddiki, S.; Carley, S.; Cisney, J.; Krause, R.M.; Lane, B.W.; Rupp, J.A.; Graham, J.D. Effects of providing total cost of ownership information on consumers’ intent to purchase a hybrid or plug-in electric vehicle. Transp. Res. Part A Policy Pract. 2015, 72, 71–86. [Google Scholar] [CrossRef] [Green Version]
  57. AutoScout24. Available online: https://www.autoscout24.at/ (accessed on 3 February 2023).
  58. Das WeltAuto Austria. Available online: https://www.dasweltauto.at/ (accessed on 3 February 2023).
  59. Gebrauchtwagen Austria. Available online: https://www.gebrauchtwagen.at/ (accessed on 3 February 2023).
  60. Njuskalo Croatia. Available online: https://www.njuskalo.hr/ (accessed on 3 February 2023).
  61. Oglasnik Croatia. Available online: https://www.oglasnik.hr/auto-moto-i-nautika (accessed on 3 February 2023).
  62. Autoto. Available online: https://www.autoto.hr/ (accessed on 3 February 2023).
  63. Auti.hr. Available online: https://www.auti.hr/ (accessed on 3 February 2023).
  64. Das WeltAuto Croatia. Available online: https://www.rabljenavozila.com.hr/ (accessed on 3 February 2023).
  65. OTOMOTO. Available online: https://www.otomoto.pl/ (accessed on 3 February 2023).
  66. DobrevAvto. Available online: https://www.doberavto.si/ (accessed on 3 February 2023).
  67. Avto.net. Available online: https://www.avto.net/ (accessed on 3 February 2023).
  68. Kocsi.hu. Available online: https://www.kocsi.hu/ (accessed on 3 February 2023).
  69. Használtautó.hu. Available online: https://www.hasznaltauto.hu/ (accessed on 3 February 2023).
  70. JóAutók.hu. Available online: https://www.joautok.hu/ (accessed on 3 February 2023).
  71. OOYYO Hungary. Available online: https://www.ooyyo.com/hungary/c=CDA31D7114D6854F111B8F6F9D671453/ (accessed on 3 February 2023).
  72. Bestauto. Available online: https://www.bestauto.ro/ (accessed on 4 February 2023).
  73. AUTOVIT. Available online: https://www.autovit.ro/ (accessed on 4 February 2023).
  74. OLX. Available online: https://www.olx.ro/ (accessed on 4 February 2023).
  75. OOYYO Romania. Available online: https://www.ooyyo.com/romania/c=CDA31D7114D6854F111B746F9D671453/ (accessed on 4 February 2023).
  76. AAA AUTO Czech Republic. Available online: https://www.aaaauto.cz/ (accessed on 4 February 2023).
  77. Sauto.cz. Available online: https://www.sauto.cz/ (accessed on 4 February 2023).
  78. AutoBazar EU. Available online: https://www.autobazar.eu/ (accessed on 4 February 2023).
  79. AAA AUTO Slovakia. Available online: https://www.aaaauto.sk/ (accessed on 4 February 2023).
  80. AUTOVIA.SK. Available online: https://www.autovia.sk/ (accessed on 4 February 2023).
  81. Fileru, I.F. Toyota Prius—A Successful Pioneering in Hybrid Vehicle World. Appl. Mech. Mater. 2015, 809–810, 1139–1144. [Google Scholar] [CrossRef]
  82. Fiat Austria Official. Available online: https://www.fiat.at/ (accessed on 6 February 2023).
  83. Fiat Croatia Official. Available online: https://www.fiat.hr/ (accessed on 6 February 2023).
  84. Fiat Poland Official. Available online: https://www.fiat.pl/ (accessed on 6 February 2023).
  85. Fiat Slovenia Official. Available online: https://www.fiat.si/ (accessed on 6 February 2023).
  86. Fiat Hungary Official. Available online: https://www.fiat.hu/ (accessed on 6 February 2023).
  87. Fiat Romania Official. Available online: https://www.fiat.com.ro/ (accessed on 6 February 2023).
  88. Fiat Slovakia Official. Available online: https://www.fiat.sk/ (accessed on 6 February 2023).
  89. Fiat Czech Republic Official. Available online: https://www.fiat.cz/ (accessed on 6 February 2023).
  90. Renault Austria Official. Available online: https://www.renault.at/ (accessed on 6 February 2023).
  91. Renault Croatia Official. Available online: https://www.renault.hr/ (accessed on 6 February 2023).
  92. Renault Poland Official. Available online: https://www.renault.pl/ (accessed on 6 February 2023).
  93. Renault Slovenia Official. Available online: https://www.renault.si/ (accessed on 6 February 2023).
  94. Renault Hungary Official. Available online: https://www.renault.hu/ (accessed on 6 February 2023).
  95. Renault Romania Official. Available online: https://www.renault.ro/ (accessed on 6 February 2023).
  96. Renault Slovakia Official. Available online: https://www.renault.sk/ (accessed on 6 February 2023).
  97. Renault Czech Republic Official. Available online: https://www.renault.cz/ (accessed on 6 February 2023).
  98. Volkswagen Austria Official. Available online: https://www.volkswagen.at/ (accessed on 6 February 2023).
  99. Volkswagen Croatia Official. Available online: https://www.volkswagen.hr/ (accessed on 6 February 2023).
  100. Volkswagen Poland Official. Available online: https://www.volkswagen.pl/ (accessed on 6 February 2023).
  101. Volkswagen Slovenia Official. Available online: https://www.volkswagen.si/ (accessed on 6 February 2023).
  102. Volkswagen Hungary Official. Available online: https://www.volkswagen.hu/ (accessed on 6 February 2023).
  103. Volkswagen Romania Official. Available online: https://www.volkswagen.ro/ (accessed on 6 February 2023).
  104. Volkswagen Slovakia Official. Available online: https://www.volkswagen.sk/ (accessed on 6 February 2023).
  105. Volkswagen Czech Republic Official. Available online: https://www.volkswagen.cz/ (accessed on 6 February 2023).
  106. Tesla Official. Available online: https://www.tesla.com/ (accessed on 6 February 2023).
  107. Nissan Austria Official. Available online: https://www.nissan.at/ (accessed on 7 February 2023).
  108. Nissan Croatia Official. Available online: https://www.nissan.hr/ (accessed on 7 February 2023).
  109. Nissan Poland Official. Available online: https://www.nissan.pl/ (accessed on 7 February 2023).
  110. Nissan Slovenia Official. Available online: https://www.nissan.si/ (accessed on 7 February 2023).
  111. Nissan Hungary Official. Available online: https://www.nissan.hu/ (accessed on 7 February 2023).
  112. Nissan Romania Official. Available online: https://www.nissan.ro/ (accessed on 7 February 2023).
  113. Nissan Slovakia Official. Available online: https://www.nissan.sk/ (accessed on 7 February 2023).
  114. Nissan Czech Republic Official. Available online: https://www.nissan.cz/ (accessed on 7 February 2023).
  115. Mitsubishi Austria Official. Available online: https://www.mitsubishi-motors.at/ (accessed on 7 February 2023).
  116. Mitsubishi Croatia Official. Available online: https://www.mitsubishi-motors.hr/ (accessed on 7 February 2023).
  117. Mitsubishi Poland Official. Available online: https://www.mitsubishi.pl/ (accessed on 7 February 2023).
  118. Mitsubishi Slovenia Official. Available online: https://www.mitsubishi-motors.si/ (accessed on 7 February 2023).
  119. Mitsubishi Hungary Official. Available online: https://www.mitsubishi.hu/ (accessed on 7 February 2023).
  120. Mitsubishi Romania Official. Available online: https://www.mitsubishi-motors.ro/ (accessed on 7 February 2023).
  121. Mitsubishi Slovakia Official. Available online: https://www.mitsubishi-motors.sk/ (accessed on 7 February 2023).
  122. Mitsubishi Czech Republic Official. Available online: https://www.mitsubishi-motors.cz/ (accessed on 7 February 2023).
  123. BMW Austria Official. Available online: https://www.bmw.at/ (accessed on 7 February 2023).
  124. BMW Croatia Official. Available online: https://www.bmw.hr/ (accessed on 7 February 2023).
  125. BMW Poland Official. Available online: https://www.bmw.pl/ (accessed on 7 February 2023).
  126. BMW Slovenia Official. Available online: https://www.bmw.si/ (accessed on 7 February 2023).
  127. BMW Hungary Official. Available online: https://www.bmw.hu/ (accessed on 7 February 2023).
  128. BMW Romania Official. Available online: https://www.bmw.ro/ (accessed on 7 February 2023).
  129. BMW Slovakia Official. Available online: https://www.bmw.sk/ (accessed on 7 February 2023).
  130. BMW Czech Republic Official. Available online: https://www.bmw.cz/ (accessed on 7 February 2023).
  131. Volvo Austria Official. Available online: https://www.volvocars.com/at/ (accessed on 7 February 2023).
  132. Volvo Croatia Official. Available online: https://www.volvocars.com/hr/ (accessed on 7 February 2023).
  133. Volvo Poland Official. Available online: https://www.volvocars.com/pl/ (accessed on 7 February 2023).
  134. Volvo Slovenia Official. Available online: https://www.volvocars.com/si/ (accessed on 7 February 2023).
  135. Volvo Hungary Official. Available online: https://www.volvocars.com/hu/ (accessed on 7 February 2023).
  136. Volvo Romania Official. Available online: https://www.volvocars.com/ro/ (accessed on 7 February 2023).
  137. Volvo Slovakia Official. Available online: https://www.volvocars.com/sk/ (accessed on 7 February 2023).
  138. Volvo Czech Republic Official. Available online: https://www.volvocars.com/cz/ (accessed on 7 February 2023).
  139. Toyota Austria Official. Available online: https://www.toyota.at/ (accessed on 8 February 2023).
  140. Toyota Croatia Official. Available online: https://www.toyota.hr/ (accessed on 8 February 2023).
  141. Toyota Poland Official. Available online: https://www.toyota.pl/ (accessed on 8 February 2023).
  142. Toyota Slovenia Official. Available online: https://www.toyota.si/ (accessed on 8 February 2023).
  143. Toyota Hungary Official. Available online: https://www.toyota.hu/ (accessed on 8 February 2023).
  144. Toyota Romania Official. Available online: https://www.toyota.ro/ (accessed on 8 February 2023).
  145. Toyota Slovakia Official. Available online: https://www.toyota.sk/ (accessed on 8 February 2023).
  146. Toyota Czech Republic Official. Available online: https://www.toyota.cz/ (accessed on 8 February 2023).
  147. EAFO European Alternative Fuels Observatory: Compare Cost and CO2 Emissions of Passenger Cars. Available online: https://alternative-fuels-observatory.ec.europa.eu/consumer-portal/calculator (accessed on 19 February 2023).
  148. Zhou, Y.; Wang, M.; Hao, H.; Johnson, L.R.; Wang, H. Plug-in electric vehicle market penetration and incentives: A global review. Mitig. Adapt. Strateg. Glob. Chang. 2015, 20, 777–795. [Google Scholar] [CrossRef]
  149. Cansino, J.M.; Sánchez-Braza, A.; Sanz-Díaz, T. Policy Instruments to Promote Electro-Mobility in the EU28: A Comprehensive Review. Sustainability 2018, 10, 2507. [Google Scholar] [CrossRef] [Green Version]
  150. Tsakalidis, A.; Thiel, C. Electric Vehicles in Europe from 2010 to 2017: Is Full-Scale Commercialisation Beginning? An Overview of the Evolution of Electric Vehicles in Europe; Technical Report No. EUR 29401 EN; Publications Office of the European Union: Luxembourg, 2018; ISBN 978-92-79-96719-1. [Google Scholar]
  151. Fiorello, D.; Martino, A.; Zani, L.; Christidis, P.; Navajas-Cawood, E. Mobility Data across the EU 28 Member States: Results from an Extensive CAWI Survey. Transp. Res. Procedia 2016, 14, 1104–1113. [Google Scholar] [CrossRef] [Green Version]
  152. IEA. Global EV Outlook 2021, IEA, Paris. 2021. Available online: https://www.iea.org/reports/global-ev-outlook-2021 (accessed on 15 April 2023).
  153. IEA. Global EV Outlook 2022, IEA, Paris. 2022. Available online: https://www.iea.org/reports/global-ev-outlook-2022 (accessed on 24 April 2023).
  154. Dik, A.; Omer, S.; Boukhanouf, R. Electric Vehicles: V2G for Rapid, Safe, and Green EV Penetration. Energies 2022, 15, 803. [Google Scholar] [CrossRef]
  155. EUROSTAT Population on 1 January 2022. Available online: https://ec.europa.eu/eurostat/databrowser/view/TPS00001/default/table?lang=en (accessed on 11 February 2023).
  156. Brzezińska, D. LPG cars in a car park environment—How to make it safe. Int. J. Environ. Res. Public Health 2019, 16, 1062. [Google Scholar] [CrossRef] [Green Version]
  157. Jena, P.R.; Managi, S.; Majhi, B. Forecasting the CO2 emissions at the global level: A multilayer artificial neural network modelling. Energies 2021, 14, 6336. [Google Scholar] [CrossRef]
  158. Bryła, P.; Chatterjee, S.; Ciabiada-Bryła, B. Consumer Adoption of Electric Vehicles: A Systematic Literature Review. Energies 2023, 16, 205. [Google Scholar] [CrossRef]
  159. Ogunkunbi, G.A.; Al-Zibaree, H.K.Y.; Meszaros, F. Modeling and Evaluation of Market Incentives for Battery Electric Vehicles. Sustainability 2022, 14, 4234. [Google Scholar] [CrossRef]
  160. Ogunkunbi, G.A.; Al-Zibaree, H.K.Y.; Meszaros, F. Evidence-Based Market Overview of Incentives and Disincentives in Electric Mobility as a Key to the Sustainable Future. Future Transp. 2021, 1, 290–302. [Google Scholar] [CrossRef]
  161. Bohdanowicz, Z.; Kowalski, J.; Biele, C. Intentions to Charge Electric Vehicles Using Vehicle-to-Grid Technology among People with Different Motivations to Save Energy. Sustainability 2022, 14, 12681. [Google Scholar] [CrossRef]
  162. Sobiech-Grabka, K.; Stankowska, A.; Jerzak, K. Determinants of Electric Cars Purchase Intention in Poland: Personal Attitudes v. Economic Arguments. Energies 2022, 15, 3078. [Google Scholar] [CrossRef]
  163. Brătucu, G.; Trifan, A.; Dovleac, L.; Chițu, I.B.; Todor, R.D.; Brătucu, R. Acquisition of Electric Vehicles—A Step towards Green Consumption. Empirical Research among Romanian Students. Sustainability 2019, 11, 6639. [Google Scholar] [CrossRef] [Green Version]
  164. Hecht, C.; Spreuer, K.G.; Figgener, J.; Sauer, D.U. Market Review and Technical Properties of Electric Vehicles in Germany. Vehicles 2022, 4, 903–916. [Google Scholar] [CrossRef]
  165. Kajanova, M.; Bracinik, P. The Vehicle-to-Grid Concept with Respect to the Preferences of Electric Vehicle Drivers and Charging Station Operators. Appl. Sci. 2022, 12, 5476. [Google Scholar] [CrossRef]
  166. Falkoni, A.; Pfeifer, A.; Krajačić, G. Vehicle-to-Grid in Standard and Fast Electric Vehicle Charging: Comparison of Renewable Energy Source Utilization and Charging Costs. Energies 2020, 13, 1510. [Google Scholar] [CrossRef] [Green Version]
  167. Viola, F. Electric Vehicles and Psychology. Sustainability 2021, 13, 719. [Google Scholar] [CrossRef]
  168. Wang, N.; Pan, H.; Zheng, W. Assessment of the incentives on electric vehicle promotion in China. Transp. Res. Part A Policy Pract. 2017, 101, 177–189. [Google Scholar] [CrossRef]
  169. European Environment Agency (EEA). Available online: https://www.eea.europa.eu/publications/electric-vehicles-in-europe (accessed on 15 July 2020).
  170. Xu, M.; Yang, H.; Wang, S. Mitigate the range anxiety: Siting battery charging stations for electric vehicle drivers. Transp. Res. Part C Emerg. Technol. 2020, 114, 164–188. [Google Scholar] [CrossRef]
  171. Kim, E.; Heo, E. Key Drivers behind the Adoption of Electric Vehicle in Korea: An Analysis of the Revealed Preferences. Sustainability 2019, 11, 6854. [Google Scholar] [CrossRef] [Green Version]
  172. García-Martínez, E.; Muñoz-Cruzado-Alba, J.; Sanz-Osorio, J.F.; Perié, J.M. Design and Experimental Validation of Power Electric Vehicle Emulator for Testing Electric Vehicle Supply Equipment (EVSE) with Vehicle-to-Grid (V2G) Capability. Appl. Sci. 2021, 11, 11496. [Google Scholar] [CrossRef]
  173. Cabrera-Tobar, A.; Blasuttigh, N.; Massi Pavan, A.; Lughi, V.; Petrone, G.; Spagnuolo, G. Energy Scheduling and Performance Evaluation of an e-Vehicle Charging Station. Electronics 2022, 11, 3948. [Google Scholar] [CrossRef]
  174. Zhao, Z.; Xu, M.; Lee, C.K. Capacity Planning for an Electric Vehicle Charging Station Considering Fuzzy Quality of Service and Multiple Charging Options. IEEE Trans. Veh. Technol. 2021, 70, 12529–12541. [Google Scholar] [CrossRef]
  175. Pop, H.; Grama, A.; Fodor, A.; Rusu, C. Infrastructure Development for Electric Vehicle Charging Stations in Cluj-Napoca Municipality—A Case Study. Energies 2023, 16, 3552. [Google Scholar] [CrossRef]
  176. Liao, F.; Molin, E.J.; van Wee, B. Consumer preferences for electric vehicles: A literature review. Transp. Rev. 2017, 37, 252–275. [Google Scholar] [CrossRef] [Green Version]
  177. Luo, T.; Song, Y.; Li, G. An agent-based simulation study for escaping the “chicken-egg” dilemma between electric vehicle penetration and charging infrastructure deployment. Resour. Conserv. Recycl. 2023, 194, 106966. [Google Scholar] [CrossRef]
  178. Ghosh, N.; Mothilal Bhagavathy, S.; Thakur, J. Accelerating electric vehicle adoption: Techno-economic assessment to modify existing fuel stations with fast charging infrastructure. Clean Technol. Environ. Policy 2022, 24, 3033–3046. [Google Scholar] [CrossRef]
  179. Skrúcaný, T.; Kendra, M.; Stopka, O.; Milojević, S.; Figlus, T.; Csiszár, C. Impact of the Electric Mobility Implementation on the Greenhouse Gases Production in Central European Countries. Sustainability 2019, 11, 4948. [Google Scholar] [CrossRef] [Green Version]
  180. Zamfir, A.-I.; Croitoru, E.O.; Burlacioiu, C.; Dobrin, C. Renewable Energies: Economic and Energy Impact in the Context of Increasing the Share of Electric Cars in EU. Energies 2022, 15, 8882. [Google Scholar] [CrossRef]
  181. Lieutenant, K.; Borissova, A.V.; Mustafa, M.; McCarthy, N.; Iordache, I. Comparison of “Zero Emission” Vehicles with Petrol and Hybrid Cars in Terms of Total CO2 Release—A Case Study for Romania, Poland, Norway and Germany. Energies 2022, 15, 7988. [Google Scholar] [CrossRef]
  182. Živčák, J.; Kádárová, J.; Puškár, M.; Kočišová, M.; Lachvajderová, L. Expected Impacts of the Massive Increase in Electric Vehicles in Slovakia. Appl. Sci. 2020, 10, 8945. [Google Scholar] [CrossRef]
  183. Mutavdžija, M.; Kovačić, M.; Buntak, K. Assessment of Selected Factors Influencing the Purchase of Electric Vehicles—A Case Study of the Republic of Croatia. Energies 2022, 15, 5987. [Google Scholar] [CrossRef]
  184. Kumar, P.; Nikolovski, S.; Ali, I.; Thomas, M.S.; Ahuja, H. Impact of Electric Vehicles on Energy Efficiency with Energy Boosters in Coordination for Sustainable Energy in Smart Cities. Processes 2022, 10, 1593. [Google Scholar] [CrossRef]
  185. Dudziak, A.; Caban, J.; Stopka, O.; Stoma, M.; Sejkorová, M.; Stopková, M. Vehicle Market Analysis of Drivers’ Preferences in Terms of the Propulsion Systems: The Czech Case Study. Energies 2023, 16, 2418. [Google Scholar] [CrossRef]
  186. Zavorka, R.; Paar, M. A Focus on Electromobility within Smart City Solutions—Charging Stations, Renewable Energy, and Air Quality Monitoring. Sensors 2022, 22, 7841. [Google Scholar] [CrossRef] [PubMed]
  187. Dvořáček, L.; Horák, M.; Knápek, J. Simulation of Electric Vehicle Charging Points Based on Efficient Use of Chargers and Using Recuperated Braking Energy from Trains. Energies 2022, 15, 571. [Google Scholar] [CrossRef]
  188. Siebenhofer, M.; Ajanovic, A.; Haas, R. How Policies Affect the Dissemination of Electric Passenger Cars Worldwide. Energies 2021, 14, 2093. [Google Scholar] [CrossRef]
  189. Ajanovic, A.; Siebenhofer, M.; Haas, R. Electric Mobility in Cities: The Case of Vienna. Energies 2021, 14, 217. [Google Scholar] [CrossRef]
  190. Borowska-Stefańska, M.; Kowalski, M.; Kurzyk, P.; Mikušová, M.; Wiśniewski, S. Privileging Electric Vehicles as an Element of Promoting Sustainable Urban Mobility—Effects on the Local Transport System in a Large Metropolis in Poland. Energies 2021, 14, 3838. [Google Scholar] [CrossRef]
  191. Kakkar, R.; Gupta, R.; Agrawal, S.; Tanwar, S.; Sharma, R.; Alkhayyat, A.; Neagu, B.-C.; Raboaca, M.S. A Review on Standardizing Electric Vehicles Community Charging Service Operator Infrastructure. Appl. Sci. 2022, 12, 12096. [Google Scholar] [CrossRef]
  192. Barjoveanu, G.; Dinita, F.; Teodosiu, C. Aging Passenger Car Fleet Structure, Dynamics, and Environmental Performance Evaluation at the Regional Level by Life Cycle Assessment. Sustainability 2022, 14, 8443. [Google Scholar] [CrossRef]
  193. Vrabie, C. Electric Vehicles Optimism versus the Energy Market Reality. Sustainability 2022, 14, 5388. [Google Scholar] [CrossRef]
  194. EAFO European Alternative Fuels Observatory. 2022. Available online: https://alternative-fuels-observatory.ec.europa.eu/transport-mode/road/european-union-eu27/infrastructure (accessed on 19 February 2023).
  195. Hardman, S.; Fleming, K.L.; Kare, E.; Ramadan, M. A Perspective on Equity in the Transition to Electric Vehicles. MIT Sci. Policy Rev. 2021, 2, 46–54. [Google Scholar] [CrossRef]
  196. Vassileva, I.; Campillo, J. Adoption barriers for electric vehicles: Experiences from early adopters in Sweden. Energy 2017, 120, 632–641. [Google Scholar] [CrossRef]
  197. Westin, K.; Jansson, J.; Nordlund, A. The importance of socio-demographic characteristics, geographic setting, and attitudes for adoption of electric vehicles in Sweden. Travel Behav. Soc. 2018, 13, 118–127. [Google Scholar] [CrossRef]
  198. EUROSTAT 2022b Average Full Time Adjusted Salary Per Employee. Available online: https://ec.europa.eu/eurostat/databrowser/view/NAMA_10_FTE/default/table?lang=en (accessed on 7 February 2023).
  199. Creutzig, F.; Niamir, L.; Bai, X.; Callaghan, M.; Cullen, J.; Díaz-José, J.; Figueroa, M.; Grubler, A.; Lamb, W.F.; Leip, A.; et al. Demand-Side Solutions to Climate Change Mitigation Consistent with High Levels of Well-Being. Nat. Clim. Chang. 2022, 12, 36–46. [Google Scholar] [CrossRef]
  200. Garcia, S.; Cordeiro, A.; Nääs, I.D.A.; Neto, P.L.D.O.C. The sustainability awareness of Brazilian consumers of cotton clothing. J. Clean. Prod. 2019, 215, 1490–1502. [Google Scholar] [CrossRef]
  201. Omahne, V.; Knez, M.; Obrecht, M. Social Aspects of Electric Vehicles Research—Trends and Relations to Sustainable Development Goals. World Electr. Veh. J. 2021, 12, 15. [Google Scholar] [CrossRef]
  202. Bjerkan, K.Y.; Nørbech, T.E.; Nordtømme, M.E. Incentives for Promoting Battery Electric Vehicle (BEV) Adoption in Norway. Transp. Res. Part D Transp. Environ. 2016, 43, 169–180. [Google Scholar] [CrossRef] [Green Version]
  203. Improving the Sustainability of Passenger and Freight Transport. Available online: https://www.iea.org/topics/transport (accessed on 3 May 2023).
  204. Temporelli, A.; Carvalho, M.L.; Girardi, P. Life Cycle Assessment of Electric Vehicle Batteries: An Overview of Recent Literature. Energies 2020, 13, 2864. [Google Scholar] [CrossRef]
  205. CO2 Intensity of Electricity Generation—European Environment Agency. Available online: https://www.eea.europa.eu/data-and-maps/data/co2-intensity-of-electricity-generation (accessed on 3 May 2023).
  206. Global CO2 emissions from Passenger Cars 2020|Statista. Available online: https://www.statista.com/statistics/1107970/carbon-dioxide-emissions-passenger-transport/ (accessed on 6 May 2023).
  207. Carbon-Dioxide Emissions of Passenger Transport. Available online: https://www.eea.europa.eu/en/topics/in-depth/transport-and-mobility (accessed on 3 May 2023).
  208. A European Strategy for Low-Emission Mobility—European Environment Agency. Available online: https://www.eea.europa.eu/policy-documents/a-european-strategy-for-low (accessed on 3 May 2023).
  209. Greenhouse Gas Emissions from Transport in Europe—European Environment Agency. Available online: https://www.eea.europa.eu/ims/greenhouse-gas-emissions-from-transport (accessed on 3 May 2023).
  210. Commission Regulation (EU) No 459/2012 of 29 May 2012 Amending Regulation (EC) No 715/2007 of the European Parliament and of the Council and Commission Regulation (EC) No 692/2008 as Regards Emissions from Light Passenger and Commercial Vehicles (Euro 6) Text with EEA Relevance. Available online: https://eur-lex.europa.eu/legal-content/EN/TXT/?uri=celex%3A32012R0459 (accessed on 3 May 2023).
  211. European Green Deal Package. European Green Deal: The “Fit for 55 Package”|Thought Leadership|Insights|Linklaters. Available online: https://www.linklaters.com/en/insights/thought-leadership/energy/european-green-deal (accessed on 3 May 2023).
  212. Ghosh, A. Possibilities and Challenges for the Inclusion of the Electric Vehicle (EV) to Reduce the Carbon Footprint in the Transport Sector: A Review. Energies 2020, 13, 2602. [Google Scholar] [CrossRef]
  213. Sobol, L.; Dyjakon, A. The Influence of Power Sources for Charging the Batteries of Electric Cars on CO2 Emissions during Daily Driving: A Case Study from Poland. Energies 2020, 13, 4267. [Google Scholar] [CrossRef]
  214. Huo, H.; Cai, H.; Zhang, Q.; Liu, F.; He, K. Life-cycle assessment of greenhouse gas and air emissions of electric vehicles: A comparison between China and the U.S. Atmos. Environ. 2015, 108, 107–116. [Google Scholar] [CrossRef]
  215. Requia, W.J.; Mohamed, M.; Higgins, C.D.; Arain, A.; Ferguson, M. How clean are electric vehicles? Evidence-based review of the effects of electric mobility on air pollutants, greenhouse gas emissions and human health. Atmos. Environ. 2018, 185, 64–77. [Google Scholar] [CrossRef]
  216. Huo, H.; Zhang, Q.; Wang, M.Q.; Streets, D.G.; He, K. Environmental Implication of Electric Vehicles in China. Environ. Sci. Technol. 2010, 44, 4856–4861. [Google Scholar] [CrossRef]
  217. Neugebauer, M.; Żebrowski, A.; Esmer, O. Cumulative Emissions of CO2 for Electric and Combustion Cars: A Case Study on Specific Models. Energies 2022, 15, 2703. [Google Scholar] [CrossRef]
  218. Wu, Q.; Sun, S. Energy and Environmental Impact of the Promotion of Battery Electric Vehicles in the Context of Banning Gasoline Vehicle Sales. Energies 2022, 15, 8388. [Google Scholar] [CrossRef]
  219. Gil-Garcia, I.C.; García-Casales, M.S.; Dagher, H.; Molina-Garcia, A. Electric Vehicle and Renewable Energy Sources: Motor Fusion in the Energy Transition from a Multi Indicator Perspective. Sustainability 2021, 13, 3430. [Google Scholar] [CrossRef]
  220. Gryparis, E.; Papadopoulos, P.; Leligou, H.C.; Psomopoulos, C.S. Electricity demand and carbon emission in power generation under high penetration of electric vehicles. A European Union perspective. Energy Rep. 2020, 6, 475–486. [Google Scholar] [CrossRef]
  221. Vanderheiden, S. Assessing the case against the SUV. Environ. Polit. 2006, 15, 23–40. [Google Scholar] [CrossRef]
  222. Jochem, P.; Babrowski, S.; Fichtner, W. Assessing CO2 emissions of electric vehicles in Germany in 2030. Transp. Res. Part A Policy Pract. 2015, 78, 68–83. [Google Scholar] [CrossRef] [Green Version]
  223. Choi, H.; Shin, J.; Woo, J. Effect of electricity generation mix on battery electric vehicle adoption and its environmental impacts. Energy Policy 2018, 121, 13–24. [Google Scholar] [CrossRef]
  224. Koengkan, M.; Fuinhas, J.A.; Teixeira, M.; Kazemzadeh, E.; Auza, A.; Dehdar, F.; Osmani, F. The Capacity of Battery Electric and Plug-int Hybrid Vehicles to Mitigate CO2 Emissions: Macroeconomic Evidence from the European Union Countries. World Electr. Veh. J. 2022, 13, 58. [Google Scholar] [CrossRef]
  225. Kawamoto, R.; Mochizuki, H.; Moriguchi, Y.; Nkano, T.; Motohashi, M.; Sakai, Y.; Inaba, A. Estimation of CO2 Emissions of Internal Combustion Engine Vehicle and Battery Electric Vehicle Using LCA. Sustainability 2019, 11, 2690. [Google Scholar] [CrossRef] [Green Version]
  226. Costa, C.M.; Barbosa, J.C.; Goncales, R.; Castro, H.; Del Campo, F.J. Recycling and environmental issues of lithium-ion batteries: Advances, challenges and opportunities. Energy Storage Mater. 2021, 37, 433–465. [Google Scholar] [CrossRef]
  227. Pan, S.; Roy, A.; Choi, Y.; Eslami, E.; Thomas, S.; Jiang, X.; Gao, O. Potential impacts of electric vehicles on air quality and health endpoints in the Greater Houston Area in 2040. Atmos. Environ. 2019, 207, 38–51. [Google Scholar] [CrossRef]
  228. Nichols, B.G.; Kockelman, K.M.; Reiter, M. Air quality impacts of electric vehicle adoption in Texas. Transp. Res. Part D Transp. Environ. 2015, 34, 208–218. [Google Scholar] [CrossRef]
  229. Timmers, V.; Achten, P. Non-exhaust PM emissions from electric vehicles. Atmos. Environ. 2016, 134, 10–17. [Google Scholar] [CrossRef]
  230. Przydatek, G.; Ryniewicz, A.; Irmia, O.; Tomozei, C.; Mosnegutu, E.; Bodziony, M. Analysis of Noise Levels in Typical Passenger Cars. Sustainability 2023, 15, 7910. [Google Scholar] [CrossRef]
  231. Lan, Z.; Yuan, M.; Shao, S.; Li, F. Noise Emission Models of Electric Vechicles Considering Sppeed, Acceleration and Motion State. Int. J. Environ. Res. Public Health 2023, 20, 3531. [Google Scholar] [CrossRef]
  232. Campello-Vicente, H.; Peral-Orts, R.; Campillo-Davo, N.; Velasco-Sanchez, E. The effect of electric vehicles on urban noise maps. Appl. Acoust. 2017, 116, 59–64. [Google Scholar] [CrossRef]
  233. Møller Iversen, L.; Marbjerg, G.; Bendtsen, H. Noise from electric vehicles—‘state-of-the-art’ literature survey. In Proceedings of the Internoise 2013, Innsbruck, Austria, 15–18 September 2013. [Google Scholar]
  234. Altinsoy, M.E. The Evaluation of Conventional, Electric and Hybrid Electric Passenger Car Pass-By Noise Annoyance Using Psychoacoustical Properties. Appl. Sci. 2022, 12, 5146. [Google Scholar] [CrossRef]
Figure 1. Number of EVs per 1000 people in 2022. Data: Own editing based on the data of EAFO [5] and Eurostat [155].
Energies 16 05421 g001
Figure 2. Number of EVs per charging station. Data source: based on the data of EAFO [5].
Energies 16 05421 g002
Figure 3. Time needed for buying the studied passenger cars compared to the EU average. Source: Own editing based on used car websites [57,58,59,60,61,62,63,64,65,66,67,68,69,70,71,72,73,74,75,76,77,78,79,80], official websites of manufacturers [82,83,84,85,86,87,88,89,90,91,92,93,94,95,96,97,98,99,100,101,102,103,104,105,106,107,108,109,110,111,112,113,114,115,116,117,118,119,120,121,122,123,124,125,126,127,128,129,130,131,132,133,134,135,136,137,138,139,140,141,142,143,144,145,146], and the data of EUROSTAT [198].
Energies 16 05421 g003
Figure 4. The manufacture year of EV, which can be purchased with an average income over a time unit in the studied member states. Source: Own editing based on data of used car websites [57,58,59,60,61,62,63,64,65,66,67,68,69,70,71,72,73,74,75,76,77,78,79,80], official websites of manufacturers [82,83,84,85,86,87,88,89,90,91,92,93,94,95,96,97,98,99,100,101,102,103,104,105,106,107,108,109,110,111,112,113,114,115,116,117,118,119,120,121,122,123,124,125,126,127,128,129,130,131,132,133,134,135,136,137,138,139,140,141,142,143,144,145,146] and EUROSTAT [198].
Energies 16 05421 g004
Figure 5. The manufacture year of Fiat 500e and Toyota Aygo, which can be purchased with an average income over a time unit in the studied member states. Source: own editing based on data of used car websites [57,58,59,60,61,62,63,64,65,66,67,68,69,70,71,72,73,74,75,76,77,78,79,80], official websites of manufacturers [82,83,84,85,86,87,88,89,139,140,141,142,143,144,145,146] and EUROSTAT [198].
Energies 16 05421 g005
Figure 6. The average price of the three differently powered Volkswagen Golf by the manufacture year of the models. Data source: Used car websites [57,58,59,60,61,62,63,64,65,66,67,68,69,70,71,72,73,74,75,76,77,78,79,80], official websites of the manufacturer [98,99,100,101,102,103,104,105], authors’ own editing.
Energies 16 05421 g006
Figure 7. Price of Volkswagen E-Golf/ID.3, Golf GTE, and Golf TSI models by the manufacture year of the models in Hungary. Data source: Used car websites [68,69,70,71], Volkswagen Hungary [102], authors’ own editing.
Energies 16 05421 g007
Figure 8. The total cost of ownership over seven years (euros). Data source: EAFO [147], authors’ own editing.
Energies 16 05421 g008
Figure 9. Total ownership cost per 100 km during the operational period of seven years (euros). Data source: EAFO [147], authors’ own editing.
Energies 16 05421 g009
Figure 10. Global CO2 emissions of passenger transport between 2000 and 2020 in billion metric tons [206].
Energies 16 05421 g010
Table 1. EV fleet by countries.
Territorial EntityEV FleetRatio of EVs in Total Passenger Car Fleet (%)Number of EVs PER 1000 CitizensNumber of Charging Points Per 10,000
Citizens (2022)
Number of EVs (pcs.) in 2020Change 2022
(%)
(2020 = 100%)
EU average77,510180.82.1012.5610.7
Austria59,744155.32.7516.9925.5
Czech Republic9835130.30.342.153.8
Croatia1906285.30.391.893.3
Poland12,475393.50.221.641.0
Hungary10,753295.50.974.393.7
Slovakia3506199.70.391.935.0
Slovenia4457106.90.694.389.0
Romania7410329.10.391.670.9
Data source: EAFO [5], EUROSTAT [155].
Table 2. Summarizing table of EV-ICE cost effectiveness.
Car TypeDifference in Price (EV-ICE), EuroOperational Costs of EVs (EV-ICE), EuroAmortisation (EV-ICE), %
12,000 km18,000 km40,000
km
12,000 km18,000
km
40,000
km
Fiat vs. Aygo12,6263087614517,35410.621.159.7
Zoe vs. Yaris13,3463547687119,05610.620.456.7
ID3 vs. Golf−538115,78119,11731,34339.848.379.1
Tesla vs. BMW27595329847620,0109.815.736.9
Data source: based on EAFO [147].
Table 3. Cumulated CO2 emission by car types according to different operational levels.
Car TypeCO2 Emissions (kg) for the Total (7 Years) MileageCO2 Emission
(g/km)
12,000 km/year18,000 km/year40,000 km/year
Segment AToyota Aygo 1.0940814,11231,360112
Segment BToyota Yaris 1.010,41615,62434,720124
Segment CVolkswagen Golf 1.5 TSI10,41615,62434,720124
Segment DBMW G30 520i12,60018,90042,000150
Data source: Volkswagen Official [98,99,100,101,102,103,104,105], BMW Official [123,124,125,126,127,128,129,130], Toyota Official [139,140,141,142,143,144,145,146], authors’ own editing.
Disclaimer/Publisher’s Note: The statements, opinions and data contained in all publications are solely those of the individual author(s) and contributor(s) and not of MDPI and/or the editor(s). MDPI and/or the editor(s) disclaim responsibility for any injury to people or property resulting from any ideas, methods, instructions or products referred to in the content.

