Article

Multicriteria Optimisation of the Structure of a Hybrid Power Supply System for a Single-Family Housing Estate in Poland, Taking into Account Different Electromobility Development Scenarios

by
Andrzej Tomczewski
1,*,
Stanisław Mikulski
1,*,
Adam Piotrowski
2,
Sławomir Sowa
3 and
Krzysztof Wróbel
4
1
Robotics and Electrical Engineering, Faculty of Control, Poznan University of Technology, 60-965 Poznan, Poland
2
Advanced Energy Transition Advisory, 61-036 Poznan, Poland
3
Faculty of Environmental and Mechanical Engineering, Poznan University of Life Sciences, 60-637 Poznan, Poland
4
Automatic Control and Informatics, Faculty of Electrical Engineering, Opole University of Technology, 45-758 Opole, Poland
*
Authors to whom correspondence should be addressed.
Energies 2023, 16(10), 4132; https://doi.org/10.3390/en16104132
Submission received: 12 April 2023 / Revised: 8 May 2023 / Accepted: 11 May 2023 / Published: 16 May 2023
(This article belongs to the Section A2: Solar Energy and Photovoltaic Systems)

Abstract

:
This article focuses on determining the optimum structure for a hybrid generation and storage system designed to power a single-family housing estate, taking into account the different number of electric vehicles in use and an assumed level of self-consumption of the generated energy. In terms of generation, two generation sections—wind and solar—and a lithium-ion container storage system will be taken into account. With regards to energy consumption, household load curves, determined on the basis of the tariff for residential consumers and modified by a random disturbance, will be taken into account, as well as the processes for charging electric cars with AC chargers, with power outputs ranging between 3.6 and 22 kW. Analyses were carried out for three locations in Poland—the Baltic Sea coast (good wind conditions), the Lublin Uplands (the best insolation in Poland) and the Carpathian foothills (poor wind and insolation conditions). The mathematical and numerical model of the system and the MOPSO (multiobjective particle swarm optimisation) algorithm were implemented in the Matlab environment. The results include Pareto fronts (three optimisation criteria: minimisation of energy storage capacity, minimisation of energy exchanged with the power grid and maximisation of the self-consumption rate) for the indicated locations and three electromobility development scenarios with determined NPVs (net present values) for a 20-year lifetime. The detailed results relate to the inclusion of an additional expert criterion in the form of a coupled payback period of no more than 10 years, a maximum NPV in the last year of operation and a self-consumption rate of at least 80%. The economic calculations take into account the decrease in PV installation capacity as a function of the year of operation, as well as changes in electricity and petrol prices and variations in energy prices at purchase and sale.

1. Introduction

Over the past 30 years, there has been a noticeable increase in the environmental awareness of society, which has contributed to the currently observable energy transition. One important aspect of this is the shift from emission-intensive electricity sources (e.g., coal and oil) to renewable energy sources (RES) (e.g., wind and solar). The intensive development of RES technologies has meant that they can be installed both on the high- and medium-voltage side (’utility power plants’), as well as on the low-voltage side, as so-called small and microinstallations, referred to as distributed energy resources (DER). In the case of RES installations installed at or on residential properties, the main factor driving their demand is the possibility of reducing the cost of purchasing energy from the grid. The prerequisite for a rapid return on investment costs is to use as much of the generated energy as possible for one’s own consumption (so-called self-consumption). Discharging surplus energy to the grid and collecting energy shortfalls from the grid involves losing some of the profit associated with the difference between the purchase and sale price of energy from and to the grid. This means that the size of the RES installation should be tailored to the needs of the residential building in question, e.g., on the basis of an analysis of the annual energy demand and load characteristics. Additionally, in many cases, it is advisable to use energy storage—in solar–wind systems, usually lithium-ion electrochemical batteries. A large number of scientific papers have been published on the above topics. The review below presents papers that contain interesting solutions, including the use of RES sources to power individual consumers (including single-family housing estates and multiapartment buildings) and the area of optimisation of the indicated types of systems often provided with energy storage systems.
The paper in [1] describes and characterises the power market: the distributed energy sources in the form of microinstallations that can operate in a system of energy clusters and virtual power plants. The impact of the introduction of the power market on the development of distributed energy sources, including hybrid systems with renewable sources, was evaluated. A method for sizing a photovoltaic installation for a single-family house in a way that reduces the annual cost of purchasing energy from the power grid was presented in [2]. The paper in [3] uses model predictive control (MPC) to control the components of the renewable installation. Artificial neural networks (ANNs) were used to predict the energy yield of the photovoltaic installation. It was also assumed that surplus energy is primarily used to heat water. The installation structure is optimised using quadratic programming.
Wind farms are characterised by higher energy production in winter and the possibility to also produce energy at night, while photovoltaic installations produce a high proportion of energy in summer when the days are long and there is a lot of sunshine. The increasing availability of modern technological solutions, such as photovoltaic roof tiles or small wind turbines, allows for increasingly better integration of RES into residential infrastructure. It has become possible to use hybrid (wind–solar) installations, which allow the amount of energy produced to be equalised at different times of the day and year. The paper in [4] presents the use of hybrid generation systems to increase energy efficiency. The article proves that by using generators with small installations and micro-RES installations with the possibility to control the energy flow in a cluster, large savings can be achieved. The paper in [5] analyses the feasibility of an autonomous hybrid solar and wind system for domestic use. It was verified that the averaged cost of electricity (LCOE) of a solar–wind system coincides with the final cost of electricity on the grid. The results show that in the location under analysis (Bulgaria), the electricity prices generated by stand-alone hybrid systems are higher than the electricity prices for grid-connected consumers. The use of stand-alone hybrid systems there is therefore only justified when there is no power supply available from the grid. However, the results presented in the paper need to be verified in the current energy situation in Europe.
One way to increase the self-consumption of energy is to use an additional energy storage system (ESS) [2,6]. Owing to this, the surplus energy produced can be stored and used when the energy demand of the consumer exceeds current production. As the current cost of purchase of an ESS is high, it is important to select the storage capacity and the appropriate energy exchange schedule so that its purchase does not have a negative impact on the economic analysis of the investment. Additionally, an ESS can increase the reliability of energy supply on the consumer side [7].
The problem concerning the optimisation of the selection of the type and structure of RES and ESS installations for residential buildings is widely described in many scientific papers. In the paper in [8], the aim of the optimisation is to minimise the costs of purchasing energy from the grid and the costs resulting from the ageing of the energy storage system. The problem of the minimisation of energy purchase costs on an annual basis, with a monthly balancing period, is described in [9]. Several scenarios that take into account different sizes of PV installations and their placement on the roof of a single-family house are presented. In both papers, a mixed-integer programming task was used to solve the problem. An interesting solution is presented in [10]; it involves the use of a non-cooperative game theory method to determine the optimal energy storage capacity and the schedule of energy exchange between the power grid and a single-family home equipped with renewable systems and energy storage to minimise energy purchase costs. The paper in [11] presents the application of the particle swarm method for the optimisation of the size of the components of a renewable installation comprising PV systems, electrochemical energy storage and a small pumped-storage power plant using elevated rain water storage. The minimisation of LCOE was used as an optimisation criterion. In the paper in [12], evolutionary algorithms were used to optimise the energy exchange schedule of a single-family house between the grid and the PV installation and the energy storage and an electric car (V2G exchange). It was shown that the proposed optimisation can lead to a significant reduction in household costs while increasing living standards. The paper in [13] examines the concept of the “efficient house plus” (EHP), as defined by the German Ministry of Climate, which envisages the production of energy in excess of a house’s needs through renewable systems. Based on data collected from several EHPs, a model of an EHP equipped with a photovoltaic installation, electricity storage and thermal storage is presented, with the aim of reducing the household’s energy purchase costs.
Additional opportunities for efficient energy use are provided by Smart Grid technology, which involves the possibility of a two-way flow of information between a smart energy meter located in the home and the distribution network operator. This enables more efficient management of the energy demand of a residential building, e.g., by shifting the load to off-peak hours [14,15,16,17]. A home energy management system (HEMS) based on optimisation methods is presented in [14]. The main task set for the system is to minimise the electricity bill, taking into account different energy tariffs. The paper in [15] presents a home energy management system (HEMS) that includes a photovoltaic installation, an energy storage and a smart energy meter. An energy management model involving the monitoring of the charging and discharging of an energy storage facility and the control of energy demand by shifting the load to off-peak hours is presented. The particle swarm method (PSO) was used to optimise the model. In the article in [16], the particle swarm optimisation (PSO) was used along with minimisation of the energy costs for a single-family house equipped with a PV installation and an energy storage. This was carried out by appropriately scheduling the electricity demand (shifting the load to off-peak hours) while maintaining the comfort of the householders. The paper in [17] presents a so-called smart home equipped with a PV installation and energy storage, where the main task of the storage is to average the daily energy demand.
The intensive development of electromobility, especially the issue of integrating plug-in hybrid electric vehicles (PHEVs) into a low-voltage electricity grid, introduces new challenges and opportunities for distribution network operators and PHEV owners. An algorithm for managing PHEV charging with the aim of minimising the total cost and flattening the demand curve is presented in [18]. The results verify the effectiveness of the proposed method in reducing the total costs with the management algorithm for PHEVs, especially when energy from the PHEV storage is discharged (sold to the grid). In the paper in [19], an electric car battery with bidirectional power exchange (V2G) capability was used to store energy from a domestic photovoltaic installation. The presented research demonstrates an algorithm for the energy management of the components of the installation in order to minimise the demand for electricity from the power grid.
In the case of multifamily dwellings (blocks of flats and single-family housing estates), the management of RES and ESS shared between households involves an even distribution of the energy produced (all users gain the same profit) [20,21,22]. An additional aspect of this problem comes into play when there is an external developer in addition to the users of the installation. It is then necessary to use methods of analysis that allow an intermediate solution that maximises profit for both parties to be found [23,24]. The paper in [20] provides a detailed analysis of the impact of PV installation, energy storage and electric cars on reducing the energy demand from the grid (self-sufficiency) of a single residential block in the UK. Various technical and economic models were used to help with the sizing of the components. For the case study under analysis, it was shown that it is possible to reduce energy demand by more than 30% by selecting components based on historical meteorological data. The paper in [21] presents a solar–wind installation equipped with a hybrid energy storage (supercapacitor and fuel cell) that powers 15 rural households. The structure of the installation (number of individual components) is determined in such a way as to minimise the total costs of the installation over a 20-year period. These costs include investment costs, operating costs and costs for replacing equipment. Adaptive Bacterial Foraging Optimisation (ABFO) was used for minimisation. The paper in [22] presents a model for the optimal energy exchange between single-family houses equipped with PV installations and energy storage. It employs the concept of the so-called Internet of Energy, an online energy exchange platform controlled using the Internet of Things (IoT) and smart meters. The aim of the collaboration algorithm of the systems is to obtain the highest possible profit for all participants (households) included in the system. The collaboration algorithm is based on a hybrid optimisation of harmony search (HS) and variable neighbourhood search (VNS). In contrast, the paper in [23] analysed the issue of the optimisation of energy storage capacity for a number of residential buildings, the aim of which was the highest profit on the part of the electricity consumers and the photovoltaic installation investor. For this purpose, the PSO method was used. The paper in [24], using the example of a so-called apartment building, presents the problem of sharing renewable energy among the residents of a multifamily building. The optimisation of the distribution of the energy produced by the photovoltaic installation between the individual apartments, the energy storage and the power grid was carried out using game theory. Two approaches were considered: in the first one, the maximum profit of the residents (energy consumers) was sough, and in the second one, the profit of the owner of the installation.

2. Description of the Facility and Characteristics of Its Electrical Load

The facility analysed is a single-family housing estate consisting of 24 terraced houses of 122 m2, each (electricity consumers) with a hybrid generation system and energy storage. An illustrative layout of the estate and generation system components is shown in Figure 1.
In accordance with the data published on the operator’s website (ENEA company) [25], it was assumed that each house consumes 3500 kWh of electricity per year, according to the load characteristics of the G11 tariff for individual consumers with a contracted capacity of no more than 40 kW determined for the entire year with a step of 1 h. To represent the actual operating conditions of the consumers (24 houses), a random modification of the load characteristic of each house was used in the form of noise, with a normal distribution with mean value equal to μ = 0 , variance equal to σ = 0.2 and amplitude equal to A = 0.2 kW. Depending on the variant of calculations, power resulting from electric vehicle charging processes was added to the house loads. Figure 2 shows the family of randomly modified load characteristics of the G11 tariff as of 01.01.2021 (a) and the selected load characteristic taking into account the charging of an electric vehicle (b).

3. Energy Flows in the Hybrid System: Energy Storage Operation Strategy

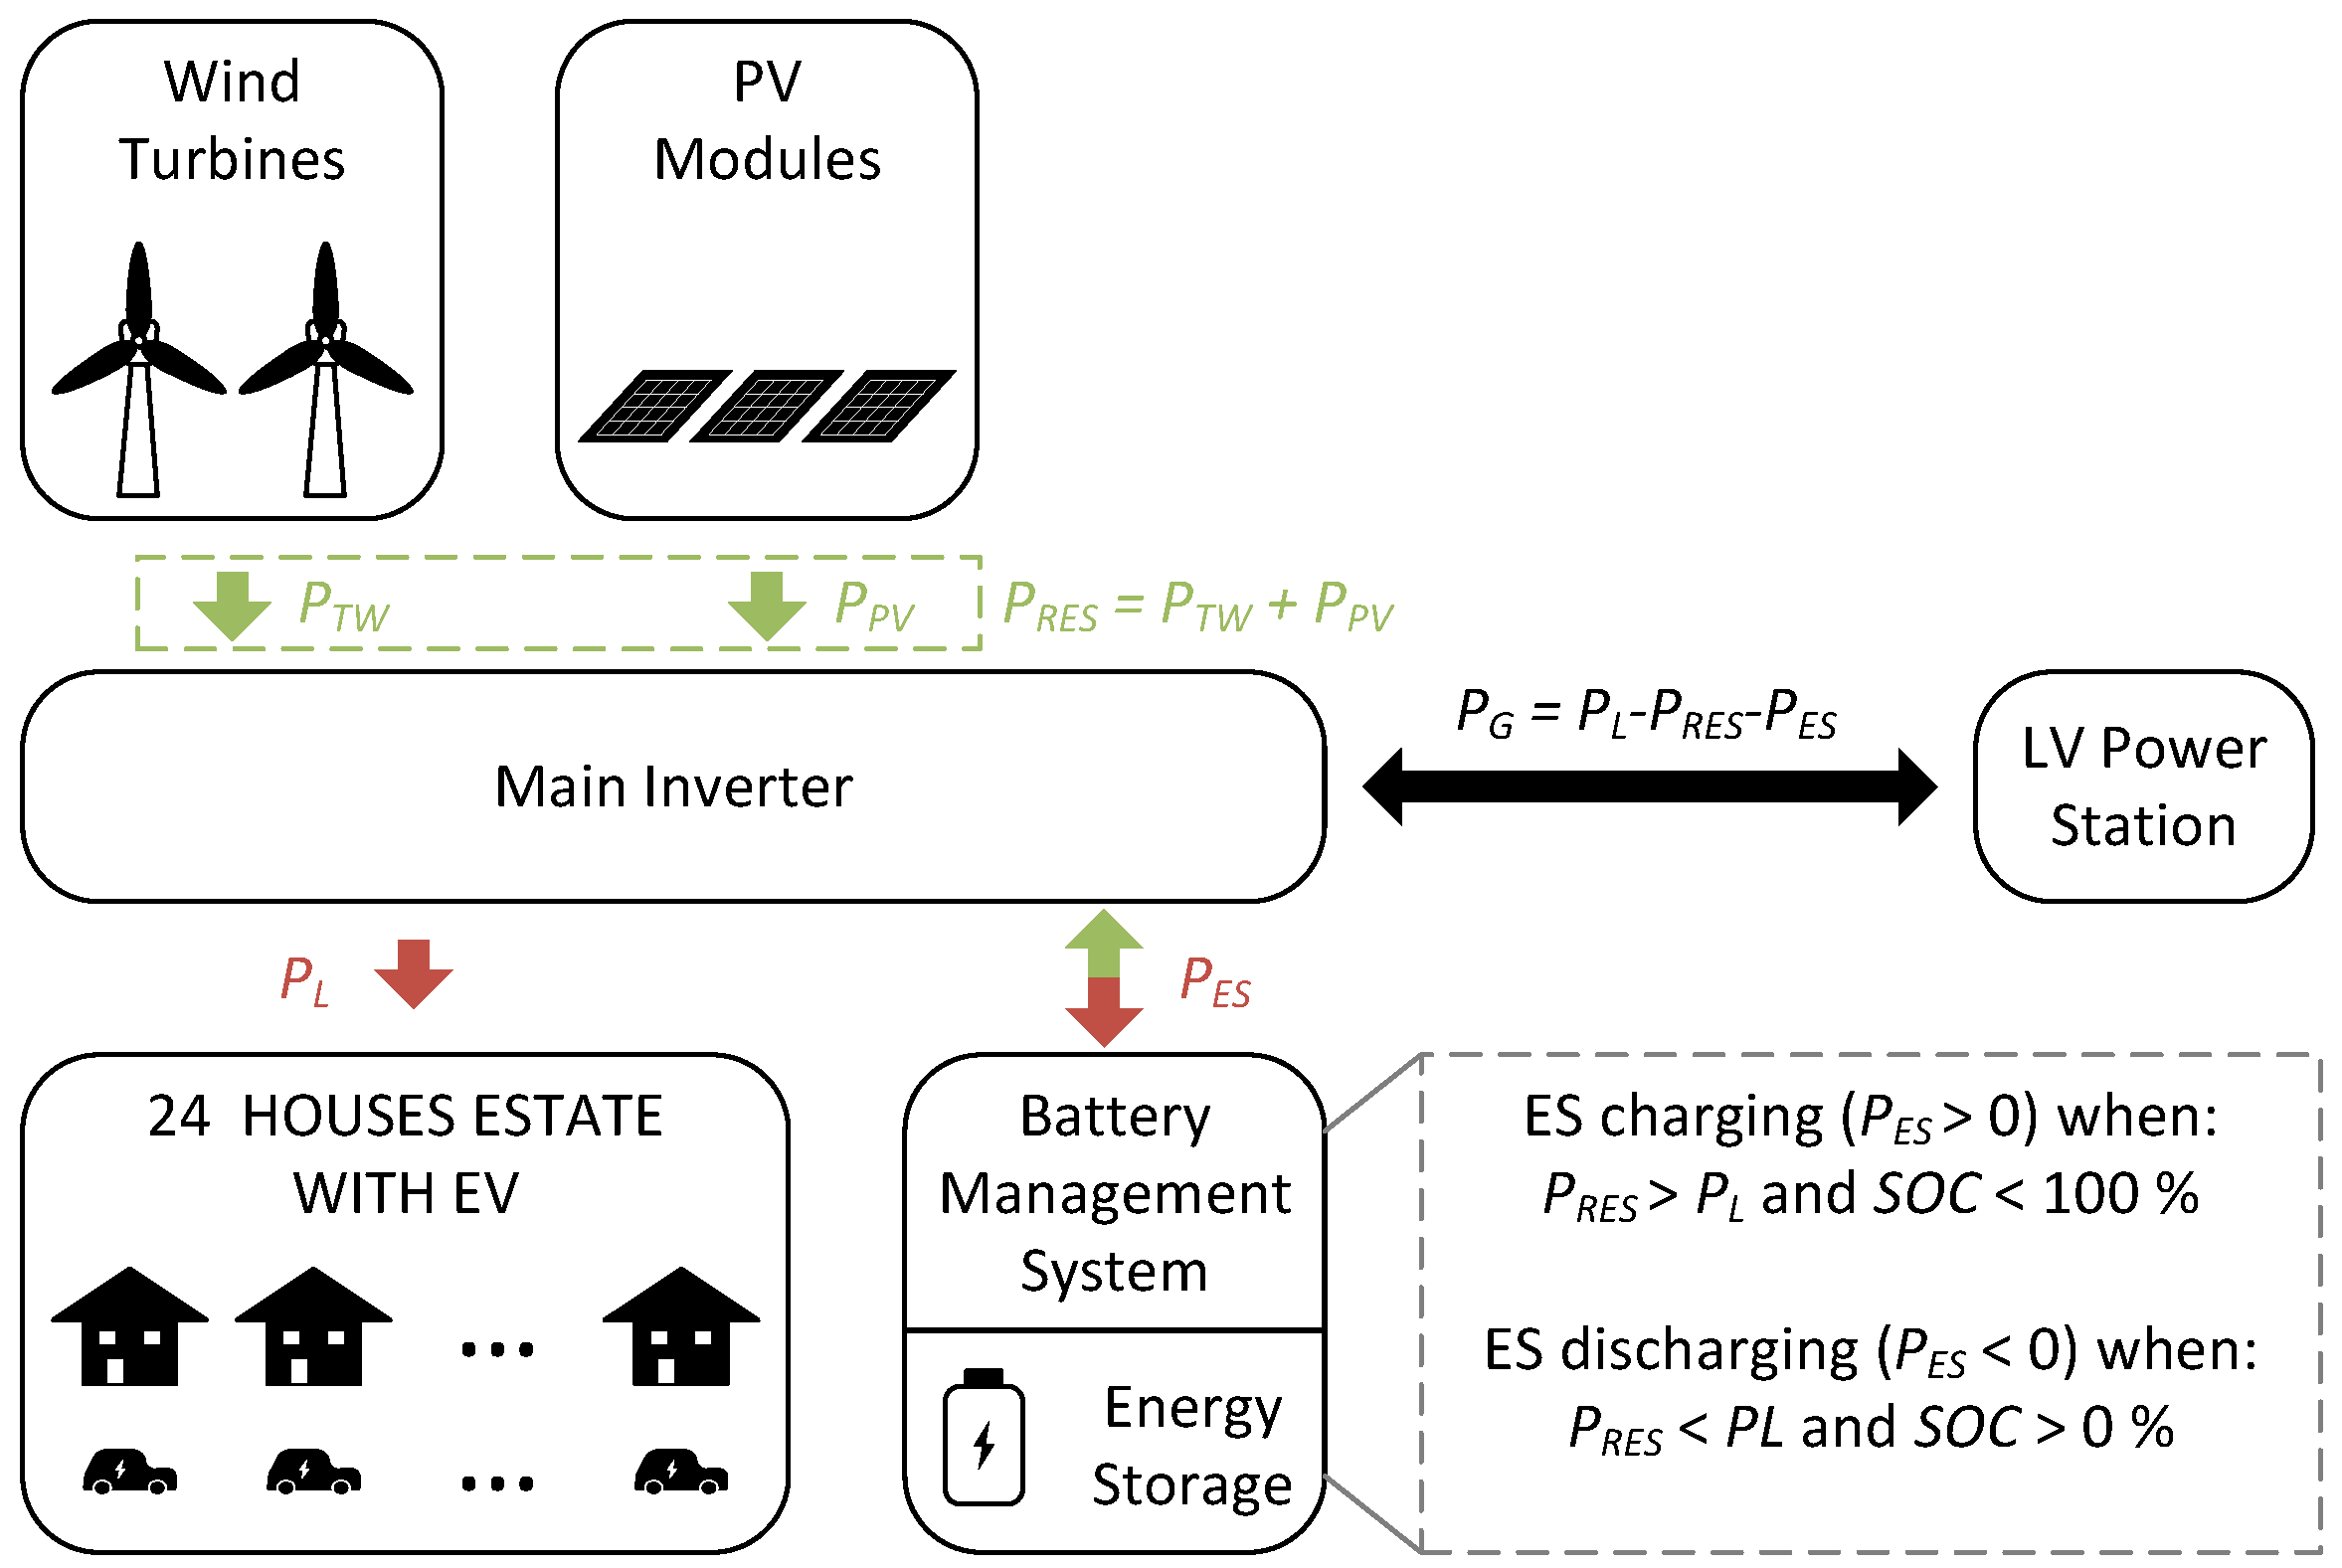
Figure 3 shows the general electrical structure of the analysed generation system with an electrochemical energy storage designed to supply the consumer described in Section 2. The PV and wind generator sections and the energy storage system are connected to the hybrid inverter, which allows the system to be synchronised with the grid (on-grid system). This means that in the case of a power deficit (taking into account the operation of the storage system), energy is taken from the grid (purchase), and in the case of overproduction, energy is transferred to the grid (sale).
The generation system comprises two sections: a solar section and a wind section, with a total capacity of Pn. The solar section consists of PV modules placed on the ground on a support structure inclined to the ground at an angle of 37° degrees facing south. Vertical axis wind turbines are installed on the north side of the area, so as not to obscure the PV section, on masts with a height of h W T = 20 m a.s.l. The total rated output of the generation system is P R E S n and is the sum of the output of the PV P P V n section and P W T n section. The energy storage used is a lithium-ion structure built in the form of a container with its own inverter installed.
The consumers are powered, depending on the level of generation in the RES system, the state of charge of the energy storage and the load level, by three sources: the RES system, the energy storage and the power grid (hereafter referred to as the grid). The momentary powers of individual elements of the system depend on the implemented operation strategy of the energy storage. In the case under consideration, its purpose is to limit the amount of energy transferred from the RES system to the grid and to increase the self-consumption factor. The storage is charged only in the case of excess generation from the RES section in relation to the load power ( P R E S > P L ), and it is discharged in the case of a power deficit in the system ( P R E S < P L ), taking into account the current state of charge. In situations where RES generation and energy storage discharge do not cover the load P L , the power difference P G is taken from the grid. In the case of excess RES generation and full charge of the energy storage, power P G is also transmitted to the grid. The energy storage is not involved in processes of supervised energy trading, e.g., the sale of energy during peak load periods, nor does it ever return energy to the grid. Taking the above into account, the relationships between the electrical powers of the individual system components at time t are described by the following relationships:
P R E S t = P P V t + P W T t
P G t = P L t P R E S t P E S t
where P R E S , P P V , P W T , P L , P E S —instantaneous values of power generated in RES; solar sections; wind sections; load, taken from the grid (+) or returned (−) to the grid; and energy storage charging (−) or discharging (+). The nature of the analysis carried out as part of the research is energy-related and requires the use of measurement data of wind speed (vw), irradiance ( G r ) and ambient temperature ( T a ), as well as the development of a mathematical and numerical model of the system under analysis. Only the elements necessary in this context were implemented in the model, thus limiting the calculation time, which is particularly important when considering the solution of a multicriteria optimisation task.
On the basis of the relationships between (1) and (2), calculations of the power in the system elements for any moment t can be performed, as well as taking into account the entire period of analysis (one year); the total amounts of energy generated in the RES A R E S , taken from and returned to the A F G and A T G grid; and the energy sent to the A T M E and taken from the A F M E storage. These values are used in the optimisation calculations concerning the structure of the hybrid generation system, the details of which are discussed in the further sections of this thesis.

4. Input Data and Model of the Generation System with Energy Storage

4.1. Measurement Data

The input data for the ongoing energy analyses of the system in Figure 3 include wind speed ( v W ), irradiance ( G r ) and ambient temperature ( T a ). These data were obtained from the NASA Langley Research Center (LaRC) POWER Project funded through the NASA Earth Science/Applied Science Program. Data sets were obtained for three locations in Poland (Figure 4)—A: Baltic coast (54.51° N, 16.86° E), B: Lublin Uplands (51.21° N, 23.39° E) and C: Carpathian Foothills (49.58° N, 20.72° E). The indicated locations significantly differ with regards to wind and solar energy resources. Figure 4 shows the location of the indicated points on a map of Poland. The data used have a one-hour resolution and cover the period between 1 January 2021 and 31 December 2021 (one year). Average annual irradiance, wind speed and air temperature for locations A, B and C in the year 2021 are given in Table 1. The site load profiles, with an identical 1 h step, correspond to the G11 tariff published by the Polish operator, ENEA [25].
Due to the one-hour step of the analysis, it was assumed that the i-th number of the measurement data sample corresponds to time t = i h from the beginning of the analysis, i.e., from 0:00 on 1 January 2021. The models of the system components developed and characterised below are in discrete form—the i-th sample is denoted by the symbol i .

4.2. Wind Turbine Model

In energy analyses, the wind turbine is modelled using its power characteristic P W T = f ( v w ( h W T ) ) related the output electrical power P W T , with the wind speed v w i at the rotor centre height hWT. The characteristic given in discrete form describes the output powers given for total wind speeds v W i ( v c u t i n ; v c u t o u t ) , where v c u t i n and v c u t o u t are the turbine start and shutdown speeds, respectively. The power P W T ( i ) for any wind speed v W ( i ) lying between two characteristic points A ( v 1 , P 1 ) and B ( v 2 , P 2 ) is determined on the basis of the following relationship [26]:
P W T i = P v 1 + P v 2 P v 1 v 2 v 1 v w i v 1 for v c u t i n v w i < v w n P W T n for v w n v w i < v c u t o u t 0 for other
where v 1 , v 2 —wind speed from the wind turbine power discrete characteristics, where the wind speed ( v W ( i ) v 1 , v 2 ) falls in between; P v 1 and P v 2 —wind turbine power values corresponding to wind speed v 1 and v 2 ; and v w n —wind speed which enables reaching the wind turbine rated power P W T n .
In accordance with (3), linear interpolation is used to determine power P W T . Figure 5 shows the discrete power characteristic of the wind turbine with the above-described characteristic points and the linearly interpolated characteristic area (green section).
Due to the strong dependence of wind speed on height above ground level, the measurement data were converted to the actual height of the turbine according to the exponential relationship [27]:
v W T ( i ) = v w ( i ) h W T h M α
where v W T ( i ) —converted wind speed (i-th sample) for the rotor centre height (m/s), v w ( i ) —wind speed (i-th sample) at the measurement height (10 m above sea level) (m/s), h W T —height of installation of the wind turbine rotor centre (m), h M —height of wind speed measurement (m) and α —coefficient related to the roughness (type) of soil.

4.3. Model of PV Modules

In order to analyse the operation of PV modules, a two-diode model of photovoltaic cells was used. The model is described by the following relationships [28]:
I = I p h I s 1 e q U + R S I N 1 N k B T 1 I s 2 e q U + R S I N 2 N k B T 1 U + R S I R P
I p h = I p h 0 G r G r 0 α T T S T C
where I, U—current and voltage on the PV cell terminals, I p h 0 —solar current generated at the actual irradiance G r and at the PV module surface temperature T, I p h 0 —solar current generated at irradiance G r 0 , G r —actual irradiance on the PV cell surface, I s 1 , I s 2 —saturation currents of the first and second diode, N 1 , N 2 —coefficients of quality of the first and second diode, R S —series resistance, R P —parallel resistance, k—Boltzmann constant, T—PV cell temperature and q—electron elementary charge.
The cell surface temperature T is determined on the basis of an empirical formula presented in the paper in [29]:
T = T a + ω 0.32 8.91 + 2 v w G r
where T a —ambient temperature (synchronised with the irradiance and wind speed data), G r —irradiance on PV module surface, v w —wind speed at the height of the PV installation and ω —coefficient of the PV system mounting method ( ω = 1 —standalone system, ω = 1.2 —on a flat roof and ω = 1.8 —on a sloped roof).
Modelling the modules and their interconnection groups involves solving a system of Equations (5)–(7)) using the Newton–Raphson method, determining a family of current–voltage characteristics for different irradiances (in the range between 50 W m 2 and 1500 W m 2 with a step of 50 W m 2 ) and ambient temperatures T a , determining the maximum power P m a x = f ( G r ) and approximating, with the mean square method, the module power for any irradiance G r , which allows for the modelling of the operation of the MPP tracker system. For the i-th sample of irradiation G r , the power generated by the module is read from the determined characteristic P m a x = f ( G r ) , which, with a known number of modules, also means the power of the photovoltaic system PPV.

4.4. Energy Storage

The energy storage model used in the analyses takes into account the energy capacity A E S ; the limitation of the charging ( P m a x c h E S ) and discharging ( P m a x d c h E S ) power (current) values; the energy conversion efficiency in the charging and discharging cycle, which also includes the efficiency of inverters η E S ; the self-discharge process ( P S D C H ); and the allowable depth of discharge. Figure 6 shows a general model of the energy storage taking into account the parameters indicated above.
The discrete energy storage model determining the energy stored in the storage for the i-th time step considering the previous state (step i 1 ) takes the following form:
A E S i = A E S i 1 + η E S P E S i Δ t energy storage charging A E S i 1 P E S i η E S energy storage discharging
where P E S ( i ) —the average power of the energy storage taken from or returned to the grid (at the output of the power electronic systems) for the i-th step and η E S —the charging and discharging efficiency of the energy storage.

4.5. Converter Systems

The most important parameter of converter systems in power analyses is their efficiency. In the model analysed here, this is captured in the form of efficiency characteristics as a function of the ratio of system output power to rated power.

5. Multicriteria Optimisation of a Hybrid Generation System with Energy Storage to Supply a Housing Estate Consisting of Terraced Houses

Actual optimisation problems are often complex in nature, leading to the search for solutions which simultaneously satisfy two or more often conflicting criteria [30]. Efficient determination of a solution in such a case requires the use of multicriteria optimisation methods looking for solutions in the set of all admissible solutions X —those that are not dominated by other solutions [30]. In the case of M of the analysed criteria, solution x 1 dominates solution x 2 ( x 1 x 2 ) when it is not worse in all criteria and there is at least one criterion in which solution x 1 is better than solution x 2 f ( x 1 ) f ( x 2 ) .
In this approach, the optimisation task boils down to determining the so-called Pareto front [30,31], which is a set of solutions from which, using expert knowledge, one final solution can be determined. The optimisation problem indicated above can be expressed mathematically as [30]
min / max f m x , m = 1 , 2 , , M at g j x 0 , j = 1 , 2 , , J h k x = 0 , k = 1 , 2 , , K
where m, j, k—indices, M—number of optimised criteria, J—number of inequality constraints, K—number of equality constraints, N—number of decision variables and x = { x 1 , x 2 , , x N } —vector of decision variables.
In order to solve the multicriteria task presented in this way (9), evolutionary methods are suitable, as they allow a set of solutions to be processed in one step and thus make it possible to determine a set of points in one run, rather than a single point belonging to the Pareto front [28].
The problem solved in this paper is the search for the optimal structure and operating parameters of a hybrid generation system with RES and energy storage in the case of a known geographical location and load characteristics of the facility being powered in terms of minimising the energy capacity of the energy storage ( k 1 ), minimising the energy exchanged with the power grid ( k 2 ) and maximising the self-consumption factor ( k 3 ). The decision variables in the case under consideration are the number of PV modules with rated power P P V n x 1 , the number of wind turbines with rated power P W T n x 2 and the number of electrochemical battery modules with unit capacity A n E S x 3 . The criteria listed above can be expressed in the following form:
k 1 x = A E S = x 3 · A n E S
k 2 x = A F G x + A T G x
k 3 x = A R E S A T G A R E S
where A E S —total net energy capacity of the energy storage system, A R E S —electricity generated in the PV and wind sections during the analysed period (one year), A F G —electricity taken from the grid and A T G —electricity transferred to the grid from the hybrid system during the analysed period (one year), determined from the following relationship:
A R E S = i = 1 8760 P P V i + P W T i Δ t
A F G = i = 1 8760 P L i P P V i P W T i P E S i Δ t ; i : P L i P P V i P W T i P E S i > 0
A T G = i = 1 8760 P L i P P V i P W T i P E S i Δ t ; i : P L i P P V i P W T i P E S i < 0
The storage charging and discharging power results from the instantaneous state of the system ( P P V and P W T powers and state of charge ( S o C )). Its value is limited by maximum power P E S m a x , which results from the discharge and charge with the maximum current of 1C. This allows for a long storage life [32].
The solved optimisation task has the following form:
min k 1 x , k 2 x , k 3 x at P P V m a x P P V n 0 P T W m a x P T W n 0 A E S m a x A E S 0
where P T W m a x —maximum power of installed turbines, P P V m a x —maximum power of installed PV cells and A E S m a x —maximum energy storage capacity.
In order to determine the values of the criterion functions from k 1 to k 3 , in each optimisation step, full energy calculations are performed for a specific configuration of the generation system (power of the PV section, wind section and energy storage capacity). The calculations use the models of the system components presented in Section 4 of this article.

6. Description of the Tests Carried Out and Results Obtained

In order to solve the problem indicated above, the MPSO multicriteria method was used, which has been characterised in detail in the paper in [33]. Its basic parameters (Table 2) were established experimentally and led to obtaining repeatability of the quality of determined solutions (Pareto fronts) in the analysed task.
The study involved 12 numerical experiments involving the optimisation of the structure of the system from 
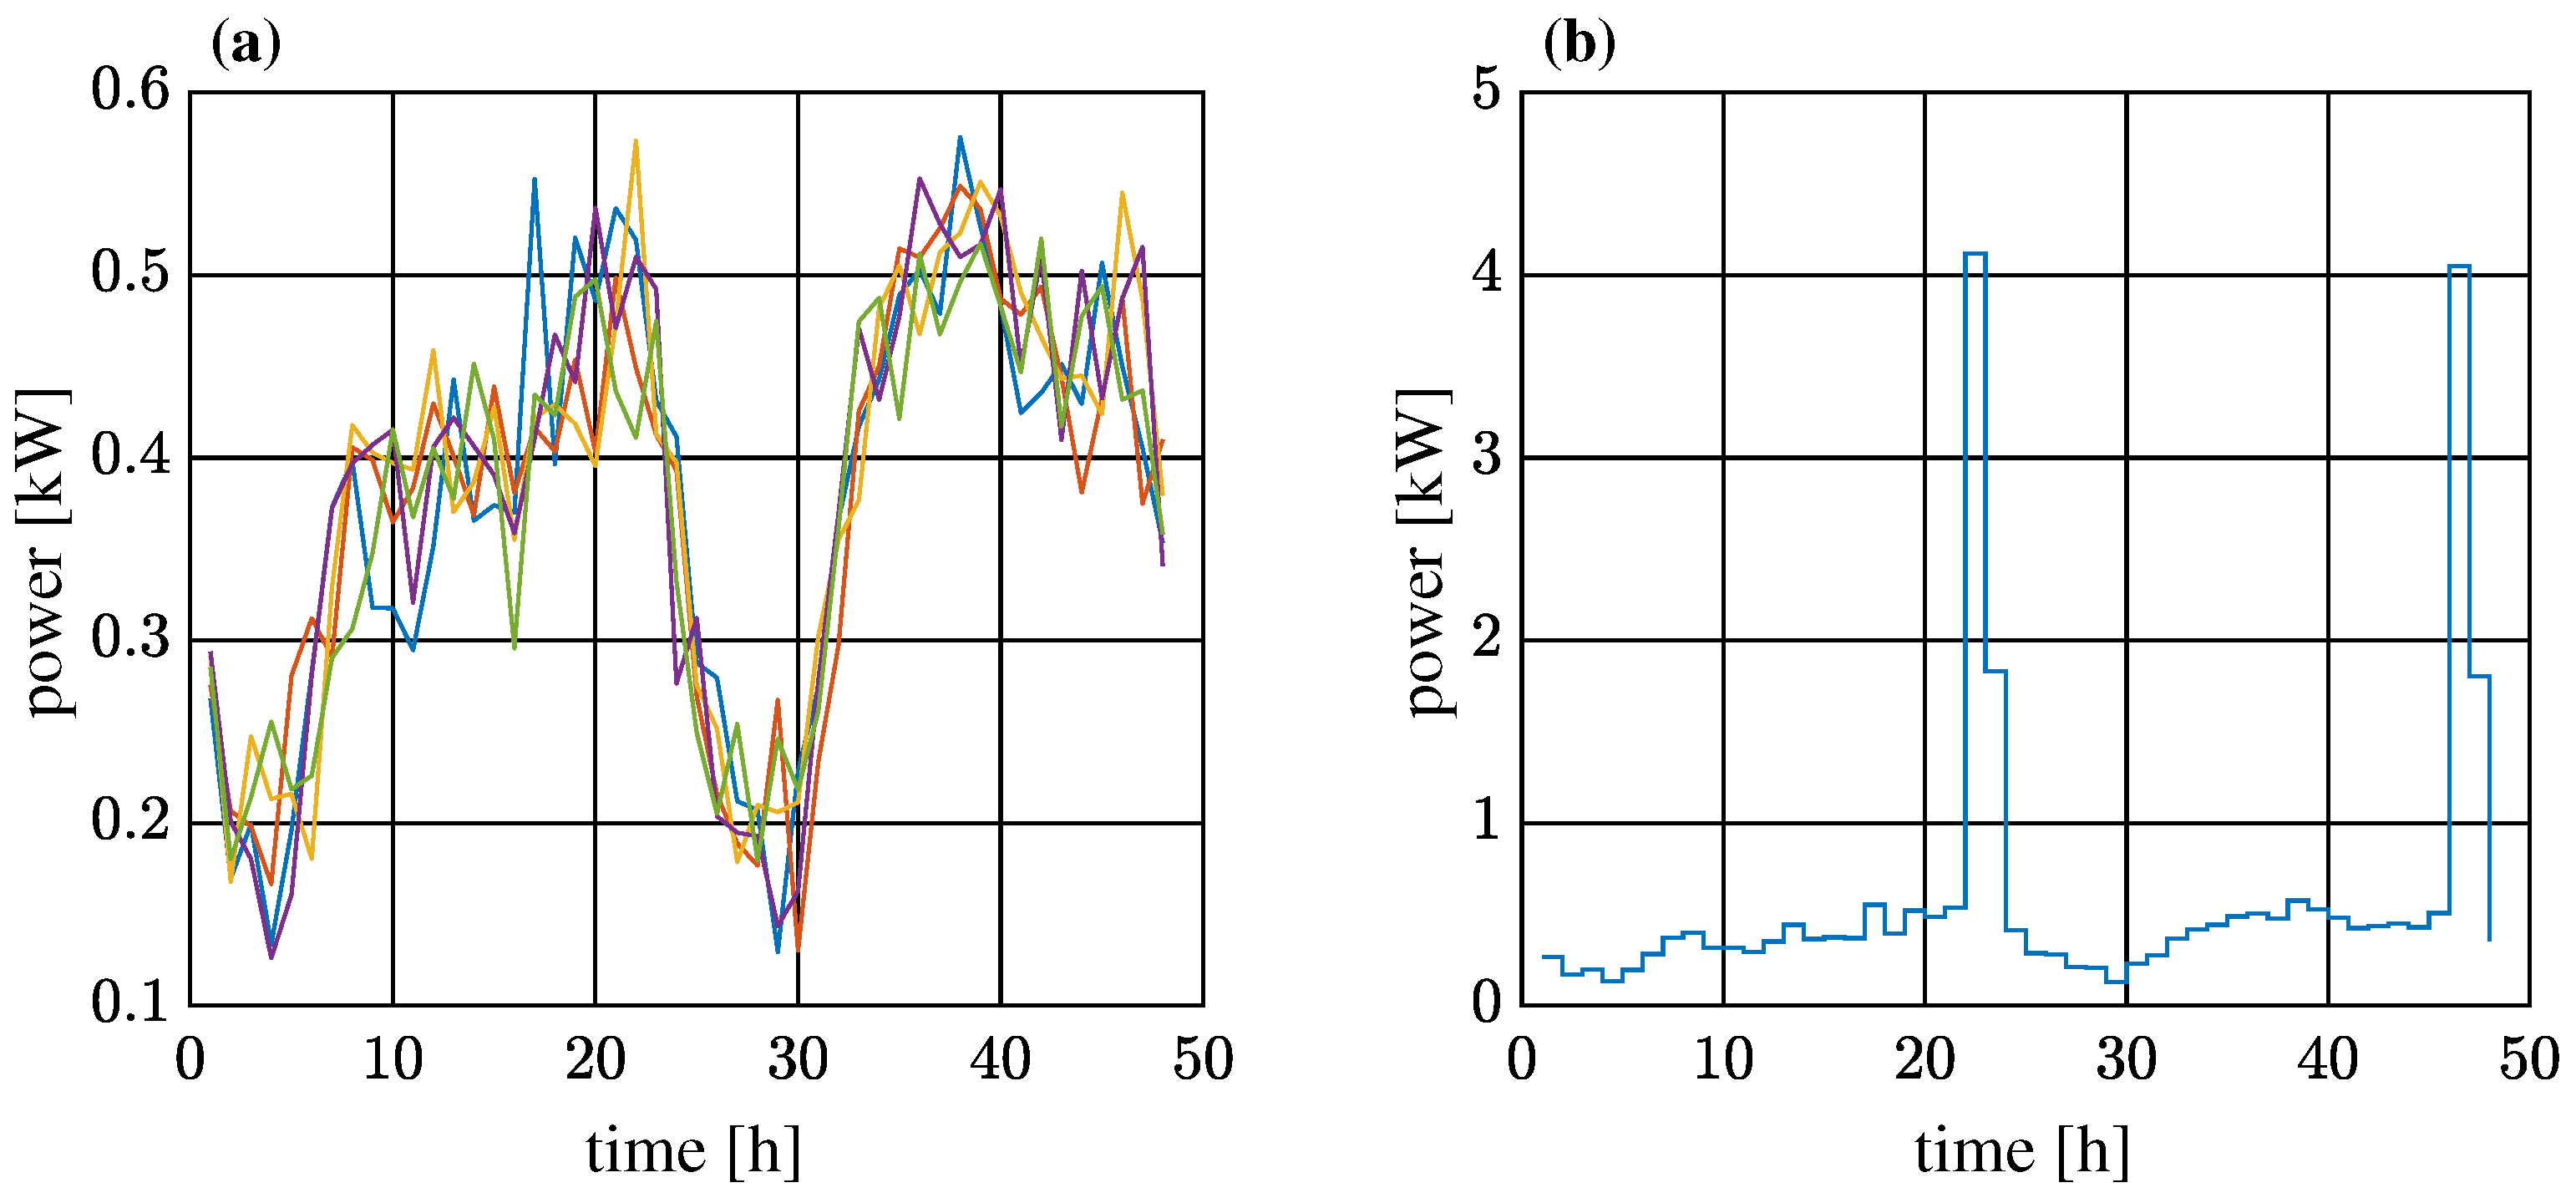
Figure 3 for 3 locations (point 4) and for 4 load scenarios considering different levels of electromobility development:
  • Scenario 0: houses have no electric vehicles (reference variant);
  • Scenario I: half of the houses have an electric vehicle (12 EVs) with an average energy intensity of 18 kWh/100 km and an average daily mileage of 30 km;
  • Scenario II: each house has an electric vehicle (24 EVs) with the energy intensity indicated above and a daily mileage of 30 km;
  • Scenario III: each house has an electric vehicle (24 EVs) with the energy intensity indicated and an average daily mileage of 50 km.
In the calculations, 500 W PV modules, vertical axis wind turbines with a rated power of 5 kW and lithium-ion storage sections with a net unit capacity of 10 kWh were used. The maximum charging and discharging power for an energy storage system with a capacity greater than or equal to 20 kWh is 20 kW. The energy storage systems are built in the form of a container (including the cooling and heating system), and their rated net energy capacities are multiples of the 10 kWh modules. The details of the modules, turbines and energy storage systems are given in Table 3, Table 4 and Table 5.
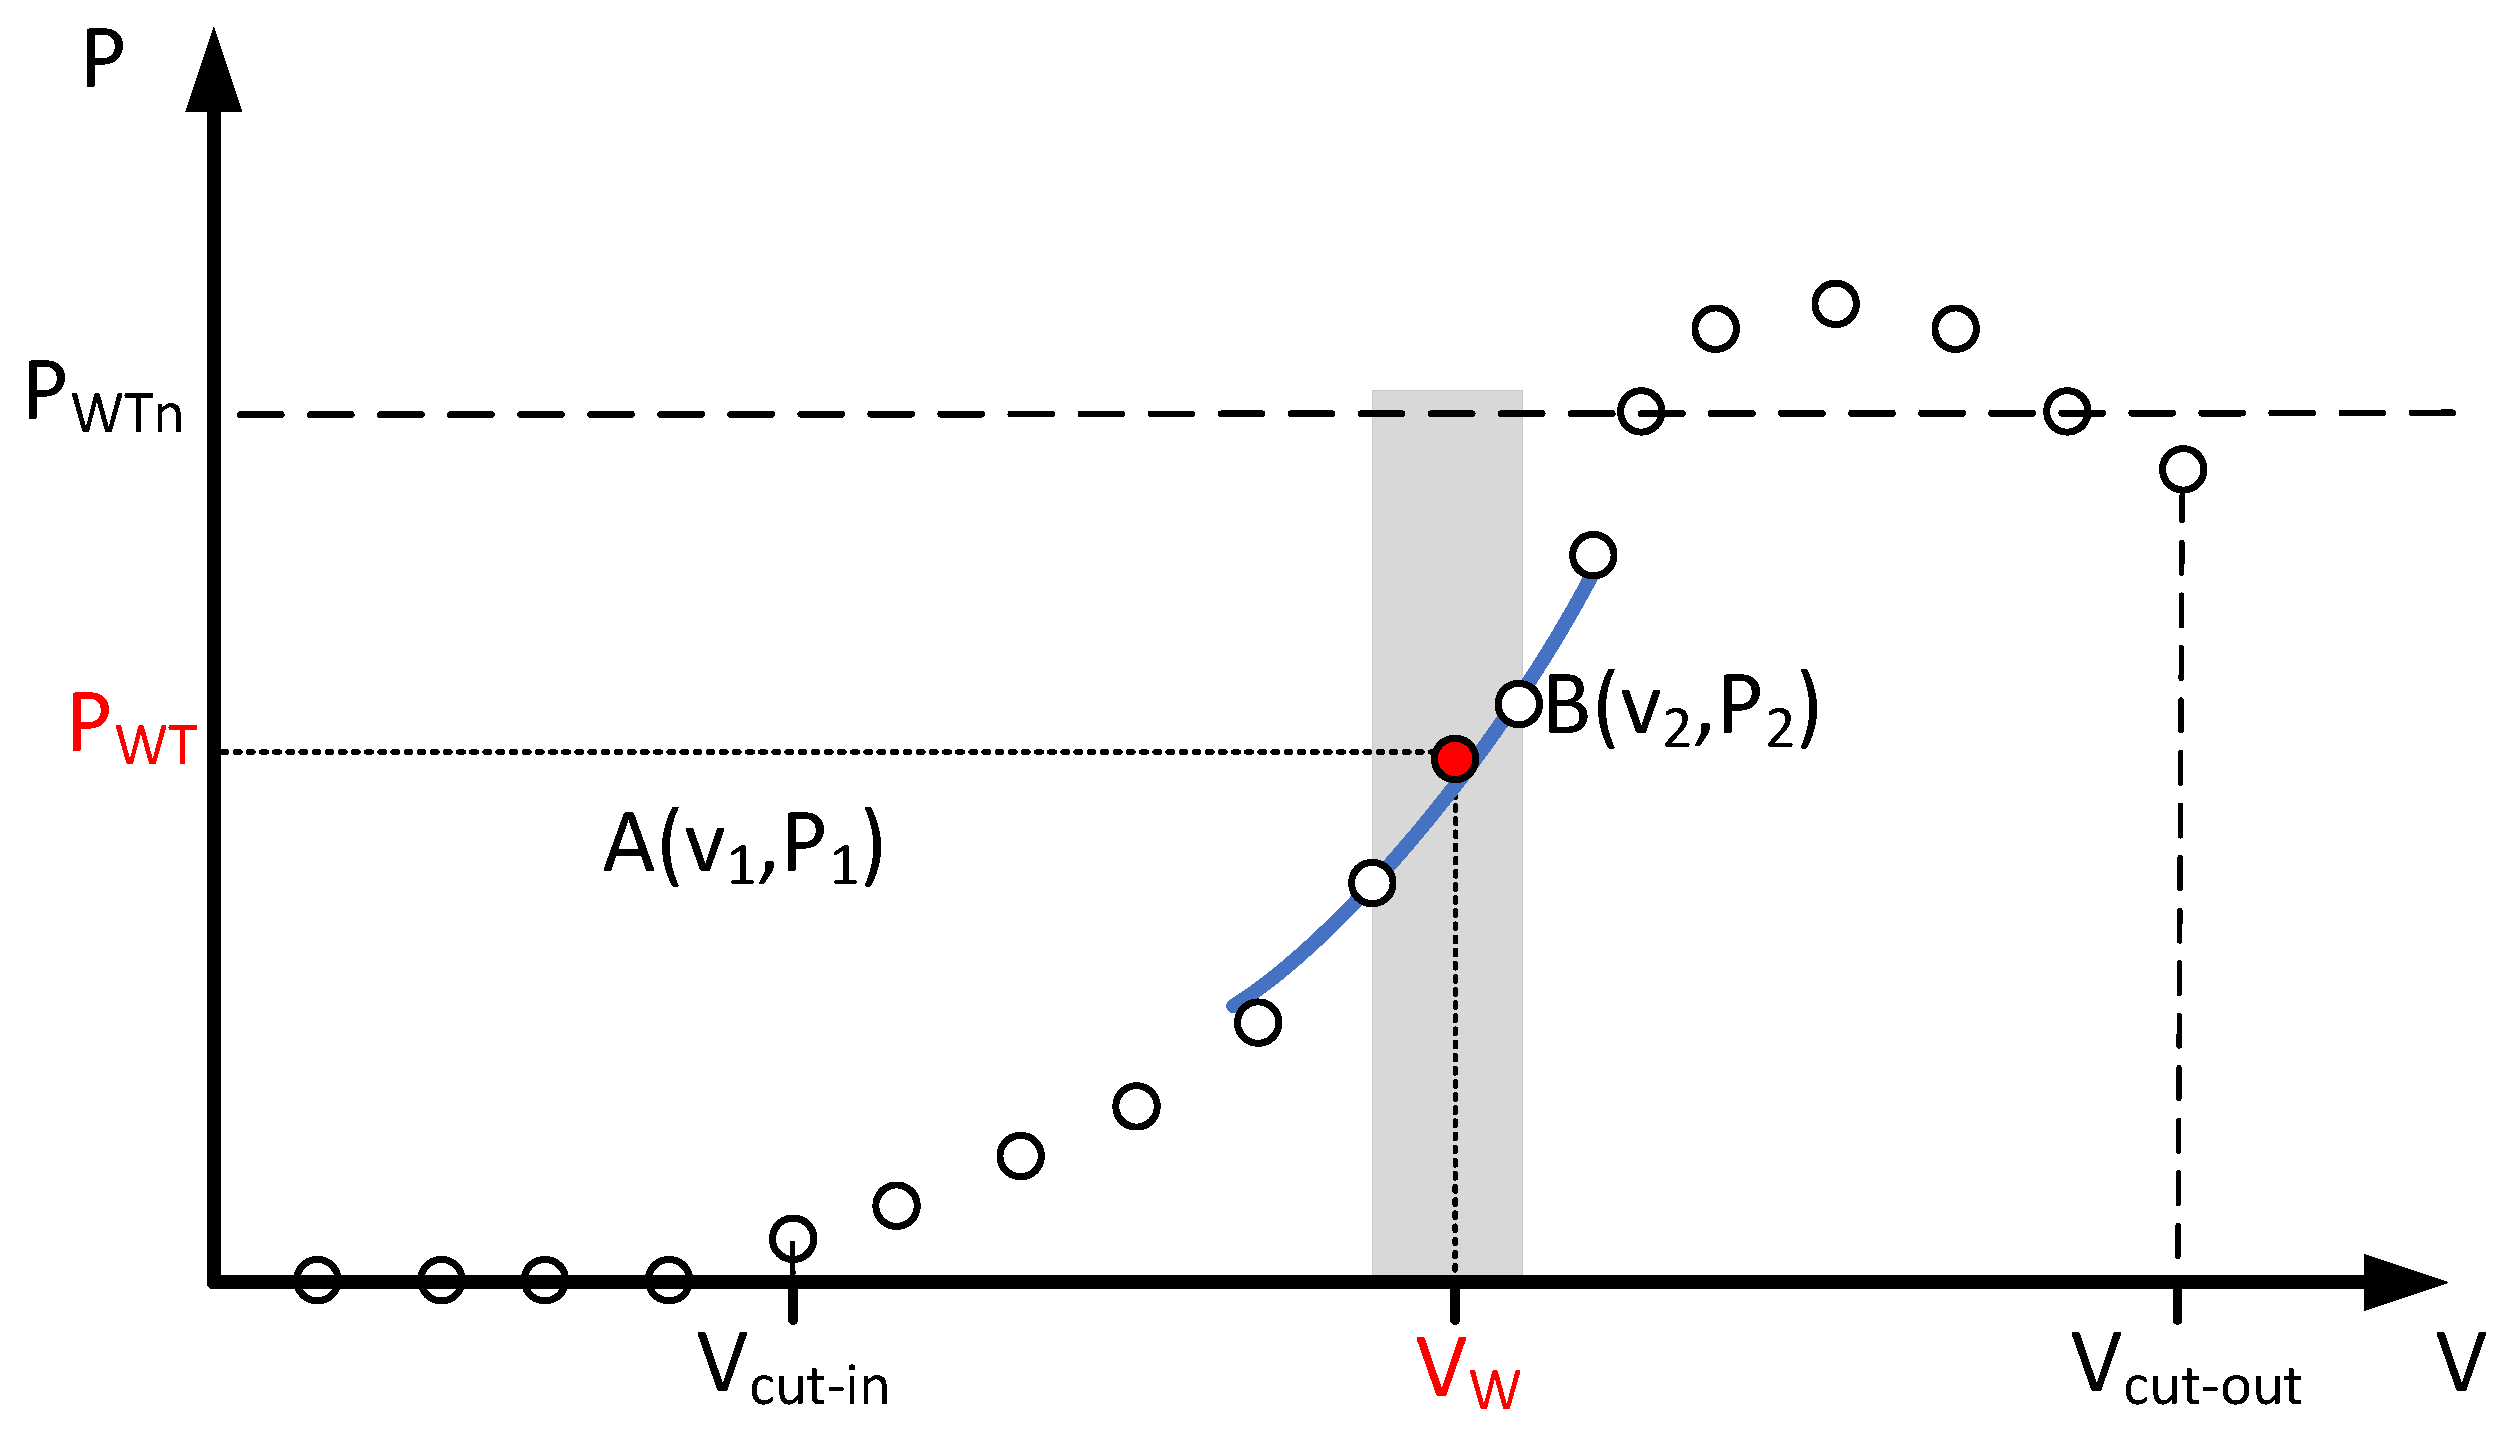
Figure 7 shows the power characteristics of the wind turbine used.
Vehicle charging processes are taken into account by the addition of a constant power, with a value and duration ensuring that the vehicles are topped up to SoC = 100%, at randomly determined times in the afternoon and at night. The maximum charging powers for each vehicle, depending on the charger (3.6; 7.4; 11 or 22 kW), are selected at random. The results of the optimisation of the variants indicated above for location A, in the form of Pareto fronts in the three-dimensional space k 1 , k 2 and k 3 , are shown in Figure 8.
Each of the designated Pareto fronts contains 100 solutions, from which the selection of the final one requires the application of expert knowledge and an additional criterion. Taking into account the end-user requirements for the type of generation systems analysed, it was assumed that economic aspects were the key determinant for the installation of generation systems with RES. Therefore, for each solution, given a system lifetime of 20 years, NPVs (net present values) were established using the following relationship [34]:
N P V ( k ) = t = 1 k C F t 1 + r t I 0
where t—year index (for analyses t = 0 , 1 , 2 , , 20 was assumed, whereby the year “0” is the investment year), r—rate of return (discount rate) determined on the basis of loan interest levels, C F t —net cash flows in year t, I 0 —investment cost (in the year 0) and k—year of determination of the NPVs.
The economic calculations take into account the expected change in electricity and fuel prices over the following years and the annual decrease in energy generation from PV systems. In the 10th year of operation, the batteries in the energy storage are replaced, the value of which is 0.7 of the investment cost of the energy storage. The parameters adopted for the economic calculations are shown in Table 6.
Further analysis in each Pareto front is carried out on the set of solutions that meet the payback condition of no more than 10 years from the start of operation. In order to select the final solution of the task, for individual locations and scenarios, two additional parameters (expert criteria) were considered: minimum payback period (basic criterion—minimised) and NPVs after 20 years of operation per house (supplementary criterion—maximised).
For location C only, due to low wind and solar resources, some of the results include solutions with payback times of more than 10 years. Exemplary solutions for locations A to C, taking into account the four calculation scenarios (electromobility development), are shown in Table 7, Table 8 and Table 9. For each location and scenario, the final solution (the best from the perspective of the adopted additional criterion) is highlighted in grey in the tables.
Additionally, Table 10, Table 11, Table 12 and Table 13 provide a comparison of the final solutions (grey rows from Table 7, Table 8 and Table 9) for Scenarios 0, I, II and III and different locations of the generation system.
Figure 9, Figure 10 and Figure 11 show the changes in NPVs as a function of the year of operation of the systems for the final solutions (calculations carried out for the data in Table 9, Table 10, Table 11 and Table 12) for locations A, B and C and scenarios 0, I, II and III, respectively.
Figure 12 provides a comparison of the rated power Pn of the system, the energy storage capacity AME and the percentage share of the power of PV and wind sections for the final solution, as well as the locations considered and the electromobility development scenarios. The dotted lines in the figures indicate the average values.

7. Summary

The multiobjective particle swarm optimisation used in this research, as one of the population heuristic methods, allows for the determination of the entire set of solutions constituting the Pareto front within a single run of the algorithm. However, its characteristics lead to variations in the results in different runs of the algorithm. Therefore, preliminary tests were carried out to determine the parameters of the MPSO algorithm which would lead to the reproducibility of the quality of the obtained sets of solutions. The selection of the final solution from the set of Pareto-optimal solutions was conducted taking into account the so-called expert criterion using two additional conditions: minimisation of the payback period of the investment and maximisation of the profit after 20 years of operation.
A significant challenge to the current states and structures of power grids in many countries is the development of electromobility, associated with the increase in the number of motor vehicles being charged from the domestic (low-voltage) grid. Research shows that this will significantly disrupt existing load profiles, increasing the disproportion between electricity demand during the daytime and afternoon/evening periods. Particularly high energy demand is anticipated during periods with less or no PV system generation. However, research carried out indicates that it is possible to achieve a very high (well over 80%) self-consumption rate in the type of hybrid system analysed, not only through the use of energy storage but also by incorporating sufficient wind generator capacity into the system. The inclusion of the minimisation of the amount of energy exchanged with the grid as part of the optimisation criteria and the currently observed price disproportion between energy purchased from the grid and that sold to the grid (the research assumed a ratio of 3.6:1—based on analysis of official data from Towarowa Giełda Energii between July 2022 and August 2022) are leading to solutions that are increasingly self-sufficient in terms of the electricity generated and consumed.
Even different locations within one country have different wind and solar energy potentials; this results in the necessity to design hybrid generation systems with different structures in terms of PV and wind section power and storage capacity in order to achieve their equal functionality. This paper demonstrates that for three locations in Poland (A—Baltic coast, B—Lublin Uplands and C—Carpathian Foothills) and the considered scenarios related to the number and daily mileage of home-charged electric vehicles, the structures of hybrid systems that are final solutions to the optimisation task considered differ significantly.
The smallest wind section capacities in the optimised structure of the hybrid system, regardless of the scenario of electromobility considered, were obtained for location A. At location C, the rated outputs of the system were significantly higher than at the other locations. In terms of the selection of energy storage systems, the largest energy storage capacities were required, for each scenario, at location C, and the smallest at location A. This is due to the partial overlap between the load characteristics, including vehicle charging (the highest loads) and the daily deterministic trend of wind turbine energy generation. It can therefore be concluded that an increase in the share of wind generators in the rated output of small-scale generation systems can lead, with an increase in the number of electric cars being charged at home, to an increase in the self-consumption rate and an improvement in the economic balance of the system. This applies, of course, to locations that guarantee good or very good wind conditions. The differences in energy storage capacities in the final solutions between locations A and C were, for any scenario involving EV charging, very large and reached up to 8000% (Figure 12b).
The differences in the payback period for the extreme (in terms of energy resources) locations A and C are also significant. Depending on the scenario, the period varies from 4 (location A) to 12 (location C) years. This also entails differences in profit after 20 years of operation—for the worst (in terms of energy resources) location C, the differences relative to location A ranged between 37% and 59%. When analysing the payback period for any scenario of locations A and B, the final solutions give satisfactory results, with the period varying from 4 to 7 years. From an economic point of view, this is a very good result, which puts these types of systems in a good position in the context of skyrocketing electricity and fuel prices, as well as partial independence from the grid. In comparison with other solutions belonging to the Pareto front, the return on investment within a few years is very good, as the set of solutions established through optimisation also includes systems that do not pay for themselves, even within the assumed 20-year period.
The shortest payback period and the highest profits per house (after 20 years of operation) were obtained for location A. A particularly good fit of the system structure was obtained for scenario 2, for which the profit was the highest, reaching EUR 23,300, and the payback period is only 5 years.
In the task under consideration, no attempt was made to develop an algorithm for internal billing of individual consumers (houses). The energy calculations were performed globally—for one consumer, with a load characteristic representing the sum of the loads of individual houses using a random variation of the profiles for houses and the power and charging hours of electric vehicles. An important issue is also the inclusion of a storage operation strategy that allows a group of consumers to actively participate in energy trading during short billing periods. This should enable the economic balance of hybrid generation systems with an energy storage system to be further improved. At present, however, it is difficult to determine whether the payback period will be shortened or whether the profit after 20 years of system operation will increase.

Author Contributions

Conceptualisation, A.T.; methodology, A.T. and S.M.; software, S.M. and A.T.; validation, K.W., A.P. and S.S.; formal analysis, A.T. and K.W.; writing—original draft preparation, A.T., S.M. and S.S.; writing—review and editing, S.M. and S.S.; visualisation, S.M. and A.T.; supervision, A.T. and S.M. All authors have read and agreed to the published version of the manuscript.

Funding

This research received no external funding.

Data Availability Statement

Not applicable.

Conflicts of Interest

The authors declare no conflict of interest.

References

  1. Sowa, S. The capacity market and its impact on the development of distributed energy sources. Polityka Energetyczna Energy Policy J. 2019, 22, 65–80. [Google Scholar] [CrossRef]
  2. Koskela, J.; Rautiainen, A.; Jarventausta, P. Using electrical energy storage in residential buildings—Sizing of battery and photovoltaic panels based on electricity cost optimization. Appl. Energy 2019, 239, 1175–1189. [Google Scholar] [CrossRef]
  3. Ahmad, A.; Anderson, T.N.; Lie, T.T.; Swain, A.K. Maximizing Photovoltaic Array Energy Usage Within a House Using Model Predictive Control. In Proceedings of the 2017 Asian Conference on Energy, Power and Transportation Electrification (ACEPT), Singapore, 24–26 October 2017. [Google Scholar] [CrossRef]
  4. Sowa, S. Efficiency of the RES Hybrid Microinstallations Working in Energy Clusters. MATEC Web Conf. 2020, 328, 03016. [Google Scholar] [CrossRef]
  5. Pehlivanova, T.I.; Atanasov, A.K. Feasibility analysis of autonomous hybrid solar-wind system for household consumption: A case study. IOP Conf. Ser. Mater. Sci. Eng. 2021, 1031, 012043. [Google Scholar] [CrossRef]
  6. Pontes, L.; Costa, T.; Souza, A.; Dantas, N.; Vasconcelos, A.; Rissi, G.; Dias, R.; Mohamed, M.A.; Siano, P.; Marinho, M. Operational Data Analysis of a Battery Energy Storage System to Support Wind Energy Generation. Energies 2023, 16, 1468. [Google Scholar] [CrossRef]
  7. Nascimento, R.; Ramos, F.; Pinheiro, A.; Junior, W.d.A.S.; Arcanjo, A.M.C.; Filho, R.F.D.; Mohamed, M.A.; Marinho, M.H.N. Case Study of Backup Application with Energy Storage in Microgrids. Energies 2022, 15, 9514. [Google Scholar] [CrossRef]
  8. Gitizadeh, M.; Fakharzadegan, H. Effects of Electricity Tariffs on Optimal Battery Energy Storage Sizing in Residential PV/Storage Systems. In Proceedings of the 2013 International Conference on Energy Efficient Technologies for Sustainability (ICEETS), Nagercoil, India, 10–12 April 2013. [Google Scholar] [CrossRef]
  9. Doroudchi, E.; Pal, S.K.; Lehtonen, M.; Kyyra, J. Optimizing Energy Cost via Battery Sizing in Residential PV/Battery Systems. In Proceedings of the 2015 IEEE Innovative Smart Grid Technologies—Asia (ISGT ASIA), Bangkok, Thailand, 3–6 November 2015. [Google Scholar] [CrossRef]
  10. Gao, B.; Liu, X.; Wu, C.; Tang, Y. Game-theoretic energy management with storage capacity optimization in the smart grids. J. Mod. Power Syst. Clean Energy 2018, 6, 656–667. [Google Scholar] [CrossRef]
  11. Bhayo, B.A.; Al-Kayiem, H.H.; Gilani, S.I.U.; Ismail, F.B. Power management optimization of hybrid solar photovoltaic-battery integrated with pumped-hydro-storage system for standalone electricity generation. Energy Convers. Manag. 2020, 215, 112942. [Google Scholar] [CrossRef]
  12. Soares, A.; Gomes, A.; Antunes, C.H. An Evolutionary Algorithm for the Optimization of Residential Energy Resources. In Advances in Energy System Optimization. Trends in Mathematics; Bertsch, V., Fichtner, W., Heuveline, V., Leibfried, T., Eds.; Springer International Publishing AG: Cham, Switzerland, 2017; pp. 3–16. [Google Scholar] [CrossRef]
  13. Camargo, L.R.; Pagany, R.; Dorner, W. Optimal Sizing of Active Solar Energy and Storage System for Energy Plus Houses. In Proceedings of the 11th ISES Eurosun 2016 Conference, Palma de Mallorca, Spain, 11–14 October 2017; pp. 128–139. [Google Scholar] [CrossRef]
  14. Khorram, M.; Faria, P.; Vale, Z. Optimization-Based Home Energy Management System Under Different Electricity Pricing Schemes. In Proceedings of the 2018 IEEE 16th International Conference on Industrial Informatics (INDIN), Porto, Portugal, 18–20 July 2018; pp. 508–513. [Google Scholar] [CrossRef]
  15. Dinh, H.T.; Yun, J.; Kim, D.M.; Lee, K.H.; Kim, D. A Home Energy Management System With Renewable Energy and Energy Storage Utilizing Main Grid and Electricity Selling. IEEE ACCESS 2020, 8, 49436–49450. [Google Scholar] [CrossRef]
  16. Bouakkaz, A.; Mena, A.J.G.; Haddad, S.; Ferrari, M.L. Efficient energy scheduling considering cost reduction and energy saving in hybrid energy system with energy storage. J. Energy Storage 2020, 33, 101887. [Google Scholar] [CrossRef]
  17. Hirasawa, T.; Yoshida, M.; Obara, S. Battery control for leveling the amount of electricity purchase in smart-energy houses. Int. J. Energy Res. 2021, 45, 807–823. [Google Scholar] [CrossRef]
  18. Hasankhani, A.; Hakimi, S.M.; Bodaghi, M.; Shafie-Khah, M.; Osório, G.J.; Catalão, J.P.S. Day-Ahead Optimal Management of Plug-in Hybrid Electric Vehicles in Smart Homes Considering Uncertainties. In Proceedings of the 2021 IEEE Madrid PowerTech, Madrid, Spain, 28 June–2 July 2021; pp. 1–6. [Google Scholar] [CrossRef]
  19. Friedrischkova, K.; Vala, D. Energy-independent concept of a house using an electric vehicle traction. IFAC Pap. 2016, 49, 535–540. [Google Scholar] [CrossRef]
  20. Gil, G.O.; Chowdhury, J.I.; Balta-Ozkan, N.; Hu, Y.; Varga, L.; Hart, P. Optimising renewable energy integration in new housing developments with low carbon technologies. Renew. Energy 2021, 169, 527–540. [Google Scholar] [CrossRef]
  21. Sikder, S.; Konar, G.; Chakraborty, N. Effect of Hybrid Energy Storage on Sizing of PV-Wind Standalone System using Bacteria Foraging Optimization Algorithm. In Proceedings of the 2018 20th National Power Systems Conference (NPSC), Tiruchirappalli, India, 14–16 December 2018. [Google Scholar] [CrossRef]
  22. Lin, C.C.; Wu, Y.F.; Liu, W.Y. Optimal sharing energy of a complex of houses through energy trading in the Internet of energy. Energy 2021, 220, 119613. [Google Scholar] [CrossRef]
  23. Peng, P.; Li, X.; Shen, Z. Energy storage capacity optimization of residential buildings considering consumer purchase intention: A mutually beneficial way. J. Energy Storage 2022, 51, 104455. [Google Scholar] [CrossRef]
  24. Fleischhacker, A.; Auer, H.; Lettner, G.; Botterud, A. Sharing Solar PV and Energy Storage in Apartment Buildings: Resource Allocation and Pricing. IEEE Trans. Smart Grid 2018, 10, 3963–3973. [Google Scholar] [CrossRef]
  25. Instrukcje Ruchu i Eksploatacji Sieci Dystrybucyjnej. Available online: https://www.operator.enea.pl/bricks/instrukcja-ruchu (accessed on 9 January 2023).
  26. Tomczewski, A.; Kasprzyk, L. Optimisation of the Structure of a Wind Farm—Kinetic Energy Storage for Improving the Reliability of Electricity Supplies. Appl. Sci. 2018, 8, 1439. [Google Scholar] [CrossRef]
  27. Strzelczyk, P.; Szczerba, Z.; Woźniak, A. Modelowanie pionowego profilu prędkości wiatru w tunelu aerodynamicznym. ZNPRzBiS 2015, XXXII, 413–427. [Google Scholar] [CrossRef]
  28. Kasprzyk, L.; Tomczewski, A.; Pietracho, R.; Mielcarek, A.; Nadolny, Z.; Tomczewski, K.; Trzmiel, G.; Alemany, J. Optimization of a PV-Wind Hybrid Power Supply Structure with Electrochemical Storage Intended for Supplying a Load with Known Characteristics. Energies 2020, 13, 6143. [Google Scholar] [CrossRef]
  29. Faiman, D. Assessing the outdoor operating temperature of photovoltaic modules. Prog. Photovoltaics Res. Appl. 2008, 16, 307–315. [Google Scholar] [CrossRef]
  30. Deb, K. Multi-Objective Optimization Using Evolutionary Algorithms, 1st ed.; Wiley-Interscience Series in Systems and Optimization John Wiley & Sons: Hoboken, NJ, USA, 2001. [Google Scholar]
  31. Mikulski, S.; Tomczewski, A. Use of Energy Storage to Reduce Transmission Losses in Meshed Power Distribution Networks. Energies 2021, 14, 7304. [Google Scholar] [CrossRef]
  32. Burzyński, D.; Kasprzyk, L. A novel method for the modeling of the state of health of lithium-ion cells using machine learning for practical applications. Knowl.-Based Syst. 2021, 219, 106900. [Google Scholar] [CrossRef]
  33. Coello, C.; Pulido, G.; Lechuga, M. Handling multiple objectives with particle swarm optimization. IEEE Trans. Evol. Comput. 2004, 8, 256–279. [Google Scholar] [CrossRef]
  34. Moles, P.; Terry, N. Net present value. In The Handbook of International Financial Terms; Oxford University Press: Oxford, UK, 1997. [Google Scholar]
Figure 1. Mutual location of houses, garages (1a, 1b), gardens (2), streets (3), flower beds (4) and hybrid generation/storage system area (5): 6—PV modules; 7—wind turbines; 8—energy storage (own review).
Energies 16 04132 g001
Figure 2. Load characteristics of the G11 tariff (ENEA company) for 01.01.2021: (a) randomly modified for 5 houses; (b) for one house, taking into account the process of charging an electric vehicle (own study).
Energies 16 04132 g002
Figure 3. General structure of a generation system with electrochemical energy storage designed to supply a group of detached houses (terraced houses), taking into account the charging of electric vehicles (own study).
Energies 16 04132 g003
Figure 4. Locations in Poland for which optimisation calculations of the hybrid generation system are carried out (A—Baltic coast, B—Lublin Uplands and C—Carpathian Foothills).
Energies 16 04132 g004
Figure 5. Graphical representation of the determination of wind turbine power PWT for wind speed vW based on the discrete power characteristic (own study).
Energies 16 04132 g005
Figure 6. Model of the energy storage system working together with the hybrid system (own study).
Energies 16 04132 g006
Figure 7. Power characteristics of the type of wind turbine used.
Energies 16 04132 g007
Figure 8. Pareto fronts in the space of optimisation criteria Ω ( k 1 , k 2 , k 3 ) for location A and load scenarios taking into account different electromobility development: (a) 0; (b) I; (c) II; (d) III.
Energies 16 04132 g008
Figure 9. Changes in NPVs (per house) as a function of year of operation for the final solutions of the optimisation task for location A of the system and load scenarios taking into account different development of electromobility: (a) 0; (b) I; (c) II; (d) III.
Energies 16 04132 g009
Figure 10. Changes in NPVs (per house) as a function of year of operation for the final solutions of the optimisation task for location B of the system and load scenarios taking into account different development of electromobility: (a) 0; (b) I; (c) II; (d) III.
Energies 16 04132 g010
Figure 11. Changes in NPVs (per house) as a function of year of operation for the final solutions of the optimisation task for location C of the system and load scenarios taking into account different development of electromobility: (a) 0; (b) I; (c) II; (d) III.
Energies 16 04132 g011
Figure 12. Comparison of selected parameters of the final solutions for optimising the structure of a hybrid generation system with energy storage, depending on location and electromobility scenario: (a) rated power of the system; (b) usable energy storage capacity; (c) percentage share of the PV section power in the rated power of the system; (d) percentage share of the wind section power in the rated power of the system.
Energies 16 04132 g012
Table 1. Average annual values of climatic parameters in the analysed geographic locations.
LocationCoordinatesIrradiance ( W / m 2 )Wind Speed (m/s)Air Temperature (deg C)
A—Baltic coast54.51° N, 16.86° E 121.8 5.4 8.9
B—Lublin Uplands51.21° N, 23.39° E 128.1 4.3 7.9
C—Carpathian Foothills49.58° N, 20.72° E 130.7 2.8 6.5
Table 2. Parameter values of the MPSO method used to analyse the considered examples.
No.Parameter NameParameter Value
1Number of particles200
2Repository size (in particles).100
3Maximum number of generations1000
4Inertia coefficient0.2
5Personal confidence factor2
6Swarm confidence factor0.3
7Number of hypercubes in each dimension5
8Maximum velocity (search space percentage)50
9Uniform mutation percentage0.05
Table 3. Parameter values of the PV modules used in the calculations.
No.Parameter NameParameter ValueUnit
1 P M P P (STC)500W
2 U M P P (STC)61.8V
3 I M P P (STC)8.08A
4 U O C (STC)75.2V
5 I S C (STC)8.59A
6 I s a t (STC)18.62 μ A
7 R S 0.521 Ω
8 R S H 302.3 Ω
9 α I 0.06%/°C
10 α U −0.36%/°C
Table 4. Parameter values of the wind turbines used in the calculations.
No.Parameter NameParameter ValueUnit
1 P T W n 5kW
2 v c u t i n 2.5m/s
3 v n 12m/s
4 v c u t o f f 60m/s
5Wind classIIa-
6Tower height12m/s
7Rotor diameter5.4m
Table 5. Parameters of the section (10 kWh net) of energy storage used in the calculations.
No.Parameter NameParameter ValueUnit
1Type of storageNMC-
2Rated voltage44.4V
3Minimum voltage51V
4Maximum voltage40V
5Rated energy12.5kWh
6Continuous discharge current120A
7Continuous charge current120A
8Maximum instantaneous discharge current180A
9Maximum instantaneous charge current180A
Table 6. Economic parameters used to establish NPV ratios.
No.Parameter NameValueUnit
1Unit price of the PV installation1042EUR/kW
2Unit price of the wind section2500EUR/kW
3Unit price of the storage installation730EUR/kWh
4Petrol price1.42EUR/l
5Energy purchase price (from the grid)375EUR/MWh
6Energy sales price (to the grid)104EUR/MWh
7Annual decrease in energy generation in the PV system0.38%/a
8Annual increase in energy prices2%/a
9Annual increase in fuel prices2%/a
10Average fuel consumption of a car8l/100 km
11Unit price of plot94EUR/m2
12Area of plot for the hybrid system500m2
Table 7. Exemplary optimisation task solutions for the hybrid generation system with energy storage for location A and the final solution determined from the Pareto front using the expert criterion (the grey colour row).
No. P PV (kW) P WT (kW) k 1 (kWh) k 2 (MWh per Year) k 3 (%) A RES (MWh per Year)Year of Return (-) I 0 (thous. EUR) NPV 20 per House (thous. EUR)
Scenario 0 (without EV)
115.52036019.992.581.4915.611.5
216.01526025.297.465.5815.713.8
319.01514027.293.768.6610.518.5
424.0158029.289.473.747.220.0
Scenario I (12 EV, 30 km/day/EV)
130.52031033.496.296.8919.215.1
2292536030.291.9112.1817.515.7
319.02016044.694.485.0612.519.4
4302010045.788.996.859.420.7
Scenario II (24 EV, 30 km/day/EV)
148.52547030.293.6131.5920.915.3
230.02519047.593.6112.6713.416.6
342.02514052.685.3124.9612.623.6
416.0204071.688.281.9511.923.3
Scenario III (24 EV, 50 km/day/EV)
125.02529068.197.8107.51214.58.9
243.02520063.693.8125.9814.215.1
325.02512075.091.1107.5714.418.8
420.5206094.091.786.5614.721.0
Table 8. Exemplary optimisation task solutions for the hybrid generation system with energy storage for location B and the final solution determined from the Pareto front using the expert criterion (the grey colour row).
No. P PV (kW) P WT (kW) k 1 (kWh) k 2 (MWh per Year) k 3 (%) A RES (MWh per Year)Year of Return (-) I 0 (thous. EUR) NPV 20 per House (thous. EUR)
Scenario 0 (without EV)
1232028027.196.266.2103.92.8
2312023024.793.175.3916.211.5
3171011045.6100.039.5610.417.9
424207035.788.267.359.018.2
Scenario I (12 EV, 30 km/day/EV)
152.53027037.787.5118.5912.07.9
243.52524038.293.998.5817.116.6
336.02517045.093.090.5713.018.5
423.0204066.388.966.2612.619.2
Scenario II (24 EV, 30 km/day/EV)
171.52541039.491.8128.5105.54.1
252.52013064.088.997.896.05.6
336.03017056.691.4100.9819.318.2
431.0259069.089.985.1716.320.4
Scenario III (24 EV, 50 km/day/EV)
152.54033060.792.0139.3108.66.2
256.03527064.292.6132.7918.414.7
335.54016082.886.9121.1820.218.0
433.03580100.581.5108.1717.221.1
Table 9. Exemplary optimisation task solutions for the hybrid generation system with energy storage for location C and the final solution determined from the Pareto front using the expert criterion (the grey colour row).
No. P PV (kW) P WT (kW) k 1 (kWh) k 2 (MWh per Year) k 3 (%) A RES (MWh per Year)Year of Return (-) I 0 (thous. EUR) NPV 20 per House (thous. EUR)
Scenario 0 (without EV)
133.55017033.492.365.71113.88.8
240.56018031.987.079.11015.410.8
332.04010036.694.258.2914.012.0
434.0359036.794.757.5813.312.6
Scenario I (12 EV, 30 km/day/EV)
154.085308021.7100.0108.41322.99.6
258.095248019.597.2118.61219.710.7
359.065158029.298.7102.31115.110.8
457.09593028.593.2117.5915.111.5
Scenario II (24 EV, 30 km/day/EV)
162.0115510017.3100.0134.61521.56.7
259.5115414019.3100.0131.91424.17.7
354.0115363023.998.8125.91321.88.7
456.5125335020.598.7134.41216.59.4
Scenario III (24 EV, 50 km/day/EV)
176.5150564022.599.1170.81524.86.9
272.5150493023.999.7166.41423.78.5
373.5150445024.799.2167.51324.19.8
482.0140330027.497.4171.01226.313.2
Table 10. Optimisation task solutions for the hybrid generation system with energy storage for the location of scenario 0 (without EV).
P PV (kW) P WT (kW) k 1 (kWh) k 2 (MWh per Year) k 3 (%) A RES (MWh per Year)Year of Return (-) I 0 (thous. EUR) NPV 20 per House (thous. EUR)
Location A
24.0158029.289.473.747.220.0
Location B
24.0207035.788.267.359.018.2
Location C
34.0359036.794.757.5813.312.6
Table 11. Optimisation task solutions for the hybrid generation system with energy storage for scenario I (12EV/30 km/day).
P PV (kW) P WT (kW) k 1 (kWh) k 2 (MWh per Year) k 3 (%) A RES (MWh per Year)Year of Return (-) I 0 (thous. EUR) NPV 20 per House (thous. EUR)
Location A
302010045.788.996.859.420.7
Location B
23.0204066.388.966.2612.619.2
Location C
57.09593028.593.2117.5915.111.5
Table 12. Optimisation task solutions for the hybrid generation system with energy storage for scenario II (24 EV/30 km/day).
P PV (kW) P WT (kW) k 1 (kWh) k 2 (MWh per Year) k 3 (%) A RES (MWh per Year)Year of Return (-) I 0 (thous. EUR) NPV 20 per House (thous. EUR)
Location A
16.0204071.688.281.9511.923.3
Location B
31.0259069.089.985.1716.320.4
Location C
56.5125335020.598.7134.41216.59.4
Table 13. Optimisation task solutions for the hybrid generation system with energy storage for scenario III (24EV/50 km/day).
P PV (kW) P WT (kW) k 1 (kWh) k 2 (MWh per Year) k 3 (%) A RES (MWh per Year)Year of Return (-) I 0 (thous. EUR) NPV 20 per House (thous. EUR)
Location A
20.5206094.091.786.5614.721.0
Location B
33.03580100.581.5108.1717.221.1
Location C
82.0140330027.497.4171.01226.313.2
Disclaimer/Publisher’s Note: The statements, opinions and data contained in all publications are solely those of the individual author(s) and contributor(s) and not of MDPI and/or the editor(s). MDPI and/or the editor(s) disclaim responsibility for any injury to people or property resulting from any ideas, methods, instructions or products referred to in the content.

