
A Novel Hybrid Polygeneration System Based on Biomass, Wind and Solar Energy for Micro-Scale Isolated Communities


Department of Sustainable Energy Development, Faculty of Energy and Fuels, AGH University of Science and Technology, 30-059 Kraków, Poland
*
Author to whom correspondence should be addressed.
Energies 2022, 15(17), 6331; https://doi.org/10.3390/en15176331
Submission received: 29 July 2022
/
Revised: 23 August 2022
/
Accepted: 27 August 2022
/
Published: 30 August 2022
(This article belongs to the Special Issue Research in Building Physics and Renewable Energy)
Abstract
:The availability of freshwater and energy is a serious issue in remote and islanded areas, especially at a small scale, where there may not be the possibility to access the grid and/or water distribution systems. In this context, polygeneration systems operating on the basis of local, renewable energy sources can be an answer to the users’ demand for electricity, heating, cooling, and domestic hot water. The scope of the proposed paper was to investigate, numerically, the energy and economic feasibility of a novel hybrid polygeneration system powered by biomass, solar, and wind energy for a micro-district of households. The proposed system consists of a biomass-fueled steam cycle, wind turbine, photovoltaic field coupled with thermal and electrical energy storage, adsorption chiller, and a reverse osmosis water desalination unit. The system is also assisted by an LPG generator set running as backup. The system provides space heating and cooling, electrical energy, and fresh and domestic hot water to 10 households located on Pantelleria Island, Italy. The proposed system is modelled and simulated through TRNSYS software with realistic user demand. The energy and economic performance of the proposed system are assessed with respect to a reference system in different scenarios, taking into account islanded operation, connection to the grid, and biomass tariffs. The results show that the proposed system achieves an excellent primary energy saving performance in all the investigated scenarios, with savings of more than 94% for all the investigated scenarios. Excluding any kind of funding, in case of new investment for the system, the simple payback oscillates between 7 and 12 years, showing that the developed alternative is fairly valid with respect to traditional solutions.
Keywords:
polygeneration; biomass; wind; solar; reverse osmosis; electrical storage; buildings; domestic hot water; heating; cooling1. Introduction
According to WHO data, even 1 in 3 people globally does not have access to safe drinking water [1]; almost two-thirds of those who lack clean water also lack access to electricity. This opens up a range of potential possibilities to manage those problems in a coordinated manner. The most developed region of the world in the field of freshwater production is the Middle East, with nearly 5% of its total energy consumption used for purposes of desalination plants [2]. As countries in this region are mostly producers of fossil fuels (oil and gas), a relatively cheap operation of thermal desalination plants led to nearly 70% of freshwater production utilizing this method in 2016. However, rising temperatures in the region, as well as economic and population growth, lead to increasing demand for freshwater. In general, the availability of water is also a problem in the Mediterranean region [3], pointing out that the problem is widely diffused in the southern part of Europe.
Due to the relatively low efficiency of thermal desalination processes, membrane technologies that use electricity are considered the future main source of freshwater in the region. A transitional period of freshwater production will depend mostly on electricity generated from natural gas, however, the Sustainable Development Scenario predicts that over 41% of water production will be based on renewable energy sources [4].
There are a lot of efforts realized worldwide in order to purify water. Solutions may involve treating wastewater through microorganisms [5] or using semi-permeable membranes [6]. However, the most common method is the desalination of seawater. This can be done by thermal means [7,8], by freezing [9], or by pressure (membrane permeation) [10]. The thermal way is based on the direct evaporation of a portion of seawater. During this operation, a by-product is obtained, i.e., deposited salt, and pure water in the form of steam. One of the latest ideas for desalinating water is to freeze it [11]; however, this process is very expensive and therefore rarely used. The pressure methods are based directly on the water passing through a semi-permeable membrane on the basis of the osmosis phenomenon. The membrane has small openings so that only water molecules can fit through it. The process can be demonstrated on a model consisting of two connected vessels divided by a semi-permeable membrane. One of them contains saline water, and the other contains water with a reduced concentration of salt. The system seeks to equalize the saline concentrations between the two vessels, thus, a flow of water of lower concentration into the water of higher concentration is observed. Since only water molecules pass through the membrane, the water level in the vessel with the higher salt concentration increases. Water transport is caused by what is called osmotic pressure [12]. This is the exact amount of pressure with which one has to act on the water of higher concentration to inhibit liquid transport. Thus, in a situation where the applied pressure is higher than the osmotic pressure, water molecules from the tank with a higher concentration will be transported to the tank with pure water. This process is called reverse osmosis [13,14]. The relative simplicity of this process has made this solution one of the most common choices in seawater and ocean water desalination systems.
2. State of the Art
As renewables are considered to be the future power source for desalination processes, it is important to properly design the energy facility used for the purpose of freshwater production.
The main disadvantage of most types of renewable energy sources is the instability of power generation. This is mainly due to the fluctuation and hard-to-predict availability of primary energy sources [15]. Additionally, this energy is beyond the control of the energy user and it cannot be constantly adjusted to consumption. It is challenging to match the demand to the potential energy production from renewable sources as they are hard to forecast on both a short and long-term basis. In order to maintain electricity security, those intermittent energy sources should be backed up with the ones that can be controlled. In this way, hybrid energy systems are created [16]. Such systems are divided into two groups: those with two, and those with multiple types of energy-generation technologies [17]. Due to the simplicity of plant construction and technological availability, the most popular type of dual hybrid system is a solar–wind power plant. (The authors analyzed the installations in their paper focusing on describing the methodology for modeling hybrid renewable energy system (HRES) components, HRES designs, and their evaluation. In view of the system cost, the contribution of PV is small compared to that of wind. It is noted that the ratio of PV power to wind power in a hybrid PV/wind system to achieve the lowest possible cost is 70% [18].) This solution partially eliminates the stochastic characteristics of wind and sun by generating energy when one of those sources is unavailable. Moreover, in many areas, wind and solar energy are mutually exclusive which indicates the necessity of the hybrid system [19].
While designing the hybrid system, the sizing of the individual components that match the demand of the user is determined. In the case of a wind–solar hybrid system, Haddad [20] recommended the following approach. The sizing of the wind turbine should be calculated first, and the remaining demand is filled up with photovoltaics. The calculations are then iteratively repeated with a decreasing number of turbines. As a result, different configurations of the hybrid renewable energy system are obtained. During the calculation of the power produced by both wind turbines and photovoltaics, multiple factors must be taken into consideration. Geographic location and climate data are used to predict available energy annually [19,21], while local weather forecasting and topography can indicate daily changes [22]. The sizing of the power system is also influenced by the required annual system cost, which is a sum of the capital cost, the replacement cost in case of system breakdowns, and operation and maintenance costs. Another factor is the required reliability and the autonomy of the renewable resource component of the hybrid system. Additionally, in the case of the off-grid hybrid systems, the sizing of the energy storage is also paramount in order to achieve a proper operation of the system [23].
The analysis made by Boonbumroong et al. [24] showed that for Chik Island, Ontario, in Canada, the most economical system consisted of a photovoltaic field, wind turbine, diesel generator, and battery. In the considered case, renewable energy met 55.6% of the energy demand, while the remaining 44.4% was contributed by the diesel generator. The results show that scenarios based on renewables only or diesel only are not profitable. Similarly, Kalantar et al. [25] conducted a techno-economic analysis of a stand-alone hybrid system with a wind turbine, PV array, and lead-acid battery pack using a generic algorithm. The total cost of this hybrid system was USD 215,580.
For a smaller scale system, Loganathan et al. [26] proposed a hybrid installation to fulfill 50% of the demand of the average Australian house. In the presented approach, the authors sized the photovoltaic component to cover the power demand in summer (2.8 kW), and then added a wind turbine in order to support the system during the winter period (1 kW). Photovoltaics alone covers 110% of the summer energy demand and 85% of the winter demand, while the wind turbine supplies the remaining 15–20% of the demand in the winter period. (Additionally, a 53.1 kWh battery is used to accommodate the surplus energy generated by photovoltaics in the summer. The incorporation of the wind turbine in the system significantly increased its cost, but it made the system more reliable by having two different sources of power. The authors concluded that over the period of 20 years, the cost of the energy generated by the system is higher than the grid connection. However, they claim that having lower greenhouse gas emissions, lower operating costs, and a reliable power supply is making alternative power sources attractive to the common masses). Hiendro et al. [27] have presented a similar conclusion that the wind turbine and battery are necessary to meet demand loads at night hours in a PV/wind hybrid system, although both contribute the greatest cost to the system. Therefore, it is important to select the best size of the wind turbine and battery in order to minimize the total cost of the PV/wind hybrid system.
With different applications in mind, Mokheimer et al. [28] proposed a hybrid energy system composed of 3.3 kW PV panels and 6 kW wind turbines which reduced the energy cost to 0.672 USD/kWh, according to conducted simulation. The system was designed to power a desalination plant producing 5 m3/day in a region with scarce water in Saudi Arabia. In the colder climate, Miao et al. [29] concluded that because of abundant wind resources in the United Kingdom, especially in the Newcastle area, wind turbines have an overwhelming contribution to the electricity supply, leading to LCOE equal to 0.588 USD/kWh.
Mentis et al. [30] considered the potential of satisfying local water demand by renewable energy sources on arid islands in the Aegean Sea. The authors considered three different islands—Patmos, Lipsoi, and Thirasia, and analyzed the possibilities of replacement of transported water. Presented results show that, depending on the installation size, it is possible to achieve even 4.5 times lower price (from 145 to 260 EUR/m3) of water compared to the case with the transport of water from other regions.
Azinheria et al. [31] presented a study considering renewable energy-powered desalination. The aim of the study was to determine whether a centralized or a decentralized strategy yields the lowest costs of water desalination. The optimization model presented by the authors led to the conclusion that the lowest levelized cost of water is achieved in the case of decentralized energy production, where LCOW achieved 72.7 EUR/m3, which was 2.1% lower than in the case of the centralized scenario.
Most of the articles summarized in Table 1 present a simulation approach where specialized software is used. Sharma et al. [32] conducted a detailed comparative analysis of the available simulation tools based on an environmental assessment. Five software packages were chosen from the group of fifty that best fits the proposed criteria. Among them, the TRNSYS Simulation Studio showed the most flexibility for simulations across all stages of the project development.
As concerns, the application of the software, good compliance between the simulation and experimental results was achieved in the case of the polygeneration system based on hybrid renewable energy and water desalination proposed by Uche et al. [33]. The mean deviation and averaged relative error were less than 10% with the correlation coefficient in the range of 0.90–0.98. This means that the control parameters are within the limits that allow the validity and comparability of experimental and simulation results.
On the basis of the presented literature review, it can be noticed that significant research possibilities are still available in the field of hybrid polygeneration systems including desalination units, especially at the scale of micro-installations. The analysis of the literature shows that the studies are mainly focused on hybrid energy systems used to provide thermal and electrical energy, while ones including freshwater production are not so numerous. Such systems are analyzed mostly for purposes of large-scale users, and in such cases, preferable energy sources are based only on PV and wind energy. Therefore, the aim of this study was to expand the knowledge about islanded micro-scale reverse osmosis systems powered by renewables, including energy storage and production of heat and chill. The proposed system consists of a wind turbine, PV field, electrochemical battery, Rankine cycle with a biomass boiler, adsorption chiller, and reverse osmosis unit as well as a backup LPG generator. The heat produced in such a system is used for the whole year for the production of DHW, for heating purposes in winter months, and as a supply of the sorption chiller generator in summer months. The electrical energy produced by RES is used for the purposes of freshwater production throughout the whole year as well as for matching user load. The novelty of the presented study concerns the dynamic analysis of such a system in the fully remote and renewable-based scheme of operation and comparing it to scenarios utilizing energy from the grid or from generators based on fossil fuels. The achieved results, beginning from the presentation and discussion of the system dynamic operation up to the yearly results summarizing the performance of the system, are novel with respect to the existing literature. Indeed, to the best of our knowledge, the proposed system is investigated for the first time.
In order to provide a complex dynamic analysis of the energy with a timestep equal to 5 min, the system was investigated using a Transient System Simulation (TRNSYS) software package. This software was selected since it has some interesting features such as: (i) the capability to simulate energy systems with a user-defined time scale and resolution, (ii) full liberty in developing models of energy systems and their operation strategy, and (iii) the possibility to integrate user-defined components. It is important to note that this software is continuously used to carry out research on novel and complex energy systems, as proven by countless papers available in the scientific literature.
The model of the system was developed on the basis of user-defined models validated against experimental or technical data, as well as build-in software components. The operating parameters of each of the system elements were calculated at each timestep and influenced the further operation of the system. Dynamic simulation of the mentioned system describes its operation in Pantelleria Island (Italy) and can be adapted to any other climatic conditions.
3. Materials and Methods
In order to simulate the hybrid energy system with a reverse osmosis unit, TRNSYS software was used [34]. The modeling of the considered system was performed using both built-in libraries (wind turbine, battery, PV field, steam turbine, pumps, diverters, valves, tanks, boiler, generator sets, etc.) as well as user-defined components, specifically configured for the proper design of the system (control strategy, energy, and economic model, reverse osmosis unit). It is important to note that the software library components are experimentally validated or were based on manufacturers’ data, which allows achieving highly reliable outcomes from the simulation.
Figure 1 presents a sequence of activities in the form of a flowchart, which has been undertaken during the investigation. The flowchart is divided into four sections. The first presents preliminary research and the component selection of the system. The second part contains the process of implementing the issue into the program and setting up subsequent variants. Part three presents results obtained from the simulation. Part four is the economic analysis carried out on the basis of simulation results, available market, and the literature data. All of the steps presented allowed the energy and economic potential of the investigated polygeneration system to be accurately determined.
In this section, models of a reverse osmosis unit, as well as economic and energy models are provided, while the other models used in the study are omitted for the sake of brevity since they are presented in the TRNSYS software reference. Concerning the adopted models, it is worth noting that the wind turbine model is based on manufacturer’s data [35], as well as the adsorption chiller [36]. The complete list of utilized TRNSYS build-in components is presented in Table 2.
It is worth noting that the main components used in the developed simulation are based on the manufacturer’s characteristic curves and technical and scientific literature. The wind turbine model, as well as the adsorption chiller used in the simulation, are defined on the basis of the real performance of the devices as a function of the current operating conditions. The model of the photovoltaic field takes into consideration the effect of temperature on the efficiency of the modules, with validation reported in Ref. [37]. The model of the reverse osmosis was also adopted from the literature [38]. The mass flux Md of feed water was calculated as the following equation:
where Mf is feedwater mass flux. It should be noted that the recovery ratio RR value is an experimentally determined value and is most often provided by the manufacturer of the membrane. The salinity of the produced freshwater Xd can be defined as the relationship between the salinity of the feed water Xf and the percentage of salt excretion SR, which is also usually sourced from the manufacturer.
The brine mass flux Mb is the difference between the feed Mf and desalinated water flux Md:
To calculate the concentration of excreted brine Xb, the following equation was used:
The averaged value of salt concentration Xa can be described by the formula:
A temperature correction factor TCF can be determined for subsequent calculations. To calculate TCF, the following equation was used:
The most important parameter describing the modeled semi-permeable membrane is its water permeability. It is described by the water permeability factor kw, and it is calculated on the basis of the following equation:
The salt permeability index ks was calculated using another empirical parameter called the sedimentation coefficient FF:
The reverse osmosis process requires knowledge of the parameter describing each semi-permeable membrane—the osmotic pressure II. By definition, this value can be determined on the basis of the equation:
However, the above relationship applies to general cases. In the following work, an empirical coefficient was used to indicate the relationship between salt concentration in the feed water, freshwater, and wastewater. Separate values of osmotic pressure IIf, IIb, IId, respectively, were determined for each flux value [38]:
The calculated values allowed to determine the average osmotic pressure on the membrane IIa:
Net osmotic pressure ΔII was determined as the difference between the average value of the parameter describing the wastewater stream:
Net pressure difference ΔP was calculated from the above results:
While pump power required, HP, for a reverse osmosis-based system is:
As for the other components of the system, the steam boiler model is based on the definition of boiler efficiencies provided by the American Society of Heating, Refrigerating and Air-Conditioning Engineers (ASHRAE) [39], while the steam turbine model was adopted on the basis of an isentropic efficiency approach to calculate the performance of the component [40]; this method is widely adopted in the literature for purposes of simulating steam turbines.
The condenser model implements the pinch-point temperature difference method in order to determine the heat transfer among the cooling liquid and condensing steam [41]. The tank used as the thermal energy storage is modeled as a tank interacting with the environment, with two flows supplied to the source and load side of the tank. Experimental validation of this model is presented in Ref. [42].
3.1. Layout and Control Strategy of the System
The proposed system consists of a water–steam power cycle, a wind turbine, and a photovoltaic field for the generation of electrical energy, and a battery system for its storage. Moreover, the system is equipped with a generator set operating with LPG in order to match the user’s electrical demand when needed. The thermal energy rejected by the condenser of the cycle is used by the adsorption chiller to produce chilled water during the cooling season, and as a heat source during the winter season for the space heating purposes of the user. During the whole year, the heat cogenerated by the steam cycle is also used to produce domestic hot water. The system also includes a reverse osmosis unit, which utilizes part of the electrical energy produced by the hybrid system. The unit takes the seawater, then stores the produced freshwater in a tank, while the brine is pumped back into the sea. The layout of the system, including crucial components and loops, is shown in Figure 2.
Subsystems included in the entire simulated system are, in particular:
- Electrical power (EP), wind turbine, photovoltaic field, the output of the steam turbine, battery storage, and the power supplied from or to the grid;
- Desalination water (DW), water from the sea, brine, and freshwater directed to the storage tank;
- Rankine cycle (RC) consisting of distilled water flowing within the boiler, steam turbine, and condenser;
- Chilled water (CHW), consisting of chilled water supplied for the air conditioning system of the user;
- Cooling water (CW), water used to dissipate the thermal energy rejected by the adsorption chiller and the one produced by the system when the tanks are thermally loaded;
- Hot water (HW), consisting of water in a thermal storage tank, which is used for purposes of space heating and producing domestic hot water and chill in CW when demand occurs;
- Auxiliary boiler fluid (ABF), a loop which is used to heat the thermal storage tank when thermal demand peaks;
- Domestic hot water (DHW), consisting of freshwater produced by DW and heated by HW in a storage tank with an internal heat exchanger.
The main components of the proposed system are:
- Wind turbine, WT, producing electrical energy from the wind energy;
- Photovoltaic field, PV, converting the solar energy into electrical power;
- Biomass boiler, BOIL, consisting of a low-pressure unit, combusting wood chips to produce steam;
- Steam turbine, ST, consisting of a low-pressure condensing unit and electrical generator;
- Condenser, COND, used to transfer the heat to the user’s heating and cooling systems;
- Reverse osmosis, RO, consisting of a desalination unit converting seawater to freshwater and brine, powered by electrical energy;
- Battery, BAT, used for the purposes of storing produced energy;
- Generator set, GSET, an LPG generator set consisting of three units producing electrical energy needed to compensate the energy produced by renewable energy sources in order to match the load of the user;
- Tank, TK1, stratified thermal storage unit, transferring the heat produced in the system to the utilization parts of the system;
- Tank, TK2, a variable level tank used to store the freshwater produced by RO;
- Tank, TK3, a stratified thermal storage unit equipped with an internal heat exchanger and producing DHW;
- Auxiliary heat exchanger, AHX, used to dissipate excess energy;
- Auxiliary boiler, AUX, consisting of a biomass unit producing thermal energy on demand;
- Adsorption chiller, ACH, composed of a zeolite matrix-based unit, producing chilled water from heat;
- Dry cooler, DC, used to dissipate the thermal power rejected by AHX and ACH.
Furthermore, the layout of the system also includes plant equipment, e.g., circulation pumps (P), flow diverters (D), and mixers (M), adopted to ensure proper circulation of the flows in the system.
The developed hybrid polygeneration system operates on the basis of a well-defined control strategy, as described below. The heat produced by BOIL is transferred to water in order to achieve oversaturated steam at a pressure of 10 bars and 220 °C. The produced steam is expanded in ST and condensed by the COND to a temperature of 75 °C. The condensed steam is then supplied to P1, allowing to set the cycle maximum pressure.
The heat rejected by the condenser, COND, is supplied to the thermal storage tank TK1 by means of pump P2. It is worth noting that in the loop between the condenser and the tank, the auxiliary heat exchanger, AHX, operates in order to ensure a returning temperature to the condenser not exceeding the limit of 65 °C. Thus, when the bottom temperature of tank TK1 increases over this limit, water returning to the condenser is cooled down to keep a proper process of condensing. The heat stored in TK1 during the heating period is supplied to the user in order to match the heating load, while during the cooling season the heat is used to drive the adsorption chiller. The hot water pumped by pump P6 is supplied to the hydronic distribution system of the user buildings and then returns back to TK1 cooled down due to the heat withdrawal for space heating. For cooling purposes, the hot water is supplied by pump P8 to the generator of the adsorption chiller, ACH, then the evaporator of the chiller produces chilled water at a set point temperature of 10 °C. In this way, cold water supplied to the user conditioning system by pump P9 allows the system to match the space cooling demand. Furthermore, the heat stored in TK1 is also supplied by pump P5 to the internal heat exchanger of tank TK3 for the production of DHW. Pump P5 is always activated with scope to keep the temperature in the top part of TK3 similar to the one in TK1, which is a temperature level that allows to match the DHW demand of the user at 45 °C.
The steam turbine, ST, system operates on the basis of a control strategy following the thermal load of the user. In particular, pump P1 varies linearly the flow rate of condensed water as a function of the temperature inside TK1 in the range between 30 and 100% of the nominal value. For a temperature of 60 °C inside TK1, the mass flowrate of water is set to 100% of the nominal value while for 65 °C the flowrate drops to 30%. The variation of P1 pump load, as well as of boiler, BOIL, and steam turbine, ST, is assumed to be linear in the described temperature operation range. Moreover, the system is also equipped with an auxiliary boiler, AUX, which is activated once the temperature of TK1 drops below 60 °C in order to maintain a proper operation temperature of the space heating system and of the adsorption chiller thermal cooling cycle. This may seldomly occur as a consequence of high demand for heat of the space conditioning system or high DHW demand. The activation of the auxiliary heater, AUX, persists until TK1 reaches a temperature of 63 °C.
From the point of view of freshwater production, the pump integrated with the desalination system provides seawater from an onshore intake to the reverse osmosis unit, RO. The device is activated when the water level inside tank TK2 drops to 50% due to DHW demand and it is turned off when a storage level of 100% is reached. The freshwater inside TK2 is supplied to TK3 according to the usage of DHW of the user.
The electrical energy produced by steam turbine, ST; wind turbine, WT; and photovoltaic field, PV, is supplied in the first place to the user by means of a conversion-distribution busbar, and an eventual excess is used to charge the battery system. In case of a full state of charge of the battery system, BAT, and a user load matched by renewable energy sources, the electrical energy in excess is dumped by the polygeneration system due to the impossibility to direct this energy to other loads. Moreover, in order to cover the demand of the user independent from the energy available from the WT and PV and the variable user thermal load affecting the energy production of the ST, the system also integrates an LPG generator set. This system is activated when the power produced by the ST, WT, and PV and the one provided by BAT is not enough to match the electrical load of the user. The units of the generator set are activated on the basis of a master-slave mode to follow the required load, each operating in a range of power between 25 and 100% of the nominal capacity. This strategy allows one to achieve satisfactory flexibility in the operation of the generator set as a function of the required power.
3.2. Energy and Economic Model
In order to assess the global energy and economic performance of the proposed polygeneration system, PS, it was compared with a reference system, RS. The analysis was carried out assuming that both PS and RS systems satisfies the same users load in terms of heating, cooling, electrical energy, and freshwater. For PS, two configurations were assumed depending on the fact if the system is connected to the grid or not. Thus, the basic proposed system configuration without access to the grid (IS), as well as its alternative with the connection to the grid (GRID) were investigated. A similar assumption was made for the RS, since it was assumed that the reference system may be islanded and rely only on LPG generator sets and boilers (GSET) or be connected to the electrical and natural grid (GRID). Thus, the systems considered are four:
- -
- PS-IS, consisting of the described polygeneration system with LPG generator set backup and no connection with the electrical grid;
- -
- PS-GRID, similar to PS, IS but without generator sets and with the possibility to exchange bidirectionally electrical energy with the electrical grid;
- -
- RS-IS, consisting of an islanded system with an LPG generator set to produce electrical energy, an LPG boiler to ensure space heating and DHW, an electric chiller for space cooling, and freshwater bought on the market;
- -
- RS-GRID, consisting of a grid-connected system, natural gas boiler for space heating and DHW production, an electric chiller for space cooling, and freshwater bought on the market.
The adoption of these proposed and reference systems defines four analysis scenarios given by their different combinations. In the reference system, the boilers had a reference efficiency of 0.85, and the seasonal COP in the cooling mode of the electrical chiller was assumed to equal to 2.5, while, for all the systems connected to the electric grid, the energy conversion efficiency of the grid was 0.46.
The energy performance was assessed on the basis of some efficiency parameters of the components, ratios between energy flows, primary energy consumption, and savings.
The performance of the photovoltaic field was determined on the basis of its efficiency, by means of the following equation:
For the steam, wind turbine, and generator set, the index of normalized equivalent operation hours n was determined, defined as the ratio between the energy produced in a certain time and the maximum producible energy (at constant nominal power in the same time):
The operation of the adsorption chiller was assessed on the basis of the coefficient of performance, COP, defined as the ratio between the cooling energy supplied by the evaporator of the unit and the one supplied to the generator:
The analysis of the system was also carried out analyzing selected energy ratios, as listed below:
- -
- energy dumped by the system with respect to the total produced;
- -
- energy supplied to charge the battery compared to the total production;
- -
- total energy produced to the demand of the user;
- -
- energy supplied to charge the battery with respect to the demand of the user;
- -
- energy dumped compared to the demand of the user.
In order to develop the analysis of the proposed system, the following primary energy flows related to different energy consumptions were considered:
- -
- for PS-IS, consumption due to the user of LPG fuel to run the generator set in case of necessity;
- -
- for PS-GRID, consumption of electrical energy from the grid and supply of energy produced in excess to the grid by the proposed system (renewable energy);
- -
- for RS-IS, consumption of LPG in order to run the generator set and the boilers;
- -
- for RS-GRID, consumption of electrical energy provided by the grid to match the load of the user and of natural gas for heating and DHW production.
The primary energy consumption due to the use of freshwater bought on the market in case of RS was neglected. This assumption allows one to slightly underestimate the performance of the proposed system configurations in terms of primary energy saving, which has a positive effect on the reliability of the results of the analysis.
On the basis of the assessment of energy flows, the total primary energy consumption PE for each system was determined, and the primary energy saving PES and its ratio PESr for the proposed system configurations with respect to the reference ones were calculated using the following equations:
The economic performance of the PS was evaluated taking into consideration the investment costs of the PS and the operating costs of both the PS and the RS. The methodology is based on the evaluation of component costs on the basis of the literature and market data [43,44,45]. The specific cost of the steam turbine Rankine cycle, photovoltaic modules, and adsorption chiller were assumed as 10,000 EUR/kW, 370 EUR/m2 and 500 EUR/kW. The wind turbine cost was estimated on the basis of a cost function depending on the nominal power of the device and developed for micro-scale units [44]. The cost of the freshwater tank was determined on the basis of a linear relationship with the storage capacity [46].
The specific cost of the battery storage was set to 350 EUR/kWh [47]. The initial cost of the RO unit was set as a function of the cost of the RO system per m3 of the capacity of the desalinated water of the system per day, assumed equal to 532 USD/m3/day [48]. The cost of the onshore intake system for seawater was estimated with the methodology presented in [49]. As regards the generator sets, the cost was estimated by determining the specific cost of the small-scale devices in the power range of 5–10 kW with an analysis of market data. In this way, the cost of 500 EUR/kW was found. It is important to note that the cost of the generator sets has not been considered in the PS configuration where the system is connected to the grid (PS-GRID), since the devices are not required.
Finally, in order to determine the total cost of the system, the costs of all devices have been summed up and increased by 10% in order to take into account other balance of plant costs, such as the ones for pumps, connections, control system, etc.
The assessment of operation cost for the PS and RS configurations has been performed using tariffs for energy and their vectors. For the purposes of the proposed study, the tariffs for Italy were taken into account. The price of LPG was set at 706.24 EUR/m3 on the basis of yearly average monthly values for the 2021 year [50]. The density of 505 kg/m3 and the lower heating value of 12.84 kWh/kg of LPG were taken from [51]. The cost of natural gas was set to 0.1005 EUR/kWh according to data reported by Eurostat for the second half of 2021 [52]. For electrical energy, a constant tariff of 0.236 EUR/kWh for buying energy was adopted [53], while for sold energy, the tariff was set to 0.12546 EUR/kWh according to the yearly mean market price for 2021 [54]. The freshwater cost of 0.7 EUR/m3 was taken from a literature study dealing with a case study similar to the one investigated in this paper [55].
In addition to the two configurations of the PS, two assumptions have been adopted for the biomass cost in order to estimate the operation cost of the polygeneration system. In the base case, the cost of biomass has been set to zero assuming that the system uses local and free residual biomass, while for comparison, it was assumed a scenario, namely, BIO, in which the biomass must be purchased on the market. In this case, the wood chip biomass cost was fixed to 0.06 EUR/kg with a lower heating value of 3.7 kWh/kg [44]. Therefore, the operation costs of the PS in IS and GRID configuration was assessed in the case of basic and BIO scenario. Moreover, in order to consider the cost of maintenance of the PS in each configuration, a yearly cost of 2% of the total cost of the system has been included in the operational expenditures.
On the basis of the assumed cost of operation for all the systems variants, the savings of the PS with respect to the RS in the four different configurations and under two biomass cost assumptions was determined. Thus, in total, eight different scenarios were investigated. Finally, the comparison of the economic performance of the hybrid polygeneration system under such scenarios was carried out by introducing a simple economic index—the simple payback time, defined as the ratio between the cost of the system and achievable savings in the considered scenarios.
3.3. Case Study
The case study was developed for the purposes of testing the system in simulated real world conditions, and it consists of a group of 10 single-family households with heating, cooling, and electrical loads as well as freshwater and DWH demand. The location of the system has been set to the island of Pantelleria, Italy, in order to simulate a user with a possible remote/island condition.
In the developed case study, each of the 10 buildings presents the same geometrical properties and characteristics of envelope and user usage. In detail, the building consists of a 100 m2 household with a sloped roof with one floor and an attic. The height of the house floor was 2.7 m. The detailed geometrical parameters of the building are shown in Figure 3.
This building has been used in other papers of the authors in order to simulate the space cooling and heating demand of the user [44]. The details of the thermal transmittances of the building envelope elements and those regarding the internal thermal loads are reported in [44], thus, are here omitted for the sake of brevity. The adopted building model was developed with TRNSYS3d plug-in integrated with the Google SketchUp tool, and it was imported to TRNSYS software environment where details regarding envelopes and loads were set using the TRNBuild tool [34].
The operation of the space heating and cooling system was set for all the year without any period of scheduling regarding winter or summer; thus, the thermal load determined by the simulation of the building was only affected by the required thermal comfort levels of the users. Indeed, a 24 h/24 h operation schedule was set for heating and cooling of the building, with the assumption that the indoor air temperature in the rooms of the buildings must be kept between the set point of 20 °C and 26 °C as a minimum and maximum temperature level, respectively.
For the necessity of domestic hot water usage simulation, some literature demand profiles representing the same type of user investigated in this paper were used [56]. In particular, the user DHW demand was developed on the basis of three average user profiles measured with a sampling time of 5 min. The profiles were normalized in order to set demand of each building consisting of the water usage for 4 people with a specific consumption of 60 kg/day/person. DWH demand is reported in Figure 4, while the heating and cooling load of the building are reported in Figure 5.
As regards the electrical energy demand, a similar approach to DHW profiles was adopted, consisting of using some standard loads for different types of days (workday, Saturday, Sunday/holidays) and seasons. The profiles were normalized in order to simulate the user demand according to the used trends of consumption and the total annual consumption of each building. The demand for a single household has been set to 3000 kWh/year. The adopted profile and the detailed description of the used methodology are presented in [44].
The case study was completed with design parameters of the developed polygeneration system, selected in order to size the system components as well as set a proper dynamic operation of the whole system from the point of view of temperatures, mass flow rates, and energy flows. The design of the system was carried out with the scope to match the user heating, cooling, and DHW demand and electrical load entirely. The list of the main parameters adopted for the system is reported in Table 3.
4. Results
In order to perform the dynamic simulation of the proposed small-scale hybrid polygeneration system, the period of one year was considered (0–8760 h) as a time basis, while its discretization has been set by adopting a timestep of 5 min. The selection of the timestep was determined on the basis of the sampling time of DHW profiles taking into account the convergence of the calculation for iterative components (tanks and controllers).
With the selected global simulation parameters, the results as temperatures, mass flowrates, power trends, and also integrated variables were calculated. In the frame of this paper, it is not possible to present all the calculated data; thus, only the main results which point out the performance of the system in different conditions are shown. In particular, the operation of the system for a reference winter and summer day is presented as a function of temperatures and powers (thermal and electrical), while for the water production and storage system only the winter operation is shown for the sake of brevity. The performance of the system through the year is discussed on the basis of monthly trends of energies and performance indexes, while the summary of the system energy and economic performance is reported through yearly data.
4.1. Daily Results for a Winter Day
The selected winter operation day is the 15 of January (between 336 and 360 h of the year). The main temperatures for the selected day are reported in Figure 6.
The operation of the steam turbine, ST, is characterized by a stable outlet temperature of 75 °C during the day, due to a constant expansion pressure at its outlet and to the control of the temperature exiting the boiler, BOIL, (220 °C), as planned by the developed control strategy. These conditions allow one to also keep a stable temperature of the cooling water exiting the condenser, COND, at 65 °C for almost the whole day, allowing, in this time, to match the heating demand of the user. The temperature increases above the set point value in the period after noon since the produced heat cannot be fully utilized by the system. Despite this situation, there is no necessity to activate the auxiliary heat exchanger to limit the temperature of cooling entering the condenser, since it keeps below 65 °C as shown by the trend of pump P2’s outlet temperature. During the selected day, the inlet temperature to condenser, COND, oscillates between 59.7 and 63.6 °C ensuring a proper operation of the condensing process and of the whole steam cycle.
The increase of condenser outlet temperature implies, at the same time, a slight increase of temperature in both tanks TK1 and TK2, which reaches 64.8 and 64.7 °C, respectively. It is worth noting that the temperature of both tanks is similar since the pump connecting the storages runs continuously, and small variations are due to the inertia and heat supplied to the user. In the morning and night hours, tank TK1 provides a temperature of about 63 °C for the heating system of the user, while the return temperature from the user oscillates between about 57 and 59 °C as a function of the heating demand varying on the basis of the environment temperature. Only during the increase of the temperature inside tank TK1 in the first afternoon hours does the returning temperature increases to a maximum of 63.6 °C. This increase is due to the fact that the heat supplied to the buildings decreases; indeed, the temperature difference between tank TK1 and the return for the heating system decreases being the flowrate of the hot water constant.
The system’s thermal and electrical powers for the winter day are shown in Figure 7 and Figure 8, respectively. The thermal power trends reflect the operation of the system in terms of temperatures; indeed, it can be clearly observed that the heat produced by the boiler, BOIL, and rejected by the condenser, COND, follow mainly the heating demand of the user (HEAT,USER), and in minor part the demand for DHW. During the night hours, the heating demand slowly increases, causing a small increase in the heat cogenerated by the system. It is worth noting that in the first morning hours the user space heating demand is 1–2 kW higher than the one produced by the COND, and this determines a slight decrease in TK1 tank temperature (Figure 6). During the morning hours, the heat supplied to tank TK1 by the condenser, COND, decreases from a maximum of 28.1 kW, when the morning peak of DHW demand occurs, to 13.8 kW, which shows that the system operates with a significant variation of the load during the day. This operation characteristic is achieved since the cogeneration process is designed and managed in order achieve an elasticity in the production of heat as a function of the thermal load of the user.
The electrical power of the steam turbine, ST, reported in Figure 8, follows the same trend of the heat produced by the boiler, BOIL, as expected due to a partialization of the turbine operation as a function of the heat demanded by the user. In this way, steam turbine power production varies between 1.6 and 3.3 kW. In comparison, the variation of the other renewable electrical energy sources is higher since wind turbine, WT, power oscillates from almost 0 kW at the beginning of the day to the nominal value at the end, while the PV field produces a maximum variation of 2.9 kW. The results for the steam and wind turbine show that the first one is capable of operating at a minimum regime and providing a constant power, while the second one may operate in a very variable regime for a single 24 h period.
As regards the energy storage system, the selected day starts with the discharge of the battery, BAT, being used to compensate the demand of the user due to null photovoltaic field, PV, power production and scarce wind turbine, WT, power. However, the battery discharges completely just after 5:00 am, and the auxiliary generator set LPG must be activated in order to match the load of the user (USER). The auxiliary power is produced until the user demand drops at about 6:30 am due to the deactivation of the reverse osmosis unit, RO. In the remaining part of the day, the system is able to produce excess energy with respect to the demand of the user, and the battery system is charged with a maximum power of 5.9 kW.
The operation of the system from the standpoint of view of production and usage of water is shown in Figure 9. The daily operation starts with the refill of desalinated water tank TK2 because during the previous day the stored volume reached the minimum lower deadband level of 50% of the storage volume for the activation of the reverse osmosis unit, RO. Due to a null DHW demand in the first hours of the day, tank TK2 is refilled by the RO unit just before the morning demand of the user at about 6:30 a.m. The operation of the RO unit is performed with the nominal seawater flow of 1600 kg/h from which 240 kg/h of desalinated water is produced. The water stored in tank TK2 allows one to meet the variable demand in the central hours of the day; nonetheless, the activation of the RO unit is needed before 6:00 p.m. since the stored water volume drops to the half storage capacity of the tank. It is noticeable that the volume stored in the tank keeps decreasing after the activation of the RO unit due to a relatively high water demand in the late evening hours, and that only after this demand does the stored volume increase from the minimum value of 0.74 m3. The trend shows that the system is robust in providing the demanded water with a relatively small, desalinated water flowrate given by the RO unit and a proper storage tank volume. Therefore, similarly to renewable energy sources, in islanded systems requiring freshwater, it is possible to match the user demand with an adequate storage capability despite a limited generation capability.
4.2. Daily Results for a Summer Day
The representative operation of the polygeneration system in terms of temperatures for the summer day of 29 July is shown in Figure 10. Condenser, COND, outlet temperature is higher in the first part of the day (68 °C) compared to the remaining part (65 °C). This occurs because the morning hours of operation are characterized by relatively high temperatures in the loop that manages the cogenerated heat, due to a scarce demand for heat from the user (DHW and space cooling). In fact, at the beginning of the day, tank TK1 is already above the maximum set point temperature of 65 °C, along with the temperature at the outlet of pump P2 (returning to COND). Such temperatures are almost the same since the TK1 tank top and bottom temperatures are similar due to a small heat utilization. This situation changes in the morning hours when a drop in the temperatures in the system can be observed starting from the maximum of 67 °C. TK1 tank temperature drops below 65 °C before 11:00 am, and one hour earlier, the same occurs for the outlet of pump P2, which determines the end of the necessity of cooling down the water returning to the condenser, COND, by the auxiliary heat exchanger, AHX. As occurred in the winter day, here, also, TK3 tank temperature follows that of TK1 due to continuous heat exchange between the tanks.
The trend of the temperature of tank TK1 shows also that the generator of the adsorption chiller is always operated at a temperature above 60 °C without the activation of the backup heater, AUX. Thus, for the selected day, space cooling is generated only with the cogenerated heat from the steam cycle. The increase in the cooling demand of the user can be observed by analyzing the trend of the outlet temperature from the generator (ACH,GEN) and the user cooling distribution system (COOL,USER). In the first case, the difference of temperature between tank TK1 and the adsorption chiller, ACH, generator outlet increases during the day, achieving a maximum of 3.0 °C, while for the chilled water, the difference between the outlet (COOL,USER) and inlet (ACH,EVA) temperature of the cooling system reaches a maximum of 3.2 °C. In general, the operation condition of the adsorption chiller, ACH, allows one to achieve a stable chilled water set point temperature of 10 °C due to temperature levels inside tank TK1, which are adequate to the device’s manufacturer specifications.
The summer operation of the system is more clear when analyzing the thermal power trends in Figure 11. At the beginning of the day, the boiler, BOIL, runs at minimal capacity (30%) in order to keep running the steam turbine, ST, in the specified operation range of temperature, pressure, and mass flowrate. This occurs because both space cooling and DHW demands are relatively low in such a period; thus, the majority of the heat rejected by the condenser, COND, is dissipated by the auxiliary heat exchanger, AHX. The presented situation continues until the concurrent demand of heat by the adsorption chiller generator (ACH,GEN) and for the production of DHW in the morning hours determines a decrease of the temperature in the loop storing the thermal energy produced by the steam cycle. It is interesting to note that the response of the steam cycle in terms of heat generation is delayed by about 1 h with respect to the rising demand for heat of the ACH in the morning hours. This trend is due to the thermal capacity of the TK1 tank and its relatively high temperature. Conversely, a much more rapid response of the variation of boiler, BOIL, and condenser, COND, power is achieved when the DHW demand peaks before 8:00 p.m., since it causes a noticeable variation of the TK1 tank.
In Figure 12, the electrical powers concerning the summer operation of the system are shown. The steam turbine, ST, operates for about half of the time at a minimum load of 1.5 kW, while in the remaining time, the power reaches a maximum power of 3.6 kW as a consequence of the increases in the cooling load of the user. The wind turbine, WT, in the first part of the day is turned off since the wind speed does not reach the cut-in threshold of the unit, while in the second part of the day, two periods of significant wind availability are present allowing the device to achieve a relative maximum of 2.0 and 4.1 kW. A similar maximum production is also achieved by the photovoltaic field, PV, at about 1:00 p.m., due to the peak of solar energy availability.
The operation of the battery is variable since it shifts from a period of discharging and charging over the day, depending on the ongoing production of power and the demand of the user. For the selected day, the battery system, BAT, provides 21.2% of the demand of the user, which is a significant contribution for covering the user load in the selected day.
4.3. Monthly Results
The monthly thermal energies of the system and the thermal demand of the user are presented in Figure 13 and Figure 14, respectively. The thermal energy produced by the condenser, COND, is the highest in the first month due to the heat demand of the user, and it varies between 10.2 and 15.5 MWh throughout the year. In general, the steam cycle system runs at a higher load in winter with respect to the summer; nevertheless, the differences between these two periods are not significant since the mean energy produced in the first three months of the year is only less than 2% higher than the one in the summer months (June–August). Therefore, from the point of view of heat generation in the system, the winter and summer periods are similar despite a different type of heat demand of the user.
The thermal energy dissipation of the auxiliary heat exchanger, AHX, in each month is always above zero, and this means that the system is not able to effectively partialize the heat produced when needed. Such a condition is due to the technological/thermodynamic limits of the steam cycle adopted, characterized by a relatively low pressure/temperature operation, as well as efficiency. Unfortunately, it is not possible to reduce the load of the steam cycle below a certain limit imposed by the turbine operational range. The ratio of the thermal energy dissipated by the AHX with respect to the one rejected by the condenser, COND, oscillates between 3% in the 1st month and 71% in the 10th one. The peaks of energy dissipation are achieved in the periods of shifting between the heating and cooling demand of the user when the space conditioning demand of the user is null.
In the operation period, the adsorption chiller generator (ACH,GEN) absorbs 37.6% of the thermal energy of the condenser, COND, while the remaining part is supplied to tank TK3 to produce DHW (19.3%) or it is dissipated by the AHX (43.1%). During the activation months of the adsorption chiller, ACH, the production of cooling energy by the ACH evaporator (ACH,EVA) follows the demand of the user as expected without any significant differences due to the lack of a cold storage tank in the system that may produce heat (cool) losses.
The results point out also that the stabilization of the monthly thermal load of the system by DHW demand is scarce, since, despite a more or less constant trend, the DHW demand is relatively low with respect to other thermal loads of the user. Indeed, DHW demand accounts for a share between 16.3 and 23.9% of the thermal energy produced by the condenser, COND.
It is worth mentioning that the monthly thermal energy provided by the auxiliary heater, AUX, is two orders of magnitude lower with respect to the other energy flows, thus it has been omitted in the graph.
The operation of the system in terms of electrical energies is shown in Figure 15. The steam turbine, ST, produces energy in the range of 1.1 and 1.64 MWh, with a variation of 34% due to the change of the user’s thermal demand over the year. Higher variation of the energy yield is observable for the photovoltaic field, PV, with an oscillation of 55% between winter’s worst and summer’s best month, while for the wind turbine, WT, energy production varies between 2.1 and 3.3 MWh, and the variation is 37%. The trend of energy produced by the generator set, GSET, shows that the system relies each month on the activation of the auxiliary source of energy. The energy generated by the GSET ranges between 95 and 473 kWh, making the device mandatory to match the user demand despite the presence of a battery system, BAT, and a constant operation of the steam turbine. The energy storage allows one to provide energy to the user by discharging (BAT, discharge) between 373 and 697 kWh, showing its important role in saving the system from a more frequent activation of the GSET.
The trend of dumped energy (DUMP) reveals that the system is subject to a significant ineffectiveness from the point of view of the utilization of produced electrical energy. Indeed, the energy dumped varies between 0.75 and 2.00 MWh. This is due to the intrinsic characteristic of the user demand, thermal load strategy adopted, and availability of solar and wind energy.
The performance parameters of the main energy conversion devices present in the system are shown in Figure 16. The steam turbine’s normalized equivalent number of operation hours (n,ST) is relatively low as it does not exceed 0.5 during the whole year. Such a situation is due to the fact that the steam cycle system has a high heat-to-power ratio, caused by the adopted Rankine cycle parameters, which limits the electrical energy production even when the heat demand of the user is substantial. Conversely, better utilization of the installed power capacity is achieved by the wind turbine, WT, whose normalized performance index (n,WT) varies between 0.28 and 0.46 due to the favorable wind conditions of the selected location. Moreover, as pointed out by the energy results, the operation of the GSET is marginal since its normalized energy production with respect to its nominal capacity (n,GSET) keeps between 0.009 and 0.042.
The change in the PV performance over the months is not significant because the efficiency (η,PV) drops meanly only by 6% with respect to the maximum value of 0.194 achieved in the second month. This result is mainly due to a relatively low temperature coefficient of the PV modules. Furthermore, an opposite trend to the PV efficiency is achieved by the COP of the adsorption chiller, ACH, as its values are higher in the central months compared to the ones at the beginning and end. The maximum COP result is 0.626 while the minimum one is 0.571. The difference is achieved because during the central months of operation, the temperature returning from the user is relatively higher which allows to achieve better thermal performance of the adsorption chiller.
The trends reported in Figure 17 show the distribution of electrical energies generated by the devices in the system (ST, WT, PV and GSET), and the ratio of energy dumped (DUMP) and supplied to the battery (BAT) with respect to the energy produced. The contribution in energy production throughout the months is highest in the case of the wind turbine, WT, whose utilization factor oscillates between 0.474 and 0.640, followed by the steam turbine, ST, with a contribution in the range of 0.203 and 0.328, and, finally, there is the photovoltaic field, PV, with a 0.069–0.177 share. For the GSET, the energy generated accounts for between 0.022 and 0.086 of the total energy produced.
The ratio of energy dumped monthly varies throughout the year from 18.5 to 39.1%, which significantly affects the performance of the system in terms of effective operation. A lower value could be achieved with a higher capacity of battery system, BAT, since in the investigated case, it stores between 7.5 and 16.5% of the monthly energy produced. This energy is completely supplied to the user as shown by the electrical energy trends (Figure 15). Thus, the battery system is crucial to buffer the energy between the production and the load; indeed, with a higher capacity, it could be possible to reduce both the dumped energy and the activation of the auxiliary generator set.
The utilization of the energy generated or stored in the system is shown in Figure 18. The user demand is directly matched by the produced renewable energy (directly generated) in a range between 72.0 and 81.4%, while the electrical storage system (BAT) provides energy from 8.7 to 21.3% of the total load. The last contribution is from the generator set (GSET), with a range between 2.9 and 12.3%. These results show that the system in the major part is powered by renewables, but a small amount of energy must be provided from a dedicated system that is not affected by variation of availability of renewable energies such as solar and wind or it is dependent on the thermal loads of the user.
Finally, the ratio of energies generated, used to charge the battery, and dumped with respect to the demand are shown in Figure 19. It is interesting to note that the system is able to produce a monthly amount of energy that is significantly higher with respect to the user needs, as the ratio of generated to demanded energy (generated/demanded) oscillates from 1.27 to 1.74. This means that the system produces at least more than 27% of energy compared to the user demand. Unfortunately, as shown previously, this energy is in significant part dumped due to the time variation of both load and production patterns. Performing a comparison with the demand, the dumped energy (dumped/demanded) results in between 21.4 and 65.6% of the monthly needs. This shows that the system has a significant potential of effectively supplying energy that is not utilized, and this situation may change if other users outside the system could benefit from the dumped energy. Alternatively, with a higher battery system capacity, it could be possible to increase the energy supplied to the battery (BAT,charge/demanded), increasing at the same time the demand covered by renewables and reducing the waste of energy.
4.4. Yearly Results
The annual analysis of the considered polygeneration system was carried out on the basis of a one-year integration period within the simulation. Main thermal and electrical energies in the system components, as well as the energy and economic indexes of the system, are reported in Table 4, Table 5, Table 6 and Table 7.
The analysis of the results points out that the thermal energy produced by the boiler (BOIL) is converted into 89.4% (130.00 MWh) of cogenerated heat available at the condenser (COND). However, this amount of energy is not fully used because 29.8% is dissipated by the auxiliary heat exchanger (AHX) due to the overheating of tank TK1 occurring when the steam turbine, ST, runs at minimum load and there is a scarce demand of heat. The heat supplied to tank TK1 is in part diverted to produce DHW in tank TK3 (USER,DHW), supplied to the heating system of the user (USER,HEAT), and to drive the adsorption chiller (ACH,GEN). The distribution of heat among these uses is 28.7, 44.3, and 27.0%, respectively, highlighting that the highest thermal energy consumption of the system consists of space heating. Moreover, it is important to note that the production of auxiliary heat (AUX) is negligible with respect to the one provided by the COND; in fact, it is only 0.12%. This result is achieved because the production of heat in the system is constant, and only in some peaks of concurrent heat demand for DHW and space conditioning is the steam cycle incapable of matching entirely the needs of the user.
The yearly electrical energies of the system components are reported in Table 5. The energy generated by steam turbine, ST; wind turbine, WT; and photovoltaic field, PV, together is 39.1% higher than the one consumed by the system auxiliaries; reverse osmosis, RO; and user. ST, WT, and PV contribute for 27.5, 58.8, and 13.6% of the total electrical renewable energy produced by the system. The higher contribution of the wind turbine is due to the higher nominal power of this component with respect to the other ones (10 kW vs. 5 kW) and to the favorable wind conditions of the Pantelleria island. The energy results also confirm that the operation of the GSET is marginal in terms of generation since it produces only 2.87 MWh, being significantly lower than the other electrical energy generators. Therefore, the proposed system is solid in providing renewable electrical energy to the user with a limited use of fossil origin fuels for matching the load. Conversely, higher amounts of energy are managed by the energy storage BAT energy during the yearly operation. In fact, with a utilization of 6.54 MWh, the battery absorbs 11.7% of the energy produced by renewables, while it returns to the user a slightly lower amount due to the charging losses occurring in the energy exchange process.
The variability of both the electrical load and production over the year causes a significant production of energy in excess which is unused. In fact, dumped energy (DUMP) accounts for 27.7% of the total yield from renewable energy sources. This negative result of the operation of the system is unavoidable in order to limit the activation of the auxiliary generator system but could be limited with a different combination of the capacities of the steam turbine, ST; wind turbine, WT; and photovoltaic field, PV, along with the battery system, BAT.
As regards the demand of the system and user for electrical energy, the share of consumption of both the system auxiliaries and the reverse osmosis unit, RO, is about three times lower than the user intrinsic demand. Thus, the addition of the polygeneration system does not substantially affect the final demand of energy of the system user.
The performance parameters of the system components are presented in Table 6. The efficiency of the steam turbine, ST, due to assumptions on the thermodynamic cycle is relatively low (10.6%), nevertheless its operation allows one to achieve a satisfactory normalized equivalent number of operation hours of more than 0.35. This points out that despite a thermal load following strategy of the steam turbine, the production of electrical energy reaches a decent level with respect to the maximum potential at nominal power. A similar result is also achieved by the wind turbine, WT, with a normalized equivalent time of operation above 0.37, while for the generator set, GSET, this parameter drops to 0.022, and it underlines once again the rare activation of the auxiliary component. For both the photovoltaic field, PV, and the adsorption chiller, ACH, the performance achieved is lower than the nominal one due to their operating temperature. For the PV during summer, the modules operate at a temperature higher than the reference one, while for the ACH, the chilled water set point temperature (10 °C) is lower than the one provided by the manufacturer at nominal conditions.
The performance of the system from the standpoint of view of primary energy and economics is reported in Table 7. Analyzing the scenarios investigated, it can be clearly noticed that the best PES is achieved by the combination of a proposed system connected with the grid PS-GRID (without GSET) and a reference system running on a GSET (namely RS-GSET), followed by the islanded variant (PS-IS) coupled with the previous reference system (RS-GSET). This is obtained because the RS systems using LPG are characterized by a high primary energy consumption due to the use of fossil fuels.
In terms of PESr, the islanded configuration of the system (PS-IS) allows one to achieve a very high saving of primary energy with respect to reference systems in both islanded (RS-GSET) and grid-connected (RS-GRID) configurations since it is above 90%. It is interesting to note that the PESr is above the unit for the other two combinations of PS connected to the grid (PS-GRID) independently from the assumed reference system. Such a result is given by the supply of electrical energy produced in excess by the system to the grid, and this energy is free of primary energy consumption being produced by renewables. The lower value of PESr in the case of the PS-GRID and RS-GSET combination with respect to the one with RS-GRID is only due to the fact that the primary energy consumption of RS-GEST is higher than in the case of RS-GRID. Thus, the effect of supplying renewable energy to the grid is marginally lower.
The operation cost for the investigated PS and RS systems depends substantially on the configuration considered. The lowest cost of operation for the PS is achieved in the scenario where the system is grid-connected, as the possibility to sell the electrical energy in excess to the grid allows one to cut the yearly bill of the proposed system. In fact, the operation cost of PS-IS with respect to PS-GRID is 61.0% higher. In the case of not-free biomass, the additional cost for the renewable fuels is 2.95 EUR/year, whichever is the adopted scenario for PS. Thus, the biomass cost could have a significant effect on the operation cost if bought on the market, making the option of free local biomass very convenient.
The achievable economic savings and the simple payback time are better in scenarios where the PS is grid-connected. For the investigated system, the grid connection allows one to avoid the cost of GSET and to achieve a SPB mean 1.83 years lower with respect to the islanded scenarios (PS-IS), with a range between 1.48 and 2.20 years. However, even if the system works in islanded mode, its economic feasibility is fairly reliable since SPB is lower than 10 years for 3/4 of the scenarios. Obviously, higher times of capital recovery are achieved in the case of market-priced biomass, since the BIO scenario increases SPB from 1.30 to 3.05 years compared to a free biomass condition.
5. Conclusions
In the present paper, a comprehensive analysis of a hybrid polygeneration system integrating renewable energy sources such as biomass, wind, and solar was performed by means of a numerical modeling approach and dynamic simulations. The designed system integrates a steam turbine-based Rankine cycle, a horizontal axis wind turbine, and a photovoltaic field coupled with electrical storage for the production of electrical energy, a heat recovery system of cogenerated thermal energy with a storage and adsorption chiller for the production of heating, cooling, and domestic hot water, and a reverse osmosis desalination unit for the production of freshwater from seawater. The system is also equipped with an LPG generator as an auxiliary device to match the load. For the case study, a small, isolated community of 10 households on Pantelleria Island, Italy, was considered.
The system was developed and simulated using TRNSYS software, which allowed one to model in detail the components and the whole system on the basis of validated components on the basis of the scientific literature and manufacturers’ data regarding the performance of devices. The user was simulated using real data regarding domestic hot water and electrical energy consumption, and the realistic heating and cooling demand of the buildings obtained within the simulation.
The performance of the proposed system was performed assuming a reference system, and, for both, different scenarios were considered. Stand-alone or grid-connected situations were assumed for both systems, affecting the necessity of not adopting LPG generator sets. Moreover, for the polygeneration system, freely available or market origin biomass was considered. The simulation carried out allowed one to investigate the detailed operation of the system on the basis of temperatures, powers (thermal and electrical), and water production/usage. On the other hand, a global assessment of the system was performed on the basis of aggregated data regarding energy and economic flows.
The results obtained from simulations are the following:
- -
- the freshwater volume stored may decrease after the activation of the reverse osmosis unit due to a relatively high water demand; nevertheless, the system is robust in providing the demanded water with a relatively small, desalinated water flowrate given by the RO and a proper storage tank volume;
- -
- the activation of the auxiliary generator set is not frequent, and it occurs typically during the morning hours when the battery is discharged and the photovoltaic production is null and the reverse osmosis is turned on;
- -
- during the summer days, despite the operation of the steam cycle at minimum load (30%) in the night and morning hours, the dissipation of cogenerated heat is needed since both space cooling and DHW demands are relatively low in such period;
- -
- the monthly thermal energy produced varies between 10.2 and 15.5 MW; the steam cycle system runs at a higher load in winter with respect to the summer; nevertheless, the differences between these two periods are not significant since the mean energy produced in the first three months of the year is only less than 2% higher than the one in the summer months (June–August);
- -
- the stabilization of the monthly thermal load of the system by DHW demand is scarce; indeed, DHW demand accounts for a share between 16.3 and 23.9% of the thermal energy produced by the cycle;
- -
- the steam turbine produces energy in the range of 1.1 and 1.64 MWh per month (variation of 34%); higher variation of the energy yield is observable for the photovoltaic field with an oscillation of 55% between winter’s worst and summer’s best month, while for the wind turbine, the variation of energy production is smaller, being only 37%;
- -
- due to characteristics of the user demand, thermal load strategy adopted, and availability of solar and wind energy, the system is subject to a significant ineffectiveness from the point of view of the utilization of produced electrical energy; in fact, the energy dumped monthly varies between 0.75 and 2.00 MWh;
- -
- the contribution in energy production throughout the months is highest in the case of a wind turbine, whose utilization factor oscillates between 0.474 and 0.640, followed by the steam turbine with a contribution in the range of 0.203 and 0.328. For the generator set, the energy generated accounts for between 0.022 and 0.086 of the energy totally produced;
- -
- on yearly basis, the generated renewable electrical energy is 39.1% higher than the one consumed by the system auxiliaries, reverse osmosis, and the user, while the dumped energy accounts for 27.7% of the total yield from renewable energy sources;
- -
- the islanded configuration of the proposed system allows one to achieve a saving of primary energy above 90% with respect to reference systems in both islanded and grid-connected configurations since it is above 90%. The saving is above 100% for the combinations of a proposed system connected to the grid independently from the assumed reference system. Such a result is given by the supply of renewable electrical energy produced in excess by the system to the grid;
- -
- the grid connection allows one to avoid the cost of the generator set and to achieve a simple payback meanly 1.83 years lower with respect to the islanded scenarios. However, even if the system works in islanded mode, a simple payback time of 10 years is achievable in the majority of the scenarios. Higher times of capital recovery are achieved in the case of biomass bought on the market since this case is characterized by a capital recovery from 1.30 to 3.05 years higher with respect to the free biomass scenario.
The presented results allow one to conclude that it is possible to develop an energy system allowing to satisfy user needs in the field of electric energy, thermal energy including cooling needs and domestic hot water, and freshwater production. Economic analysis shows that depending on the analyzed scenario, it is possible to achieve a payback period in a range from 5.67 to 12.20 years, which proves profitability. The investigations performed are the basis for further developments of the study, where a complex analysis of the proposed system by means of parametric/sensitivity and optimization approach is the next step. Future investigations will also include considering subsidies policy and load profiles adapted to other types of users. Including long-term energy storage based on hydrogen and its impact on the energy safety of the community will also be considered in further research.
Author Contributions
Conceptualization, R.F., M.Ż., M.H. and A.P.; methodology, R.F., M.H. and A.P.; software, R.F.; validation, R.F., M.H. and A.P.; formal analysis, R.F.; investigation, R.F., M.H. and A.P.; resources, R.F. and M.Ż.; data curation, R.F. and M.Ż.; writing—original draft preparation, R.F., M.H. and A.P.; writing—review and editing, R.F. and M.Ż.; visualization, R.F. and M.Ż.; supervision, R.F. and M.Ż.; project administration, R.F. All authors have read and agreed to the published version of the manuscript.
Funding
This research has been carried with statutory research funds of the Faculty of Energy and Fuels, AGH UST in Krakow. Part of this research was funded by the Polish Ministry of Higher Education on the basis of the decision number 0086/DIA/2019/48.
Institutional Review Board Statement
Not applicable.
Informed Consent Statement
Not applicable.
Data Availability Statement
Not applicable.
Acknowledgments
This work was carried out under Subvention and Subvention for Young Scientists, Faculty of Energy and Fuels, AGH University of Science and Technology, Krakow, Poland. The authors acknowledge the use of the infrastructure of the Center of Energy, AGH UST in Krakow. Research supported by the Foundation for Polish Science (FNP).
Conflicts of Interest
The authors declare no conflict of interest.
References
- 1 in 3 People Globally Do not Have Access to Safe Drinking Water–UNICEF, WHO. Available online: https://www.who.int/news/item/18-06-2019-1-in-3-people-globally-do-not-have-access-to-safe-drinking-water-unicef-who (accessed on 27 July 2022).
- Thinking about Energy and Water Together Can Help Ensure That “No One Is Left behind”–Analysis-IEA. Available online: https://www.iea.org/commentaries/thinking-about-energy-and-water-together-can-help-ensure-that-no-one-is-left-behind (accessed on 27 July 2022).
- Lange, M.A. Impacts of Climate Change on the Eastern Mediterranean and the Middle East and North Africa Region and the Water–Energy Nexus. Atmosphere 2019, 10, 455. [Google Scholar] [CrossRef]
- Desalinated Water Affects the Energy Equation in the Middle East–Analysis-IEA. Available online: https://www.iea.org/commentaries/desalinated-water-affects-the-energy-equation-in-the-middle-east (accessed on 27 July 2022).
- Zahid, M.; Savla, N.; Pandit, S.; Thakur, V.K.; Jung, S.P.; Gupta, P.K.; Prasad, R.; Marsili, E. Microbial Desalination Cell: Desalination through Conserving Energy. Desalination 2022, 521, 115381. [Google Scholar] [CrossRef]
- Ibrar, I.; Yadav, S.; Naji, O.; Alanezi, A.A.; Ghaffour, N.; Déon, S.; Subbiah, S.; Altaee, A. Development in Forward Osmosis-Membrane Distillation Hybrid System for Wastewater Treatment. Sep. Purif. Technol. 2022, 286, 120498. [Google Scholar] [CrossRef]
- Al-Madhhachi, H.; Min, G. Effective Use of Thermal Energy at Both Hot and Cold Side of Thermoelectric Module for Developing Efficient Thermoelectric Water Distillation System. Energy Convers. Manag. 2017, 133, 14–19. [Google Scholar] [CrossRef]
- Thakur, A.K.; Sathyamurthy, R.; Velraj, R.; Saidur, R.; Lynch, I.; Chaturvedi, M.; Sharshir, S.W. Synergetic Effect of Absorber and Condenser Nano-Coating on Evaporation and Thermal Performance of Solar Distillation Unit for Clean Water Production. Sol. Energy Mater. Sol. Cells 2022, 240, 111698. [Google Scholar] [CrossRef]
- Gao, P.; Yan, F.; Cong, J.; Li, Z.; Yan, H.; Teng, J. Theoretical and Experimental Study of a New Freezing Desalination System Assisted by Ultrasound. Desalination 2022, 533, 115772. [Google Scholar] [CrossRef]
- Lim, Y.J.; Goh, K.; Kurihara, M.; Wang, R. Seawater Desalination by Reverse Osmosis: Current Development and Future Challenges in Membrane Fabrication—A Review. J. Membr. Sci. 2021, 629, 119292. [Google Scholar] [CrossRef]
- Jayakody, H.; Al-Dadah, R.; Mahmoud, S. Cryogenic Energy for Indirect Freeze Desalination—Numerical and Experimental Investigation. Processes 2019, 8, 19. [Google Scholar] [CrossRef]
- Tay, K.G.; Song, L. A More Effective Method for Fouling Characterization in a Full-Scale Reverse Osmosis Process. Desalination 2005, 177, 95–107. [Google Scholar] [CrossRef]
- Okampo, E.J.; Nwulu, N. Optimisation of Renewable Energy Powered Reverse Osmosis Desalination Systems: A State-of-the-Art Review. Renew. Sustain. Energy Rev. 2021, 140, 110712. [Google Scholar] [CrossRef]
- Djebedjian, B.; Gad, H.; Khaled, I.; Abou Rayan, M. Management Options of Wadi Faria Baseflow. In Proceedings of the Eleventh International Water Technology Conference, Sharm El-Sheikh, Egypt, 1 January 2007. [Google Scholar]
- Bakhtiari, H.; Zhong, J.; Alvarez, M. Predicting the Stochastic Behavior of Uncertainty Sources in Planning a Stand-Alone Renewable Energy-Based Microgrid Using Metropolis–Coupled Markov Chain Monte Carlo Simulation. Appl. Energy 2021, 290, 116719. [Google Scholar] [CrossRef]
- Palatel, A. Isolated Hybrid Energy Systems for Remote Locations. Encycl. Sustain. Technol. 2017, 205–216. [Google Scholar] [CrossRef]
- Systemy Hybrydowe Odnawialnych Źródeł Energii-Czysta Energia-Tom Nr 11 (2013)-BazTech-Yadda. Available online: https://www.cire.pl/pliki/2/edukacja_stefaniak_1208_ml_po_adpo_kor.pdf (accessed on 27 July 2022).
- Deshmukh, M.K.; Deshmukh, S.S. Modeling of Hybrid Renewable Energy Systems. Renew. Sustain. Energy Rev. 2008, 12, 235–249. [Google Scholar] [CrossRef]
- Wasonga, A.; Saulo, M.; Odhiambo, V.; Solar-Wind, M.S. Solar-Wind Hybrid Energy System for New Engineering Complex- Technical University of Mombasa. Int. J. Energy Power Eng. 2014, 4, 73. Available online: http://www.sciencepublishinggroup.com (accessed on 27 July 2022).
- Sizing and Management of Hybrid Renewable Energy System for Data Center Supply-TEL-Thèses En Ligne. Available online: https://tel.archives-ouvertes.fr/tel-02736497 (accessed on 27 July 2022).
- Sharma, C.; Singh, M.P.; Chaudhary, S. Cost Analysis of Solar-Wind Based Hybrid Renewable Energy System. Lect. Notes Electr. Eng. 2021, 700, 2733–2746. [Google Scholar]
- Acuzar, A.M.A.; Arguelles, I.P.E.; Elisan, J.C.S.; Gobenciong, J.K.D.; Soriano, A.M.; Rocamora, J.M.B. Effects of Weather and Climate on Renewable Energy Resources in a Distributed Generation System Simulated in Visayas, Philippines. In Proceedings of the 2017-9th International Conference on Humanoid, Nanotechnology, Information Technology, Communication and Control, Environment and Management (HNICEM), Manila, Philippines, 1–3 December 2017. [Google Scholar]
- Hussein Ibrahim, M.; Ibrahim, M.A. Solar-Wind Hybrid Power System Analysis Using Homer for Duhok, Iraq. Prz. Elektrotec. 2021, 9, 143. [Google Scholar]
- Boonbumroong, U.; Pratinthong, N.; Thepa, S.; Jivacate, C.; Pridasawas, W. Particle Swarm Optimization for AC-Coupling Stand Alone Hybrid Power Systems. Sol. Energy 2011, 85, 560–569. [Google Scholar] [CrossRef]
- Kalantar, M.; Mousavi, G.S.M. Dynamic Behavior of a Stand-Alone Hybrid Power Generation System of Wind Turbine, Microturbine, Solar Array and Battery Storage. Appl. Energy 2010, 87, 3051–3064. [Google Scholar] [CrossRef]
- Loganathan, B.; Chowdhury, H.; Allhibi, H.; Mustary, I.; Sony, S.M.; Alam, F. Design of a Hybrid Household Power Generation System for a Coastal Area: A Case Study for Geraldton, Australia. Energy Procedia 2019, 160, 820–826. [Google Scholar] [CrossRef]
- Hiendro, A.; Kurnianto, R.; Rajagukguk, M.; Simanjuntak, Y.M. Junaidi Techno-Economic Analysis of Photovoltaic/Wind Hybrid System for Onshore/Remote Area in Indonesia. Energy 2013, 59, 652–657. [Google Scholar] [CrossRef]
- Mokheimer, E.M.A.; Sahin, A.Z.; Al-Sharafi, A.; Ali, A.I. Modeling and Optimization of Hybrid Wind–Solar-Powered Reverse Osmosis Water Desalination System in Saudi Arabia. Energy Convers. Manag. 2013, 75, 86–97. [Google Scholar] [CrossRef]
- Miao, C.; Teng, K.; Wang, Y.; Jiang, L. Technoeconomic Analysis on a Hybrid Power System for the UK Household Using Renewable Energy: A Case Study. Energies 2020, 13, 3231. [Google Scholar] [CrossRef]
- Mentis, D.; Karalis, G.; Zervos, A.; Howells, M.; Taliotis, C.; Bazilian, M.; Rogner, H. Desalination Using Renewable Energy Sources on the Arid Islands of South Aegean Sea. Energy 2016, 94, 262–272. [Google Scholar] [CrossRef]
- Azinheira, G.; Segurado, R.; Costa, M. Is Renewable Energy-Powered Desalination a Viable Solution for Water Stressed Regions? A Case Study in Algarve, Portugal. Energies 2019, 12, 4651. [Google Scholar] [CrossRef]
- Sharma, H.; Monnier, É.; Mandil, G.; Zwolinski, P.; Colasson, S. Comparison of Environmental Assessment Methodology in Hybrid Energy System Simulation Software. Procedia CIRP 2019, 80, 221–227. [Google Scholar] [CrossRef]
- Uche, J.; Muzás, A.; Acevedo, L.E.; Usón, S.; Martínez, A.; Bayod, A.A. Experimental Tests to Validate the Simulation Model of a Domestic Trigeneration Scheme with Hybrid RESs and Desalting Techniques. Renew. Energy 2020, 155, 407–419. [Google Scholar] [CrossRef]
- Klein, S.A.; Beckman, W.A.; Mitchell, J.W.; Duffie, J.A.; Duffie, N.A.; Freeman, T.L.; Mitchell, J.C. TRNSYS 18: A Transient System Simulation Program; Solar Energy Laboratory, University of Wisconsin: Madison, WI, USA, 2017. [Google Scholar]
- Small Wind Turbines Enair, Efficient and Evolved Small Wind Turbines. Available online: https://www.enair.es/en/ (accessed on 18 June 2020).
- Invensor LTC 10 E Plus–InvenSor. Available online: http://invensor.com/en/products/invensor-ltc-10-e-plus/ (accessed on 20 January 2021).
- Żołądek, M.; Sornek, K.; Papis, K.; Figaj, R.; Filipowicz, M. Experimental and Numerical Analysis of Photovoltaics System Improvements in Urban Area. Civ. Environ. Eng. Rep. 2018, 28, 13–24. [Google Scholar] [CrossRef]
- El-Dessouky, H.T.; Ettouney, H.M. Fundamentals of Salt Water Desalination; Elsevier: Amsterdam, The Netherlands, 2002. [Google Scholar]
- American Society of Heating Refrigerating and Air-Conditioning Engineers. ASHRAE HVAC Systems & Equipment Handbook 2000; Ashrae: Atlanta, GA, USA, 2000. [Google Scholar]
- Karakurt, A.S.; Güneş, Ü. Performance analysis of a steam turbine power plant at part load conditions. J. Therm. Eng. 2017, 3, 1121–1128. [Google Scholar] [CrossRef]
- Jankowski, M.; Borsukiewicz, A.; Szopik-Depczyńska, K.; Ioppolo, G. Determination of an Optimal Pinch Point Temperature Difference Interval in ORC Power Plant Using Multi-Objective Approach. J. Clean. Prod. 2019, 217, 798–807. [Google Scholar] [CrossRef]
- Allard, Y.; Kummert, M.; Bernier, M.; Moreau, A. Intermodel Comparison and Experimental Validation of Electrical Water Heater Models in TRNSYS. In Proceedings of the Building Simulation 2011: 12th Conference of International Building Performance Simulation Association, Sydney, Australia, 14–16 November 2011; pp. 688–695. [Google Scholar]
- Figaj, R.; Sornek, K.; Podlasek, S.; Żołądek, M. Operation and Sensitivity Analysis of a Micro-Scale Hybrid Trigeneration System Integrating a Water Steam Cycle and Wind Turbine under Different Reference Scenarios. Energies 2020, 13, 5697. [Google Scholar] [CrossRef]
- Figaj, R. Performance Assessment of a Renewable Micro-Scale Trigeneration System Based on Biomass Steam Cycle, Wind Turbine, Photovoltaic Field. Renew. Energy 2021, 177, 193–208. [Google Scholar] [CrossRef]
- Figaj, R.; Żoładek, M. Operation and Performance Assessment of a Hybrid Solar Heating and Cooling System for Different Configurations and Climatic Conditions. Energies 2021, 14, 1142. [Google Scholar] [CrossRef]
- Figaj, R.; Żołądek, M.; Gory, W. Dynamic Simulation and Energy Economic Analysis of a Household Hybrid Ground-Solar-Wind System Using TRNSYS Software. Energies 2020, 13, 3523. [Google Scholar] [CrossRef]
- Ramasamy, V.; Feldman, D.; Desai, J.; Margolis, R.U.S. Solar Photovoltaic System and Energy Storage Cost Benchmarks: Q1 2021. 2021. Available online: https://www.nrel.gov/docs/fy22osti/80694.pdf (accessed on 27 July 2022).
- Abdelshafy, A.M.; Hassan, H.; Jurasz, J. Optimal Design of a Grid-Connected Desalination Plant Powered by Renewable Energy Resources Using a Hybrid PSO–GWO Approach. Energy Convers. Manag. 2018, 173, 331–347. [Google Scholar] [CrossRef]
- Voutchkov, N. Desalination Project Cost Estimating and Management; CRC Press: Boca Raton, FL, USA, 2018. [Google Scholar]
- Monthly Fuel Prices-Energy and Mining Analysis and Statistics-Ministry of Ecological Transition. Available online: https://dgsaie.mise.gov.it/prezzi-mensili-carburanti?pid=5 (accessed on 27 July 2022).
- Iraqi Academic Scientific Journals-IASJ. Available online: https://www.iasj.net/iasj/article/214413 (accessed on 27 July 2022).
- Natural Gas Price Statistics-Statistics Explained. Available online: https://ec.europa.eu/eurostat/statistics-explained/index.php?title=Natural_gas_price_statistics (accessed on 27 July 2022).
- Electricity Price Statistics-Statistics Explained. Available online: https://ec.europa.eu/eurostat/statistics-explained/index.php?title=Electricity_price_statistics (accessed on 27 July 2022).
- GME-Gestore Dei Mercati Energetici SpA. Available online: https://www.mercatoelettrico.org/En/Tools/Accessodati.aspx?ReturnUrl=%2fEn%2fDownload%2fDatiStorici.aspx (accessed on 27 July 2022).
- Calise, F.; Macaluso, A.; Piacentino, A.; Vanoli, L. A Novel Hybrid Polygeneration System Supplying Energy and Desalinated Water by Renewable Sources in Pantelleria Island. Energy 2017, 137, 1086–1106. [Google Scholar]
- Edwards, S.; Beausoleil-Morrison, I.; Laperrière, A. Representative Hot Water Draw Profiles at High Temporal Resolution for Simulating the Performance of Solar Thermal Systems. Sol. Energy 2015, 111, 43–52. [Google Scholar] [CrossRef]
Figure 1.
Flowchart depicting development of the research.

Figure 2.
Scheme of the developed hybrid polygeneration system.

Figure 3.
The household building geometry parameters.

Figure 4.
Domestic hot water demand.

Figure 5.
Heating and cooling demand.

Figure 6.
Main temperatures for the representative winter operation day.

Figure 7.
Main thermal powers for the representative winter operation day.

Figure 8.
Main electrical powers for the representative winter operation day.

Figure 9.
Water flowrates and stored freshwater volume.

Figure 10.
Main temperatures for the representative summer operation day.

Figure 11.
Main thermal powers for the representative summer operation day.

Figure 12.
Main electrical powers for the representative summer operation day.

Figure 13.
Main thermal energies of the system on monthly basis.

Figure 14.
Monthly heating, cooling, and DHW demand.

Figure 15.
Main electrical energies of the system on monthly basis.

Figure 16.
Energy performance indexes of the system’s main components on monthly basis.

Figure 17.
Utilization factor of devices in energy production, ratio of dumped energy, and ratio of produced energy supplied to the battery on monthly basis.
Figure 17.
Utilization factor of devices in energy production, ratio of dumped energy, and ratio of produced energy supplied to the battery on monthly basis.

Figure 18.
Share of energies in matching the user demand on a monthly basis.

Figure 19.
Ratios of energy generated, used to charge the battery, and dumped with respect to the demand on a monthly basis.
Figure 19.
Ratios of energy generated, used to charge the battery, and dumped with respect to the demand on a monthly basis.


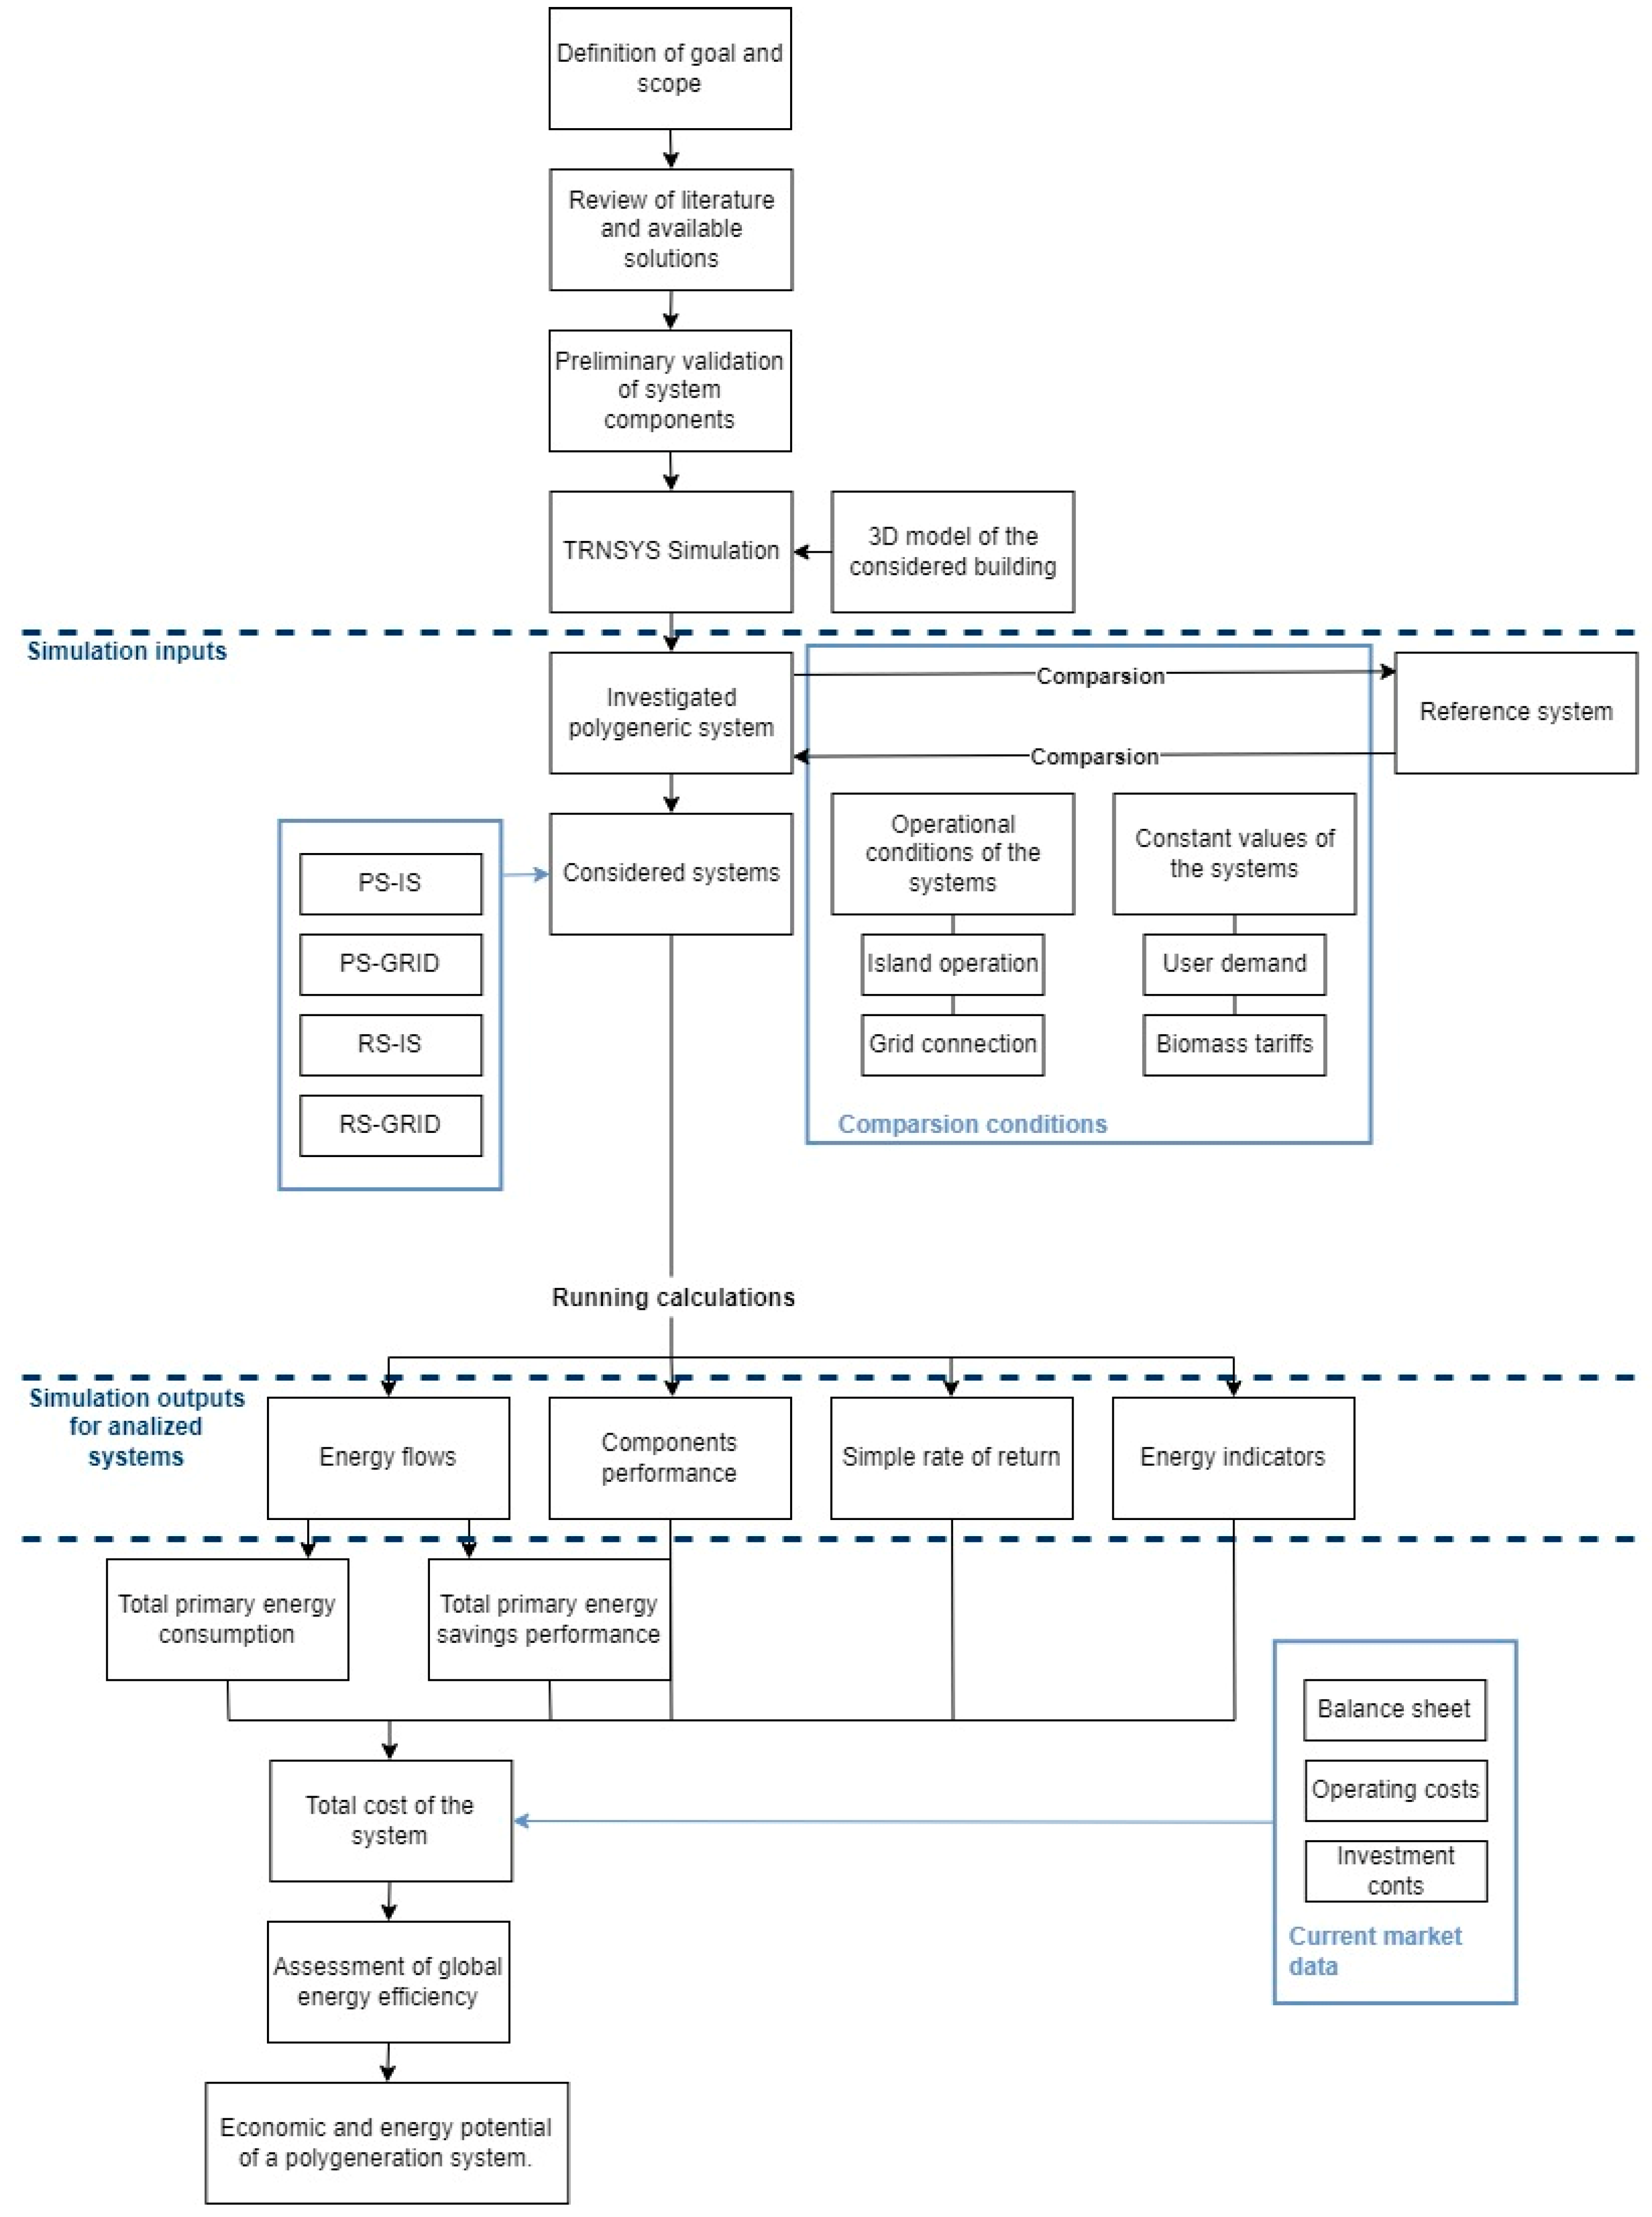
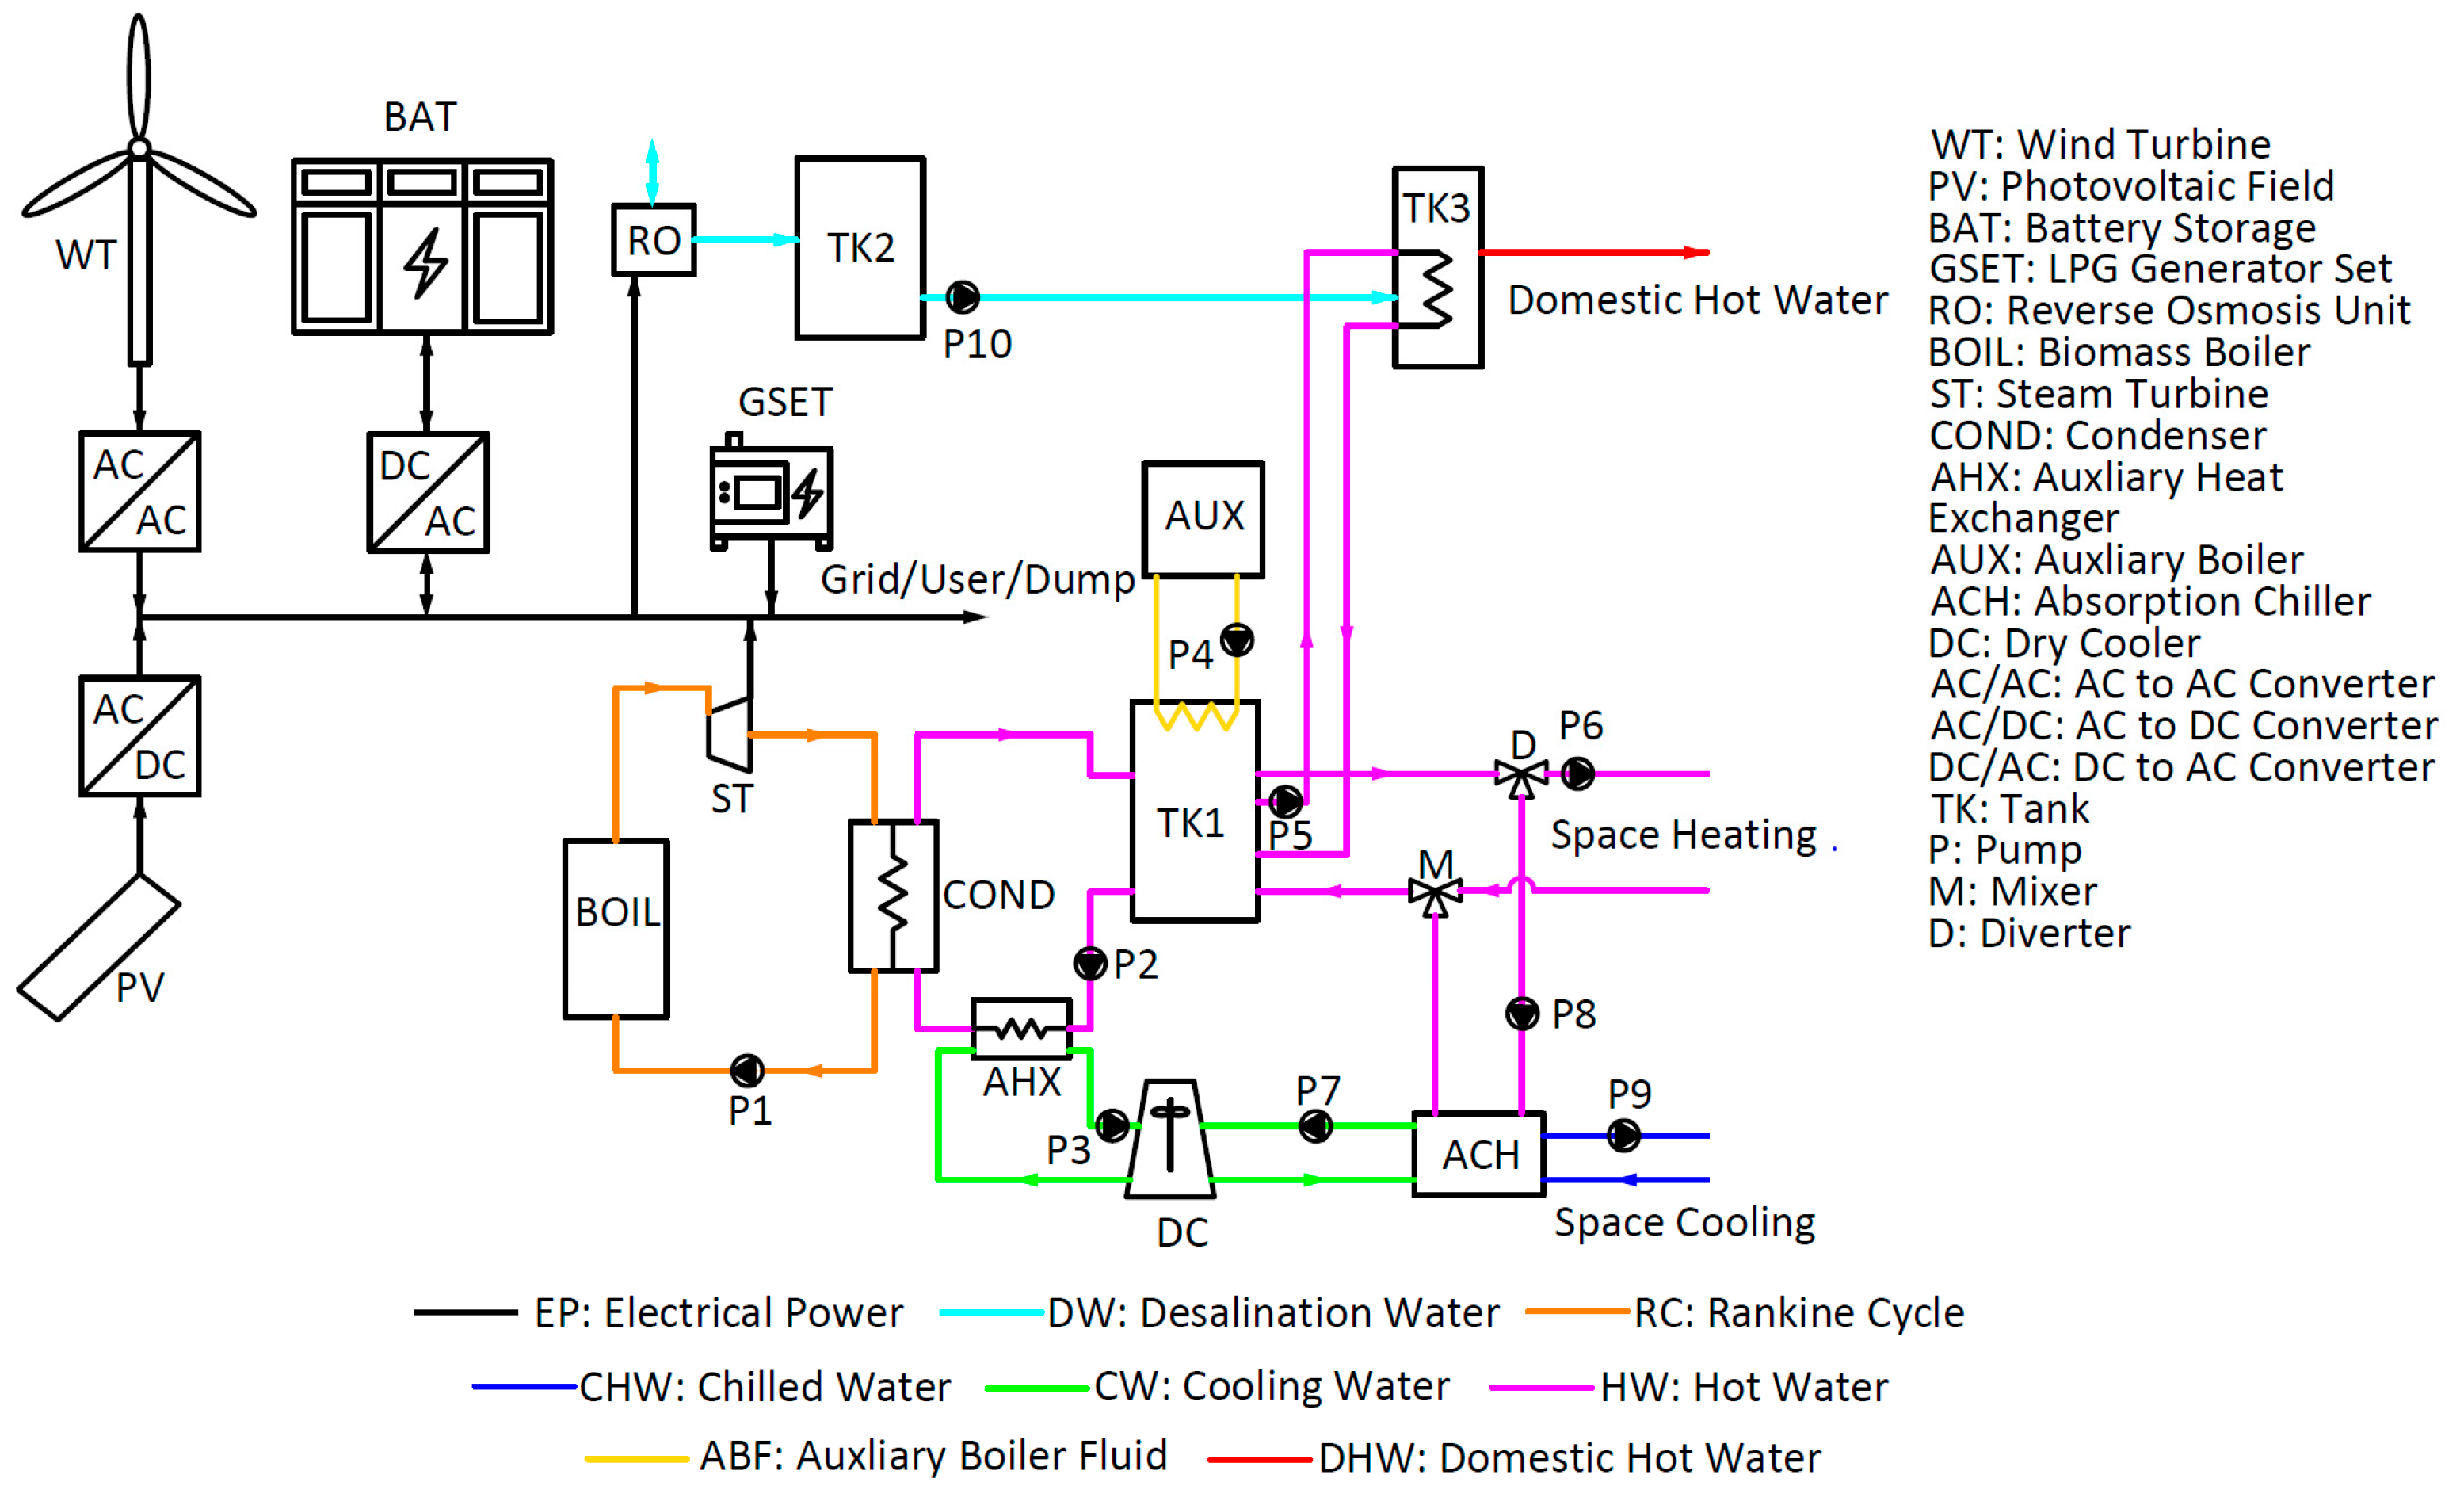
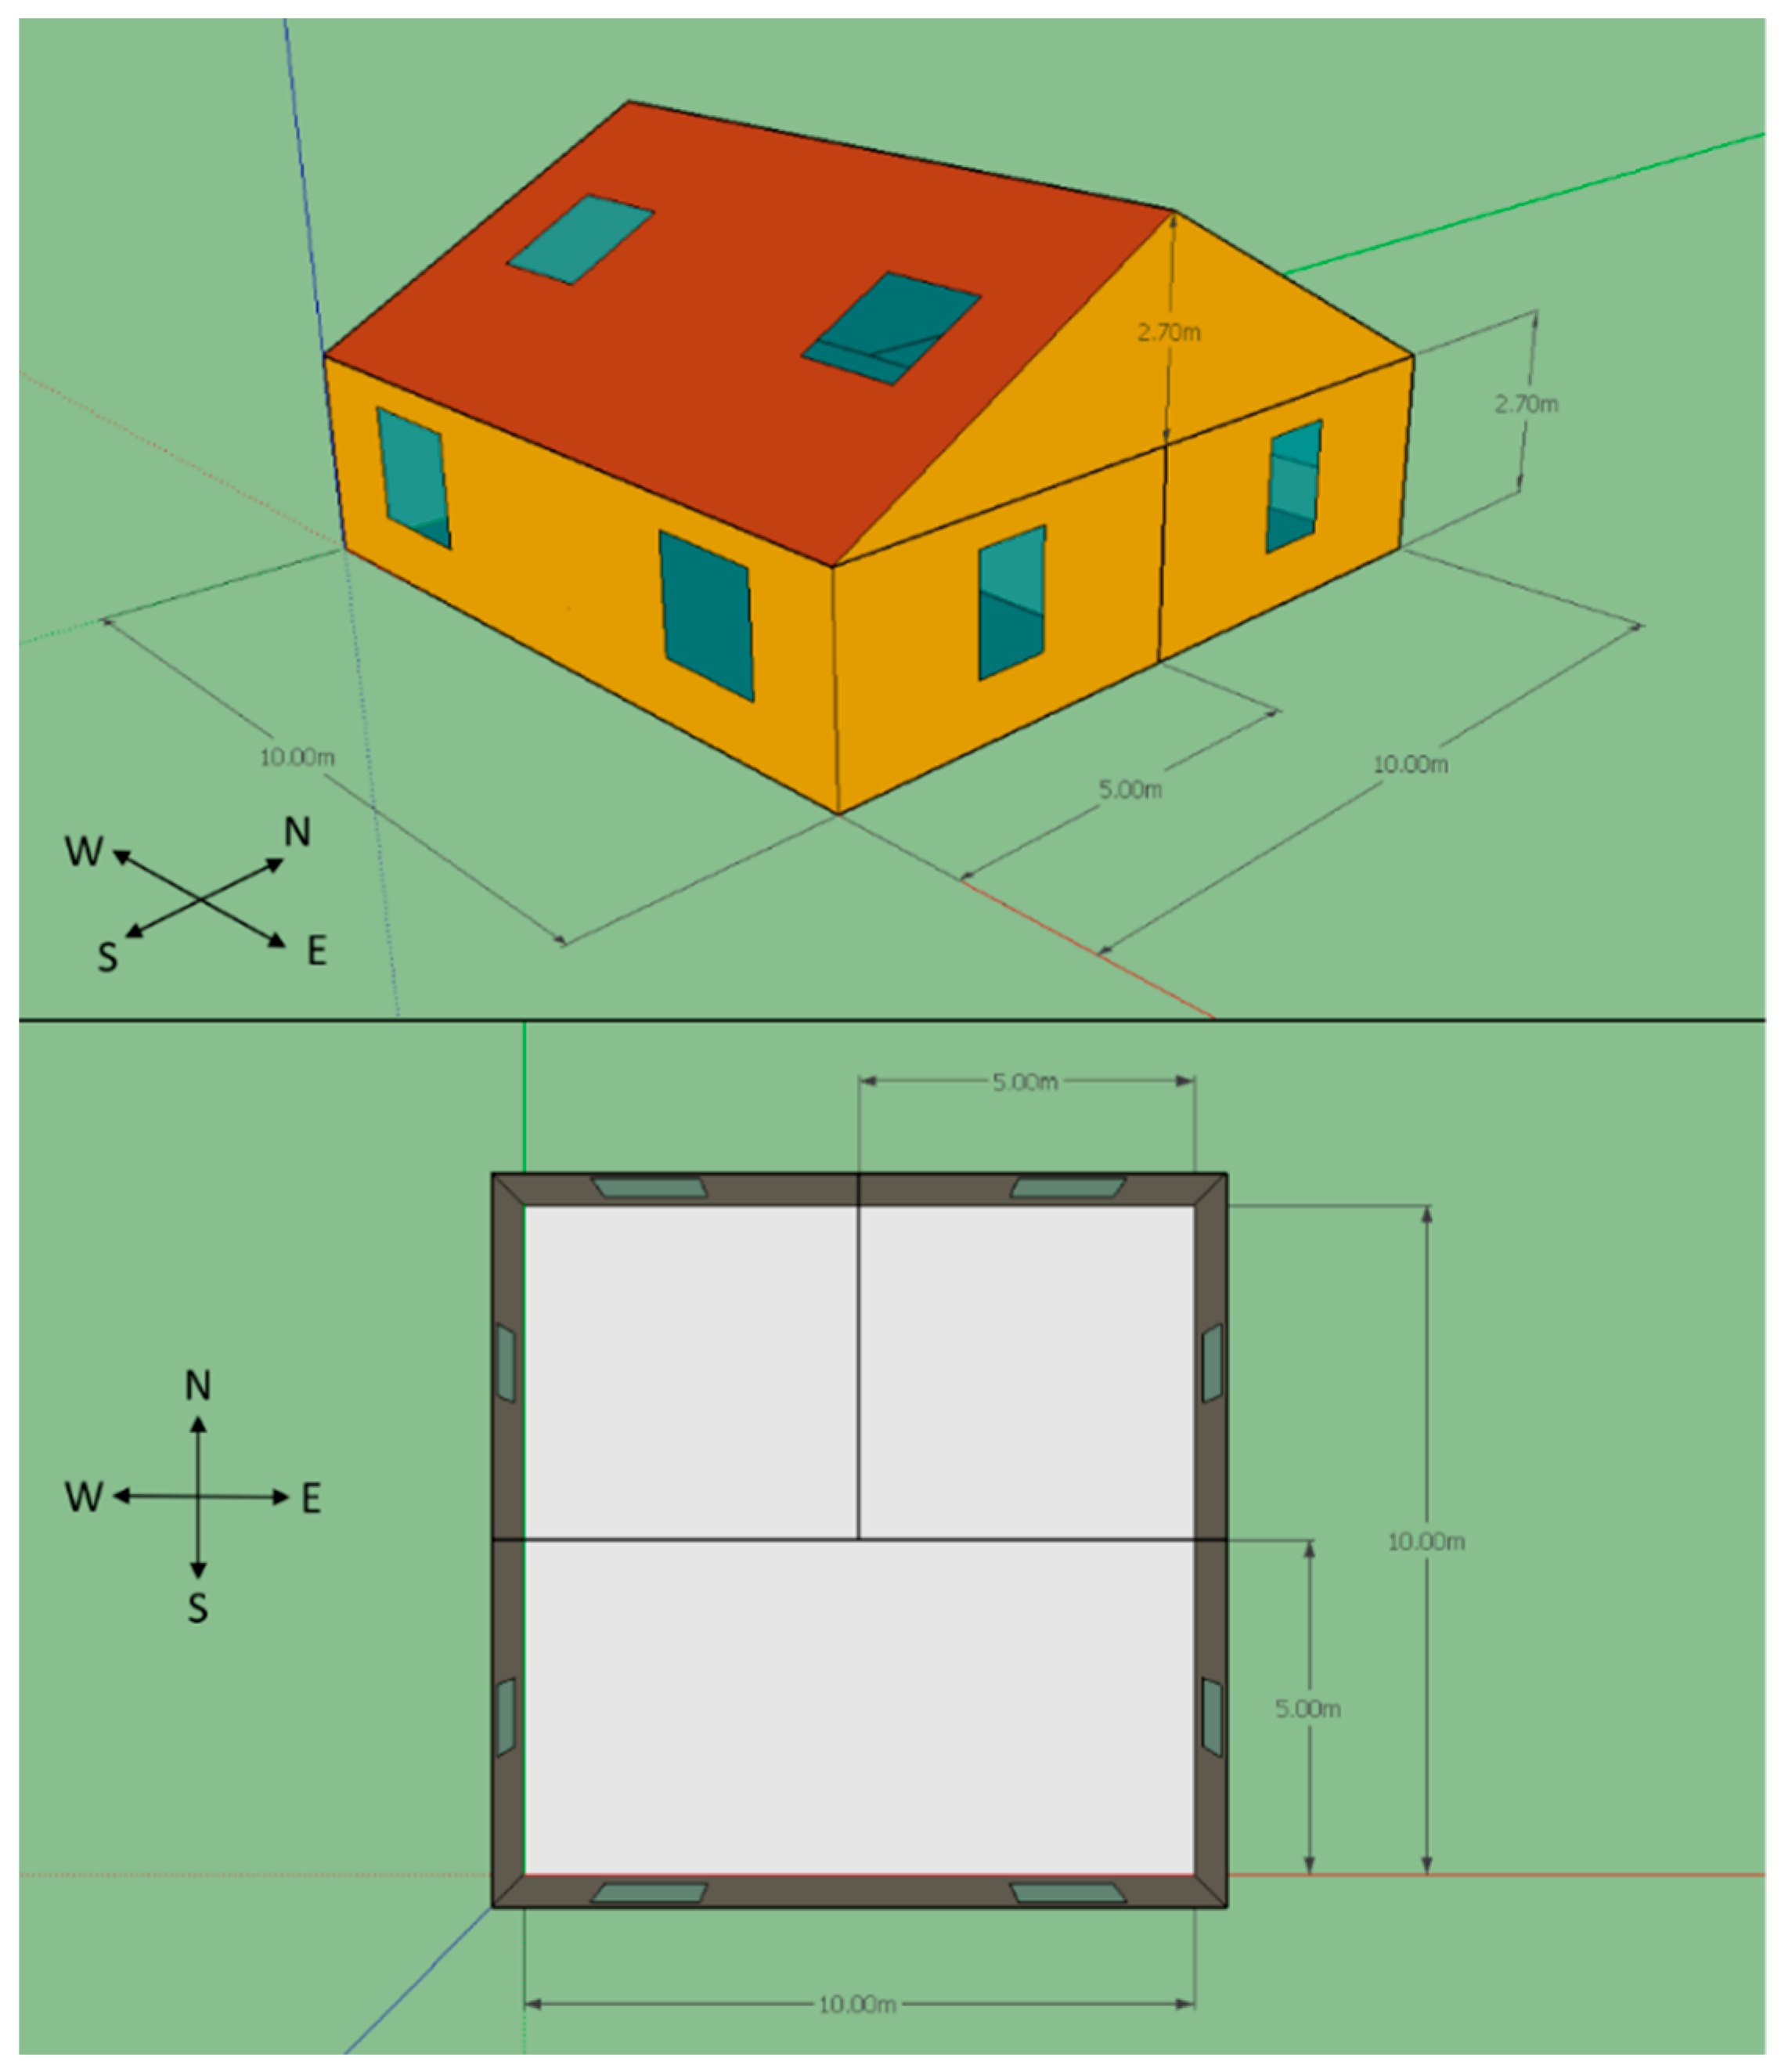
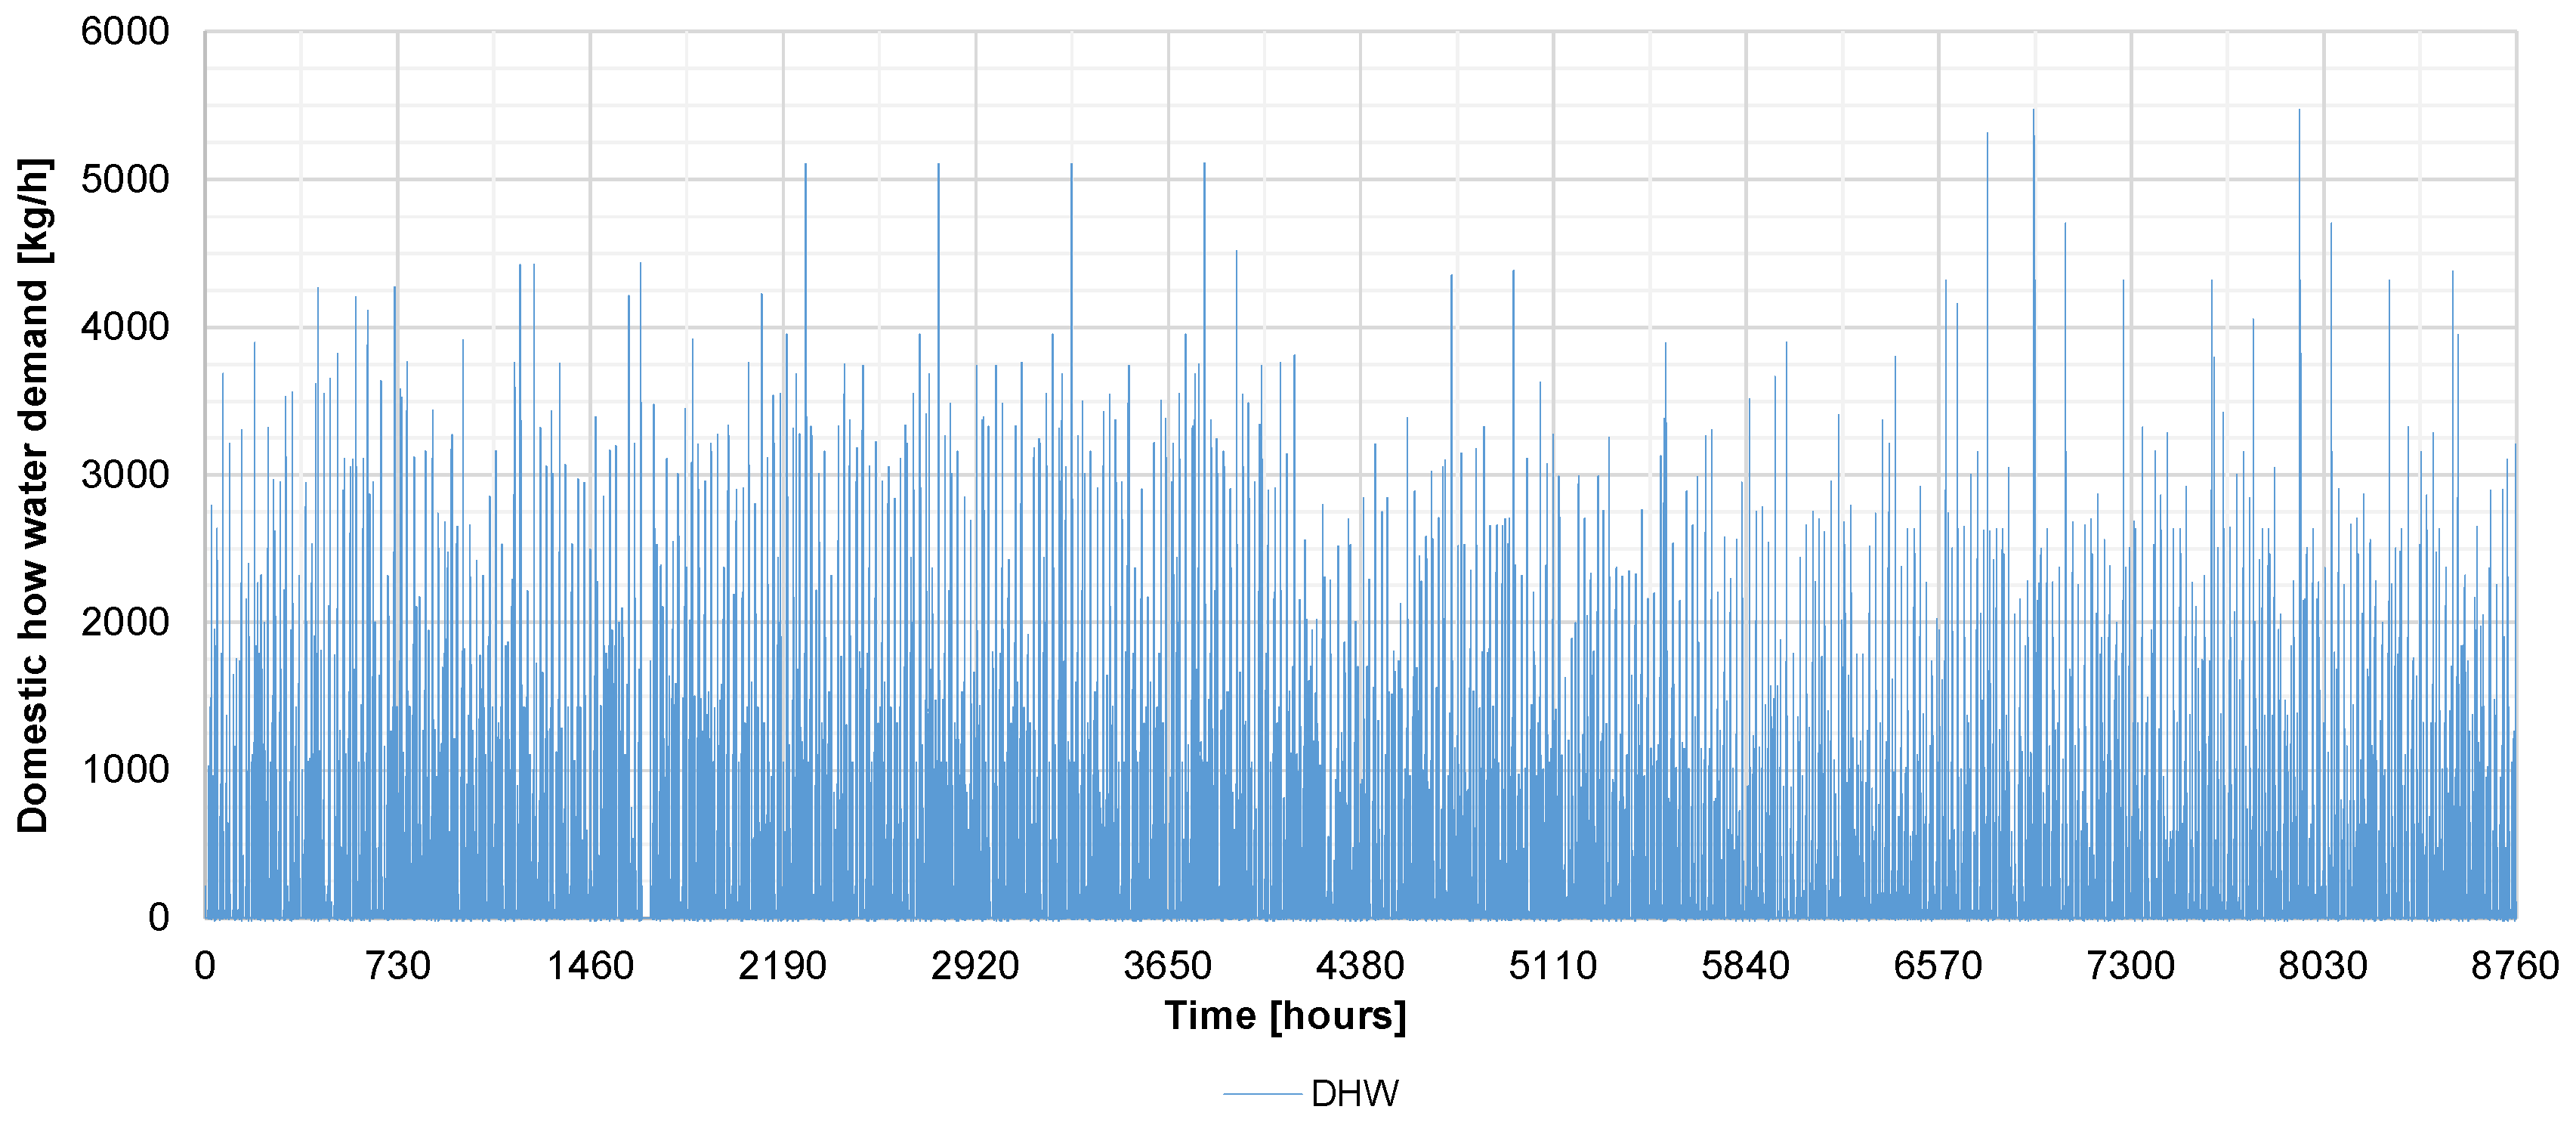
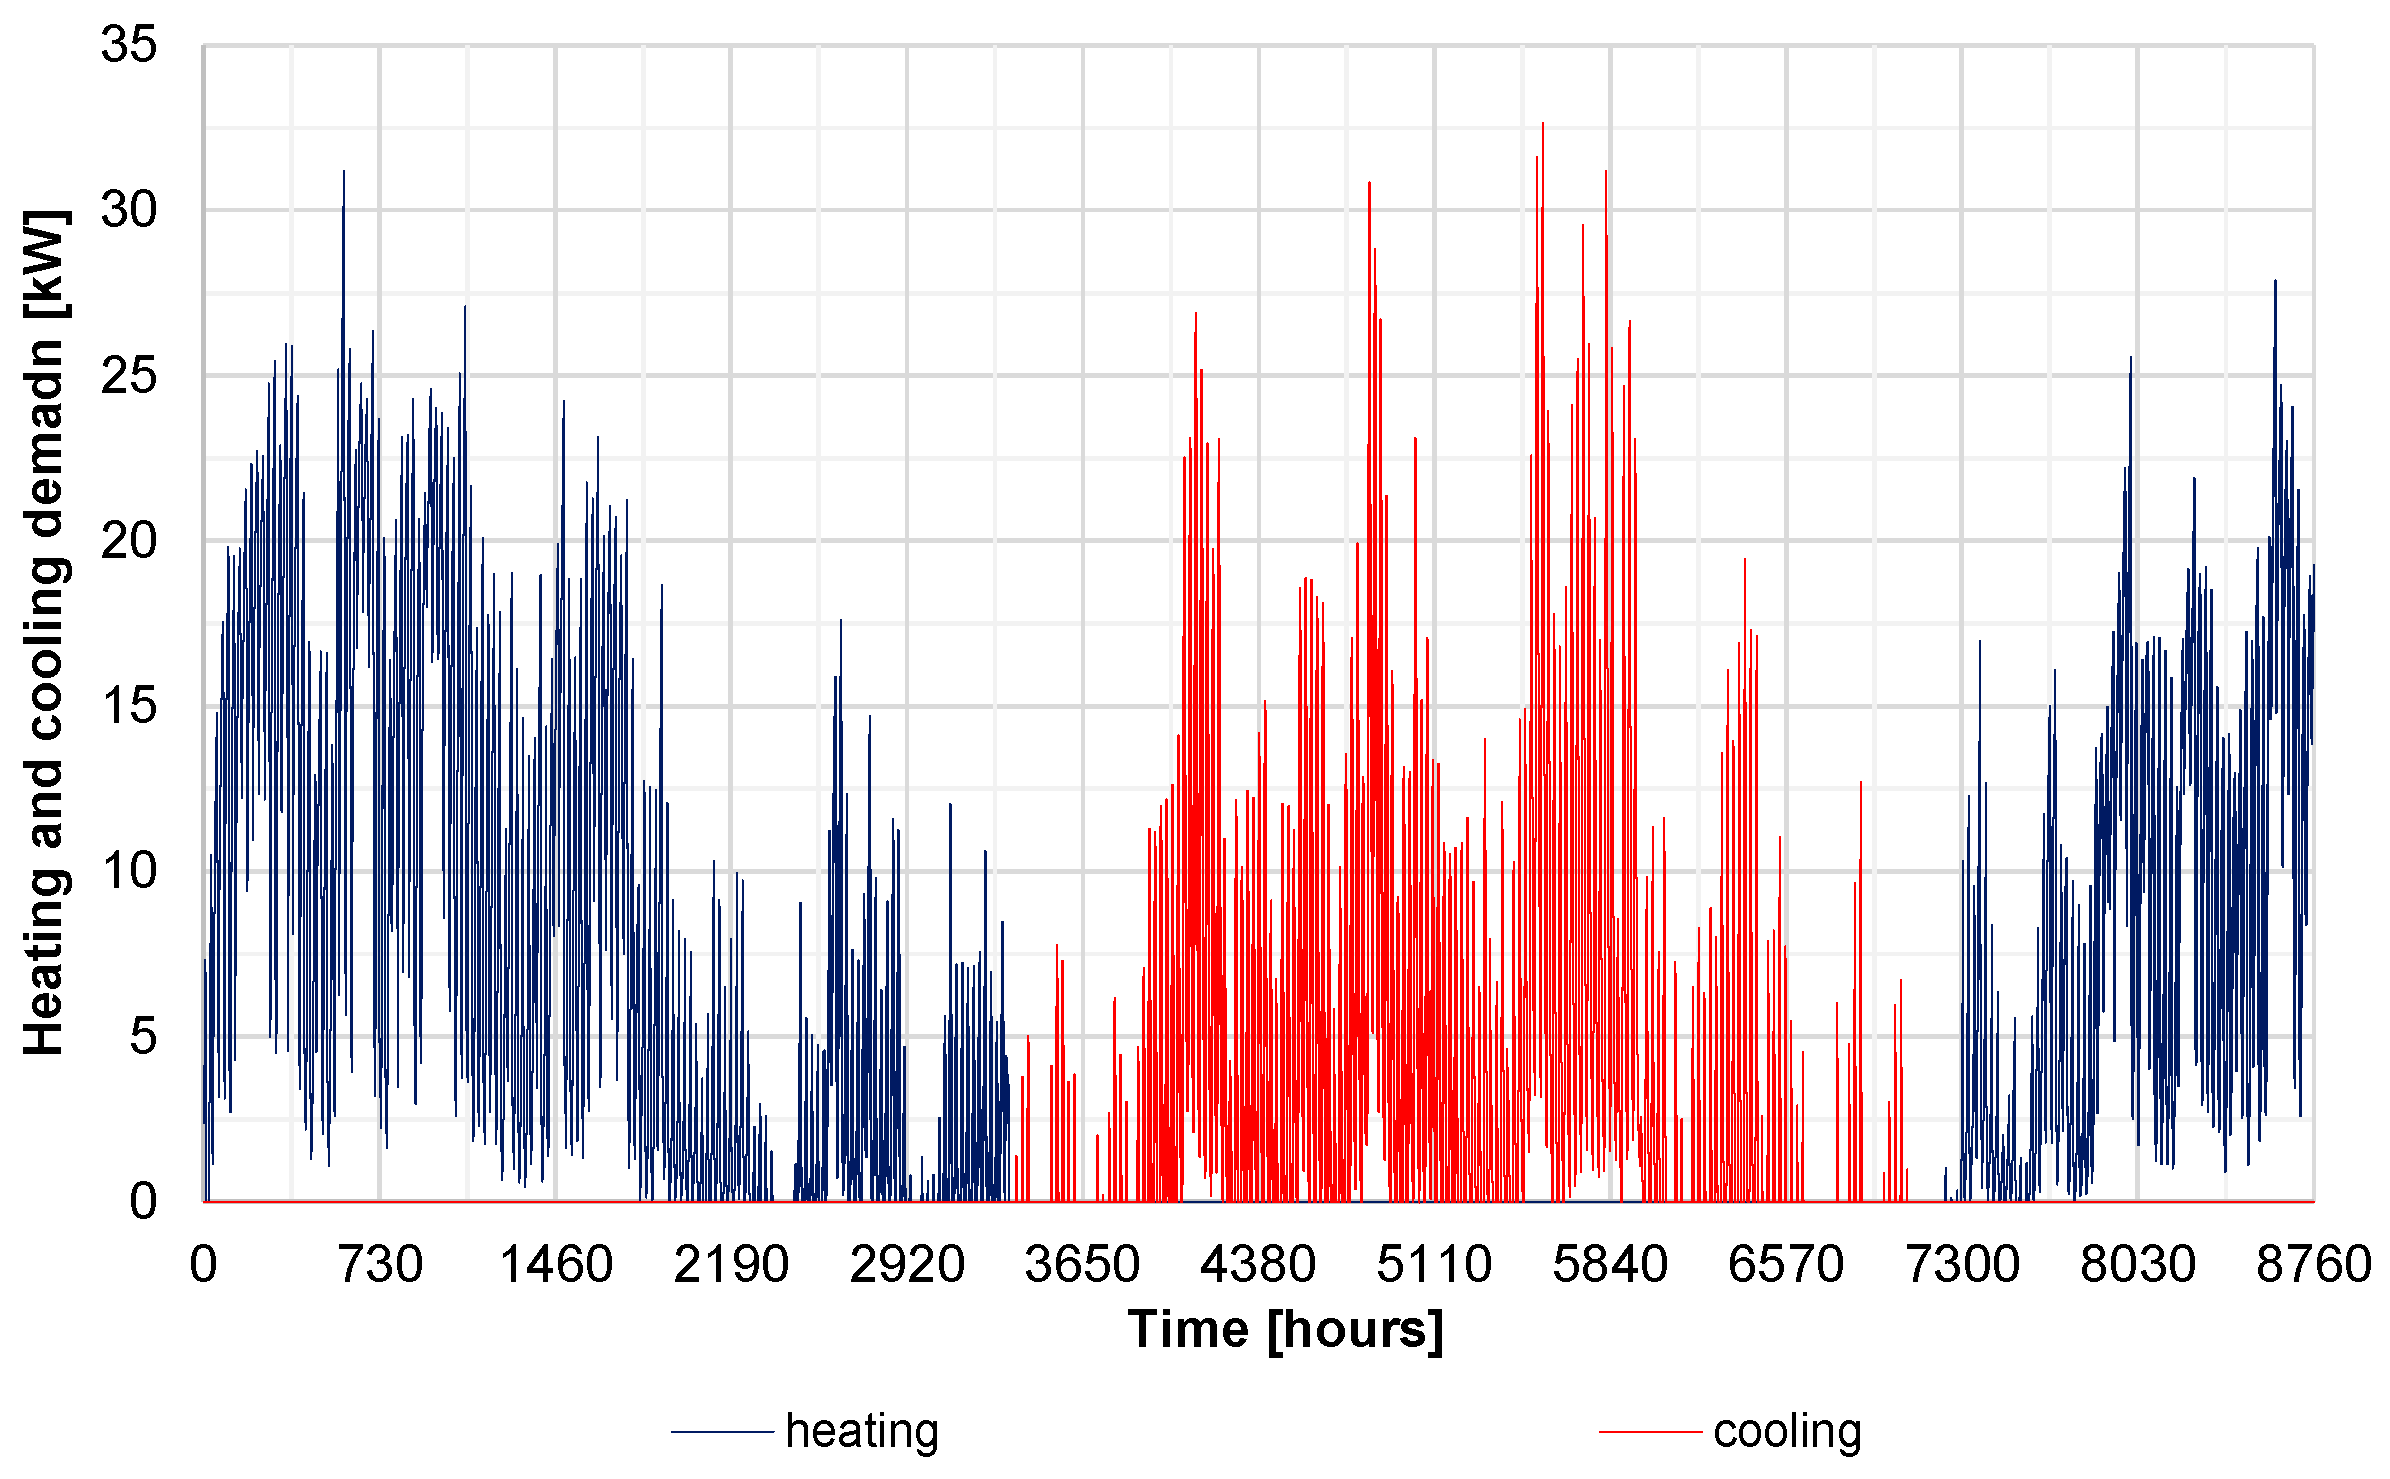
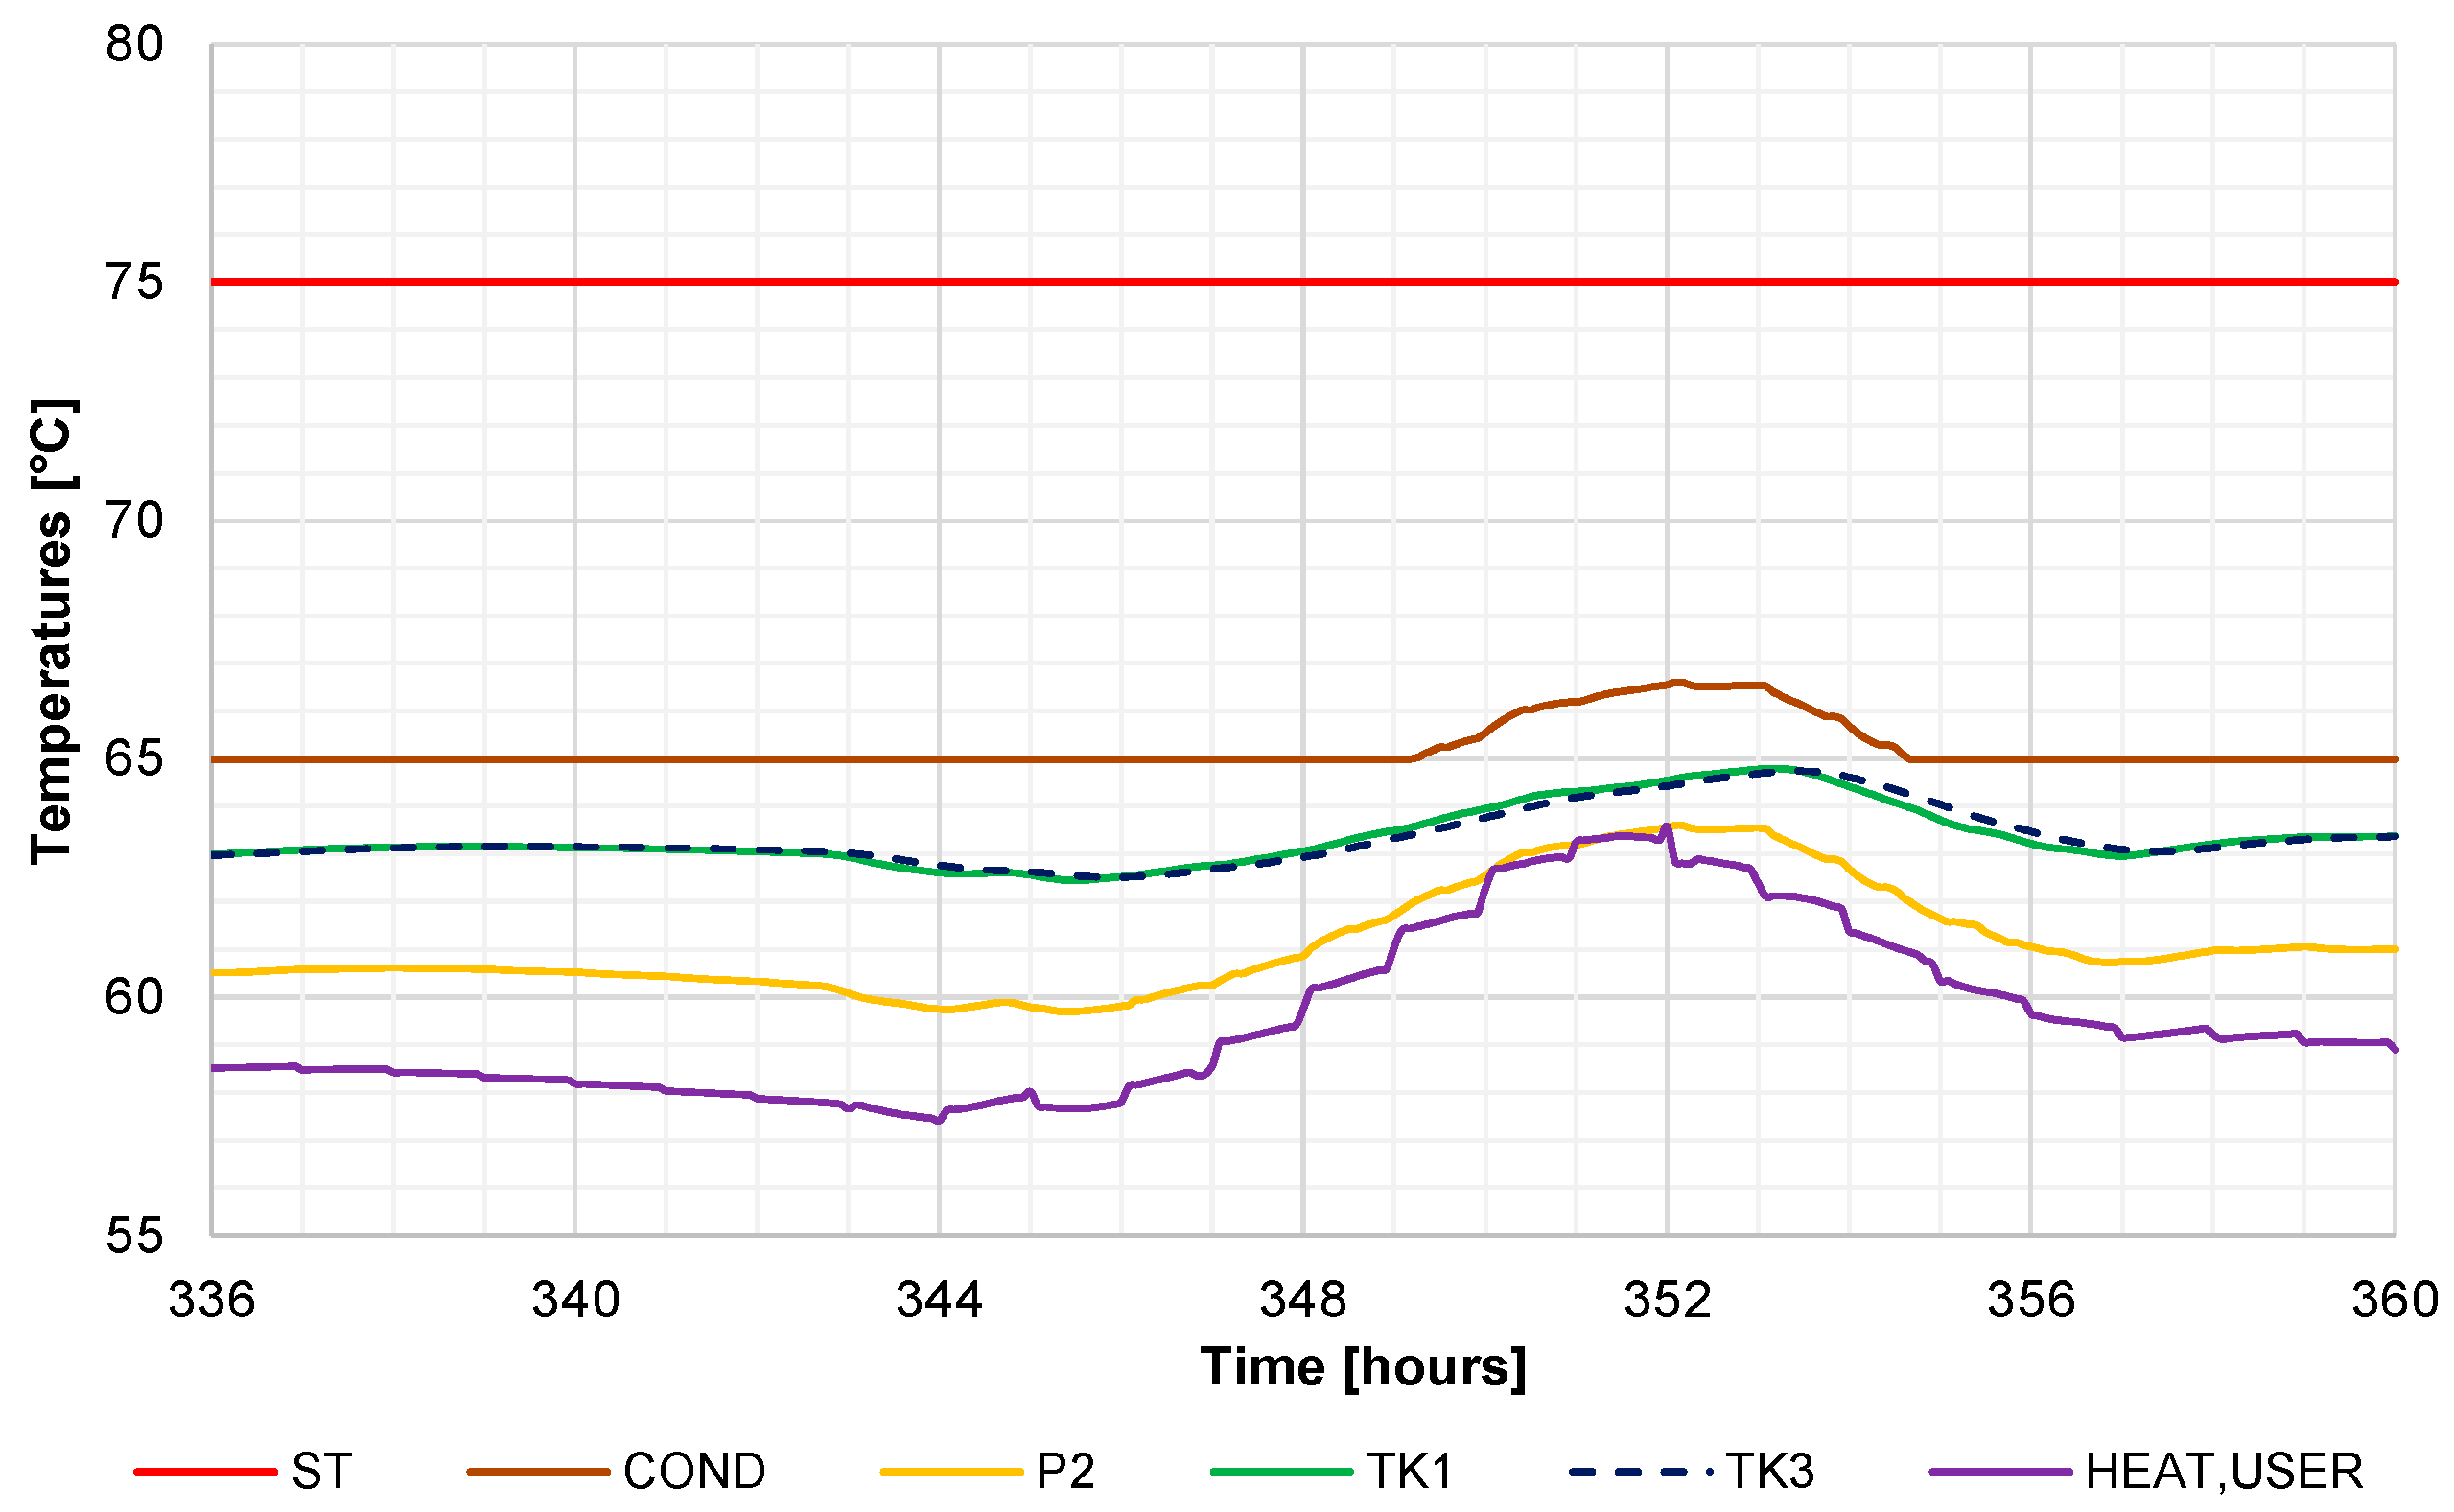
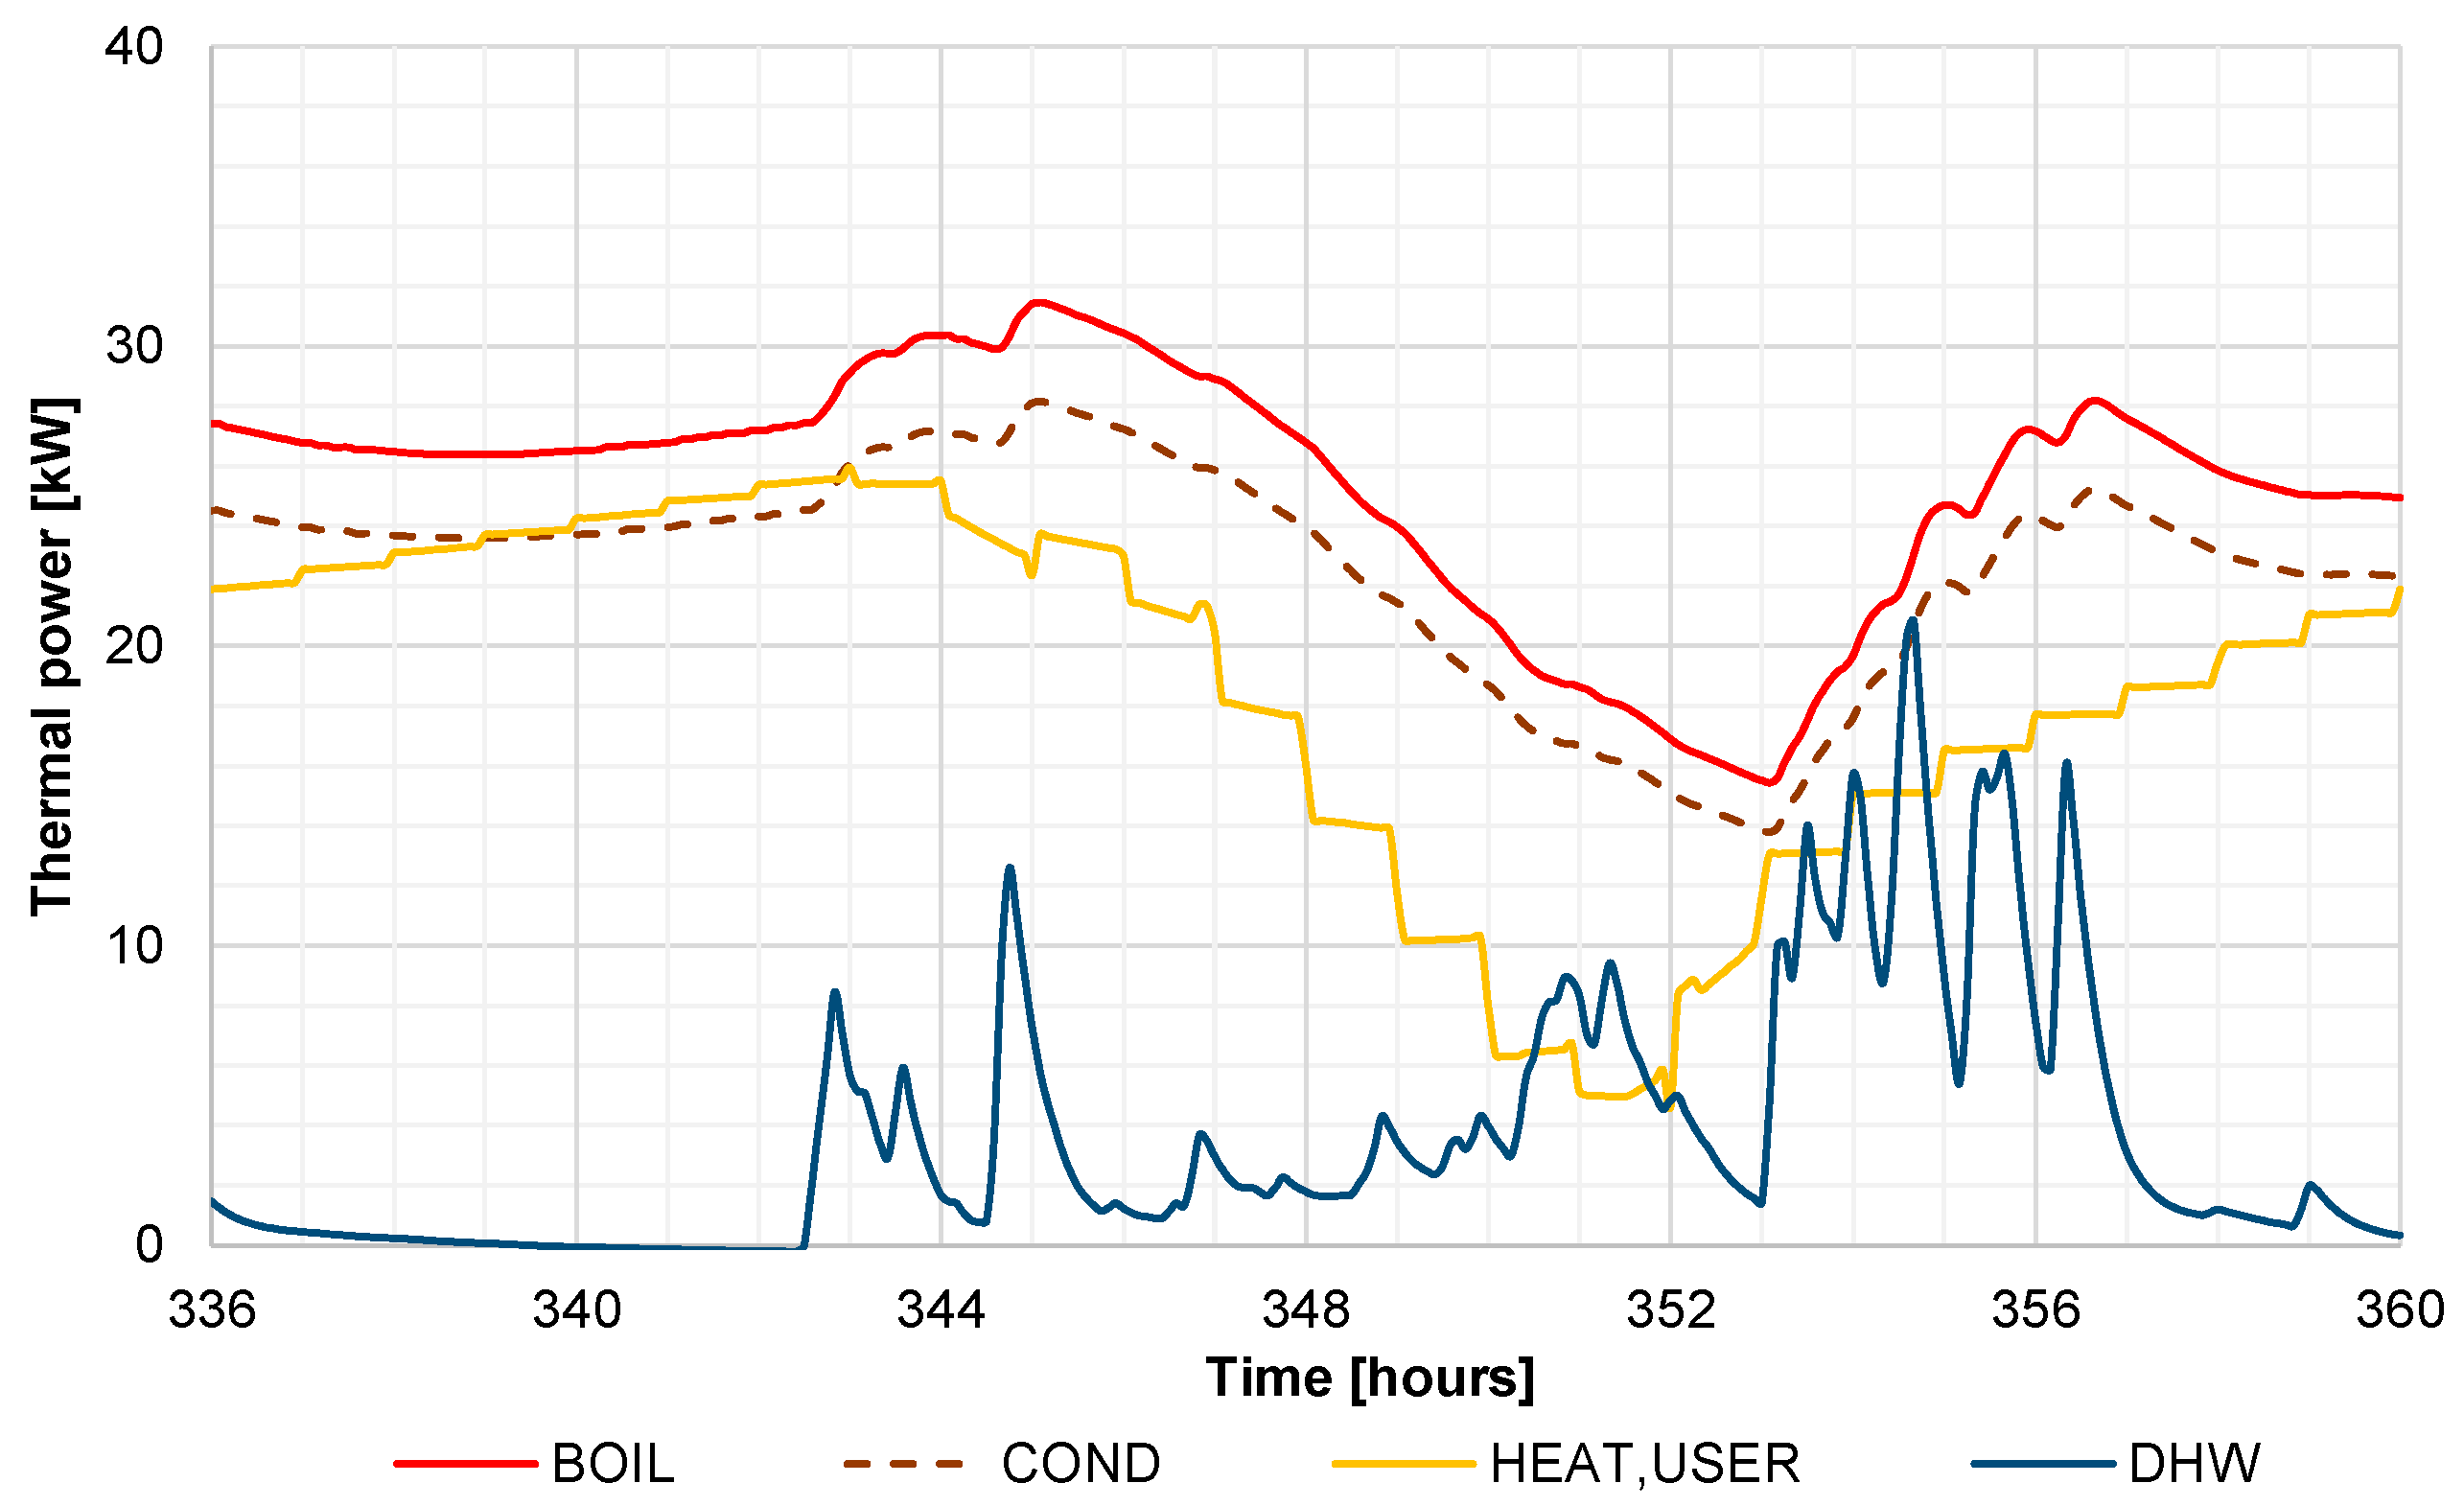
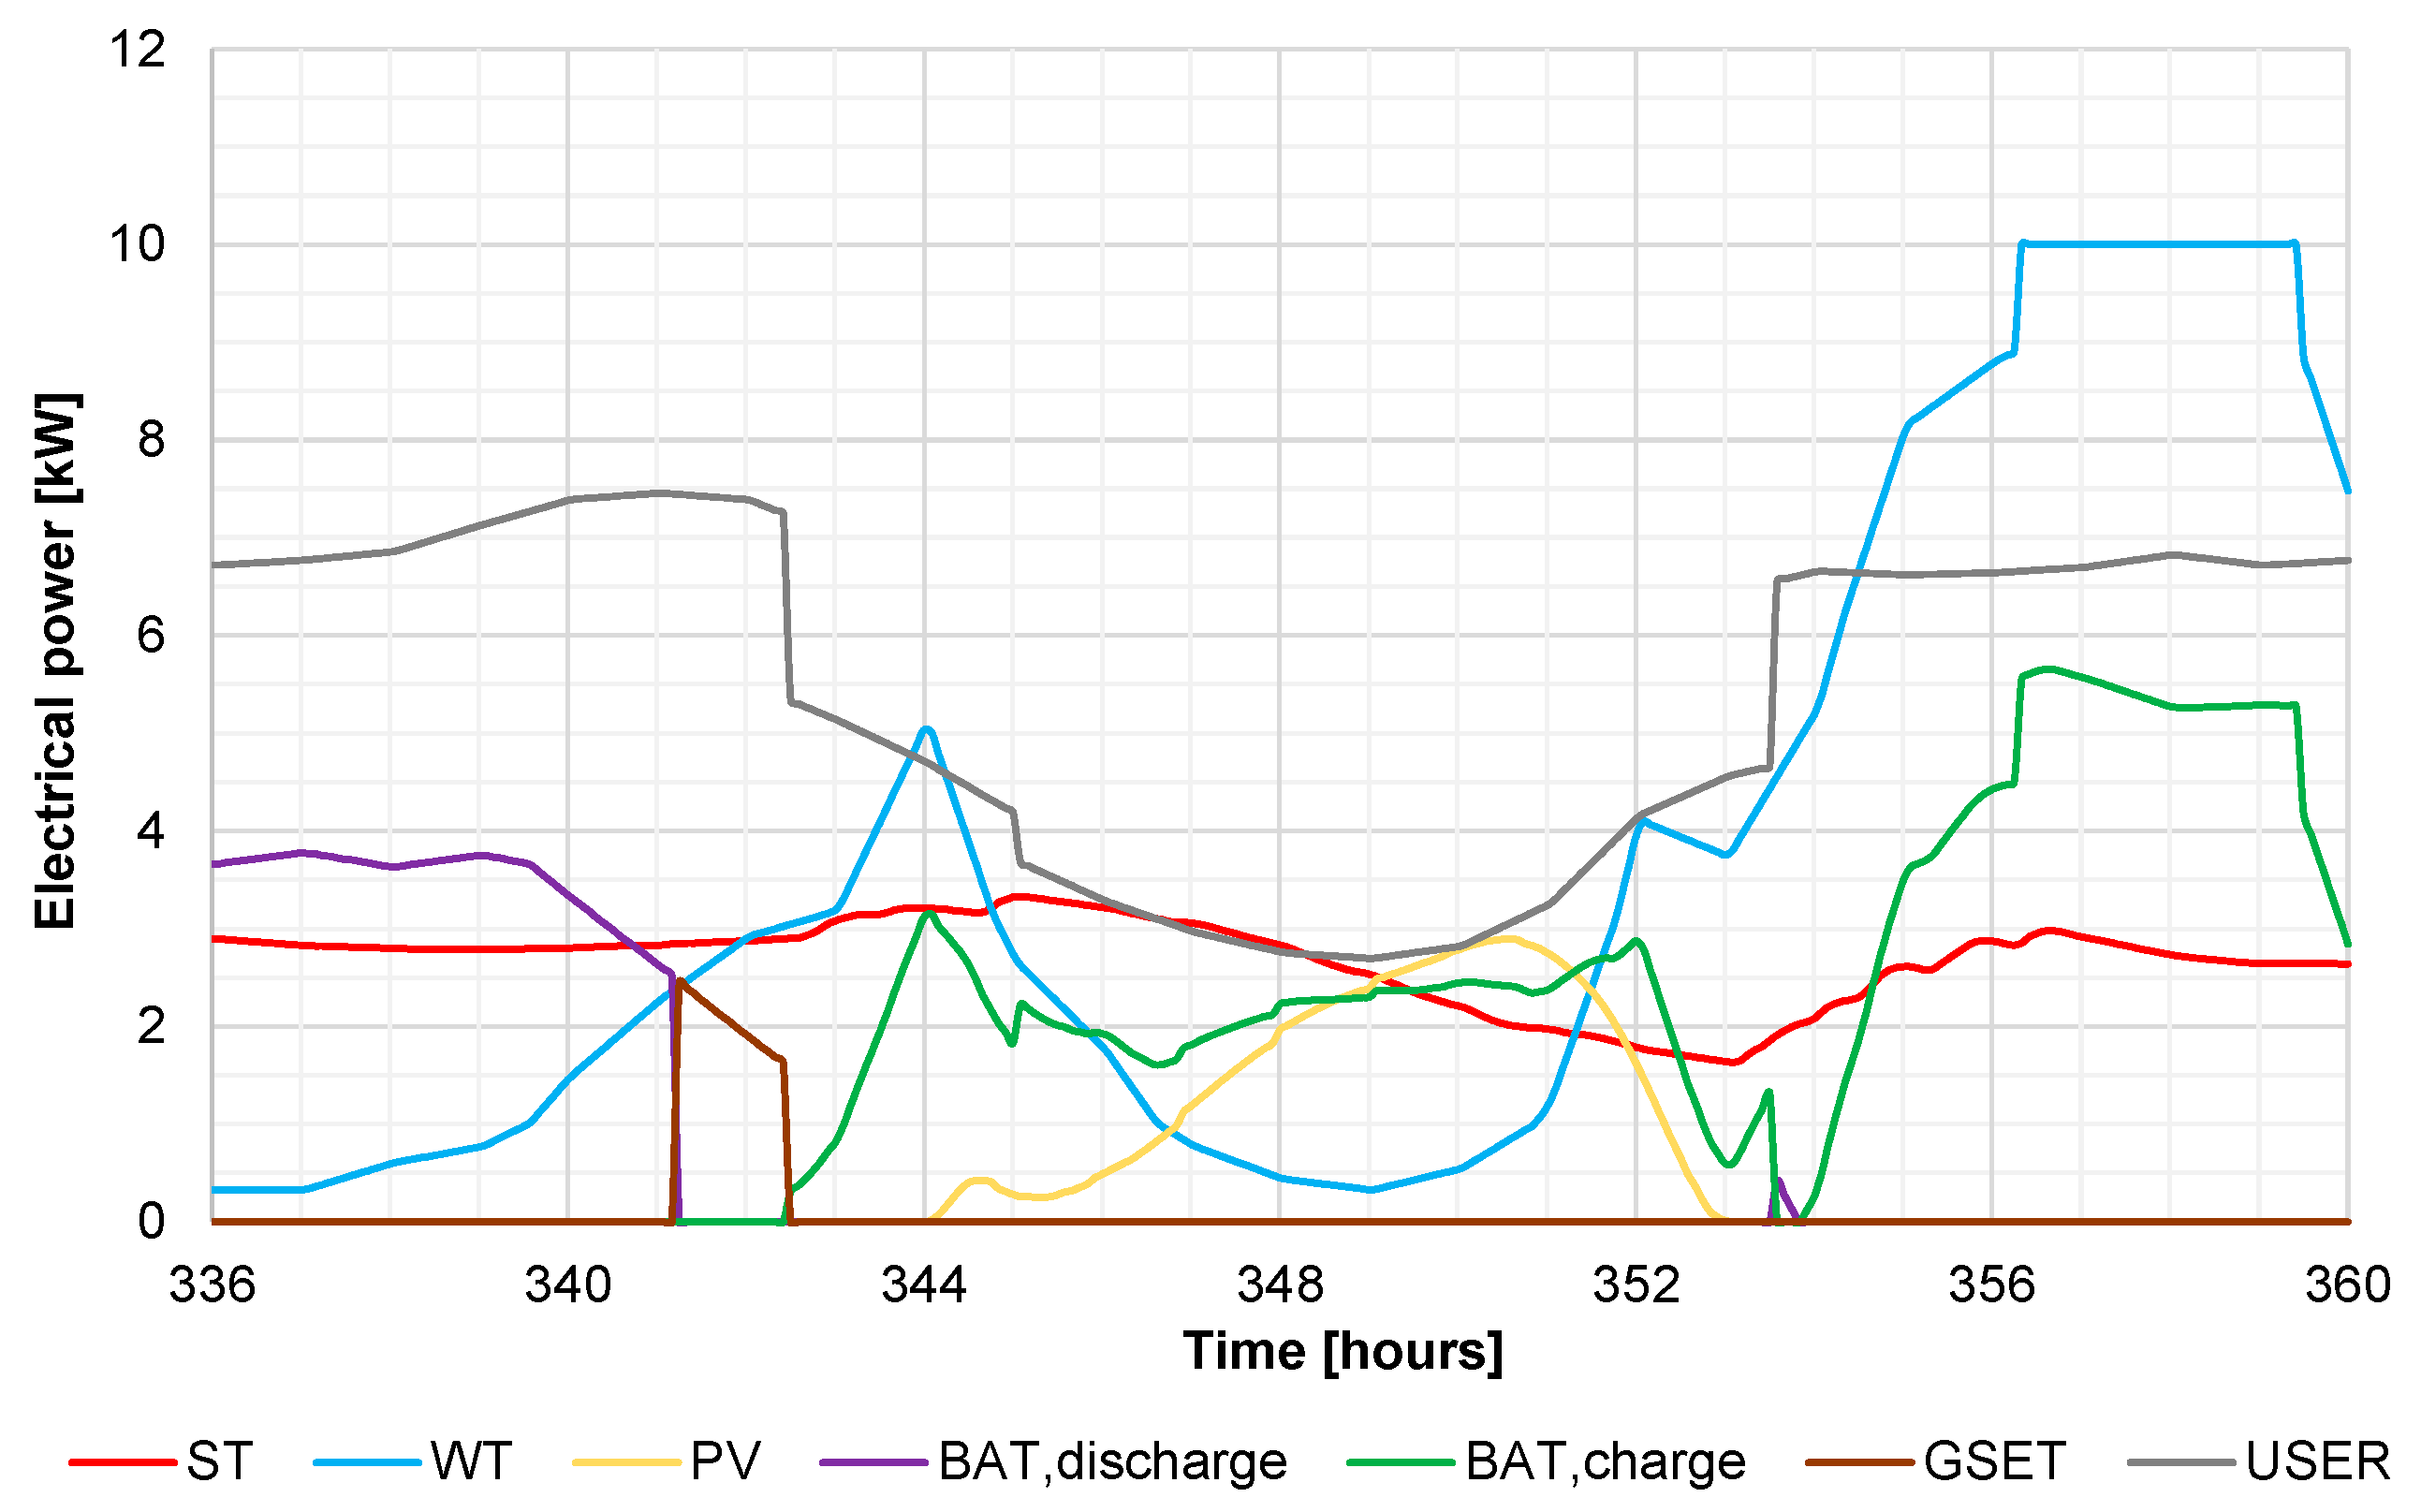
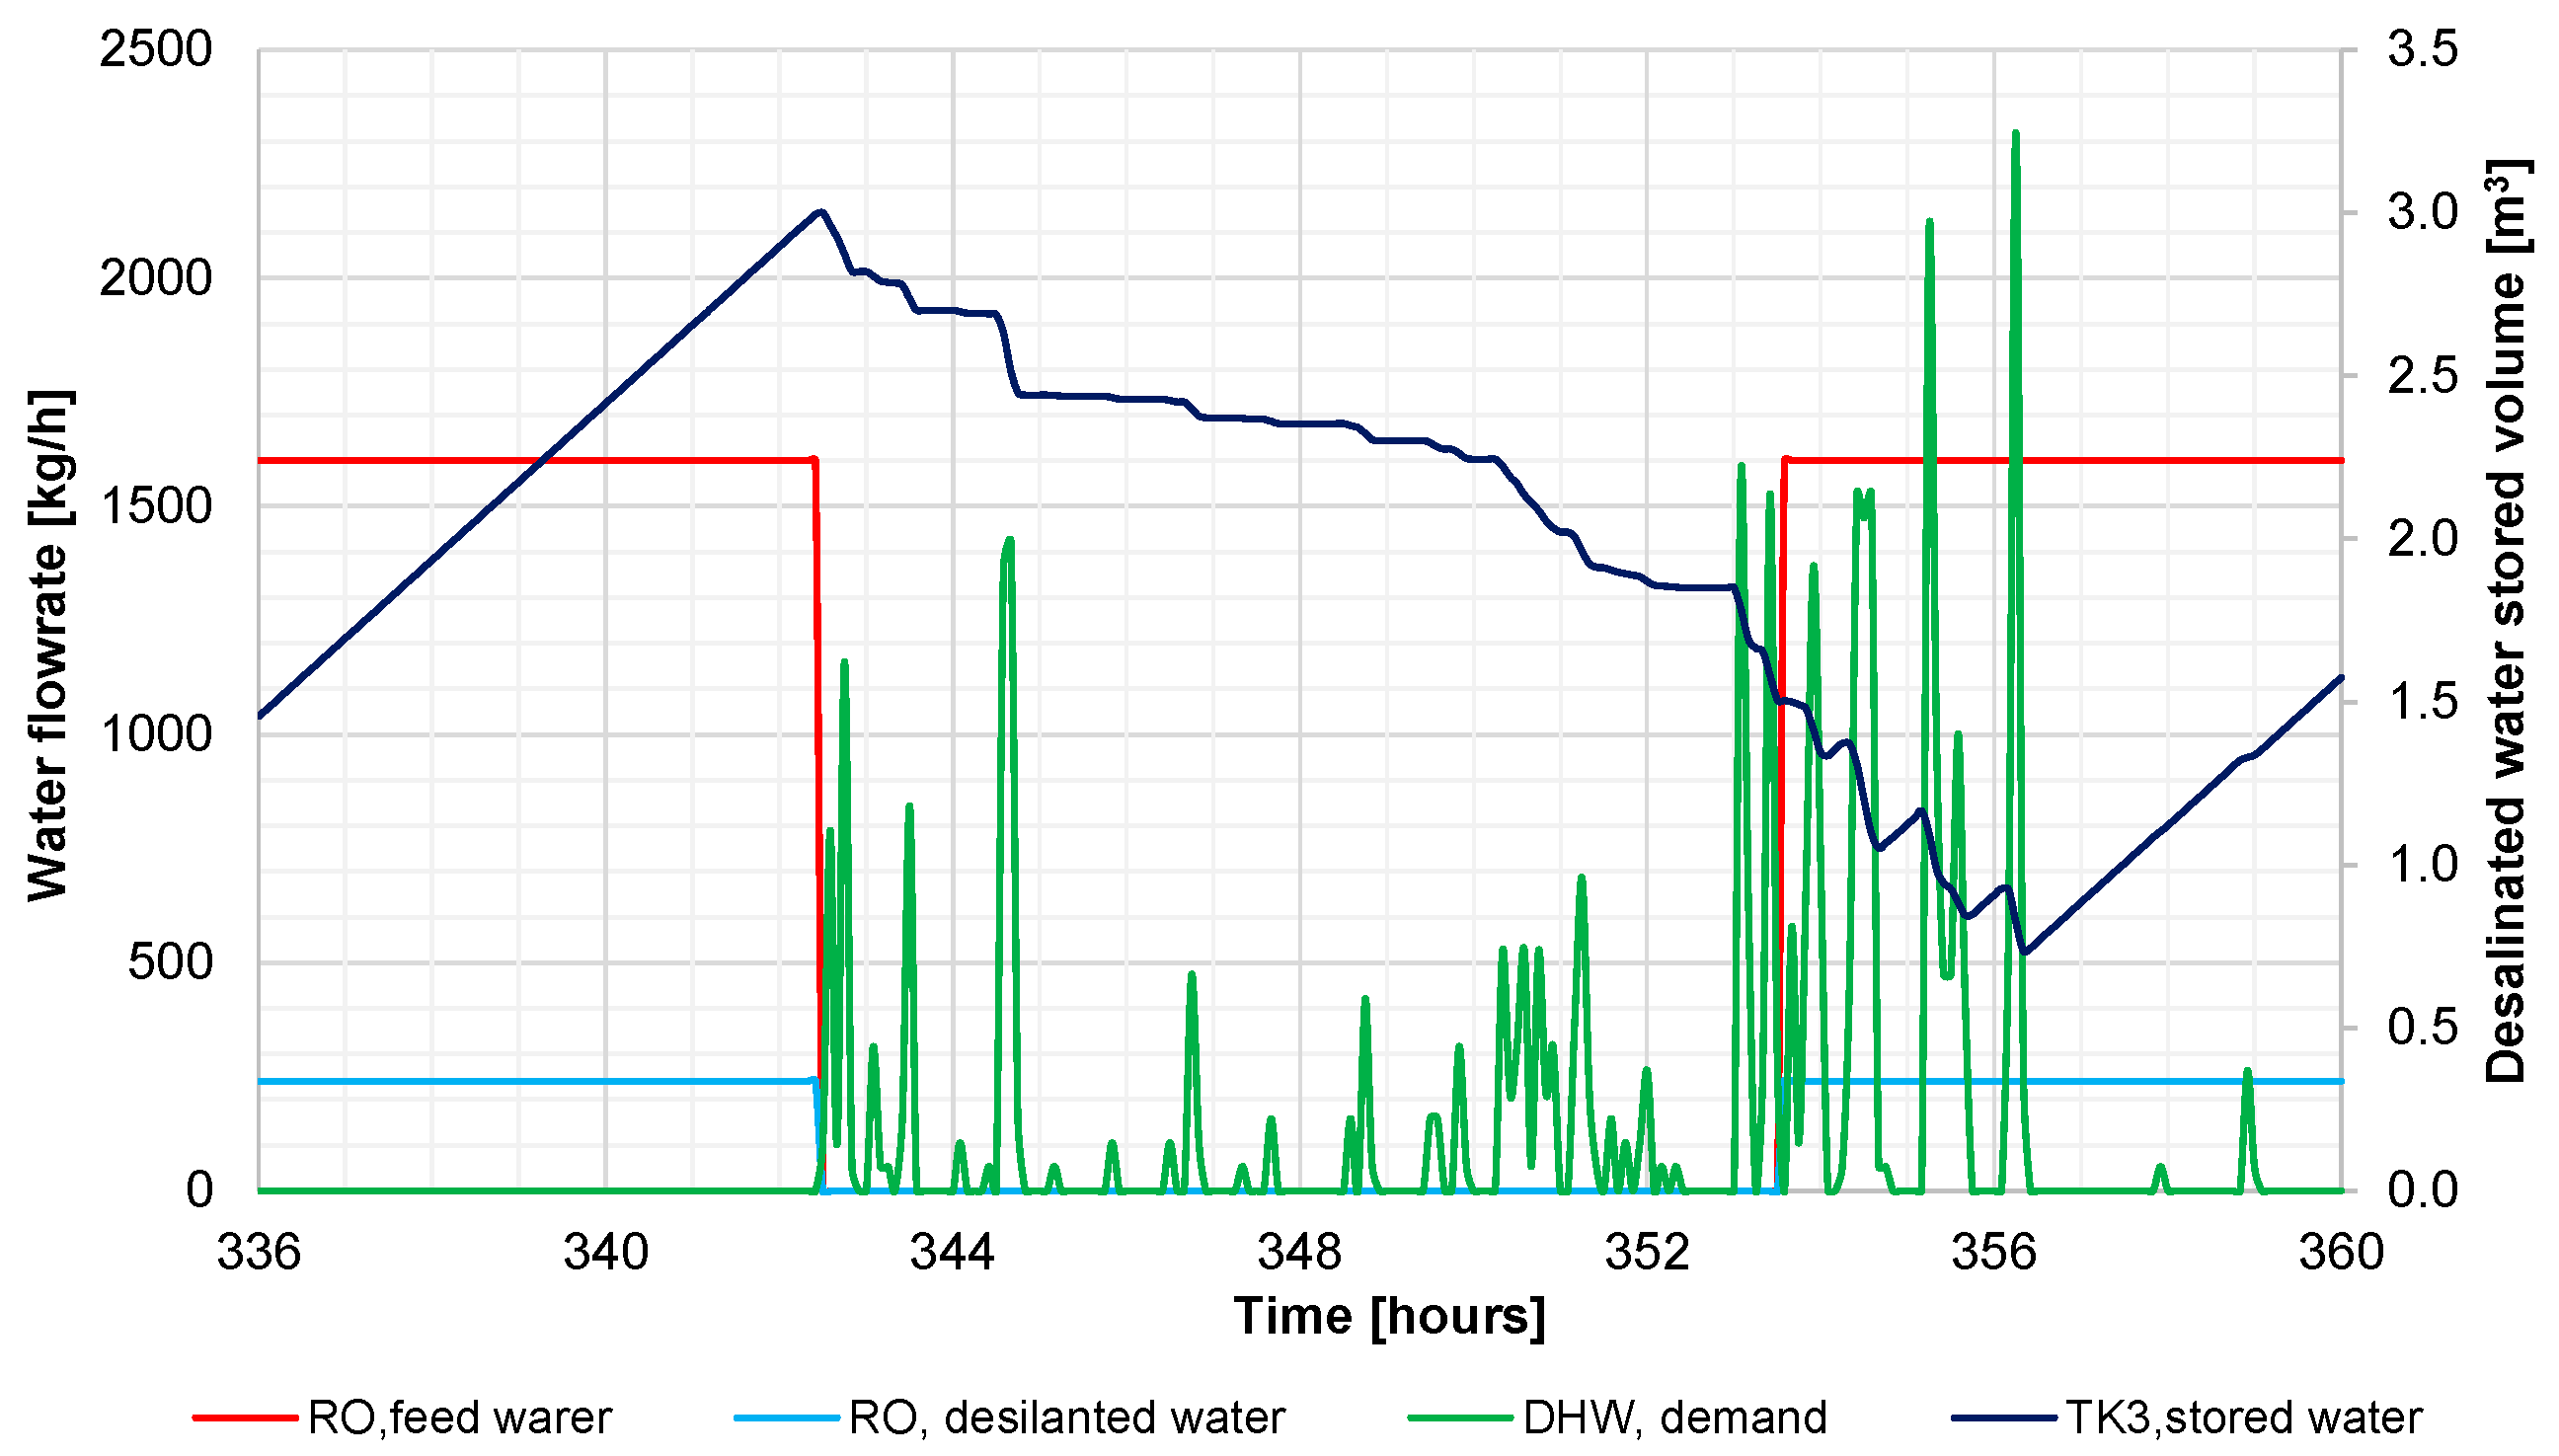
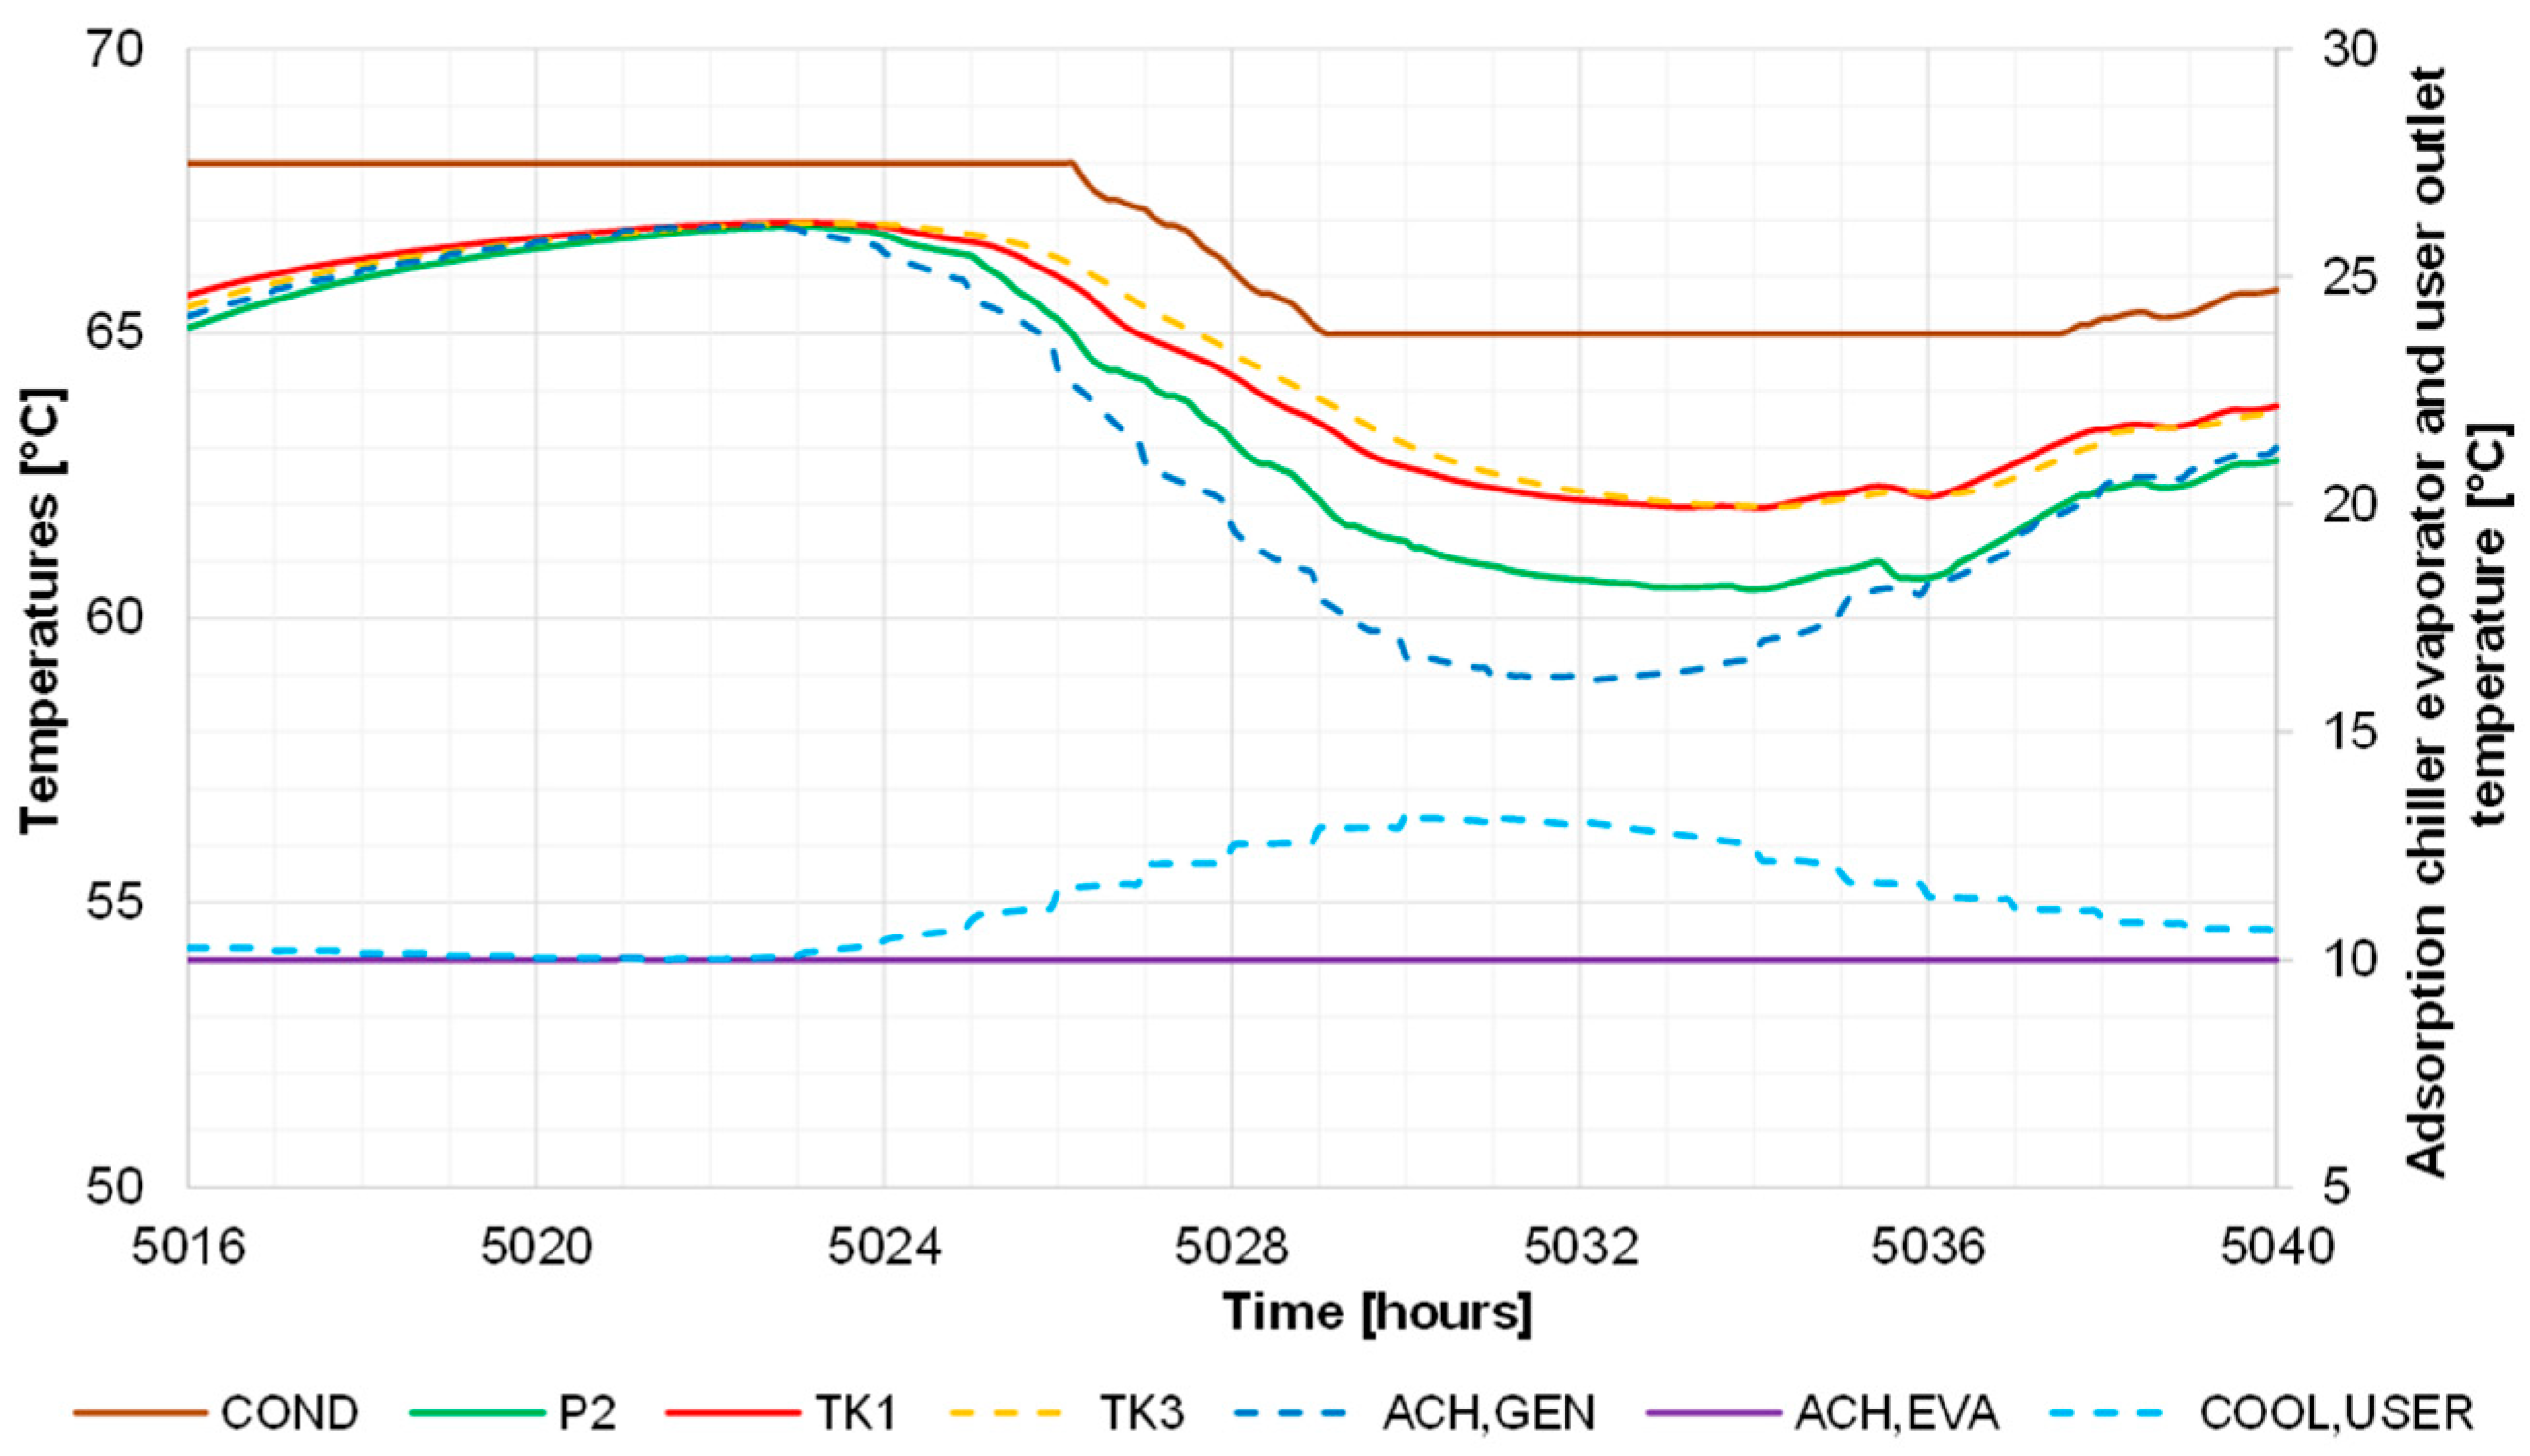
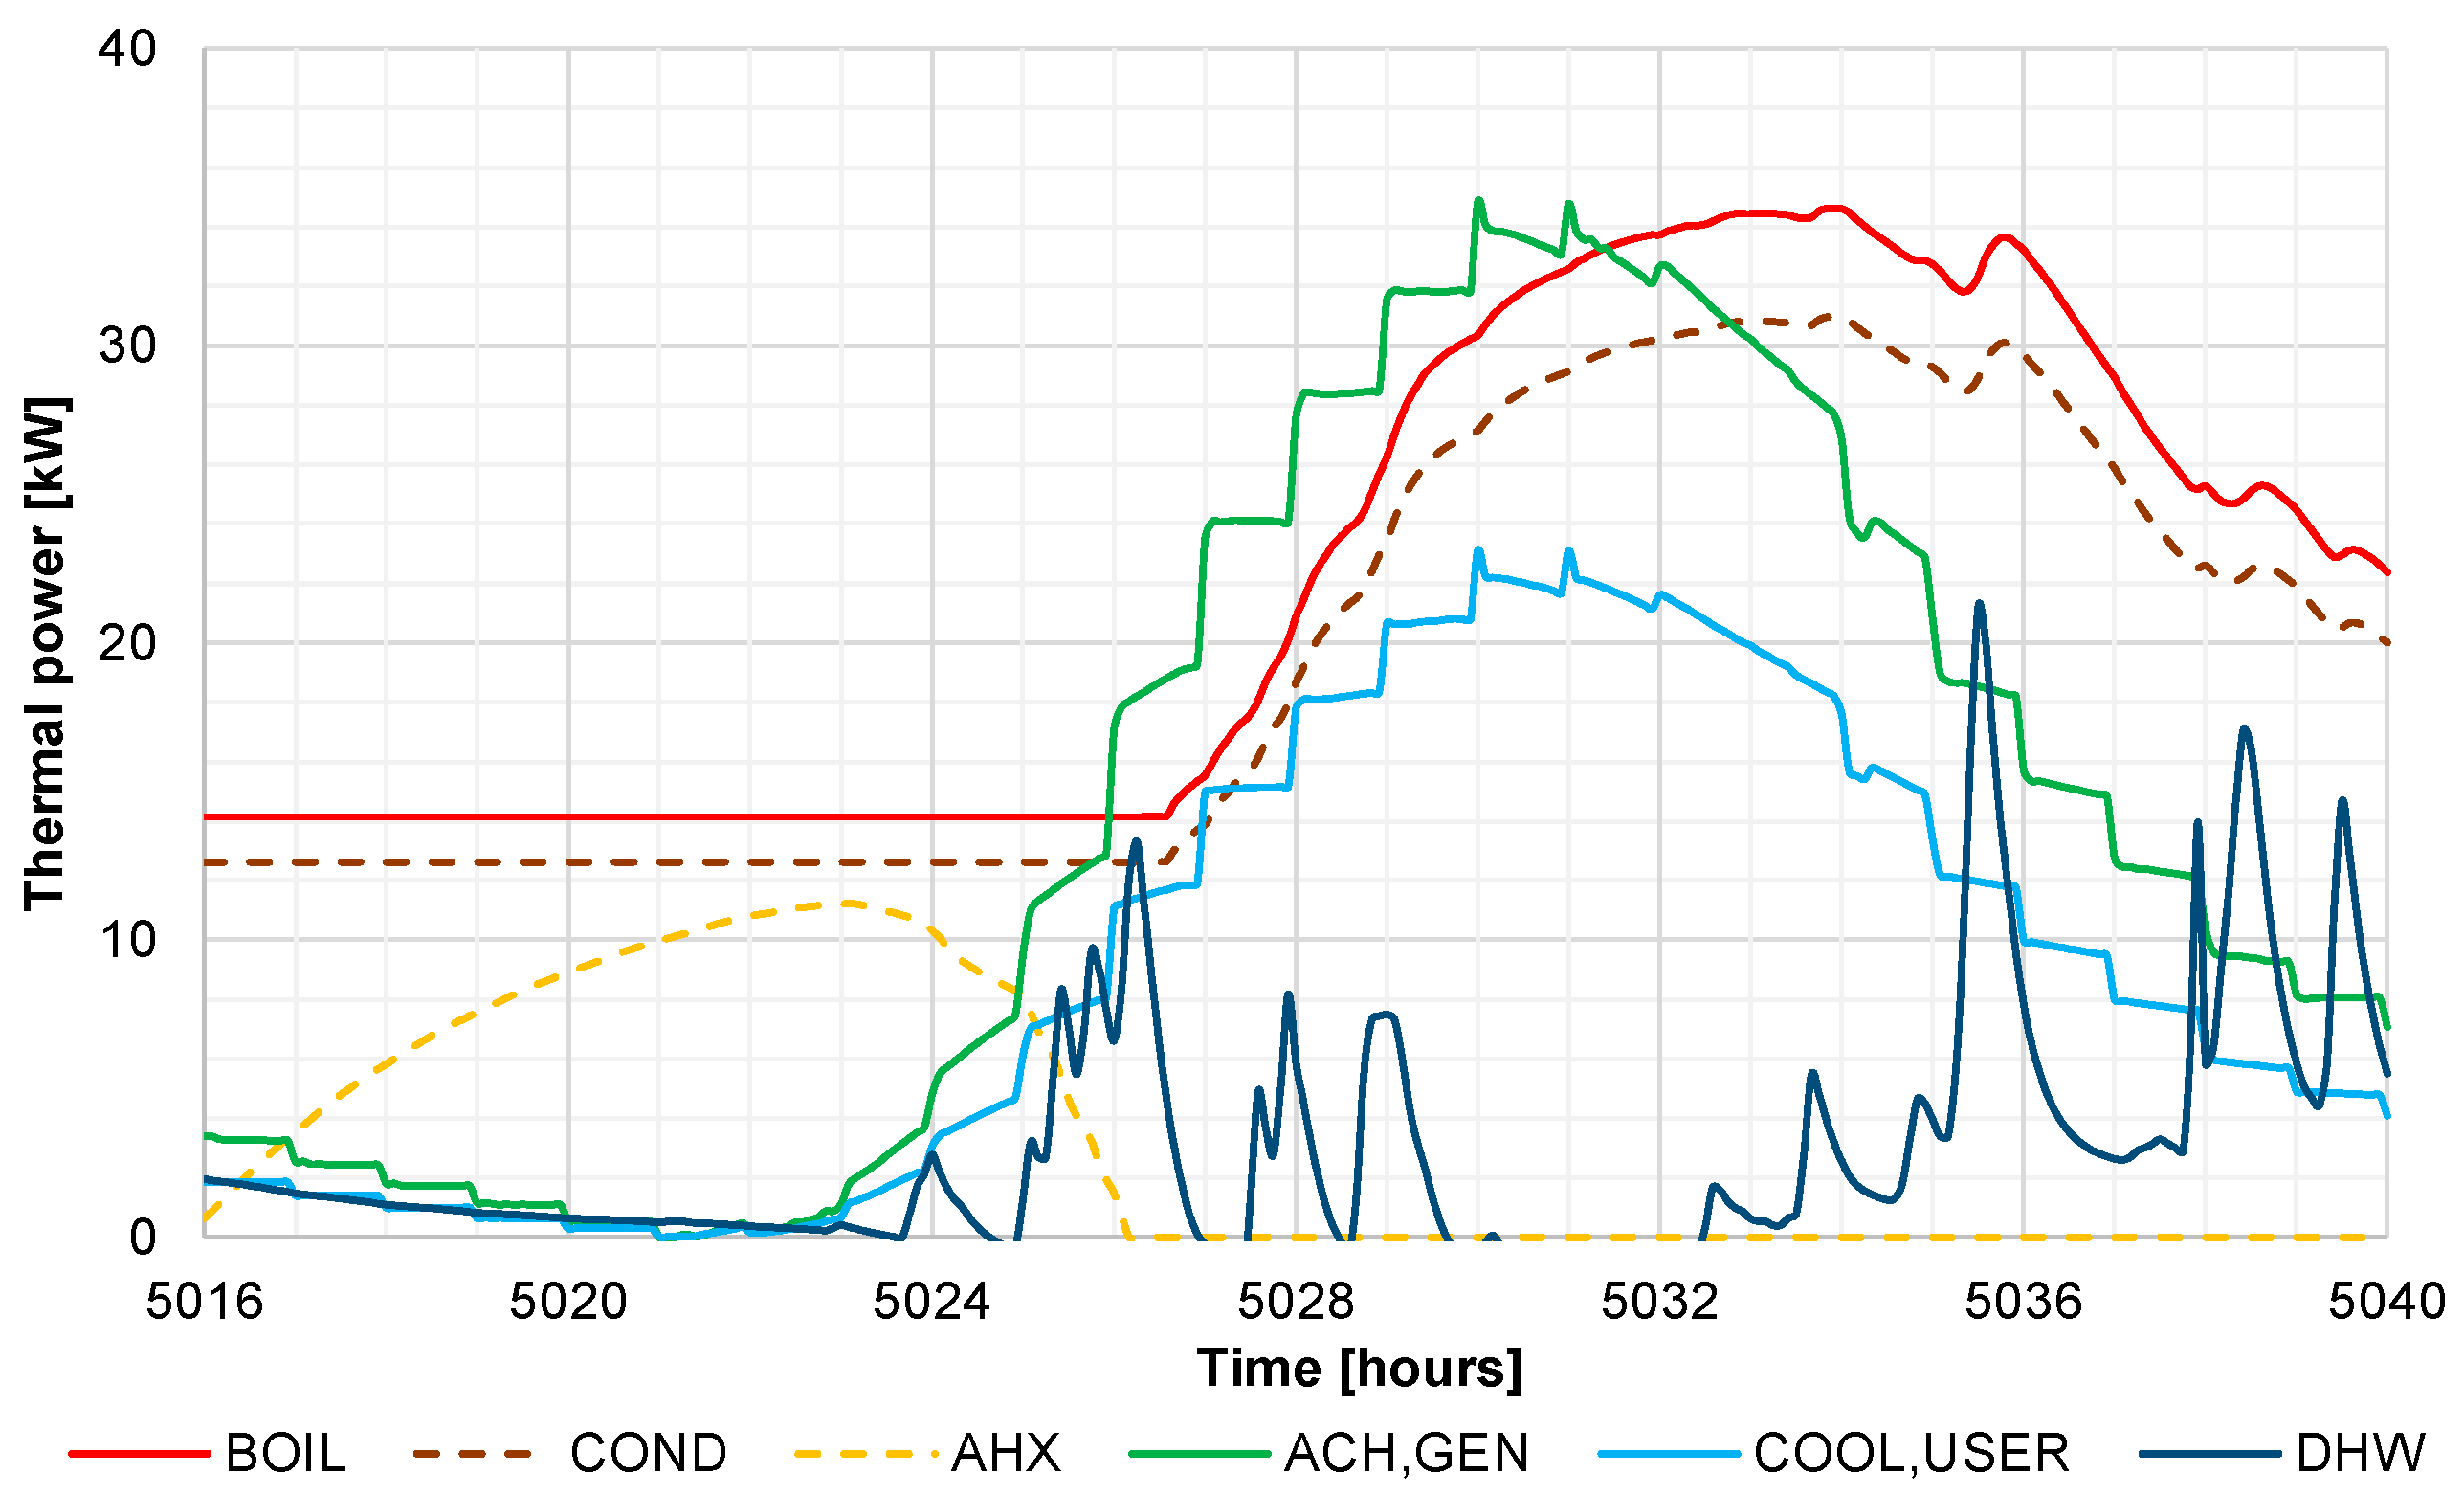
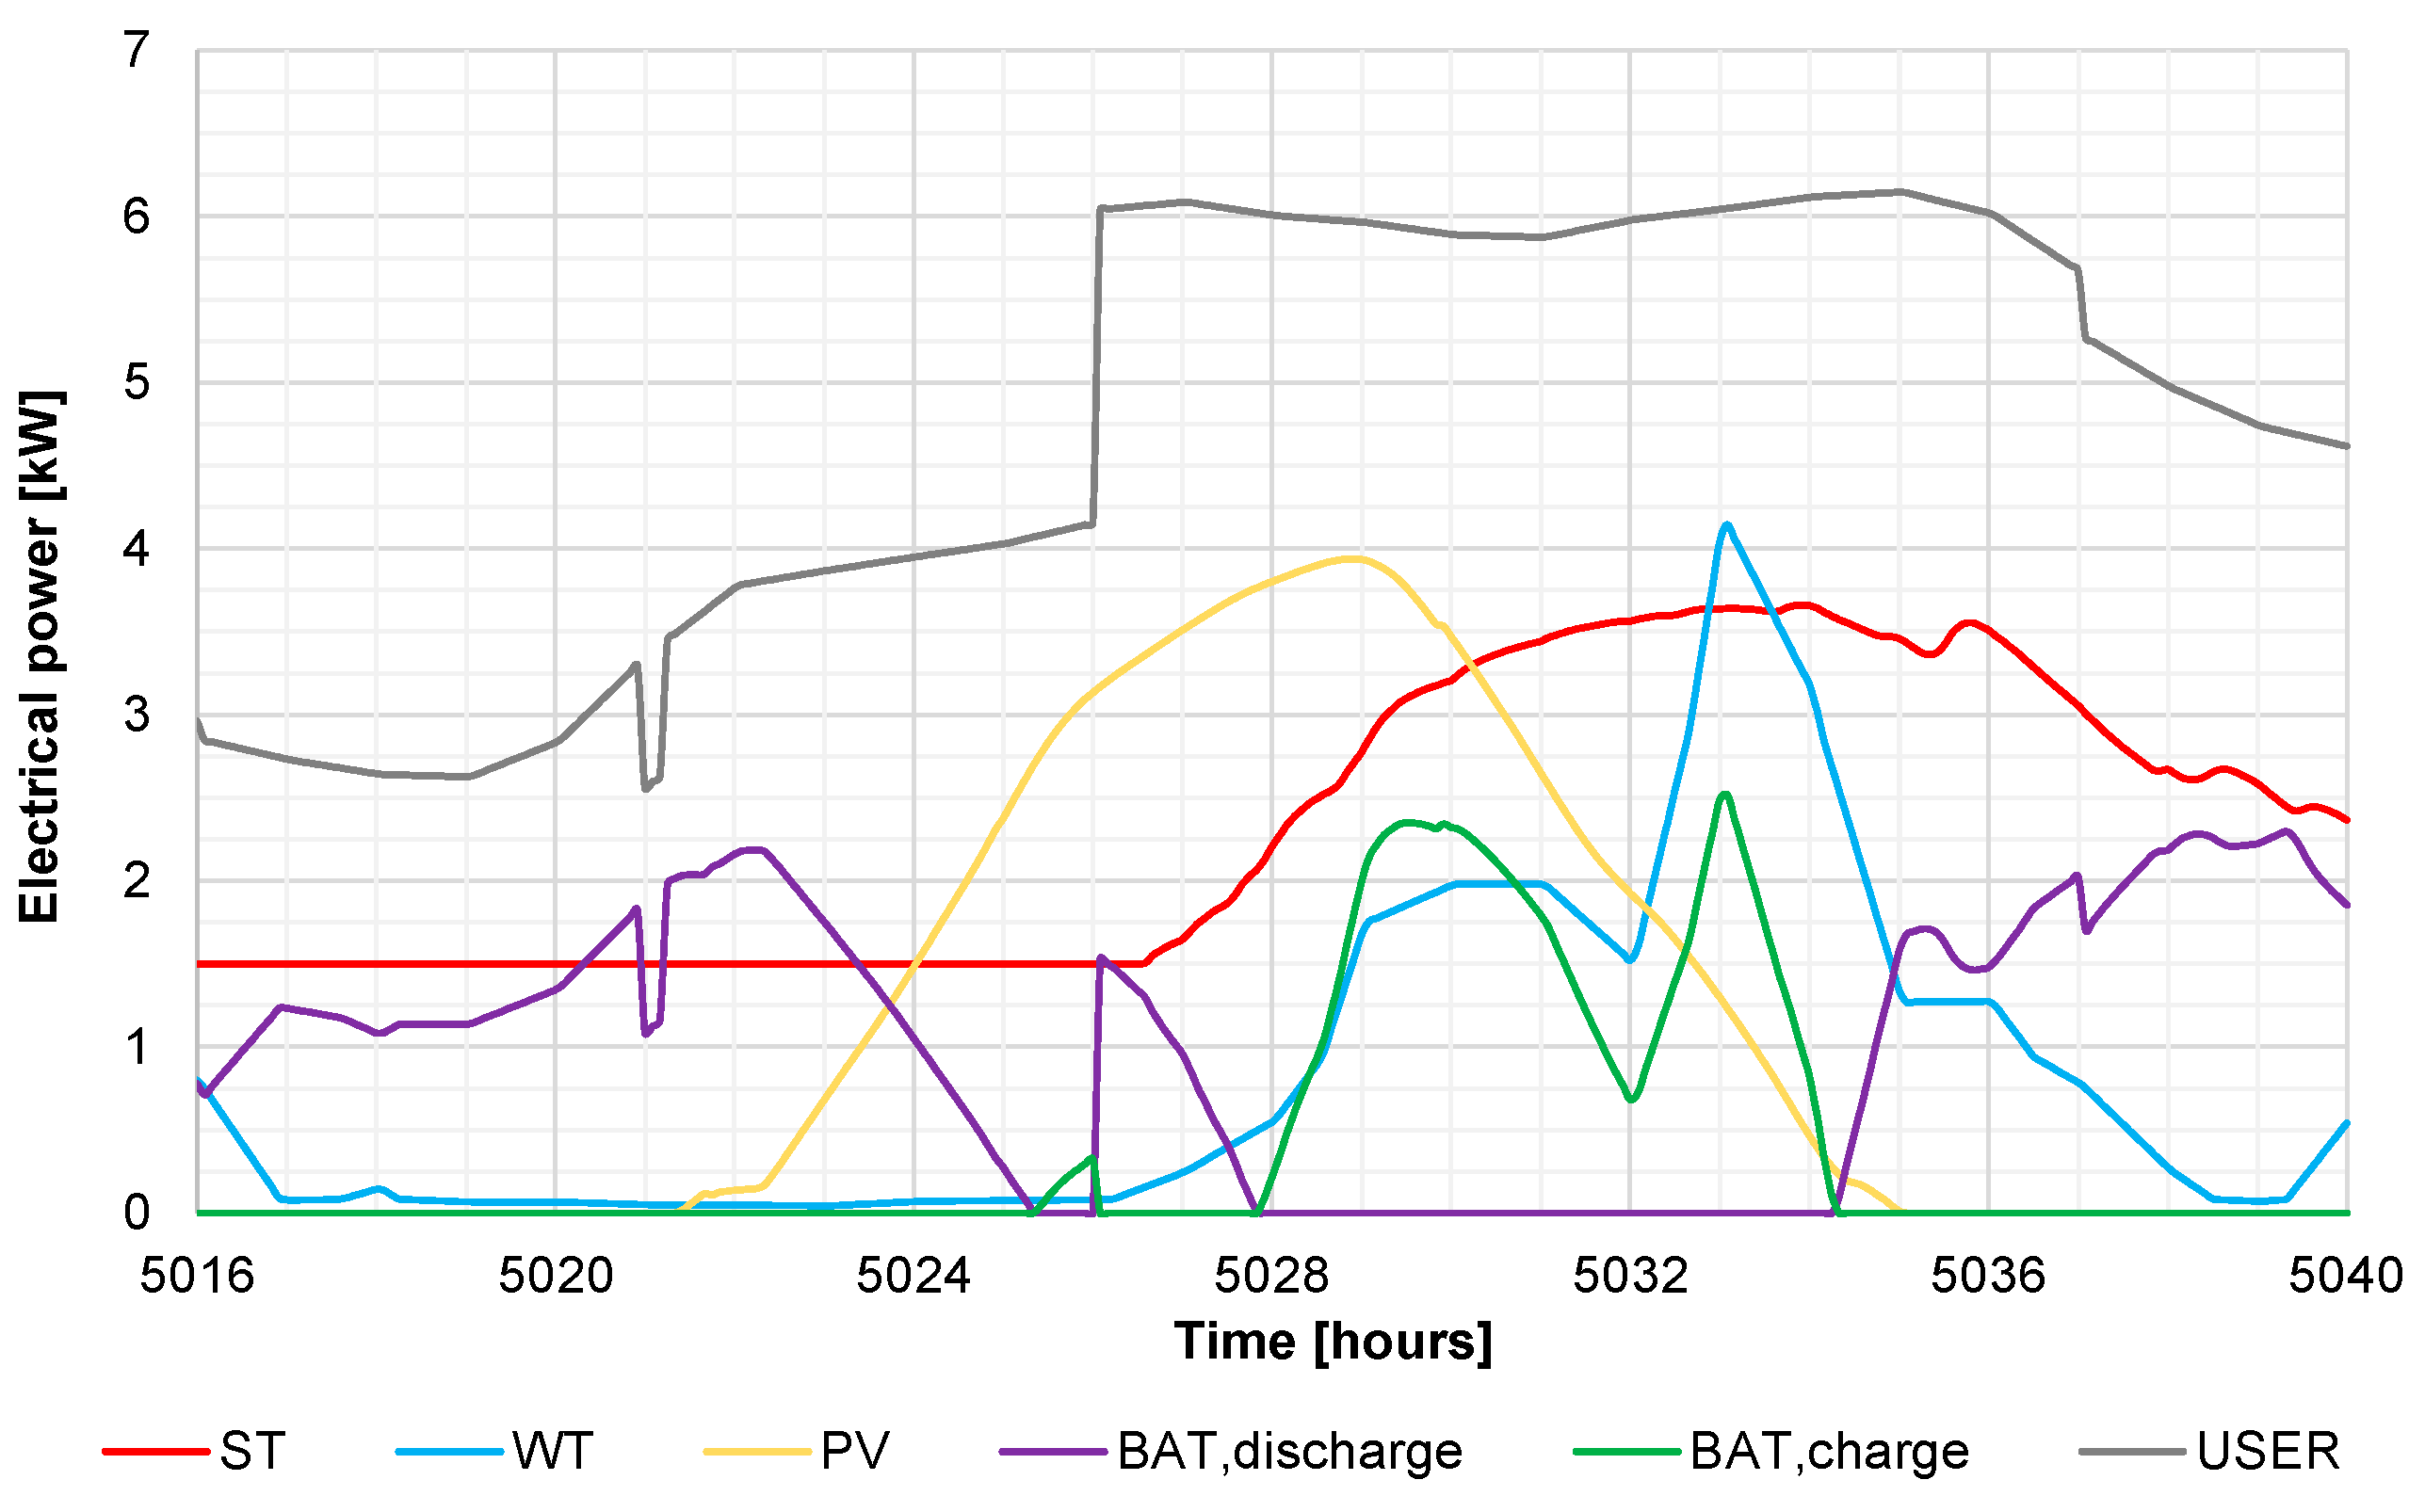
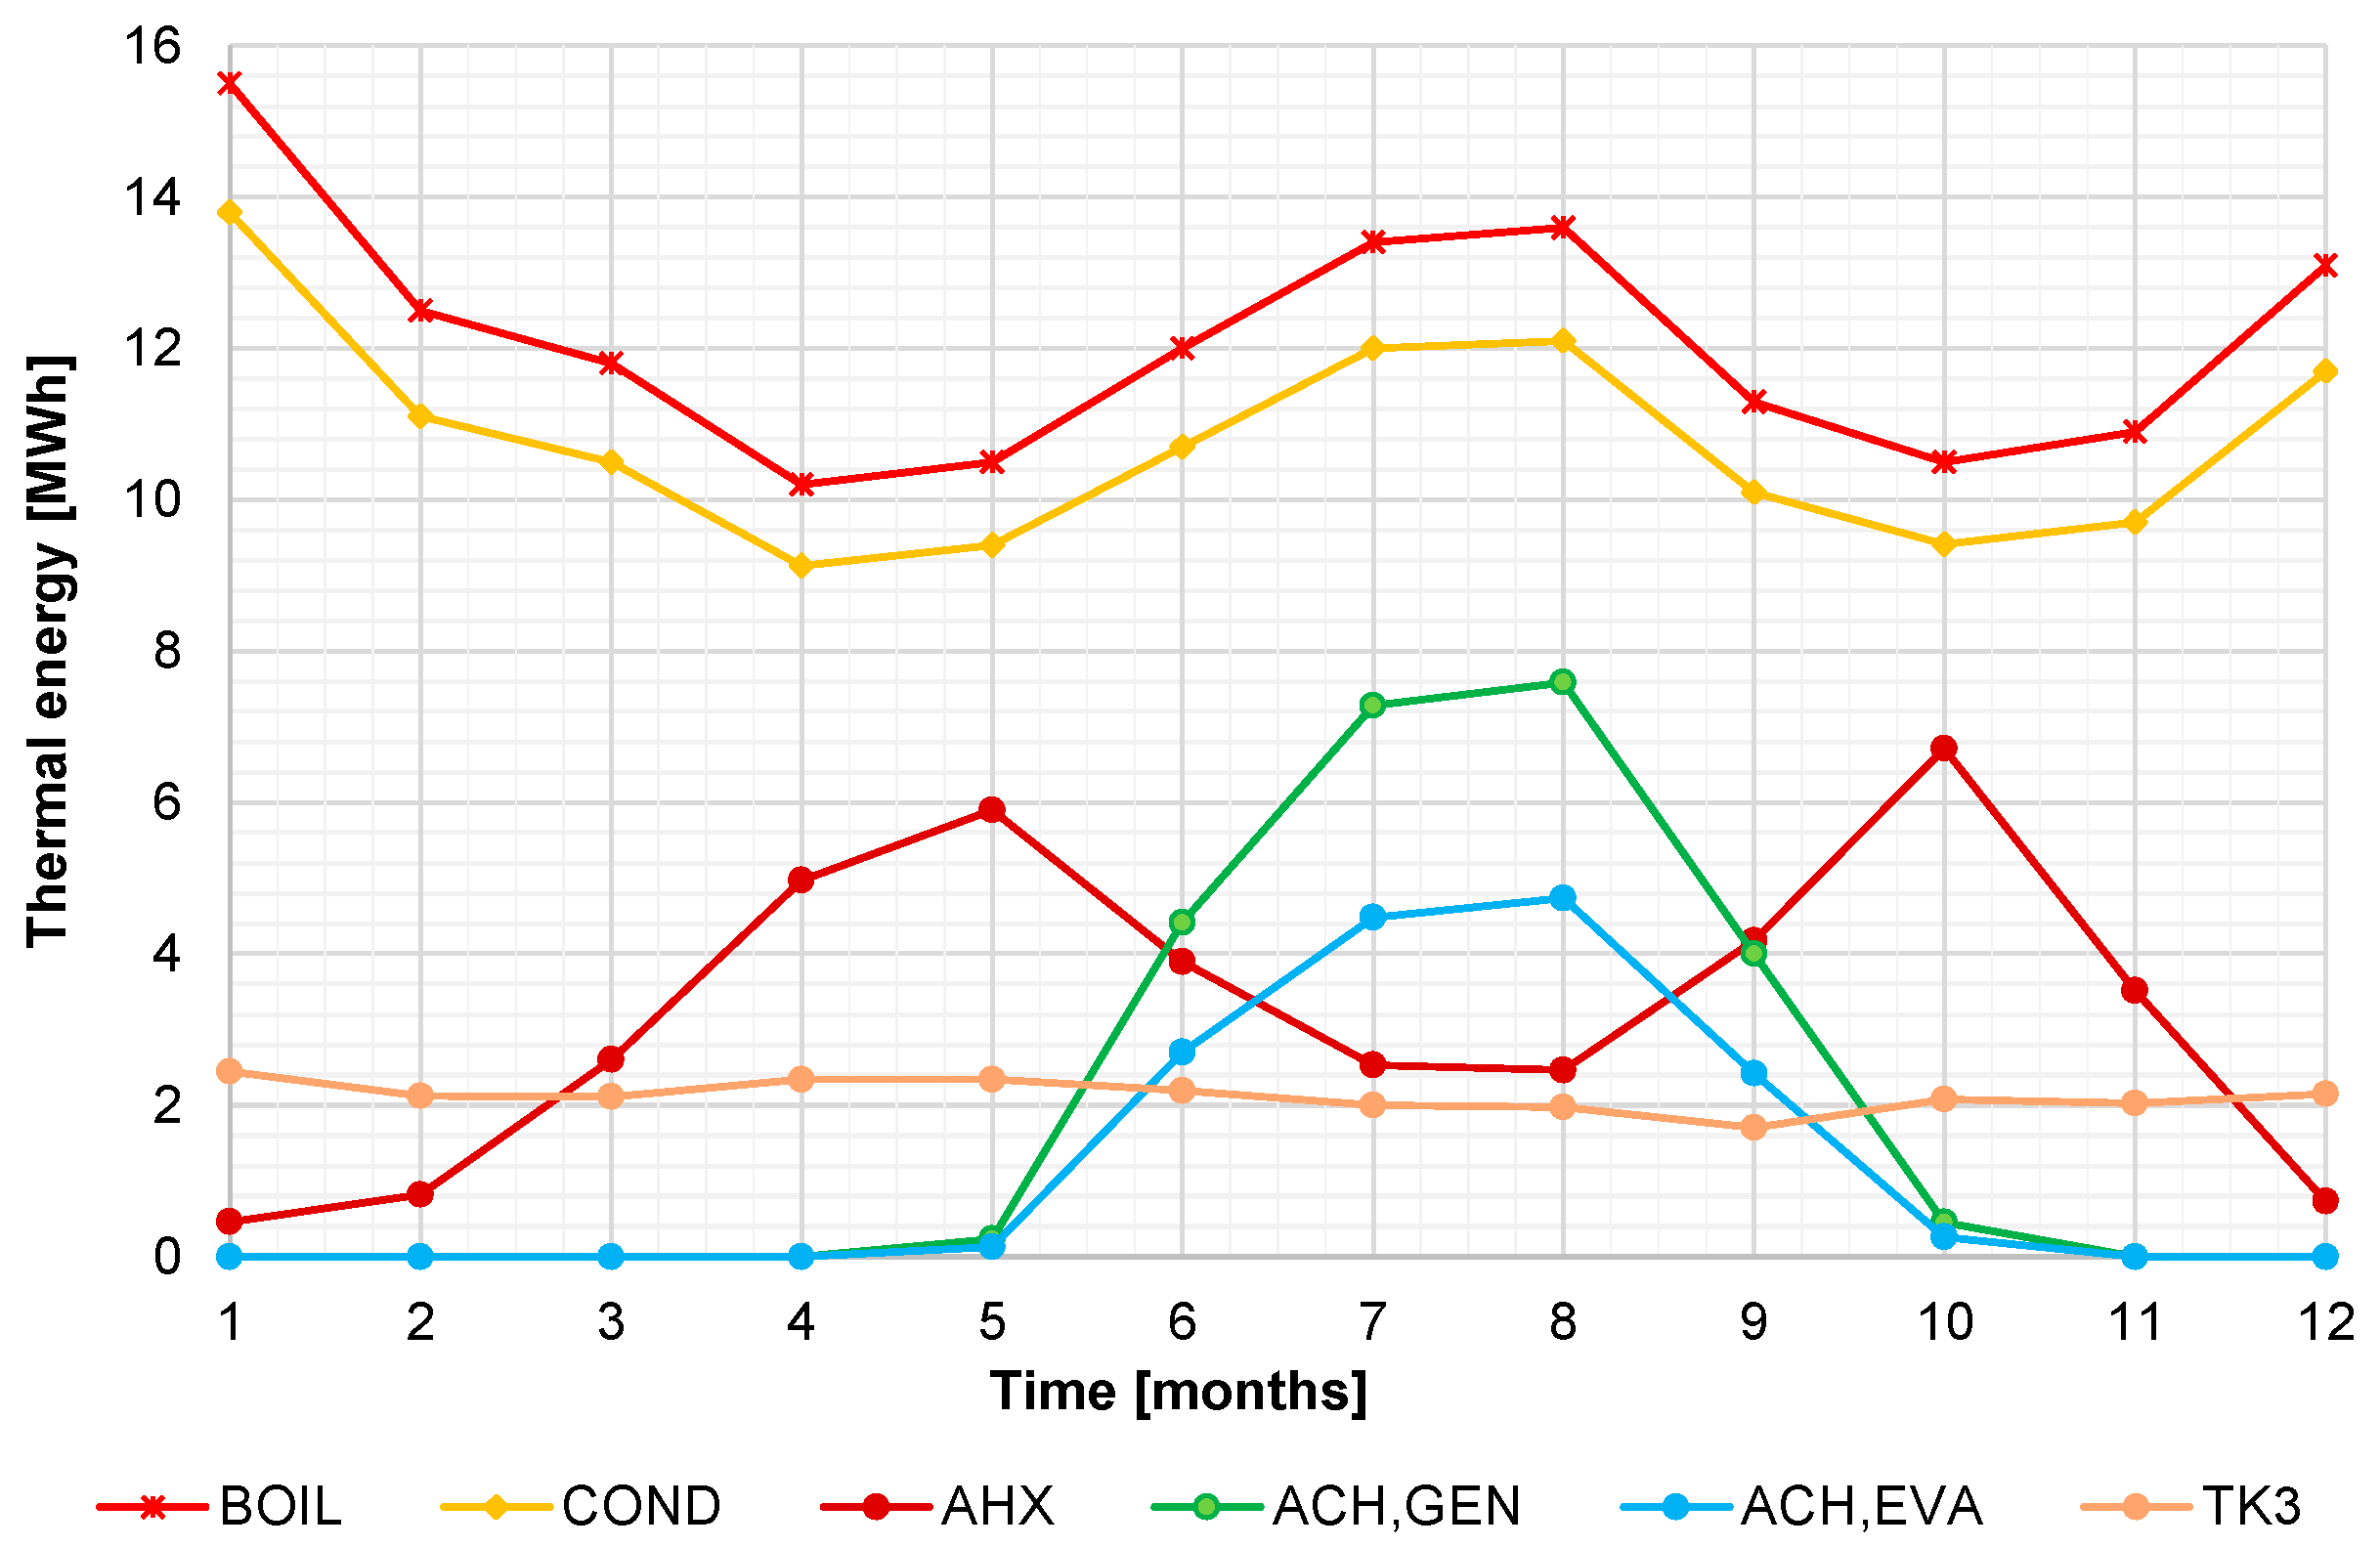
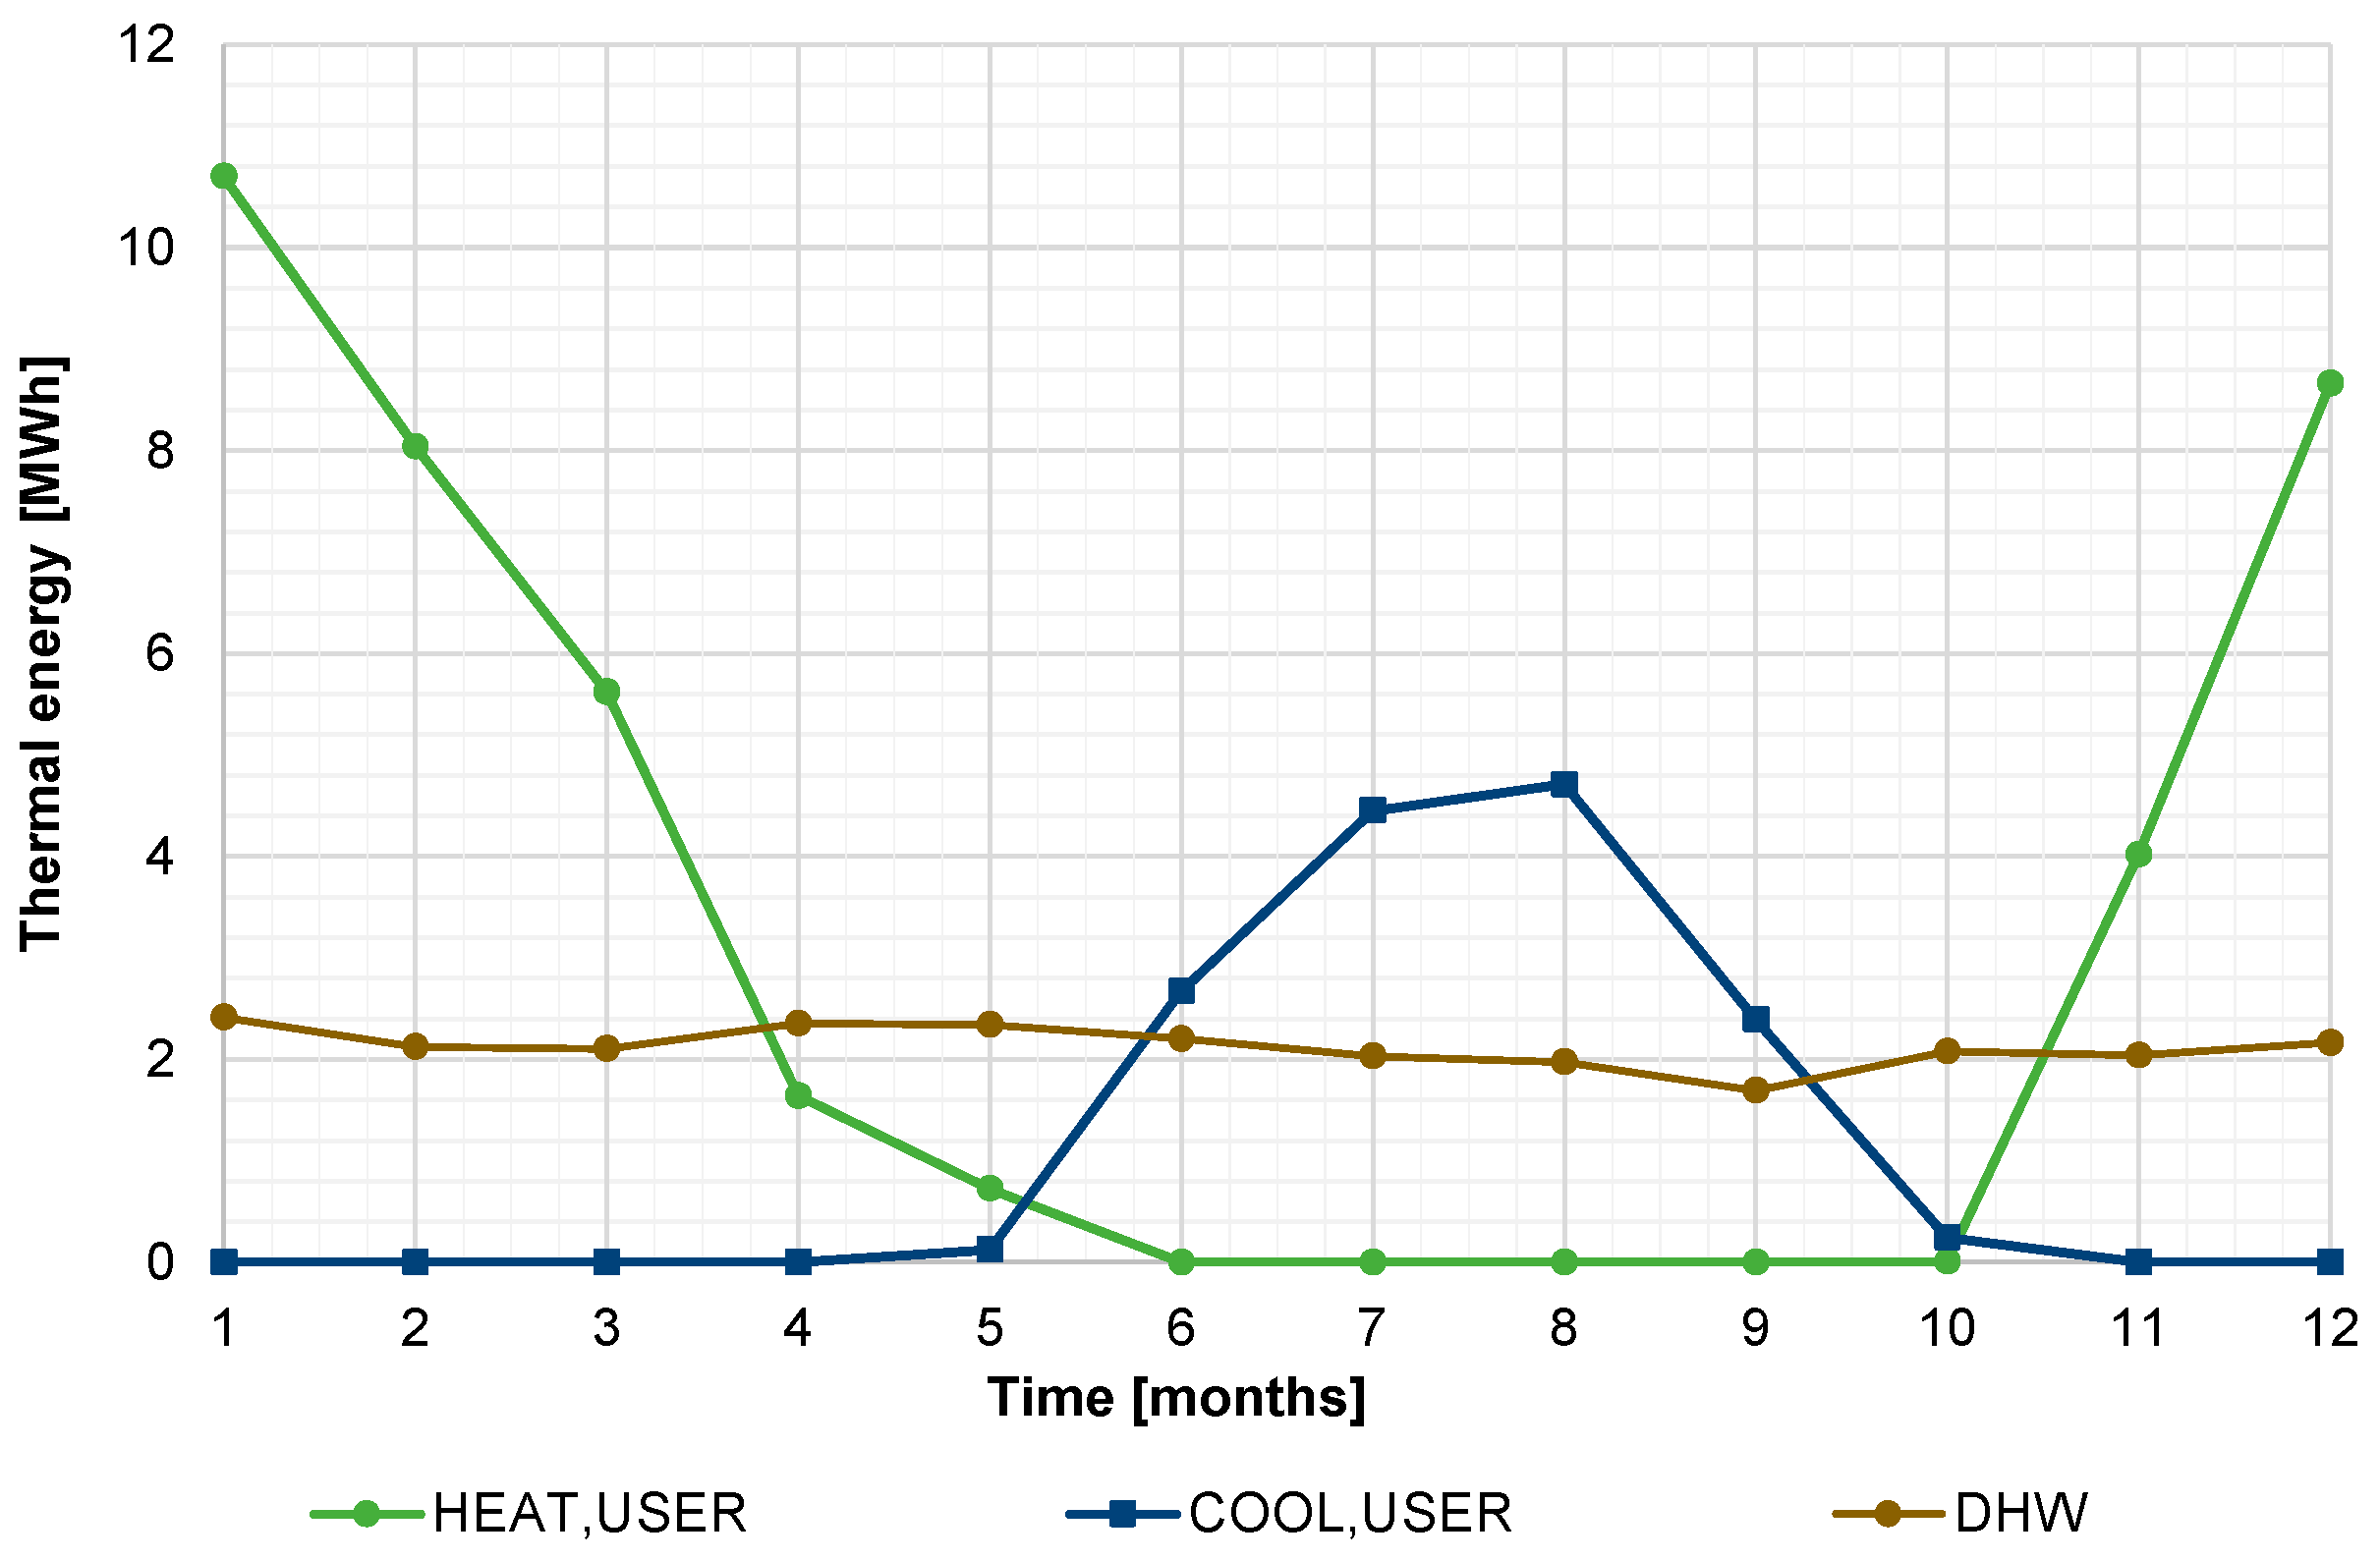
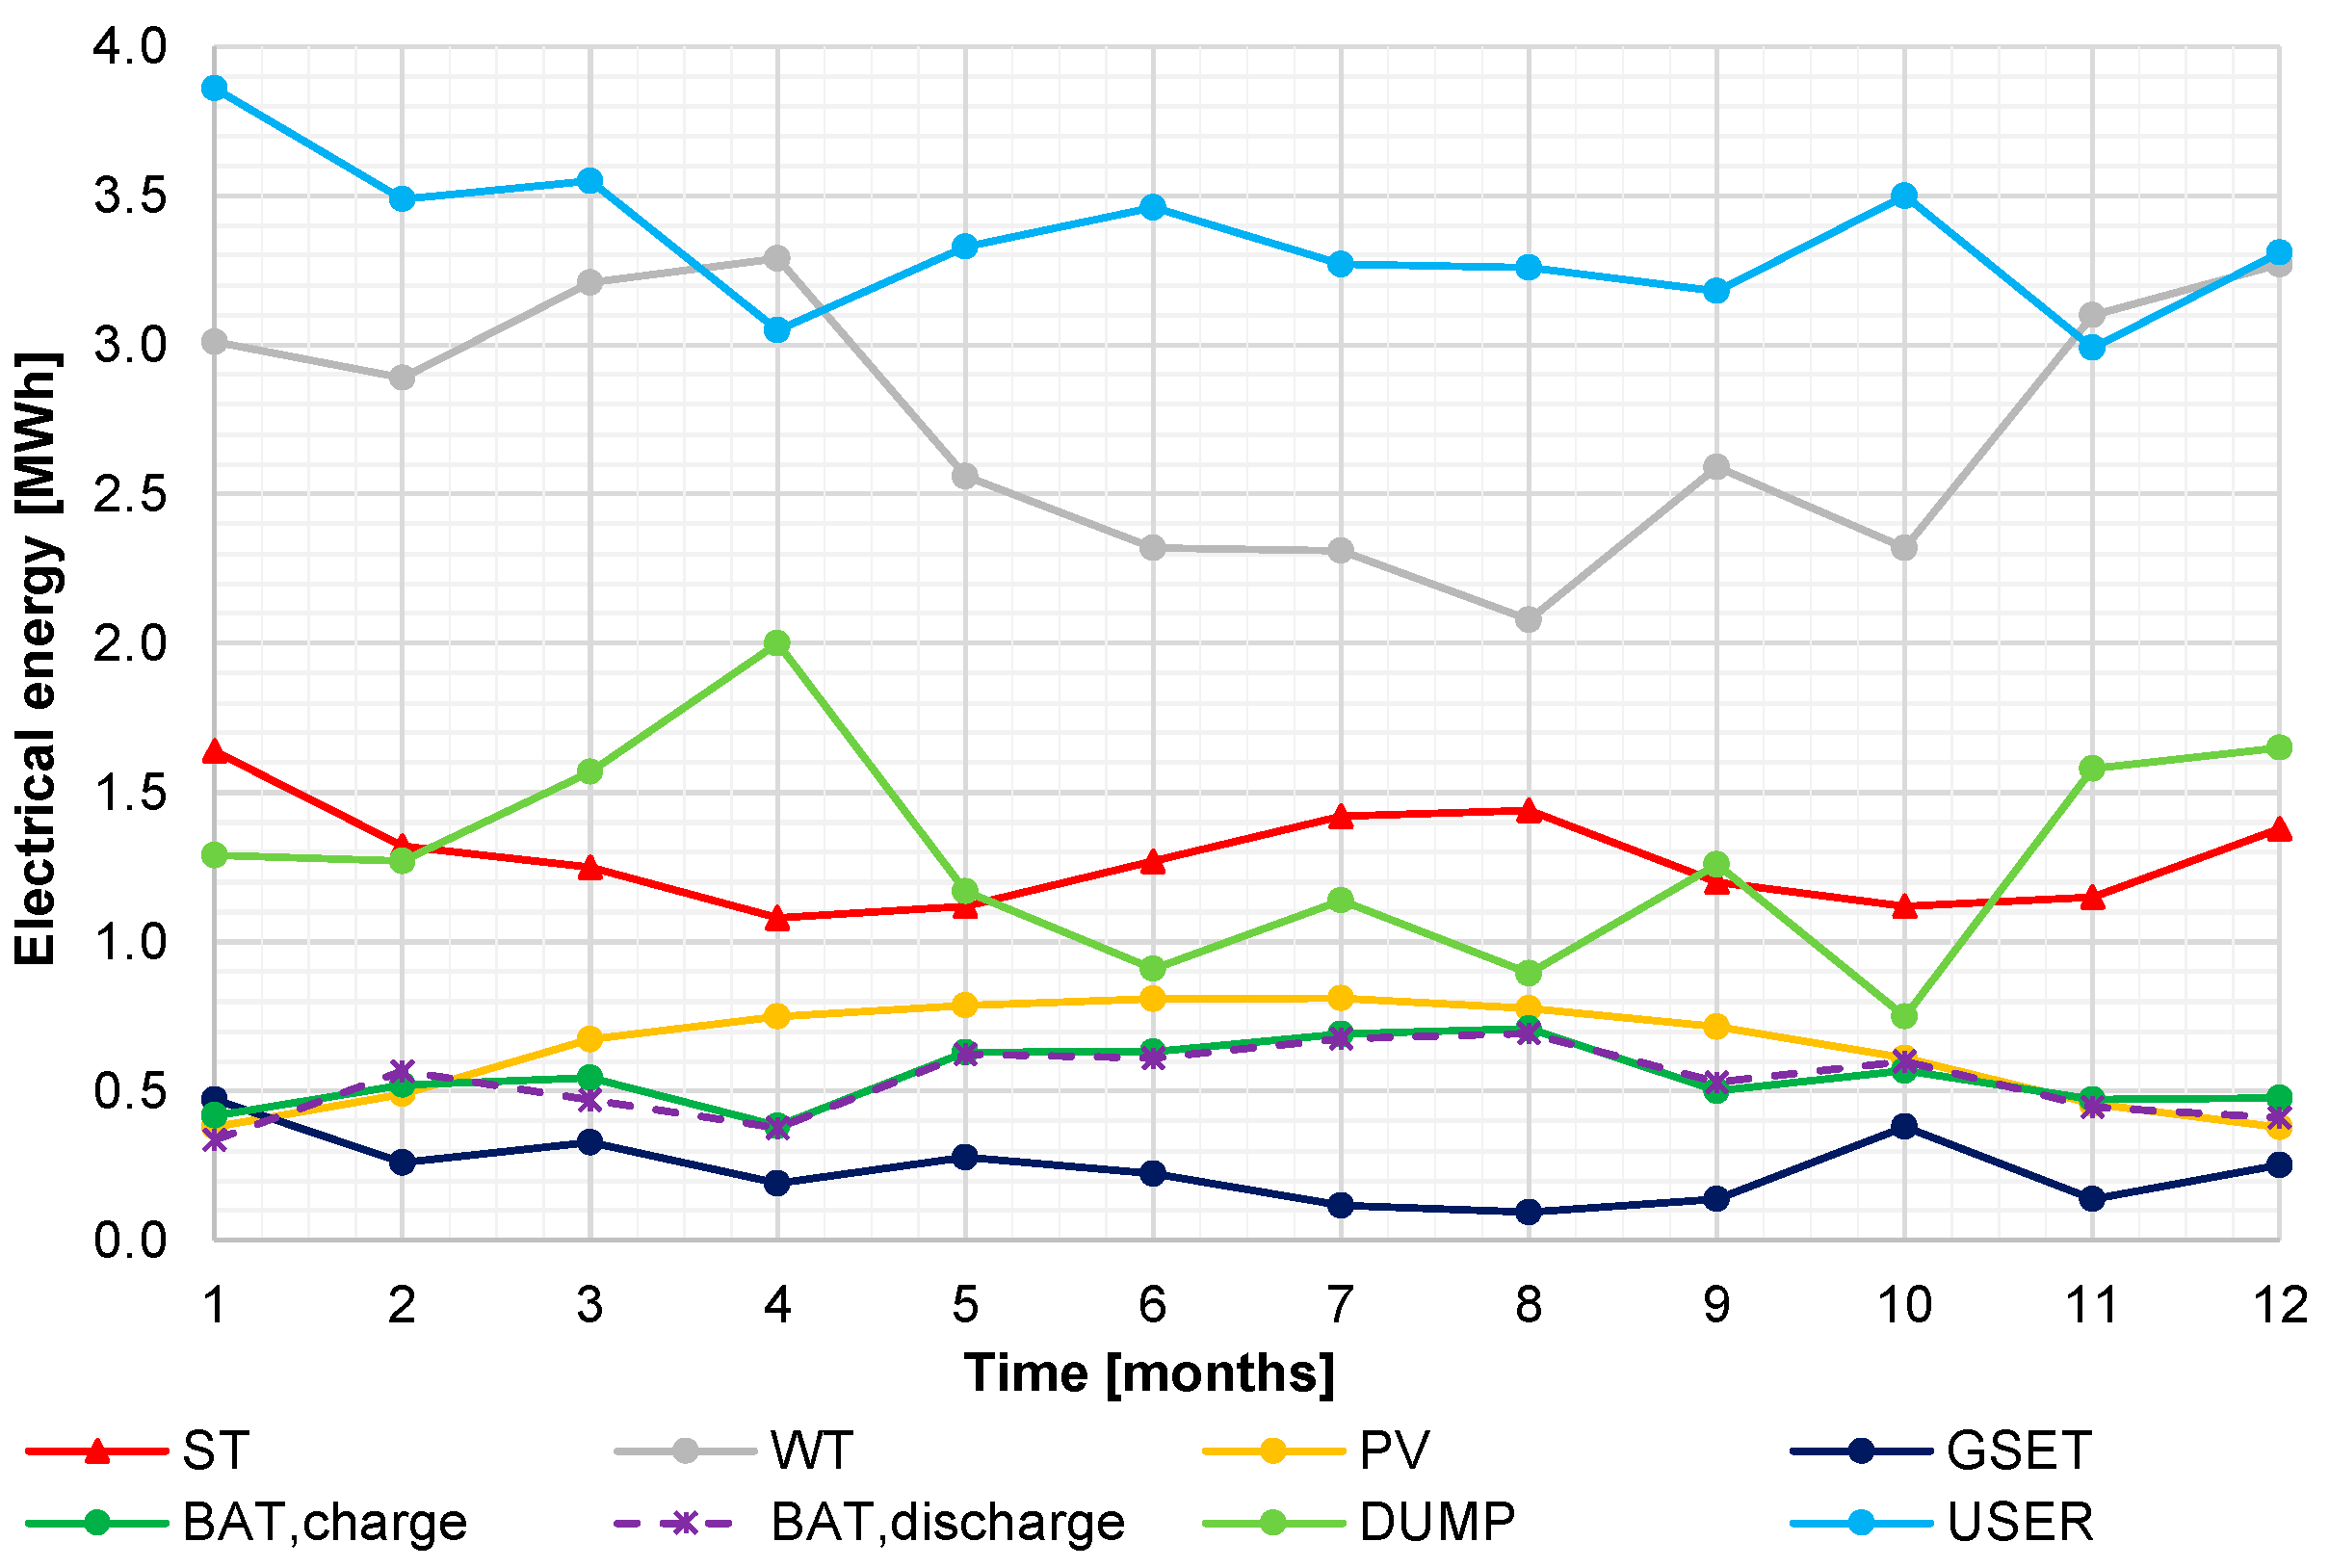
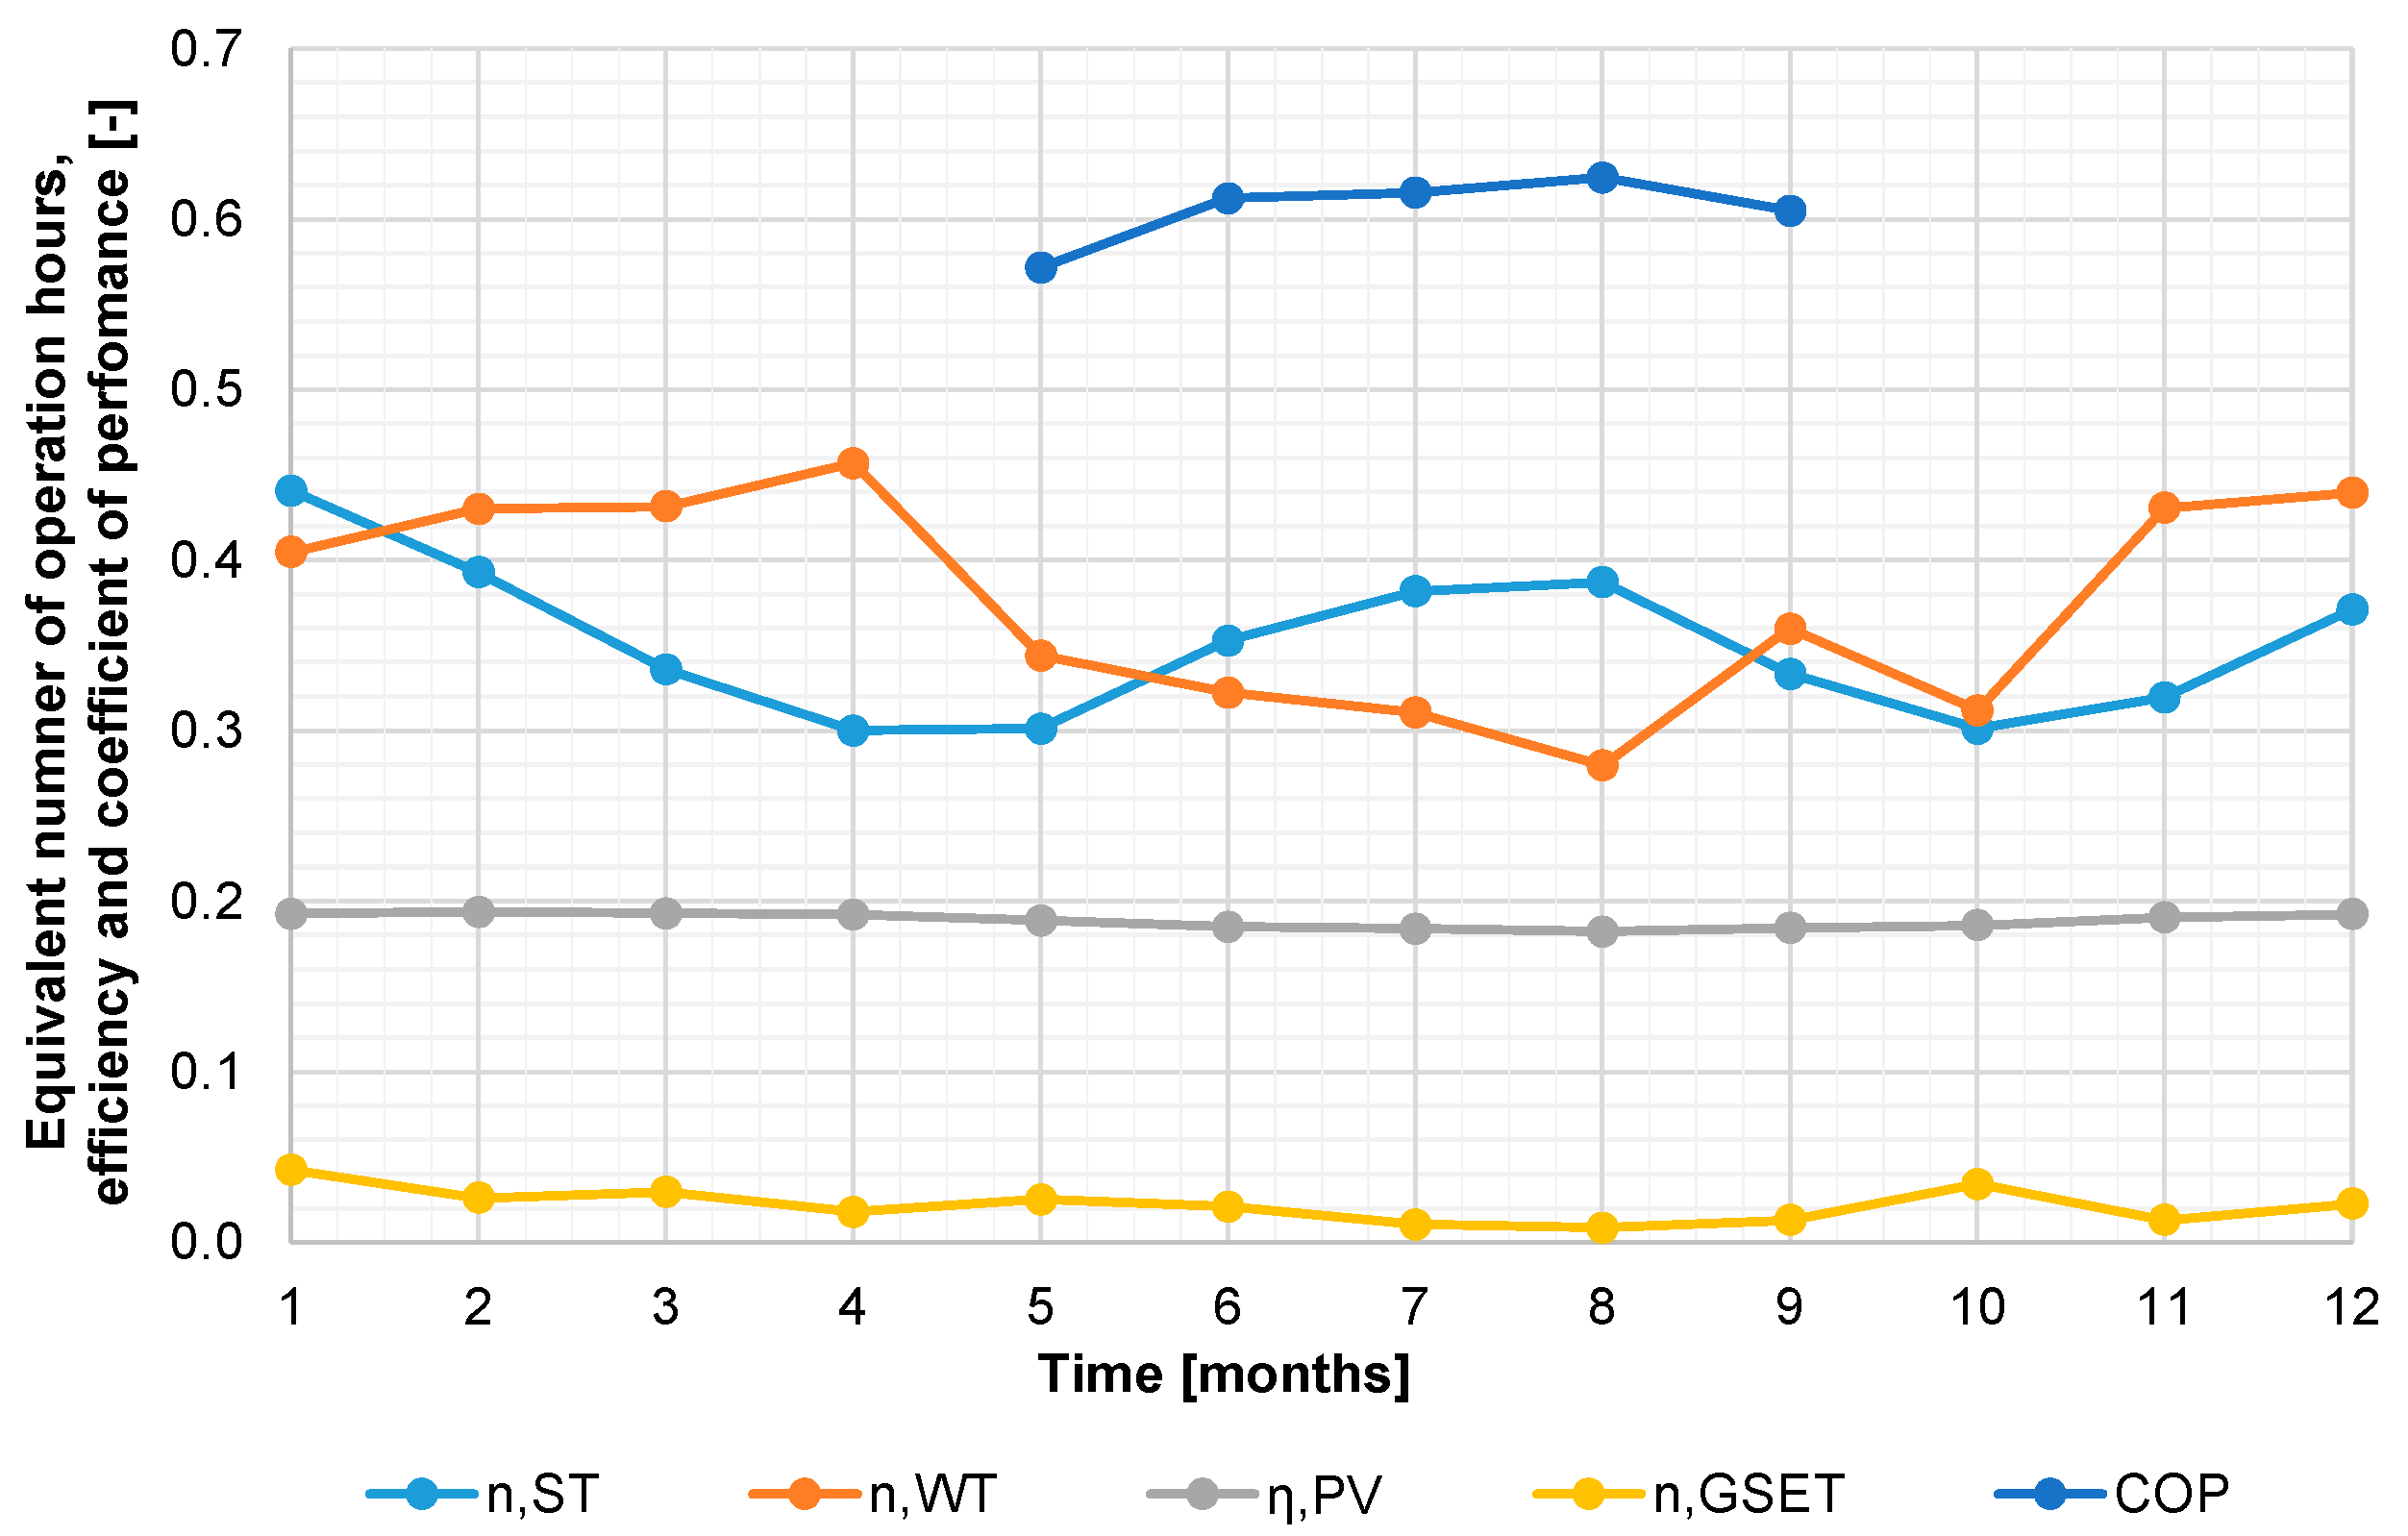
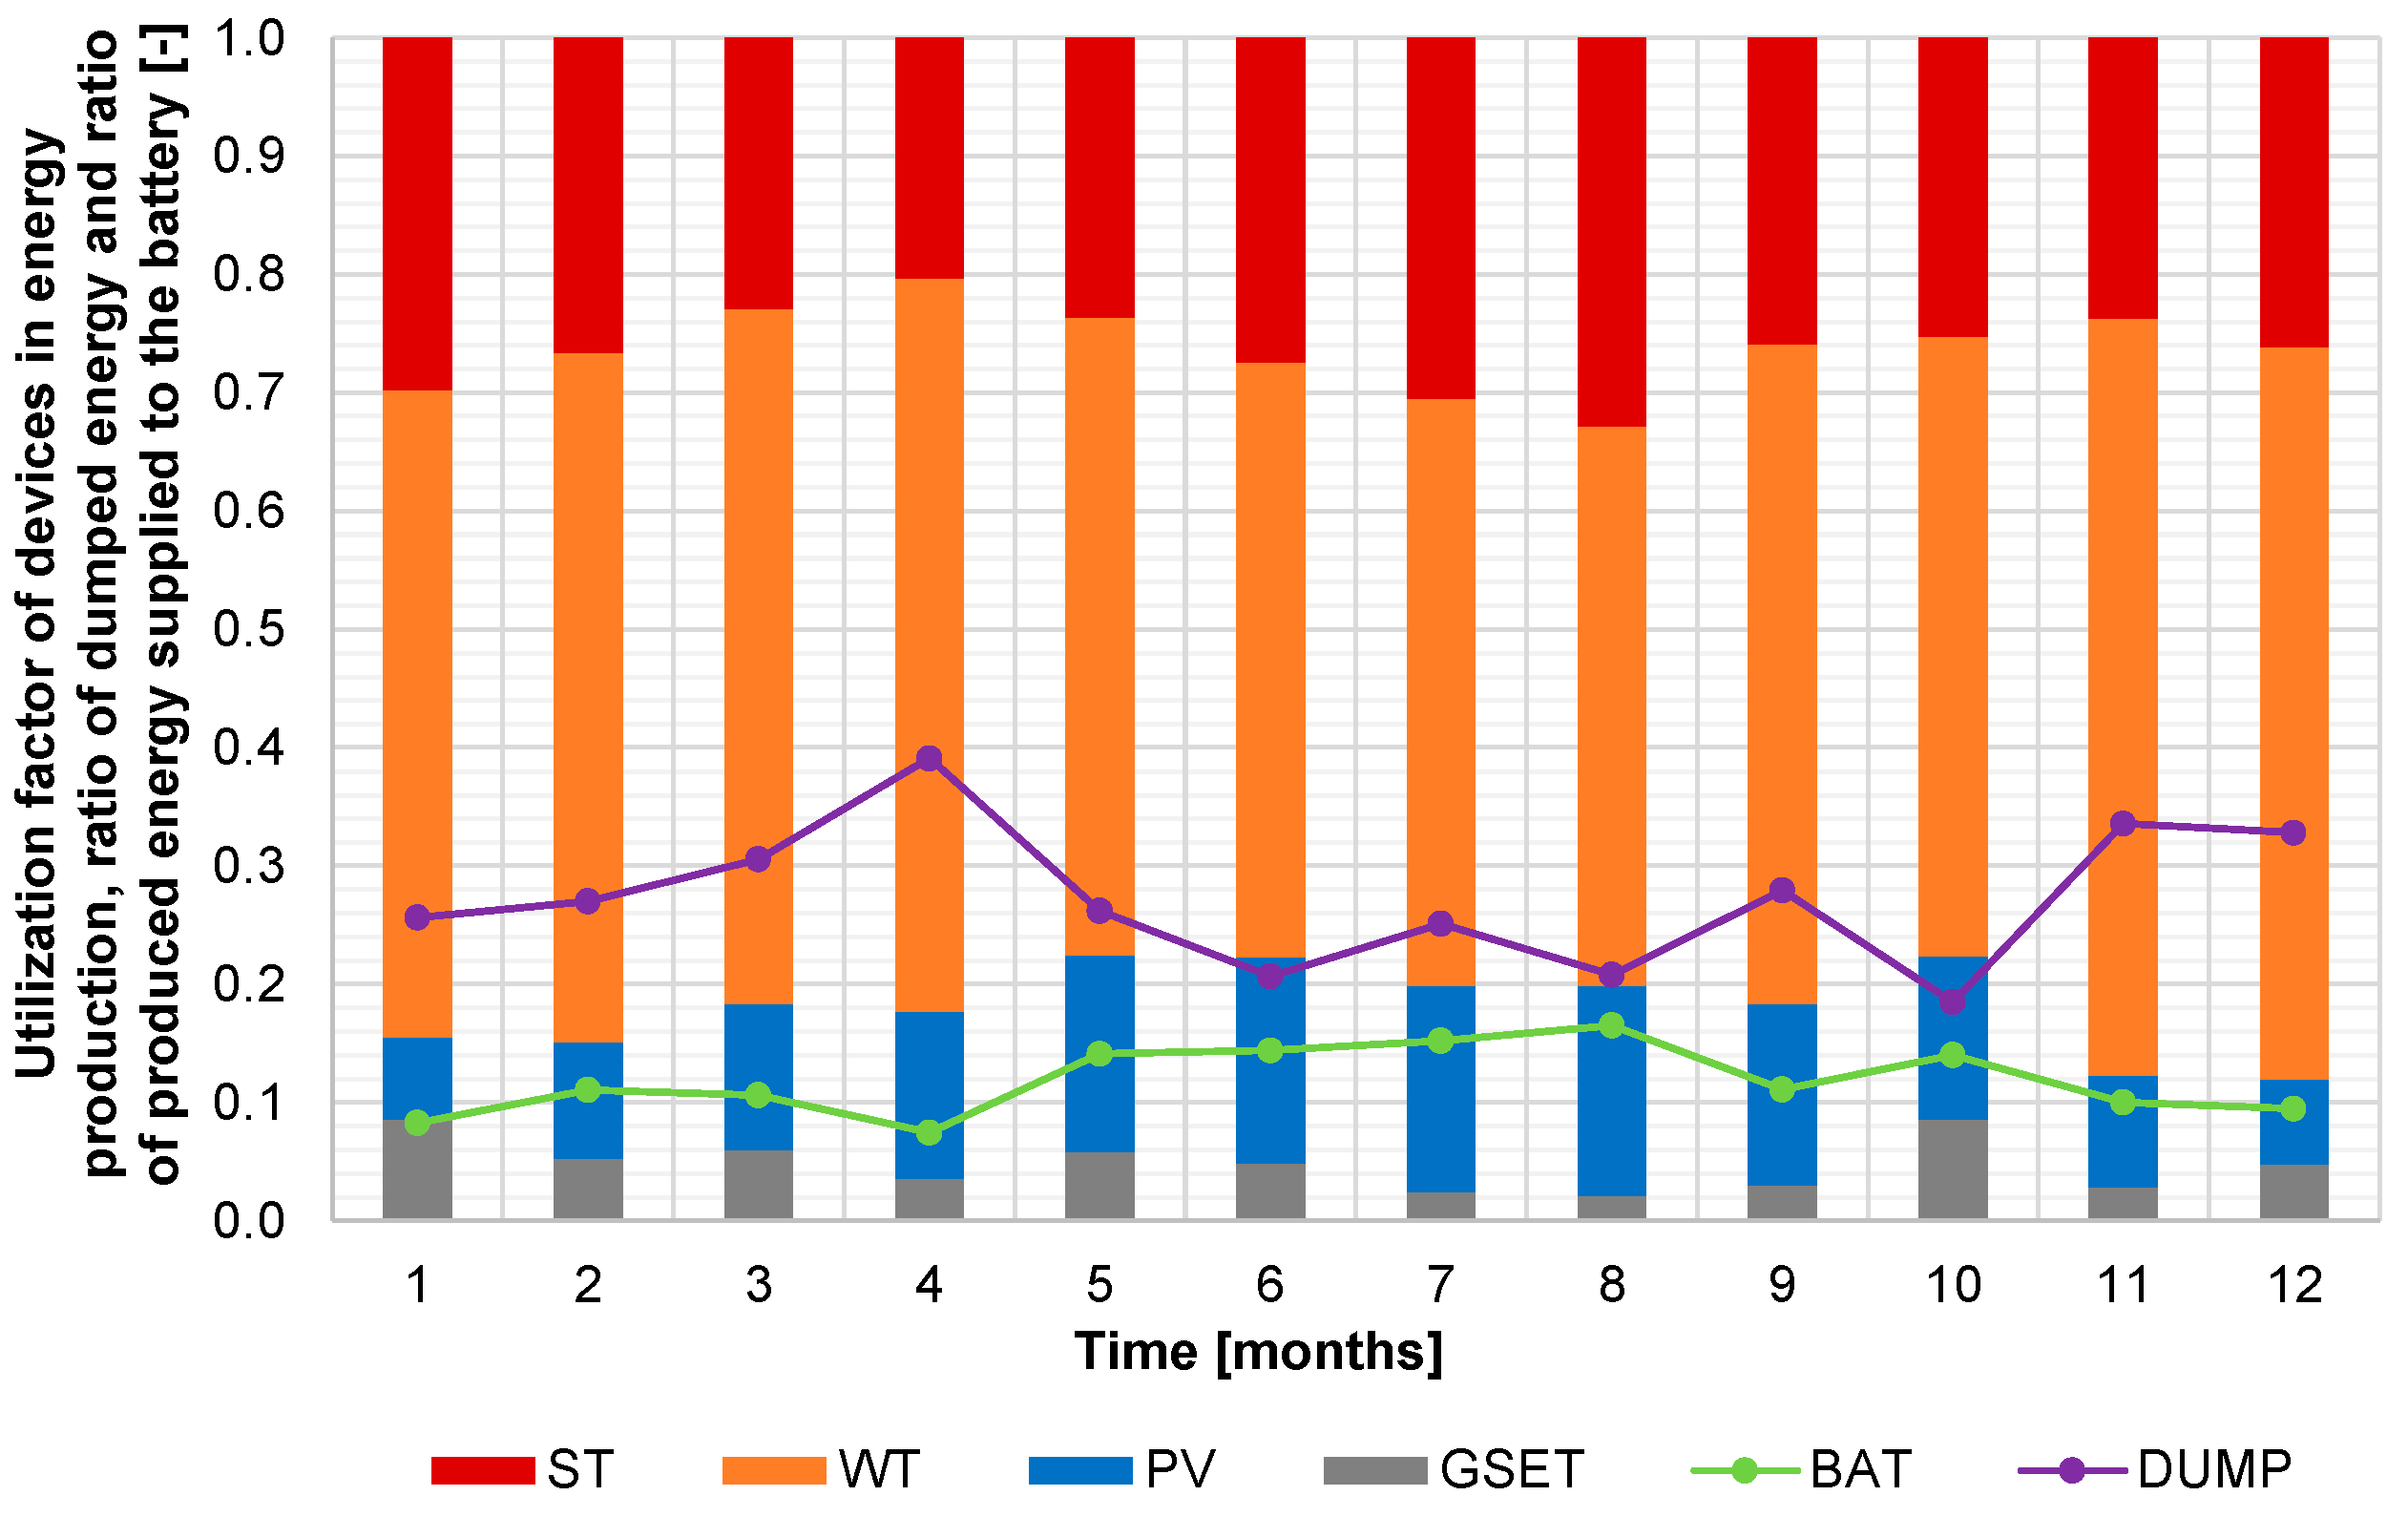
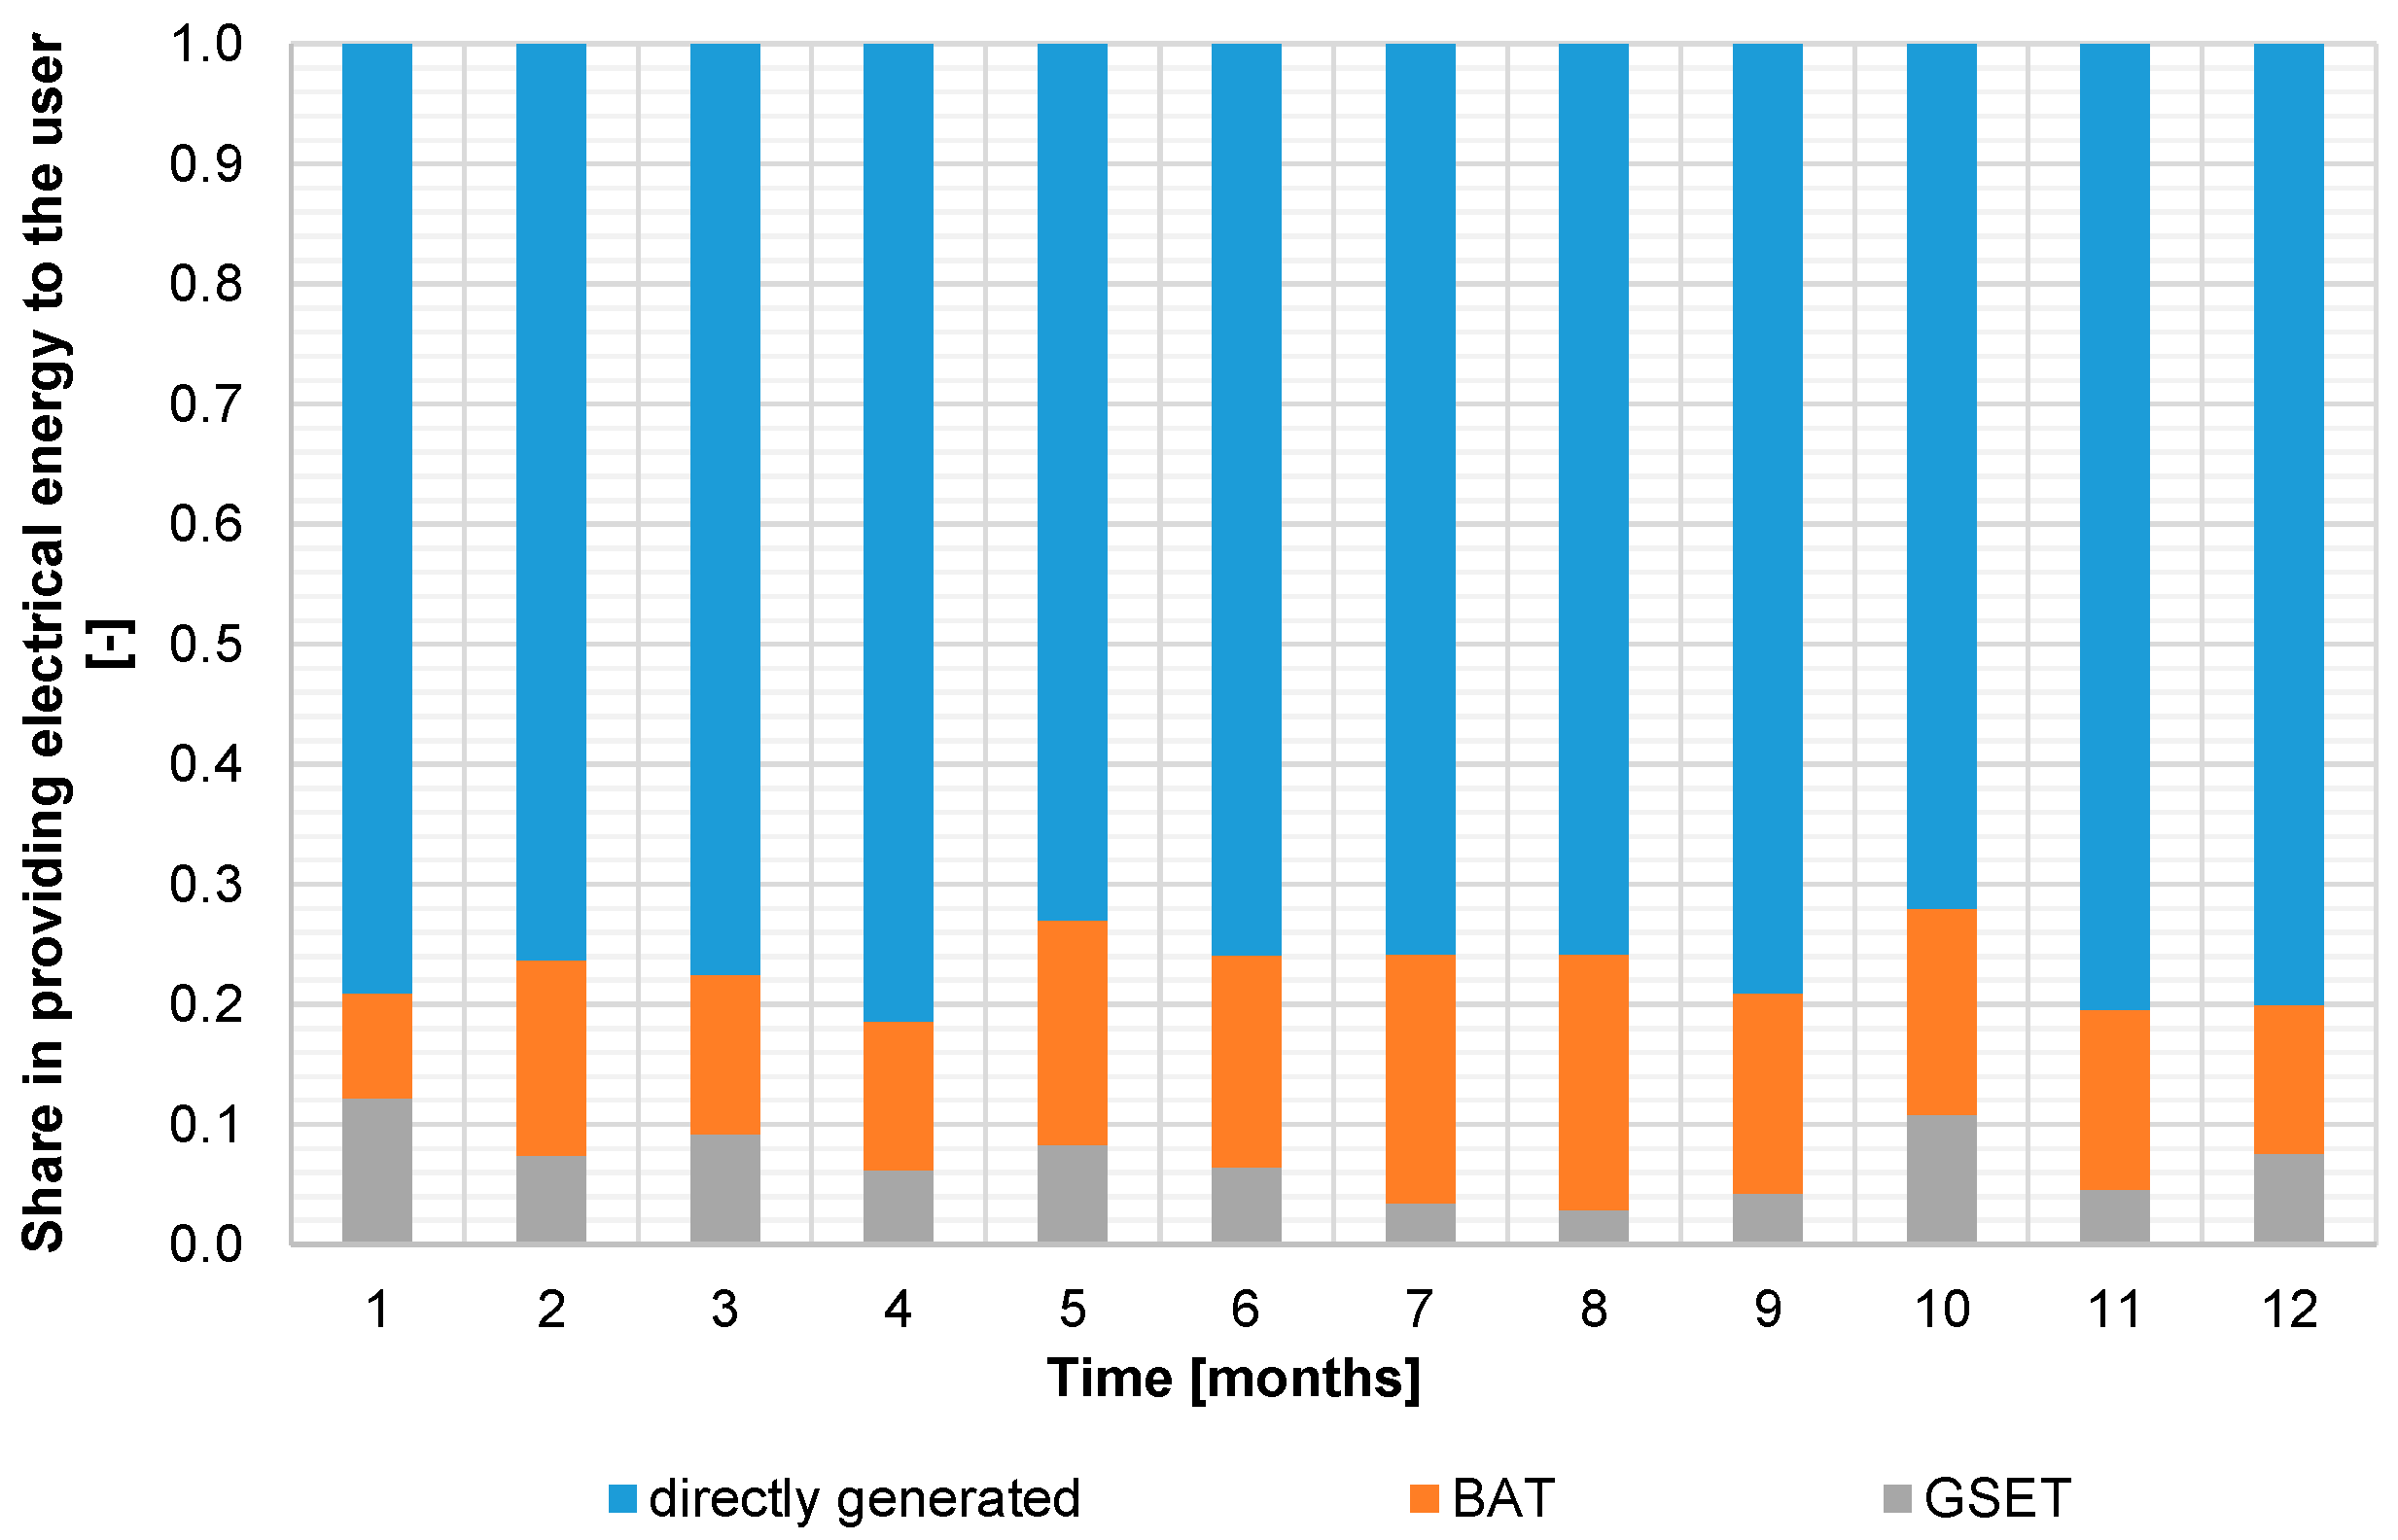
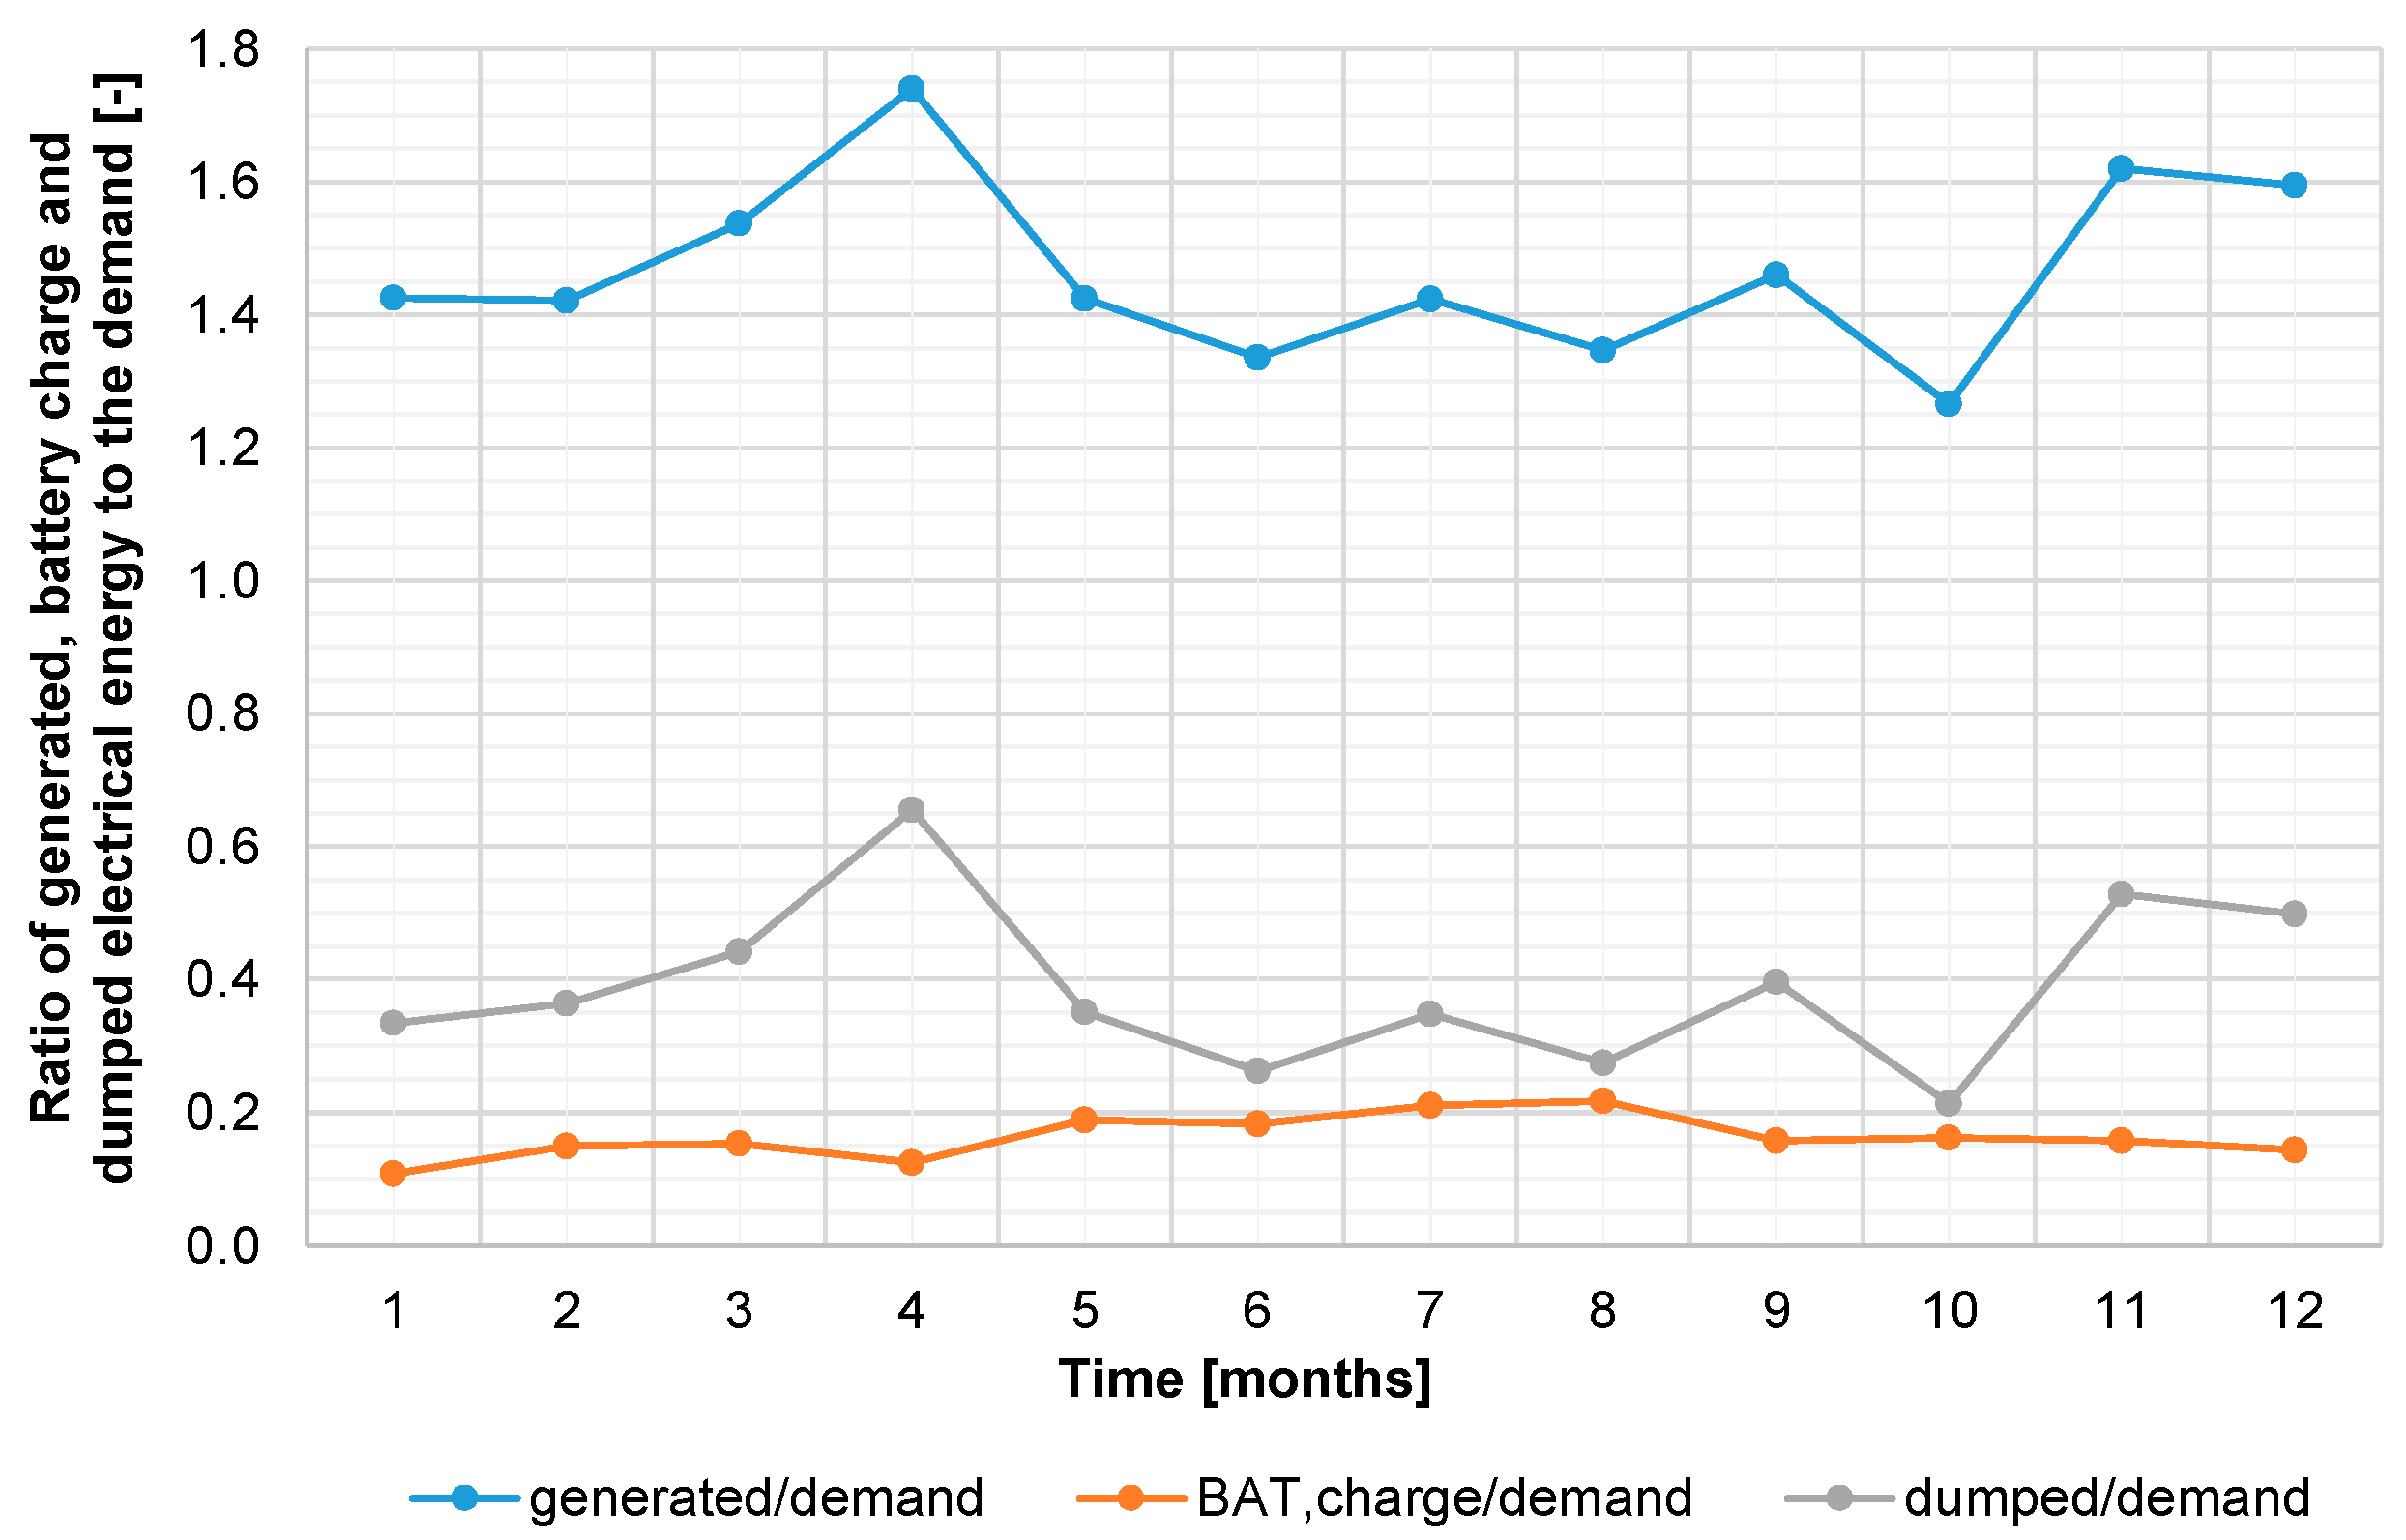
Table 1.
Literature review of hybrid systems studies.
| Analysis Type | Evaluation Area | Load Details [kWh/Day] | Size of Wind Turbine [kW] | Size of Photovoltaic Field [kW] | Capacity of Desalination Unit [m3/day] | Reference |
|---|---|---|---|---|---|---|
| Simulation [TRNSYS] | Chik Island | 239 | 38.5 | 98.7 | - | [24] |
| Simulation [MATLAB Simulink] | Teheran | 250 | 195 | 85 | - | [25] |
| Analytical | Geraldton | 15 | 1 | 2.8 | - | [26] |
| Analytical, simulation [HOMER] | Temajuk | - | 1 | 1 | - | [27] |
| Simulation [HOMER] | Saudi Arabia | 24 | 6 | 3.3 | 5 | [28] |
| Simulation [HOMER] | Newcastle | 4.6 (27.9) | 11.04–27.84 | 1.44–3.6 | - | [29] |
| Simulation | Patmos | - | 330 | 86 | 2000 | [30] |
| Simulation | Portimão | - | 5000 | 6300 | 175,000 | [31] |
Table 2.
TRNSYS build-in library components used to develop the model of the system.
| Component | Type | Component | Type |
|---|---|---|---|
| Steam turbine | 592 | Condenser | 598 |
| Wind turbine | 90 | Auxiliary heat exchanger | 5b |
| Photovoltaic field | 562 | Steam condensate pump | 597 |
| Electrical storage | 47a | Proportional controller | 1669 |
| Biomass boiler | 639 | Steam thermodynamic properties | 58 |
| Battery inverter | 48 | Diverters and mixers | 11 |
| Thermal storage | 534 | On/off controller with hysteresis | 2 |
| Domestic hot water tank | 340 | Variable volume tank | 39 |
| Dry cooler | 511 | Data plotter | 25c |
| Building | 56 | Data reader | 9e |
| Data integrator | 24 | Weather data processor | 109, 15 |
Table 3.
Main parameters of the polygeneration system model.
| Parameter | Value | Unit | Parameter | Value | Unit |
|---|---|---|---|---|---|
| BOIL thermal power | 55 | kW | DC water flowrate | 14,700 | kg/h |
| BOIL outlet temperature | 220 | °C | DC air flowrate | 51,500 | kg/h |
| P1 outlet pressure | 10 | bar | P6 flowrate | 4200 | kg/h |
| P1 nominal flowrate | 65.5 | kg/h | P9 flowrate | 6140 | kg/h |
| ST nominal power | 5 | kW | PV power | 5 | kW |
| ST isentropic efficiency | 0.50 | - | PV reference efficiency | 0.21 | - |
| ST outlet pressure | 0.386 | bar | PV temperature coefficient | −0.0035 | 1/°C |
| COND temperature | 75 | °C | WT power | 10 | kW |
| COND pinch point temp. diff. | 3 | °C | WT height | 19.9 | m |
| TK1 set point temperature | 65 | °C | WT shear coefficient | 0.14 | - |
| TK1 volume | 10 | m3 | BAT capacity | 100 | kWh |
| AHX set point temperature | 65 | °C | BAT power | 25 | kW |
| AUX capacity | 50 | kW | BAT charging efficiency | 0.98 | - |
| ACH cooling power | 40 | kW | BAT maximum state of charge | 0.90 | - |
| ACH set point | 10 | °C | BAT minimum state of charge | 0.10 | - |
| RO Feed water salinity | 45,000 | ppm | RO Mech. efficiency of the driving pump | 0.85 | - |
| RO Feed water temperature | 20 | °C | RO Feed water rate | 486 | m3/h |
| RO Feed pressure | 67 | bar | RO Recovery ratio | 0.3 | - |
| RO Density of the feed water | 1026 | g/cm3 | RO Area of membrane | 41 | - |
Table 4.
Thermal energies of main components of the system on yearly basis.
| Component | Value [MWh] | Component | Value [MWh] |
|---|---|---|---|
| BOIL | 145.40 | ACH,GEN | 24.00 |
| COND | 130.00 | ACH,EVA | 14.70 |
| AHX | 38.80 | DC | 77.80 |
| AUX | 0.16 | USER,HEAT | 39.40 |
| TK1 | 88.90 | USER,COOL | 14.60 |
| TK3 | 25.50 | USER,DHW | 25.50 |
Table 5.
Electrical energies of main components of the system on yearly basis.
| Component | Value [MWh] | Component | Value [MWh] |
|---|---|---|---|
| ST | 15.40 | BAT,discharge | 6.34 |
| WT | 32.90 | DUMP | 15.50 |
| PV | 7.63 | RO | 6.87 |
| GSET | 2.87 | AUXILIARIES | 3.33 |
| BAT,charge | 6.54 | USER | 30.00 |
Table 6.
Energy performance parameters of the system on yearly basis.
| Result | Value [-] | Result | Value [-] |
|---|---|---|---|
| ηST | 0.106 | ηPV | 0.188 |
| nST | 0.352 | nGSET | 0.022 |
| nWT | 0.376 | COP | 0.613 |
Table 7.
Primary energy performance and economic results of the system.
| Component | Value | Unit | Component | Value | Unit |
|---|---|---|---|---|---|
| PESPS-IS,RS-GSET | 195.04 | MWh | JPS-IS,RS-GRID | 13.50 | kEUR/year |
| PESPS-IS,RS-GRID | 149.94 | MWh | JPS-IS-BIO,RS-GSET | 16.20 | kEUR/year |
| PESPS-GRID,RS-GSET | 231.80 | MWh | JPS-IS-BIO,RS-GRID | 10.50 | kEUR/year |
| PESPS-GRID,RS-GRID | 186.70 | MWh | JPS-GRID,RS-GSET | 24.20 | kEUR/year |
| PESrPS-IS,RS-GSET | 0.956 | - | JPS-GRID-BIO,RS-GRID | 18.50 | kEUR/year |
| PESrPS-IS,RS-GRID | 0.943 | - | JPS-GRID-BIO,RS-GSET | 18.50 | kEUR/year |
| PESrPS-GRID,RS-GSET | 1.136 | - | JPS-GRID-BIO,RS-GRID | 12.80 | kEUR/year |
| PESrPS-GRID,RS-GRID | 1.174 | - | SPBPS-IS,RS-GSET | 7.15 | years |
| Cop,PS-IS | 3.72 | kEUR/year | SPBPS-IS,RS-GRID | 9.53 | years |
| Cop,PS-IS-BIO | 6.67 | kEUR/year | SPBPS-IS-BIO,RS-GSET | 8.45 | years |
| Cop,PS-GRID | 1.45 | kEUR/year | SPBPS-IS-BIO,RS-GRID | 12.20 | years |
| Cop,PS-GRID-BIO | 4.39 | kEUR/year | SPBPS-GRID,RS-GSET | 5.67 | years |
| Cop,RS-GSET | 22.90 | kEUR/year | SPBPS-GRID,RS-GRID | 6.95 | years |
| Cop,RS-GRID | 17.20 | kEUR/year | SPBPS-GRID-BIO,RS-GSET | 7.41 | years |
| JPS-IS,RS-GSET | 19.10 | kEUR/year | SPBPS-GRID-BIO,RS-GRID | 10.00 | years |
Publisher’s Note: MDPI stays neutral with regard to jurisdictional claims in published maps and institutional affiliations. |
© 2022 by the authors. Licensee MDPI, Basel, Switzerland. This article is an open access article distributed under the terms and conditions of the Creative Commons Attribution (CC BY) license (https://creativecommons.org/licenses/by/4.0/).
Share and Cite
MDPI and ACS Style
Figaj, R.; Żołądek, M.; Homa, M.; Pałac, A. A Novel Hybrid Polygeneration System Based on Biomass, Wind and Solar Energy for Micro-Scale Isolated Communities. Energies 2022, 15, 6331. https://doi.org/10.3390/en15176331
AMA Style
Figaj R, Żołądek M, Homa M, Pałac A. A Novel Hybrid Polygeneration System Based on Biomass, Wind and Solar Energy for Micro-Scale Isolated Communities. Energies. 2022; 15(17):6331. https://doi.org/10.3390/en15176331
Chicago/Turabian StyleFigaj, Rafał, Maciej Żołądek, Maksymilian Homa, and Anna Pałac. 2022. "A Novel Hybrid Polygeneration System Based on Biomass, Wind and Solar Energy for Micro-Scale Isolated Communities" Energies 15, no. 17: 6331. https://doi.org/10.3390/en15176331
Note that from the first issue of 2016, this journal uses article numbers instead of page numbers. See further details here.