Article

Computational Investigation on the Performance Increase of a Small Industrial Diesel Engine Regarding the Effects of Compression Ratio, Piston Bowl Shape and Injection Strategy

Institute of Sustainable Mobile Drivetrains, Technical University Munich, Schragenhofstr. 31, 80992 Munich, Germany
*
Author to whom correspondence should be addressed.
Energies 2022, 15(13), 4674; https://doi.org/10.3390/en15134674
Submission received: 29 May 2022 / Revised: 21 June 2022 / Accepted: 22 June 2022 / Published: 25 June 2022
(This article belongs to the Special Issue CASES Vehicles and the Mobility of the Next Generation)

Abstract

:
This paper describes the simulative approach to calibrate an already extremely highly turbocharged industrial diesel engine for higher low-speed torque. The engine, which is already operating at its cylinder-pressure maximum, is to achieve close to 30 bar effective mean pressure through suitable calibration between the compression ratio, piston-bowl shape and injection strategy. The basic idea of the study is to lower the compression ratio for even higher injection masses and boost pressures, with the resulting disadvantages in the area of emissions and fuel consumption being partially compensated for by optimizations in the areas of piston shape and injection strategy. The simulations primarily involve the use of the 3D CFD software Converge CFD for in-cylinder calibration and a fully predictive 1D full-engine model in GT Suite. The simulations are based on a two-stage turbocharged 1950 cc four-cylinder industrial diesel engine, which is used for validation of the initial simulation. With the maximum increase in fuel mass and boost pressure, the effective mean pressure could be increased up to 28 bar, while specific consumption increased only slightly. Depending on the geometry, NOx or CO and UHC emissions could be reduced.

1. Introduction

Development of today’s internal-combustion engines continues to be a major challenge. Despite the great expertise of manufacturers in almost all areas of energy conversion, compliance with increasingly stringent emission regulations is a demanding task. In addition to compliance with various emissions, the demand for steadily decreasing fuel consumption and increasing engine performance also plays a role that must not be neglected. These challenges are not only to be found in the automotive-industry sector but also to the same extent in the area of off-road or industrial engines. Diesel engines are often used in industrial applications, which are characterized by comparatively low HC and CO emissions as well as higher thermal efficiency [1,2]. However, it should be noted that diesel engines are equally known for increased NOx and soot emissions [3]. The further development of modern diesel engines is, therefore, constantly driven by a compromise mainly between emissions, performance and fuel consumption. There are many ways to achieve this, but various studies show that internal engine improvements in the area of fuel injection and combustion-chamber design already account for a large part of the compromise.
Brijesh et al. [4] conducted a numerical study to gain a better understanding of the influences of combustion-chamber geometry and nozzle tilt angle on both combustion processes and emissions. Depending on the shape, soot, CO and HC could be reduced significantly, with only a slight increase in NOx values. Reductions in HC and CO emissions, with unchanged soot and NOx values, were also a result of using a bow combustion chamber. Yoo et al. [5] investigated the correlation between fuel consumption and the combustion system. Adjustments in swirl ratio, nozzle flow rate and piston-bowl geometry achieved over 6% improvement in fuel consumption at the rated power condition. In addition, soot emissions were reduced at a constant NOx level. Another important factor is presented in the investigations by Splitter et al. [6], who, among other things, dealt with the interaction of bowl depth and squish volume. As can be seen from the data, the squish height is also responsible for thermal losses and the number of unburned hydrocarbons. Ideally, a flat, wide piston bowl should be selected in combination with a minimized squish volume.
Hu et al. [7] studied the influence of certain piston parameters such as piston-bowl diameter, re-entrant angle and bowl-bottom radius on fuel–air mixing and performance. In terms of indicated power, the piston-bowl diameter and bowl-bottom radius were found to be the most critical parameters. The results also showed that the piston shape and the heat-release rate are closely related, since an inappropriate design can lead to fuel-rich regions, which in turn hamper both the mixing and combustion processes. Similar investigations can be found in [8].
Subramanian et al. [9] also used a numerical approach to evaluate different piston geometries (hemispherical, toroidal, shallow). Among other observations, it was shown that piston shape itself has no effect on cylinder peak pressure. This finding was confirmed by the studies of Zolver et al. [10], which also demonstrated no correlation between piston shape and peak pressure. Contradictory results could be found in [3,11,12]. The study includes the same three piston shapes, which, however, showed a clear dependence on the maximum cylinder pressure [3]. The authors [3] justified the different peak pressures by means of a higher burning rate of fuel, caused by the increased swirl and better fuel–air mixing process. Further differences were also apparent in the gradation of the swirl results, although the TTC form represented the maximum in each case [3,9]. Annamalai et al. [13] also demonstrated the advantages of a toroidal-cavity piston over a hemispherical piston. The study described a more uniform distribution of the fuel–air mixture and the resulting better combustion and higher thermal efficiency.
Shi et al. [14] illustrated in their study that the design of a suitable piston geometry is sensitive to high loads compared to low-load operating points. They also claimed that the selection of a piston geometry in the high-load case should be done before the design of a low-load geometry. The shapes investigated in each case showed clear dependencies with respect to NOx, soot and specific fuel consumption, even though the basic shape was only adjusted slightly compared to other studies. The investigations by Dolak et al. [15] also showed that emissions and fuel consumption can be influenced by optimizing the piston geometry. The subject was the development of a stepped-lip geometry. In combination with a targeted-injection strategy, it was possible to utilize the two zones below and above the stepped-lip contour, which ensured better oxygen utilization and thus lower soot emissions. Furthermore, the smaller surface area resulted in reduced heat loss and consequently lower specific fuel consumption. Similar observations can be found in Quazi et al. [16] and Lee et al. [17], who also investigated different piston shapes. Here, too, the stepped-lip contour in particular shows relatively large advantages in the areas of soot emissions, NOx emissions and specific-fuel consumption. The reasons given are consistent with [16]. Appukuttan et al. [18] also demonstrated the potential for lowering BSFC and NOx emissions, provided that a narrow and deep stepped-lip-piston geometry is selected.
Cipolla et al. [19] investigated the effects of different piston shapes in combination with a lowered compression ratio. In addition to the usual emissions, IMEP and EVO temperatures were also evaluated. The results showed that piston shapes with a low aspect ratio (bowl diameter in relation to piston depth) are preferable. The reason for this is the high utilization of oxygen in the full-load range and the wide bowl diameter, which provides considerable flexibility with regard to the injection strategy in the part-load range. Hariram et al. [20] studied the influence of different compression ratios on combustion at varying loads in the range of 1 bar to 4 bar BMEP. Increasing the CR from 16 to 18 resulted in a 30% reduction in BSFC at full load. Comparable results can be found in [12,21]. Peak pressure was reduced by 10% and 21% in the full-load and low-load ranges, respectively, when lowered to CR 16 [22]. Other parameters of the study included heat-release and pressure-rise rates, break-thermal efficiency, exhaust-gas temperatures and ignition delay, which are all dependent on the CR. Correlations between cylinder pressure, emissions and compression ratio are also described in Kassaby et al. [22]. Funayama et al. [23] investigated the effects of varying compression and specific heat ratios. The authors were able to prove that higher compression ratios are effective in improving thermal efficiency. In addition, the influence of the piston shape was investigated as a further variable for the highest CR. The transition from a deep bowl to a shallow dish bowl led, among other things, to a shorter combustion phase and a higher indicated thermal efficiency. Minamino et at. [24] studied the effects of compression ratio on soot emissions. Despite a constant excess-air ratio (EAR), soot emissions increased with increasing load due to longer injection times. It was also observed that the effect of compression ratio on soot emissions was smaller at lower engine speeds. Finally, it was shown that short injection times at high pressure tend to be required for low-soot emissions at high loads. Sheikh et al. [25] described that a reduction in BSFC with a reduced CR is possible by means of suitable piston-shape adaptation. The piston shape with the lowest CR also has the lowest combustion temperatures and, consequently, lower NOx emissions (similar findings regarding NOx may be found in [22]). The highest accumulated heat-release rate for the piston variant just mentioned also indicates minimized fuel consumption.
The present study attempts to use the findings from the areas of piston geometry design, compression ratio and injection strategy and apply them to a small, highly supercharged industrial diesel engine. Since the engine already reaches its mechanical-load capacity at a peak pressure of around 180 bar (390 Nm at 1300 rpm), an optimized piston shape and a reduced compression ratio are intended to achieve even higher loads. The reduced peak pressure resulting from the CR reduction is then to be compensated for by an increase in injection mass, so that a significantly increased performance gain can be achieved within the 180 bar limit. The associated consequences in terms of BSFC and emissions must be assessed and kept as low as possible by means of suitable geometries. With optimum calibration between piston shape, CR and injection strategy, injector adaptation should enable an increase in BMEP close to 30 bar.

2. Materials and Methods

2.1. Test Bench and Operating Points

The test engine is a four-stroke inline four-cylinder industrial diesel engine with 1985 cm3, which can be seen schematically in Figure 1. In the context of the present investigation, the engine was equipped with a two-stage exhaust-gas turbocharger setup in order to increasing the mean effective pressure even more. In addition to the standard boost configuration, consisting of a wastegate turbocharger with mechanical actuation, an electrically driven compressor (eBooster) from BorgWarner was installed. Accordingly, it is possible to set the boost pressure to a specific lambda value, which is essential for this study, and to significantly increase the low-end torque. The engine also has an external high-pressure EGR system with two-stage cooling and an adjustable EGR valve. The fresh air section has single-stage-charge-air cooling. The fuel used is commercial fuel stations’ diesel and is subject to DIN EN 590 regulations. A more exact determination of the ingredients could not be made within the scope of the work, but the fuel complies with the boundary conditions of the fuel regulations, as already mentioned. Boost pressure, cylinder pressure and exhaust pressure were each recorded with a resolution of 0.1 degrees crankshaft angle. Furthermore, additional engine parameters, such as pressures, temperatures, mass flows, emissions and injection parameters, were recorded with a resolution of 20 Hz. The injection curves required for the simulations (1D and 3D) were remeasured on the basis of the current profiles from the engine test bench at another injection test bench (injection-rate analyzer IRA [26]).
The exhaust-gas measurement system used was a Horiba MEXA—7170 DEGR unit, which was mainly used for the measurement and calibration of CO, CO2, NOx and HC emissions. An AVL Smoke Meter 415SE was utilized for smoke measurements. A CA—RIE sensor unit from DEWETRON was used to measure the engine revolutions with a resolution of 0.1 degrees. The associated cylinder-pressure indexing was done by a Kistler Type 6056A sensor, the intake and exhaust pressure indexing by a Kistler Type 4011A sensor. Furthermore, torque was monitored via an HBM Smart Torque T1253 unit. Current profiles were measured utilizing a KiBox Supply and Signal Summing Module for Current Type 2105A20. A Siemens Sitrans FC MassFlow 6000 IP67 unit provided fuel-mass flow measurements. Relevant temperatures were determined using NiCrNi—Type K and PT100 385 thermocouples. Air-flow measurement was performed using a Sensyflow unit.
For the present study, five different operating points were investigated, which were previously measured on the test bench. The operating points have different injection sequences consisting of pre-, main- and post-injection, depending on load and revolutions. The two lower load points have a pre- and main-injection. The operating point at high load and revolution consists of a main- and post-injection. The initial-calibration point as well as the extreme-operating point only consist of a main injection.
The development of the 3D-simulation model consisted in the first step of calibrating the model at a single operating point. Another four operating points were used for the subsequent validation of the model. The calibration point is defined by 1200 rpm and 14.5 bar bmep. The first three validation points (1200 rpm, 6.2 bar/2800 rpm, 12.2 bar/2800 rpm, 6.2 bar) are also located within the production-engine map, where 2800 rpm represents the rated speed of the engine. The main investigation takes place at the fourth validation point, which is significantly outside of the engine map. This operating point is located at approx. 24 bar bmep and an engine speed of 1300 rpm. Table 1 contains some more information about the test engine.

2.2. Numerical Setup

The engine simulation was done with the commercial software Converge CFD and consists of a 3D CFD simulation, which was performed with a Reynolds Averaged Navier Stokes (RANS) approach. For turbulence modeling, the generalized renormalization group (gRNG) k-ε Modell was chosen, which predicts, due to its additional terms, the turbulent dissipation and, therefore, the flow field more accurately in engine flows, without increasing computational expenses [27,28].
The liquid phase is modeled with the Lagrangian method and a library fuel, which is available in Converge CFD, called DIESEL2. By representing a pure-diesel liquid phase, this surrogate fuel is only used to model the spray breakup and evaporates into n-heptane (C7H16), which is then used for the chemical-reaction mechanisms. Identical droplets of the liquid phase are combined to parcels in order to reduce computational time. The injection was done with the Blob Model, which injects all droplets in the size of the injector diameter. The determination of drag forces happened with a dynamic model, which takes the distortion of droplets, calculated by the Taylor Analogy Breakup (TAB) Model, into account. The droplet collision is modeled with the No Time Counter (NTC) method, according to Schmidt and Rutland, which has been shown to be more accurate and less time expensive than the O’Rourke method [29]. The primary spray breakup of a high-pressure liquid jet close to the injector is predicted with the Kelvin–Helmholtz (KH) model, whereas the secondary spray breakup of so called child parcels is additionally modeled with the Raileigh–Taylor (RT) model [30]. In order to consider wall interaction of the droplets, the Rebound/Slide model was chosen. For the final vaporization of the DIESEL2 droplets to the gaseous phase n-heptane (C7H16), the Frössling correlation is used.
SAGE detailed chemical kinetics solver has been used, which calculates the reaction rates of all elementary reactions in each cell and time step. The reaction mechanism consists of 42 species and 168 reactions. In addition, to save computing time, the SAGE mechanism is not activated continuously above the cycle, but only at the start of injection and until the exhaust valve opens.
The CO and UHC emissions are directly derived by the detailed chemistry solver, whereas for the NOx emissions the thermal NOx model, which is based on the extended Zeldovich mechanism, is used. The NOx is calculated from the NO, resulting from detailed chemical reactions, by multiplication with a factor of 1.533, which is the ratio of the molecular weights of NO2 to NO [31].
The engine model used consists of a single cylinder including intake and exhaust ports. Due to the initial conditions, the fluid is at rest and motionless in the computational domain at the start time of the simulation. To minimize the resulting errors in a simulation, it is recommended to calculate at least one working cycle and to use these results as initial values for further cycles [32]. Therefore, a map file is saved for each operating point, when the exhaust valve is fully opened, which is used as the starting point for further variations at this operating point.

2.3. Model Validation

Before starting a geometry and compression-ratio variation, the CFD model has to be validated against the given test-bench measurements. This parameter investigation is carried out at a operating point, which is at 1200 rpm and 190 Nm load, and validated at three other OPs with different loads and speeds. The aim of the parameter variation is to ensure good agreement between the test bench measurements and the simulation results, with regard to the pressure curve and specific emissions.
First, a mesh-sensitivity analysis was performed during injection and combustion, to obtain a good cost–benefit ratio with respect to the accuracy of the simulation and the required computation time. From this analysis, the mesh settings listed in Table 2 consisting of base size and different fixed embeddings (FE), so the adaptive mesh refinements (AMR) are obtained. These settings were used for all following CFD simulations.
Since the wall-heat transfer has an influence on the gas temperature in the combustion chamber and, thus, on the performance and emissions of the engine, the influence of the wall-heat-transfer models by Hand and Reitz, Angelberger and O’Rourke and Amsden is further investigated. It was seen that the use of the Han and Reitz and the Angelberger heat-transfer models results in lower combustion-chamber pressure over the entire cycle and, therefore, predicts higher heat transfers through the cylinder walls. Compared with the measured in-cylinder pressure, the O’Rourke and Amsden model shows a very good agreement during the expansion stroke, slightly overpredicting the peak in-cylinder pressure. Therefore, the wall-heat-transfer model of O’Rourke and Amsden was chosen, as the peak pressure is adjusted and reduced by the following methods.
The compression of the connecting rod and piston has to be taken into account, which can be determined with the help of an FEA analysis. In the context of this work, the simplification of a static change of the stroke and the compression ratio is modeled, especially since the correct position of the piston during the fuel injection and the change of the compression ratio during compression are relevant for the combustion. Therefore, the measured in-cylinder pressure for three different operating points is applied to the piston top surface in the FEA and the compression is calculated. With these results, a table containing the deflection and compression ratio change of all operating points of the engine map was created.
Furthermore a numerical blowby gas-flow and ring-dynamics model was added to the simulation setup, because the inter-ring crevice volume and the blow-up of unburned gas is responsible for non-neglectable fraction of UHC emissions [33]. Hereby the crevice region is only modeled with the help of geometrical measurements of the piston rings and corresponding gaps, but does not consist of real meshed geometry. Further information about the used crevice model of Converge CFD may be referred to in the manual [31]. The implementation of this model leads to an increase in UHC emissions of 20.0% on the regarded operating point. Besides that, the peak pressure was also reduced by 5.0%, which now leads to a good overall agreement with the measured in-cylinder pressure.
The pressure curves comparison between the final CFD model and the test bench measurements of the four operating points used for model validation are shown in Figure 2.
Consequently, it can be seen that the simulation represents all investigated operating points well with regard to the pressure curve. The effective torque of the simulation also shows a small deviation of 0.7 to 4.8%, whereby operating points with lower load levels account for the higher deviations. Regarding the emissions, the CFD simulation shows deviations between 0.3 and 5.2% with respect to CO2 emissions, 1.1 to 9.4% with respect to NOx emissions and 3.5 to 14.6% with respect to CO emissions. Higher deviations were obtained for the HC emissions with deviations up to 70% of the measured value. The cause of this high deviation is, among other things, the desorption/adsorption processes with the oil-lubricating film, which have not been taken into account, or a non-modeled dripping from the injector after the main injection has already passed. Again, the operating points with lower load levels account for the higher deviations. An accurate validation of the emissions was only possible in the course of the investigation for the operating points shown in Figure 2. The use of the eBooster, which was indispensable for measuring the extreme point, made accurate emission measurements difficult due to very short run times (a few seconds). Due to the short time span, the emissions of the extreme point showed high fluctuations paired with certain delay times, which made an averaging of the emissions difficult and did not offer sufficient quality for the validation. The validation of the emissions was, thus, limited to only four of the five operating points investigated. In summary, the CFD model can now represent the real engine well, especially with regard to higher load levels in terms of torque and emissions.

3. Results

3.1. Geometry Variation

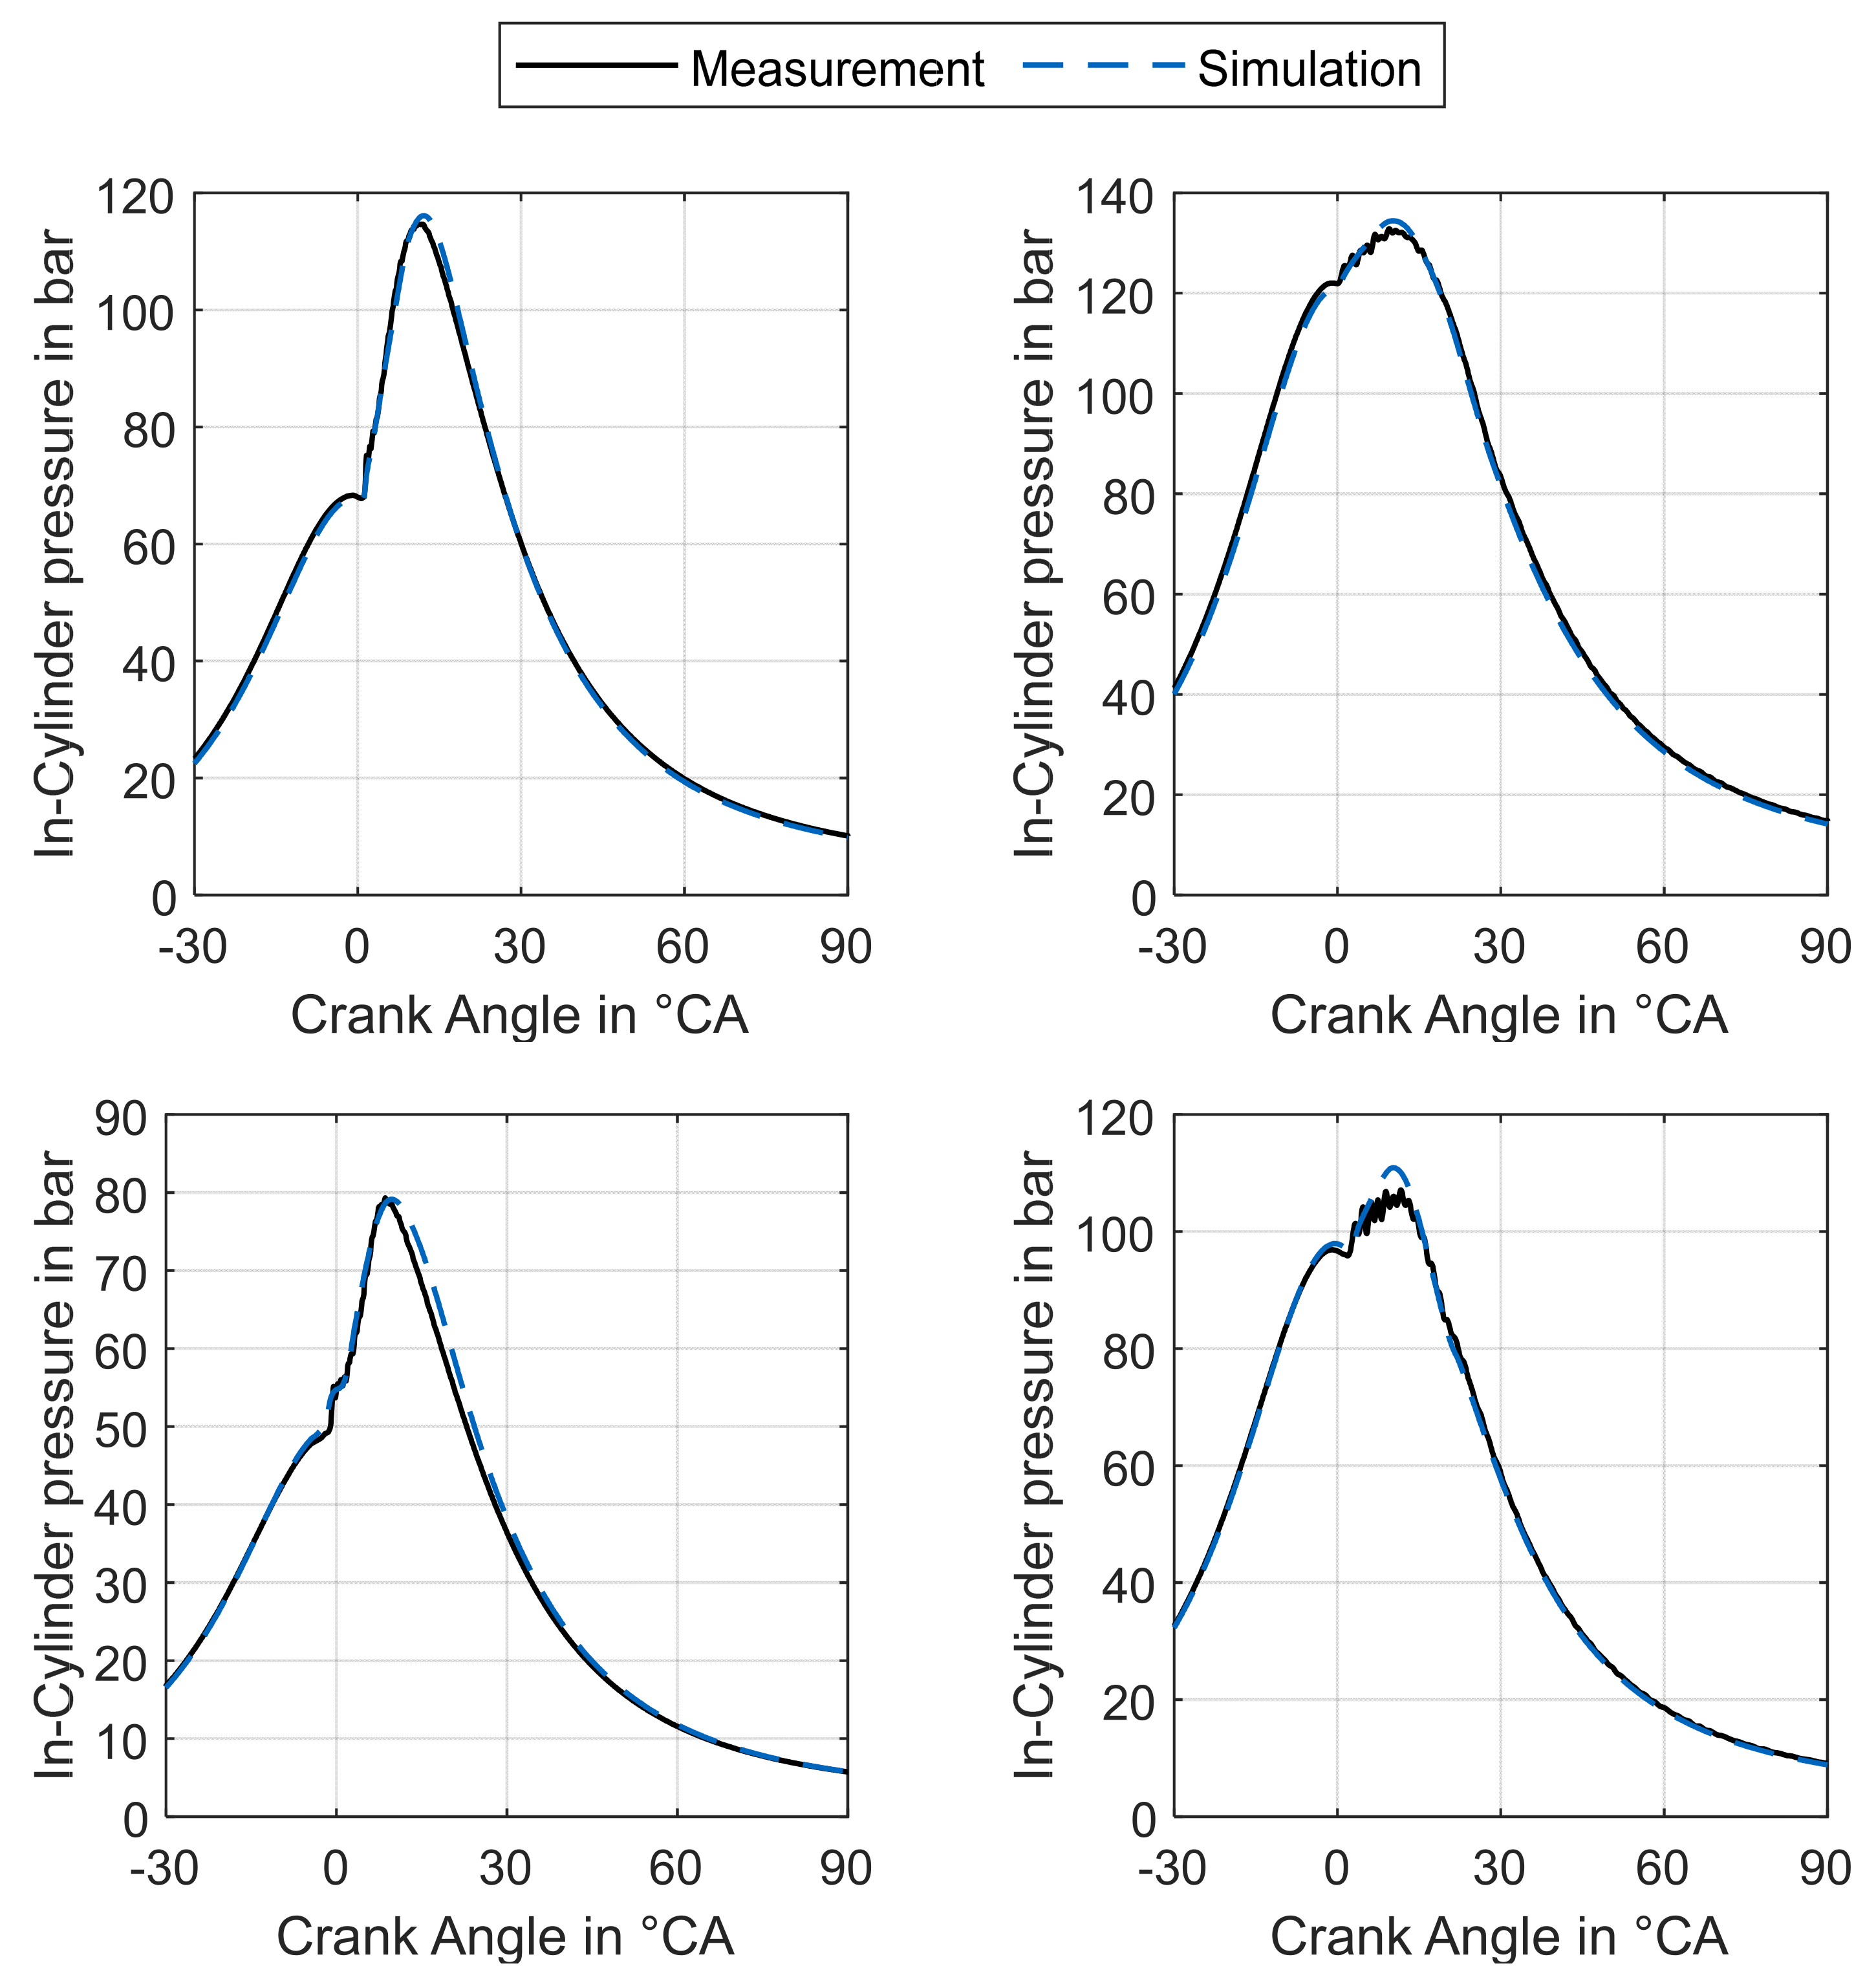
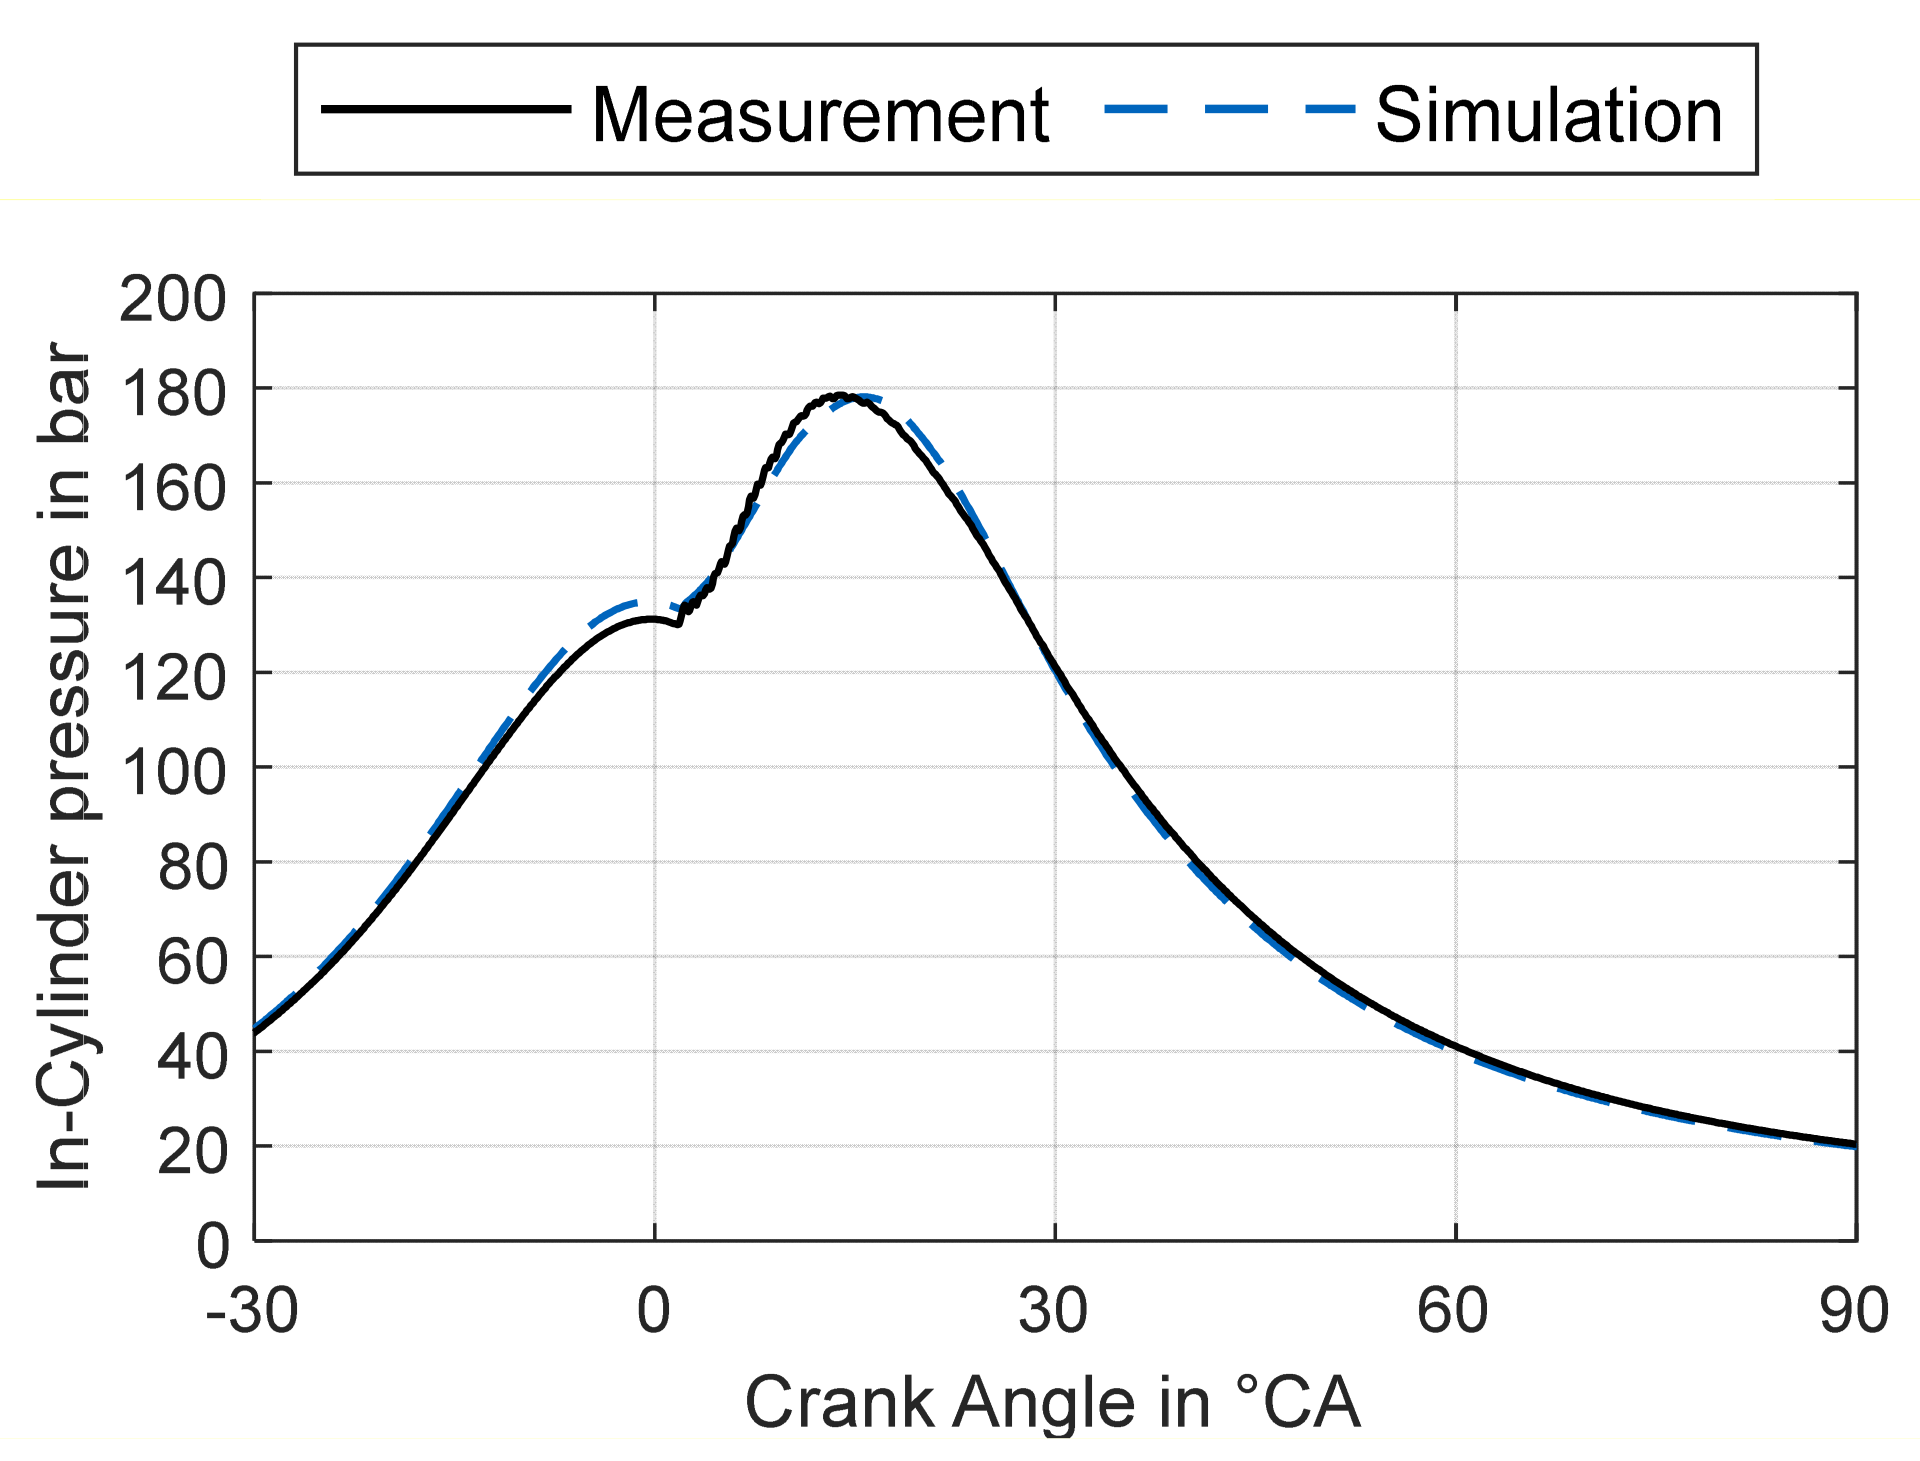
As a first step, the simulation is compared to the test-bench measurement at the operating point under consideration, which is located at 1300 rpm and 390 Nm load. It can be seen in Figure 3 that only slight deviations of 0.3% prevail with regard to the peak pressure, whereas deviations of 2.3% occur with respect to the maximum drag pressure. Therefore, the simulation shows good agreement with the measurements.
The results of the reference simulation are listed in Table 3, including the specific emissions for NOx, CO and UHC. For a comparison of the following geometry and compression ratio simulations, these values are taken as reference values.
Based on the results of the reference simulation, a piston-geometry variation is carried out at a compression ratio of 17.5. The primary objective of this study is to reduce specific NOx and CO emissions at the same or a higher torque level. Whereas the secondary objective is the reduction in specific UHC emissions.
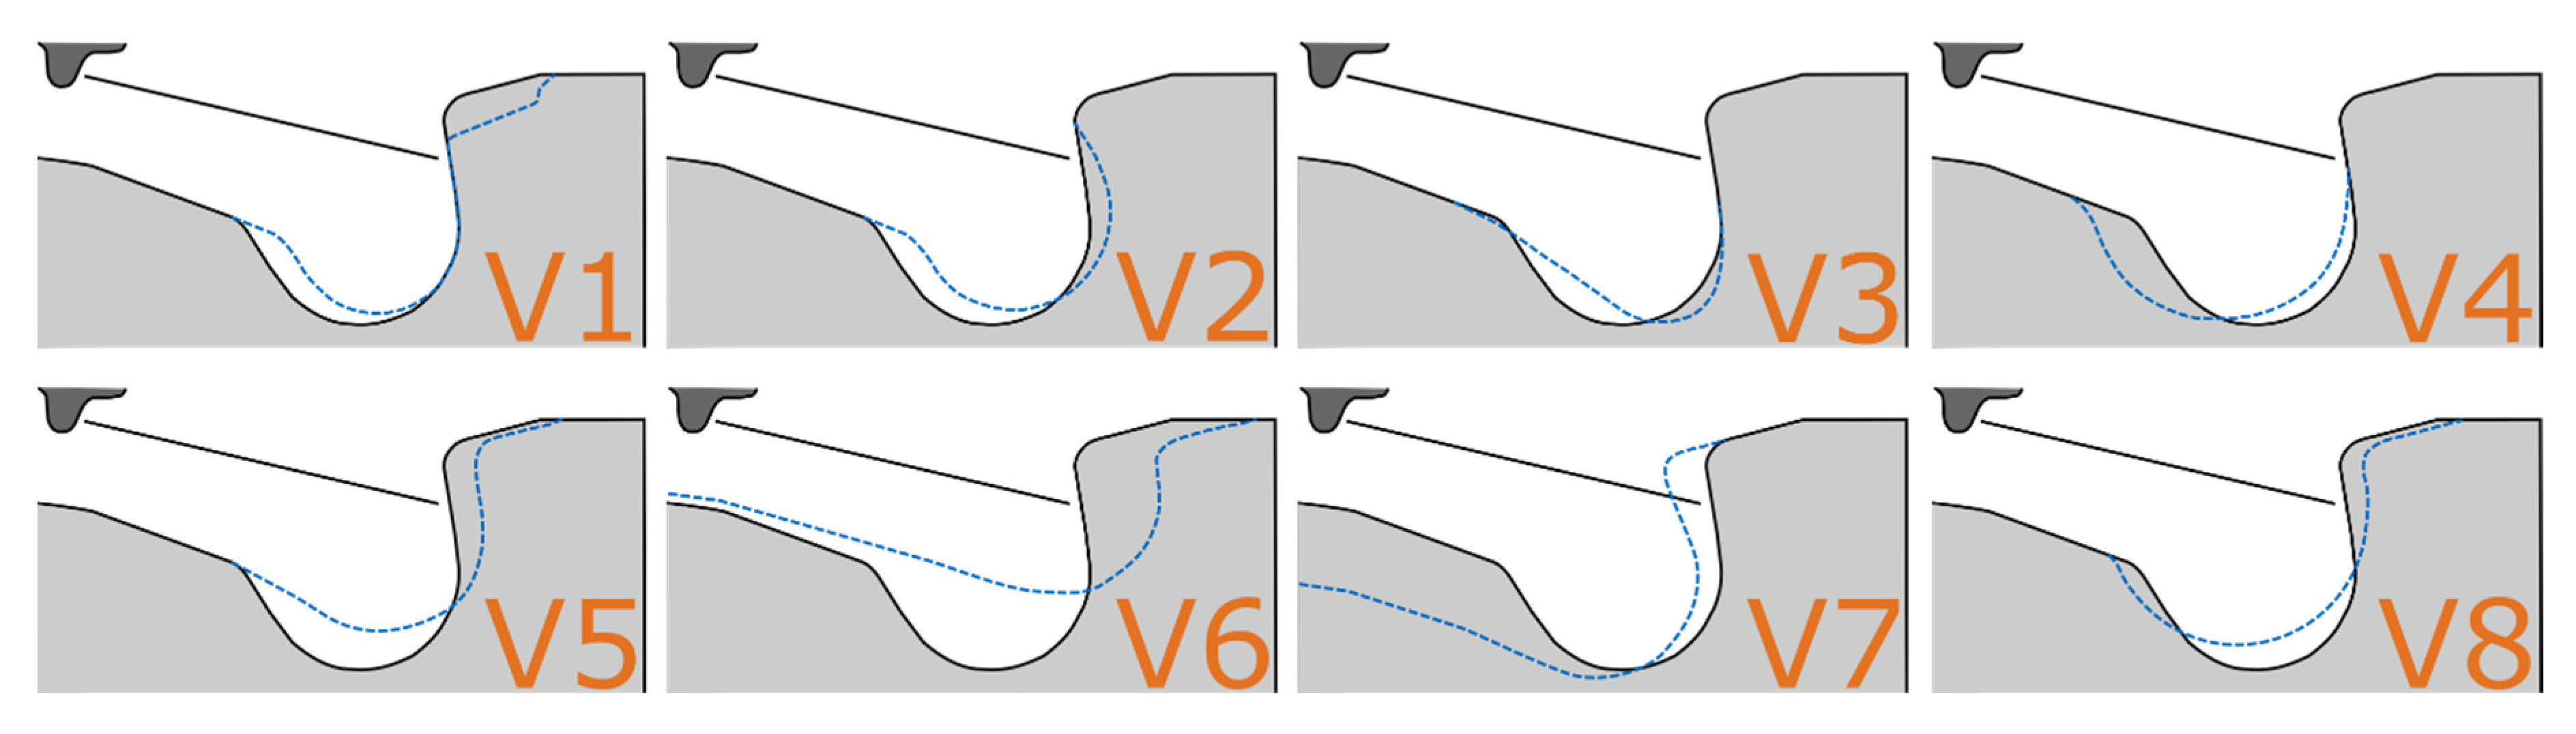
In total, eight different piston-bowl geometries were analyzed and their shapes are compared to the reference piston bowl in Figure 4.
The main idea behind the geometry V1 with the stepped lip is to have a better oxygen utilization and, therefore, increase power while decrease NOx and UHC emissions [15,16,17]. The re-entry bowl shape V2 is analyzed with the goal to further increase swirl and mixing and, therefore, reduce CO emissions [34]. Furthermore a piston-bowl geometry consisting of a narrower bottom-bowl radius (V3) is investigated due to possible power increase and NOx decrease [19]. The effects of a bigger bottom-bowl radius are the idea behind V4. Geometries V5 and V6 consist of a wider bowl diameter to realize a more uniform temperature field and, therefore, less CO emissions [6,34].Piston-bowl geometry V7 is making use of a deeper bowl, which showed good results regarding piston work and UHC emissions in [35]. The last piston-bowl geometry V8 is a combination of V4 and V5.
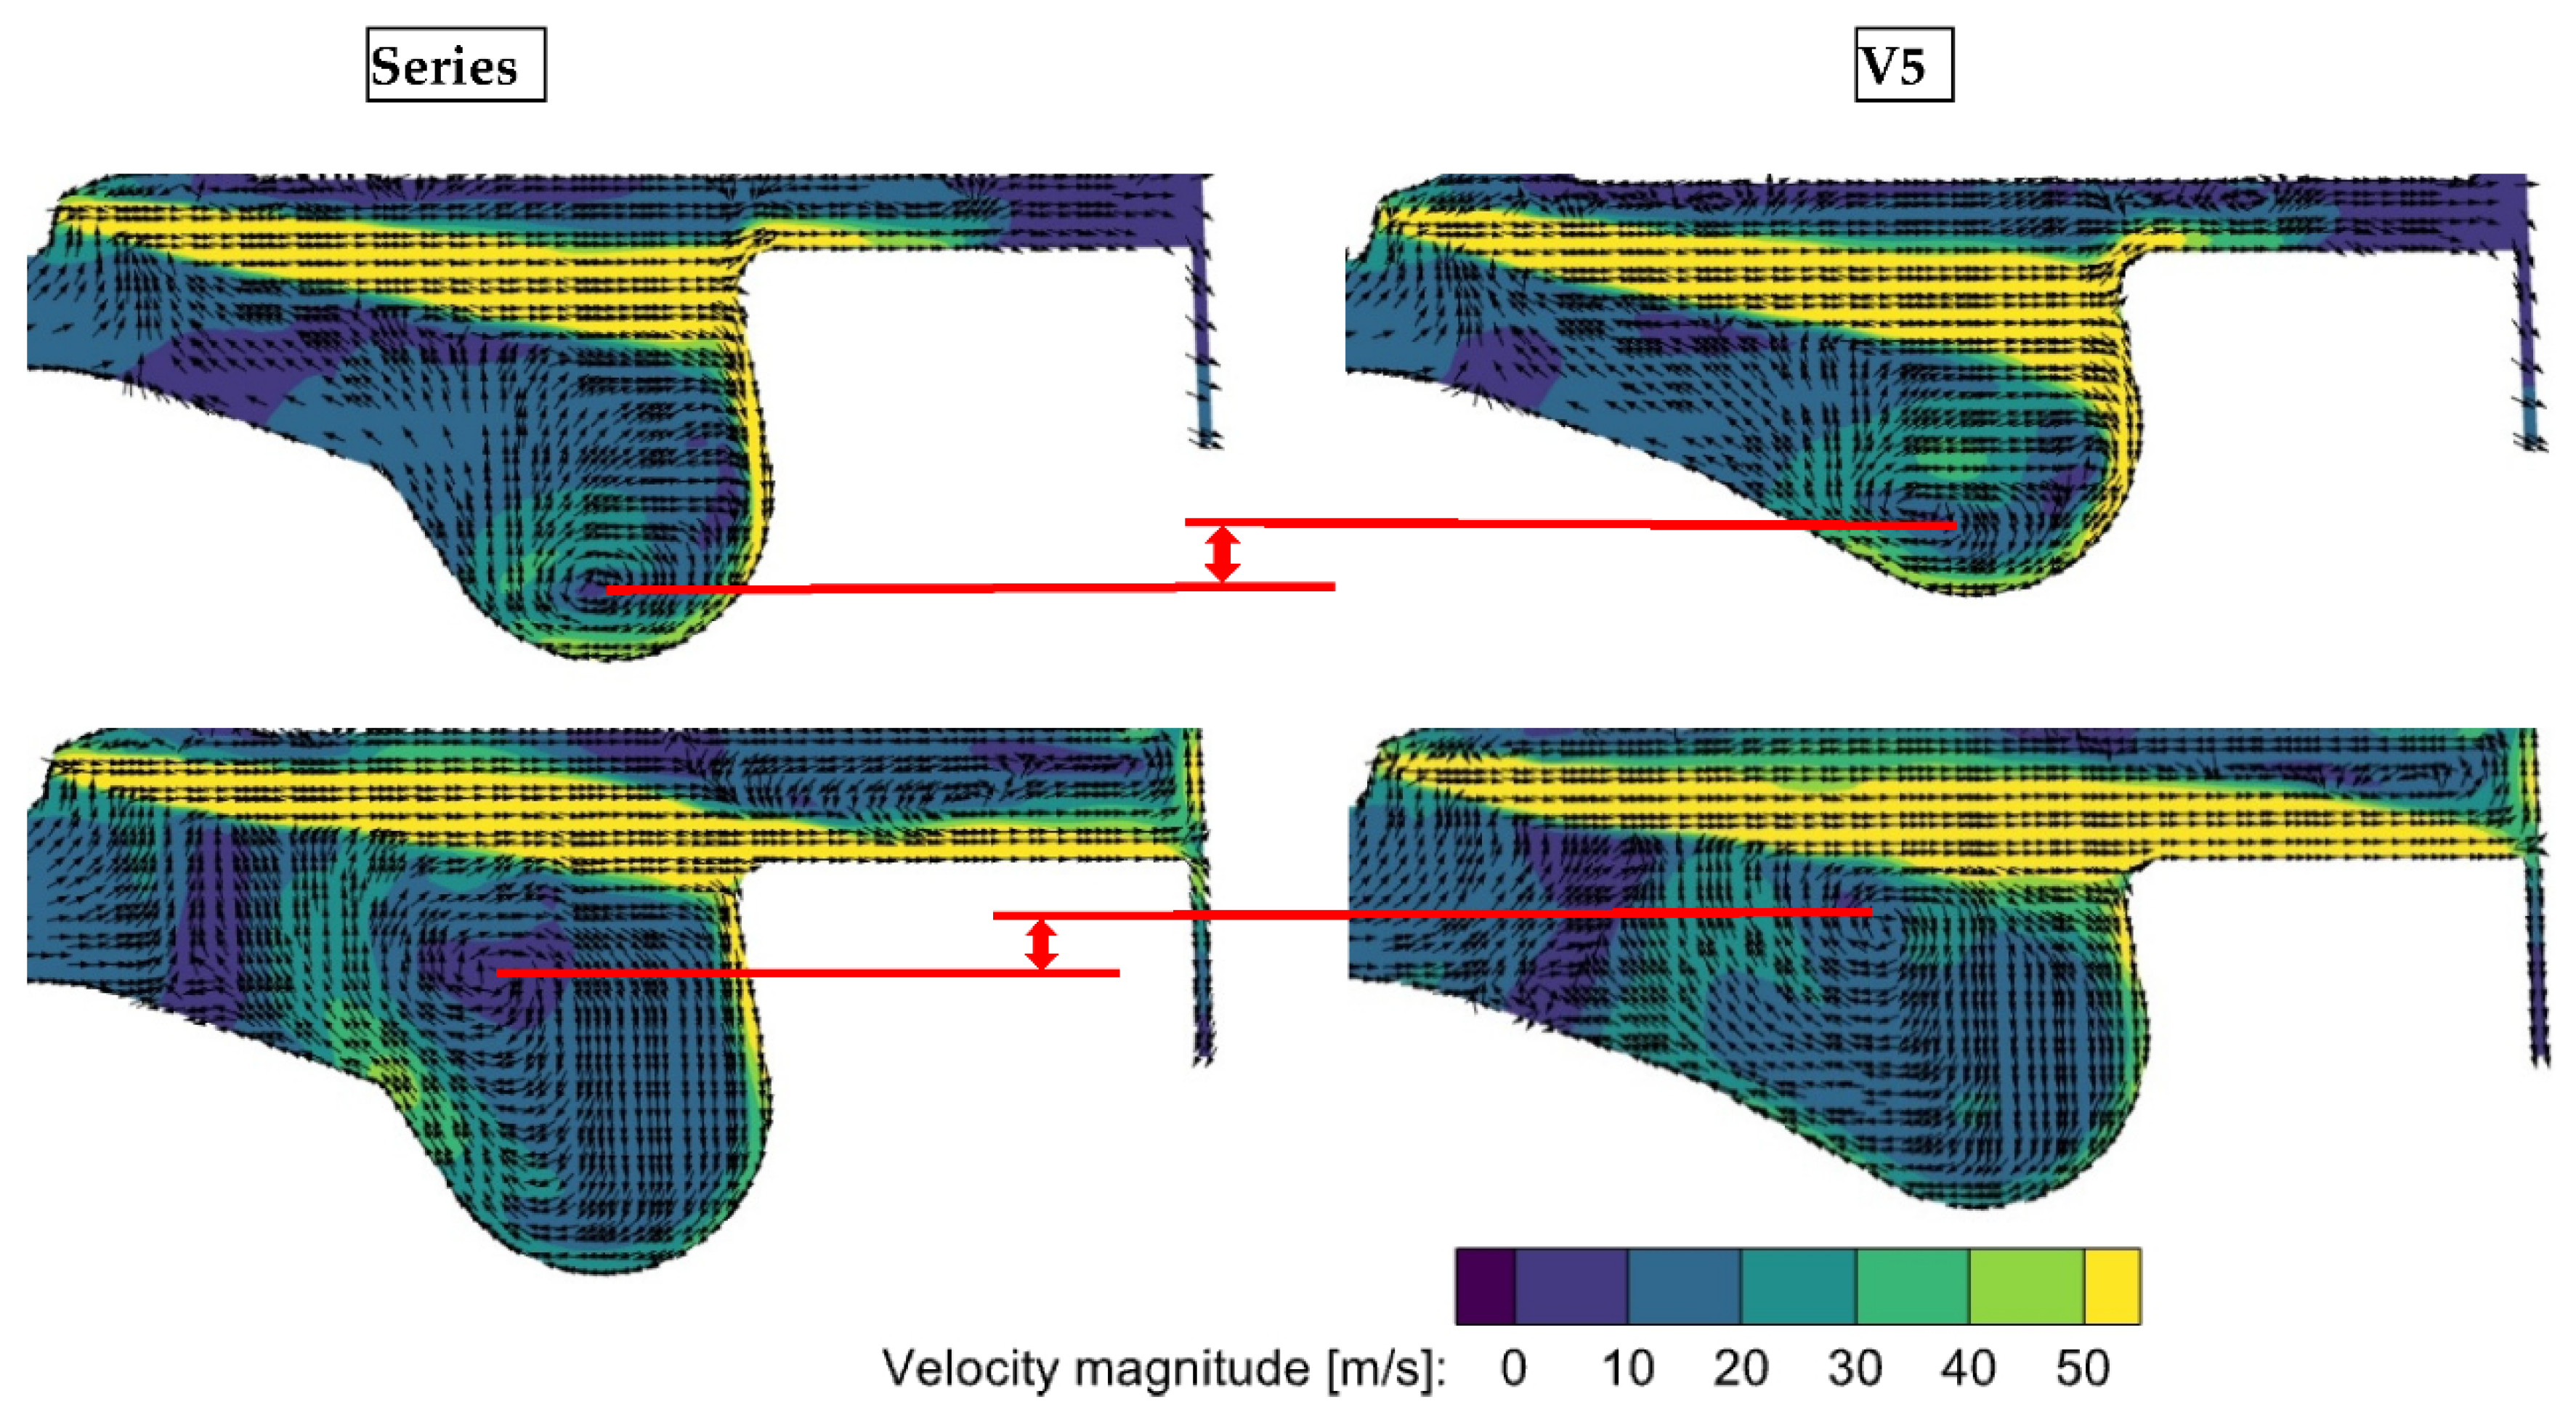
When looking at the flow field, it can be seen that not only does the swirl have an effect on the mixing behavior of fuel and air but also the lateral vortex does, developing in the piston bowl due to the injected fuel. When analyzing different piston-bowl geometries, it was found that the vorticity and position of this vortex is influenced most, and is in this study that is the main reason for changes in power and specific emissions. Given the fact, that for the other piston-bowl geometries the principle of this vortex is very similar but due to different shapes its strength and location varies, the effects will only be explained for one geometry (V5). Therefore, this flow field during the injection is compared for one piston bowl (V5), with respect to the series geometry in Figure 5.
Due to the wider and shallower bowl of V5, the lateral vortex is at a higher position. This ensures better mixing in the piston bowl at the beginning, even though the swirl is 2% lower, which is why the peak in the heat-release rate is also 5% higher. As a result, the peak temperature is slightly higher and is maintained for a longer time, which on the one hand leads to the 0.5% higher torque but on the other hand leads to the 0.5% higher specific NOx emissions. In the further course this vortex increasingly forces the jet into the squish gap. This leads to locally richer mixture zones in the squish gap, where the flame front is quenched at the cooler walls of the cylinder head, piston and liner. As a result, specific HC and CO emissions increase. In addition, the height of the vortex, in combination with its position on the outside of the piston bowl, leads to poorer utilization of the air in the center of the bowl.
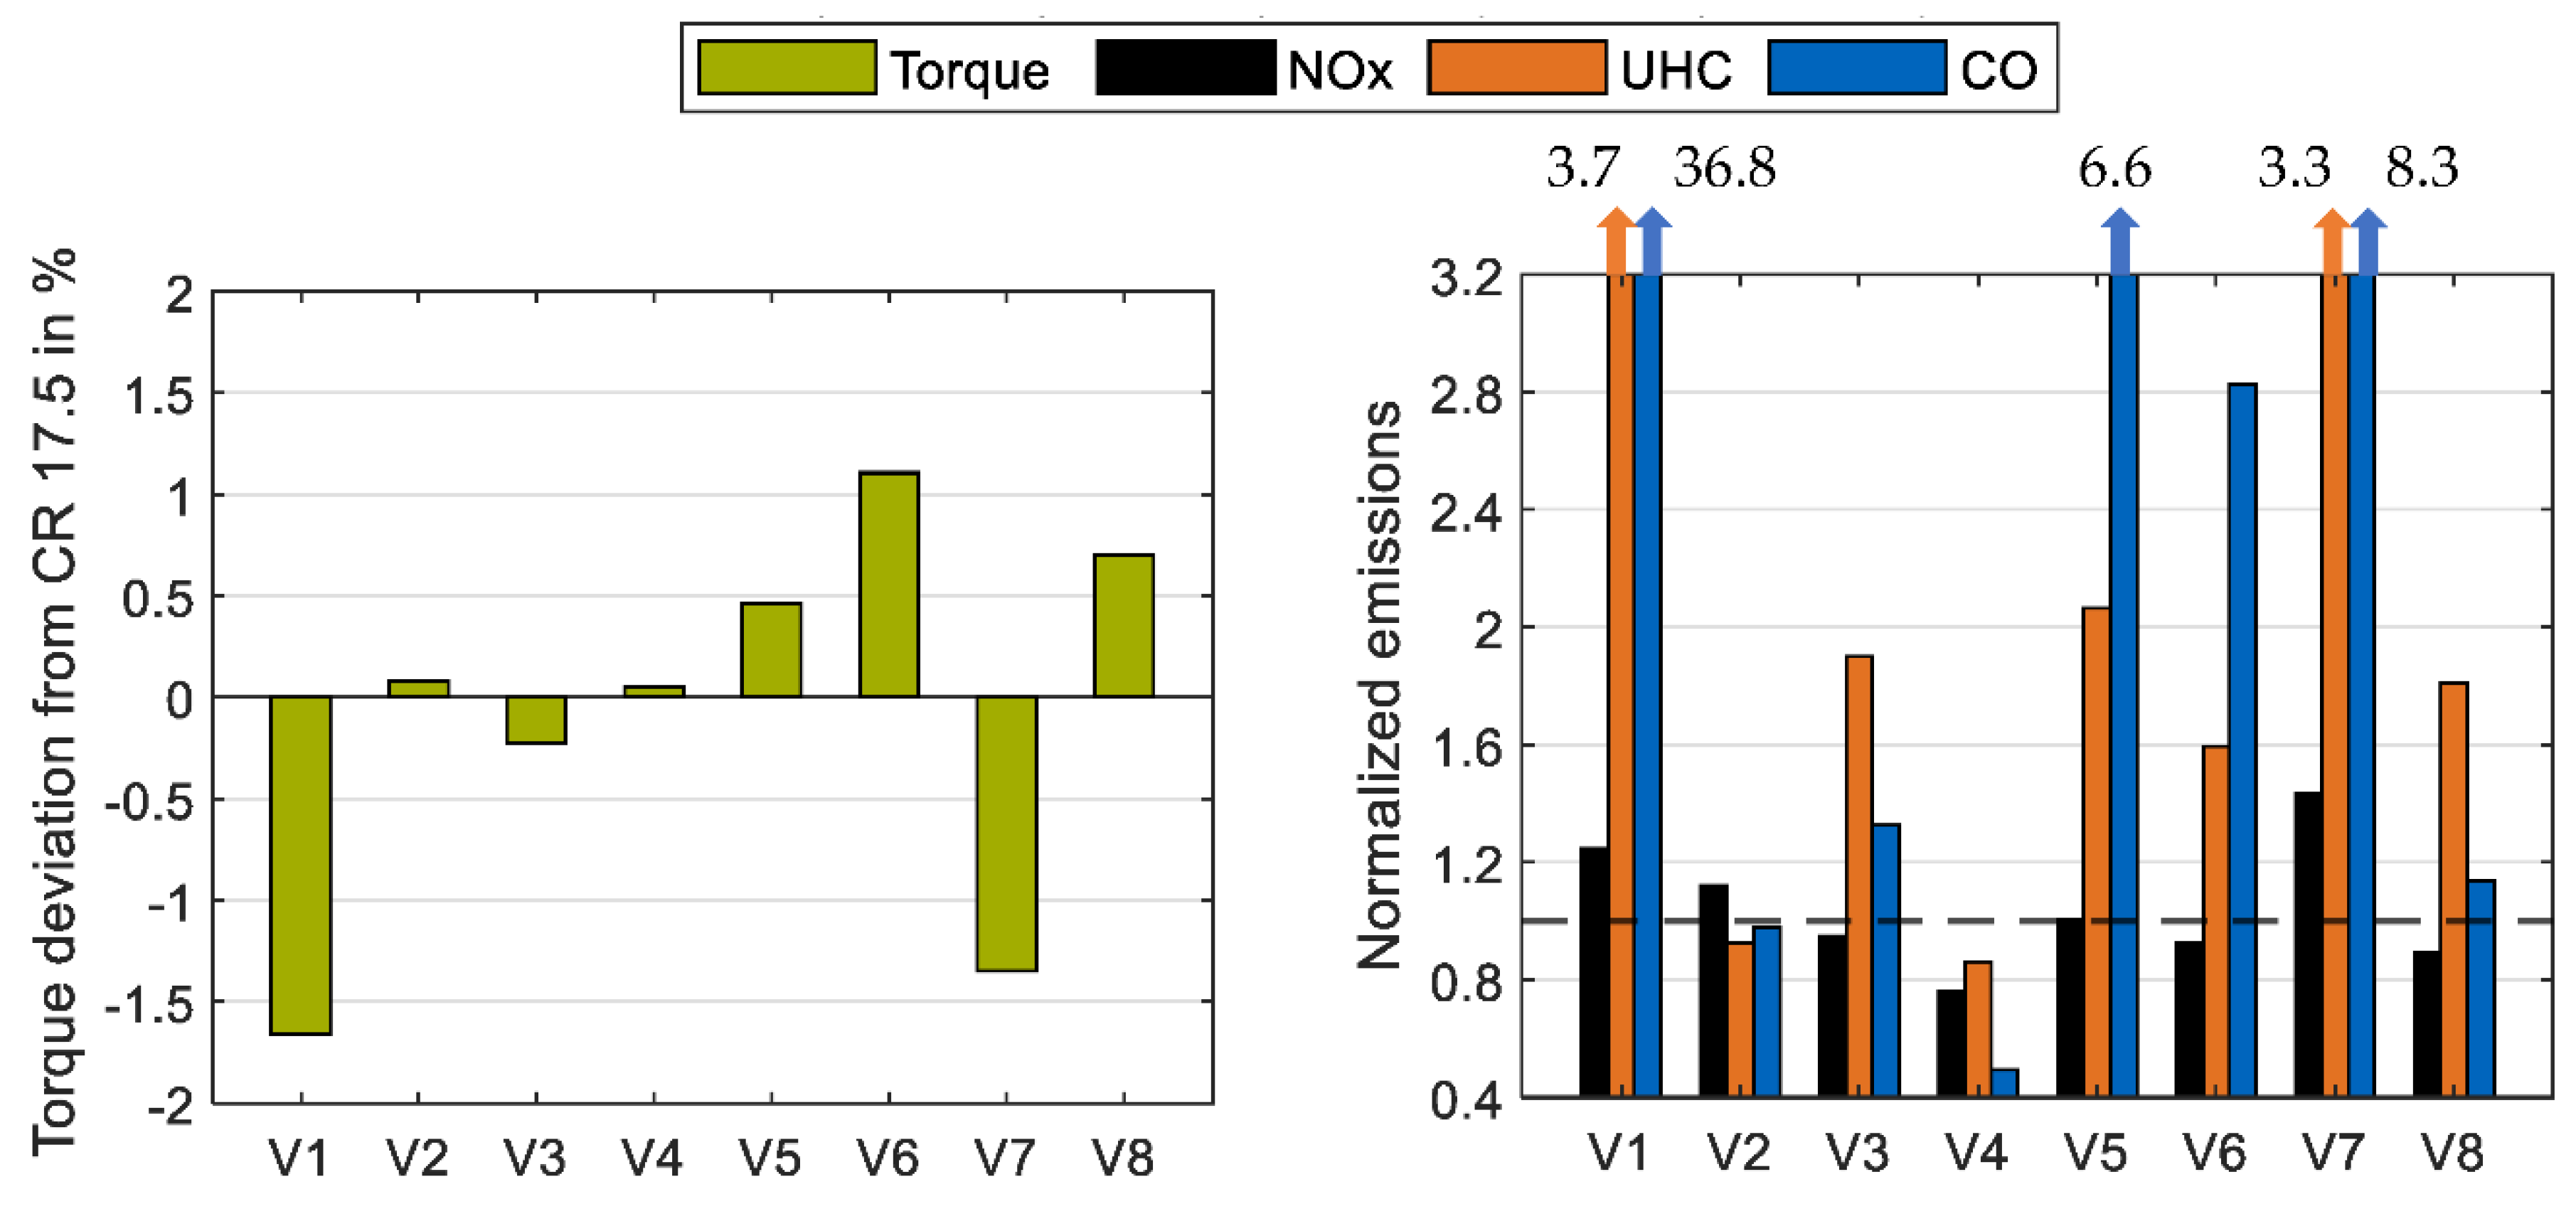
Torque as well as the specific emissions of the individual geometries are shown as a comparison in Figure 6. Regarding the torque data, there are only minor deviations (max. 1.6%). The simulations V2, V4, V5, V6 and V8 are above the value of the reference simulation. With regard to the emissions, however, there are major differences, especially for the specific CO and UHC emissions, which differ by up to 36 times from the values of the reference simulation. It can be seen that V3, V4, V6 and V8 have lower NOx emissions, while V2, V4 and V5 result in lower UHC emissions. The simulations regarding V2 and V4 show lower CO emissions. The cause of these differences has already been clearly explained for V5 and will now only be briefly listed for each of the other geometries.
In V1, the division of the fuel jet into two areas leads to more extensive mixing at the beginning and, therefore, to higher peak temperatures, which in turn leads to 24.6% higher NOx emissions. However, as the combustion progresses, the lateral vortex in the bowl is weakened as less fuel reaches this area. As a result, the mixing becomes increasingly poor. In addition, the jet directed upward is very rich and hits the cold walls of the head, piston and liner relatively quickly, where it is quenched. This leads to 3.7 times higher UHC and 35.8 times higher CO emissions.
For V2, the position of the lateral vortex is nearly the same as for the reference simulation. Only the higher swirl leads to a better mixture of fuel and air and, therefore, higher peak temperatures and a slight increase in torque, such as a reduction in UHC and CO emissions with the cost of higher NOx emissions.
The piston-bowl geometry of V3 produces a 5.3% higher swirl but still a worse mixture formation, since the lateral vortex is only formed to a much lesser extent than in the reference simulation. As a result, the peak temperature is 10 K lower, resulting in lower NOx emissions. However, the poorer mixing results in higher UHC and CO emissions and a lower torque.
The bigger lower-bowl radius of V4 leads to initially poorer mixing, since the lateral vortex has a further expansion but weaker characteristics. As a result, the peak temperatures are 24 K lower than for the reference simulation, resulting in lower NOx emissions. However, the vortex gains strength with increasing injection, and in combination with its wide expansion the mixture improves. Due to its slightly lower position, less fuel is directed into the squish gap, which also contributes to lower CO and UHC emissions due to better mixing.
The wider extension of the V6 piston geometry enables the spray to hit the bowl proportionally flat. As a result, the shallower design of the bowl the lateral vortex forms much more weakly. Furthermore, there is a breakdown into sub-vortex systems, which are responsible for the mixing. As a result, the initial combustion is delayed and the peak temperature is 12 K lower than for the reference simulation, which explains the lower NOx emission. However, the sub-vortex systems lead to a good fuel mixing in 20 °CA after SOI, whereby also the wide expansion and the additional air mass in the bowl are advantageous for combustion. Nevertheless, in some areas, due to the absence of a dominant lateral vortex, there are partial areas of a rich mixture, which increase UHC and CO emissions.
Due to the 8.5% higher swirl and the deflection of the jet into two sections, the piston shape in V7 leads to effective initial mixing and combustion. However, this also results in an increase in the peak temperature by 16 K, which is responsible for higher NOx emissions. Furthermore, the lateral vortex exhibits a large expansion and strength at the beginning, though this is quickly weakened as more and more fuel is redirected into the squish gap and, thus, less momentum is available for the vortex. This leads to fuel-rich zones in the squish gap, which are quenched at the walls, which, in turn, explains the increased UHC and CO emissions.
The flow field of V8 is, as expected, a mixture of V4 and V5. The lateral vortex is weaker but more extended at the beginning due to the larger bottom-bowl radius. Thus, the initial mixing is weaker, resulting in lower peak temperatures and NOx emissions. However, the high positioning of the vortex and its size result in better mixing in the bowl for 10 °CA after SOI. However, the height also leads to a redirection of the fuel jet into the squish gap, which also increases UHC and CO emissions but less so than in the case for V5.

3.2. Investigation of Compression-Ratio-Variation Methods

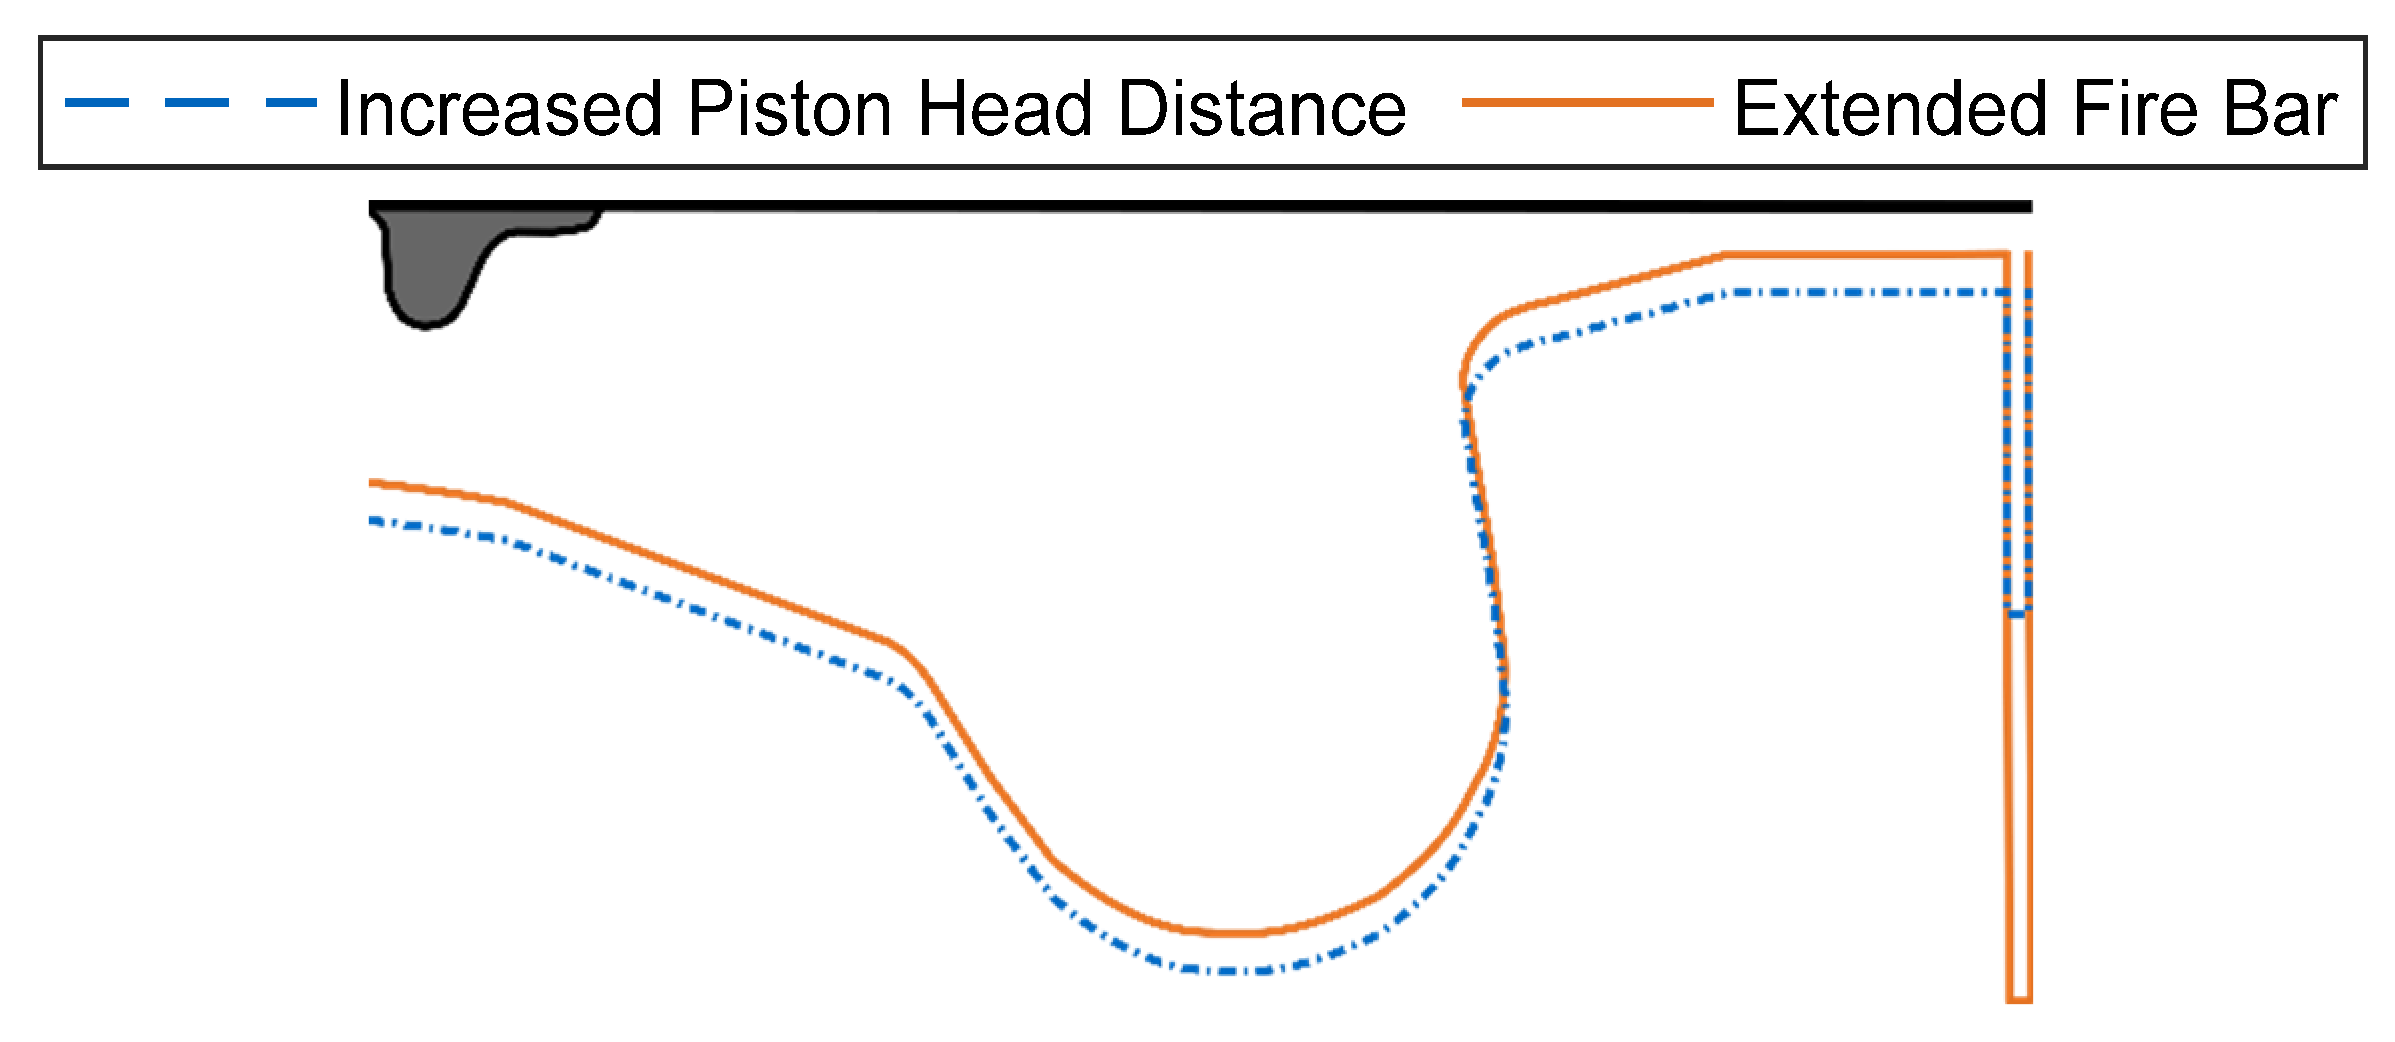
At the beginning of the compression-ratio variation, some preliminary investigations must be carried out, into which way the compression ratio is changed, among other things. From a simulation point of view, several possibilities are available, two of which are shown in Figure 7 for a compression ratio of 14.5.
In the first variant, volume is added to the TDC and BDC volume by increasing the distance between head and piston. The distance needed to reduce the compression ratio from 17.5 to 14.5 is 1.2 mm. For the second variant, the piston remains in its original position, and the volume is added by extending the fire bar. In this case, an extension of 57 mm is necessary to reduce the compression ratio from 17.5 to 14.5. It should also be noted that only the first variant is technically feasible, for example, by using a different head, but it is difficult to implement a fire bar of over 60 mm length. Nevertheless, this method is evaluated simulatively because the piston position remains constant and, thus, there is no change in spray-piston interaction.
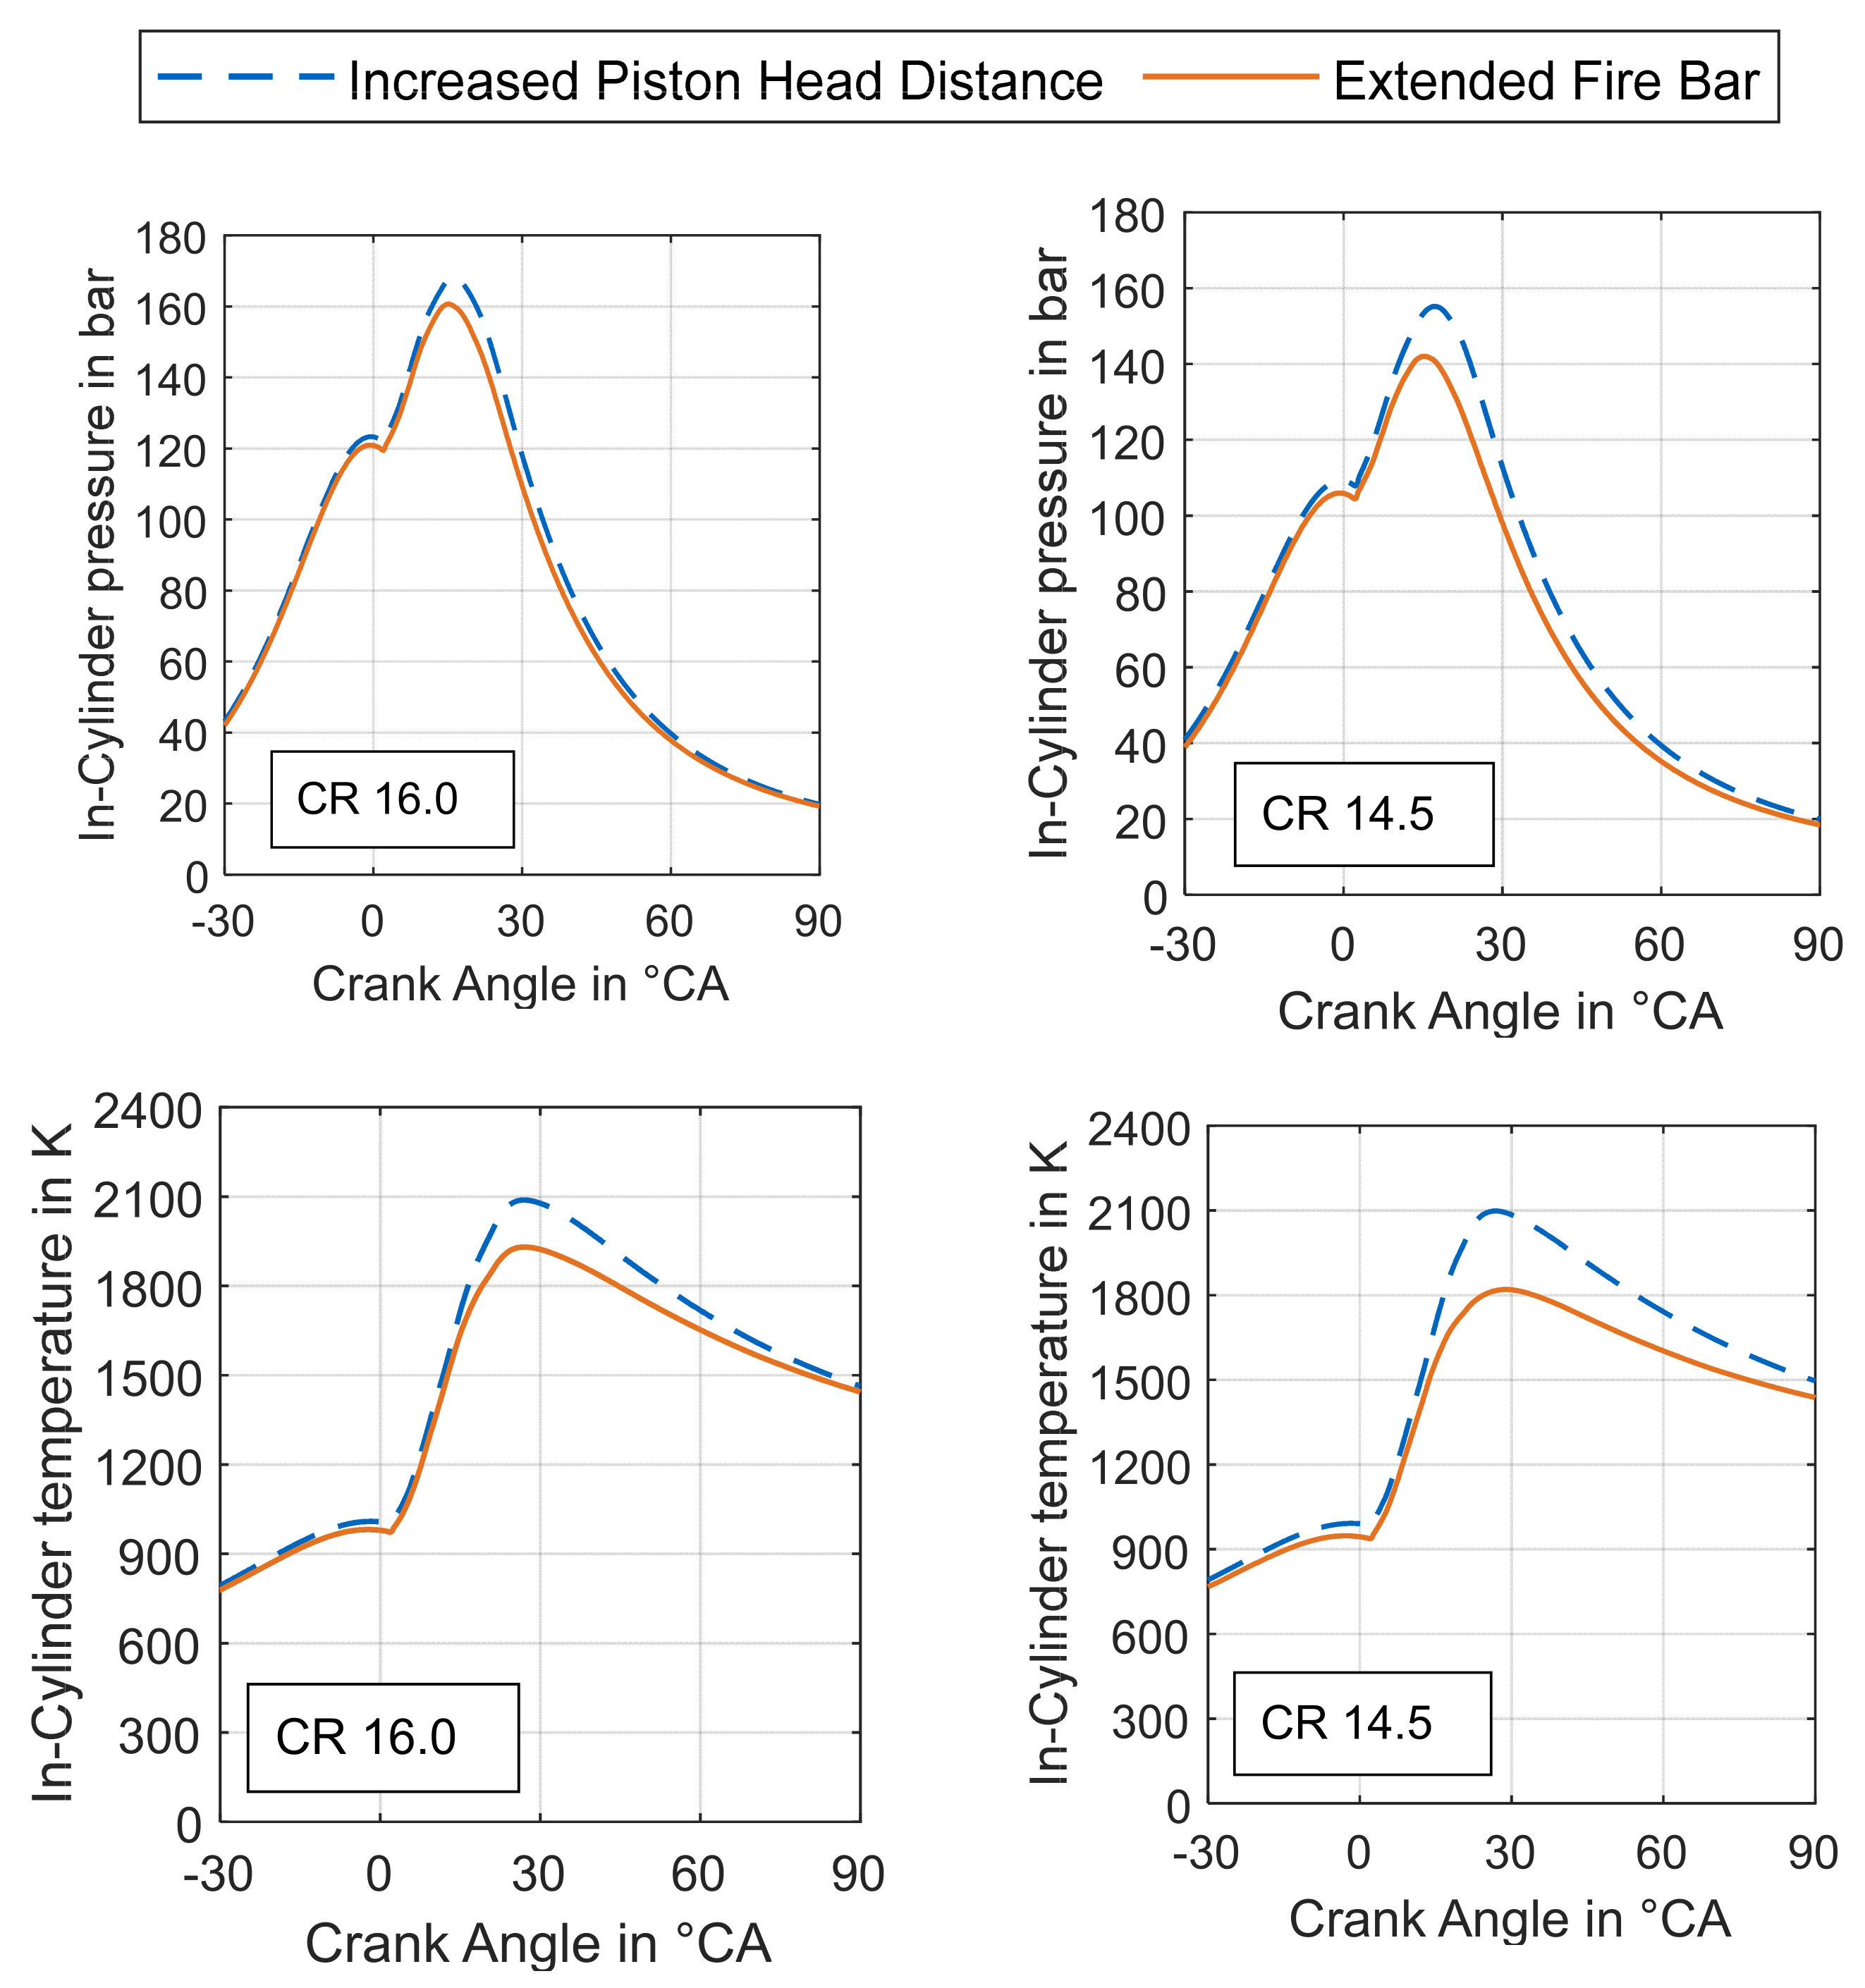
In the following, the two variants at compression ratios of 14.5 and 16.0 are compared in terms of in-cylinder-pressure curves, temperatures and emissions. A variant is selected based on these findings to be used for further investigations.
When looking at the cylinder-pressure curve in Figure 8, it is noticeable that there are deviations regarding the cylinder peak pressure, which increases as the compression ratio decreases. Thus, for a compression ratio of 16.0, the difference between the two methods is 4.3%, while for a compression ratio of 14.5 it is 8.5%.
The reason for this is the increase in wall-heat losses, which can be explained by the increasing length of the fire bar and, consequently, the larger surface. This leads to a reduction in the combustion-chamber temperatures, the curves of which can be seen Figure 8.
The deviation in the maximum mean combustion-chamber temperature is 7.6% for a compression ratio of 16.0, while this increases to 13.3% for a compression ratio of 14.5. This also leads to lower torque output for the method of increased fire-bar length of 5.2% and 8.7% for compression ratios of 16.0 and 14.5, when compared to the method of increasing the distance between head and piston at TDC.
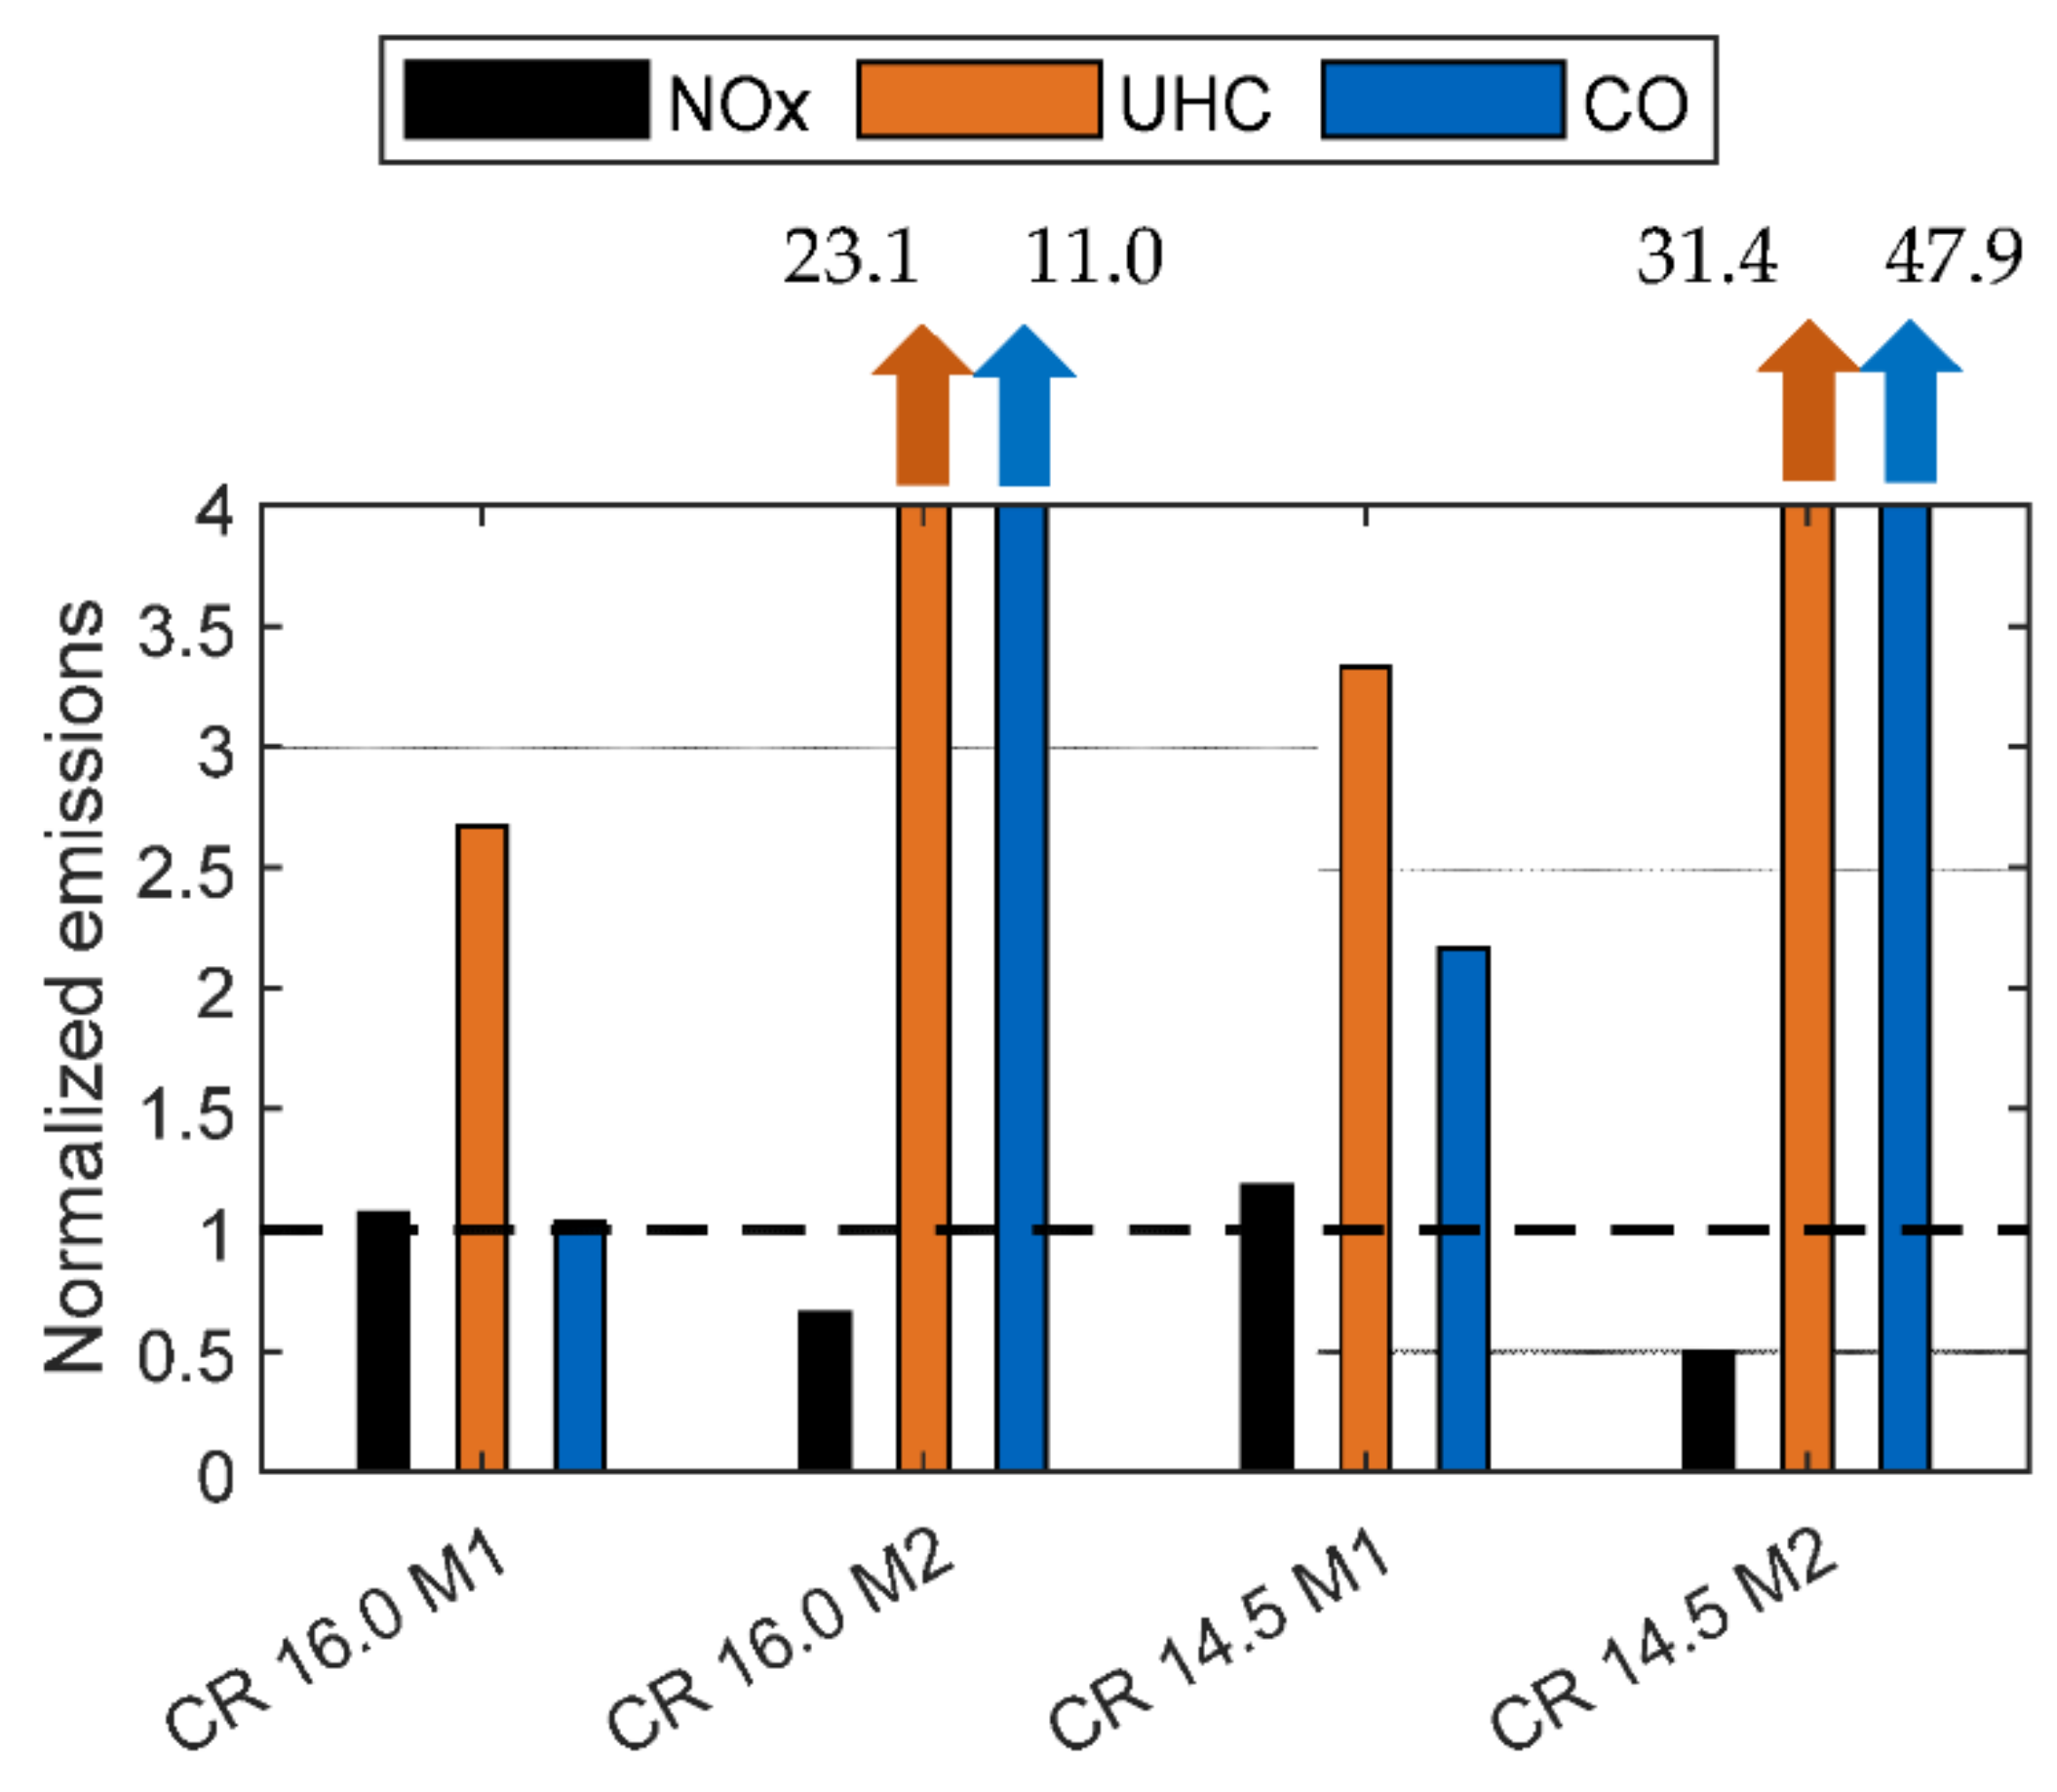
Besides that, the specific emissions are also influenced due to the high temperature differences during the combustion process. Therefore, the emissions of both methods are compared to the emissions of the reference simulation with compression ratio of 17.5 in Figure 9.
Comparing the NOx emissions, the second method leads to 34% and 51% lower specific emissions for compression ratios of 16.0 and 14.5 when compared to CR 17.5 due to the lower combustion temperatures [36,37]. Besides that, increasing the fire-bar length also leads to higher specific UHC emissions, which are 23 times higher for CR 16.0 and 31 times higher for CR 14.5 than the reference simulation. By only increasing the distance between head and piston at TDC, these specific emissions increase 2.6 times and 3.3 times. The reason for the first method is a larger fuel mass in the squish gap and, thus, a locally richer mixture due to the lower piston position. In the second variant, UHC emissions increase due to lower temperatures and the resulting more incomplete combustion as well as a greater accumulation of unburned fuel in the fire bar. This also leads to an increase in the specific CO emissions, which are 11 times and 48 times higher at CR 16.0 and CR 14.5, respectively, for the second method compared to the reference simulation. When comparing the two variants, it becomes clear that the variant with the extended fire bar delivers significantly different results in terms of cylinder pressure, temperature curves and specific emissions, despite the correct injector-piston position. The reason for this is the high wall-heat loss, as already mentioned. Therefore, the second variant is selected for further simulations. It may be noted, that for this variant the peak combustion temperature and specific NOx emissions increase with a decreasing compression ratio, which is not the expected behavior [36,37]. Therefore, the spray-piston interaction will be analyzed in the following chapter.

3.3. Influence of Injector Positioning

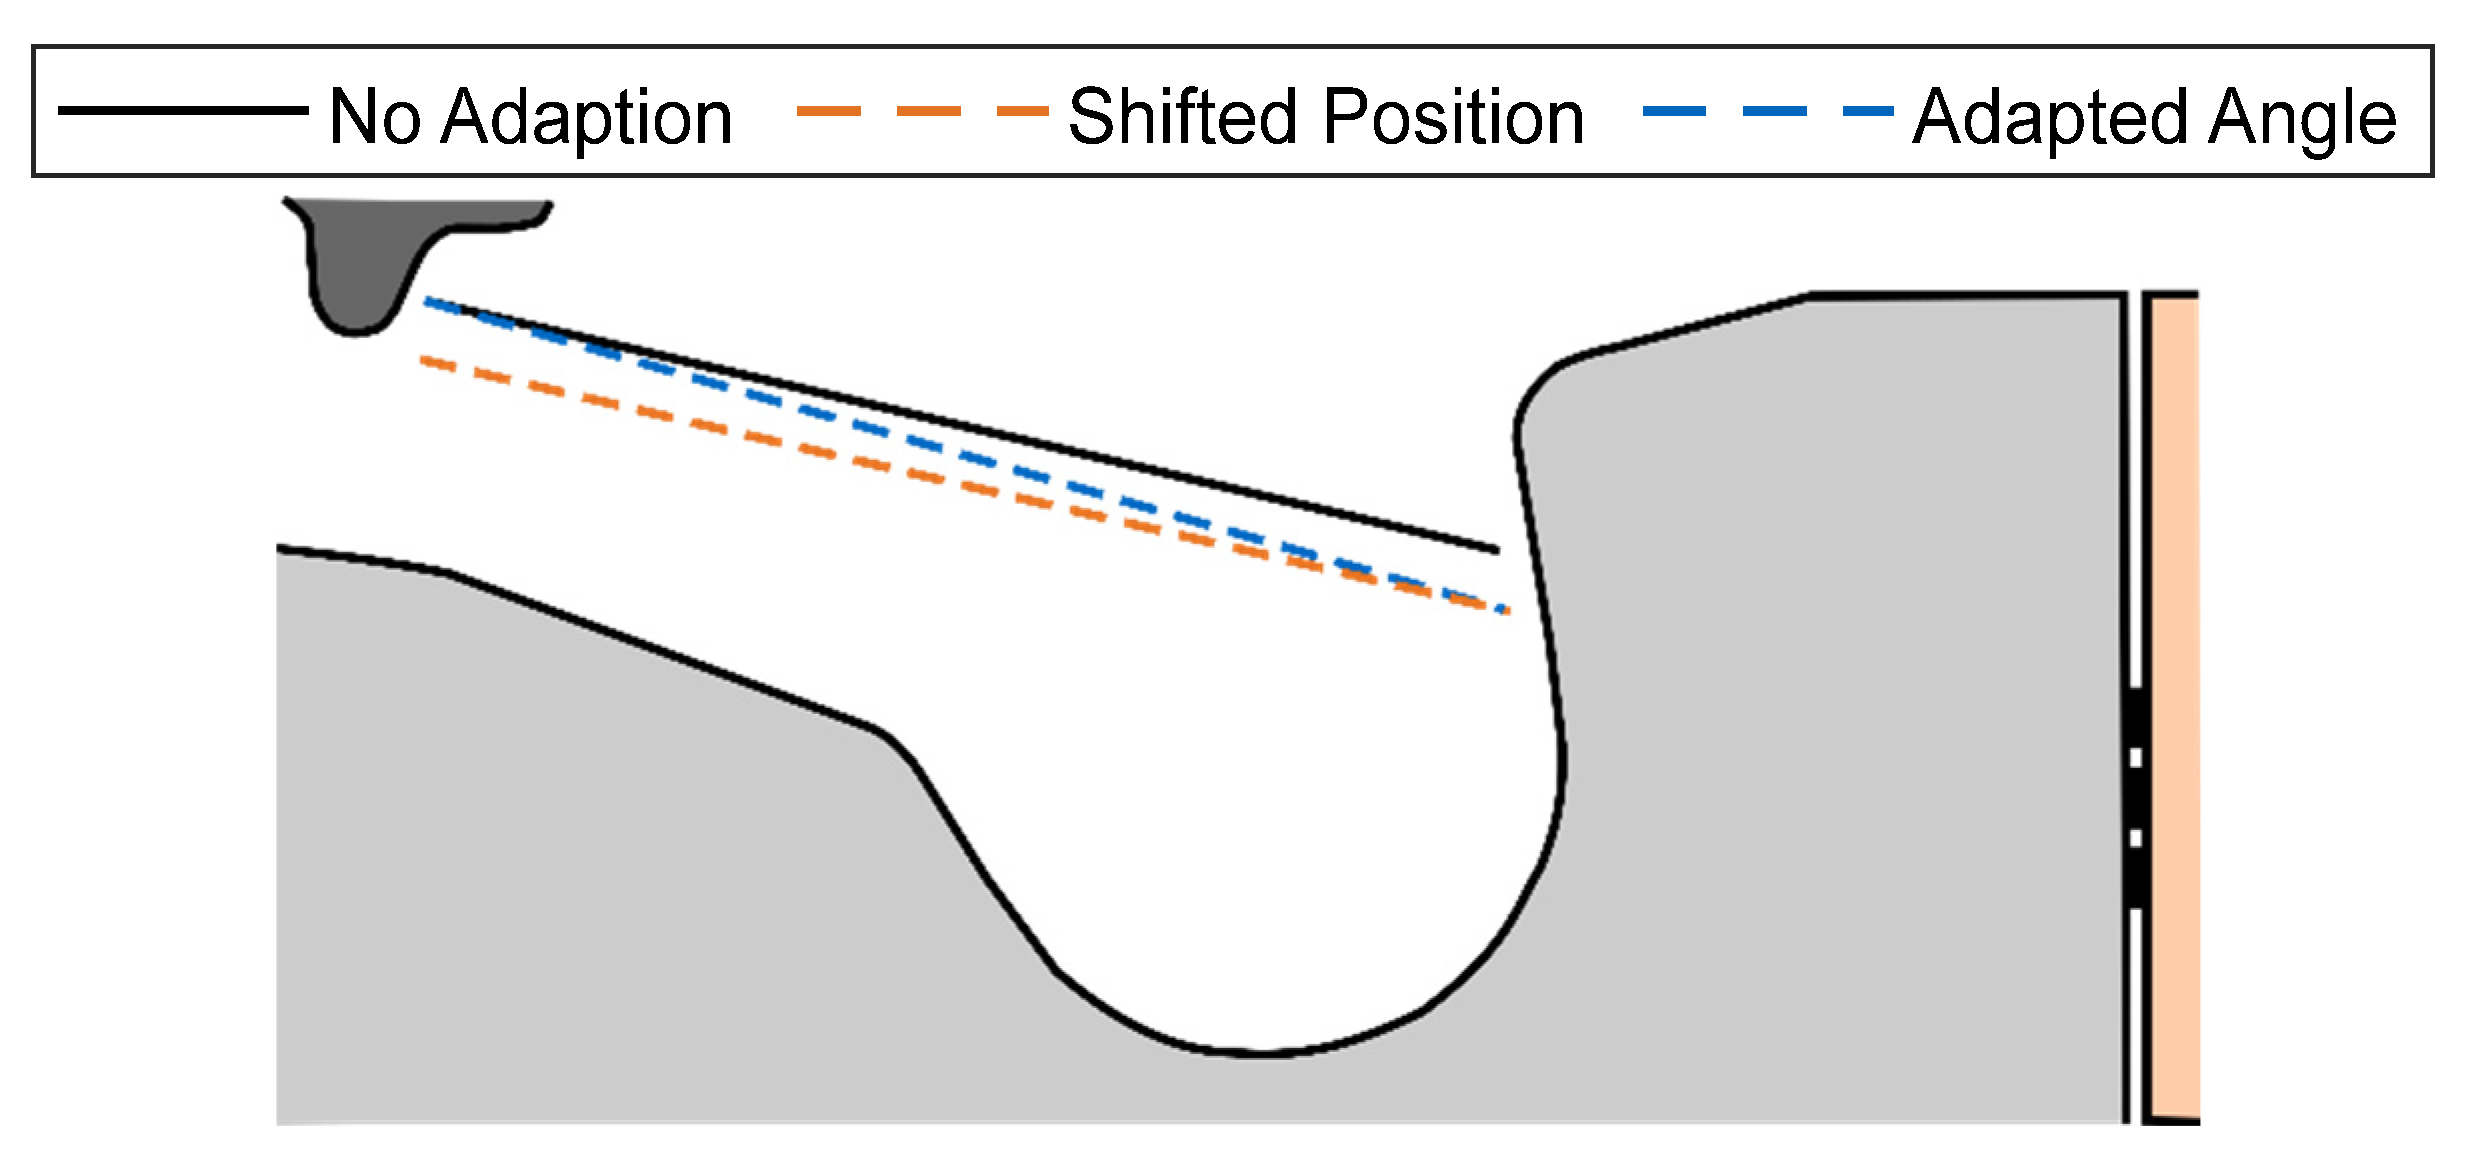
The three different diesel-injection options considered in combination with compression-ratio reduction are shown in Figure 10. For the first option, the injector maintains its position and spray angle. For the second option, the injector is moved so that it has the same position to the bowl as it would for a compression ratio of 17.5. For the third option, the spray angle is changed so that the diesel spray would occur at the same location on the piston, as it would for CR 17.5. For CR 16.0, the spray angle reduces from 77° to 74.6°, and for CR 14.5 it reduces to 71.8°.
Regarding the in-cylinder peak pressure, there are only minor deviations of less than 0.2%. Similarly, there is only a slight deviation between the simulations in terms of torque, with this at almost identical levels for the modified injector options at 393 and 399 Nm, for compression ratios of 14.5 and 16.0, respectively. For the unmodified injector option, this is at the slightly lower level of 390 and 398 Nm.
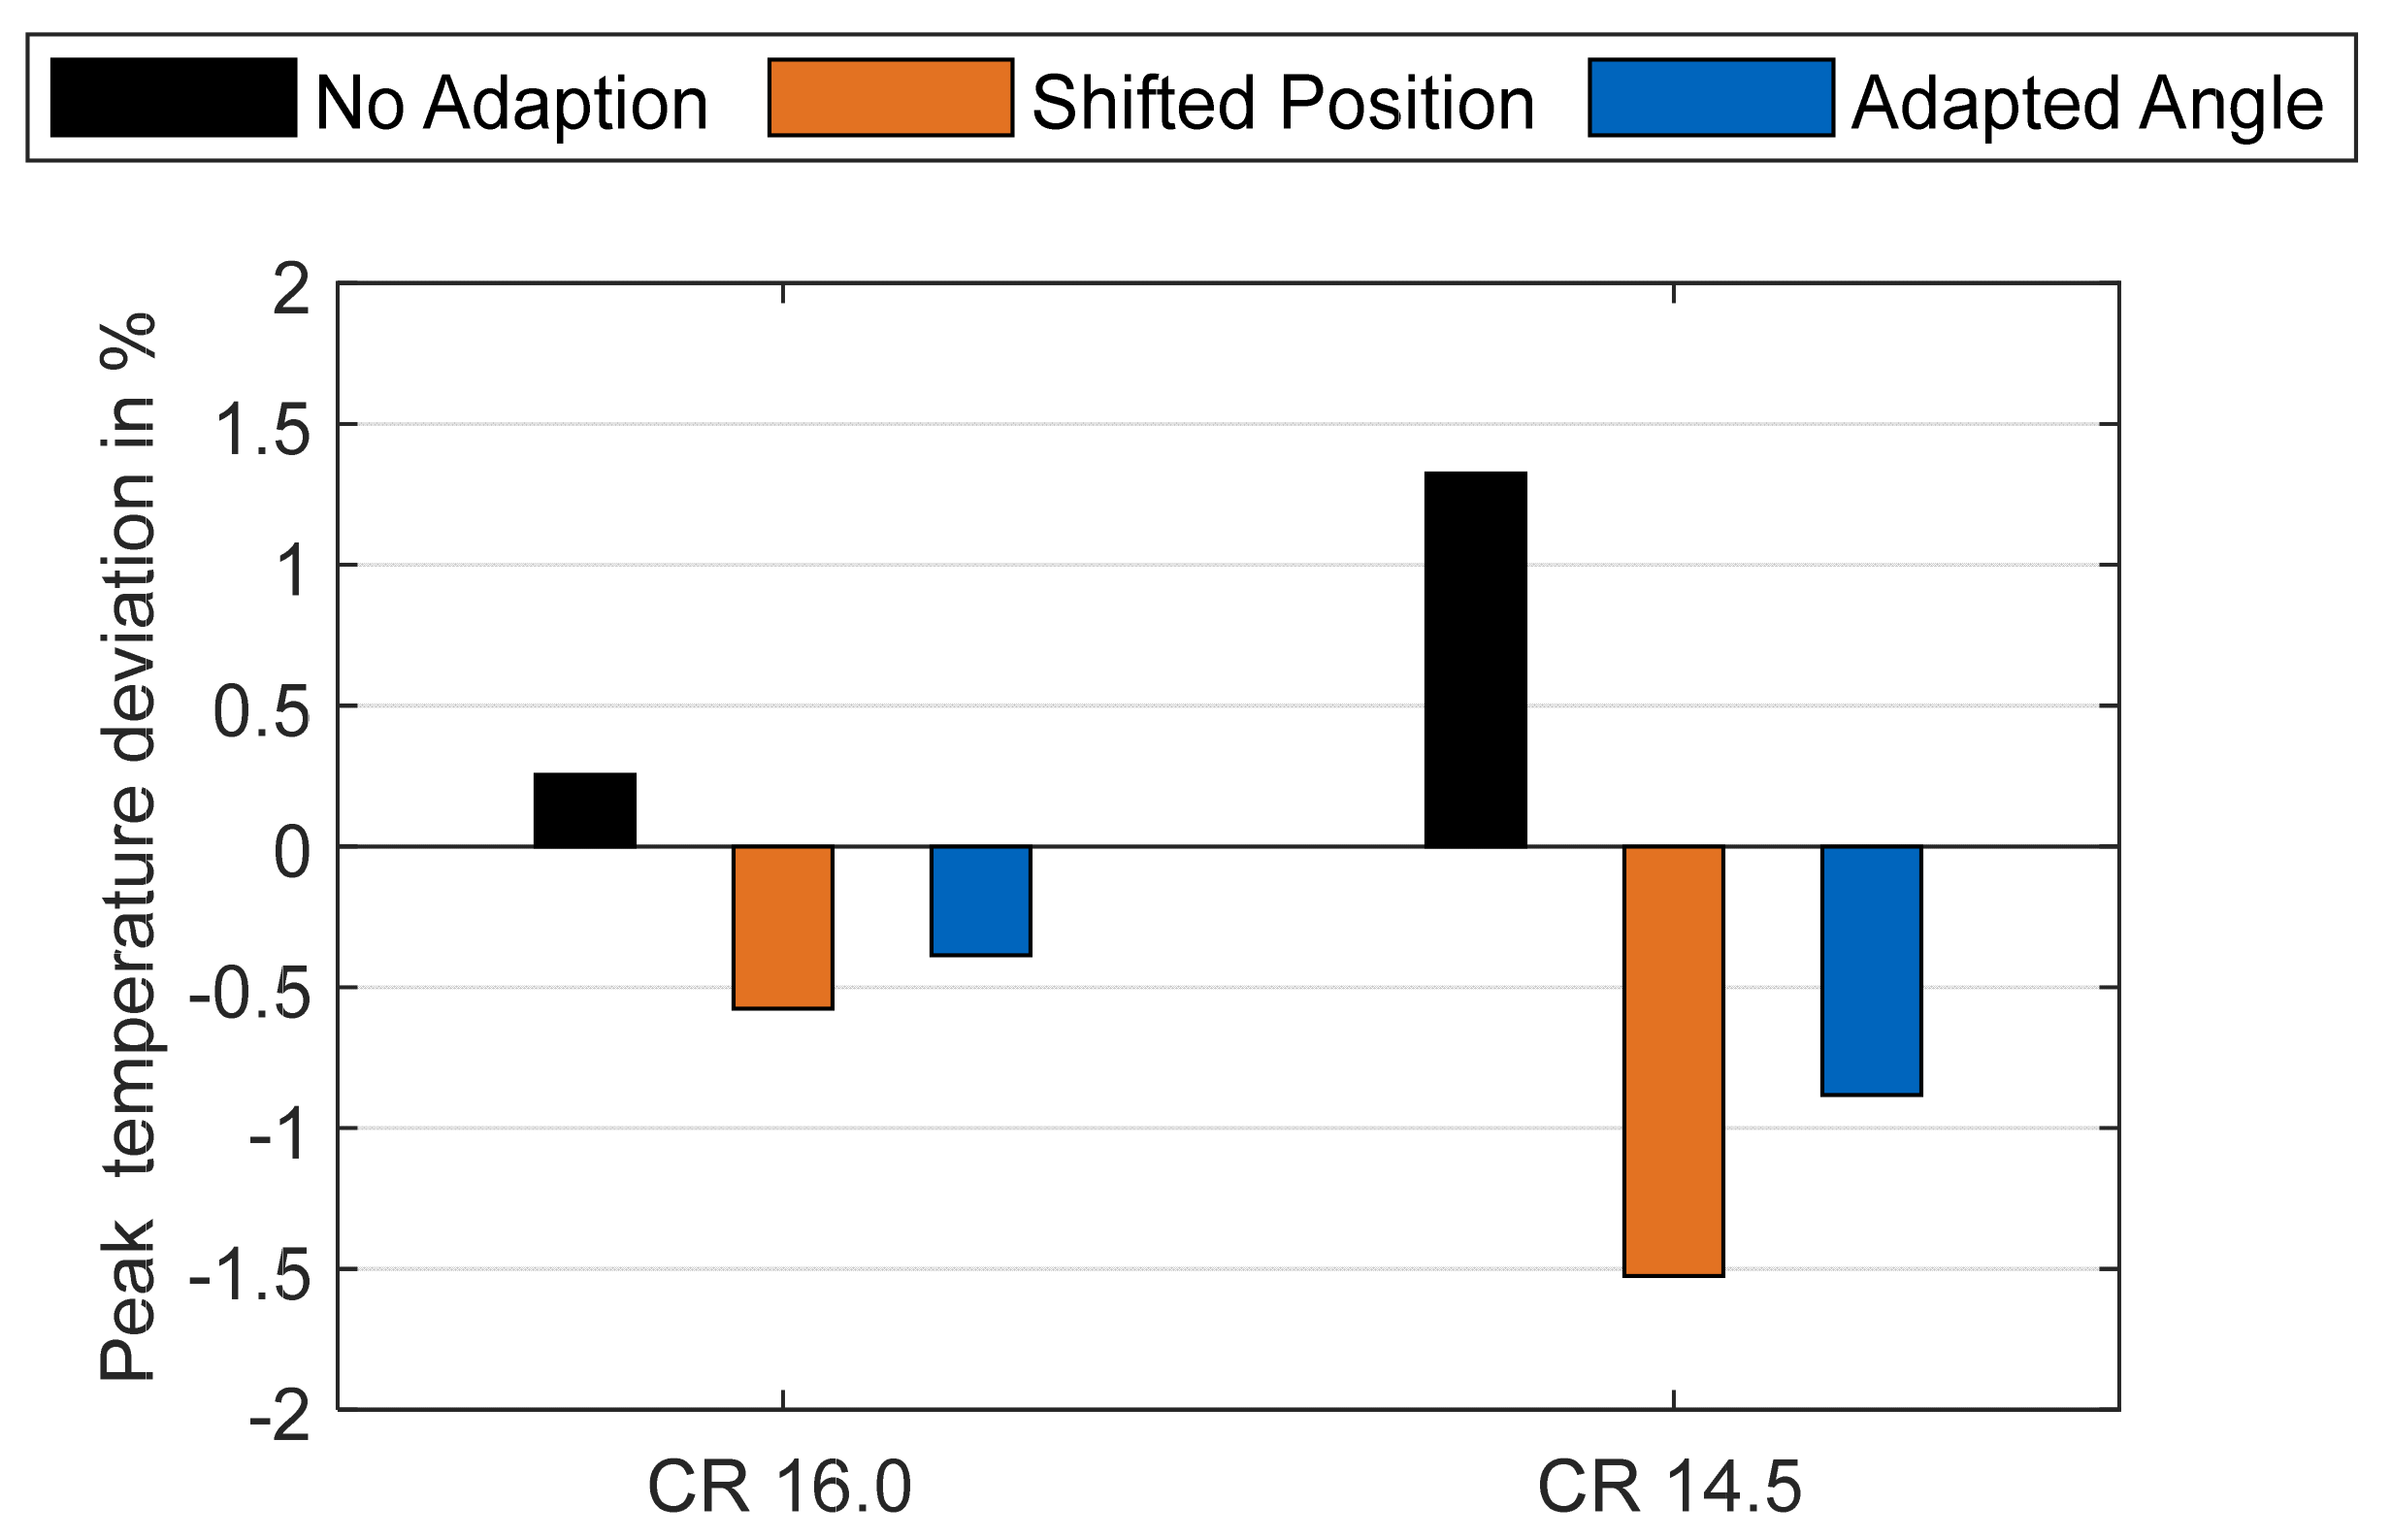
However, the temperature curve for the three options shows a difference regarding trends for the average cylinder-temperature maximum. In Figure 11, this maximum is shown as a percentage deviation from the mean peak temperature for a compression ratio of 17.5. As can be seen for the unmodified injector option, there is an increase in the mean peak temperature with a decreasing compression ratio, while for the modified injector options, the mean temperature peak is reducing with a reducing compression ratio. This is consistent with the findings in [36,37,38].
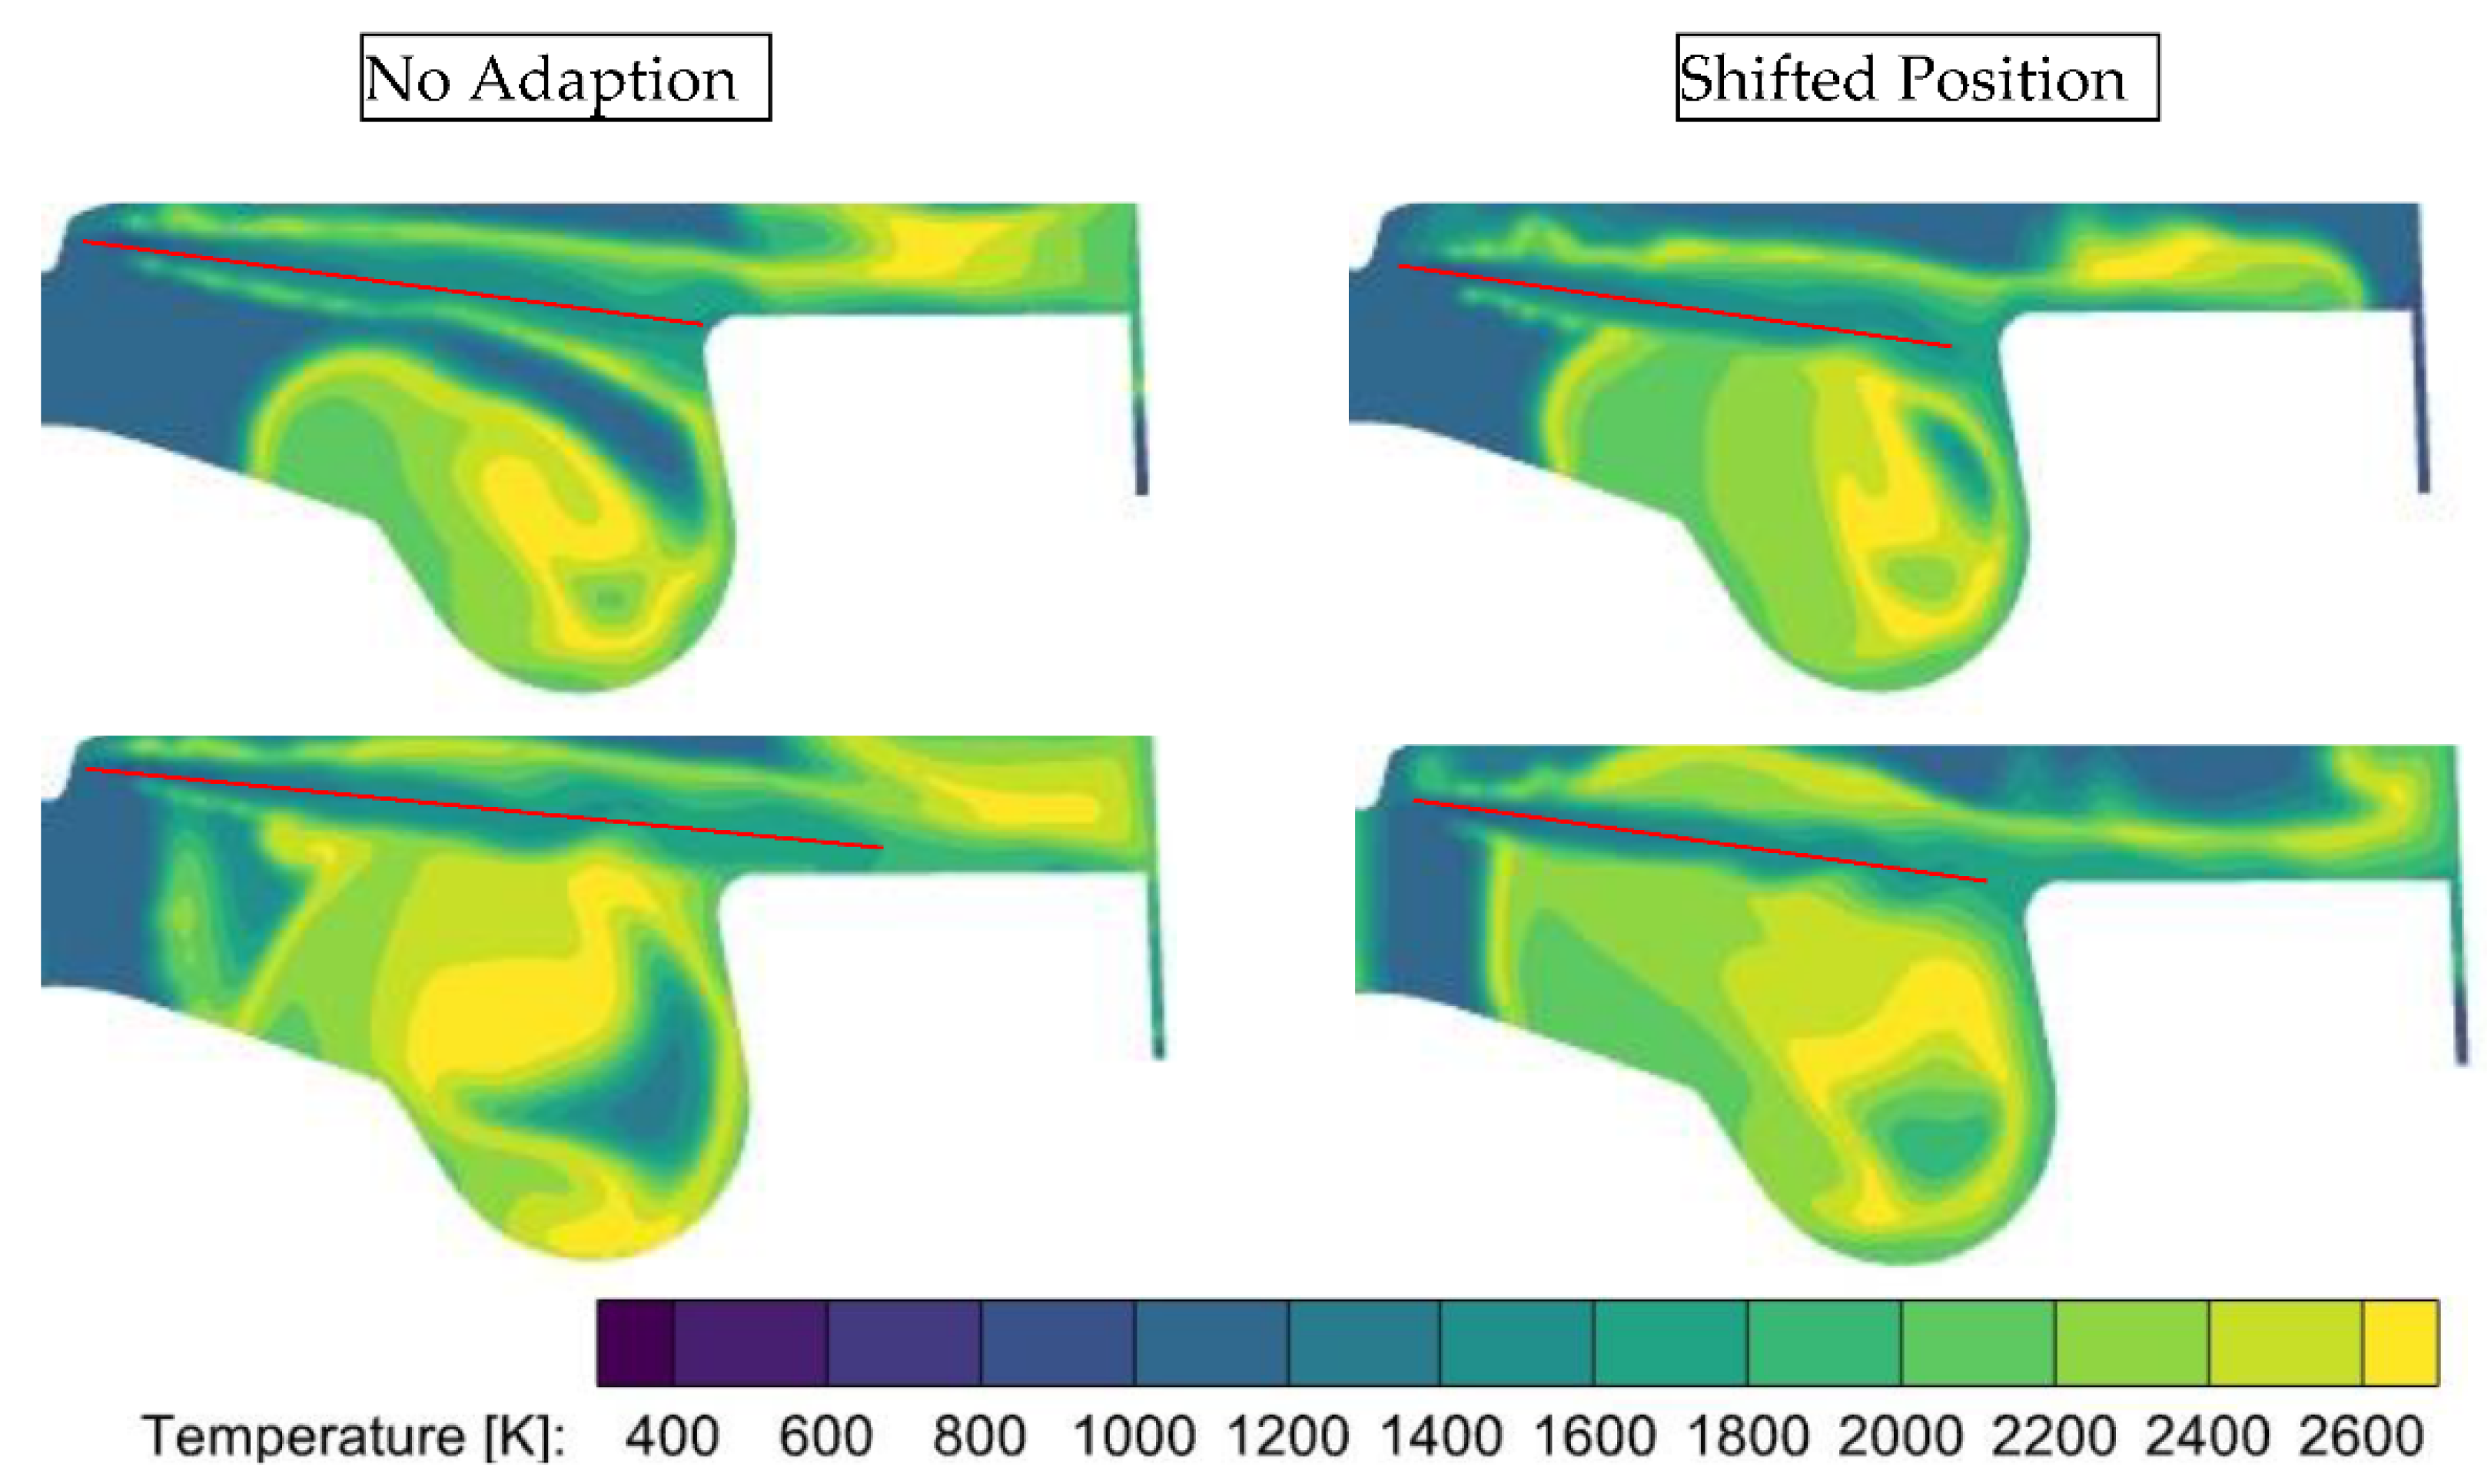
The reason for the increase in the maximum mean temperature for the variant of the unchanged injector is the stronger propagation of the flame front in the squish gap. For this variant, the diesel jet impinges the piston at a higher position and, thus, fuel spray increasingly enters the squish gap in the downward movement of the piston. This initially leads to a better fuel–air mixture, as the air trapped in the pinch gap is also utilized, as shown in Figure 12.
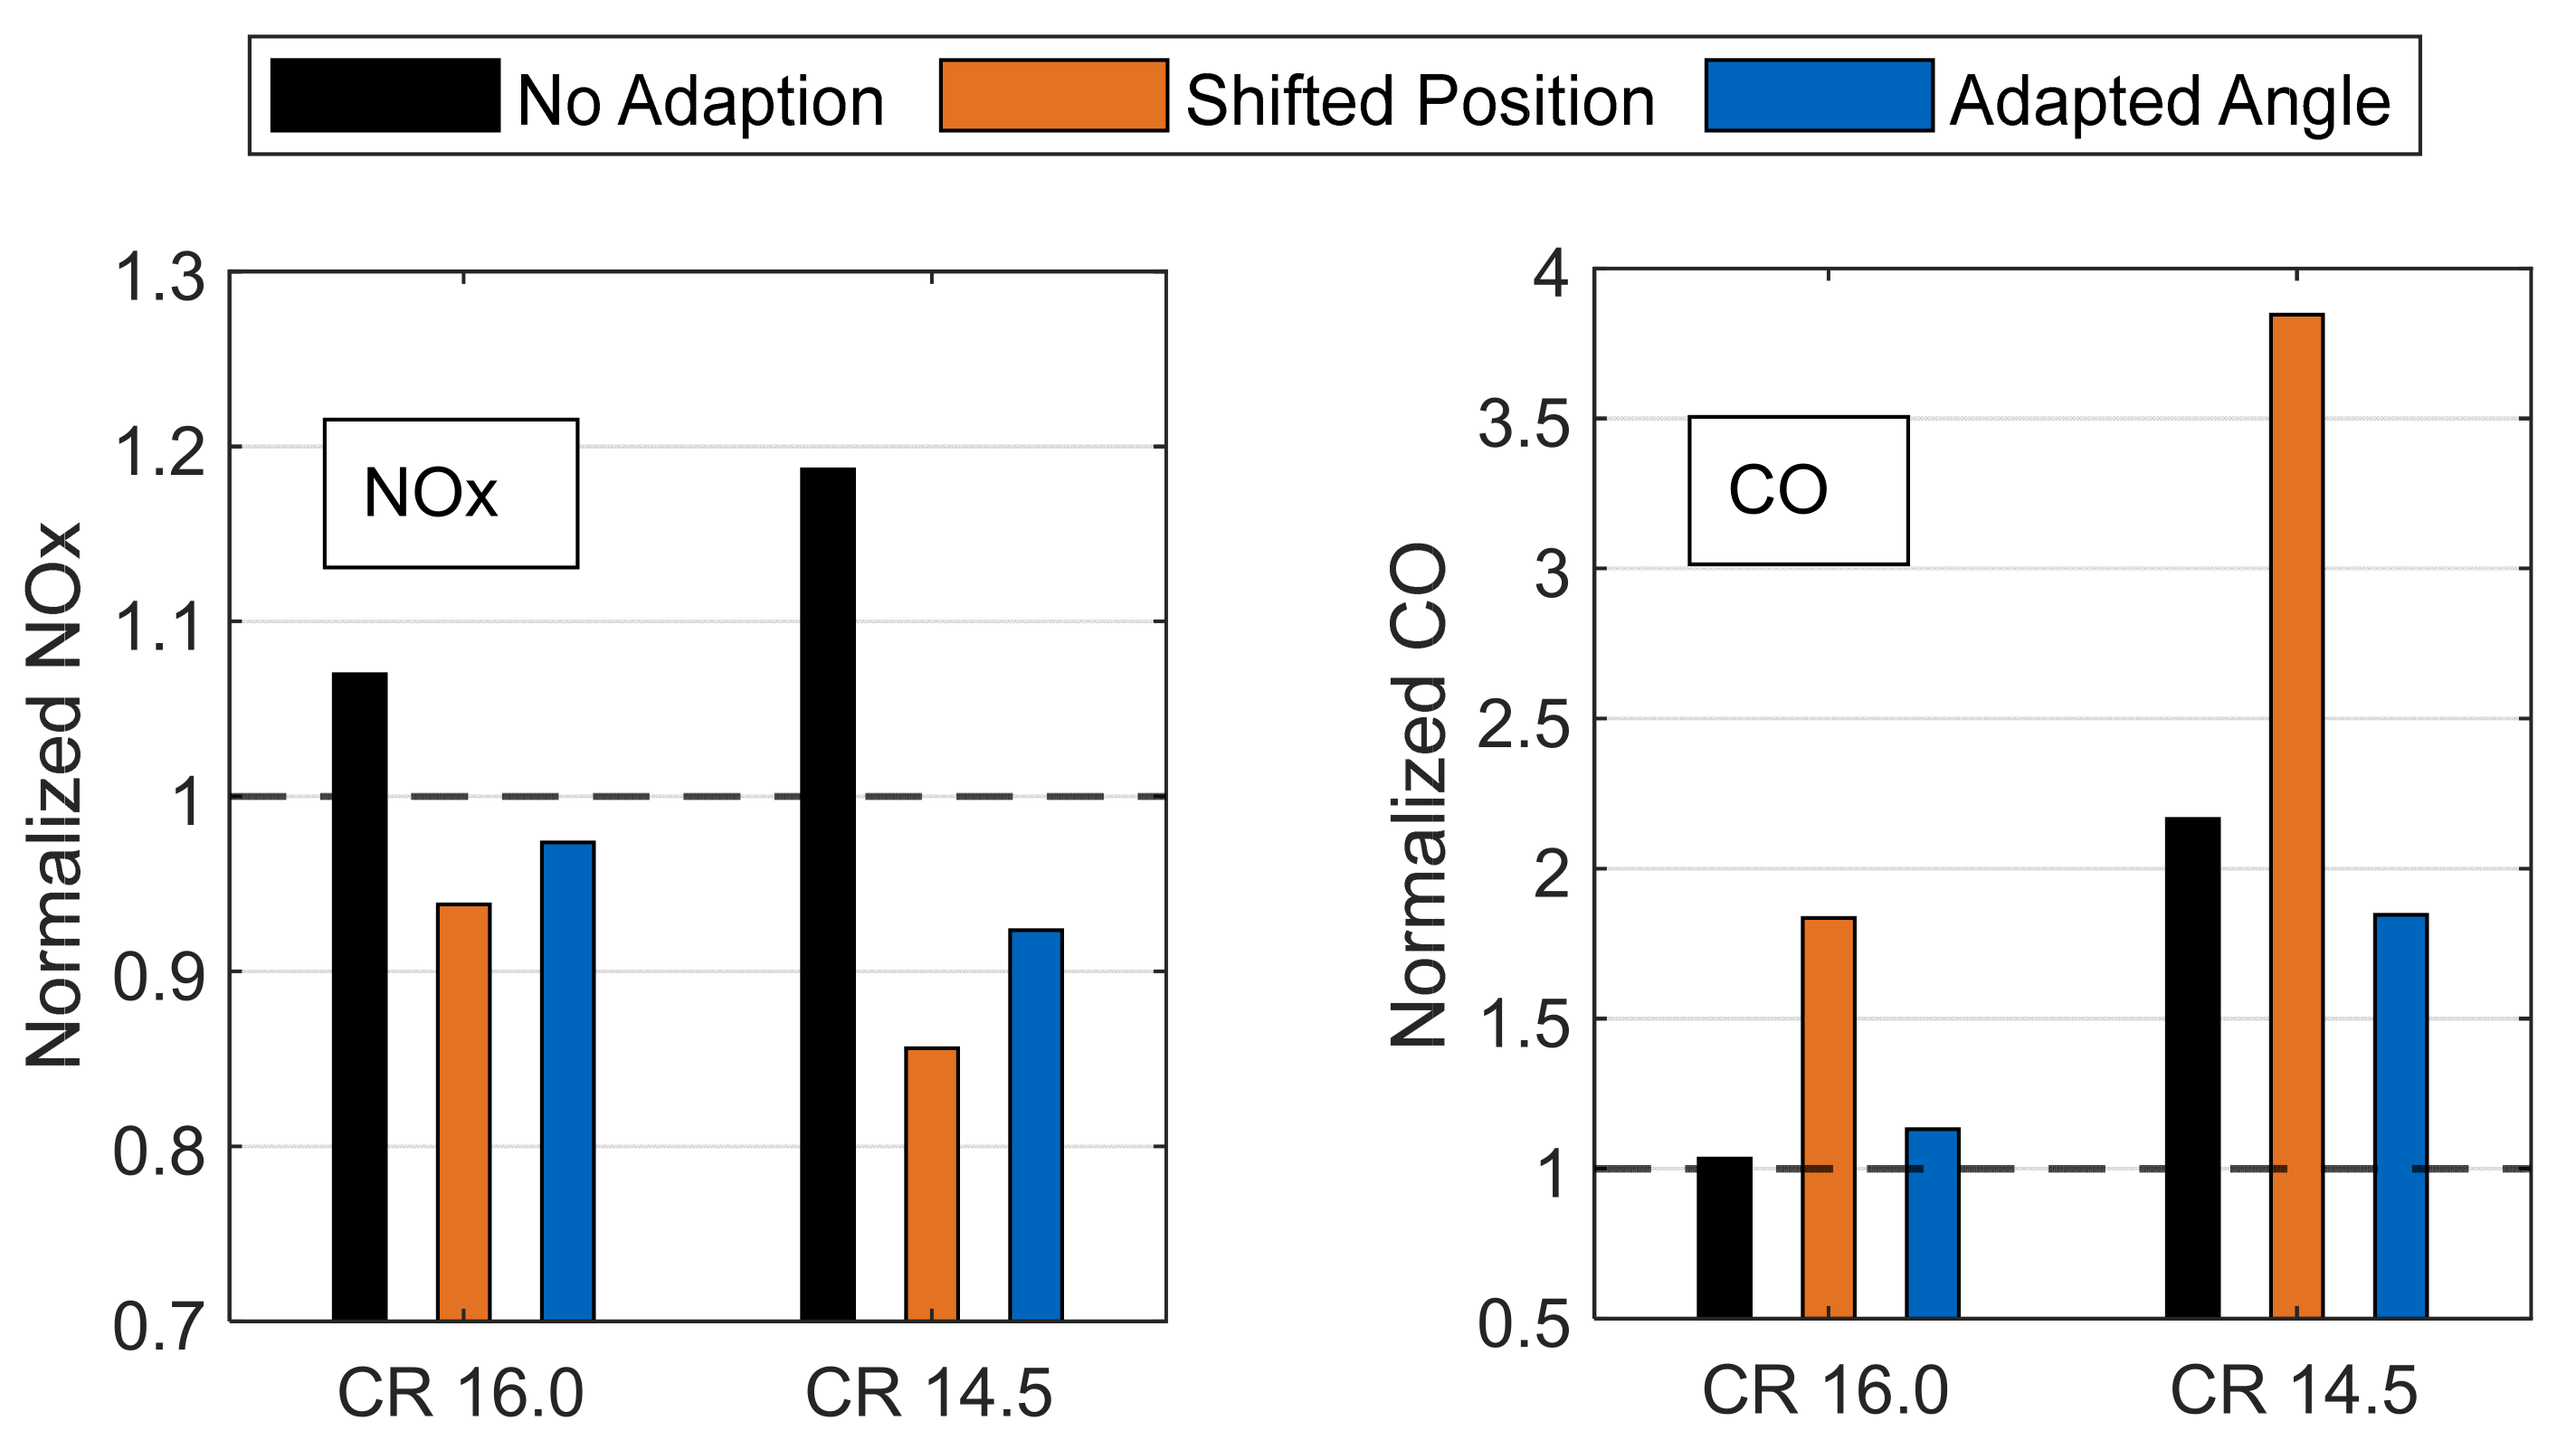
Besides an impact on the specific emissions, the changes for NOx and CO can be seen in Figure 13. The higher mean temperature peak for the variant of the unmodified injector causes an increase in the specific NOx emissions, with a decreasing compression ratio. A divergent behavior can be observed for the variants of the modified injector, as was expected when reducing the compression ratio. There is an increase in the specific CO emissions for all simulations of the reduced compression ratio. The reason for this is that, generally, due to lower compression the swirl is smaller and, thus, the mixing is worse. For the method of the unadjusted injector, larger fuel masses also enter the squish gap, resulting in locally richer mixture zones and incomplete combustion, which also explains the higher UHC emissions (up to 2.3 times) compared to CR 17.5. With the shifted-injector method, the lateral vortex system induced by the fuel jet is weakened, also resulting in worse mixing. With the adjusted-angle method, this vortex system is stronger, which is why the CO emissions for this method are lower than for the shifted position.
Due to the temperature development in the combustion chamber and the consequences for the emissions, especially with regard to increasing NOx emissions with reduced compression ratio, the unchanged-injector variant is not used for further investigations. In addition, the second method (shifted position) is conflicted with a practical implementation, since the injector moves further into the combustion chamber and, therefore, runs the risk of damage due to high temperatures. Therefore, the adjusted-injector-angle method will be chosen for further investigations. In addition, the trends regarding NOx emissions are correctly represented in relation to the compression-ratio reduction and show lower specific CO emissions than the shifted-injector variant. Besides that, this variant is, theoretically, technically feasible.

3.4. 1D Simulation for Fuel-Mass Variation

During initial assessments of the alternative operating scenarios, another simulation tool (0D/1D simulation software GT-Power) was used. The model has already been validated during previous studies by Hatz et al. [39] and is suitable for use in such investigations.
The reduction in the compression ratio, which takes place in the next investigation step, requires an initial estimate of the suitable operating scenarios for the epsilon variants of 16 and 14.5, regarding the increase in mean effective pressure. Since an estimation within the framework of the 3D investigations would have led to an extremely high additional expenditure of time, it was decided to use a 1D DoE (Design of Experiment) simulation approach. A DoE investigation involves an examination of the different factors influencing a specific result in a previously defined combination.
The initial objective of the DoE investigation is to determine the appropriate boundary conditions for the respective epsilon values with regard to boost pressure and injection mass, so that a comparable lambda level is achieved for all three compression ratios being investigated. The DoE approach was mostly a full-factorial-test plan, for which the first step consisted of a combination of eBooster speed, the resulting boost pressure and the injection mass. Since the 1D simulation is a full-engine model, the eBooster itself is also implemented in the simulation. The adjusting parameter for the boost pressure is, therefore, the speed specification at the electric engine of the compressor. In the first step, the epsilon was lowered from 17.5 to 16 and 14.5, respectively. In a further step, both the injection mass and the eBooster speed were increased. In the simulation evaluation, all possible combinations were then evaluated and compared with the targets of a maximum permissible peak pressure and a comparable lambda value. In addition, all other engine parameters required for the 3D CFD investigations were taken from the 1D simulation and applied. For example, in the context of lowering the epsilon value to 14.5, the following values were predicted by the 1D simulation. In order to achieve 180 bar peak cylinder pressure, the boost pressure was raised to 3.80 bar (+27%) and combined with an injection mass of 87 mg/stroke (+22%). The resulting lambda was about the same as previously obtained with Epsilon 17.5, with the 1D simulation achieving a value of 180.7 bar. The 1D boundary conditions were then transferred to the 3D simulation and resulted in a maximum peak pressure of about 180.9 bar.
Furthermore, the 1D simulation could be used within the scope of the present investigations to the extent that possible boundary conditions for the 3D investigations could be created for the selection of an injection strategy. These pre-investigations also included suitable DoE approaches (full factorial design approaches) for the variation of rail pressure, injection duration and injection profiles.

3.5. Influence of Methods for Increased Fuel-Mass Injection

Based on the results described in Section 3.4, this section compares three methods for additional fuel injection. In the first method, the injection duration is increased by 2.5 °CA, while the injector parameters and rail pressures are kept constant. In the second method, the rail pressure is increased while the injection duration remains constant. Lastly, the rail pressure and injection duration are kept constant but the hole diameter of the injector is increased.
It must be noted that for each compression ratio and each method, a different fuel mass and boost pressure must be selected in order to not violate the peak-pressure condition of 180 bar with a constant lambda. The respective fuel masses required for each method, as well as the gross torque and specific fuel consumption, can be seen in Table 4 next to the values of the reference simulation at CR 17.5.
With longer injection, a higher fuel mass is required for each compression ratio, in order to achieve a peak pressure of 180 bar. On the one hand, this leads to an increase in gross torque, which reaches its highest value, of 474.3 Nm for this method, at CR 14.5. However, this also leads to an increase in specific fuel consumption. The higher-rail-pressure method requires the least fuel mass to reach peak pressure, but this results in a smaller increase in gross torque. The method with the larger injector-hole diameter lies between the other two in terms of torque but has the lowest specific fuel consumption.
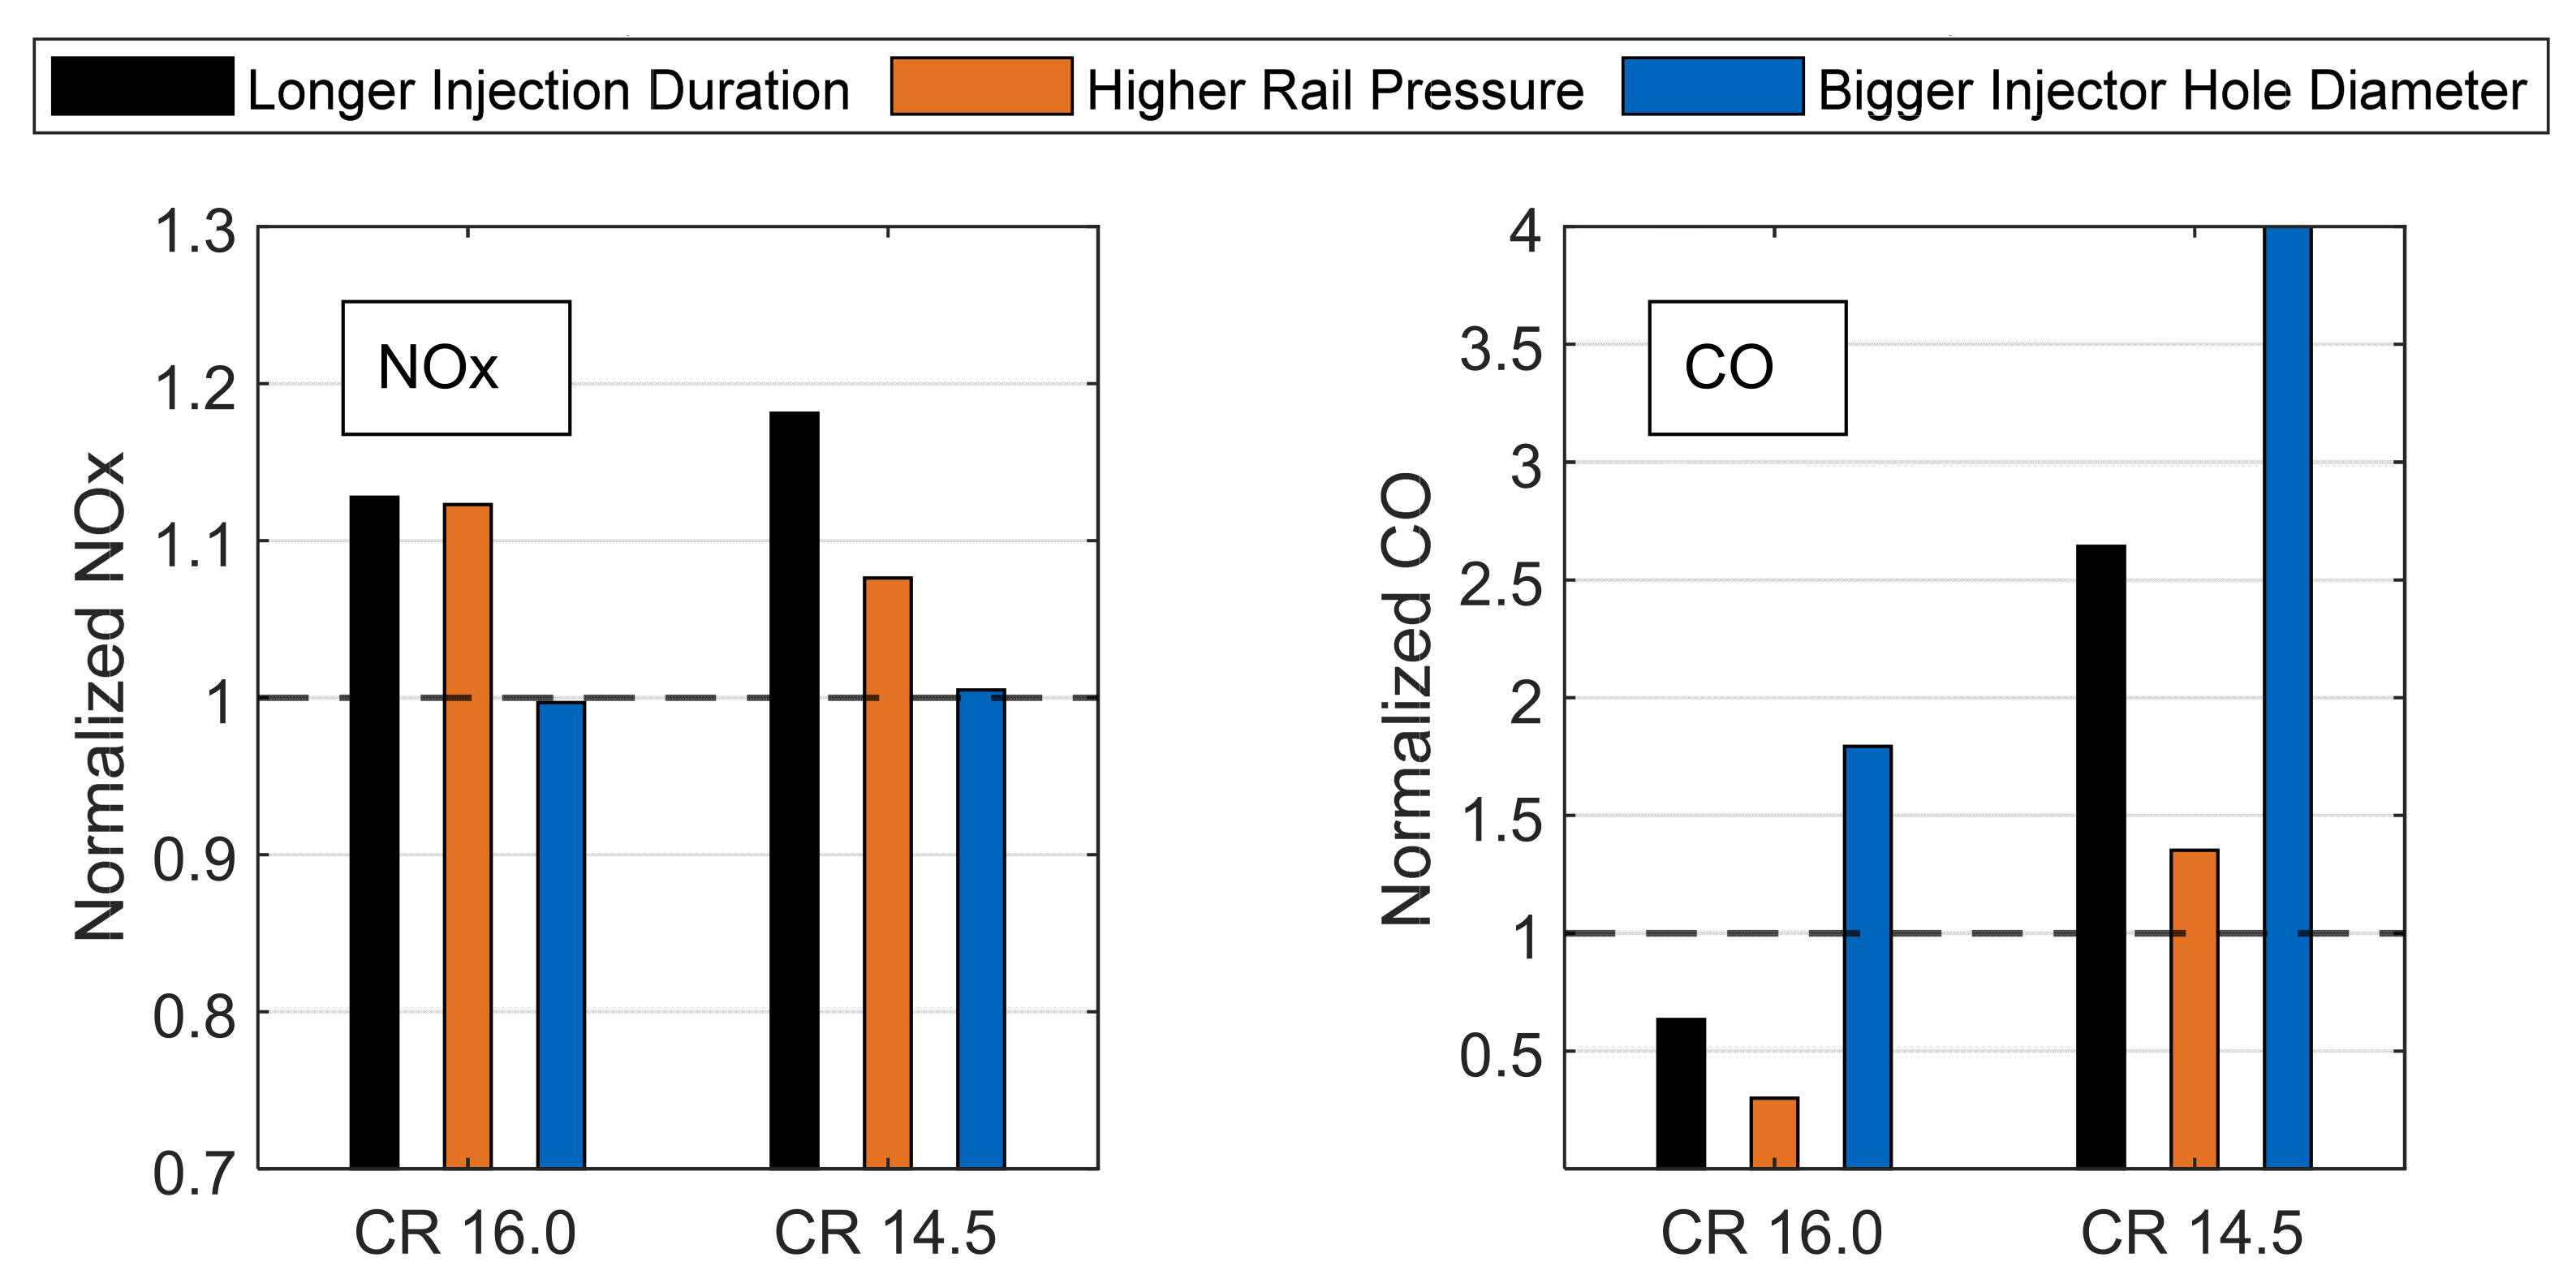
When looking at the emissions, it can be seen in Figure 14 that the longer injection method leads to the highest specific NOx emissions. Although this method has slightly lower peak temperatures than the other two, these are kept at a higher level for a longer time due to the high fuel mass and longer injection. The higher-rail-pressure method, on the other hand, has the highest peak temperatures, which also results in an increase in specific NOx emissions. The larger injector-hole-diameter method, on the other hand, results in the lowest NOx emissions, which achieves approximately the same values as for CR 17.5.
Due to the fact that the differences in fuel mass are very small for CR 16.0, the differences between the individual methods in terms of CO emissions are smaller than for CR 14.5. However, it is noticeable that the method with the larger injector-hole diameter has approx. three times higher the CO emissions than the other methods. At CR 14.5, for the variant with longer injection, CO emissions are 2.7 times higher than for CR 17.5 and 1.4 times higher than for the compression-ratio reduction alone. The reason for this is that the high fuel mass and, consequently, the longer injection duration lead to more and more diesel entering the squish gap, where rich-mixture zones are created. In addition, this also increases UHC emissions, which are 8.3 times higher at CR 14.5 than for the other two variants. The CO emissions of the higher-rail-pressure method are the lowest of the three methods. The reason for this is the amplification of the lateral-vortex system, since the fuel jet has higher velocities. This promotes mixing, which lowers CO emissions. For the variant with the larger injector-hole diameter, the highest CO emissions are shown for both compression ratios. The reason for this is the usage of the blob model for injection simulation, whereby the size of the fuel droplets depends directly on the hole diameter of the injector. This method, therefore, injects larger fuel droplets, which increases CO emissions [40].
For the following investigation, the bigger injector-hole diameter was chosen due the fact that the lowest specific fuel consumption and the lowest NOx emissions could be achieved with this method, at an increase of up to 13.3% torque.

3.6. Results of Reduced Compression Ratio and Higher Fuel Mass with Different Geometries

After finding suitable methods for lowering the compression ratio, the spray and the method of additional fuel mass, these methods are combined with selected geometries from Section 3.1. Geometry V4 is selected, since it has the lowest specific emissions at the same torque. In addition, V6 is also selected, which has the highest torque at CR 17.5. In addition, by adjusting the angle of the injection jet, a stronger vortex system can be formed in the bowl and, thus, the disadvantage of the shallower injection jet can be eliminated. For the same reason, V8 is also selected, which additionally achieved a higher torque with lower NOx emissions at CR 17.5.
The results of this study with regard to torque and specific consumption are listed in Table 5. Again, V6 achieves the highest torque at both compression ratios. Like for CR 17.5, there is no large lateral vortex in the bowl for either CR 14.5 or CR 16.0, but parts of the small vortex systems are much stronger due to the steeper impingement of the injection jet on the bowl and the additional fuel mass. Especially at CR 14.5, this causes good mixing over a large area and, thus, explains the high torque value.
For V4, the torque value is just above the stock geometry, as it was for CR 17.5. V8, on the other hand, has a higher torque at CR 16.0 than the series piston, while it is lower for CR 14.5. It should also be noted that the specific fuel consumptions for the V4, V6 and V8 geometries are lower than that for the series piston at CR 17.5.
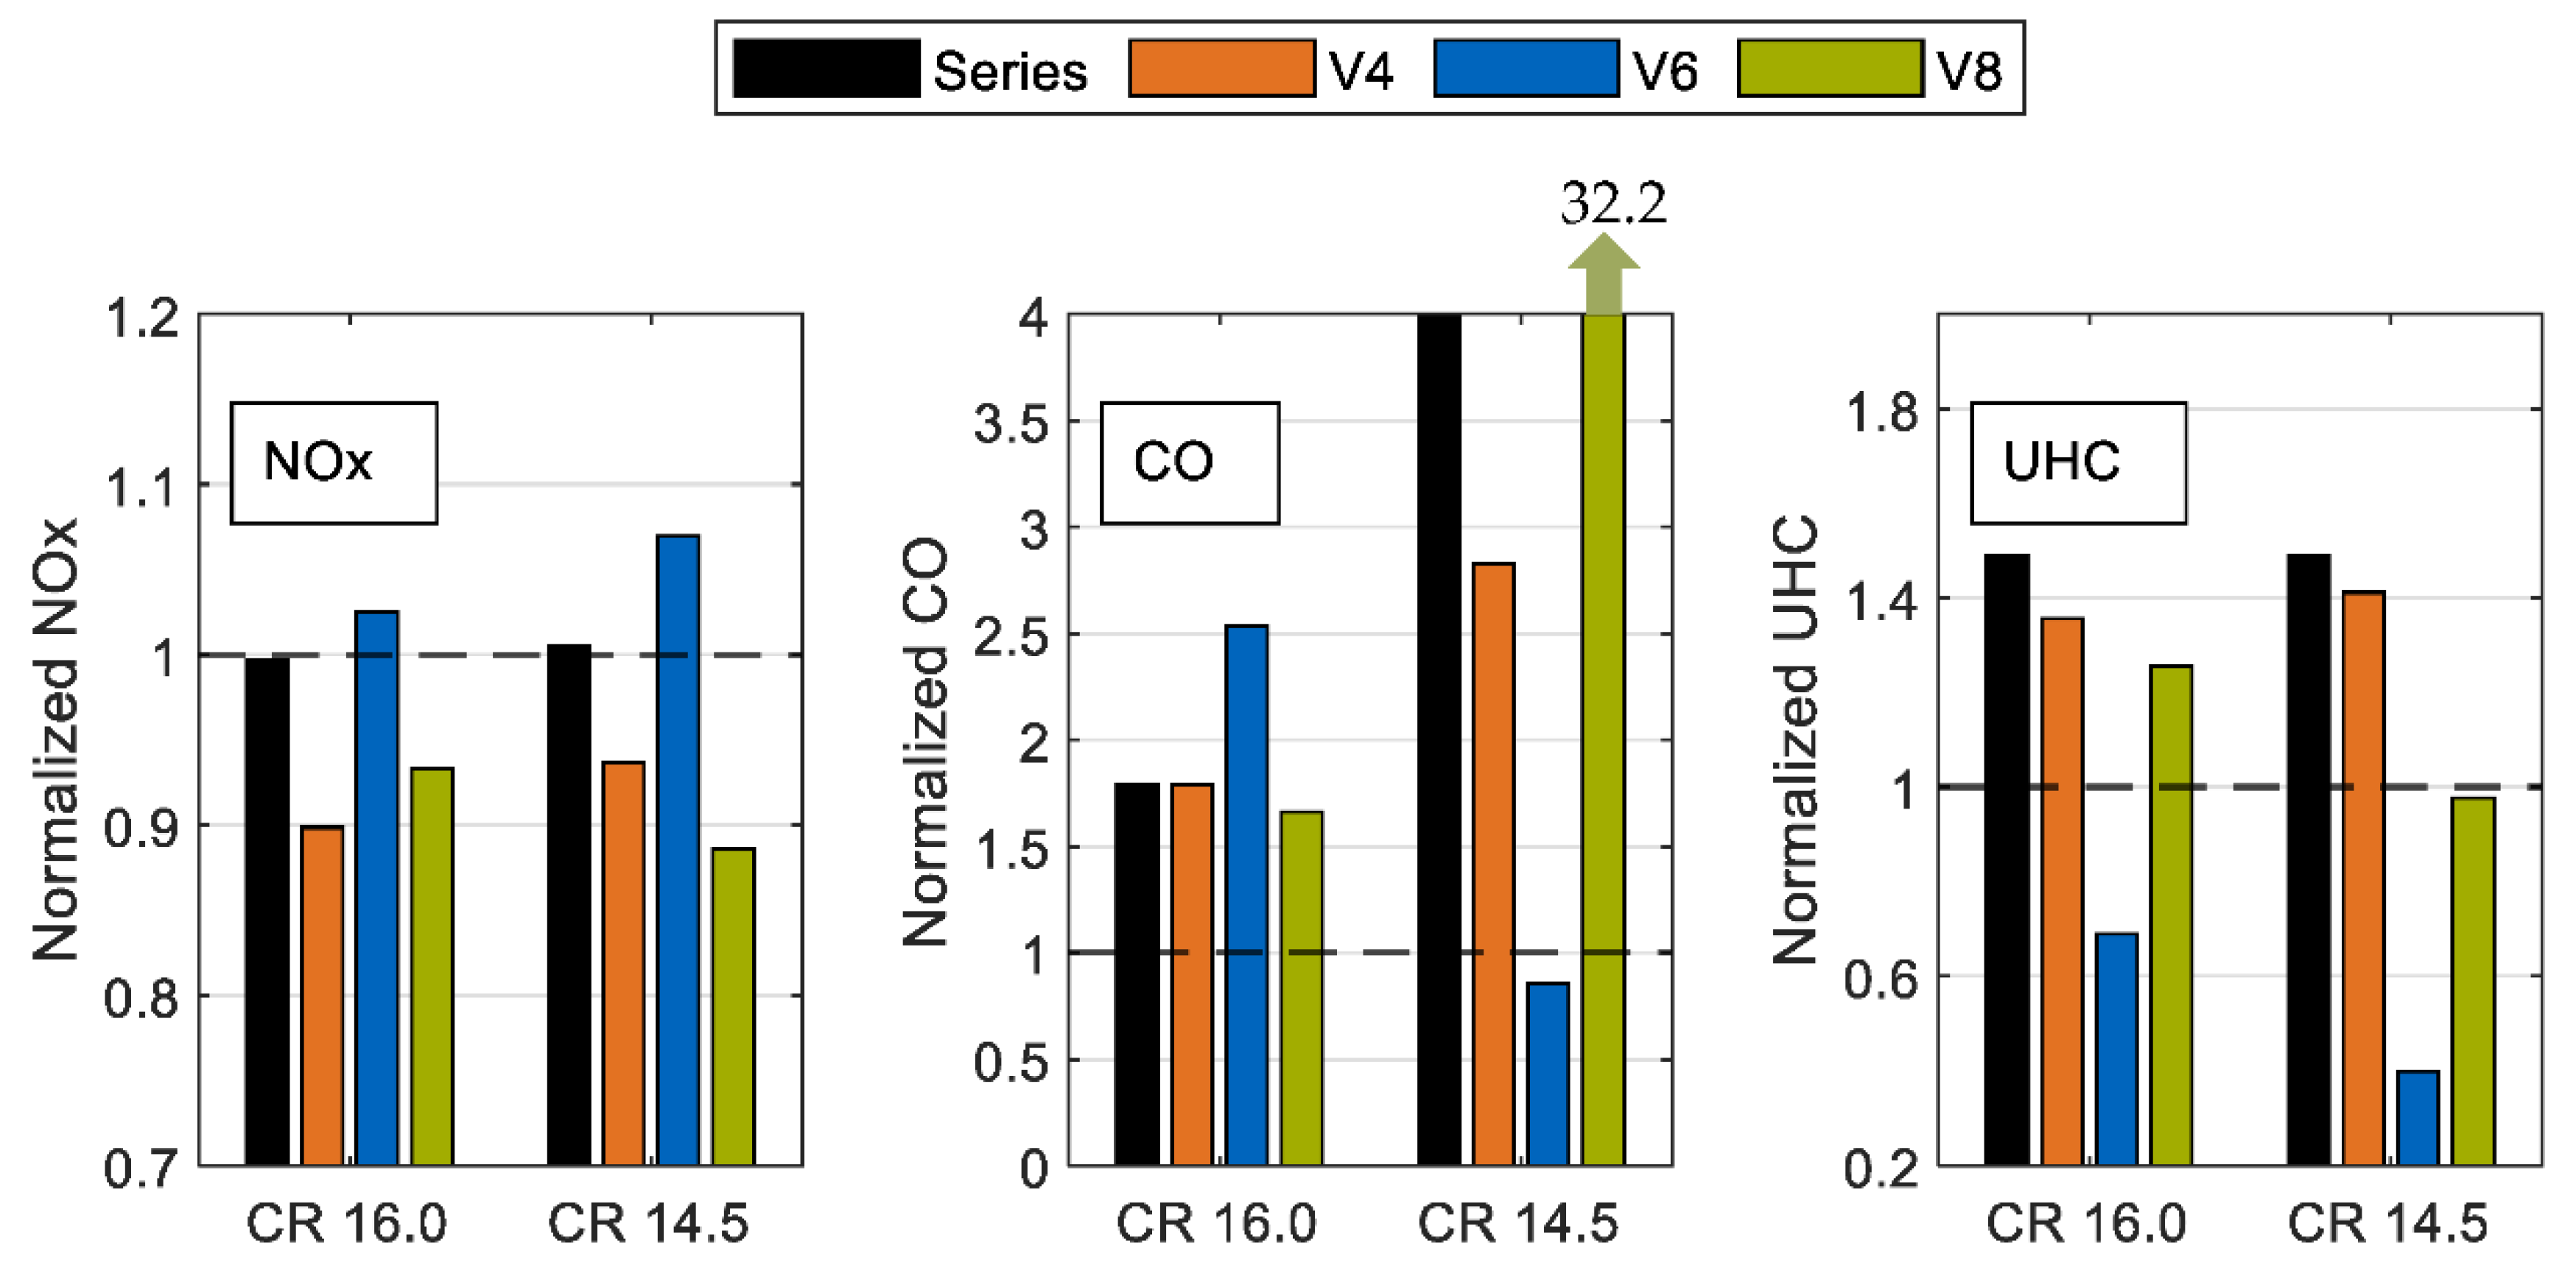
Regarding the specific emissions, which are compared to the ones of the series piston at CR 17.5 in Figure 15, V4 has 10% and 6% lower NOx emissions at CR 16.0 and CR 14.5, respectively. The reason for this is that the lateral vortex has a bigger expansion and less vorticity at the beginning of the injection, which lead to lower peak temperatures. The CO emissions are also lower at this geometry for both compression ratios. The higher swirl, due to the gaining vorticity of the lateral vortex with further fuel injection, leads to an overall good mixture and reduced CO emissions. Besides that, less spray is also directed into the squish gap and fire bar, due to the lower position of the vortex. Therefore, the UHC emissions are also reduced. Nevertheless, the CO and UHC emissions are still higher than for the series piston at CR 17.5, due to the effects explained in Section 3.2 and Section 3.4.
The efficient mixture, due to the small lateral vortex systems for V6, leads to an overall good mixture at CR 14.5, which lowers the CO emissions even below the value for CR 17.5. At CR 16.0, these lateral vortex systems have a lower vorticity, especially at the end of injection, and, therefore, there are still regions of rich mixture, which lead to an increase in CO emissions. Nevertheless, these air–fuel mixtures lead to high peak-heat releases and, therefore, high combustion temperatures. The maximum mean cylinder temperatures are 40 and 27 K higher than those of the series’ piston bowls, for CR 14.5 and CR 16.0, respectively, which explain the increased NOx emissions. Besides that, UHC emissions were reduced with this piston bowl. Due to the adjusted spray angle described in Section 3.3. and the wider piston-bowl diameter, the spray impinges the piston bowl at a further downward position. Therefore, less spray enters the squish gap and also the fire bar, which leads to reduced UHC emissions.
As with V4, the lateral vortex at the start of injection has less vorticity due to the larger bowl diameter of V8. As a result, mixing is initially poorer than for the series geometry, which is why the peak temperature is also lower and, therefore, the NOx emissions. In the further course (starting from 12 °CA after SOI), there are some differences between the compression ratios regarding the flow field in the piston bowl.
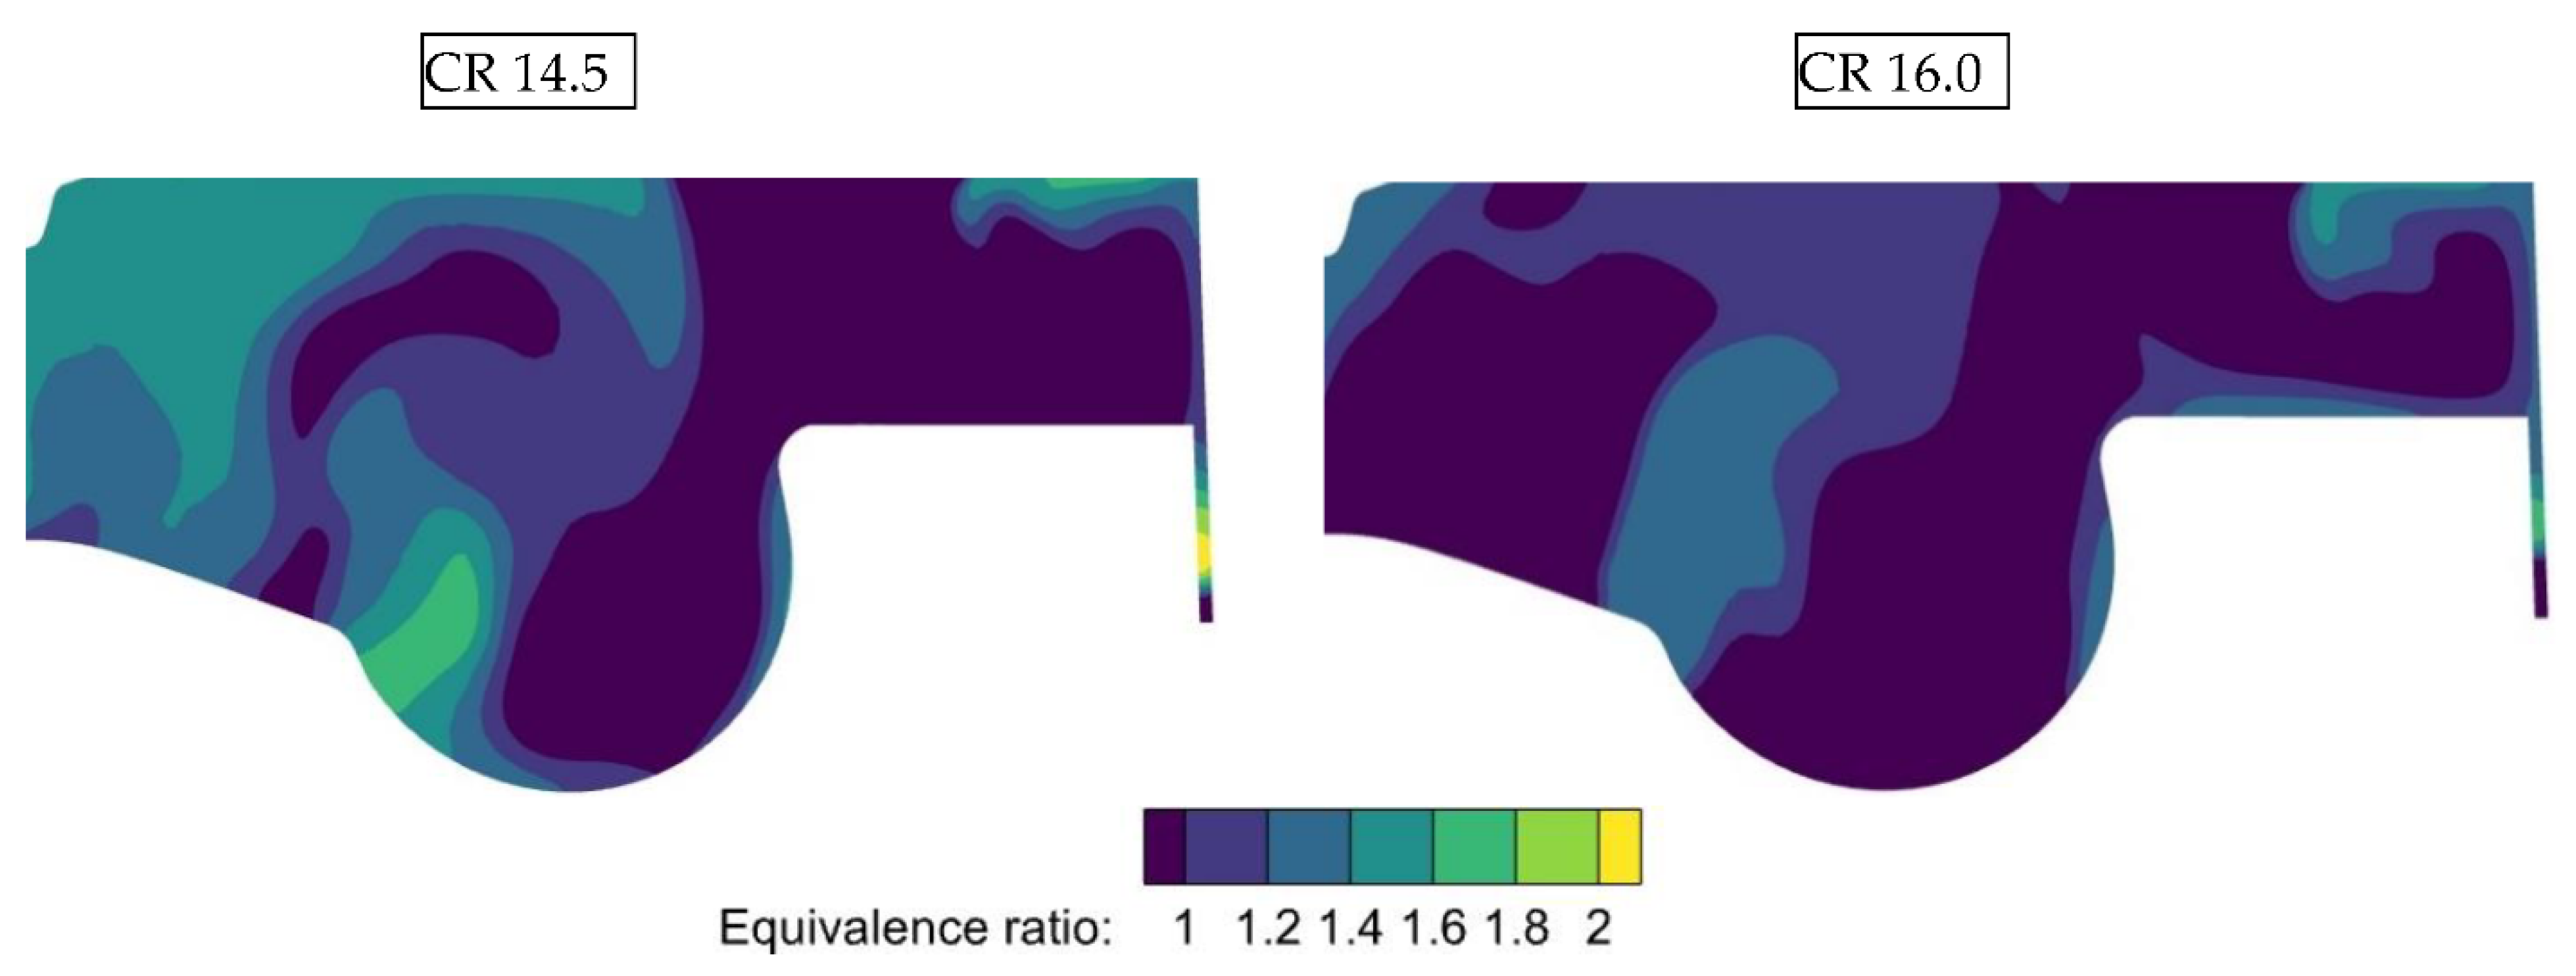
In the case of CR 14.5, the steeper fuel jet leads to a lower vorticity of the lateral vortex, so that more and more fuel reaches the center of the piston bowl. The fuel is now no longer sufficiently mixed with air in the bowl convexity by the rotational flow field, resulting in rich zones in the center of the piston bowl, as shown in Figure 16.
This leads to the increased specific CO emissions for CR 14.5. Whereas, for CR 16.0, the steeper fuel jet leads to a higher vorticity of the lateral vortex. This means that there are no fuel-rich zones in the center of the piston, but rather more uniform mixing in the bowl convexity. This reduces CO emissions, although they are still higher than for CR 17.5. Regarding UHC emissions, the behavior is similar to that of V6. Due to the spray angle and the slightly larger piston diameter, less fuel enters the squish gap and fire bar, which reduces the UHC emissions.
Overall, depending on the design objective, the results of the emissions can be decided between the geometries. Geometry V6 achieved the maximum torque increase, by 15%, compared to CR 17.5. Besides that, the specific CO emissions were reduced by 15% and the specific UHC emissions by 60%, while increasing the specific NOx emissions by 8%. Besides that, the lowest specific fuel consumption was achieved at CR 16.0 for this geometry, being 1.7 g/kWh lower than for CR 17.5. Geometries V4 and V8 showed potential in reducing NOx emissions by up to 12% for V8 at CR 14.5, but with an increase in CO emissions compared to CR 17.5.

4. Conclusions

The aim of the present study was to achieve a good trade-off between performance, emissions and specific fuel consumption, through a suitable combination of various piston geometries and different compression ratios. Furthermore, several simulative approaches were investigated, in order to determine the best possible CR variations and injection methods. Finally, on the basis of these findings, individual combination options were worked out, which achieved a maximum increase in mean pressure with partially unchanged emissions and specific fuel consumption.
In the first step, a piston-geometry study was carried out, consisting of eight different shapes, which were evaluated in terms of torque and specific NOx, CO and UHC emissions. This was followed by a study of CR reduction, in order to obtain the most accurate results possible in terms of performance and emissions. Based on this, various injector adjustments were investigated, including both spray angle and injector position. In a further step, three different options for increasing the fuel mass were investigated in order to estimate the increase in mean pressure. These included a longer injection time, an increase in rail pressure and an increase in the injector-hole diameter. All variants were evaluated, while satisfying the boundary conditions (peak pressure and lambda). Finally, the findings were used to develop various possible combinations that offer the best possible compromise between maximum performance, acceptable emissions and the lowest possible fuel consumption, depending on the design objective.
The following findings can be noted within the framework of the study:
  • Only one of the eight geometries investigated showed, due to a larger bottom-bowl radius, an improvement over the series in terms of torque and all the specific emissions evaluated. Two other geometries showed potential with regard to specific NOx emissions, despite their very different shapes.
  • Due to the high wall-heat losses caused by the extended fire bar, this compression-ratio-adaptation variant resulted in lower combustion-chamber temperatures. This reduced the effective mean pressure and decreases NOx emissions. Besides that, CO and UHC emissions increased with this variant.
  • The CR reduction required an adjustment of the fuel-spray orientation. In particular, the variant with an adjusted spray angle showed great potential, with regard to all the specific emissions considered with unchanged torque.
  • For the increased fuel-mass injection, the enlargement of the injector-hole diameter was selected. The reason for this was that the lowest specific fuel consumption and the lowest NOx emissions could be achieved with this method.
  • Finally, for geometry V6 and CR 14.5, a maximum mean pressure increase of 15%, with 15% reduced CO and 60% reduced UHC emissions, could be achieved. At a compression ratio of 16.0, this geometry showed the lowest specific consumption. Geometries V4 and V8 achieved up to 12% lower NOx emissions for both compression ratios.
Future analyses will focus on a more precise optimization of the selected geometries and their influences on combustion and emissions. In addition, validation of the simulated results on the test rig is to be carried out in a further step.

Author Contributions

Conceptualization, R.H., A.L., A.Z. and M.J.; methodology, R.H. and A.L.; validation, R.H., A.L., A.Z. and M.J.; formal analysis, R.H. and A.L.; investigation, R.H., A.L. and A.Z.; writing—original draft preparation, R.H. and A.L.; writing—review and editing, R.H. and A.L.; supervision, R.H., A.L., A.Z. and M.J.; project administration, R.H., A.L. and M.J.; resources, M.J. All authors have read and agreed to the published version of the manuscript.

Funding

This research received no external funding.

Institutional Review Board Statement

Not applicable.

Informed Consent Statement

Not applicable.

Acknowledgments

The authors would like to acknowledge the Technical University of Munich (TUM) and, especially, the Institute of Sustainable Mobile Drivetrains for their invaluable support of the research activity.

Conflicts of Interest

The authors declare no conflict of interest.

References

  1. Cowland, C.; Gutmann, P.; Herzog, P. Passenger Vehicle Diesel Engines for the US; SAE Technical Paper 2004-01-1452; SAE: Warrendale, PA, USA, 2004. [Google Scholar] [CrossRef]
  2. Pischinger, F.F. The diesel engine for cars—Is there a future? J. Eng. Gas Turbines Power 1998, 120, 641–647. [Google Scholar] [CrossRef]
  3. Yadav, P.; Saravanan, C.G.; Edward, J.G.; Perumal, R. Experimental and Numerical Investigation of Flow and Combustion in a DI Diesel Engine with Different Piston Geometries; SAE Technical Paper 2015-01-0378; SAE: Warrendale, PA, USA, 2015. [Google Scholar] [CrossRef]
  4. Brijesh, P.; Abhishek, S.; Sreedhara, S. Numerical Investigation of Effect of Bowl Profiles on Performance and Emission Characteristics of a Diesel Engine; SAE Technical Paper 2015-01-0402; SAE: Warrendale, PA, USA, 2015. [Google Scholar] [CrossRef]
  5. Yoo, D.; Song, J.; Kim, Y.; Jung, W.; Kim, D. Fuel Consumption Improvement of 2.4L ULPC Diesel Engine by Optimizing the Combustion System—Nozzle, Swirl Ratio and Piston Bowl Geometry; SAE Technical Paper 2015-01-0785; SAE: Warrendale, PA, USA, 2015. [Google Scholar] [CrossRef]
  6. Splitter, D.; Wissink, M.; Kokjohn, S.; Reitz, R. Effect of Compression Ratio and Piston Geometry on RCCI Load Limits and Efficiency; SAE Technical Paper 2012-01-0383; SAE: Warrendale, PA, USA, 2012. [Google Scholar] [CrossRef]
  7. Hu, D.; Li, G.; Yu, Y. A Computational Investigation into the Effects of Piston Bowl Geometry on Fuel-Air Mixing and Performance in a High-Intensified Diesel Engine. In Proceedings of the International Conference on Materials for Renewable Energy and Environment, Chengdu, China, 19–21 August 2013. [Google Scholar] [CrossRef]
  8. Lee, J.; Lee, S.; Kim, J.; Kim, D. Bowl Shape Design Optimization for Engine-Out PM Reduction in Heavy Duty Diesel Engine; SAE Technical Paper 2015-01-0789; SAE: Warrendale, PA, USA, 2015. [Google Scholar] [CrossRef]
  9. Subramanian, S.; Rathinam, B.; Lalvani, J.; Annamalai, K. Piston Bowl Optimization for Single Cylinder Diesel Engine Using CFD; SAE Technical Paper 2016-28-0107; SAE: Warrendale, PA, USA, 2016. [Google Scholar] [CrossRef]
  10. Zolver, M.; Griard, C.; Henriot, S. 3D Modeling Applied to the Development of a DI Diesel Engine: Effect of Piston Bowl Shape; SAE Technical Paper Series 971599; SAE: Warrendale, PA, USA, 1997. [Google Scholar]
  11. Wen, M.; Li, Y.; Li, Y.; Tan, L.; Lyu, J. Numerical Simulation Analysis into Effects of Piston Bowl Geometry on Combustion Process for a High Power Density Diesel Engine; SAE Technical Paper 2015-01-1855; SAE: Warrendale, PA, USA, 2015. [Google Scholar] [CrossRef]
  12. Cró, N.R.; Ferreira, J.V.; Ribeiro, W.L.; Tanikawa, M.G. Computational Modeling of Internal Combustion Engines: Influence of Compression Ratio in the Indicated Performance Curves; SAE Technical Paper 2013-36-0349; SAE: Warrendale, PA, USA, 2013. [Google Scholar] [CrossRef]
  13. Annamalai, R.; Kuppusamy, R.; Krishnan Ramachandran, S. Effect of Piston Bowl Geometry and Different Injection Pressure on the Performance, Emission, and Combustion Characteristics of Diesel Engine Using Biodiesel Blend. Therm. Sci. 2018, 22, 1445–1456. [Google Scholar] [CrossRef]
  14. Shi, Y.; Reitz, R.D. Optimization study of the effects of bowl geometry, spray targeting, and swirl ratio for a heavy-duty diesel engine operated at low and high load. SAGE Int. J. Engine Res. 2008, 9, 325–346. [Google Scholar] [CrossRef]
  15. Dolak, J.G.; Shi, Y.; Reitz, R.D. A Computational Investigation of Stepped-Bowl Piston Geometry for a Light Duty Engine Operating at Low Load; SAE International; ISSN 0148-7191. SAE: Warrendale, PA, USA, 2010. [Google Scholar] [CrossRef]
  16. Quazi, M.A.; Singh, S.K.; Jadhao, M. Effect of Piston Bowl Shape, Swirl Ratio and Spray Angle on Combustion and Emission in Off Road Diesel Engine; SAE Technical Paper 2015-26-0142; SAE: Warrendale, PA, USA, 2015. [Google Scholar] [CrossRef]
  17. Lee, S.; Lee, J.; Hwang, S.; Wang, T.; Lee, Y. Design of combustion bowl geometry to meet final Tier 4 of 11 L non-road heavy-duty diesel engine with multi-dimensional combustion simulation. J. Mech. Sci. Technol. 2016, 30, 4373–4382. [Google Scholar] [CrossRef]
  18. Appukuttan, A.; Bisht, J.; Kaundabalaraman, K.; Rathi, H. Piston Bowl Design Optimization to Improve Low End Rated Torque in BS-VI Diesel Engine Based on Multi-Dimensional Combustion Simulation; SAE Technical Paper 2020-01-0241; SAE: Warrendale, PA, USA, 2020. [Google Scholar] [CrossRef]
  19. Cipolla, G.; Vassallo, A.; Catania, A.E.; Spessa, E.; Stan, C.; Drischmann, L. Combined Application of CFD Modeling and Pressure-Based Combustion Diagnostics for the Development of a Low Compression Ratio High-Performance Diesel Engine; SAE Technical Paper 2007-24-0034; SAE: Warrendale, PA, USA, 2007. [Google Scholar] [CrossRef]
  20. Hariram, V.; Vagesh Shangar, R. Influence of compression ratio on combustion and performance characteristics of direct injection compression ignition engine. Alex. Eng. J. 2015, 54, 807–814. [Google Scholar] [CrossRef] [Green Version]
  21. Gavade, S.; Bhargava, A.; Sonl, G.; Deshmukh, C. Optimization of Compression Ratio for DI Diesel Engines for Better Fuel Economy; SAE Technical Paper 2019-28-2431; SAE: Warrendale, PA, USA, 2019. [Google Scholar] [CrossRef]
  22. El Kassaby, M.; Nemit Allah, M.A. Studying the effect of compression ratio on an engine fueled with waste oil produced biodiesel/diesel fuel. Alex. Eng. J. 2012, 52, 1–11. [Google Scholar] [CrossRef] [Green Version]
  23. Funayama, Y.; Nakajima, H.; Shimokawa, K. A Study on the Effects of a Higher Compression Ratio in the Combustion Chamber on Diesel Engine Performance; SAE Technical Paper 2016-01-0722; SAE: Warrendale, PA, USA, 2016. [Google Scholar] [CrossRef]
  24. Minamino, R.; Kawabe, T.; Omote, H.; Okada, S. The Effect of Compression Ratio on Low Soot Emission from a Small Non-Road Diesel Engines; SAE Technical Paper 2013-24-0060; SAE: Warrendale, PA, USA, 2013. [Google Scholar] [CrossRef]
  25. Sheikh, S.; Gokhale, N.; Thatt, V.; Gandhi, N.; Deshmukh, B.; Aghav, Y.; Kumar, M.; Nandgaonkar, M.; Babu, M. Efficient Approach for Optimization of Piston Bowl Shape, Compression Ratio and EGR for DI Diesel Engine; SAE Technical Paper 2011-24-0013; SAE: Warrendale, PA, USA, 2011. [Google Scholar] [CrossRef]
  26. Gelner, A.; Höß, R.; Zepf, A.; Wachtmeister, G. Engine Operation Strategies for the Alternative Diesel Fuel Oxymethylene Ether (OME): Evaluation Based on Injection Rate Analyzer and 0D-/1D-Simulation; SAE Technical Paper 2021-01-1190; SAE: Warrendale, PA, USA, 2021. [Google Scholar] [CrossRef]
  27. Wang, B.-L.; Lee, C.-W.; Reitz, R.D.; Miles, P.C.; Han, Z. A generalized renormalization group turbulence model and its application to a light-duty diesel engine operating in a low-temperature combustion regime. Int. J. Engine Res. 2013, 14, 279–292. [Google Scholar] [CrossRef]
  28. Perini, F.; Zha, K.; Busch, S.; Reitz, R. Comparison of Linear, Non-Linear and Generalized RNG-Based k-epsilon Models for Turbulent Diesel Engine Flows. In SAE Technical Paper Series; SAE: Warrendale, PA, USA, 2017. [Google Scholar]
  29. Schmidt, D.P.; Rutland, C.J. A New Droplet Collision Algorithm. J. Comput. Phys. 2000, 164, 62–80. [Google Scholar] [CrossRef]
  30. Reitz, R.D.; Beale, J.C. Modeling Spray Atomization with the Kelvin-Helmholtz/Rayleigh-Taylor Hybrid Model. At. Sprays 1999, 9, 623–650. [Google Scholar] [CrossRef]
  31. Convergent Science. CONVERGE 3.0 Manual; Convergent Science: Madison, WI, USA, 2020. [Google Scholar]
  32. Convergent Science. Session05-Initialization; Convergent Science: Madison, WI, USA, 2020. [Google Scholar]
  33. Kim, C.G.; Bae, C.S.; Choi, S.M. Importance of inter-ring crevice volume as a source of unburned hydrocarbon emissions-numerical considerations. Proc. Inst. Mech. Eng. Part D J. Automob. Eng. 2000, 214, 395–403. [Google Scholar] [CrossRef]
  34. Miles, P.C.; Andersson, Ö. A review of design considerations for light-duty diesel combustion systems. Int. J. Engine Res. 2016, 17, 6–15. [Google Scholar] [CrossRef]
  35. Gaukel, K.; Dworschak, P.; Pélerin, D.; Härtl, M.; Wachtmeister, G. Combustion process optimization for oxymethylene ether fuels in a heavy-duty application. In Internationaler Motorenkongress; Liebl, J., Beidl, C., Maus, W., Eds.; Springer Fachmedien Wiesbaden: Wiesbaden, Germany, 2019; pp. 351–367. [Google Scholar]
  36. Kim, Y.; Park, C.; Kim, J.; Min, B. The Effect of Low Temperature EGR and Low Compression Ratio on NOx Reduction for EU6 Diesel Engine. In SAE Technical Paper Series; SAE: Warrendale, PA, USA, 2013. [Google Scholar]
  37. Ramalingam, S.; Chinnaia, P.; Rajendran, S. Influence of Compression Ratio on the Performance and Emission Characteristics of Annona Methyl Ester Operated DI Diesel Engine. Adv. Mech. Eng. 2014, 6, 832470. [Google Scholar] [CrossRef]
  38. Datta, A.; Mandal, B.K. Effect of compression ratio on the performance, combustion and emission from a diesel engine using palm biodiesel. In AIP Conference Proceedings; AIP Publishing LLC: Long Island, NY, USA, 2016. [Google Scholar]
  39. Hatz, R.; Zhou, H.; Diez, C.; Wachtmeister, G.; Jaensch, M. Investigation and Comparison of the Prediction Capabilities of Multiple 0D/1D Combustion Calibration Strategies Using Different Turbocharger Systems as Calibration Basis; SAE Technical Paper 2022-01-0378; SAE: Warrendale, PA, USA, 2022. [Google Scholar] [CrossRef]
  40. Reşitoğlu, İ.A.; Altinişik, K.; Keskin, A. The pollutant emissions from diesel-engine vehicles and exhaust aftertreatment systems. Clean Technol. Environ. Policy 2015, 17, 15–27. [Google Scholar] [CrossRef] [Green Version]
Figure 1. Schematic layout of the engine test bench.
Energies 15 04674 g001
Figure 2. Pressure curve comparison CFD and measurement: (top left) 1200 rpm and 189 Nm; (top right) 2800 rpm and 189 Nm; (bottom left) 1200 rpm and 95 Nm; (bottom right) 2800 rpm and 95 Nm.
Energies 15 04674 g002
Figure 3. Pressure-curve comparison CFD and measurement: reference operating point at 1300 rpm and 401 Nm gross torque.
Energies 15 04674 g003
Figure 4. Eight new piston-bowl profiles compared to series geometry.
Energies 15 04674 g004
Figure 5. Lateral-vortex system during injection for series and V5: velocity including vectors in sectional plane. (top) 10 °CA after SOI; (bottom) 18 °CA after SOI.
Energies 15 04674 g005
Figure 6. Comparison of torque and emissions for geometry variation. (left) Torque as deviation from series geometry; (right) specific emissions normalized with respect to series geometry.
Energies 15 04674 g006
Figure 7. Piston-position comparison for compression-ratio variation.
Energies 15 04674 g007
Figure 8. Compression-ratio-variation results. (top) Pressure curve; (bottom) temperature curve.
Energies 15 04674 g008
Figure 9. Comparison of different emissions for compression-ratio-reduction methods. (M1) Head-piston distance increase; (M2) fire-bar length increase. Normalized with respect to CR 17.5.
Energies 15 04674 g009
Figure 10. Spray directions for injector position and spray-angle variation at CR 14.5.
Energies 15 04674 g010
Figure 11. Comparison of peak mean in-cylinder temperature for injector position and spray-angle variation. Normalized with CR 17.5.
Energies 15 04674 g011
Figure 12. Injector position variation: temperature in sectional plane. (top) At 14 °CA; (bottom) at 18 °CA. Compression ratio: 14.5.
Energies 15 04674 g012
Figure 13. Comparison of different emissions for injector position and spray-angle variation. Normalized with respect to CR 17.5.
Energies 15 04674 g013
Figure 14. Comparison of different emissions for increased fuel-mass-injection methods. Normalized with respect to CR 17.5.
Energies 15 04674 g014
Figure 15. Comparison of different emissions for multiple compression ratios and geometries. Normalized with respect to CR 17.5.
Energies 15 04674 g015
Figure 16. Piston bowl V8 for two compression ratios: equivalence ratio in sectional plane at 16 °CA. (left) CR 14.5; (right) CR 16.0.
Energies 15 04674 g016
Table 1. Parameters of the test engine.
Number/layout of cylinders4-stroke inline 4-cylinder
Displaced volume1985 cm3
Stroke88
Bore84
Compression ratioStandard: 17.5:1/Variations: 16:1 and 14.5:1
Number of valves per cylinder2
Chargeexhaust-gas-wastegate turbocharger with
charge-air cooling + eBooster (two stage)
Exhaust-gas recirculationCooled high-pressure
Injection systemBosch direct-inj. common rail (max. 1800 bar)
Injector actuationmagnetic
Injector-hole diameter0.118 mm
Injector holes7
Injector-spray angle77°
Table 2. Mesh settings of the simulation.
NameMesh SizeSub-Grid ScaleTiming
Base Size1.25 mm-Whole cycle
Velocity AMR0.625 mm1.5Whole cycle
Spray FE0.3125 mm-SOI—2 °CA after end of injection
Velocity AMR0.3125 mm0.5SOI—2 °CA after end of injection
Temperature AMR0.3125 mm2.5SOI—60 °CA after SOI
Temperature AMR0.625 mm2.560 °CA after SOI—90 °CA after SOI
Table 3. Torque and specific emissions of simulated operating point.
Gross Torque in NmSpecific NOx Emissions in g/kWhSpecific CO Emissions in g/kWhSpecific UHC Emissions in g/kWh
401.65.50.0850.009
Table 4. Performance comparison for methods of increased fuel-mass injection.
Compression RatioMass-Increase MethodFuel Mass in mgGross Torque in NmSpec. Fuel Consumption in g/kWh
17.5-71401.6203.7
16.0Higher Rail Pressure75.5422.4204.8
Bigger Injector-Hole Diameter76427.0204.0
Longer Injection77429.5205.4
14.5Higher Rail Pressure80.5441.6208.9
Bigger Injector = Hole Diameter82.5455.1207.7
Longer Injection87474.3210.2
Table 5. Performance comparison for compression ratio and geometry combinations.
Compression RatioGeometryGross Torque in NmSpec. Fuel Consumption in g/kWh
17.5Series401.6203.7
16.0Series427.0204.0
V4427.7203.6
V6431.0202.0
V8429.1203.0
14.5Series455.1207.7
V4455.9207.4
V6460.8205.2
V8453.7205.3
Publisher’s Note: MDPI stays neutral with regard to jurisdictional claims in published maps and institutional affiliations.

