
The Impact of Climate Change on Primary Air Treatment Processes and Energy Demand in Air Conditioning Systems—A Case Study from Warsaw, Poland


Department of Air Conditioning, Heating, Gas Engineering and Air Protection, Wrocław University of Science and Technology, Norwida St. 4/6, 50-373 Wroclaw, Poland
*
Author to whom correspondence should be addressed.
Energies 2022, 15(1), 355; https://doi.org/10.3390/en15010355
Submission received: 10 November 2021
/
Revised: 24 December 2021
/
Accepted: 29 December 2021
/
Published: 4 January 2022
(This article belongs to the Special Issue Energy Saving and Zero-Energy Systems: Renewable Energy Technologies, Energy Efficiency, Circular Economy)
Abstract
:This article presents the impact of climate change on air treatment processes and energy demand in a selected air-conditioning system. The analysis was performed for a system supplying rooms with pre-treated primary air. Further treatment occurred directly in the rooms with individual devices such as fan coils or chilled beams. The analysis of the second stage of air treatment was not part of this study. The calculations were made for the city of Warsaw, where, according to the climate analysis for the period 1961–2020, an increase in outside temperature by 0.4 °C per decade and an increase in air humidity by 0.2 g/kg per decade were observed. The system analysis was divided into two stages. The first, including calculations made for monthly average climate data for the entire period of 1961–2020, shows changes in the energy demand of the system, resulting from progressive climate change. This analysis confirmed the general tendency of increasing demand for cooling energy and decreasing demand for heating energy, which is also observed in many other regions of the world. The second stage, based on calculations for hourly climate data in selected years, is an analysis of the operation of all elements of the system equipment. Research has identified areas that will have an increasing impact on the energy efficiency of the whole air condition system during further climate change.
1. Introduction
Climate change monitoring presents two major challenges for climatologists—distinguishing natural climate fluctuations from variability and anomalies of anthropogenic origin; and predicting scenarios for the future. For years, scientists have been publishing information about subsequent increases in temperature and the warmest years and decades. In 1999, M.E. Mann, R.S. Bradley and M.K. Hughes estimated that the decade of the 1990s was the warmest in the northern hemisphere in the last millennium, and 1998 was probably the warmest year [1]. However, the record did not last long. In the following years, more and more new information about the next highest air and ocean temperatures came [2,3,4,5,6,7]. According to the IPCC Climate Change 2021 report, each of the last four decades has been warmer than each of the decades since 1850. The global surface temperature in the first two decades of the 21st century was approx. 0.84–1.1 °C higher than in the years 1850–1900. In 2011–2020, this difference increased to 0.95–1.2 °C. A faster temperature rise was observed on land surface (1.34–1.83 °C), with a smaller rise on the surface of the oceans (0.68–1.01 °C). The likely range of the total human-caused global surface temperature increase from 1850–1900 to 2010–2019 is from 0.8 °C to 1.3 °C [8]. The period 1850–1900 is used as an approximation for pre-industrial conditions.
Progressive climate change is expected to have a significant impact on world life from decades to centuries. The need to counteract these changes, as one of the fundamental problems of the modern world, was included in The 2030 Agenda for Sustainable Development in 2015 [9]. It is a universal collection of 17 goals and 169 targets for people, the planet and prosperity. The need for humanity to respond is caused by the wide impact of climate change, not only on the natural environment, but on all areas of life.
The results of long-term monitoring studies suggest that the climate of the last few decades is anomalous compared to past climate changes, and that the latest climatic and atmospheric trends already have an impact on living organisms and their physiology, distribution and phenology of species. In agriculture, a change in the length of the growing seasons and changes in access to water have been observed, which affects the dates of plant sowing and determines the size of crops. The general tendency is the lengthening of the growing season; however, it depends to a large extent on the regions. For example, in Europe, the growing season has extended by 18–24 days per decade [10]. Plant species adapted to colder climates cope with high temperatures with more difficulty, and animals from warm areas expand their territory, threatening native species [11]. The increase in air temperature also affects the functioning and health of human organisms. Heat waves not only reduce the quality of life, but also reduce work efficiency, and are even responsible for increasing mortality [12,13,14,15,16].
Changing weather conditions also have a significant impact on the construction industry in almost all its sectors—building construction, architecture and technical equipment. Scientists from around the world are analyzing the impact of global warming on the structure of energy demand necessary to maintain comfortable and safe indoor conditions and the impact of these changes on the fuel and energy market. The aim is to identify threats and actions necessary to ensure energy security of countries, ensure access to sustainable energy and improve energy efficiency, and minimize the impact on human life and the environment, which are also the goals of the 2030 Agenda for Sustainable Development.
1.1. Global Research
Research results from many regions of the world indicate a global trend related to the increasing cooling needs of facilities. This applies to both commercial and residential buildings. The latter are subject to many analyses; as ventilated to a large extent in a natural way, they show difficulties in adapting to changing, sometimes extreme, external conditions. Therefore, a large part of the publication contains a discussion on the possibility of adapting residential buildings to climate change and the factors motivating the increase in the popularity of mechanical air exchange and the use of air conditioning devices in residential buildings [17,18,19].
1.1.1. Europe
Research by Barbosa, Vicente and Santos for Lisbon has assessed the vulnerability framework and methodology for assessing thermal comfort in existing traditional apartments in the context of climate change. As a result, a significant impact of insulating materials on lowering the internal temperature was demonstrated. It is the result of increasing the adaptability of objects, both in extreme situations and in the gradual changes of typical climatic conditions [20]. Another example of conclusions from European research are the expected increases in cooling demand in buildings located in Andalusia, described by Limones-Rodríguez, Marzo-Artigas, Pita-López and Díaz-Cuevas. The studies estimated that these changes will affect areas inhabited by 85–99% of the population to the greatest extent [21]. In turn, Oloschenk, Holsten and Kropp analyzed German housing construction, taking into account the rise in outside temperature, renovation measures and changes in human resources in their research. They showed that the strong reduction of the demand for heat energy in the German housing stock in the future will be accompanied by an increase in the demand for cooling energy. Accordingly, they predict an increase in the consumption of electricity, which is the main source of energy for cooling systems. They also pointed to the need for renovation of the existing facilities, which will translate into a reduction in the demand for heating energy [22]. An increase in cooling needs is also expected for Italy. However, in the simulations of 419 buildings located in four Italian cities (Milan, Florence, Rome, and Naples), a reduction in energy needs was finally achieved. The results show a much greater reduction in heating energy demand than an increase in cooling need [23]. Asimakopoulos, Santamouris, Farrou et al. prepared forecasts of energy demand in the construction sector in Greece. Using regional climate models up to 2100, they concluded that, during this period, the energy demand for heating the construction sector in Greece may drop by around 50%, while the corresponding energy demand for cooling may increase by 248%, with a more pronounced trend in the southern part of the country [24]. Hausl, Themessl and Gadocha also mentioned differences in the decreasing tendency of heating needs and the increasing cooling demand. They estimated that in Austria, by 2050, a decrease in heating needs by 7–15% is expected, while the expected increase in cooling needs may be up to 355% [25]. The next conclusions come from Ireland. There, based on the analysis of the periods 1981–2000 and 1961–1980, only a slight decrease in heat energy demand was observed. However, a clear trend of decreasing heating energy demand is expected by the end of this century, with longer averaging periods (40 years). Air conditioning is not a problem in the current climate of Ireland, but a low need in the summer may appear in the southeast of the country toward the end of this century [26]. Analyses for buildings located in Poland were carried out by Bazazzadeh, Pilechiha, Nadolny et al. The results for the ASHRAE reference buildings located in Poznan show that, compared to the statistical year 2004–2018, the average increase in cooling load and decrease in the heating load are respectively 135% and 40% by 2080. However, due to the higher share of heat load in Polish buildings, the total energy requirement for the research period was reduced. The authors point to the necessity to take actions aimed at controlling the increases in cooling demand [27].
1.1.2. Asia
Research for residential properties in Turkey showed an increase in cooling needs, while heating needs did not change significantly. In these studies, it was observed that a changing climate will reduce the overall energy needs of traditional buildings that have not been cooled. At the same time, it is expected that the deterioration of indoor comfort conditions related to climate warming will result in a decrease in the number of naturally ventilated buildings and an increase in the number of buildings equipped with air conditioning, which is synonymous with an increasing tendency in energy demand [28]. In China, the increase in electricity consumption resulting from the higher cooling needs of facilities located in Hong Kong was analyzed. It was observed that, in the period 1979–2008, the use of air conditioning tended to increase. The prepared forecasts of electricity consumption for cooling the buildings for the years 2009–2038, 2039–2068, 2069–2100 show a further increase respectively by 5.7%, 12.8% and 18.4% [29]. The research on energy demand for heating buildings in Tianjin (China) was carried out by Xang and Tian. They showed that the 10-year average of heat energy consumption in 2001–2010 decreased by 16.1% compared to the years 1961–1970. Further analyses indicate that when comparing the periods 1971–2010 and 2011–2050, a decrease of 10.2% can be expected. Referring to the period 2051–2100, this difference may amount to 22.7% [30].
1.1.3. USA and Canada
Wang and Chen simulated two types of residential buildings and seven types of commercial buildings located in 15 cities in the United States. They calculated the expected energy demand for heating and cooling until 2080 and determined that the energy demand of buildings located in warm and hot areas will increase and decrease in cold and very cold areas. In hot climates, the change in the energy consumption for cooling will be much greater than for heating energy, and in cold or very cold climates, the decrease in energy consumption for heating will largely exceed the increase in energy consumption for cooling [31]. In turn, Rosenthal and Gruenspecht [32] informed in their article that global warming by 1 °C would reduce projected US energy expenditure in 2010 by USD 5.5 billion, which contrasts with other studies, including earlier studies researched, e.g., by Smith and Tirpak [33]. Rosenthal and Gruenspecht calculated that assuming no correction to the expected indoor temperature, global warming would reduce projected national energy expenditure for air conditioning. According to them, the reduction of the overall air conditioning costs for rooms reflects the fact that the United States is a cold country from an air conditioning perspective. Jafarpur and Berardi investigated the impact of climate change on the energy needs of buildings in Canada. Their publications prove that buildings located in Toronto respond to changing external conditions with less heating needs and higher cooling needs. In the simulations of 16 building prototypes, they achieved an average decrease in heating energy consumption by 18–33% and an average increase in cooling energy consumption by 15–126% by 2070 [34,35].
1.1.4. Brazil and Australia
The research on heating and cooling energy demand for a residential building located in three Brazilian cities was carried out by Invidiata and Ghisi. Analyses showed an increase in annual energy demand by 112–185% in 2080. In the coldest city, the annual demand for thermal energy decreased by 94% in 2080 due to an increase in average temperature and global solar radiation. The analyses also took into account the issue of indoor comfort. The results show that during the observation period, the discomfort in the rooms will increase by 106–219% depending on the location. The authors also pointed out that a passive design strategy could be a way to reduce up to 50% the future annual cooling and heating energy demands of homes in Brazil [36]. In another part of the world, Wang, Chen and Ren studied and demonstrated the major impact of climate change on heating and cooling energy needs in Australia’s five regional climates. In hot or warm climates (e.g., Darwin and Alice Springs) or temperate climates (e.g., Sydney), the increase in energy demand for cooling is much greater than the decrease in energy demand for heating, resulting in a significant increase in total annual energy demand. For a modern 5-star house, the total annual energy demand can rise to 112–350% by 2100 depending on the adopted emission scenario. Buildings located in a relatively cool climate (e.g., Hobart) show a reduction in heating energy demand, which may result in a 48% drop in annual energy demand for a 5-star house by 2100. The authors also found that smaller changes in energy demand may occur in the case of energy-efficient houses or houses with a higher energy standard [37].
1.1.5. Summary of Global Review
The listed examples show a global trend of increasing cooling energy demand and reducing heating energy demand. The final energy balance is difficult to clearly define as it largely depends on the location of the buildings. From a local perspective, in colder climates with a dominant share of heating energy demand, warming of the climate brings energy benefits. In these regions, the observed increase in demand for cooling energy does not exceed significant decreases in demand for heating energy. The opposite situation is observed in warm and hot regions, where heating systems are not dominant in the energy balance of buildings. In these regions, the observed decreases in demand for heating energy are not able to compensate for the significant increases in cooling demand.
1.2. Main Research Question
Extensive research assesses the overall changes in energy demand, showing the modification of the structures of demand for heating and cooling energy in buildings. However, the conclusions cannot be directly transferred to the systems of technical equipment that generate and deliver this energy to the interiors. This situation applies especially to systems, the operation of which is not directly related to the energy balance of the rooms. An example of such a solution is the primary air distribution system, cooperating with second stage devices, e.g., fan coils or chilled beams.
The main question that has become the foundation of the research is: What is the impact of climate change on the operation of air treatment systems? In the first step, answering this question requires determining how the changes in the parameters of the outside air affect the amount of usable energy required to obtain the final parameters of the supplied air. Due to the multitude of technical solutions used in ventilation and air conditioning systems and the number of possible assumptions made by designers, a clear general assessment of the impact of global warming on these systems is excluded. Therefore, this study is only a research chapter, and the answer to the question asked requires an analysis of many cases and the answers to many more questions.
2. Materials and Methods
2.1. Climate of Poland
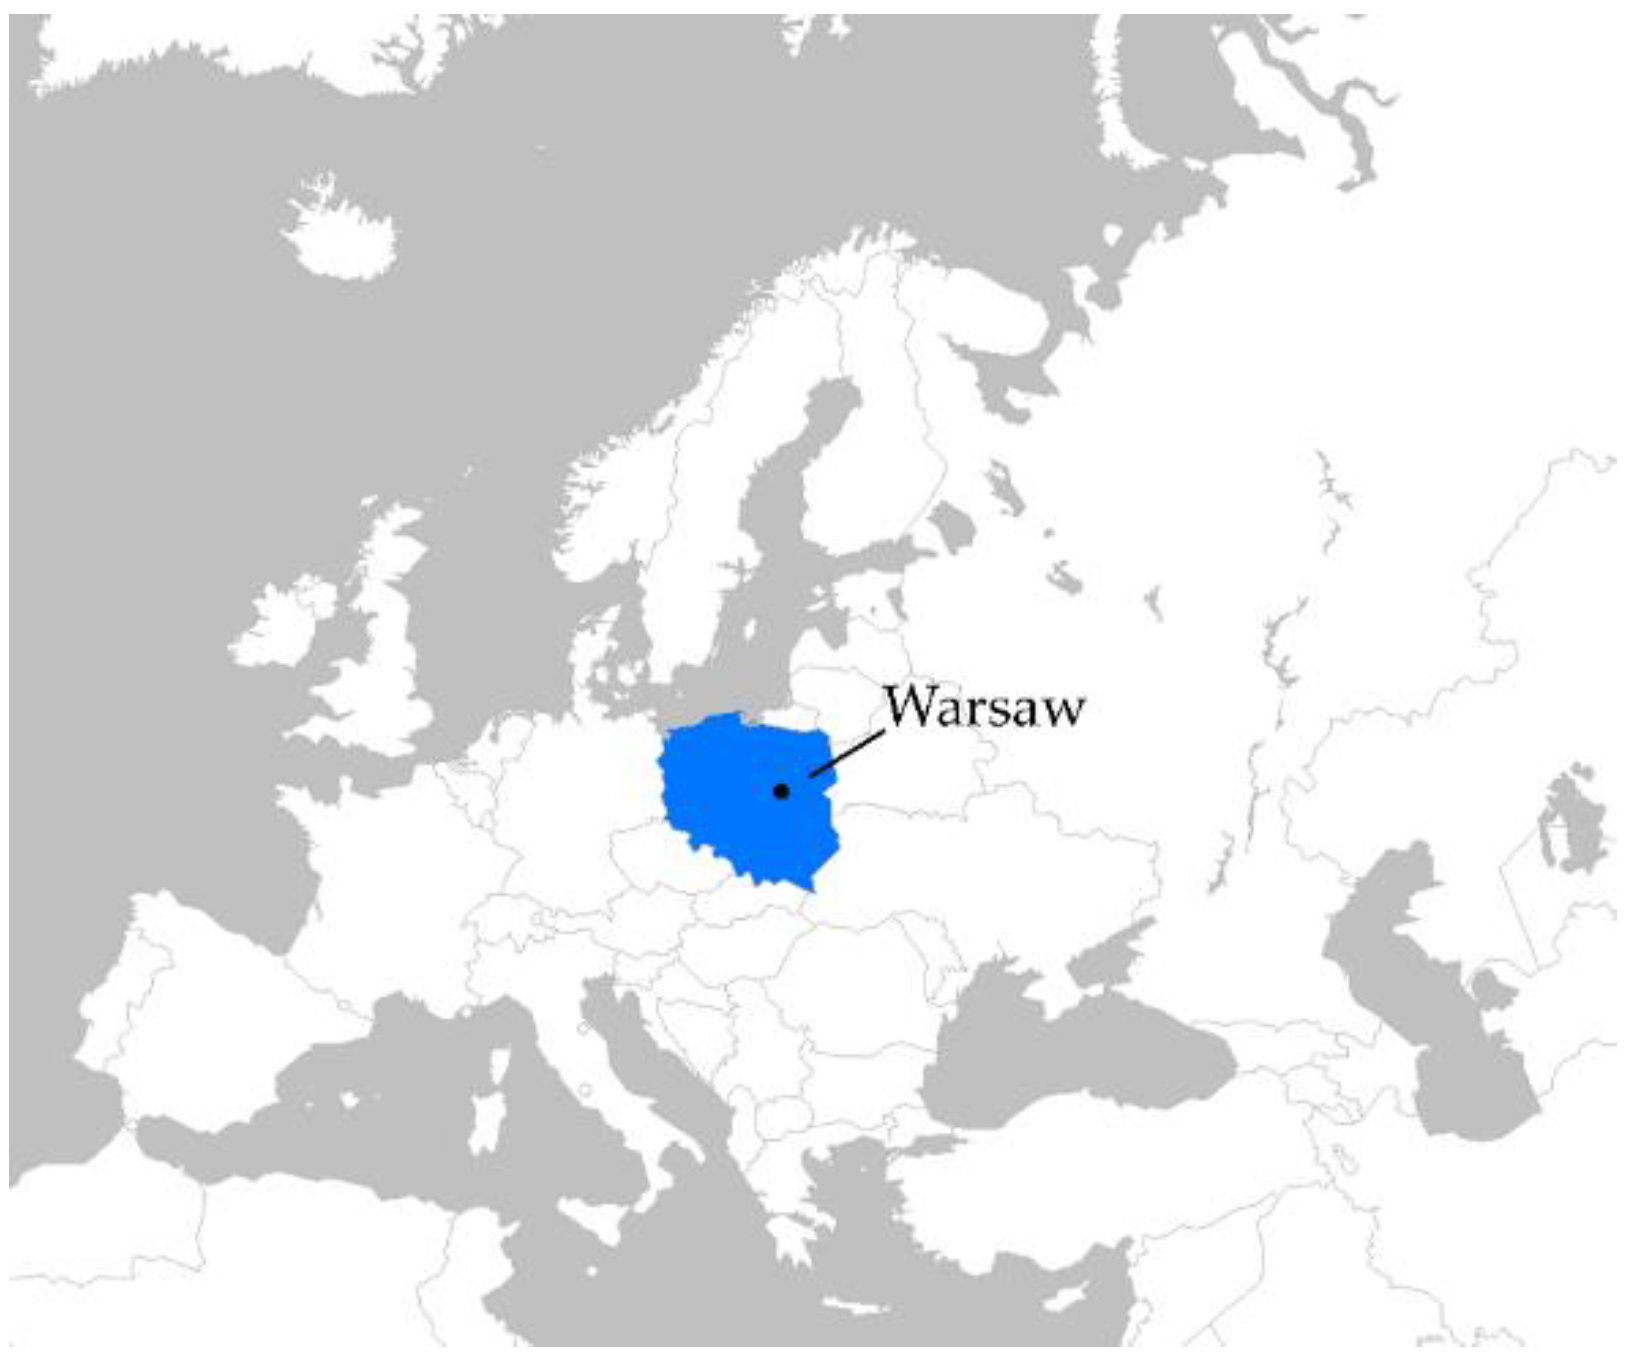
Poland is a large country in Central Europe (Figure 1), with a total area of 312,705 km2 [38]. It extends from 14°07′ E to 24°09′ E and from 49° N to 54°50′ N. The capital city is Warsaw, located in the central part of the country. The population is 38,265,000, of which less than 2 million are residents of the capital. In terms of area, it is the 69th country in the world, while in terms of population it is in the 36th position. Poland is located in the moderate climate zone, in the transitional area between temperate oceanic climate on the west, a temperate continental on the east.
The climate in Poland is shaped by two main air masses:
- −
- polar marine, occurring about 60% of the year, responsible for a mild and foggy winter and a cloudy and humid summer;
- −
- polar continental, occurring about 30% of the year, causing cold winter and heat waves in summer.
Most winds blow in this area from the west (30–35% of the year), less often from the south (20–25% of the year), and the least frequent from the east and north 15–20% [38]. The average outside air temperature is above 8 °C, and the wind speed is 3–4 m/s [38].
Poland is not the country most endangered by progressive climate change. The observed temperature increases do not reach such high values as, for example, in the Mediterranean countries. In fact, some of the prospective changes in the climate would be partially favorable (e.g., for agriculture). However, extreme weather phenomena are becoming more and more severe, and the probability of their occurrence is increasing [39].
To analyze the climate in Poland, archival meteorological data for the city of Warsaw from the period 1961–2020, provided by the Institute of Meteorology and Water Management [40], were used. Table 1, Table 2 and Table 3 show the monthly average temperatures, relative humidity and air humidity in the selected location.
The observed increase in the average annual outside temperature is approx. 0.4 °C per decade. Considering only the cold months (December–February) and warm months (June–August), these increases are slightly higher and amount to approx. 0.5 °C per decade. When analyzing the other graphs showing the average relative humidity and the moisture content, it can be seen that the average relative humidity did not change significantly in the period under consideration. However, a gradual increase in the moisture content is observed, reaching about 0.2 g/kg per decade, which is particularly important from the point of view of the operation of air-conditioning devices, as it increases the energy consumption of their work. This is due to additional energy that must be supplied to the system for the condensation of moisture from the air.
Based on the analysis of seasonal data (3 winter months XII–II and 3 summer months VI–VIII) and annual average (last column I–XII), the following characteristic years were selected:
- −
- minimum annual average temperature + 7 °C in 1965 and 1980, left should be 4.6;
- −
- maximum annual average temperature + 11 °C in 2019;
- −
- minimum temperature in winter in the season 1962/1963 with a temperature of −8 °C and 1969/1970 with a temperature of approx. −6.5 °C;
- −
- maximum temperature in winter in season 2019/2020 with a temperature of approx. 3.5 °C;
- −
- minimum temperature in summer 1962, 1965, 1974, 1978 and 1980 with a temperature of about 16.5 °C;
- −
- maximum temperature in summer 2019 at 21 °C.
After considering the availability of detailed data, the following years were analyzed:
- −
- 1969 as the year with the coldest winter (hourly data in 1962 not available—measurements were made every 6 h);
- −
- 1980 as the year with the lowest annual average temperature and the coldest summer;
- −
- 2019 as the year with the highest annual average temperature, the warmest in summer and the warmest in winter.
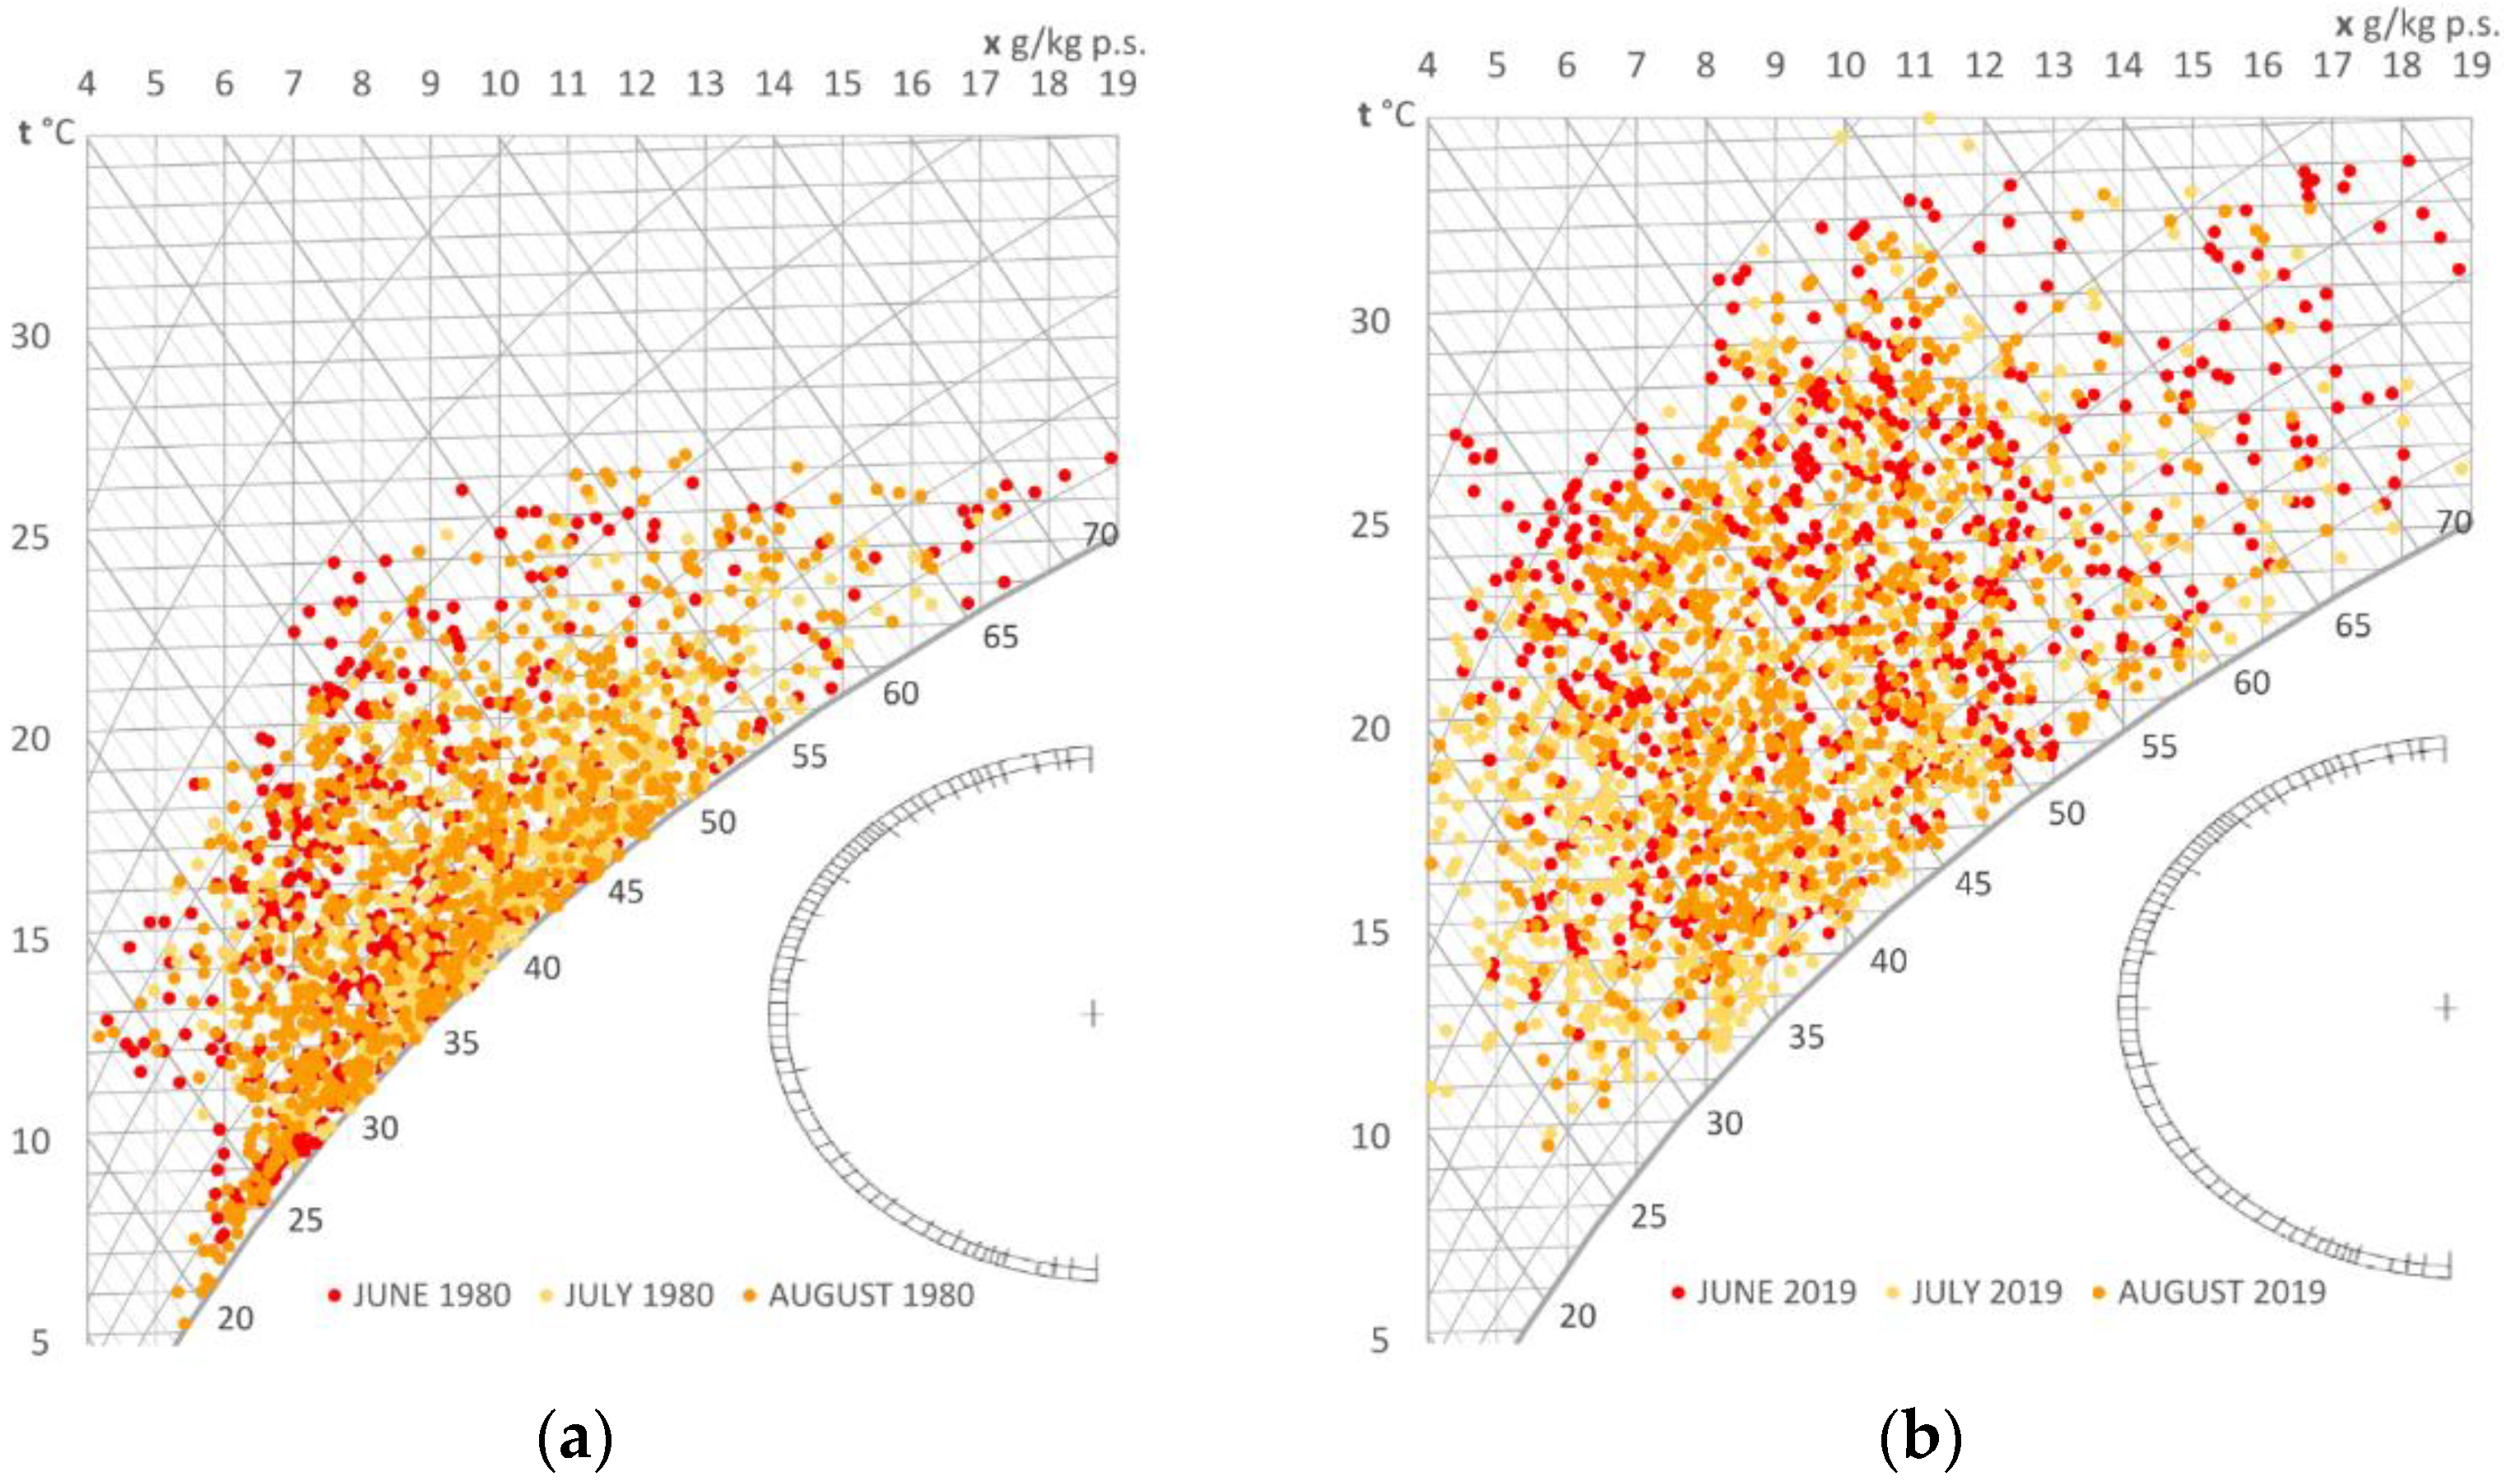
Figure 2 shows the Mollier diagram with seasonal air parameters (VI–VIII) for the coldest (1980) and warmest (2019) summer. The average summer temperature in 1980 was only about 16.5 °C, while in 2019 it was as much as 21 °C. The average relative humidity was approx. 80% in 1980 and 62% in 2019. The average moisture content in these years did not differ significantly, and in both cases, it was approx. 9.5 g/kg.
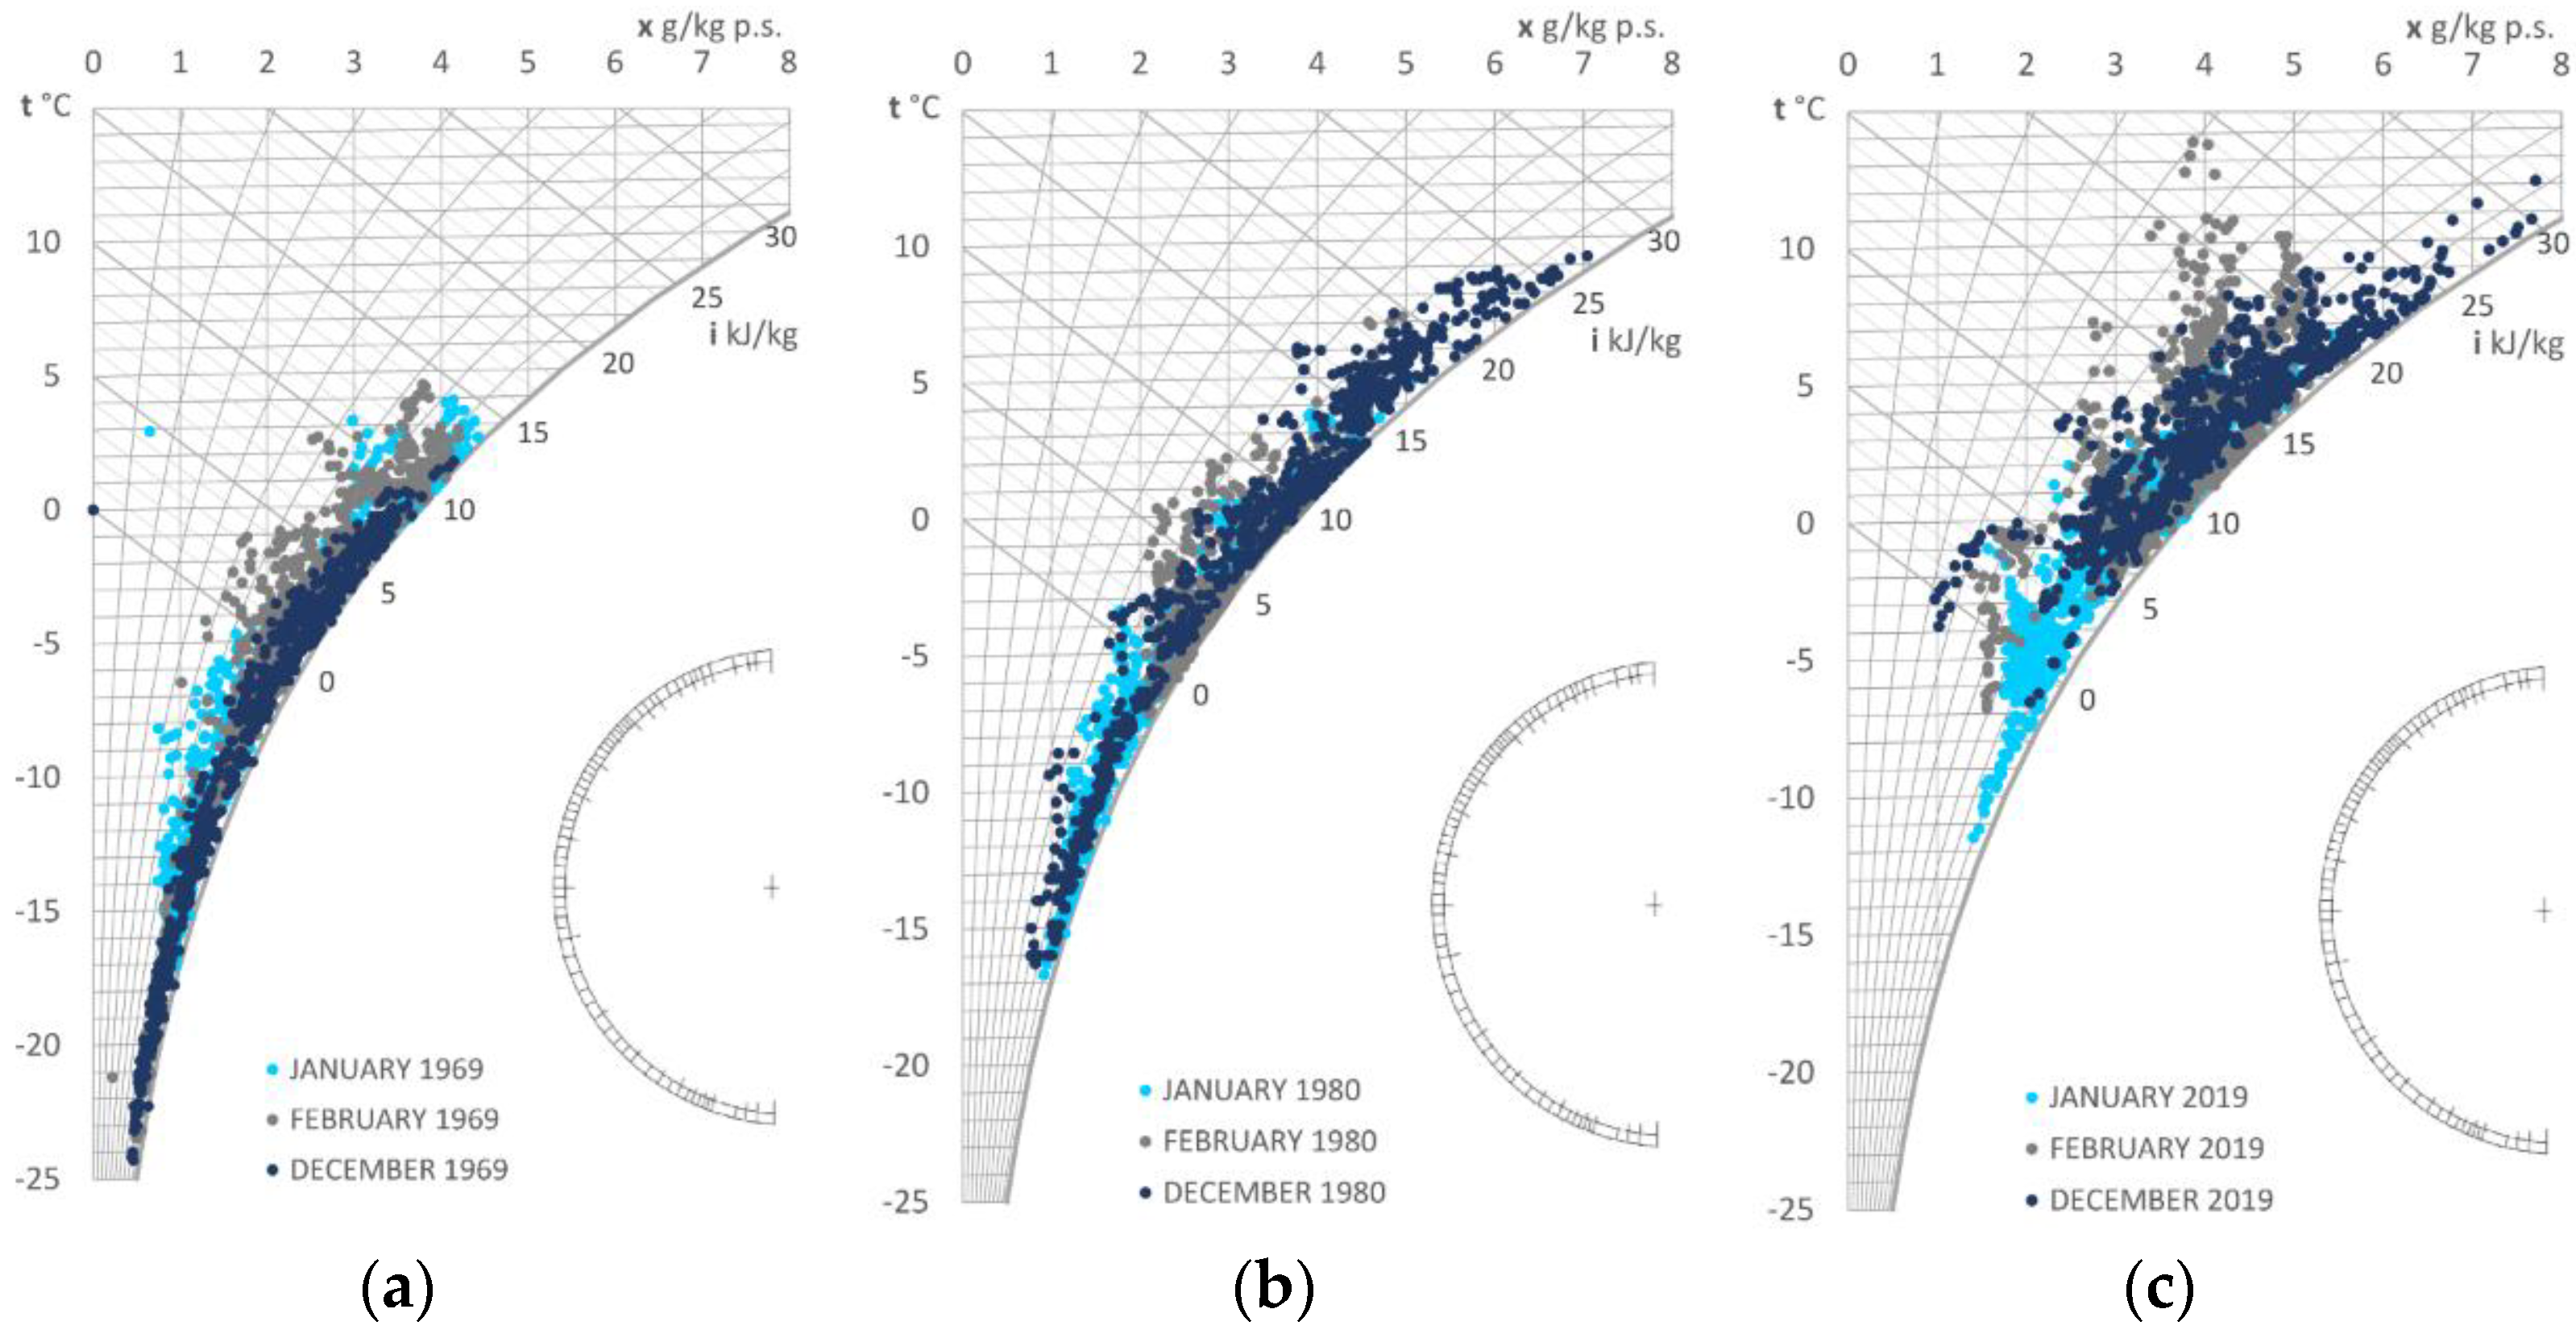
Figure 3 shows the change of air parameters in the winter (in months XII, I, II) in all three selected characteristic years. The increase in parameter area in the further periods is clearly visible. The average seasonal temperatures in 1969, 1980 and 2019 were respectively −6.1, −2.3 and 1.8 °C. However, the average relative humidity did not change significantly and amounted to 83%, 85% and 83%. More distinct differences are observed for the moisture content in the air, which increased in the following years and amounted to an average of 2.0, 2.8 and 3.6 g/kg.
The observed differences in the parameters of the external air translate measurably into the work of air treatment systems. The increase in temperature and moisture content in summer periods increases the energy necessary for cooling and drying the air. However, the increase in temperature and moisture content in winter contributes to reducing the energy for heating and humidifying the air. Thus, climate change has a positive effect on some of the energy needs of the systems, while in other places, it becomes a source of additional needs. The total energy balance of air systems is closely related to their configuration, and the results vary significantly depending on the assumptions made by the designers for the automatic control system.
2.2. Subject of Study
2.2.1. Air Treatment System
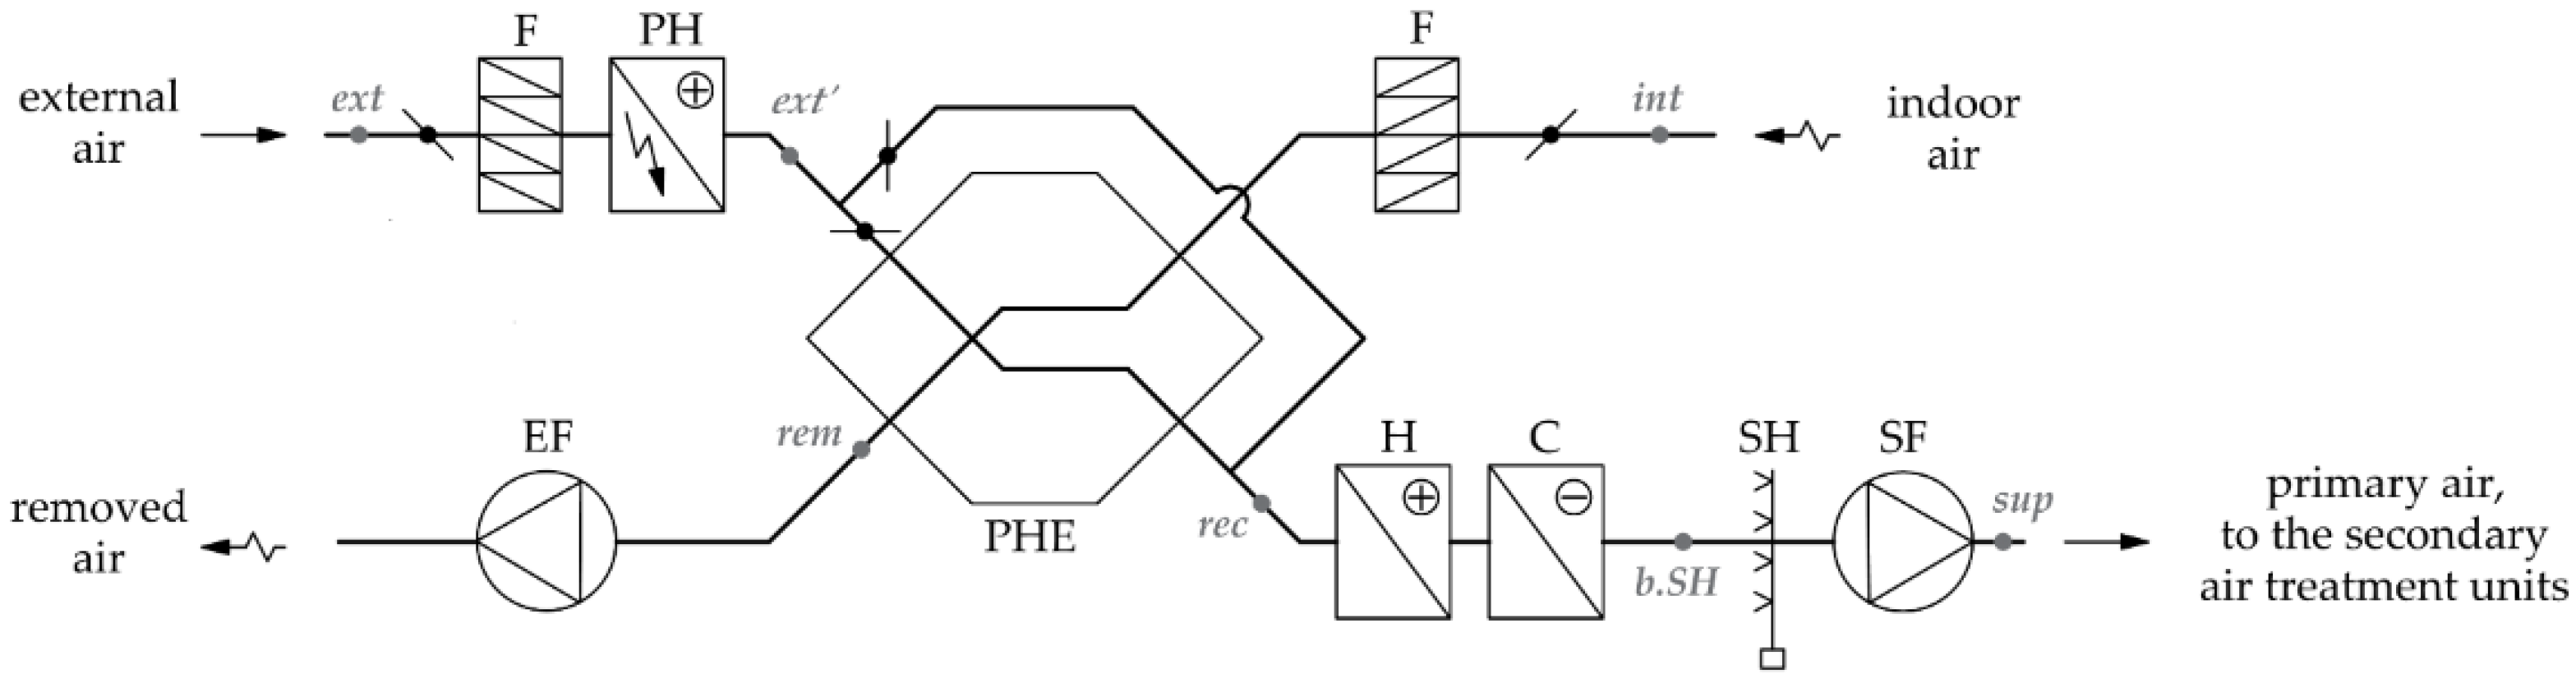
The established air conditioning system is commonly found in buildings of various purposes. It can be used in commercial, office, educational, hotel and many other facilities, therefore the presented analysis carries a universal information, valid for a large group of buildings. In this solution, the pre-treated primary air is directed to the rooms where the secondary air is treated (circulating air or a mixture of circulating and primary air), strictly adapted to the current needs of each interior. The change of the heat balance in the room does not affect the preparation of the primary air, and the heat gains are assimilated/heat losses are covered by the devices of the second stage of treatment—individual indoor devices. These devices can be: fan coil units, air conditioners, mini heat pumps, chilled beams, etc. The analysis of the energy needs of buildings mentioned in the Section 1.1 provides answers to the questions of what the internal need of rooms is; thus, it focuses largely on the energy coming from second-stage air treatment devices, without focusing on the assumptions of the system and its installation details. The considered configuration of the air treatment system is shown in Figure 4, and the basic assumptions are presented in Table 4.
2.2.2. Method
The analyses were made on the basis of monthly and hourly climatic data for Warsaw from 1961–2020, provided by the Institute of Meteorology and Water Management [40]. Detailed calculations were based on an original template that uses basic mathematical relationships to illustrate thermodynamic changes in humid air. The template takes into account all air treatment processes taking place in the air handling unit (heating, dry cooling and cooling with condensation, humidification, anti-freeze protection, regulation of heat recovery efficiency) and allows to calculate parameters before and after all devices. The process of air heating during the flow through the fans was omitted, as this value is insignificant in modern, effective devices. Detailed assumptions of the supplied air parameters are presented in Table 5. As a result of the calculations, information on the annual usable energy demand for heating, cooling and humidification was obtained. The calculations do not include the efficiency of energy production, accumulation and its distribution. The basic relationships used for the calculations are presented below in the form of Equations (1)–(16).
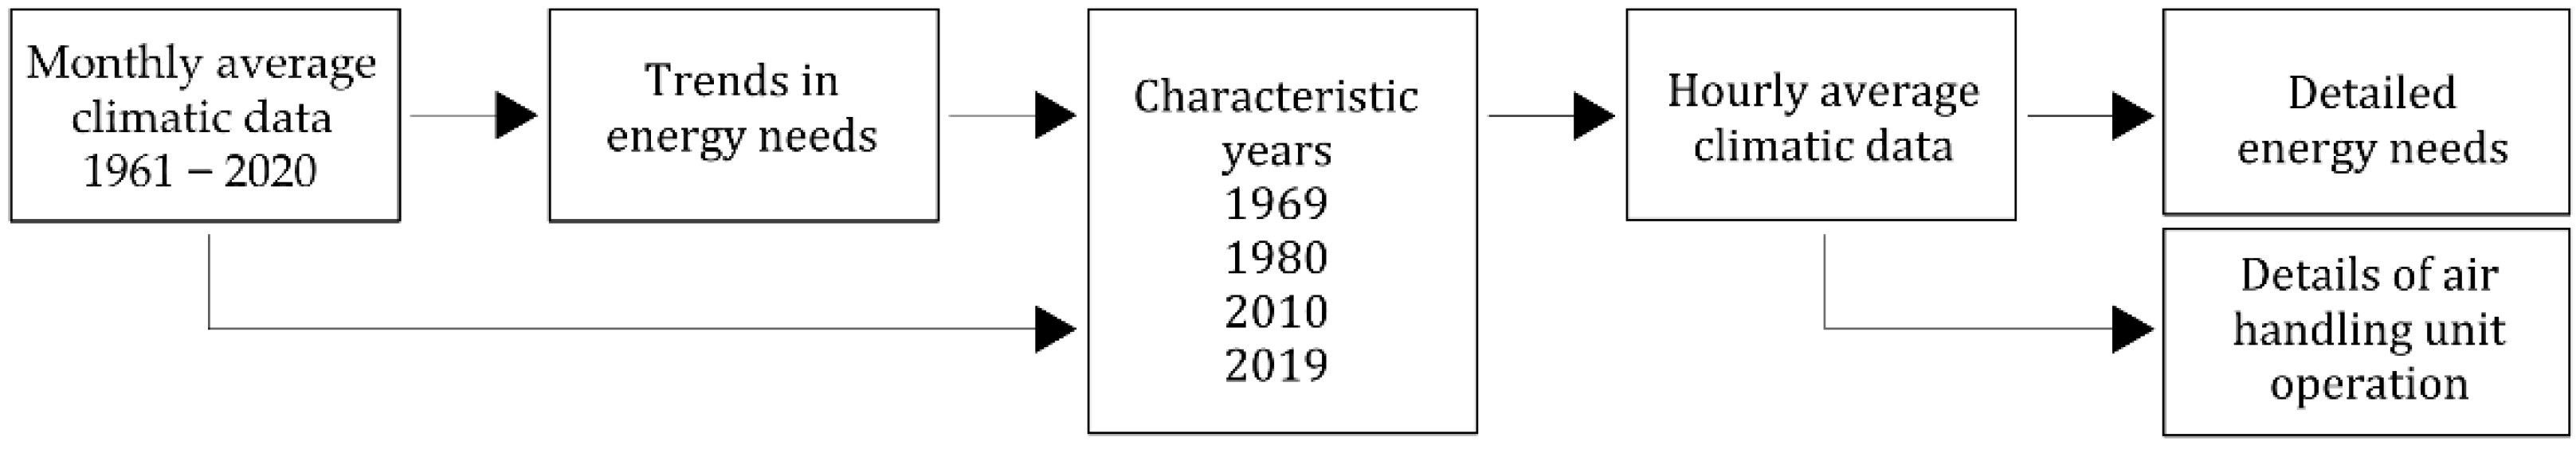
In order to illustrate trends in system energy demand, analyses were made based on the average monthly climate data for all years in the range 1961–2020. These results show the general energy changes taking place in the system under the influence of progressive climate change. However, they are not enough to observe the operation of individual devices. For this reason, based on the preliminary energy results and on the basis of meteorological data, characteristics years were selected. They were subjected to a detailed, hourly analysis. Based on these calculations, more precise information on the energy needs of the devices and their operational details was obtained. Due to the large averaging period, monthly results do not provide information such as exchanger powers, operation time of the anti-freeze protection, reduction of the heat recovery process, number of operating hours of devices, cooling with and without condensation. The scheme of the procedure is presented in Figure 5.
Calculations of Air Parameters
Air density [45]:
where to calculate the partial pressure of water vapor Pa, the definition of relative humidity was used:
Saturation vapor pressure of water [46]:
Air enthalpy for 0 ≤ x ≤ xs [45]:
which in terms of parameters typical for ventilation systems allows for simplification:
Calculation of Heat Exchanger Capacity and Energy Demand
After calculating the parameters of the air entering and leaving all the AHU equipment, it was possible to determine the capacity and annual energy demand of individual heat exchangers. Energy demand is expressed in the capacity of a given device over a certain period of time. For the calculations made in a monthly step, the average capacity of the device was multiplied by the number of hours of its operation per month. The energy demand in the calculation in an hourly step is the sum of the calculated capacities. Calculation of the annual energy demand of a given exchanger was calculated as:
The capacity of each heat exchanger and devices was calculated using Equations (10)–(14). The results for the heat recovery exchanger obtained (12) may have a different sign depending on whether it recovers heating or cooling energy. Values QPHE > 0 mean recovered heating energy and QPHE < 0 cooling energy. The summed absolute values represent the total amount of energy recovered in the exchanger. The calculations of QPHE additionally required the calculation of the supplied air temperature after the heat recovery process trec, with the additional assumption that the preheater prevents its freezing by keeping the minimum temperature trem = 0 °C (Table 5). For the assumed heat recovery efficiency η = 73%, the protection is activated when text ≤ −7.4 °C, which results from the equation of the heat energy exchange efficiency on the exhaust air side with balanced air flows (15). The value of −7.4 °C is also the minimum text′ value of the air entering the heat recovery exchanger. The heat exchange efficiency on the supply air side is presented in the Equation (16).
| Preheater | (10) | |
| Heater | (11) | |
| Plate heat exchanger | (12) | |
| Cooler | (13) | |
| Steam humidifier | (14) | |
| (15) | ||
| (16) | ||
2.3. Monthly Analyses
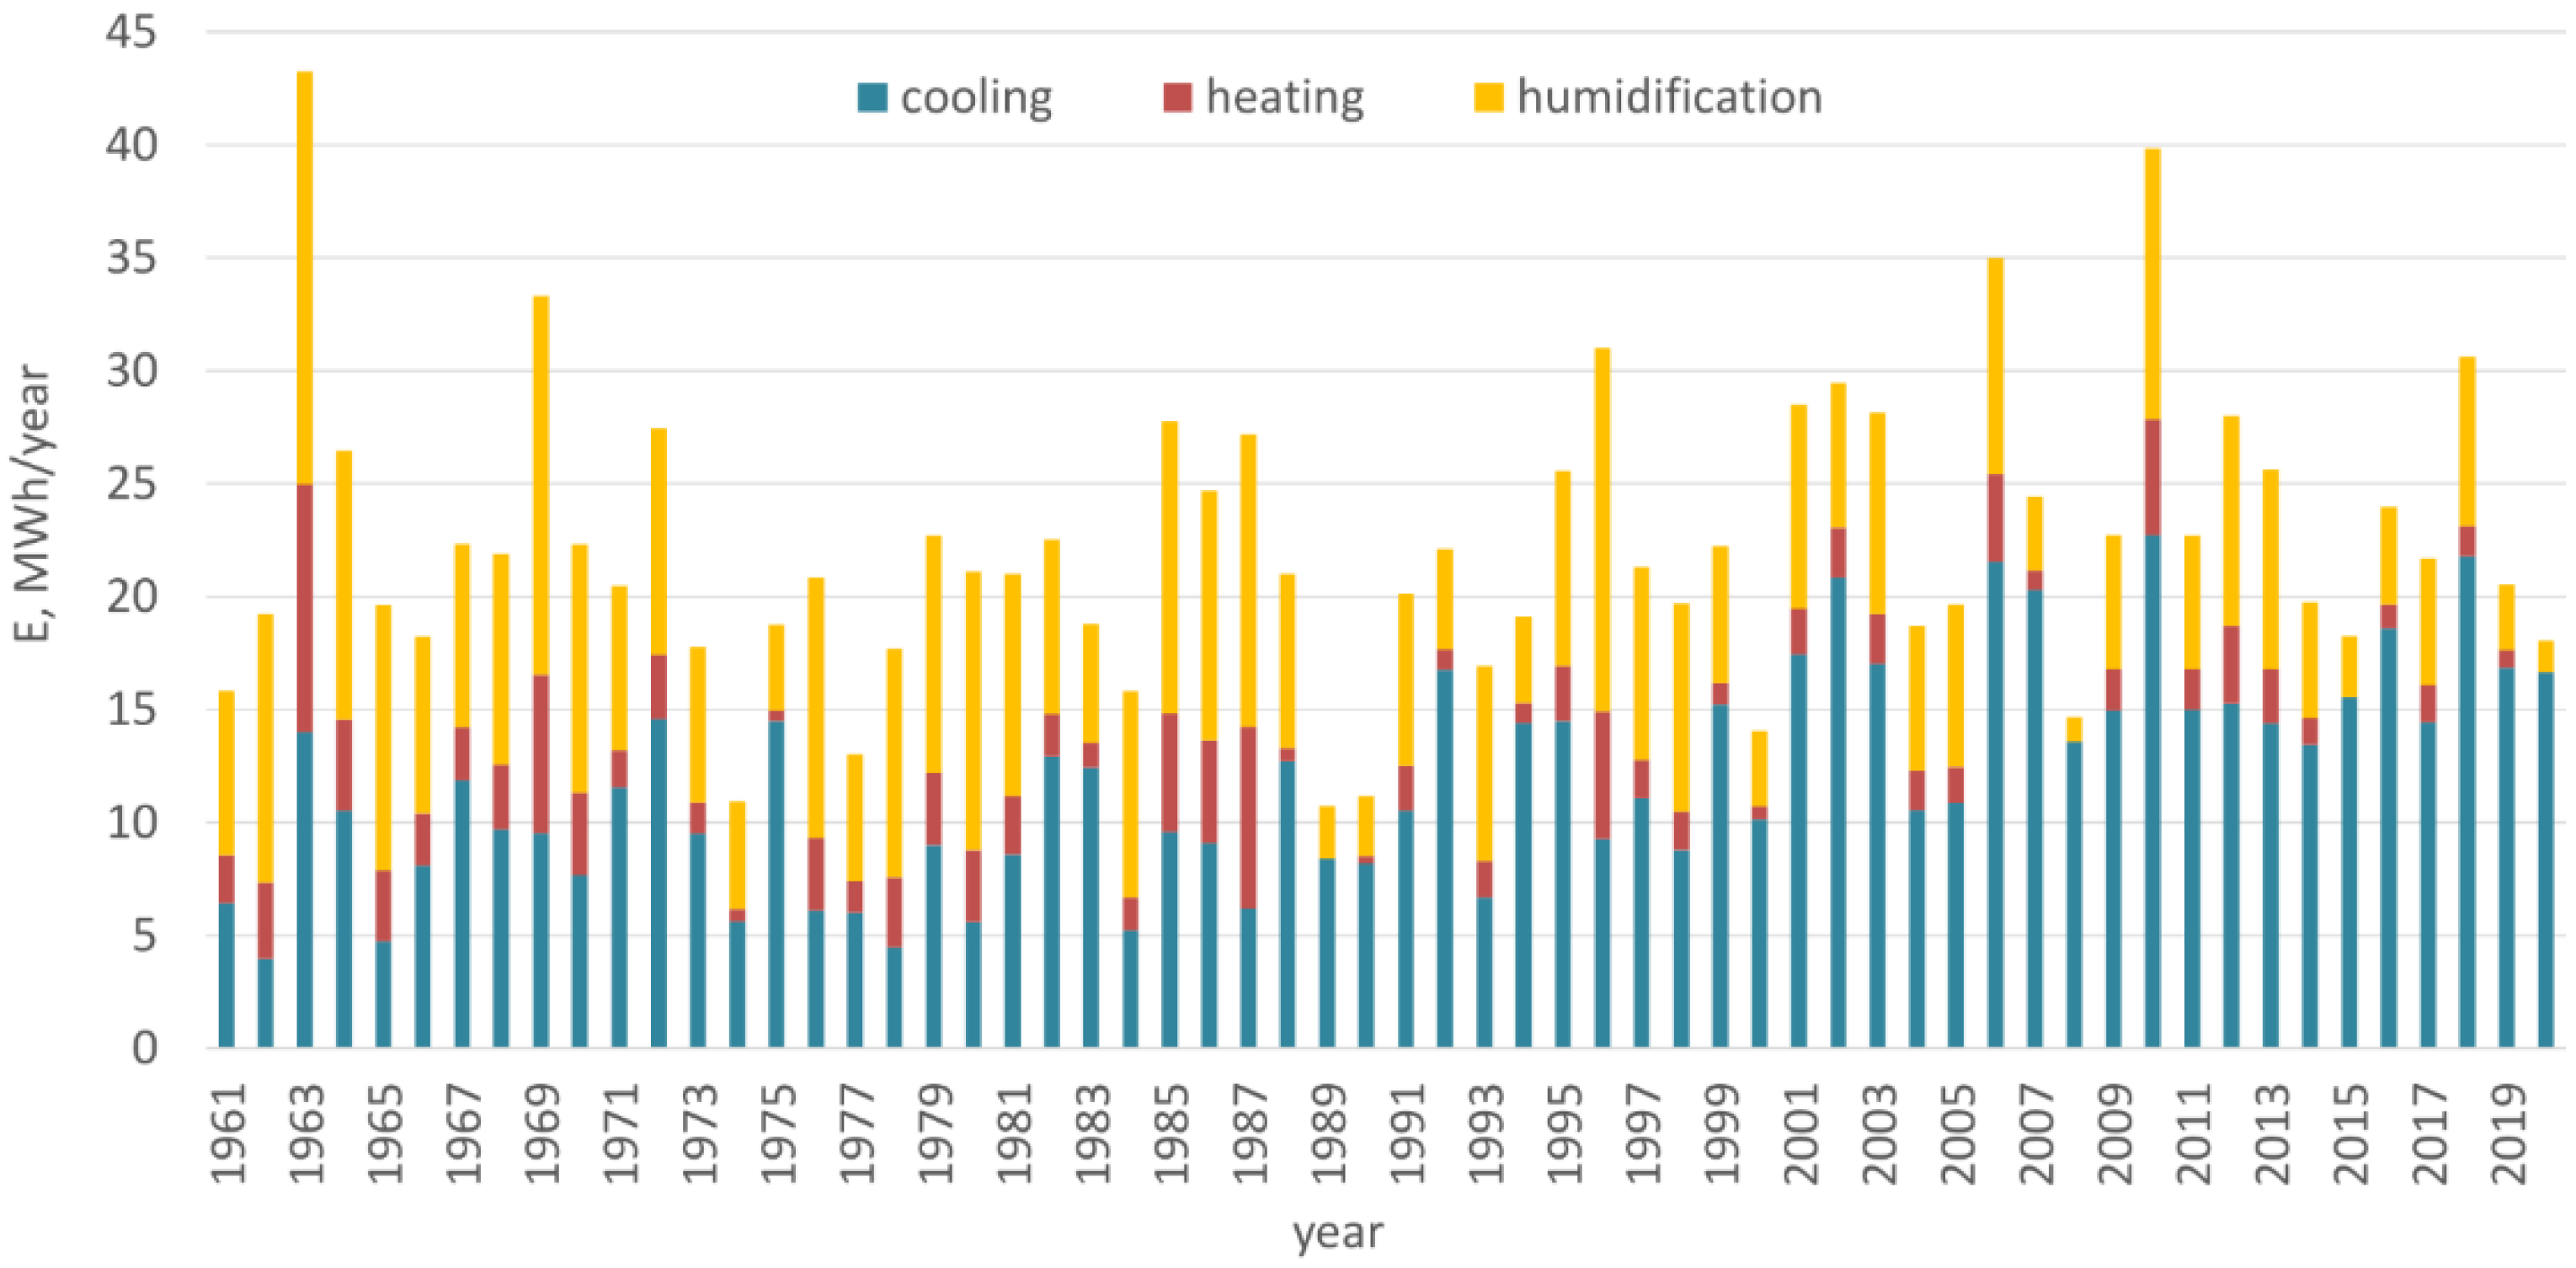
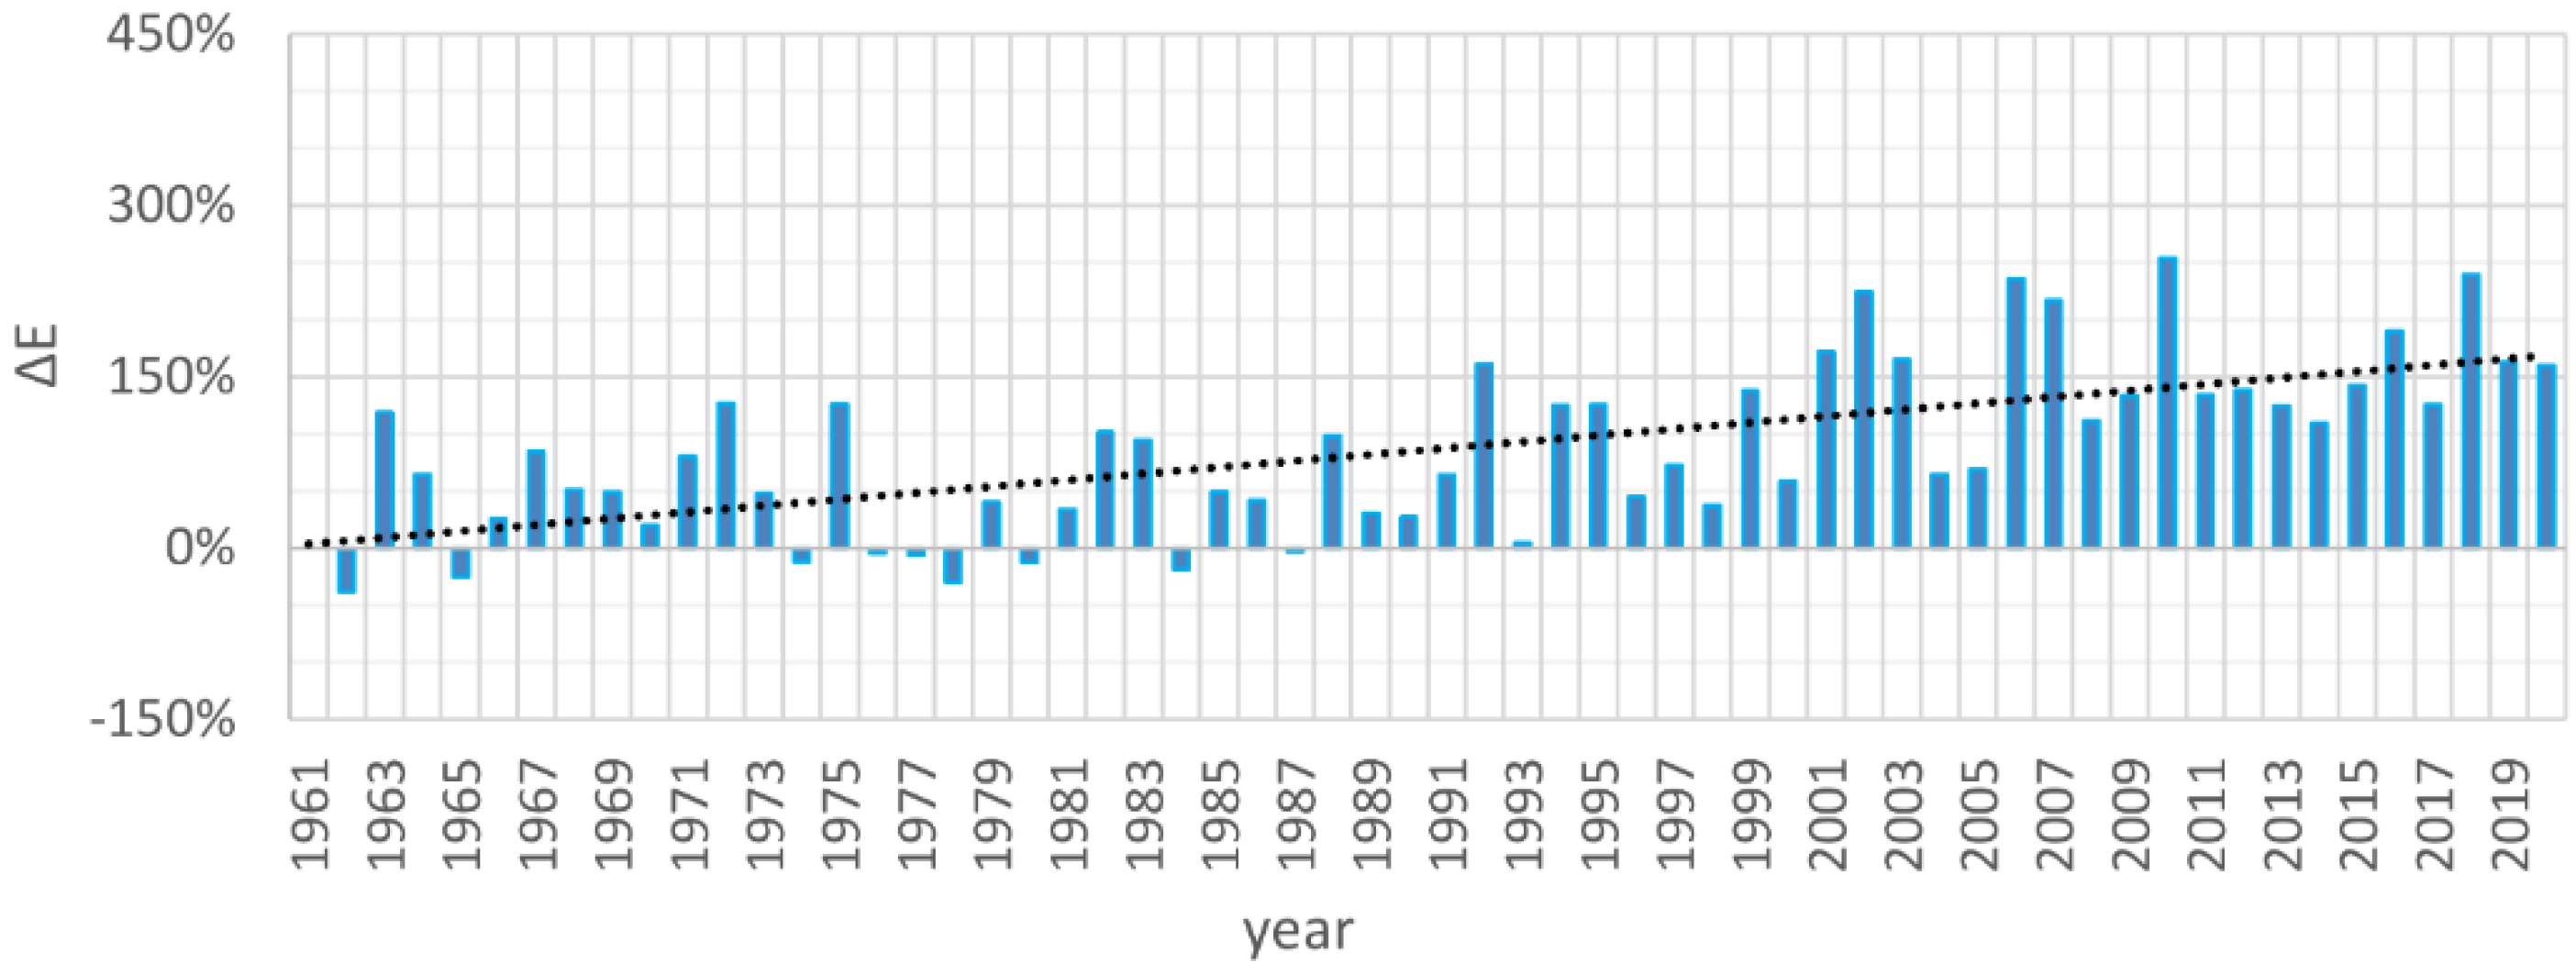
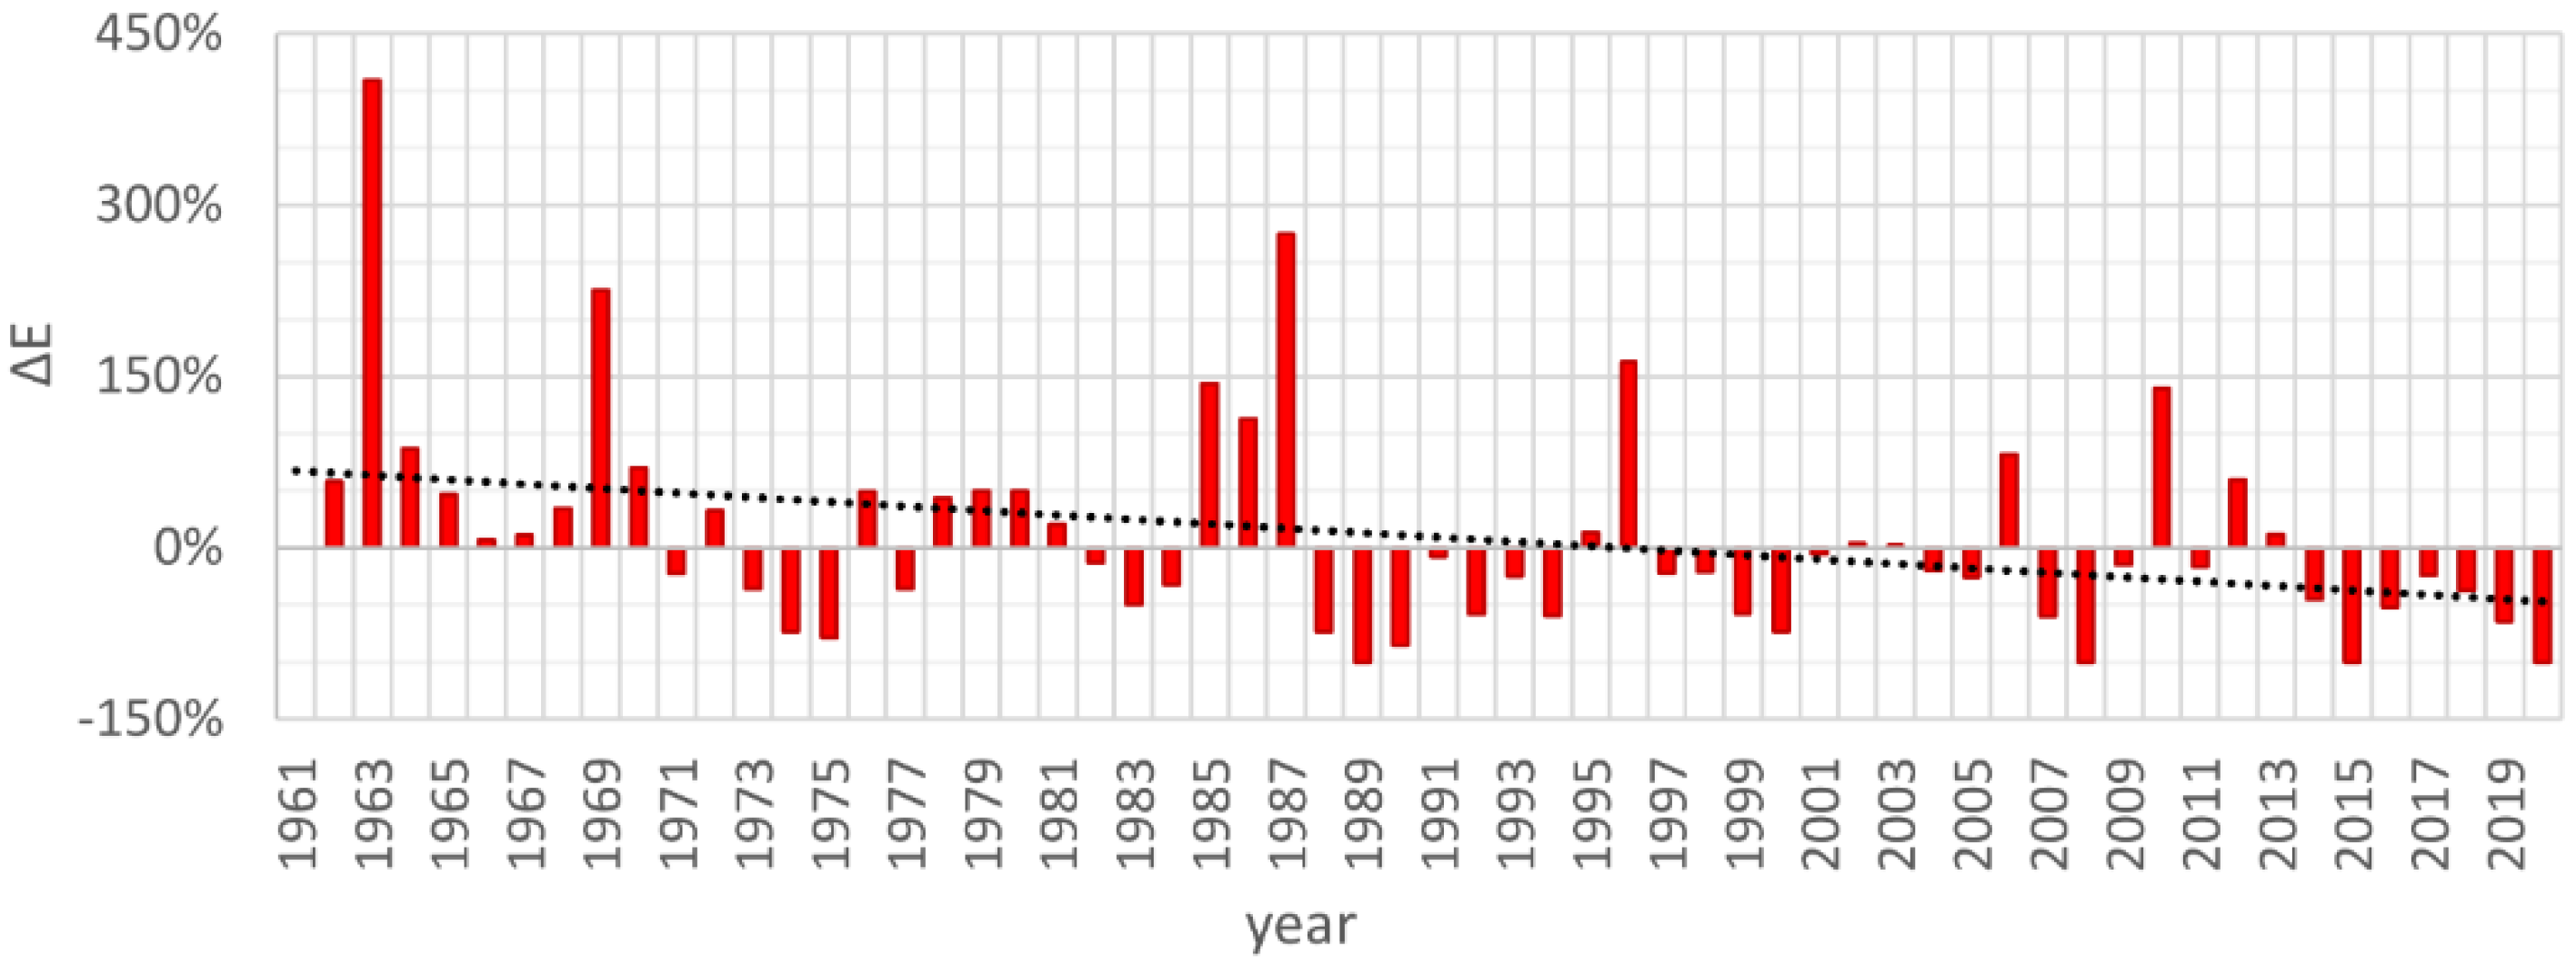
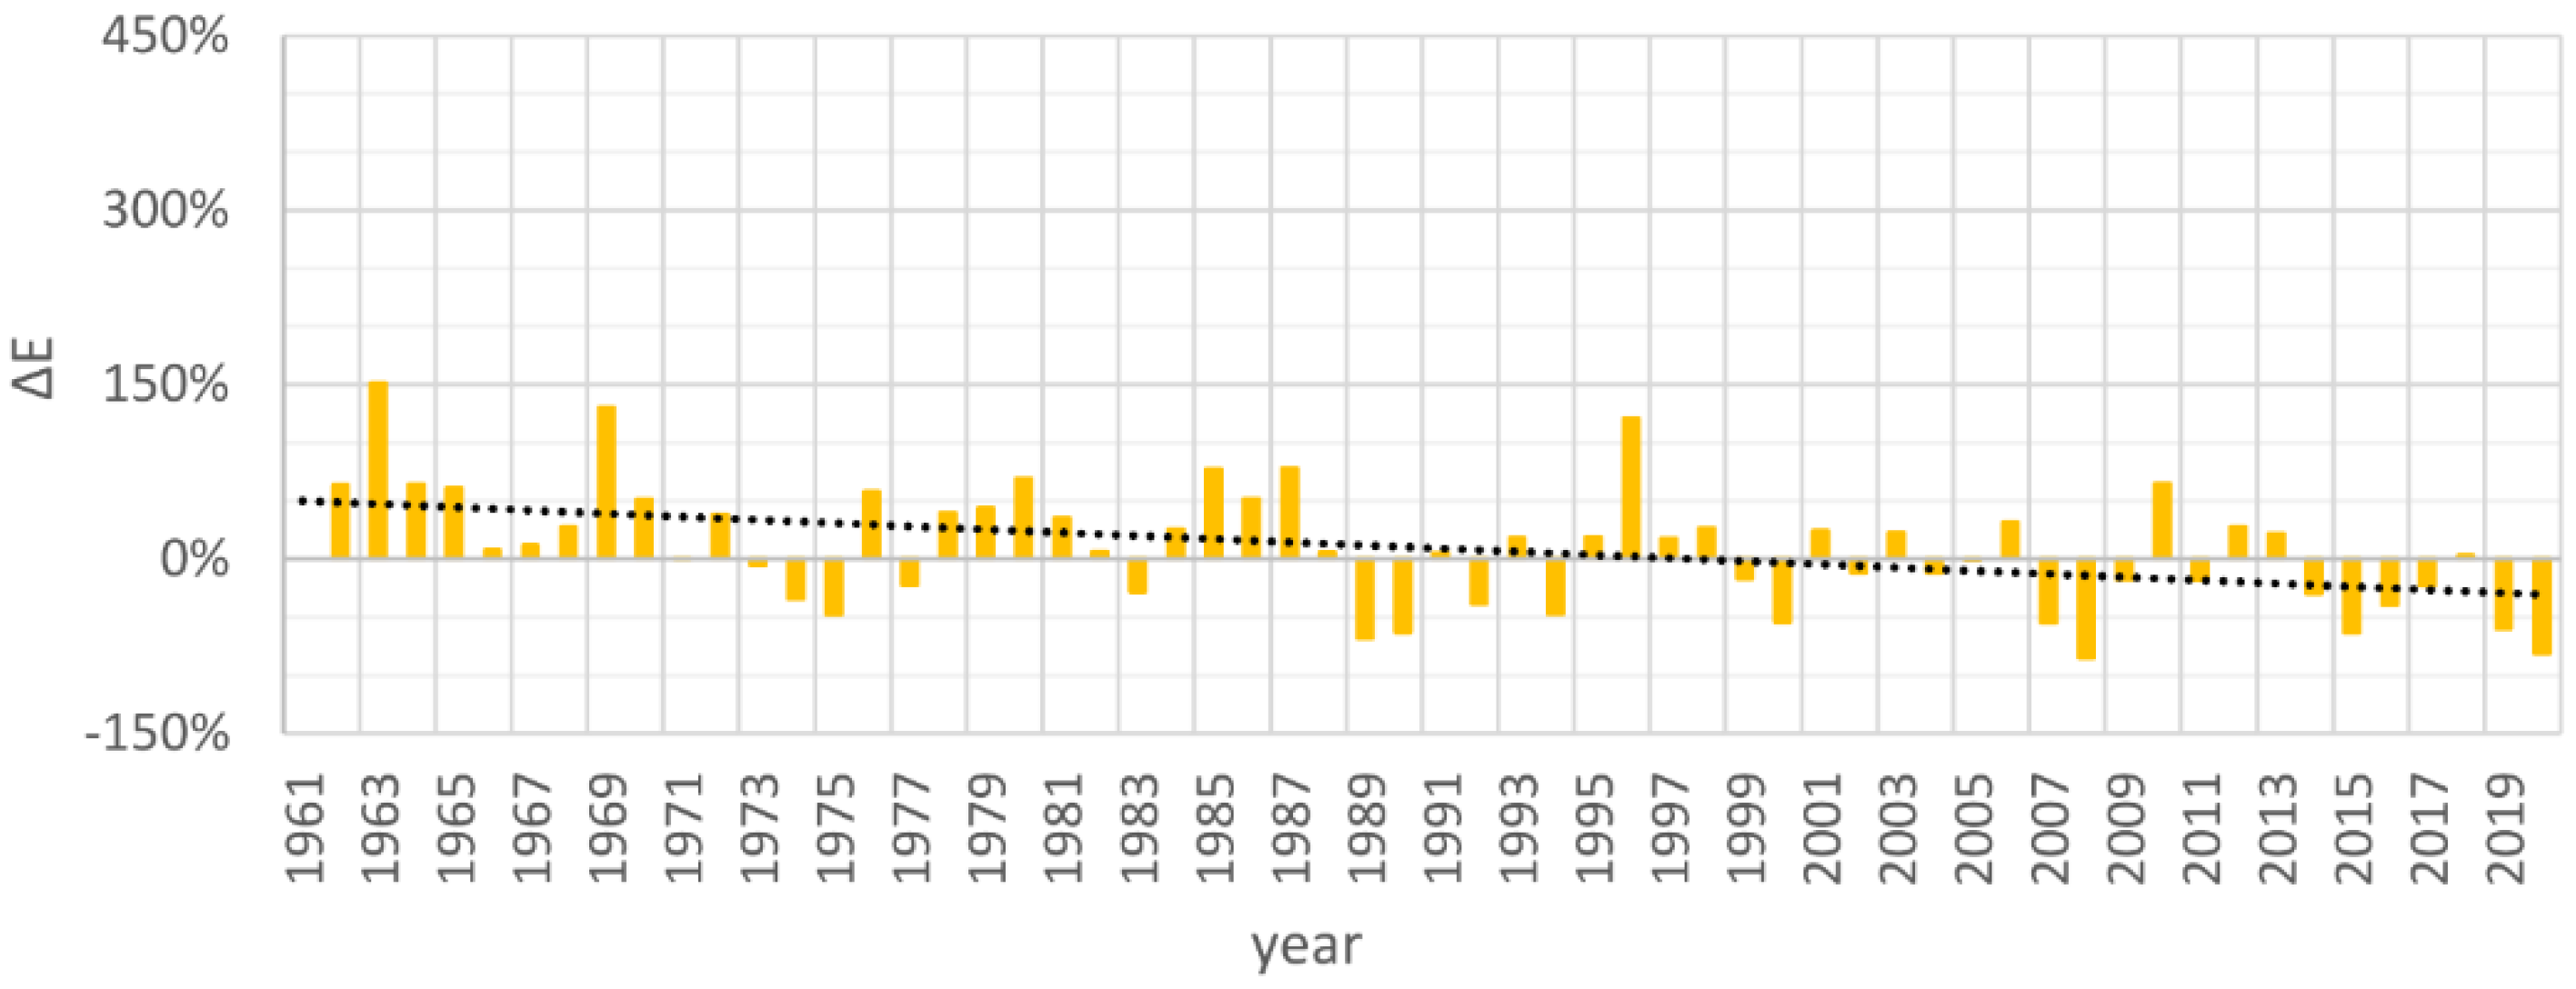
The energy demand (E) supplied from external sources for cooling, heating and air humidification, depending on the climate of individual years in the period from 1961 to 2020, based on monthly average data, is shown in Figure 6. According to the diagram, significant fluctuations in the external energy supplied to the system can be observed over the 60 years under analysis. In the diagram, there is no clear tendency of change in the total energy supplied to the system, while the proportions of cooling and heating energy and energy necessary for air humidification change significantly. Over the years, there is a noticeable increase in cooling energy and a decrease in heating and humidification energy. Detailed changes of individual processes are presented in Figure 7, Figure 8 and Figure 9. They show the percentage change in energy demand (ΔE) for heating, cooling and air humidification, related to the energy of the base year 1961.
The largest differences are observed in the energy demand for air cooling and amount to approx. 28% per decade with an upward trend. However, smaller differences in the results were observed for heating (decrease by approx. 19% per decade) and air humidification (decrease by 14% per decade). The cumulative change in the system’s total energy needs, based on the results of Figure 8, is 2.5% per decade and tend is upward.
On the basis of the monthly analysis, the year 2010 was additionally selected for a detailed, hourly analysis of the operation of the system, as it is characterized by a high total demand for external energy. Year 1963 was eliminated due to the lack of access to detailed hourly meteorological data.
2.4. Hourly Analyses
The calculation procedure for hourly data was analogous to the monthly calculation, according to the configuration presented in Table 5. Additionally, in order to determine the impact of changing the supply air temperature tsup on energy parameters, additional temperature values were introduced (default: tsup1 = 15 °C, additional: tsup2 = 12 °C and tsup3 = 18 °C).
The assumed temperature values are often encountered in primary air treatment systems cooperating with second stage devices such as fan coil units, chilled beams, heat pumps and air conditioners. Primary air preparation to the temperature of 12 °C will cause its higher dehumidification before delivering it to the room, which is particularly important, for example, in cooperation with chilled beams or cooling ceilings, sensitive to high moisture content in the room. However, maintaining an air supply temperature of 18 °C is safe when introducing air close to the occupied zone, as it will not cause a feeling of draft.
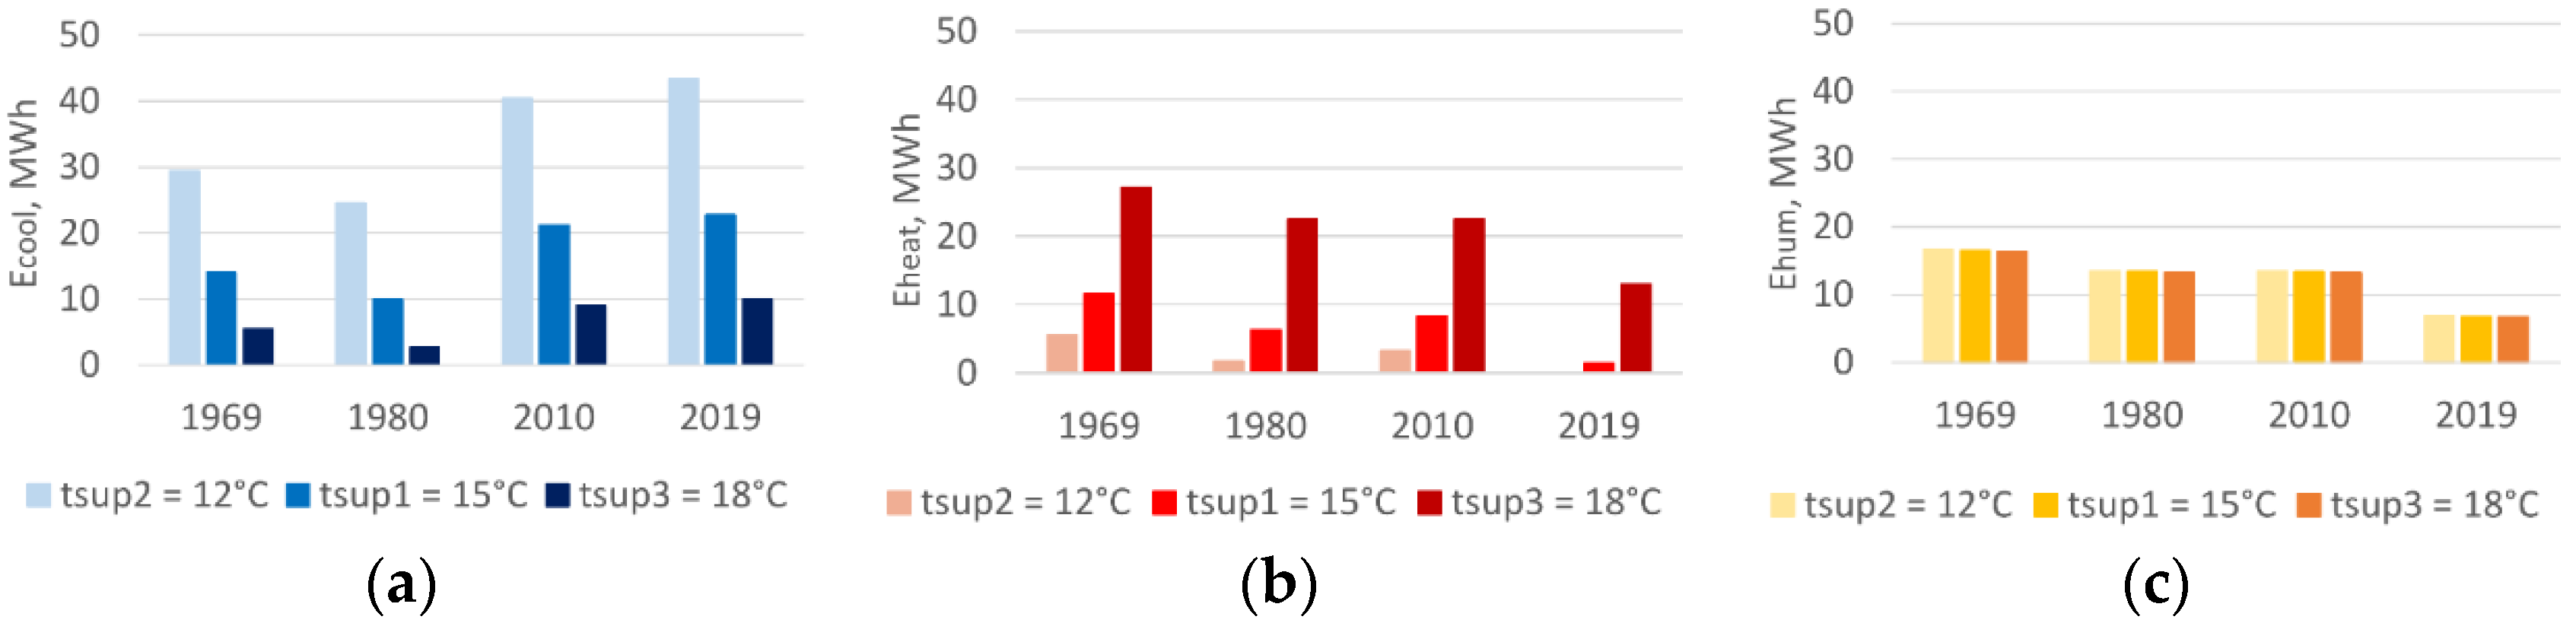
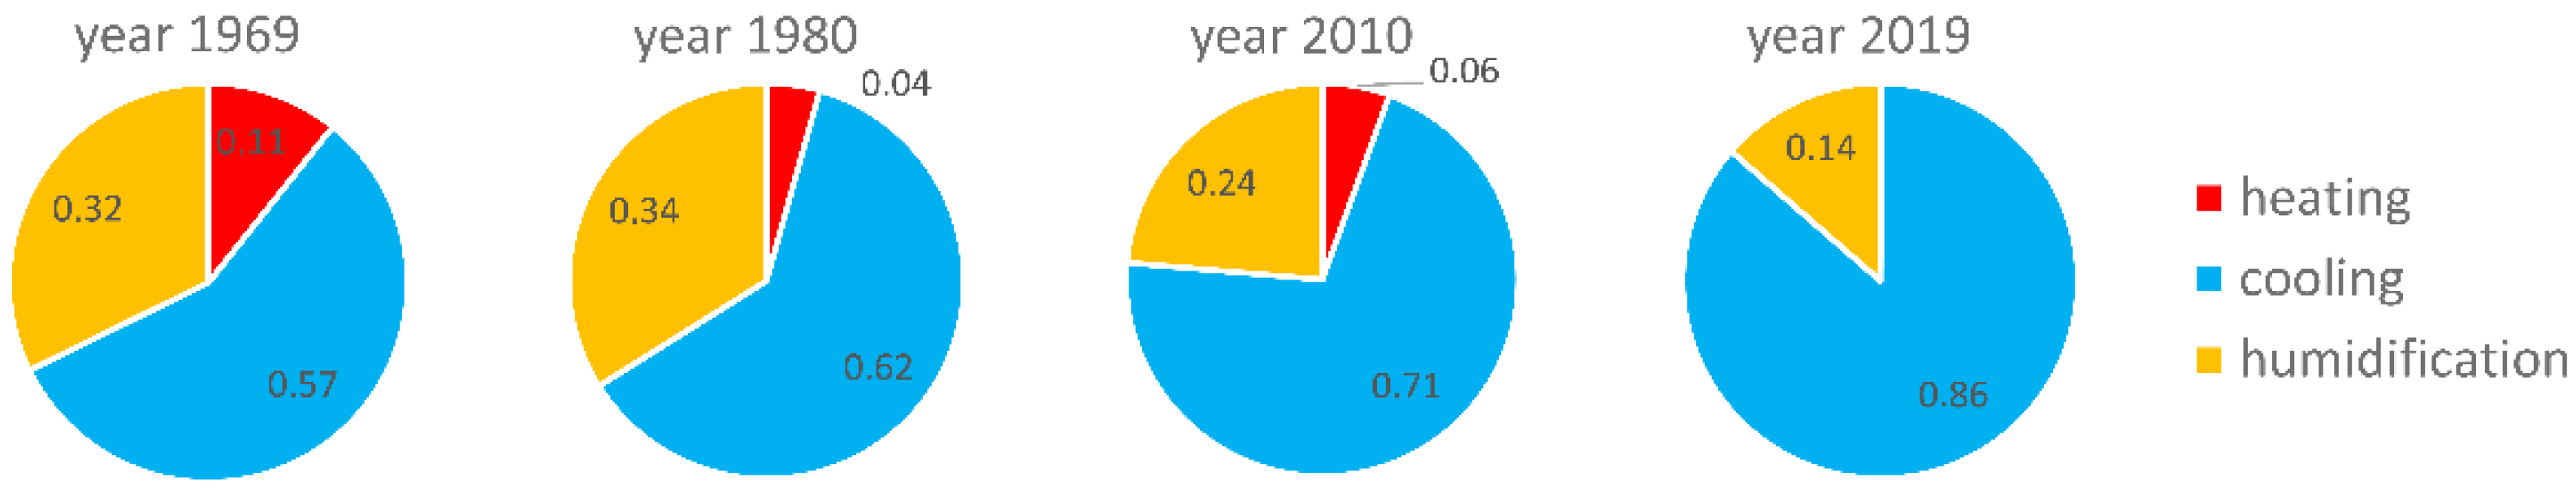
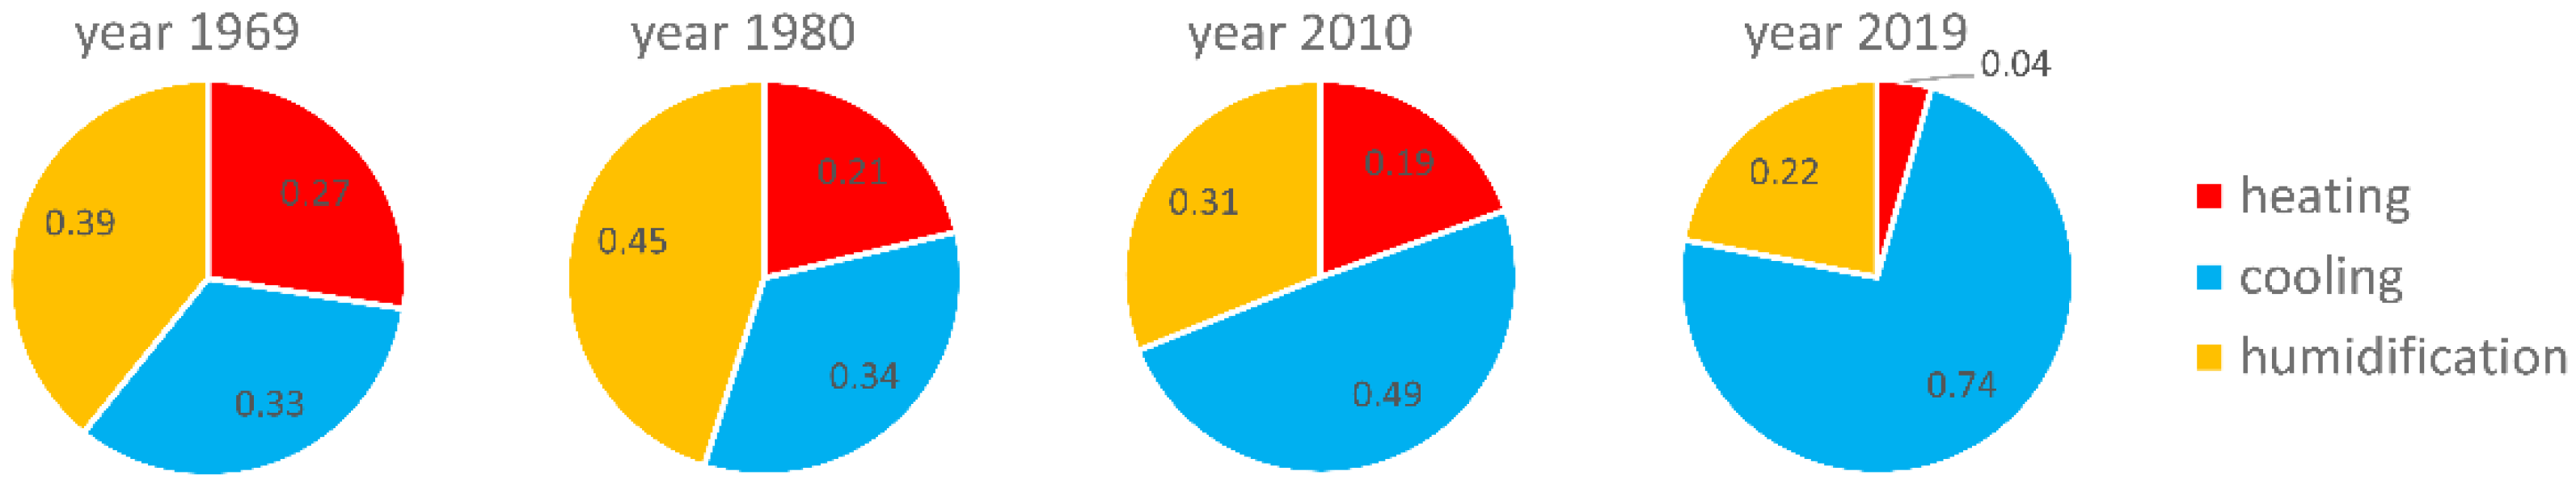
2.4.1. Energy Needs
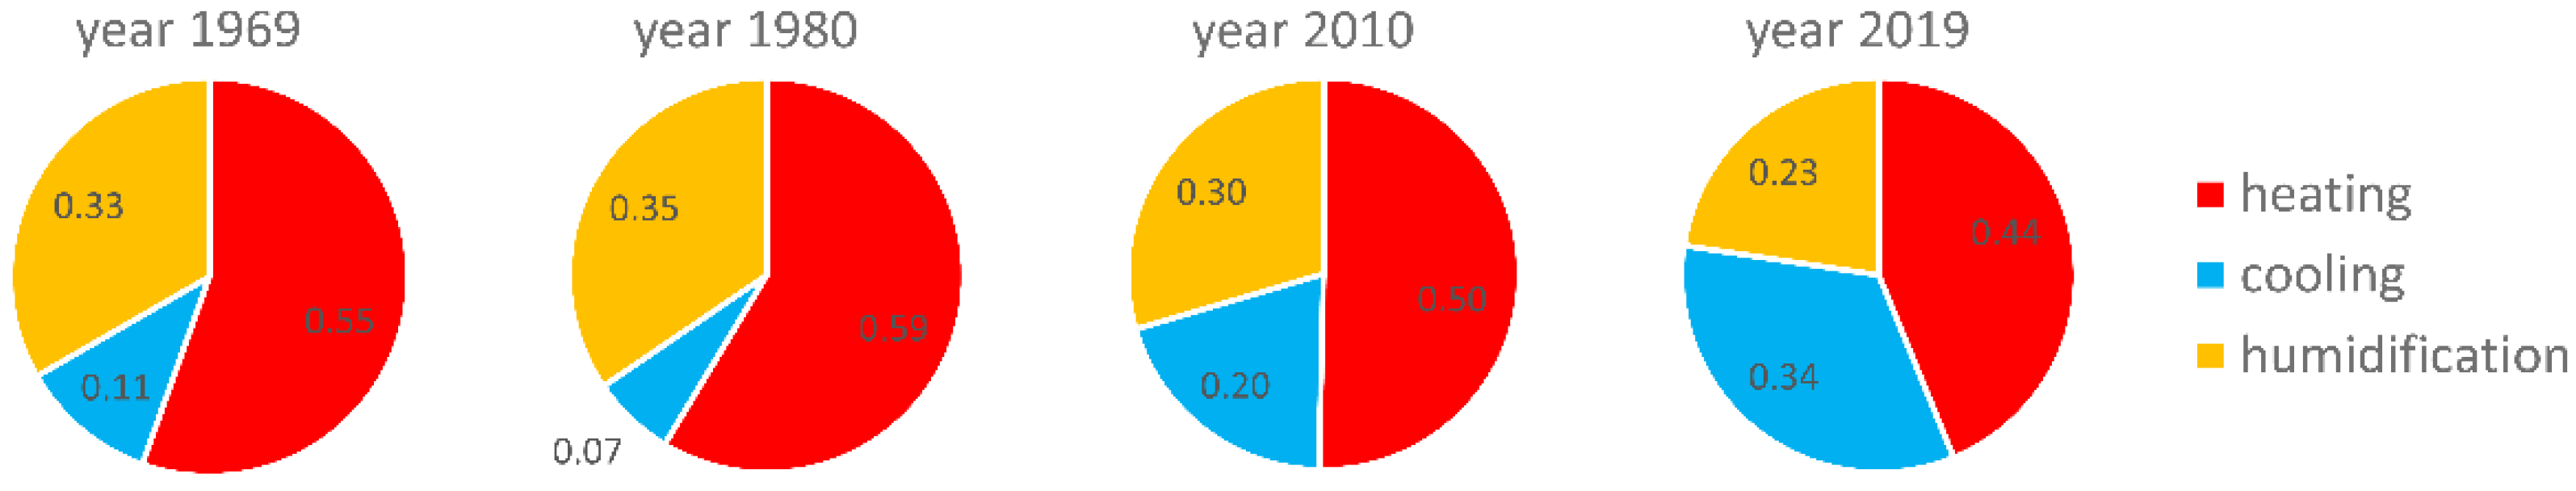
Figure 10 show the annual energy demand for air cooling (Ecool), heating (Eheat) and humidification (Ehum), and Figure 11, Figure 12 and Figure 13 show the share of individual energy needs in the annual demand. Similar to the monthly calculations, there is a general trend to increase the necessary cooling energy and decrease the heating energy and energy for air humidification, but their percentage varies depending on tsup assumption. Significant differences in amount of energy can be noticed for the tsup variants for cooling and heating. In the case of humidification, clear changes are not observed; however, in the overall needs of the system, the share of this process tends to decrease. This proves the growing importance of other processes for general energy needs. In the warmest year (2019), the energy required for cooling for tsup 12, 15, and 18 °C respectively is approx. 180%, 230%, and 380% of the value from the coldest year (1980). However, for heating, the amount of energy, when comparing the same periods, is approx. 5%, 20%, and 60% of the value from the coldest period. Reducing the supply air temperature from the default value tsup1 = 15 °C by 3 K in the analyzed years increases the demand for cooling energy to 190–245% of the base value and reduces the demand for heating energy to 5–50% of the base value. Analyzing the increase in the supply air temperature from the default value tsup1 = 15 °C by 3 K, the observed changes for cooling energy are 25–45% of the base value and 235–945% of the base value for heating energy. In the case of energy for air humidification, the observed fluctuations in energy consumption are in each case only about 1%.
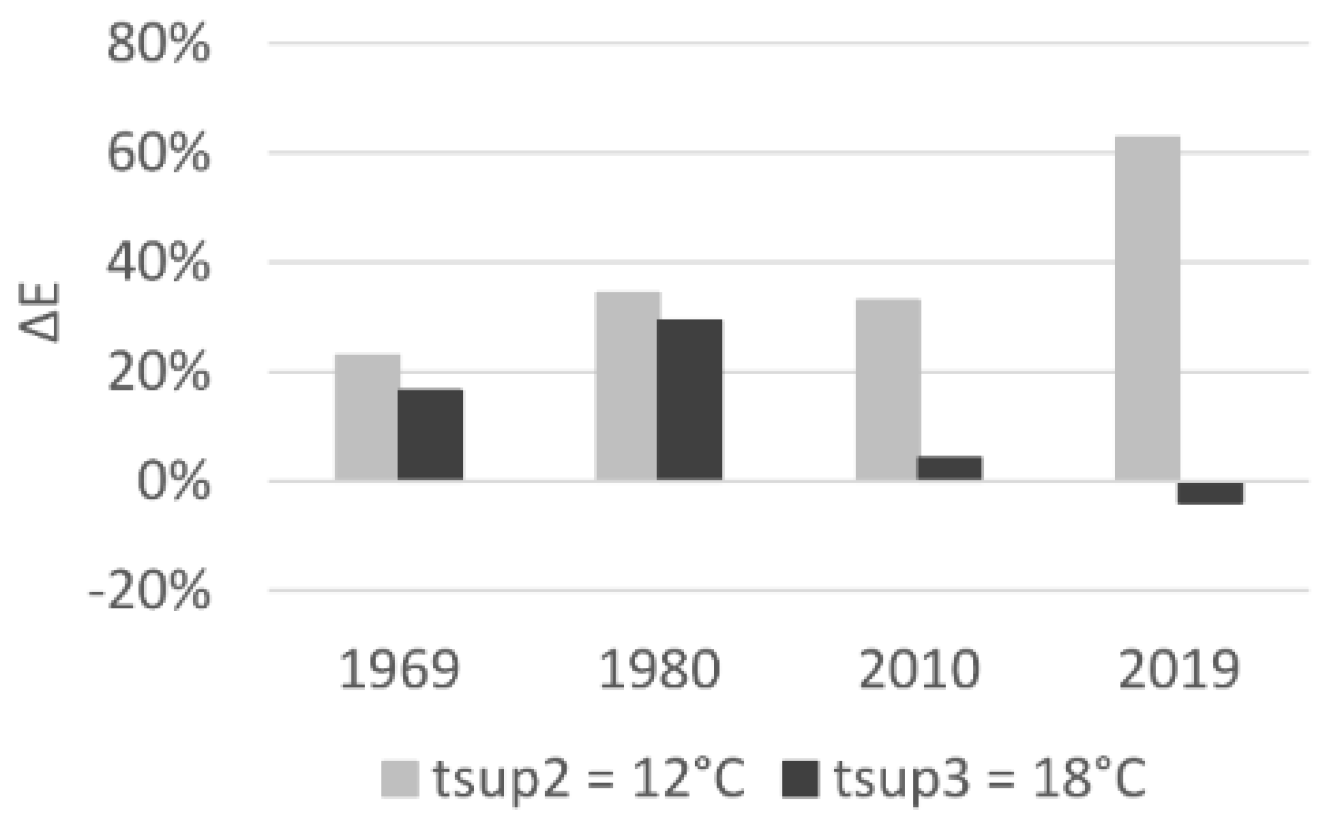
Figure 14 shows the percentage change in energy demand for external energy (ΔE) for air treatment (cooling + heating + humidification in total) related to the base value tsup1 = 15 °C. The results show that both raising and lowering the supply air temperature can result in energy losses. The exception is 2019, when the temperature increase by 3 K resulted in a reduction of the energy needs of the system by approx. 4%.
It should be remembered that at the design stage of the systems, the value of the supply air temperature is determined not only by energy issues, but also by internal conditions in the rooms. As mentioned before, a significant air cooling in the air handling unit is often the only possibility to maintain the humidity conditions in the rooms and guarantee the safe and effective operation of selected second-stage exchangers.
2.4.2. Freeze Protection System
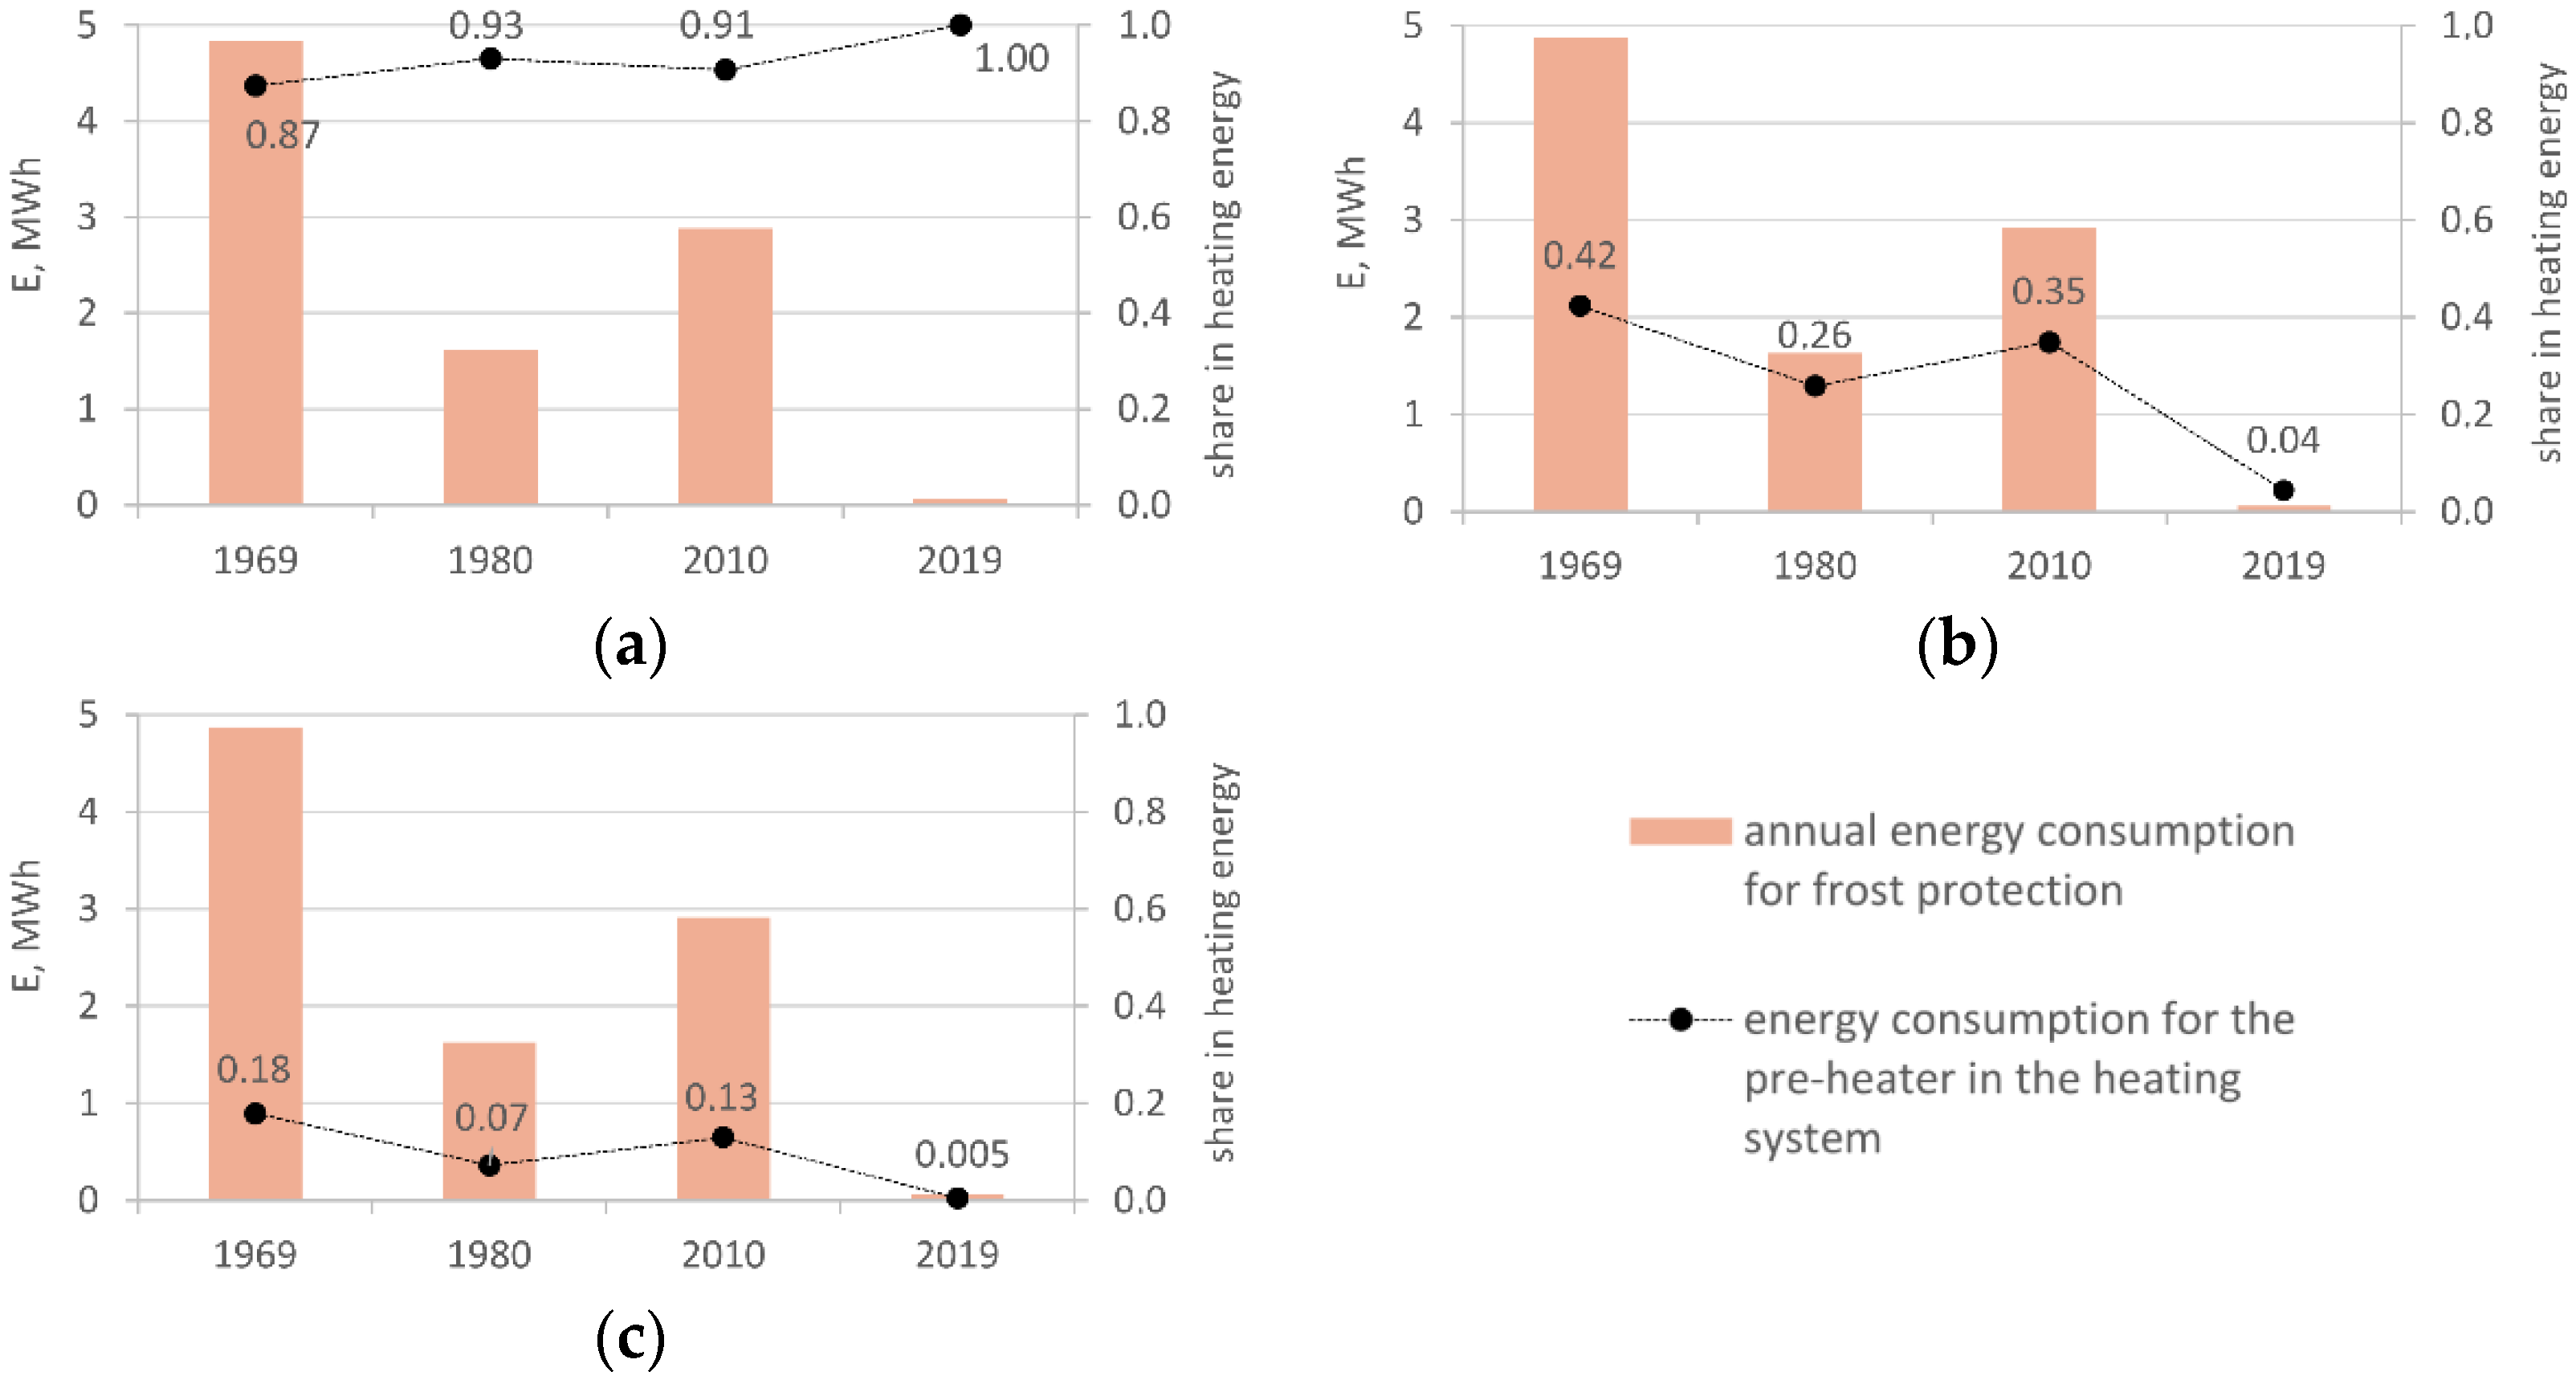
In the analyzed case, according to Table 5, the activation of the anti-freeze protection system depends on the temperature of the air removed from the heat recovery exchanger trem. The beginning of the protection process is the moment when this temperature drops to 0 °C, according to PN-EN 16798-5-1:2017-07 [44]. For the assumed 73% efficiency of the exchanger, it takes place at the external temperature text = −7.4 °C. In the analyzed years 1960, 1980, 2010 and 2019, the number of hours when the temperature drops below this limit was sequentially 918, 479, 752, 35 h (which is approx. 10%, 5%, 9%, 0.5% of the entire system operation period). The average external temperature in the period of operation of the protection was respectively −12.7, −10.8, −11.3 and −9.1 °C. The summary of the above data gives a picture of a long and cold winter in 1969 and 2010, which directly resulted in a large balance of heating needs shown in Figure 15. It contains the results of calculations of the energy demand for the preheater operation and its share in the total heating energy of the system. The differentiation of the results for the three assumed parameters of tsup air is also presented.
The charts show that in individual years the duration of the frost protection operation directly translated into general energy needs; however, individual values do not change when the temperature of the supply air is differentiated. There are significant differences in the share of energy for defrosting in the total heating energy of the system. For tsup2, the total heating needs are limited in that the energy for defrosting is as much as 87–100%. With an increase in the air supply temperature, for tsup1 and tsup3, the share of this energy decreases and amounts to 4–42% and 0.5–18%, respectively.
2.4.3. Heat Recovery
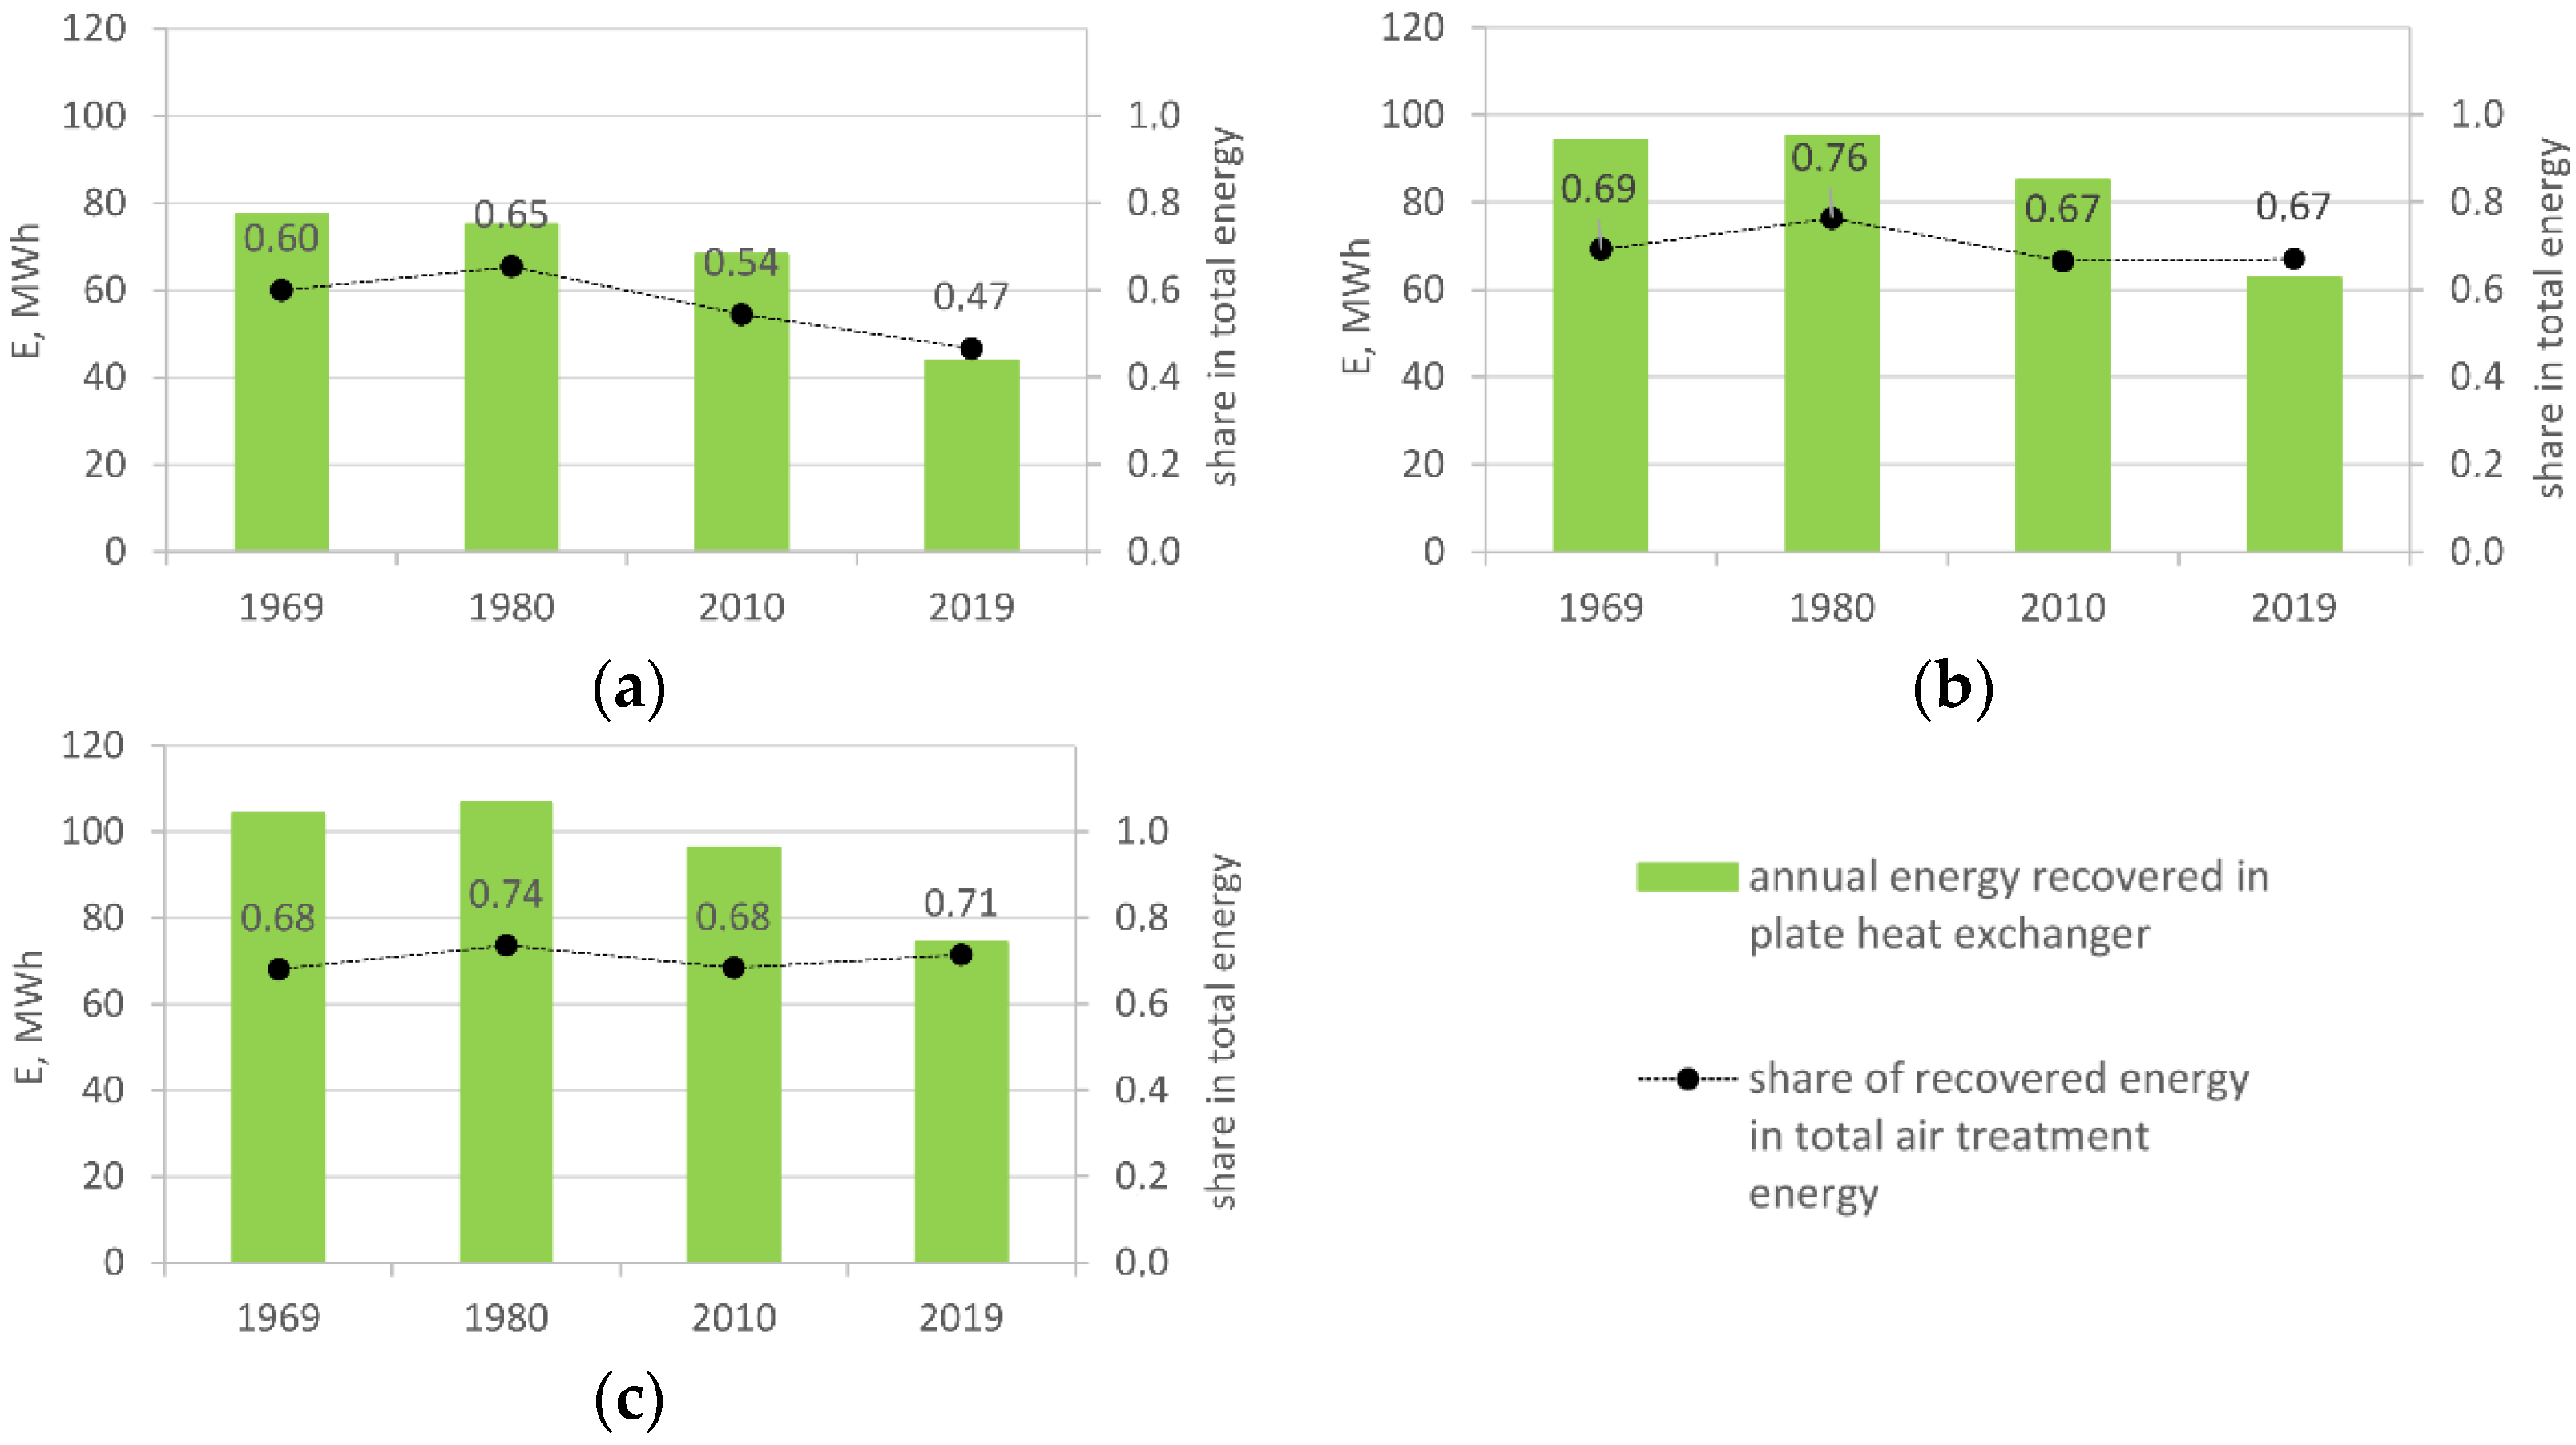
The energy needs described above concern only the energy supplied from the outside, not including that transferred inside the system. Meanwhile, the energy recovered in the heat recovery exchanger is a significant value in the total energy needs for air treatment, as shown in Figure 16. It shows the amount of energy transferred in a plate heat exchanger with parameters compliant with the assumptions of Table 5 and the share of this energy in the total energy demand of the system. Recovered energy includes both heating and cooling energy.
According to the graphs, with the increase in the supply air temperature tsup, an increase in the share of energy recovered in the total amount of energy can be noticed. Lower expected tsup require a much more frequent reduction in the efficiency of heat recovery, and thus the potential of the exchanger is not fully used. In all analyzed years, the average annual efficiency of heat recovery was similar and amounted to 36–39% for tsup2 = 12 °C, 50–51% for tsup1 = 15 °C and 64–65% for tsup3 = 18 °C.
The phenomenon of a significant decrease in the average annual efficiency of heat recovery would be even more visible with an efficiency higher than the assumed 73%, which is a common situation in the solutions currently used. The lowest amount and share of recovered energy are observed at low air supply temperatures and at the same time in the warmest years—the largest discrepancies are observed for tsup2 = 12 °C and 2019. The recovered energy is then only 47% of the total energy, while in the remaining cases, it is higher by 20% and 24%, respectively.
2.4.4. Heat Exchangers Power
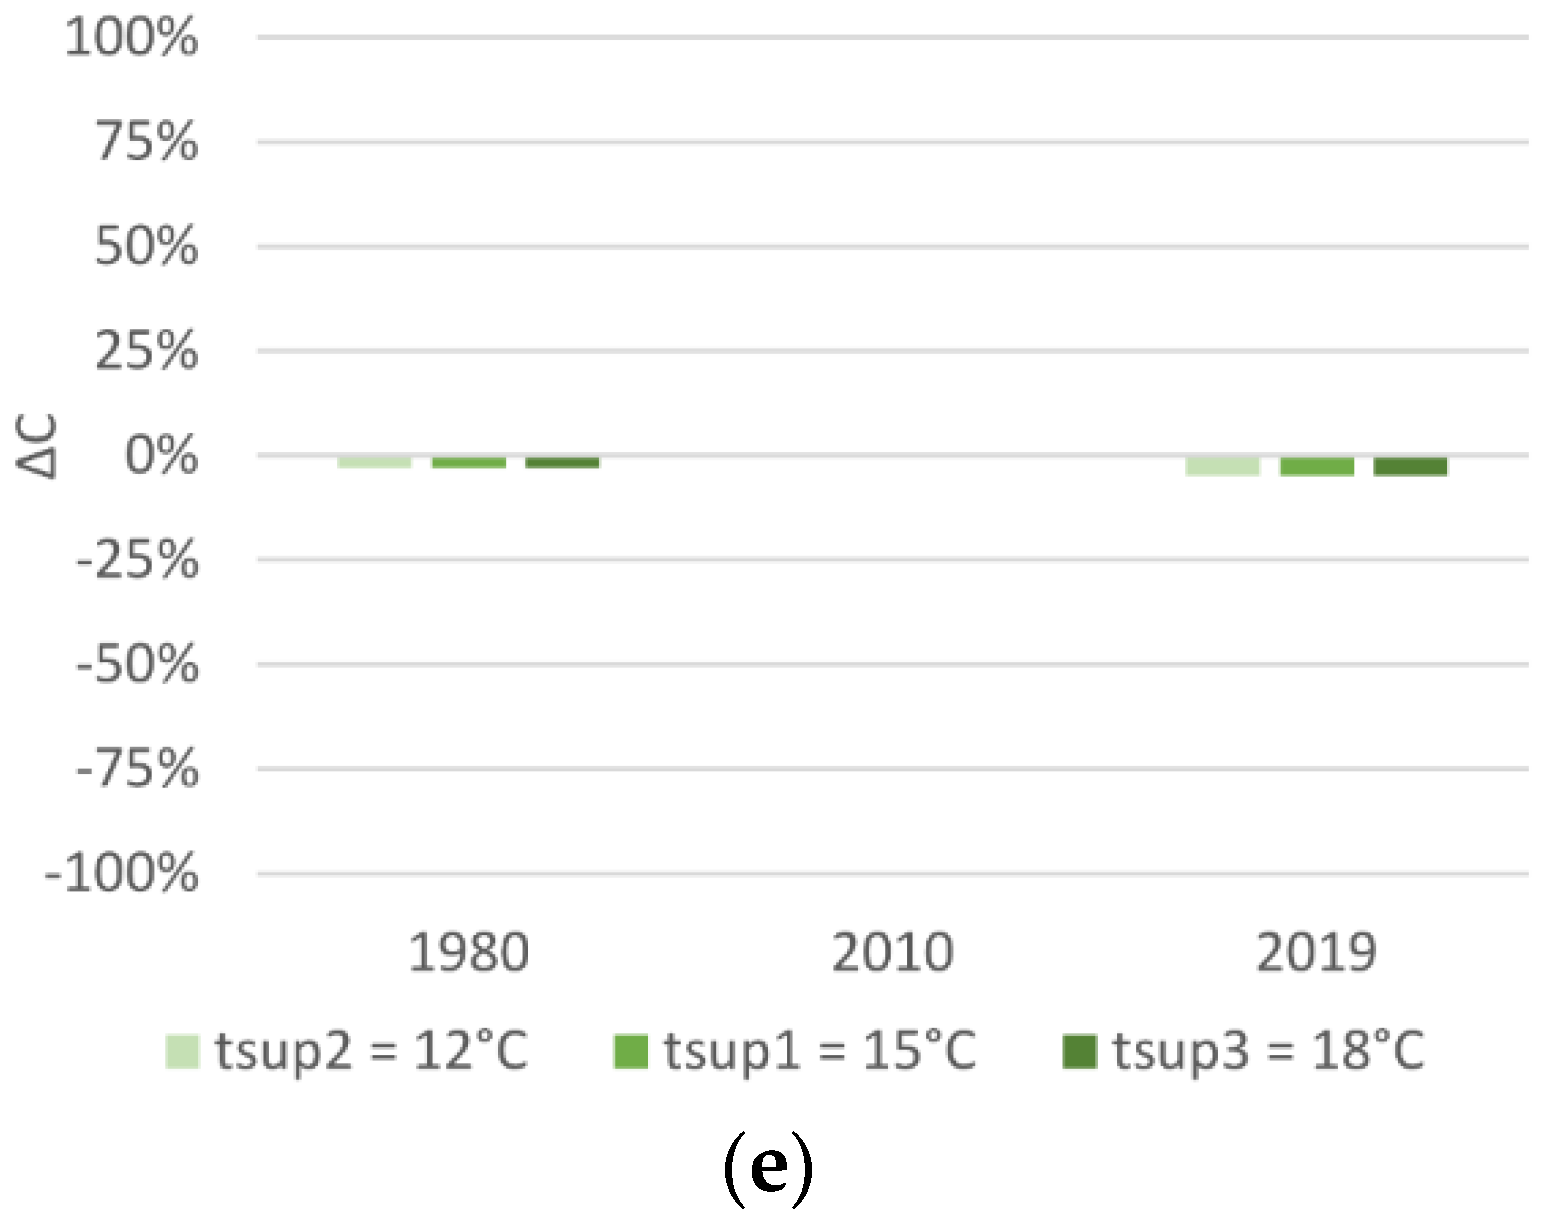
The amount of energy required for air treatment depends on the capacity of the exchangers and their operating time. Therefore, the increased amount of energy allocated to a given process does not mean the necessity to use an exchanger with a greater capacity in the device. A comparison of the percentage change in the maximum required capacities (ΔC) of all heat exchangers used in the system is shown in Figure 17.
The calculations were related to 1969. Although, according to Figure 10a, the least amount of energy for air cooling is required in 1980, and the highest in 2019, it is not evident in the achieved capacities of the devices. According to Figure 17, the maximum capacity of the cooler was achieved in 2010 and it is 33–55% higher than the cooler of the base year 1969, when this capacity was the lowest. However, in the case of the preheater and the secondary heater, their capacities in 1969 were the highest, which corresponds to the period of the highest energy demand for heating presented in Figure 10b and Figure 15. The similarity was also noticeable in 2019, when the greatest capacity reduction and the lowest cooling energy demand were observed. Clear differences in the capacity of heaters in 1980 and 2010 do not coincide with the similar energy demand in these periods. In the case of the preheater, the change in tsup temperature does not change the heat exchanger capacity, which is also reflected in the energy demand in Figure 15. Smaller fluctuations in the exchanger capacity is observed in the case of the humidifier. The largest reduction in capacity is observed in 2019 and amounts to 28–29%, which corresponds to the highest energy demand in Figure 10c. The smallest reduction in the humidifier’s capacity, 4% compared to 1969, does not correspond to the energy demand, which in 1980 and 2010, was similar. The smallest changes in the capacity of the exchanger is observed in the case of the plate heat exchanger for heat recovery, by only 0.3–5%.
3. Results and Discussion
The article presents the impact of changes in the climate of the city of Warsaw on the primary air treatment processes in the air conditioning system. The analysis was carried out for a commonly designed system used in solutions with additional devices installed directly in the rooms. In these solutions, the parameters of the supplied air do not depend directly on the temporary conditions in the interiors, and therefore the air treatment energy needs must be separately qualified in the energy needs of the building.
The analysis of the climate of Warsaw, carried out for the period 1961–2020, showed a progressive increase in the external temperature by approx. 0.4 °C per decade. Warming is more intense in the summer and winter seasons and amounts to approx. 0.5 °C per decade. The climate change is also visible in the gradual increase in the humidity content in the outside air by approx. 0.2 g/kg per decade, while the relative humidity in the year-round period does not show any clear decreasing or increasing tendencies.
The analysis of the energy needs of the installation was divided into two stages. The first one, based on the average monthly climate data for the following years of the 1961–2020 period, confirmed the general energy tendency observed in the construction sector in many regions in the world. The results show that over the analyzed years the share of cooling needs increases and the importance of the heating needs of the system decreases. The observed average increase in cooling needs is 28%, and the decrease in heating needs is 19% per decade. In addition, the increase in the temperature of the outside air and the simultaneous gradual increase in the moisture content reduce the energy demand of the humidification processes. The observed decrease is 14% per decade.
In the second stage of the research, characteristic years were selected and analyzed in detail in an hourly step. The selection was based on the results of the analysis of meteorological data and the energy demand calculated for monthly average data. The results of this analysis may provide an indication of the design of ventilation and air conditioning systems in the face of progressive changes in the climate. The calculations showed that the temperature of the air supplied to the rooms has a significant impact on the total energy demand of the system. In the analyzed case, the reduction of the temperature from tsup1 = 15 °C to tsup2 = 12 °C resulted in an increase in energy demand reaching 63% in the most unfavorable period. The increase in temperature from tsup1 = 15 °C to tsup3 = 18 °C in most cases resulted in an energy loss of up to 30%. Only in the warmest year of 2019, this change brought a positive effect, reducing energy demand by 4%.
An analysis of the operation of heat exchangers has shown that long-term climate change has a greater impact on the operation of the systems than on its design conditions. The maximum required capacity of the air humidifier and the achieved capacity of the heat recovery device remained almost unchanged. In addition, the maximum capacity of the heaters, despite the downward trend in heating needs, was not significantly reduced. This is an effect of the geographical conditions of Poland, which are responsible for the periodic appearance of severe frosts, despite the general climate warming tendency. This results in the necessity to continue providing relatively high heating capacities but used for ever shorter periods of time. It gives more possibilities to ensure efficient production of renewable energy and to reduce the final and primary energy demand of the system, which is a step toward meeting the goals of 2030 Agenda for Sustainable Development. The expected reduction in heating demand sets the direction for further research, e.g., searching for energy-saving cascade cooperation of various energy sources or increasing the possibilities of using stored energy in Poland.
In the case of heating energy, an important issue is also the protection of the heat recovery exchanger against freezing. Depending on the designed parameters of the supply air and external conditions, the heating energy for the system may be almost exclusively the energy needed to protect the exchanger or energy for the final air treatment to the tsup. Additionally, the common trend of using highly efficient recovery heat exchangers, often reaching even 90%, contributes to increasing the share of anti-freeze protection in the total heating energy demand. The awareness of the differences in the quantitative needs of individual air treatment processes should focus attention on the most effective method of obtaining energy for their implementation. Protection of recovery heat exchangers with electric heaters is relatively common in real solutions, it is energy-consuming and can have a decisive impact on the final and primary energy of the entire system. It should also be noted that the energy for defrosting can be reduced by interfering with the type of heat recovery device used, e.g., the use of rotary heat exchangers that are less prone to frosting or the use of highly effective anti-freeze protection, e.g., differential pressure sensors, which indicate the actual increase in air flow resistance caused by frost, not the risk of its occurrence.
The greatest impact of climate change on the design conditions of the system is noticeable with the air cooler. The maximum capacity of the exchanger in all compared years is greater than the base year. The expected upward trends in the power of air coolers suggest that when designing the installation, it seems necessary to take into account the predicted future climate changes. Progressing global warming will probably force the use of more and more powerful heat exchangers, and without taking into account the expected changes in external parameters, the existing systems may less and less meet expectations over the years. It seems reasonable to start work on updating the designing process methodology currently used in HVAC design.
Due to the significant increase in the importance of cooling needs in the overall energy needs of systems, it is also a place that requires special attention in optimizing the operation of systems. It is necessary to find a compromise between the need to maintain internal comfort and the need to reduce energy consumption, which is already the subject of research by many scientists [50,51,52]. Multi-criteria optimization of the operation of HVAC systems through the use of intelligent building control techniques shows a significant importance in the coordination of maintaining thermal comfort and reducing energy consumption in the building. The assumption of the supply air and refrigerant parameters should be closely related to the analysis of the variability of the heat load and humidity conditions in the rooms, because the optimization of these values during further climate warming will be of great importance in the final energy efficiency of the entire system. This is another place that should be particularly taken into account in the research of system control systems. The observed significant increase in cooling needs also suggests the need to look for energy-saving methods of its acquisition. It seems justified to research on the possibility of using the expected future parameters of the outside air, for example for natural coverage of cooling needs (e.g., natural ventilation, free-cooling, energy storage).
Measurements carried out in Poland during part of the period under consideration are, unfortunately, characterized by low accuracy, as there were no measuring instruments as precise as today, and the reading of the values was performed manually by a human, therefore the results may be burdened with a significant error. However, they show the general tendency of the impact of climate change and allow to outline the direction of further research. To compare the sensitivity of the results of calculating the capacity of exchangers to the accuracy of variable parameters, calculations of the absolute and relative errors were made. The accuracy of older temperature measurements was estimated at approx. 0.5 °C, and modern ones at approx. 0.1 °C. The accuracy of the enthalpy was determined as 0.5 kJ/kgda and the density was 0.01 kg/m3. The sensitivity analysis allowed to define the temperature and enthalpy as main significant variables in the energy demand calculation model.
Author Contributions
Conceptualization, M.K. and A.Z.; methodology, M.K. and A.Z.; software, M.K.; validation, M.K. and A.Z.; formal analysis, M.K. and A.Z.; investigation, M.K. and A.Z.; resources, M.K. and A.Z.; data curation, M.K. and A.Z.; writing—original draft preparation, M.K. and A.Z.; writing—review and editing, M.K.; visualization, M.K. and A.Z. All authors have read and agreed to the published version of the manuscript.
Funding
This research received no external funding. The APC was funded by Department of Air Conditioning, Heating, Gas Engineering and Air Protection Faculty of Environmental Engineering, Wrocław University of Science and Technology.
Institutional Review Board Statement
Not applicable.
Informed Consent Statement
Not applicable.
Data Availability Statement
Access to public meteorological measurement and observation data provided by the Institute of Meteorology and Water Management: https://danepubliczne.imgw.pl/data/dane_pomiarowo_obserwacyjne/dane_meteorologiczne/ (accessed on 5 November 2021).
Conflicts of Interest
The authors declare no conflict of interest. The funders had no role in the design of the study; in the collection, analyses, or interpretation of data; in the writing of the manuscript, or in the decision to publish the results.
Nomenclature
| Symbols | Additional | Indexes | |
| AHU | air handling unit | b.SH | before steam humidifier |
| C | cooler | cool | cooling |
| cp | specific heat, kj/(kgk) | da | dry air |
| DP | dew point temperature, °C | dp | dew point |
| Ei | energy demand for the selected exchanger, kWh | ext | external |
| H | heater | ext’ | after preheater |
| h | enthalpy, kJ/kgda | heat | heating |
| m | air mass flow rate, kg/s | hour.av | hourly average |
| Pa | water vapor pressure, Pa | hum | humidification |
| Pb | barometric pressure, hPa | int | internal |
| Ps | saturation water vapor pressure, Pa | mon.av | monthly average |
| PH | preheater | rec | after recovery heat |
| PHE | plate heat exchanger | exchanger | |
| Qi, | capacity of the selected exchanger, kW | rem | removed |
| RH | relative humidity | s | saturation |
| SH | steam humidifier | sup | supply |
| T | temperature, K | wv | water vapor |
| t | temperature, °C | ||
| V | air volume flow rate, m3/s | ||
| x | moisture content, kg/kgda | ||
| ρ | air density, kg/m3 | ||
| τmon | working time of the exchanger in a month, h |
References
- Mann, M.E.; Bradley, R.S.; Hughes, M.K. Northern hemisphere temperatures during the past millennium: Inferences, uncertainties, and limitations. Geophys. Res. Lett. 1999, 26, 759–762. [Google Scholar] [CrossRef] [Green Version]
- Cheng, L.; Zhu, J. 2017 was the warmest year on record for the global ocean. Adv. Atmos. Sci. 2018, 35, 261–263. [Google Scholar] [CrossRef] [Green Version]
- Carter, J.M.; Orive, M.E.; Gerhart, L.M.; Stern, J.H.; Marchin, R.M.; Nagel, J.; Ward, J.K. Warmest extreme year in U.S. history alters thermal requirements for tree phenology. Oecologia 2017, 183, 1197–1210. [Google Scholar] [CrossRef]
- Zhang, C.; Li, S.; Wan, J.H. The warmest year 2015 in the instrumental record and its comparison with year 1998. Atmos. Ocean. Sci. Lett. 2016, 9, 487–494. [Google Scholar] [CrossRef] [Green Version]
- Zhou, B.; Nie, Y.; Wang, P. 2014 Warmest Year in Modern Record: Climate Monitoring and Its Possible Cause. Chin. J. Urban Environ. Stud. 2016, 4, 1650018. [Google Scholar] [CrossRef]
- Barriopedro, D.; Fischer, E.M.; Luterbacher, J.; Trigo, R.M.; García-Herrera, R. The hot summer of 2010: Redrawing the temperature record map of Europe. Science 2011, 332, 220–224. [Google Scholar] [CrossRef] [Green Version]
- Garcia-Herrera, R.; Díaz, J.; Trigo, R.M.; Luterbacher, J.; Fischer, E.M. A review of the european summer heat wave of 2003. Crit. Rev. Environ. Sci. Technol. 2010, 40, 267–306. [Google Scholar] [CrossRef]
- IPCC; Masson-Delmotte, V.; Zhai, P.; Pirani, A.; Connors, S.L.; Péan, C.; Berger, S.; Caud, N.; Chen, Y.; Goldfarb, L.; et al. Climate Change 2021: The Physical Science Basis. Contribution of Working Group I to the Sixth Assessment Report of the Intergovernmental Panel on Climate Change; IPCC: Geneva, Switzerland, 2021. [Google Scholar]
- The 2030 Agenda for Sustainable Development. Available online: https://sustainabledevelopment.un.org/content/documents/21252030 Agenda for Sustainable Development web.pdf (accessed on 21 December 2021).
- Garonna, I.; de Jong, R.; de Wit, A.J.W.; Mücher, C.A.; Schmid, B.; Schaepman, M.E. Strong contribution of autumn phenology to changes in satellite-derived growing season length estimates across Europe (1982–2011). Glob. Chang. Biol. 2014, 20, 3457–3470. [Google Scholar] [CrossRef]
- Bartholy, J.; PongráCZ, R.; Nagy, J.; Pieczka, I.; Hufnagel, L. Regional climate change impacts on wild animals’ living territory in Central Europe. Appl. Ecol. Environ. Res. 2012, 10, 107–120. [Google Scholar] [CrossRef]
- Dunne, J.P.; Stouffer, R.J.; John, J.G. Reductions in labour capacity from heat stress under climate warming. Nat. Clim. Chang. 2013, 3, 563–566. [Google Scholar] [CrossRef]
- Gasparrini, A.; Guo, Y.; Sera, F.; Vicedo-Cabrera, A.M.; Huber, V.; Tong, S.; de Sousa Zanotti Stagliorio Coelho, M.; Nascimento Saldiva, P.H.; Lavigne, E.; Matus Correa, P.; et al. Projections of temperature-related excess mortality under climate change scenarios. Lancet Planet. Health 2017, 1, e360–e367. [Google Scholar] [CrossRef]
- Herrmann, F.R.; Griffiths, C.; Van Oyen, H.; Robine, J.-M.; Cheung, S.L.K.; Michel, J.-P.; Le Roy, S. Death toll exceeded 70,000 in Europe during the summer of 2003. Comptes Rendus Biol. 2008, 331, 171–178. [Google Scholar]
- Mitchell, D.; Heaviside, C.; Vardoulakis, S.; Huntingford, C.; Masato, G.; Guillod, B.P.; Frumhoff, P.; Bowery, A.; Wallom, D.; Allen, M. Attributing human mortality during extreme heat waves to anthropogenic climate change. Environ. Res. Lett. 2016, 11, 074006. [Google Scholar] [CrossRef]
- Mora, C.; Dousset, B.; Caldwell, I.R.; Powell, F.E.; Geronimo, R.C.; Bielecki, C.R.; Counsell, C.W.W.; Dietrich, B.S.; Johnston, E.T.; Louis, L.V.; et al. Global risk of deadly heat. Nat. Clim. Chang. 2017, 7, 501–506. [Google Scholar] [CrossRef]
- Dimitroulopoulou, C. Ventilation in European dwellings: A review. Build. Environ. 2012, 47, 109–125. [Google Scholar] [CrossRef]
- Peacock, A.D.; Jenkins, D.P.; Kane, D. Investigating the potential of overheating in UK dwellings as a consequence of extant climate change. Energy Policy 2010, 38, 3277–3288. [Google Scholar] [CrossRef]
- Vardoulakis, S.; Dimitroulopoulou, C.; Thornes, J.; Lai, K.M.; Taylor, J.; Myers, I.; Heaviside, C.; Mavrogianni, A.; Shrubsole, C.; Chalabi, Z.; et al. Impact of climate change on the domestic indoor environment and associated health risks in the UK. Environ. Int. 2015, 85, 299–313. [Google Scholar] [CrossRef] [Green Version]
- Barbosa, R.; Vicente, R.; Santos, R. Climate change and thermal comfort in Southern Europe housing: A case study from Lisbon. Build. Environ. 2015, 92, 440–451. [Google Scholar] [CrossRef]
- Limones-Rodríguez, N.; Marzo-Artigas, J.; Pita-López, M.F.; Díaz-Cuevas, M.P. The impact of climate change on air conditioning requirements in Andalusia at a detailed scale. Theor. Appl. Climatol. 2018, 134, 1047–1063. [Google Scholar] [CrossRef]
- Olonscheck, M.; Holsten, A.; Kropp, J.P. Heating and cooling energy demand and related emissions of the German residential building stock under climate change. Energy Policy 2011, 39, 4795–4806. [Google Scholar] [CrossRef]
- Mancini, F.; Basso, G. Lo How climate change affects the building energy consumptions due to cooling, heating, and electricity demands of Italian residential sector. Energies 2020, 13, 410. [Google Scholar] [CrossRef] [Green Version]
- Asimakopoulos, D.A.; Santamouris, M.; Farrou, I.; Laskari, M.; Saliari, M.; Zanis, G.; Giannakidis, G.; Tigas, K.; Kapsomenakis, J.; Douvis, C.; et al. Modelling the energy demand projection of the building sector in Greece in the 21st century. Energy Build. 2012, 49, 488–498. [Google Scholar] [CrossRef]
- Hausl, S.; Themessl, M.; Gadocha, S.; Schardinger, I.; Biberacher, M.; Castellazzi, B.; Gobiet, A. Effects of climate change on regional energy systems focussing on space heating and cooling: A case study of Austria. Therm. Sci. 2014, 18, 771–786. [Google Scholar] [CrossRef] [Green Version]
- Semmler, T.; Mcgrath, R.; Steele-Dunne, S.; Hanafin, J.; Nolana, P.; Wanga, S. Influence of climate change on heating and cooling energy demand in Ireland. Int. J. Climatol. 2010, 30, 1502–1511. [Google Scholar] [CrossRef]
- Bazazzadeh, H.; Pilechiha, P.; Nadolny, A.; Mahdavinejad, M.; Hashemi Safaei, S.S. The impact assessment of climate change on building energy consumption in poland. Energies 2021, 14, 4084. [Google Scholar] [CrossRef]
- Dino, I.G.; Meral Akgül, C. Impact of climate change on the existing residential building stock in Turkey: An analysis on energy use, greenhouse gas emissions and occupant comfort. Renew. Energy 2019, 141, 828–846. [Google Scholar] [CrossRef]
- Lam, T.N.T.; Wan, K.K.W.; Wong, S.L.; Lam, J.C. Impact of climate change on commercial sector air conditioning energy consumption in subtropical Hong Kong. Appl. Energy 2010, 87, 2321–2327. [Google Scholar] [CrossRef]
- Xiang, C.; Tian, Z. Impact of climate change on building heating energy consumption in Tianjin. Front. Energy 2013, 7, 518–524. [Google Scholar] [CrossRef]
- Wang, H.; Chen, Q. Impact of climate change heating and cooling energy use in buildings in the United States. Energy Build. 2014, 82, 428–436. [Google Scholar] [CrossRef] [Green Version]
- Rosenthal, D.H.; Gruenspecht, H.K.; Moran, E.A. Effects of Global Warming on Energy Use for Space Heating and Cooling in the United States. Energy J. 1995, 16. [Google Scholar] [CrossRef]
- Smith, J.; Tirpak, D. The Potential Effects of Global Climate Change on the United States, Office Of Policy, Planning And Evaluation; NSCEP: Cincinnati, OH, USA, 1989. [Google Scholar]
- Pouriya, J.; Umberto, B. Building energy demand within a climate change perspective: The need for future weather file. In Proceedings of the IOP Conference Series: Materials Science and Engineering, Kazimierz Dolny, Poland, 21–23 November 2019; Volume 609. [Google Scholar]
- Berardi, U.; Jafarpur, P. Assessing the impact of climate change on building heating and cooling energy demand in Canada. Renew. Sustain. Energy Rev. 2020, 121, 109681. [Google Scholar] [CrossRef]
- Invidiata, A.; Ghisi, E. Impact of climate change on heating and cooling energy demand in houses in Brazil. Energy Build. 2016, 130, 20–32. [Google Scholar] [CrossRef]
- Wang, X.; Chen, D.; Ren, Z. Assessment of climate change impact on residential building heating and cooling energy requirement in Australia. Build. Environ. 2010, 45, 1663–1682. [Google Scholar] [CrossRef]
- Area and Population in the Territorial Prole in 2020; Statistics Poland, Standards and Registers Department: Warsaw, Poland, 2020.
- Kundzewicz, Z.W.; Matczak, P. Climate change regional review: Poland. Wiley Interdiscip. Rev. Clim. Chang. 2012, 3, 297–311. [Google Scholar] [CrossRef]
- Institute of Meteorology and Water Management. Available online: https://www.imgw.pl (accessed on 28 December 2021).
- PN-EN 16798-1:2019 Energy Performance of Buildings—Ventilation for Buildings—Part 1: Indoor Environmental Input Pa-Rameters for Design and Assessment of Energy Performance of Buildings Addressing Indoor Air Quality, Thermal Environment, Lighting and Acoustics; British Standards Institution: London, UK, 2019.
- Eurovent 6/11-2008 Thermal Test Method for Ducted Fan Coil Units. Available online: https://eurovent.eu/sites/default/files/Eurovent%20REC%206-11%20-%20Thermal%20test%20method%20for%20ducted%20fan%20coil%20units%20-%202008%20-%20EN.pdf (accessed on 28 December 2021).
- Commission Regulation (EU) No 1253/2014 of 7 July 2014 Implementing Directive 2009/125/EC of the European Parliament and of the Council with Regard to Ecodesign Requirements for Ventilation Units. Available online: https://eur-lex.europa.eu/legal-content/EN/TXT/?uri=CELEX%3A32014R1253 (accessed on 28 December 2021).
- PN-EN 16798-5-1:2017-07 Energy Performance of Buildings—Ventilation for Buildings—Part 5-1: Calculation Methods for Energy Requirements of Ventilation and Air Conditioning Systems (Modules M5-6, M5-8, M6-5, M6-8, M7-5, M7-8)—Method 1: Distribution and Generation; British Standards Institution: London, UK, 2017.
- Recknagel, H.; Sprenger, E.; Schramek, E.-R. Kompendium Wiedzy Ogrzewnictwo, Klimatyzacja, Ciepła Woda, Chłodnictwo 08/09; Omni Scala: Wrocław, Poland, 2008; ISBN 9788392683360. [Google Scholar]
- Huang, J. A simple accurate formula for calculating saturation vapor pressure of water and ice. J. Appl. Meteorol. Climatol. 2018, 57, 1265–1272. [Google Scholar] [CrossRef]
- Jones, W.P. Klimatyzacja; Arkady: Warsaw, Poland, 1981. [Google Scholar]
- Pełech, A. Wentylacja i Klimatyzacja. Podstawy; Oficyna Wydawnicza Politechniki Wrocławskiej: Wrocław, Poland, 2008; ISBN 9788374933711. [Google Scholar]
- Chadderton, D.V. Air Conditioning: A practical Introduction; E & FN Spon: London, UK, 1993; ISBN 0419153802. [Google Scholar]
- Ngarambe, J.; Yun, G.Y.; Santamouris, M. The use of artificial intelligence (AI) methods in the prediction of thermal comfort in buildings: Energy implications of AI-based thermal comfort controls. Energy Build. 2020, 211, 109807. [Google Scholar] [CrossRef]
- Carli, R.; Cavone, G.; Ben Othman, S.; Dotoli, M. IoT based architecture for model predictive control of HVAC systems in smart buildings. Sensors 2020, 20, 781. [Google Scholar] [CrossRef] [PubMed] [Green Version]
- Klauco, M.; Kvasnica, M. Explicit MPC approach to PMV-based thermal comfort control. In Proceedings of the IEEE Conference on Decision and Control, Los Angeles, CA, USA, 15–17 December 2014. [Google Scholar]
Figure 1.
The territory of Poland and the location of Warsaw.

Figure 2.
Hourly average external air parameters for Warsaw for the summer months (June, July, August) in the i-x Mollier diagram for years: (a) 1980 and (b) 2019.
Figure 2.
Hourly average external air parameters for Warsaw for the summer months (June, July, August) in the i-x Mollier diagram for years: (a) 1980 and (b) 2019.

Figure 3.
Hourly average external air parameters for the winter months (December, January, February) in the i-x Mollier diagram for years: (a) 1969, (b) 1980 and (c) 2019.
Figure 3.
Hourly average external air parameters for the winter months (December, January, February) in the i-x Mollier diagram for years: (a) 1969, (b) 1980 and (c) 2019.

Figure 4.
Air treatment system configuration (F, filter; PH, preheater; PHE, plate heat exchanger; H, heater; C, cooler; SH, steam humidifier; SF, supply fan; EF, exhaust fan).
Figure 4.
Air treatment system configuration (F, filter; PH, preheater; PHE, plate heat exchanger; H, heater; C, cooler; SH, steam humidifier; SF, supply fan; EF, exhaust fan).

Figure 5.
Procedure scheme.

Figure 6.
External energy supplied to the system to treat 1000 L/s of primary air.

Figure 7.
Relative energy for air cooling compared to 1961.

Figure 8.
Relative energy for air heating compared to 1961.

Figure 9.
Relative energy for air humidification compared to 1961.

Figure 10.
Annual energy demand: (a) cooling, (b) heating and (c) humidification for three supply air temperature variants.
Figure 10.
Annual energy demand: (a) cooling, (b) heating and (c) humidification for three supply air temperature variants.

Figure 11.
Share of energy for air treatment steps in total energy demand, tsup2 = 12 °C.

Figure 12.
Share of energy for air treatment steps in total energy demand, tsup1 = 15 °C.

Figure 13.
Share of energy for air treatment steps in total energy demand, tsup3 = 18 °C.

Figure 14.
Relative energy for air treatment.

Figure 15.
Energy demand for freeze protection system and share in heating energy: (a) tsup2 = 12 °C, (b) tsup1 = 15 °C, (c) tsup3 = 18 °C.
Figure 15.
Energy demand for freeze protection system and share in heating energy: (a) tsup2 = 12 °C, (b) tsup1 = 15 °C, (c) tsup3 = 18 °C.

Figure 16.
Energy recovered in plate heat exchanger and share in total air treatment energy: (a) tsup2 = 12 °C, (b) tsup1 = 15 °C, (c) tsup3 = 18 °C.
Figure 16.
Energy recovered in plate heat exchanger and share in total air treatment energy: (a) tsup2 = 12 °C, (b) tsup1 = 15 °C, (c) tsup3 = 18 °C.

Figure 17.
Relative capacity of heat exchangers, compared to 1969: (a) cooler, (b) preheater, (c) heater, (d) humidifier, (e) and plate heat exchanger.
Figure 17.
Relative capacity of heat exchangers, compared to 1969: (a) cooler, (b) preheater, (c) heater, (d) humidifier, (e) and plate heat exchanger.


Table 1.
Monthly average temperature from 1961 to 2020 in Warsaw.
| I | II | III | IV | V | VI | VII | VIII | IX | X | XI | XII | I–XII | |
|---|---|---|---|---|---|---|---|---|---|---|---|---|---|
| 1961 | −2.6 | 1.8 | 5.4 | 10.4 | 12.5 | 18.7 | 16.7 | 16.7 | 14.8 | 11.1 | 3.9 | −3.1 | 8.9 |
| 1962 | 0.0 | −2.2 | −1.4 | 11.1 | 11.3 | 15.4 | 16.7 | 17.2 | 12.7 | 8.5 | 4.2 | −4.5 | 7.4 |
| 1963 | −12.1 | −7.4 | −1.5 | 8.7 | 16.1 | 17.6 | 21.3 | 19.7 | 15.2 | 8.5 | 6.4 | −4.7 | 7.3 |
| 1964 | −3.4 | −4.5 | −2.9 | 8.1 | 13.7 | 20.5 | 19.2 | 16.6 | 14.0 | 8.1 | 3.5 | 0.0 | 7.7 |
| 1965 | −1.0 | −5.3 | 1.0 | 6.5 | 10.4 | 16.6 | 17.0 | 16.3 | 15.3 | 7.8 | −1.1 | 0.4 | 7.0 |
| 1966 | −4.7 | −0.4 | 2.8 | 8.9 | 14.2 | 18.4 | 19.3 | 17.9 | 12.6 | 11.3 | 2.9 | 0.1 | 8.6 |
| 1967 | −4.7 | 0.7 | 5.4 | 7.9 | 14.9 | 17.2 | 20.5 | 17.9 | 16.7 | 11.7 | 4.1 | −1.2 | 9.3 |
| 1968 | −3.5 | −0.6 | 3.5 | 10.2 | 12.3 | 19.2 | 17.8 | 18.7 | 13.9 | 8.6 | 3.9 | −3.3 | 8.4 |
| 1969 | −5.7 | −4.1 | −1.8 | 7.2 | 15.4 | 17.9 | 19.7 | 17.5 | 14.3 | 8.9 | 5.6 | −8.4 | 7.2 |
| 1970 | −5.8 | −4.9 | 0.6 | 7.3 | 13.2 | 17.8 | 17.7 | 17.7 | 12.7 | 7.9 | 4.8 | 0.7 | 7.5 |
| 1971 | −2.8 | 0.1 | 0.3 | 8.0 | 16.2 | 16.4 | 19.9 | 20.3 | 11.5 | 8.5 | 2.4 | 3.2 | 8.7 |
| 1972 | −7.2 | −0.4 | 4.0 | 8.2 | 14.1 | 17.7 | 21.3 | 17.3 | 12.2 | 6.4 | 4.4 | 0.4 | 8.2 |
| 1973 | −2.2 | 1.6 | 4.4 | 7.5 | 13.5 | 17.0 | 18.7 | 18.4 | 13.3 | 6.6 | 1.9 | −0.4 | 8.4 |
| 1974 | −0.8 | 2.5 | 4.8 | 7.7 | 11.6 | 15.2 | 16.4 | 18.6 | 14.2 | 6.9 | 4.1 | 2.7 | 8.7 |
| 1975 | 3.1 | −0.4 | 5.0 | 7.5 | 15.5 | 17.1 | 20.2 | 19.7 | 16.6 | 8.3 | 2.1 | 1.3 | 9.7 |
| 1976 | −2.4 | −3.7 | −0.6 | 8.2 | 12.9 | 15.9 | 19.4 | 16.4 | 13.3 | 7.1 | 4.9 | −0.8 | 7.6 |
| 1977 | −1.3 | 0.5 | 5.9 | 6.8 | 13.4 | 18.2 | 16.9 | 16.3 | 11.4 | 9.6 | 5.6 | −0.4 | 8.6 |
| 1978 | −1.0 | −3.6 | 3.7 | 6.9 | 12.8 | 16.2 | 17.0 | 16.7 | 11.4 | 9.0 | 5.6 | −3.9 | 7.6 |
| 1979 | −5.7 | −4.9 | 2.2 | 7.1 | 15.6 | 20.7 | 15.6 | 17.2 | 14.3 | 6.8 | 3.2 | 1.9 | 7.8 |
| 1980 | −5.4 | −1.4 | −0.3 | 7.2 | 10.4 | 16.2 | 17.0 | 16.9 | 13.1 | 8.7 | 2.1 | −0.2 | 7.0 |
| 1981 | −2.7 | −0.5 | 4.4 | 6.6 | 14.9 | 17.6 | 18.6 | 17.1 | 14.4 | 9.2 | 3.6 | −3.0 | 8.4 |
| 1982 | −3.2 | −1.6 | 4.2 | 6.3 | 14.8 | 16.4 | 19.9 | 19.9 | 15.8 | 9.3 | 5.5 | 1.4 | 9.1 |
| 1983 | 3.5 | −1.8 | 4.6 | 10.5 | 16.4 | 17.9 | 20.2 | 19.1 | 15.1 | 9.3 | 2.7 | 0.1 | 9.8 |
| 1984 | 0.5 | −1.4 | 1.5 | 9.8 | 14.4 | 15.3 | 16.5 | 18.9 | 13.5 | 10.9 | 2.7 | −0.8 | 8.5 |
| 1985 | −7.5 | −8.4 | 2.3 | 9.0 | 16.0 | 15.5 | 18.1 | 18.7 | 12.7 | 8.6 | 1.1 | 2.0 | 7.3 |
| 1986 | −1.1 | −9.3 | 2.5 | 9.4 | 15.5 | 17.4 | 18.6 | 18.1 | 11.4 | 8.9 | 5.7 | 0.2 | 8.1 |
| 1987 | −12.1 | −0.3 | −2.0 | 7.6 | 12.8 | 16.5 | 18.7 | 15.9 | 13.3 | 8.9 | 4.4 | 1.0 | 7.1 |
| 1988 | 0.9 | 1.0 | 1.4 | 8.0 | 15.8 | 17.6 | 20.3 | 18.1 | 14.1 | 8.2 | 0.6 | 1.1 | 8.9 |
| 1989 | 2.4 | 4.4 | 6.2 | 9.6 | 15.0 | 16.3 | 19.4 | 18.5 | 14.6 | 10.7 | 1.8 | 1.5 | 10.0 |
| 1990 | 2.2 | 5.5 | 7.2 | 9.6 | 14.6 | 17.9 | 17.5 | 18.2 | 11.5 | 9.8 | 5.0 | 0.2 | 9.9 |
| 1991 | 0.3 | −3.4 | 4.3 | 8.4 | 11.3 | 16.2 | 19.7 | 18.6 | 14.9 | 8.2 | 4.5 | −0.9 | 8.5 |
| 1992 | −0.6 | 1.5 | 4.0 | 8.0 | 14.3 | 18.8 | 20.8 | 22.1 | 13.0 | 6.1 | 4.2 | −0.1 | 9.3 |
| 1993 | 0.7 | −0.9 | 1.7 | 9.6 | 16.8 | 16.0 | 17.3 | 17.2 | 12.3 | 8.3 | −2.2 | 2.4 | 8.3 |
| 1994 | 2.6 | −2.1 | 4.2 | 9.7 | 13.0 | 16.6 | 22.4 | 19.0 | 15.2 | 7.2 | 4.1 | 1.2 | 9.4 |
| 1995 | −1.1 | 3.7 | 3.4 | 8.3 | 13.3 | 18.1 | 20.8 | 19.0 | 13.6 | 10.7 | 0.4 | −4.7 | 8.8 |
| 1996 | −5.8 | −5.4 | −1.2 | 8.6 | 15.8 | 17.3 | 16.9 | 18.9 | 10.7 | 9.5 | 6.3 | −5.0 | 7.2 |
| 1997 | −4.0 | 2.3 | 3.3 | 5.7 | 14.2 | 17.4 | 18.2 | 19.3 | 13.4 | 6.5 | 3.2 | 0.2 | 8.3 |
| 1998 | 1.1 | 3.7 | 2.1 | 10.5 | 15.2 | 18.4 | 18.4 | 16.9 | 13.4 | 8.1 | −1.6 | −2.0 | 8.7 |
| 1999 | 0.4 | −0.9 | 4.9 | 10.3 | 13.2 | 18.5 | 21.2 | 18.4 | 15.6 | 8.6 | 1.9 | 1.0 | 9.4 |
| 2000 | −0.8 | 3.0 | 3.7 | 12.8 | 15.8 | 18.6 | 17.3 | 18.5 | 12.0 | 11.9 | 6.9 | 2.0 | 10.1 |
| 2001 | 0.1 | −0.1 | 2.8 | 8.9 | 15.2 | 15.8 | 21.3 | 19.8 | 12.4 | 11.2 | 2.7 | −3.9 | 8.9 |
| 2002 | −0.2 | 4.2 | 5.0 | 9.4 | 17.9 | 18.3 | 21.8 | 20.9 | 13.9 | 7.5 | 4.5 | −5.8 | 9.8 |
| 2003 | −2.4 | −4.0 | 2.6 | 7.7 | 16.5 | 18.7 | 21.1 | 19.5 | 14.1 | 5.7 | 5.6 | 1.6 | 8.9 |
| 2004 | −4.5 | 0.4 | 4.1 | 9.1 | 12.8 | 16.6 | 18.4 | 19.4 | 13.8 | 10.4 | 4.0 | 2.3 | 8.9 |
| 2005 | 1.5 | −2.5 | 0.1 | 9.5 | 14.5 | 16.8 | 20.9 | 17.6 | 15.4 | 9.5 | 3.2 | 0.0 | 8.9 |
| 2006 | −7.7 | −2.8 | −0.3 | 9.4 | 14.6 | 18.4 | 23.8 | 18.4 | 16.1 | 11.2 | 6.6 | 4.7 | 9.4 |
| 2007 | 3.9 | −1.4 | 7.3 | 10.0 | 16.4 | 20.2 | 19.9 | 19.7 | 13.8 | 8.7 | 2.3 | 0.6 | 10.1 |
| 2008 | 1.5 | 3.6 | 4.0 | 10.0 | 14.3 | 19.4 | 19.8 | 19.4 | 13.2 | 10.6 | 5.7 | 2.0 | 10.3 |
| 2009 | −2.1 | −0.2 | 3.1 | 11.5 | 14.1 | 16.7 | 20.4 | 18.6 | 15.5 | 6.7 | 5.4 | −0.8 | 9.1 |
| 2010 | −7.8 | −2.1 | 3.8 | 9.8 | 13.8 | 18.1 | 22.3 | 20.6 | 12.6 | 5.7 | 5.8 | −5.6 | 8.1 |
| 2011 | −0.6 | −4.2 | 3.5 | 11.1 | 15.2 | 19.5 | 18.5 | 18.9 | 15.3 | 8.4 | 3.1 | 3.0 | 9.3 |
| 2012 | −0.9 | −6.3 | 5.0 | 9.9 | 15.8 | 17.6 | 21.5 | 19.3 | 15.0 | 8.5 | 6.1 | −2.9 | 9.1 |
| 2013 | −3.4 | −0.3 | −1.7 | 8.5 | 16.0 | 18.9 | 20.3 | 19.5 | 12.2 | 10.3 | 5.7 | 2.7 | 9.1 |
| 2014 | −2.6 | 2.2 | 7.1 | 11.0 | 14.7 | 16.6 | 21.5 | 18.8 | 15.1 | 10.0 | 5.0 | 0.8 | 10.0 |
| 2015 | 1.6 | 1.5 | 5.9 | 9.2 | 14.0 | 18.6 | 20.6 | 23.4 | 16.1 | 7.9 | 5.7 | 5.0 | 10.8 |
| 2016 | −2.6 | 3.9 | 4.9 | 11.7 | 16.5 | 20.2 | 20.6 | 19.5 | 17.4 | 7.8 | 3.4 | 1.4 | 10.4 |
| 2017 | −3.3 | −0.5 | 6.6 | 8.0 | 14.7 | 18.9 | 19.2 | 19.7 | 13.9 | 10.1 | 5.2 | 2.6 | 9.6 |
| 2018 | 0.9 | −3.3 | 1.0 | 13.8 | 17.8 | 19.3 | 21.2 | 20.9 | 16.1 | 10.2 | 4.6 | 1.8 | 10.4 |
| 2019 | −1.6 | 3.5 | 6.4 | 10.4 | 13.7 | 23.1 | 19.3 | 20.7 | 14.7 | 11.2 | 6.5 | 3.6 | 11.0 |
| 2020 | 2.9 | 4.3 | 5.1 | 9.6 | 12.1 | 19.1 | 19.6 | 20.2 | 15.5 | 10.8 | 6.1 | 2.3 | 10.6 |
Table 2.
Monthly average relative humidity from 1961 to 2020 in Warsaw.
| I | II | III | IV | V | VI | VII | VIII | IX | X | XI | XII | I–XII | |
|---|---|---|---|---|---|---|---|---|---|---|---|---|---|
| 1961 | 81.8 | 87.0 | 78.0 | 64.7 | 72.0 | 67.7 | 74.5 | 77.7 | 74.2 | 73.8 | 87.8 | 83.8 | 76.9 |
| 1962 | 81.6 | 82.2 | 76.9 | 69.7 | 79.1 | 66.1 | 70.4 | 75.5 | 80.7 | 85.5 | 85.9 | 84.8 | 78.2 |
| 1963 | 85.2 | 80.7 | 72.7 | 66.9 | 69.6 | 63.5 | 56.4 | 69.1 | 79.0 | 86.2 | 84.3 | 87.4 | 75.1 |
| 1964 | 84.9 | 83.6 | 82.0 | 71.2 | 62.0 | 64.3 | 64.2 | 73.7 | 73.1 | 78.9 | 90.6 | 88.7 | 76.4 |
| 1965 | 86.6 | 81.5 | 79.1 | 73.2 | 70.7 | 70.3 | 72.5 | 74.6 | 77.7 | 84.1 | 87.7 | 85.1 | 78.6 |
| 1966 | 88.0 | 84.4 | 80.2 | 75.0 | 70.5 | 62.8 | 72.2 | 69.2 | 76.1 | 83.9 | 89.8 | 88.7 | 78.4 |
| 1967 | 82.3 | 79.5 | 78.7 | 75.0 | 67.6 | 68.9 | 65.2 | 73.3 | 76.9 | 81.0 | 86.2 | 87.8 | 76.9 |
| 1968 | 87.6 | 87.2 | 74.8 | 64.6 | 74.8 | 66.8 | 68.8 | 67.6 | 80.5 | 84.4 | 88.3 | 84.1 | 77.5 |
| 1969 | 82.7 | 80.8 | 75.9 | 71.1 | 67.9 | 67.1 | 63.6 | 68.9 | 74.3 | 80.3 | 82.6 | 86.0 | 75.1 |
| 1970 | 85.6 | 82.7 | 82.1 | 75.0 | 70.3 | 67.5 | 74.6 | 74.4 | 77.2 | 85.8 | 87.0 | 90.3 | 79.4 |
| 1971 | 87.2 | 86.3 | 80.4 | 70.0 | 63.5 | 72.7 | 60.1 | 58.2 | 81.7 | 79.8 | 83.5 | 88.8 | 76.0 |
| 1972 | 81.0 | 83.2 | 67.9 | 73.7 | 72.0 | 72.6 | 72.9 | 82.3 | 85.2 | 82.0 | 85.4 | 84.5 | 78.6 |
| 1973 | 84.6 | 87.1 | 73.5 | 67.0 | 68.9 | 69.5 | 75.4 | 63.6 | 75.4 | 83.6 | 81.1 | 87.3 | 76.4 |
| 1974 | 84.8 | 82.8 | 63.1 | 57.3 | 69.8 | 73.1 | 76.9 | 74.0 | 78.5 | 87.7 | 85.3 | 87.2 | 76.7 |
| 1975 | 84.6 | 82.2 | 75.3 | 71.6 | 65.3 | 68.3 | 67.9 | 67.8 | 70.9 | 86.2 | 84.5 | 84.7 | 75.8 |
| 1976 | 83.8 | 76.9 | 77.7 | 66.1 | 64.4 | 63.6 | 66.4 | 72.6 | 75.7 | 81.0 | 90.3 | 86.7 | 75.4 |
| 1977 | 84.0 | 86.0 | 74.8 | 71.5 | 69.6 | 67.5 | 72.4 | 82.9 | 77.8 | 83.0 | 81.1 | 87.4 | 78.2 |
| 1978 | 80.6 | 81.1 | 78.3 | 69.2 | 65.6 | 68.2 | 73.5 | 77.0 | 83.5 | 87.0 | 85.2 | 83.5 | 77.7 |
| 1979 | 84.6 | 74.4 | 80.4 | 69.3 | 62.8 | 63.4 | 74.3 | 79.8 | 77.0 | 75.3 | 83.3 | 85.4 | 75.8 |
| 1980 | 84.4 | 86.9 | 72.5 | 71.8 | 63.3 | 78.1 | 82.9 | 78.6 | 83.5 | 82.8 | 80.5 | 84.5 | 79.2 |
| 1981 | 81.7 | 77.0 | 73.3 | 62.6 | 67.7 | 76.6 | 73.2 | 75.6 | 85.1 | 82.1 | 85.9 | 87.4 | 77.4 |
| 1982 | 79.5 | 81.6 | 70.4 | 70.4 | 65.9 | 72.9 | 68.9 | 68.3 | 74.9 | 83.1 | 82.2 | 90.8 | 75.7 |
| 1983 | 83.1 | 81.0 | 75.5 | 69.9 | 71.7 | 60.8 | 63.4 | 66.5 | 73.9 | 78.2 | 83.9 | 81.6 | 74.1 |
| 1984 | 82.8 | 79.1 | 72.2 | 62.3 | 74.1 | 74.6 | 76.1 | 67.9 | 81.8 | 80.3 | 83.5 | 86.3 | 76.8 |
| 1985 | 81.9 | 79.0 | 81.7 | 67.8 | 68.2 | 76.1 | 73.0 | 78.3 | 79.2 | 87.6 | 82.1 | 87.4 | 78.5 |
| 1986 | 84.3 | 76.3 | 73.5 | 68.4 | 64.9 | 69.2 | 69.5 | 73.9 | 80.6 | 79.6 | 84.6 | 85.3 | 75.8 |
| 1987 | 83.7 | 81.2 | 73.5 | 68.0 | 65.8 | 76.1 | 72.5 | 76.3 | 78.0 | 75.6 | 87.2 | 88.4 | 77.2 |
| 1988 | 84.3 | 83.1 | 80.7 | 59.5 | 63.4 | 71.3 | 71.2 | 71.2 | 78.6 | 73.4 | 81.1 | 81.7 | 75.0 |
| 1989 | 83.3 | 77.1 | 67.4 | 69.6 | 63.3 | 75.8 | 65.2 | 69.6 | 80.0 | 81.5 | 88.8 | 82.7 | 75.4 |
| 1990 | 82.3 | 76.7 | 68.0 | 66.7 | 65.6 | 68.8 | 72.5 | 73.6 | 82.6 | 77.2 | 86.8 | 84.3 | 75.4 |
| 1991 | 82.5 | 78.0 | 77.9 | 68.7 | 68.2 | 69.6 | 69.1 | 74.6 | 73.8 | 78.6 | 84.2 | 85.8 | 75.9 |
| 1992 | 85.4 | 85.9 | 77.2 | 71.2 | 67.6 | 67.1 | 63.5 | 62.9 | 80.1 | 84.7 | 85.5 | 90.1 | 76.8 |
| 1993 | 80.5 | 86.3 | 77.5 | 67.1 | 66.4 | 71.2 | 75.2 | 73.6 | 84.8 | 84.5 | 83.3 | 86.4 | 78.1 |
| 1994 | 86.2 | 81.9 | 78.2 | 73.5 | 71.3 | 68.1 | 61.1 | 75.0 | 83.0 | 82.7 | 81.4 | 88.1 | 77.5 |
| 1995 | 83.9 | 80.6 | 77.5 | 72.3 | 69.9 | 75.2 | 69.2 | 69.7 | 86.9 | 86.2 | 87.1 | 82.6 | 78.4 |
| 1996 | 82.0 | 79.2 | 73.6 | 62.1 | 70.5 | 67.2 | 76.0 | 74.1 | 84.6 | 84.0 | 83.2 | 86.0 | 76.9 |
| 1997 | 84.9 | 77.2 | 71.7 | 64.8 | 65.7 | 68.3 | 79.3 | 69.7 | 76.5 | 83.4 | 87.0 | 86.1 | 76.2 |
| 1998 | 82.5 | 79.4 | 70.2 | 73.0 | 65.9 | 71.6 | 73.5 | 77.0 | 81.5 | 80.3 | 85.5 | 82.5 | 76.9 |
| 1999 | 84.3 | 83.0 | 74.0 | 72.3 | 64.1 | 78.0 | 66.0 | 67.6 | 75.5 | 83.1 | 87.2 | 81.5 | 76.4 |
| 2000 | 86.3 | 78.9 | 77.6 | 62.7 | 56.2 | 57.0 | 76.0 | 74.7 | 80.6 | 75.0 | 88.3 | 89.3 | 75.2 |
| 2001 | 85.0 | 80.2 | 74.6 | 75.9 | 59.7 | 72.5 | 76.8 | 73.5 | 87.0 | 86.4 | 84.2 | 85.4 | 78.4 |
| 2002 | 85.7 | 78.3 | 72.9 | 64.2 | 63.0 | 69.0 | 65.5 | 69.1 | 76.0 | 83.2 | 84.8 | 83.6 | 74.6 |
| 2003 | 86.4 | 81.6 | 72.9 | 63.3 | 64.1 | 60.7 | 71.3 | 65.2 | 75.0 | 84.5 | 86.4 | 84.9 | 74.7 |
| 2004 | 83.4 | 79.5 | 76.4 | 63.8 | 68.4 | 66.1 | 73.0 | 73.3 | 74.7 | 81.6 | 87.7 | 87.8 | 76.3 |
| 2005 | 84.0 | 85.4 | 84.2 | 63.7 | 67.3 | 66.7 | 66.0 | 72.9 | 83.8 | 83.2 | 85.1 | 88.2 | 77.5 |
| 2006 | 82.8 | 89.1 | 86.4 | 71.0 | 66.0 | 64.6 | 65.9 | 82.5 | 86.1 | 87.1 | 87.8 | 86.9 | 79.7 |
| 2007 | 83.1 | 90.6 | 78.9 | 69.9 | 67.5 | 70.7 | 72.2 | 74.2 | 82.3 | 84.8 | 88.1 | 88.4 | 79.2 |
| 2008 | 88.0 | 84.8 | 84.4 | 76.5 | 69.4 | 52.6 | 67.9 | 68.9 | 84.5 | 80.9 | 88.3 | 88.1 | 77.9 |
| 2009 | 87.6 | 88.9 | 84.9 | 60.1 | 67.6 | 78.7 | 75.4 | 78.1 | 78.8 | 89.1 | 89.6 | 87.8 | 80.6 |
| 2010 | 85.3 | 87.7 | 76.9 | 69.7 | 83.4 | 72.3 | 72.4 | 78.0 | 86.1 | 83.2 | 87.3 | 89.2 | 81.0 |
| 2011 | 85.3 | 87.7 | 76.9 | 69.7 | 83.4 | 72.3 | 72.4 | 78.0 | 86.1 | 83.2 | 87.3 | 89.2 | 81.0 |
| 2012 | 89.1 | 82.4 | 74.3 | 67.7 | 62.8 | 69.6 | 65.5 | 70.9 | 74.9 | 84.9 | 88.2 | 86.3 | 76.4 |
| 2013 | 85.7 | 88.9 | 70.9 | 71.4 | 69.5 | 71.6 | 63.8 | 67.3 | 82.7 | 81.9 | 89.4 | 84.4 | 77.3 |
| 2014 | 86.7 | 82.2 | 73.6 | 67.4 | 70.6 | 69.4 | 68.2 | 70.5 | 74.2 | 78.3 | 86.6 | 85.2 | 76.1 |
| 2015 | 84.1 | 80.1 | 66.8 | 62.6 | 62.9 | 54.1 | 59.1 | 49.1 | 76.0 | 77.4 | 83.6 | 81.6 | 69.8 |
| 2016 | 80.9 | 79.1 | 71.2 | 56.6 | 58.5 | 53.8 | 67.5 | 66.2 | 64.1 | 85.4 | 85.6 | 90.9 | 71.7 |
| 2017 | 85.8 | 83.1 | 78.3 | 73.1 | 66.6 | 64.3 | 71.7 | 73.4 | 87.0 | 86.1 | 85.7 | 85.2 | 78.4 |
| 2018 | 84.4 | 85.1 | 71.3 | 61.5 | 59.9 | 61.6 | 67.6 | 67.8 | 73.4 | 79.7 | 87.2 | 88.7 | 74.0 |
| 2019 | 86.2 | 78.2 | 73.3 | 55.7 | 70.5 | 56.5 | 65.1 | 64.2 | 76.2 | 81.4 | 85.9 | 85.0 | 73.2 |
| 2020 | 84.8 | 78.1 | 70.0 | 50.2 | 65.3 | 75.9 | 68.0 | 69.1 | 77.6 | 86.7 | 88.0 | 87.9 | 75.1 |
Table 3.
Monthly average moisture content from 1961 to 2020 in Warsaw.
| I | II | III | IV | V | VI | VII | VIII | IX | X | XI | XII | I–XII | |
|---|---|---|---|---|---|---|---|---|---|---|---|---|---|
| 1961 | 2.5 | 3.7 | 4.3 | 5.1 | 6.5 | 9.1 | 8.8 | 9.2 | 7.8 | 6.1 | 4.4 | 2.5 | 5.8 |
| 1962 | 3.1 | 2.6 | 2.6 | 5.7 | 6.6 | 7.2 | 8.3 | 9.2 | 7.4 | 5.9 | 4.4 | 2.3 | 5.4 |
| 1963 | 1.3 | 1.7 | 2.5 | 4.7 | 7.9 | 8.0 | 8.9 | 9.9 | 8.5 | 5.9 | 5.0 | 2.3 | 5.5 |
| 1964 | 2.5 | 2.2 | 2.5 | 4.8 | 6.0 | 9.7 | 8.9 | 8.7 | 7.3 | 5.3 | 4.4 | 3.4 | 5.5 |
| 1965 | 3.1 | 2.1 | 3.2 | 4.4 | 5.5 | 8.3 | 8.7 | 8.6 | 8.4 | 5.5 | 3.1 | 3.3 | 5.3 |
| 1966 | 2.3 | 3.1 | 3.7 | 5.3 | 7.1 | 8.3 | 10.1 | 8.8 | 6.9 | 7.0 | 4.2 | 3.3 | 5.8 |
| 1967 | 2.2 | 3.1 | 4.4 | 5.0 | 7.1 | 8.4 | 9.8 | 9.4 | 9.1 | 6.9 | 4.4 | 3.0 | 6.1 |
| 1968 | 2.5 | 3.2 | 3.6 | 5.0 | 6.6 | 9.3 | 8.7 | 9.1 | 8.0 | 5.9 | 4.4 | 2.5 | 5.7 |
| 1969 | 2.0 | 2.2 | 2.5 | 4.5 | 7.4 | 8.6 | 9.1 | 8.6 | 7.5 | 5.7 | 4.7 | 1.7 | 5.4 |
| 1970 | 2.1 | 2.1 | 3.2 | 4.8 | 6.6 | 8.6 | 9.4 | 9.4 | 7.0 | 5.7 | 4.6 | 3.6 | 5.6 |
| 1971 | 2.7 | 3.2 | 3.1 | 4.7 | 7.3 | 8.4 | 8.7 | 8.6 | 6.9 | 5.5 | 3.7 | 4.2 | 5.6 |
| 1972 | 1.8 | 3.1 | 3.4 | 5.0 | 7.2 | 9.2 | 11.6 | 10.1 | 7.5 | 4.9 | 4.4 | 3.3 | 5.9 |
| 1973 | 2.7 | 3.7 | 3.8 | 4.3 | 6.6 | 8.4 | 10.2 | 8.4 | 7.2 | 5.1 | 3.5 | 3.2 | 5.6 |
| 1974 | 3.0 | 3.7 | 3.4 | 3.7 | 5.9 | 7.9 | 8.9 | 9.9 | 7.9 | 5.4 | 4.3 | 4.0 | 5.7 |
| 1975 | 4.0 | 3.0 | 4.1 | 4.6 | 7.1 | 8.3 | 10.0 | 9.7 | 8.3 | 5.9 | 3.7 | 3.5 | 6.0 |
| 1976 | 2.6 | 2.2 | 2.8 | 4.5 | 5.9 | 7.1 | 9.3 | 8.4 | 7.2 | 5.1 | 4.9 | 3.1 | 5.3 |
| 1977 | 2.9 | 3.3 | 4.3 | 4.4 | 6.6 | 8.8 | 8.7 | 9.6 | 6.5 | 6.2 | 4.6 | 3.2 | 5.8 |
| 1978 | 2.8 | 2.3 | 3.9 | 4.3 | 6.0 | 7.8 | 8.9 | 9.1 | 7.0 | 6.2 | 4.8 | 2.3 | 5.5 |
| 1979 | 2.1 | 1.9 | 3.6 | 4.3 | 6.9 | 9.7 | 8.2 | 9.8 | 7.8 | 4.6 | 4.0 | 3.7 | 5.5 |
| 1980 | 2.1 | 3.0 | 2.7 | 4.5 | 4.9 | 9.0 | 10.0 | 9.4 | 7.8 | 5.8 | 3.5 | 3.2 | 5.5 |
| 1981 | 2.5 | 2.8 | 3.8 | 3.8 | 7.1 | 9.6 | 9.8 | 9.2 | 8.7 | 5.9 | 4.2 | 2.6 | 5.8 |
| 1982 | 2.4 | 2.7 | 3.6 | 4.2 | 6.9 | 8.5 | 10.0 | 9.9 | 8.4 | 6.0 | 4.6 | 3.8 | 5.9 |
| 1983 | 4.0 | 2.7 | 4.0 | 5.5 | 8.3 | 7.8 | 9.4 | 9.2 | 7.9 | 5.7 | 3.8 | 3.1 | 5.9 |
| 1984 | 3.2 | 2.7 | 3.0 | 4.7 | 7.6 | 8.1 | 8.9 | 9.2 | 7.9 | 6.5 | 3.8 | 3.1 | 5.7 |
| 1985 | 1.7 | 1.6 | 3.6 | 4.8 | 7.7 | 8.3 | 9.5 | 10.6 | 7.2 | 6.1 | 3.3 | 3.8 | 5.7 |
| 1986 | 2.9 | 1.4 | 3.3 | 5.0 | 7.1 | 8.6 | 9.3 | 9.6 | 6.7 | 5.6 | 4.8 | 3.2 | 5.6 |
| 1987 | 1.2 | 3.0 | 2.4 | 4.4 | 6.0 | 8.9 | 9.8 | 8.6 | 7.4 | 5.3 | 4.5 | 3.6 | 5.4 |
| 1988 | 3.4 | 3.4 | 3.4 | 4.0 | 7.1 | 8.9 | 10.6 | 9.2 | 7.9 | 5.0 | 3.2 | 3.3 | 5.8 |
| 1989 | 3.7 | 4.0 | 4.0 | 5.2 | 6.7 | 8.7 | 9.2 | 9.2 | 8.3 | 6.5 | 3.8 | 3.5 | 6.1 |
| 1990 | 3.6 | 4.3 | 4.3 | 4.9 | 6.8 | 8.8 | 9.0 | 9.6 | 7.0 | 5.8 | 4.7 | 3.2 | 6.0 |
| 1991 | 3.1 | 2.3 | 4.0 | 4.7 | 5.7 | 8.0 | 9.9 | 10.0 | 7.8 | 5.3 | 4.4 | 3.1 | 5.7 |
| 1992 | 3.1 | 3.6 | 3.9 | 4.7 | 6.8 | 9.1 | 9.7 | 10.5 | 7.5 | 5.0 | 4.4 | 3.4 | 6.0 |
| 1993 | 3.2 | 3.1 | 3.3 | 5.0 | 7.9 | 8.1 | 9.3 | 9.0 | 7.5 | 5.7 | 2.7 | 3.9 | 5.7 |
| 1994 | 3.9 | 2.6 | 4.0 | 5.5 | 6.6 | 8.0 | 10.4 | 10.3 | 8.9 | 5.2 | 4.1 | 3.6 | 6.1 |
| 1995 | 2.9 | 4.0 | 3.7 | 4.9 | 6.6 | 9.7 | 10.6 | 9.6 | 8.4 | 6.9 | 3.4 | 2.2 | 6.1 |
| 1996 | 2.0 | 2.0 | 2.6 | 4.3 | 7.9 | 8.3 | 9.1 | 10.1 | 6.8 | 6.2 | 4.9 | 2.2 | 5.5 |
| 1997 | 2.4 | 3.4 | 3.4 | 3.7 | 6.6 | 8.5 | 10.4 | 9.7 | 7.3 | 5.0 | 4.1 | 3.3 | 5.6 |
| 1998 | 3.4 | 3.9 | 3.1 | 5.7 | 7.1 | 9.5 | 9.7 | 9.2 | 7.8 | 5.4 | 2.9 | 2.7 | 5.9 |
| 1999 | 3.2 | 3.0 | 4.0 | 5.6 | 6.0 | 10.4 | 10.4 | 8.9 | 8.3 | 5.8 | 3.8 | 3.3 | 6.1 |
| 2000 | 3.1 | 3.7 | 3.8 | 5.7 | 6.3 | 7.6 | 9.4 | 9.9 | 7.0 | 6.5 | 5.5 | 3.9 | 6.0 |
| 2001 | 3.2 | 3.0 | 3.4 | 5.4 | 6.4 | 8.1 | 12.2 | 10.6 | 7.8 | 7.1 | 3.9 | 2.4 | 6.1 |
| 2002 | 3.2 | 4.0 | 3.9 | 4.7 | 8.0 | 9.0 | 10.7 | 10.7 | 7.5 | 5.4 | 4.4 | 2.0 | 6.1 |
| 2003 | 2.7 | 2.3 | 3.3 | 4.1 | 7.5 | 8.1 | 11.2 | 9.2 | 7.5 | 4.8 | 4.9 | 3.6 | 5.8 |
| 2004 | 2.2 | 3.1 | 3.9 | 4.6 | 6.3 | 7.8 | 9.6 | 10.3 | 7.3 | 6.4 | 4.4 | 3.9 | 5.8 |
| 2005 | 3.5 | 2.7 | 3.2 | 4.7 | 6.9 | 7.9 | 10.2 | 9.1 | 9.1 | 6.1 | 4.0 | 3.4 | 5.9 |
| 2006 | 1.7 | 2.7 | 3.2 | 5.2 | 6.8 | 8.5 | 12.2 | 10.9 | 9.8 | 7.2 | 5.3 | 4.6 | 6.5 |
| 2007 | 4.2 | 3.1 | 5.0 | 5.3 | 7.8 | 10.5 | 10.5 | 10.6 | 8.1 | 5.9 | 3.9 | 3.5 | 6.5 |
| 2008 | 3.7 | 4.2 | 4.3 | 5.8 | 7.0 | 7.4 | 9.8 | 9.7 | 8.0 | 6.4 | 5.0 | 3.8 | 6.3 |
| 2009 | 2.8 | 3.3 | 4.0 | 5.1 | 6.8 | 9.3 | 11.3 | 10.5 | 8.6 | 5.4 | 5.0 | 3.1 | 6.3 |
| 2010 | 1.8 | 2.8 | 3.8 | 5.2 | 8.2 | 9.4 | 12.2 | 11.9 | 7.8 | 4.7 | 5.0 | 2.2 | 6.3 |
| 2011 | 3.1 | 2.4 | 3.7 | 5.7 | 9.0 | 10.2 | 9.6 | 10.6 | 9.3 | 5.7 | 4.1 | 4.2 | 6.5 |
| 2012 | 3.2 | 1.9 | 4.0 | 5.1 | 7.0 | 8.7 | 10.5 | 9.9 | 7.9 | 5.9 | 5.2 | 2.6 | 6.0 |
| 2013 | 2.5 | 3.3 | 2.4 | 4.9 | 7.9 | 9.8 | 9.5 | 9.5 | 7.3 | 6.4 | 5.1 | 3.9 | 6.0 |
| 2014 | 2.7 | 3.6 | 4.6 | 5.5 | 7.3 | 8.2 | 10.9 | 9.5 | 7.9 | 6.0 | 4.7 | 3.4 | 6.2 |
| 2015 | 3.6 | 3.4 | 3.8 | 4.5 | 6.2 | 7.2 | 8.9 | 8.8 | 8.7 | 5.1 | 4.8 | 4.4 | 5.8 |
| 2016 | 2.5 | 4.0 | 3.8 | 4.8 | 6.8 | 7.9 | 10.2 | 9.4 | 7.9 | 5.6 | 4.1 | 3.8 | 5.9 |
| 2017 | 2.5 | 3.0 | 4.7 | 4.9 | 6.9 | 8.7 | 10.0 | 10.5 | 8.6 | 6.6 | 4.7 | 3.9 | 6.3 |
| 2018 | 3.4 | 2.5 | 2.9 | 6.0 | 7.6 | 8.6 | 10.6 | 10.5 | 8.4 | 6.2 | 4.6 | 3.8 | 6.2 |
| 2019 | 2.9 | 3.8 | 4.4 | 4.3 | 6.9 | 10.0 | 9.1 | 9.8 | 7.9 | 6.7 | 5.2 | 4.2 | 6.3 |
| 2020 | 3.9 | 4.0 | 3.8 | 3.7 | 5.7 | 10.5 | 9.7 | 10.2 | 8.5 | 7.0 | 5.1 | 3.9 | 6.3 |
Table 4.
Main assumptions of the air treatment system.
| Location | Warsaw, the capital city of Poland |
| Operation hours | 24 h/day |
| Purpose of the system | central preparation of primary air for air–water systems (e.g., with fan coil units, air conditioners, chilled beams, mini heat pumps), maintaining hygienic conditions |
| Type of system | CAV |
| Air treatment processes | preheater, heat recovery, heater, cooler, humidifier |
| Type of recovery heat exhanger | plate heat exchanger without moisture exchange |
Table 5.
Detailed parameters of the air treatment system.
| Air volume | 1000 L/s |
| Internal temperature | 20–25 °C determined according to the dependency: °C; the obtained temperature is comply with the requirements of the standard PN-EN 16798-1:2019 [41] for spaces of II. category |
| Supply air temperature | default: tsup1 = 15 °C, additional: tsup2 = 12 °C, tsup3 = 18 °C |
| Chilled water temperature | 7/12 °C according to Eurovent Standard [42] |
| Heat recovery exchanger efficiency | , according to the current Ecodesign requirements [43] |
| Defrosting system | preheater, minimum temperature of the air removed from the heat exchanger trem = 0 °C, according to PN-EN 16798-5-1:2017-07 [44] |
| Humidification | air humidification to a moisture content of 4 g/kg, which allows to maintain the relative humidity in the room at a minimum value of approx. 30%; over moisture content of 4 g/kg relative humidity without normalization, depending on external parameters and the operation of the cooler |
Publisher’s Note: MDPI stays neutral with regard to jurisdictional claims in published maps and institutional affiliations. |
© 2022 by the authors. Licensee MDPI, Basel, Switzerland. This article is an open access article distributed under the terms and conditions of the Creative Commons Attribution (CC BY) license (https://creativecommons.org/licenses/by/4.0/).
Share and Cite
MDPI and ACS Style
Kostka, M.; Zając, A. The Impact of Climate Change on Primary Air Treatment Processes and Energy Demand in Air Conditioning Systems—A Case Study from Warsaw, Poland. Energies 2022, 15, 355. https://doi.org/10.3390/en15010355
AMA Style
Kostka M, Zając A. The Impact of Climate Change on Primary Air Treatment Processes and Energy Demand in Air Conditioning Systems—A Case Study from Warsaw, Poland. Energies. 2022; 15(1):355. https://doi.org/10.3390/en15010355
Chicago/Turabian StyleKostka, Maria, and Agnieszka Zając. 2022. "The Impact of Climate Change on Primary Air Treatment Processes and Energy Demand in Air Conditioning Systems—A Case Study from Warsaw, Poland" Energies 15, no. 1: 355. https://doi.org/10.3390/en15010355
Note that from the first issue of 2016, this journal uses article numbers instead of page numbers. See further details here.