
An Intelligent Approach for Performing Energy-Driven Classification of Buildings Utilizing Joint Electricity–Gas Patterns


1
Department of Electrical and Computer Engineering, University of Texas at San Antonio, San Antonio, TX 78207, USA
2
School of Architecture and Planning, University of Texas at San Antonio, San Antonio, TX 78207, USA
*
Author to whom correspondence should be addressed.
Energies 2021, 14(22), 7465; https://doi.org/10.3390/en14227465
Submission received: 28 August 2021
/
Revised: 6 October 2021
/
Accepted: 8 November 2021
/
Published: 9 November 2021
(This article belongs to the Special Issue Artificial Intelligence for Buildings)
Abstract
:Building type identification is an important task that may be used in confirming and verifying its legitimate operation. One of the main sources of information over the operation of a building is its energy consumption, with the analysis of electricity patterns being at the spotlight of a non-intrusive identification approach. However, electricity patterns are the only source of information, and therefore, their analysis imposes several restrictions. In this work, we introduce a new approach in energy-driven identification by adding one more source of information beyond the electricity pattern that may be utilized, namely the gas consumption pattern. In particular, we propose a new intelligent approach that jointly analyzes the electricity–gas patterns to provide the type of building at hand. Our approach exploits the synergism of the matrix profile data analysis technique with a feed-forward artificial neural network. This approach has applicability in the energy waste elimination through the implementation of different energy efficiency solutions, as well as the optimization of the demand-side process management, safer and reliable operation through fault detection, and the identification and validation of the real operation of the building. The obtained results demonstrate the improvement in identifying the type of the building by employing the proposed approach for joint electricity–gas patterns as compared to only using the electricity patterns.
1. Introduction
The building energy sector has recently attracted a lot of research attention boosted by new capabilities offered by the advances in data science and artificial intelligence. In particular, the advances in smart metering infrastructure and those in big data analysis tools have allowed buildings to be seen as an intensive source of data. Lately, one research direction has focused on improving the operational performance of the building energy systems based on the building sensor data. It should be noted that several of the works met in the literature target the analysis of the electric energy consumption patterns [1,2] to identify and understand the load trend patterns of the buildings. Analysis of this type may enhance: (i) the electricity waste reduction through the implementation of different energy efficiency measures, (ii) the efficiency of implementing demand-side management (DSM) solutions, and (iii) safe operation through conducting fault detection and diagnosis.
Concerning the analysis of the massive amounts of data coming from building operation, several data mining technologies have been proposed and tested in field applications. The application of data mining techniques to large-scale building operation data exhibits a high potency in broadening the understanding of and capturing actual operational patterns within buildings; such patterns may be utilized for identifying anomalies and optimizing the overall building energy efficiency. Some of the most popular data mining techniques that have been applied in the building energy sector are presented in [3]. Generally, they may be classified into two basic groups: (i) supervised data mining methods and (ii) unsupervised data mining methods. Notably, both groups may be implemented by tools with Artificial Intelligence (AI), and therefore, AI paves the way for automated data mining combined with inference making. The first group mainly contains all regression-based methods (e.g., artificial neural networks (ANN), deep neural networks (DNN), and support vector machines (SVM)), as well as classification-based methods. The second group contains the association rule mining (ARM) and clustering-based methods as well as motif and discord detection-based approaches.
The current research is focused on using data mining and AI tools for identifying the type of building at hand. Our approach utilizes an innovative approach by extracting the anomalies in two sources of information, namely the gas and electricity load patterns. It should be noted that the vast majority of the papers in the literature focus exclusively on anomalous pattern detection by extracting information from electricity consumption patterns applied to the building energy management.
For example, in [4], the authors present a survey of anomaly detection methods pertaining to building energy consumption, providing the advantages and current limitations. The authors claim that anomaly detection strategies applied in the building sector provide insightful information on abnormal consumption behavior, anomalous appliances, non-technical loss, and electricity theft activities. Furthermore, they claim that anomaly detection systems can offer smart and robust solutions for promoting energy savings. Another piece of extensive work on AI-driven data mining methods for load prediction, pattern identification, and fault detection in the domain of building energy systems is presented in [3]. The authors have demonstrated that the unsupervised methods are efficient at the extraction and identification of operation patterns and faults in complex building energy systems. They further proved that the AI supervised data mining-based methods perform satisfactorily in tasks related to building energy demand anticipation, fault detection, and diagnosis. In [5], the authors review the recent work on intelligent methods used to implement data analysis applied to building energy consumption. Furthermore, they propose a method that can recognize, process, and classify abnormal data in a highly effective way. In addition, their method may deepen users’ understanding of gathered data pertaining to the buildings’ energy consumption monitoring systems.
The authors in [6] focus on demonstrating the potential and benefits of detecting anomalies in building energy management processes. Particularly, they propose a methodology that combines data reduction, transformation, and machine learning tools to detect abnormal patterns related to building energy consumption at a sub-daily time scale. Another work focused on anomaly detection in building energy consumption is presented in [7]. That research aimed to find anomalies in the annual HVAC consumption profile to recognize long-term building energy efficiency plans. The authors propose two generic anomaly detection frameworks, namely “the collective contextual anomaly detection using the sliding window (CCAD-SW)” framework and “the ensemble anomaly detection (EAD)” framework. According to the authors, CAD-SW is a new pattern-based anomaly classifier implemented using an autoencoder method, while EAD combines the CCAD-SW with prediction-based anomaly detection classifiers implemented by support vector regression (SVR) and random forest.
In [8], a set of multiple research tools focusing on energy rating procedures and classification schemes exclusively for the building sector are investigated and presented. The authors conclude their research work by stating that the classification of buildings is essential for determining their performance rating boundaries that subsequently contribute to establishing a set of energy and/or environmental classes.
Other papers focus on pattern recognition and the analysis of electricity load curves for customer classification. For example, in [9], two methods for performing the classification of the electricity customers based on their electrical behavior are presented. The methods proposed by the authors use a modified follow-the-leader algorithm and self-organizing maps (SOM) as clustering procedures to group the customers based on their load patterns. The authors state that the presented methods can effectively assist the electricity providers in performing customer classification.
One promising research direction is focused on developing advanced and efficient data-mining techniques for analyzing massive amounts of building operation data to extract information and features that can be utilized in improving the operational performance of buildings (i.e., performing load prediction, fault detection, and diagnosis). Nevertheless, there is no work conducted on classifying buildings using joint gas and load profiles. Therefore, the current paper intends to fill this gap by proposing a two-source—a two-dimensional—building identification approach that uses both gas and load data to identify the building’s primary usage. Through the two-dimensional approach, the more relevant information is identified by analyzing both the gas and load patterns and by extracting the discords (i.e., anomalies) found in both of them. Using this approach, more insightful information about the building’s operation is offered. Furthermore, the choice to use the gas and load patterns was made because both gas and electricity are energy-oriented, and optimizing the energy consumption and having a better building energy management systems have been important research concerns over the past years. At the same time, when it comes to the building sector, electricity is the most used source of energy and serves important systems such as lightning, thermal comfort, domestic hot water, household appliances or other electrical equipment.
The main contributions of the paper are the following:
- introduction of a novel building identification approach based concurrently on two information sources, i.e., gas and load discords;
- development of an intelligent approach based on combining the Matrix Profile (MP) technique with Artificial Neural Network (ANN) algorithms;
- application of the intelligent approach in a set of real-world gas and electricity load data.
The rest of the paper is structured as follows. (i) Section 2 discusses the proposed two-dimensional approach for building identification and the Matrix Profile data mining technique used for extracting the anomalies found in the load and gas patterns with the aim of identifying the primary usage of buildings through two proposed ANN classification models; (ii) Section 3 presents relevant experimental results on building identification based on using the top 10 anomalies found in both the gas and load patterns; and (iii) Section 4 concludes the paper and lists directions for future work.
2. Intelligent Approach for Building Identification
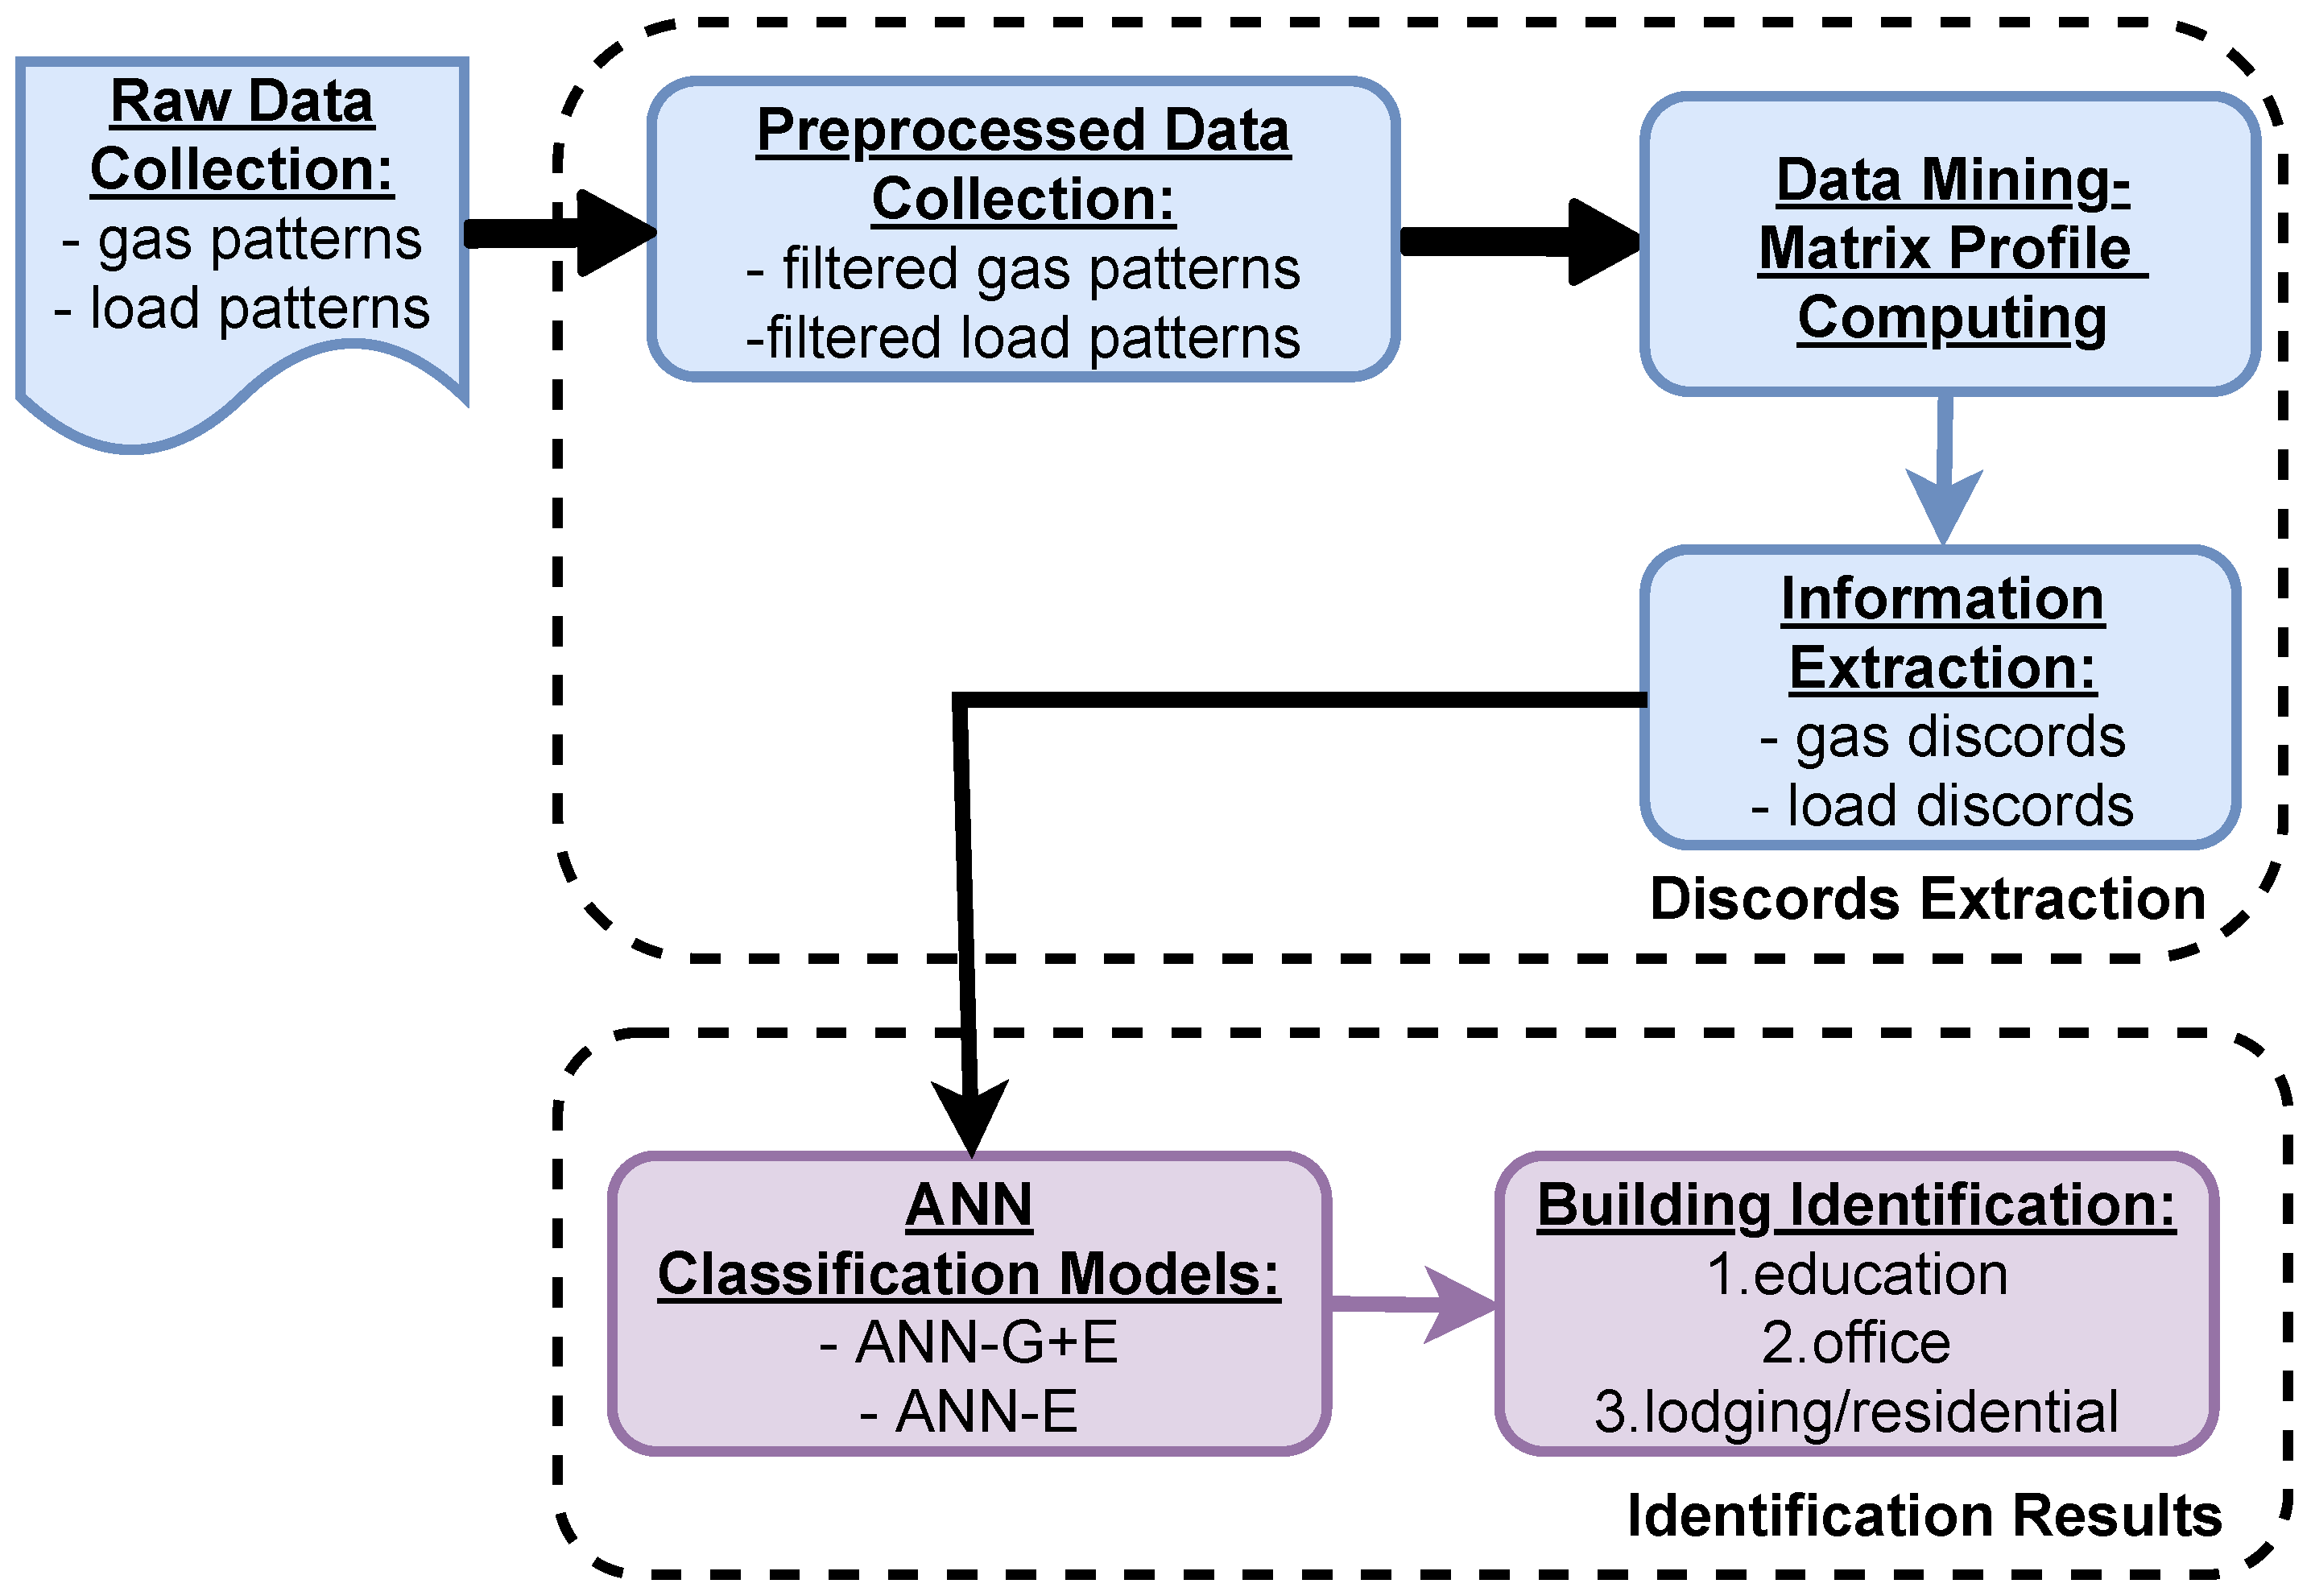
Energy pattern-driven identification is a complex task that requires the utilization of a set of features that characterize the type of building. The complexity of the energy patterns imposes computational hurdles that need to be overcome. To that end, the proposed approach is comprised of two stages, with the first performing information extraction and the second data classification. Figure 1 presents the block diagram of the intelligent approach where the two stages are presented and further detailed. The first stage conducts joint information extraction from the electricity load and gas patterns (i.e., a two-dimension information extraction), while the second stage performs the building type identification based on the information extracted in the first stage.
As pictured in Figure 1, initially, the information extraction is performed by creating a Matrix Profile for each of the load and gas patterns and subsequently by extracting the top k discords (i.e., anomalies) from the created profiles. Next, the classification is conducted by an ANN model whose inputs are the gas (G) and electricity (E) load discords. It should be noted that for comparison purposes, we have also created a second ANN model whose input is one-dimensional, i.e., only electricity load discords. To make it clear, the first model (ANN-G+E) uses a two-dimensional input with both gas and load discords, and the second model (ANN-E) only uses the electricity discords. The building classification implicitly aims at identifying the primary operation of each building either as (i) education, or (ii) office, or (iii) lodging.
In Section 2.1, the Matrix Profile technique and how it was applied in the current research as part of the first stage of the proposed approach is described. Section 2.2 describes the second stage of the approach and the two proposed Artificial Neural Network models.
2.1. Matrix Profile
The Matrix Profile technique has been developed with the purpose of mining useful patterns in data and was introduced in 2016 by E. Keogh from the University of California-Riverside and A. Mueen from the University of New Mexico [10].
MP encompasses two basic components: (i) a distance profile and (ii) a profile index. The first component (i.e., distance profile) is represented by an array of minimized Z-Normalized Euclidean Distances, while the second component (i.e., profile index) is an array that contains the index of the first nearest-neighbor (i.e., the location of the sub-sequence most similar to the distance profile). Firstly, the MP technique computes the distances of a sub-sequence (in the form of data window) of length against the whole time series, and then it sets an exclusion zone to avoid trivial matches. The length of the exclusion zone is usually determined as half of the window size , but in general, it can be adapted based on the application. In the third step, the distance profile is updated with the minimal values, and in the last step, the first nearest-neighbor index is determined. MP only stores the smallest non-trivial distance values from each computed distance profile to reduce the spatial complexity to . Figure 2 presents a diagram with the steps of the MP algorithm (for exemplification, the window size was chosen to be ).
The form of the Z-Normalized Euclidean Distance, which is used by MP in the first steps, is given by Equation (1):
where are two sub-sequences; represent their mean; and their standard deviation, respectively, as shown below:
In general, data analytics aim at identifying useful patterns in the available data. In more detail, the analysis of data in the form of time series focuses on two main classes of problems: anomaly detection and trend identification. Notably, two of the main applications of the MP technique entail (a) the localization of the top-K number of motifs (i.e, repeated patterns) and (b) the localization of discords (i.e., anomalies) in the data. In the current research, MP was applied for anomaly localization and, more specifically, is utilized to extract the top k discords. A discord is interpreted as an anomaly or, more specifically, as the most unusual sub-sequence within the analyzed pattern. To that end, the MP computes a set of distances in Euclidean space (as mentioned above) and then retains the lowest distances that are associated with the recognition of the data motifs. At the same time, the identification of the largest computed distances designates the set of the discords. Overall, the Euclidean distance value that is close to 0 indicates that the distance profiles are similar to the examined sub-sequence in the time series, while a distance far away from 0 indicates dissimilarity from the other tested sub-sequence.
In the current work, the Matrix Profile utilized a window of length equal to one week (i.e., data points). The window length is the only parameter that needs to be tuned, and it was chosen based on the authors’ prior experience and intuition. Once the Matrix Profile is computed, the top discords are extracted from the available processed data. To avoid extracting two or more discords correlated with the same event, i.e., trivial matches, a second parameter is used, namely the exclusion zone. The length of the exclusion zone is set to 2 weeks (336 data points).
2.2. Artificial Neural Network Models
The second step of the proposed approach encompasses the use of the identified discords for performing classification. As we mentioned earlier, we adopted two ANN models with different inputs. The first model used an ANN with the top 10 discords found in the load patterns and the top 10 discords in the gas patterns as input (this model is denoted as ANN-E+G). The second model utilizes an ANN that uses the top 10 discords found in the electricity load patterns as input (model is denoted as ANN-E), implying that no gas information is used.
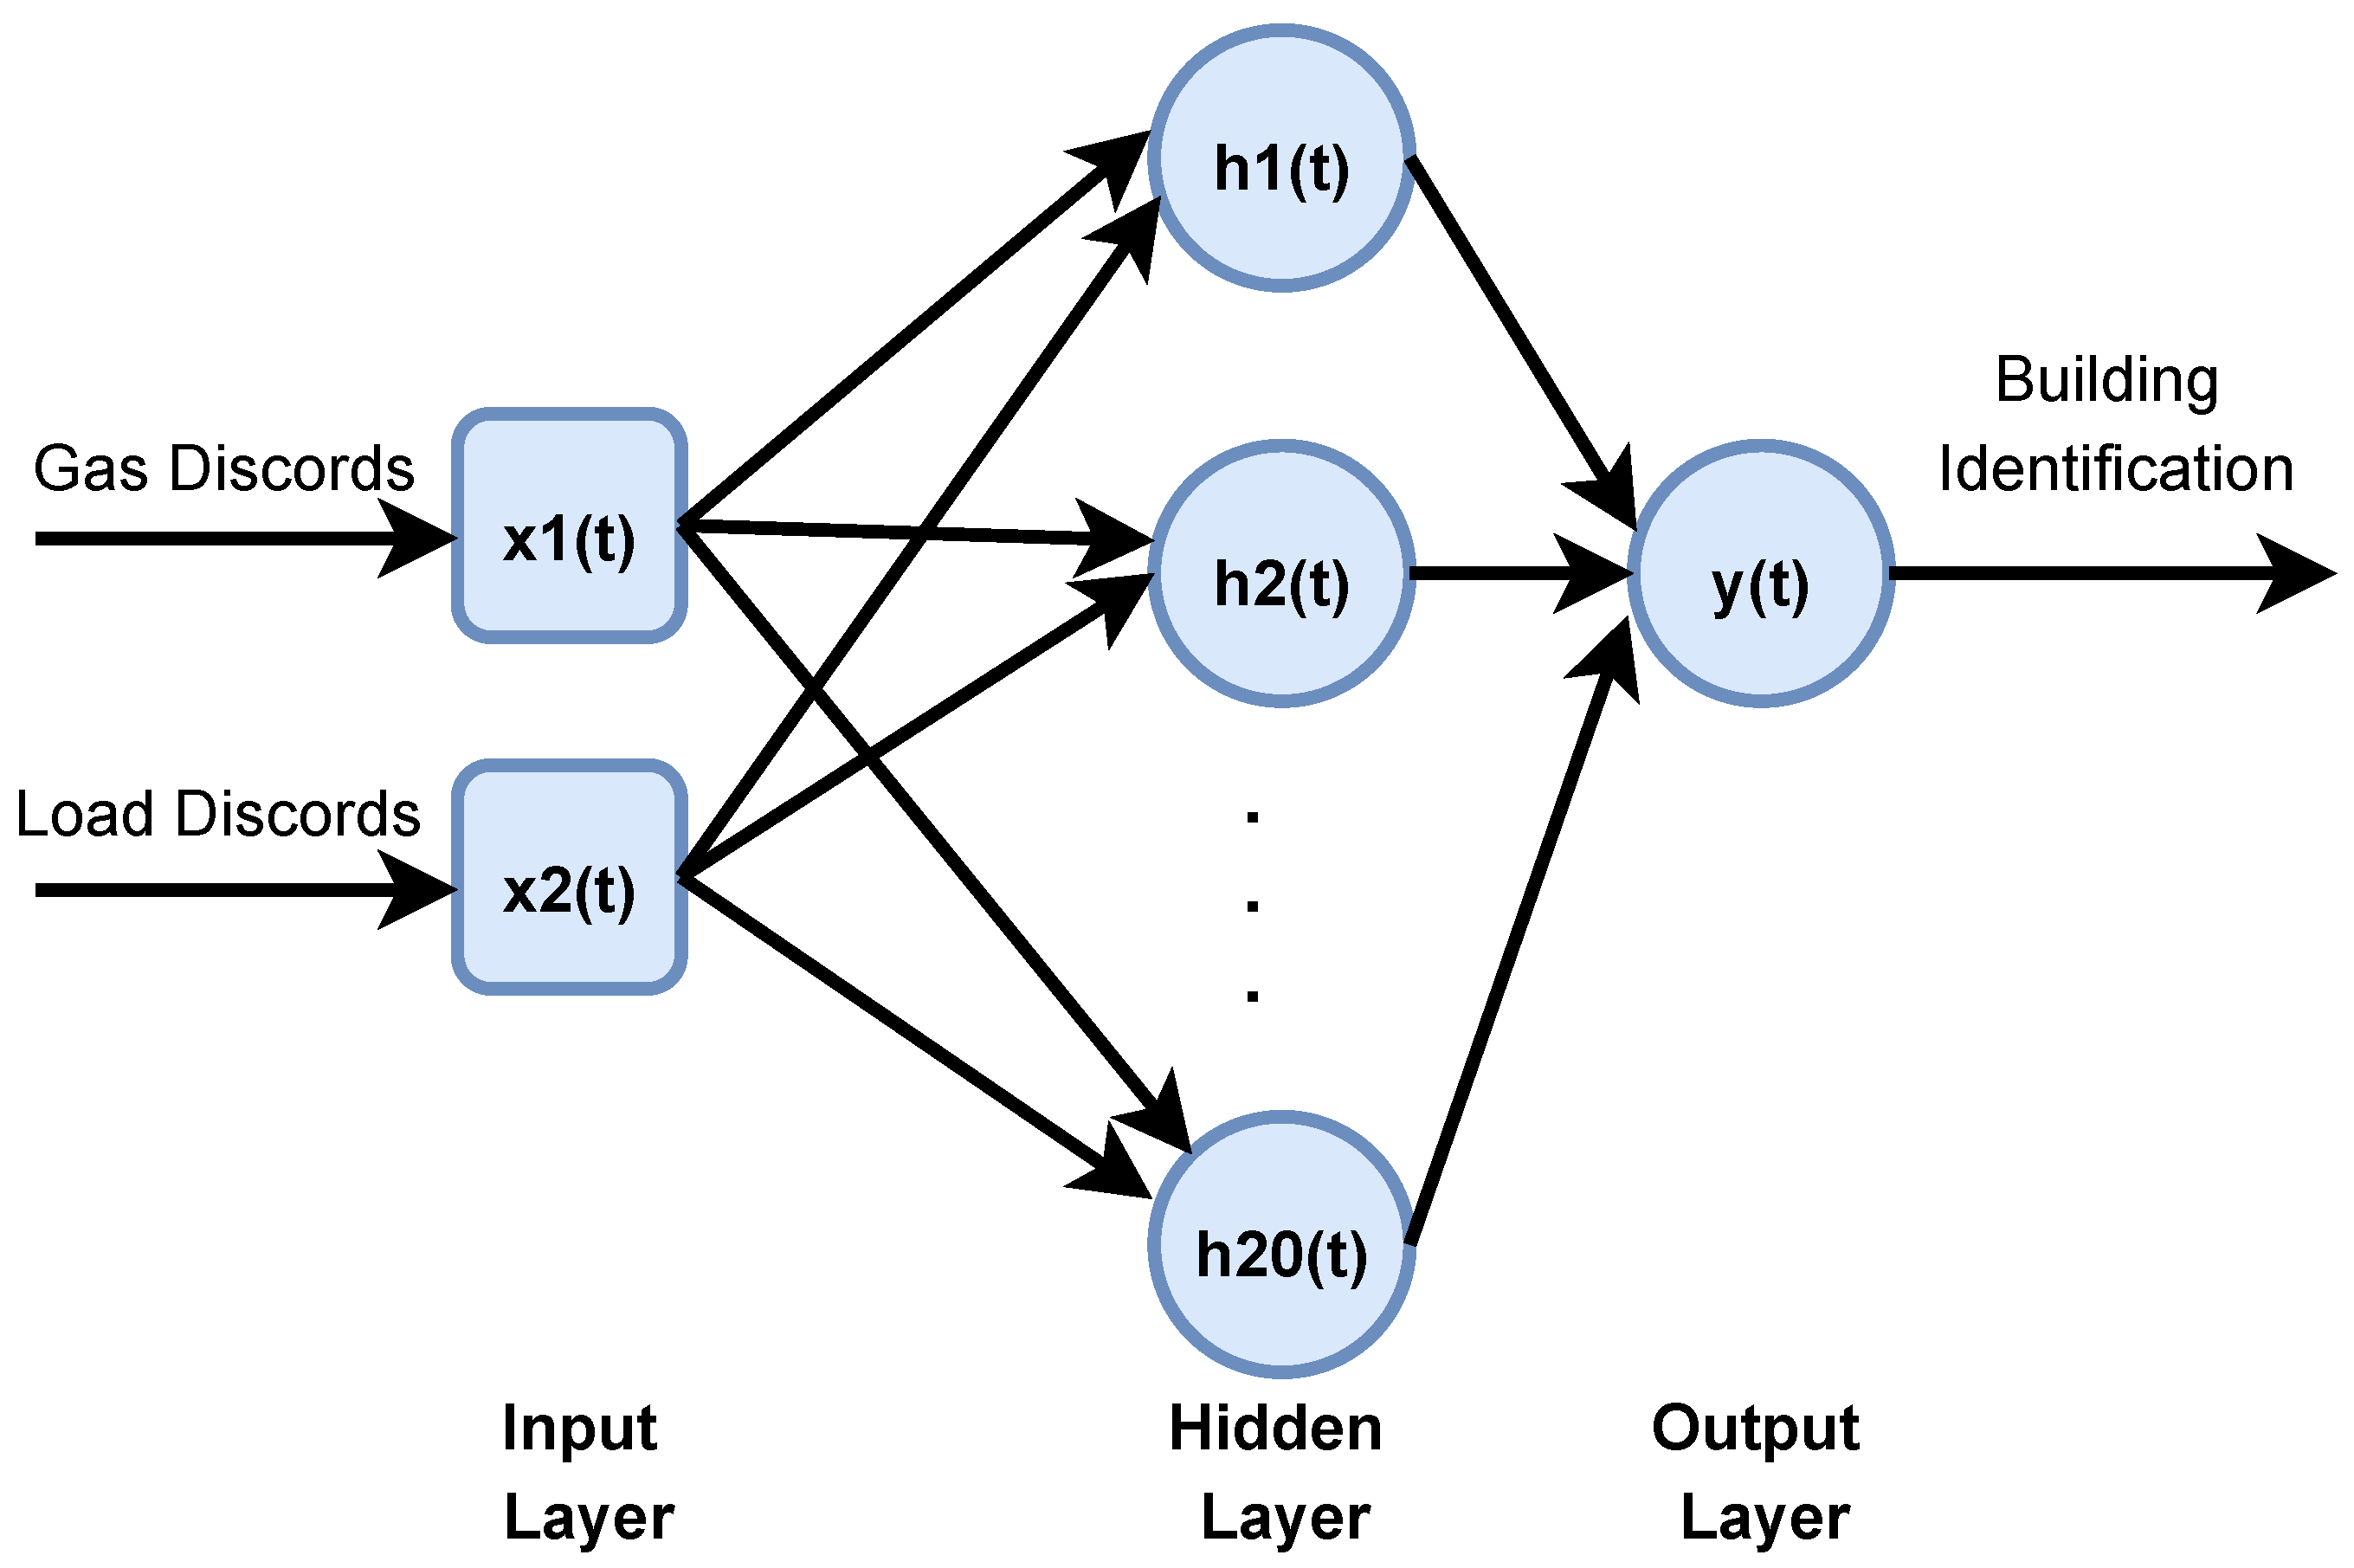
Both the utilized ANN models are implemented as fully connected feed-forward networks that have one input layer with 40 neurons, one hidden layer with 20 neurons, and one output layer with 3 neurons. For visualization purposes, Figure 3 depicts the architecture of the ANN-G+E model. The Hyperbolic Tangent Function (tanh) is used as the activation function for both the input and hidden layers, while the Softmax Function is the activation function of the output layer [11]. It should be noted that the activation functions are the carriers of non-linearity into the system, and hence, they allow learning of complex functions (complex functional patterns) via the training data. In addition, the Adam Optimizer Algorithm is used for training—i.e., evaluating the network parameters from the exposed datasets—both of the ANN models. The Adam Optimizer Algorithm is an adaptive optimizer. Compared to gradient descent optimizers (i.e., batch gradient descent, stochastic gradient descent, mini-batch gradient descent), adaptive optimizers have the advantage that the learning rate is tuned automatically. The Adam Optimizer is very robust and the best among adaptive optimizers, performing well in the case of sparse data [12]. Furthermore, for training the models, the k-fold cross-validation technique has been applied by splitting the training data into -folds with 200 epochs each.
3. Results
3.1. Dataset Description
The data used for the current research is part of the open-source data collection known as the “Building Data Genome Project 2” [13]. The project repository contains data of 1636 non-residential buildings in the form of hourly values for a period equal to two years taken from different types of meters: electricity, chilled water, steam, hot water, gas, water, irrigation, and solar. In this work, we used an overall set of 132 load and gas patterns, entailing three types of buildings, namely education, office, and lodging buildings. The utilized data are collected over a period of 18 months spanning the period from January 2016 to August 2017.
3.2. Building Identification Results
In this section, the proposed building identification method, i.e., the synergism of MP and ANN, is applied in the dataset described above. The obtained results are separately recorded with respect to identification accuracy for the two ANN models, i.e., ANN-E+G, ANN-E.
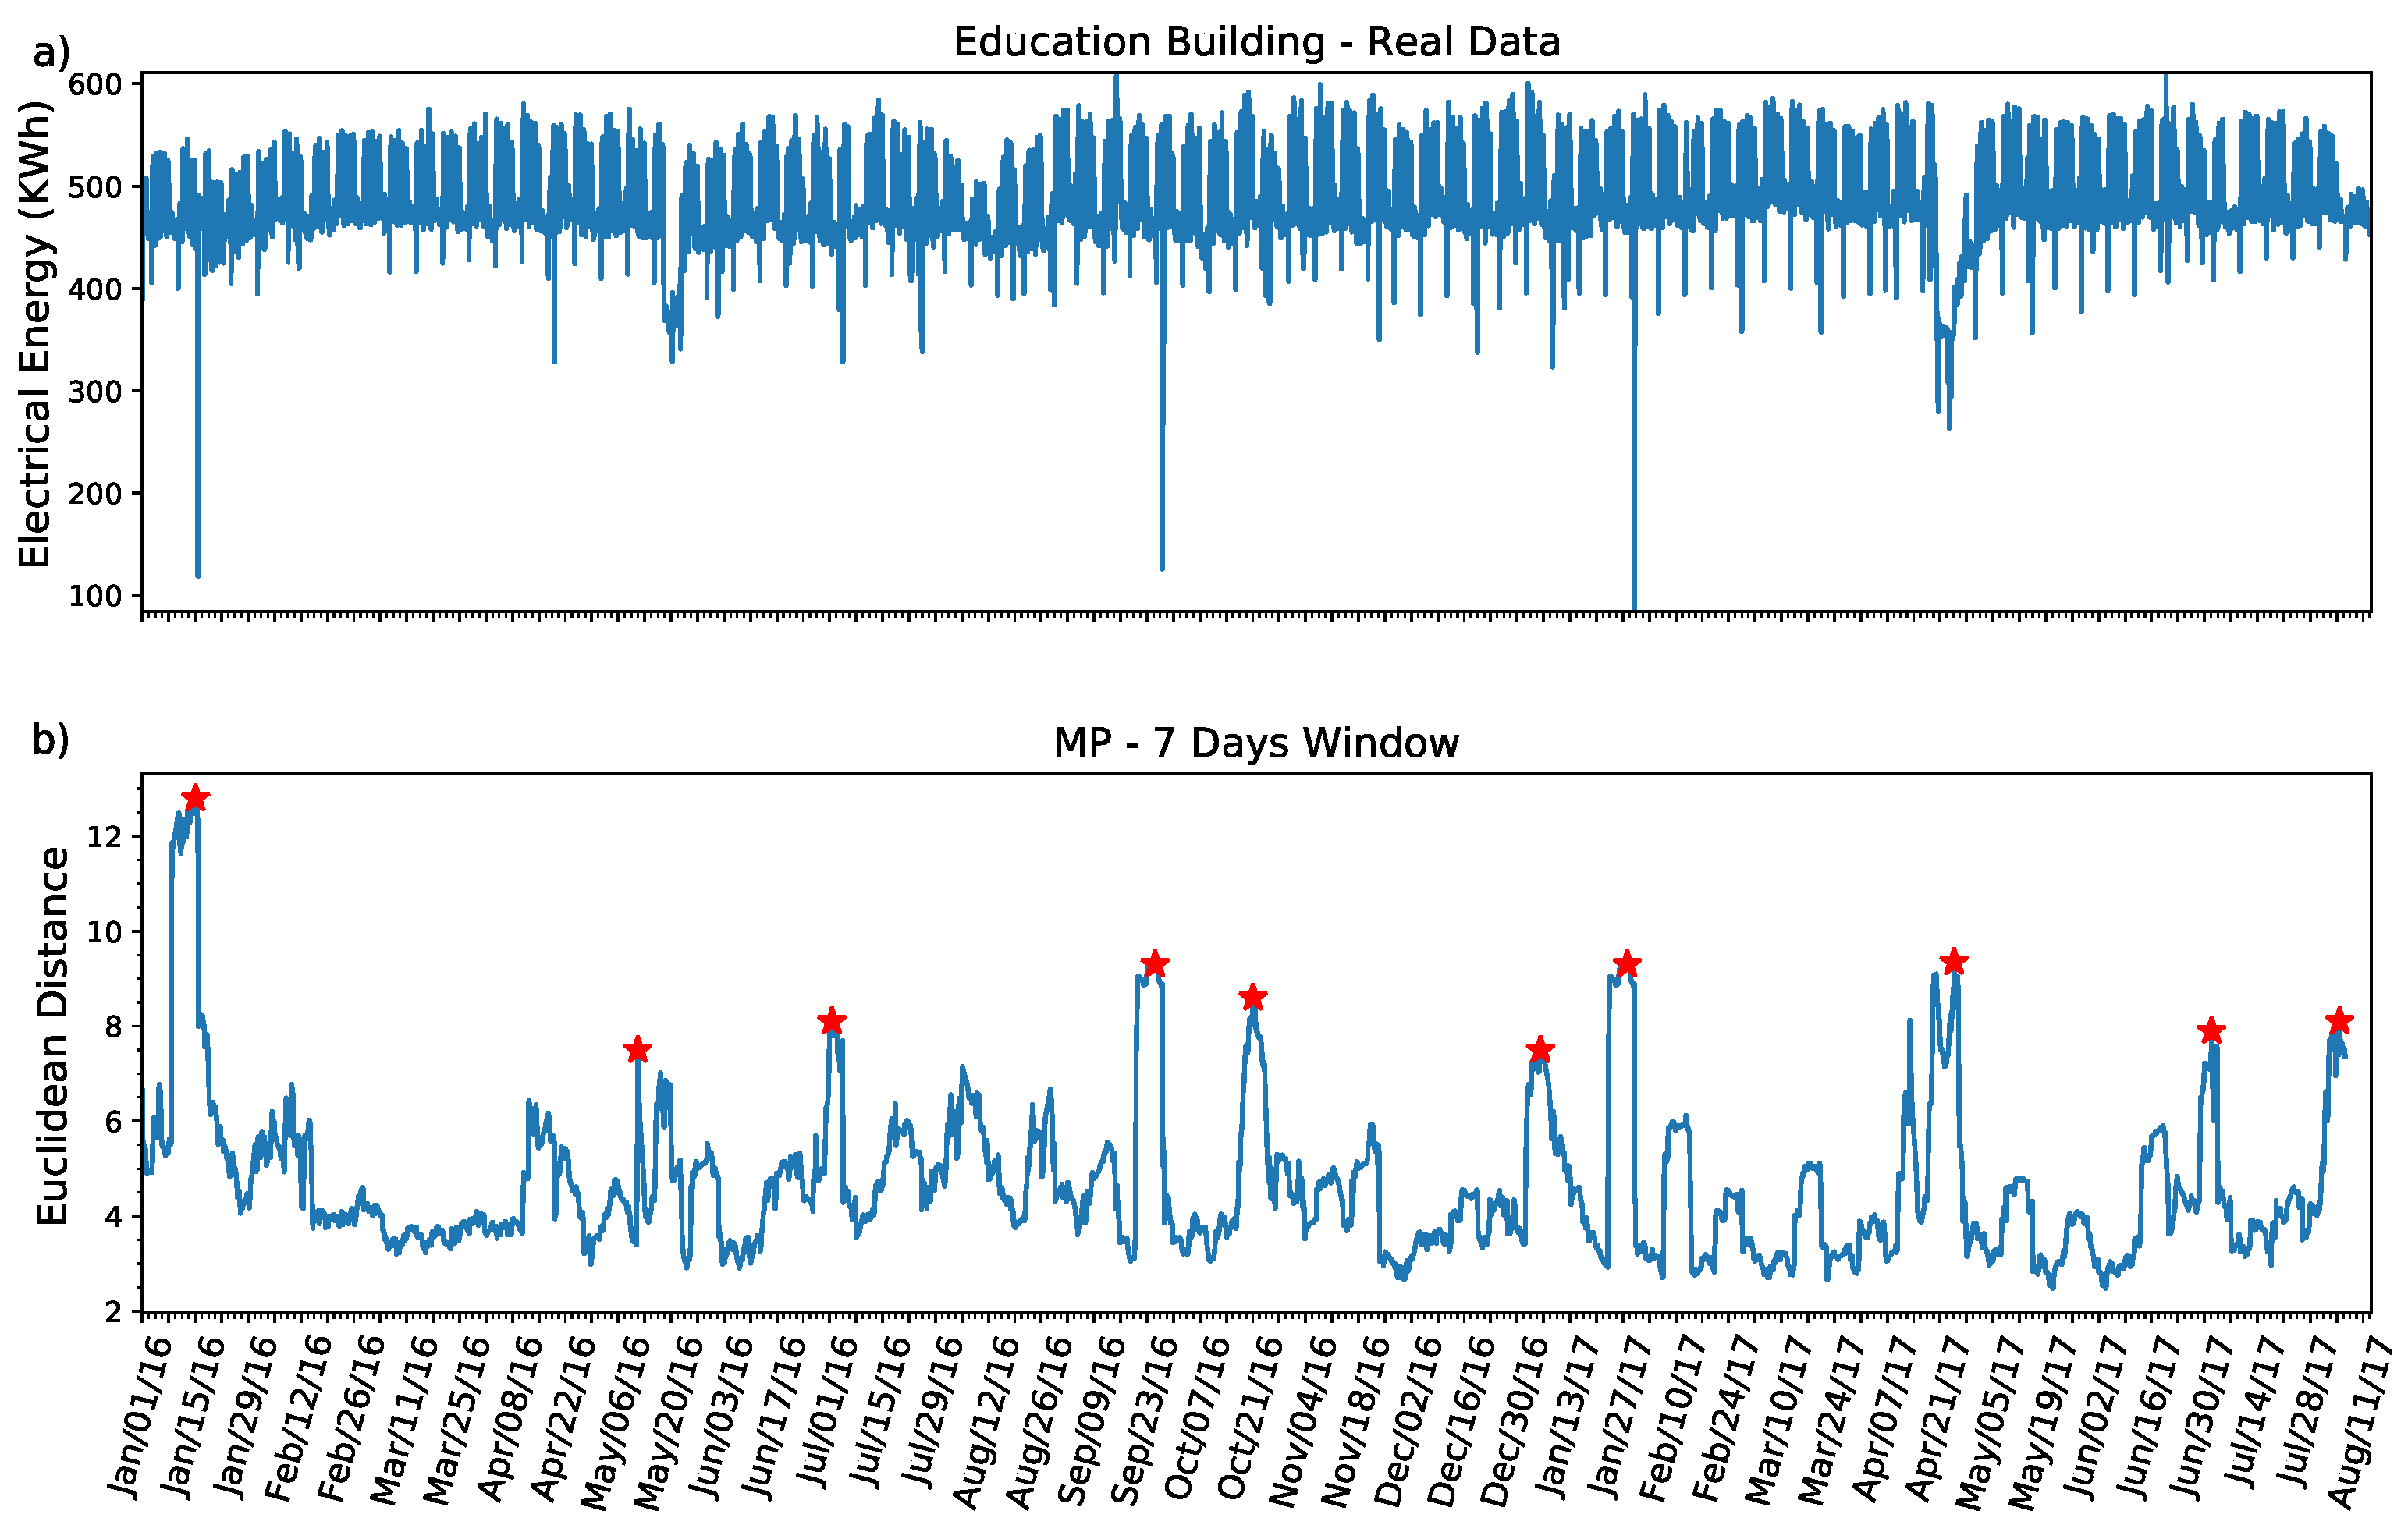
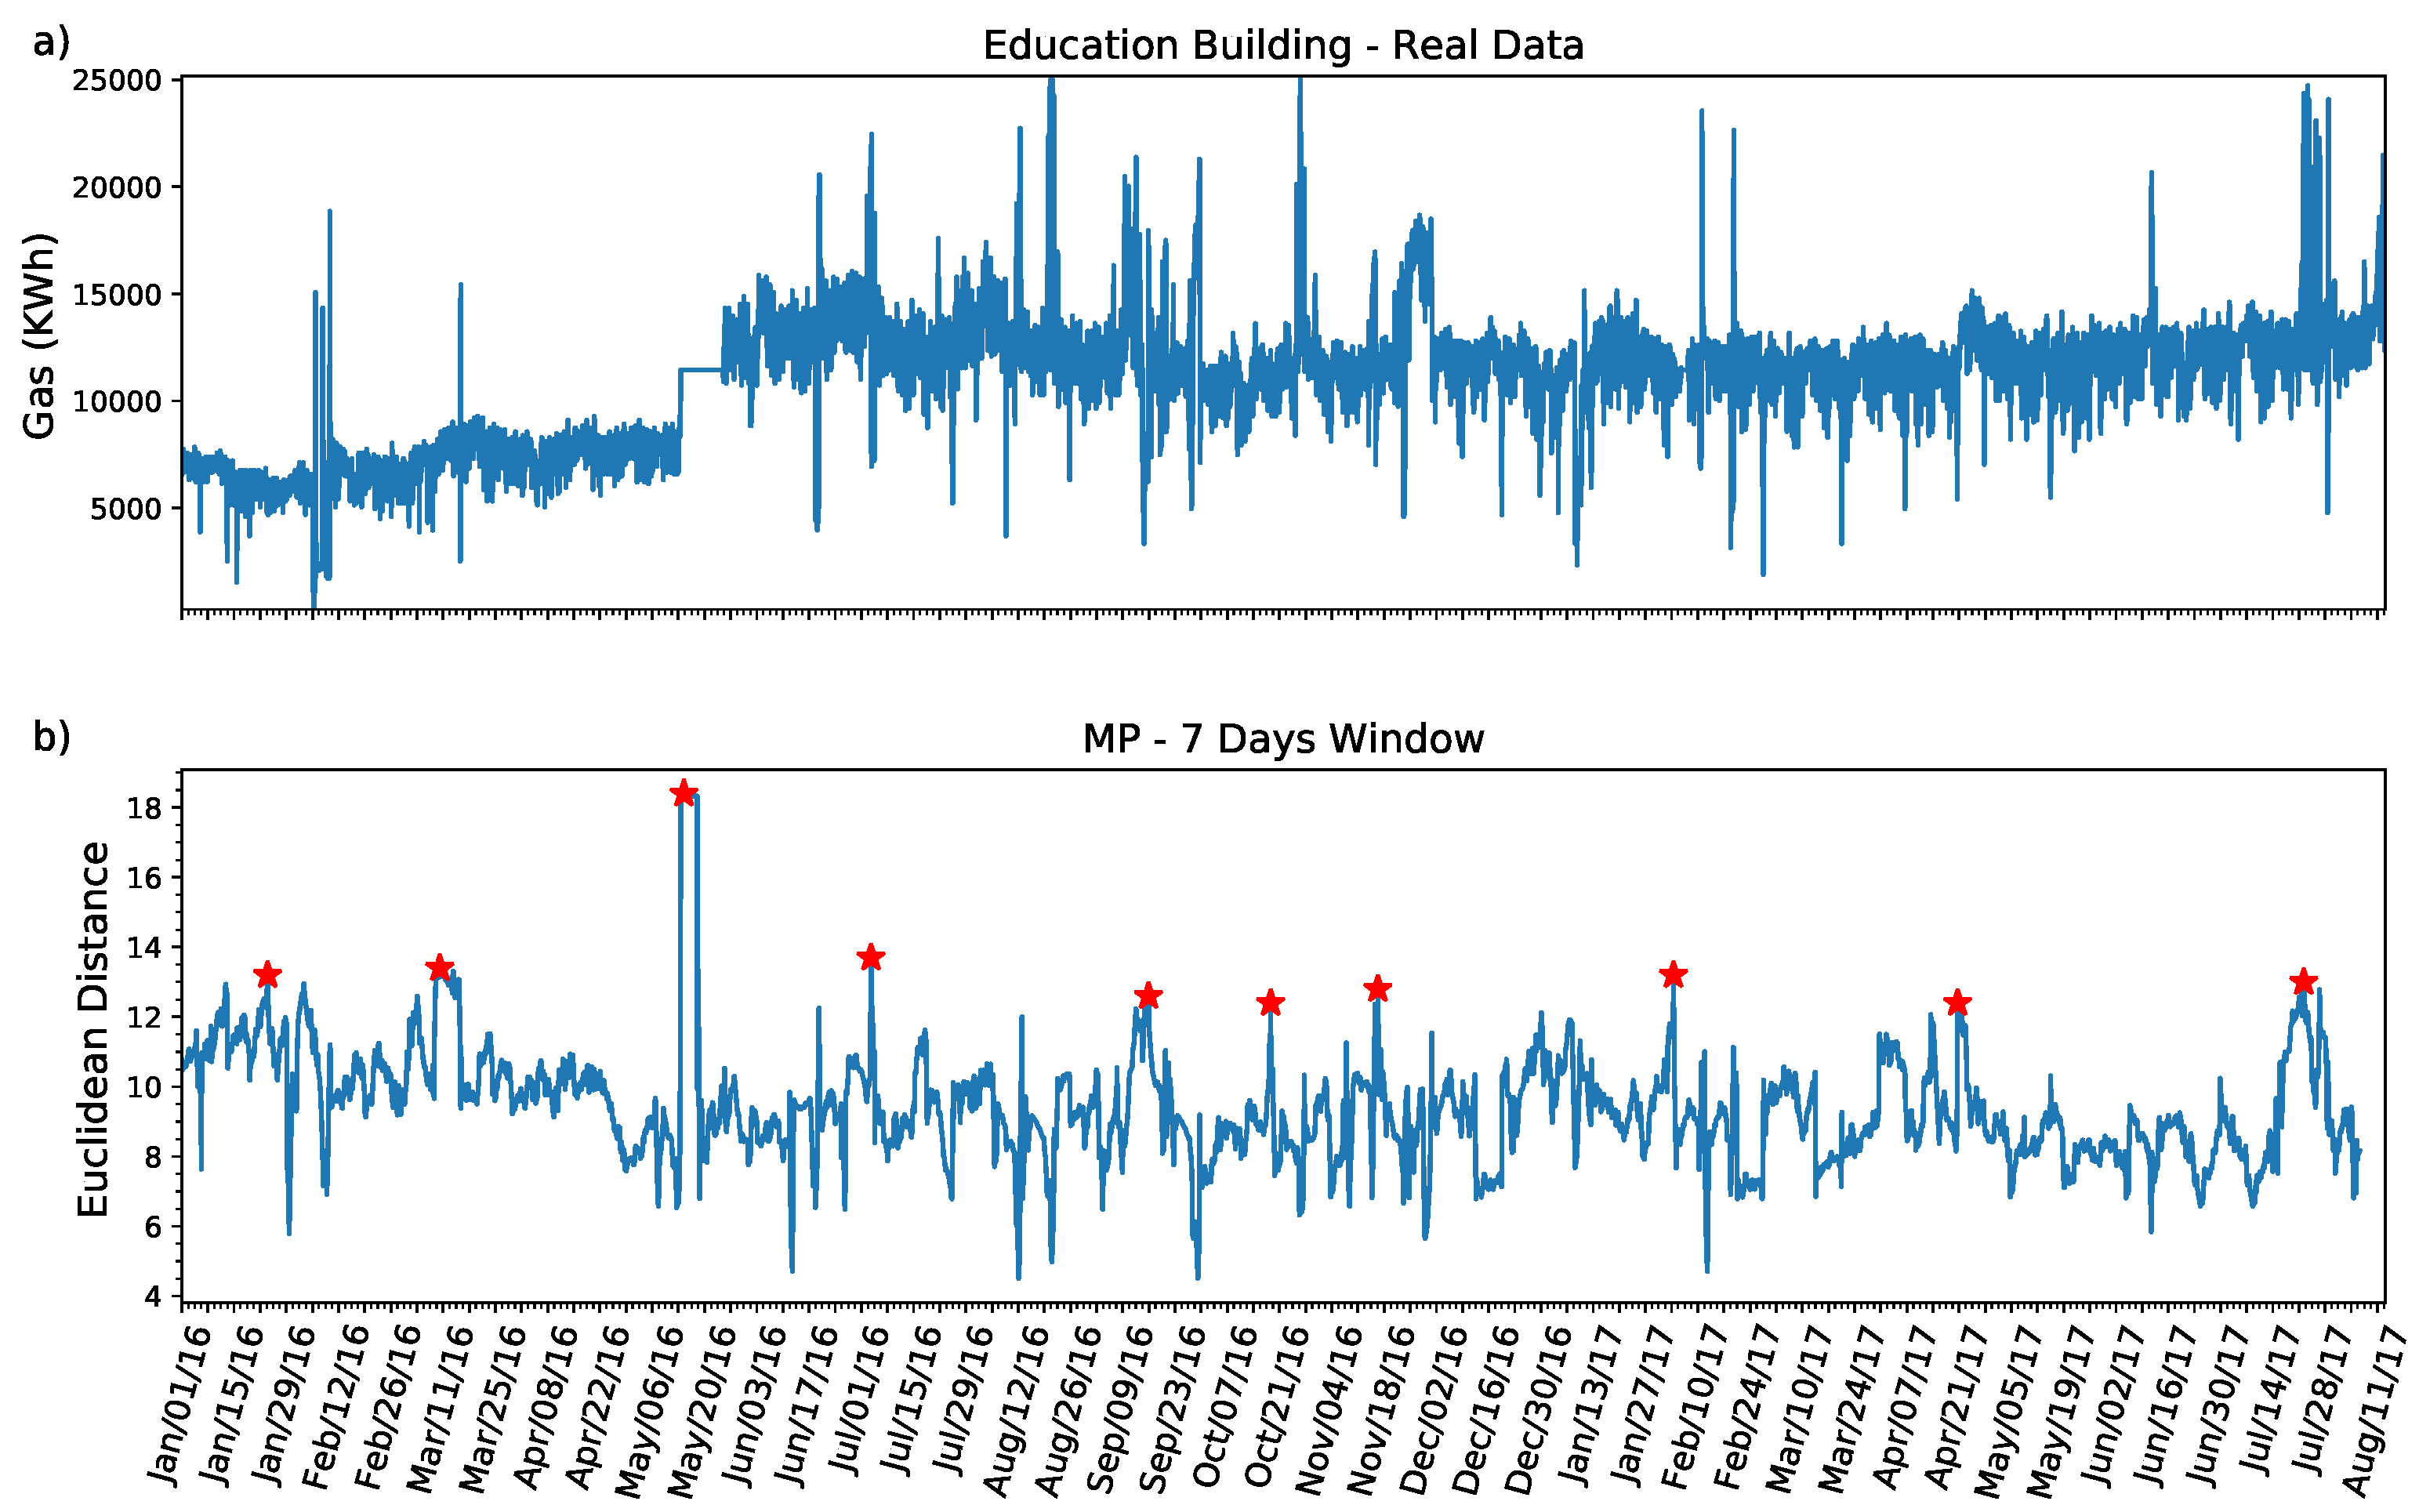
Figure 4 and Figure 5 present the MP results for the two datasets (load and gas patterns from one education building). The first figure depicts the actual load pattern (in the top subplot) and the corresponding Matrix Profile (in the bottom); more specifically, it shows the Z-Normalized Euclidean Distance together with the top 10 discords presented as the highest relative peaks on the graph. Similarly, the second figure depicts the actual gas patterns and its Matrix Profile together with the extracted top 10 discords.
The aim of the classification models was to identify the buildings in the testing dataset, more specifically to identify the primary usage of a building and to correctly assign a corresponding label according to Table 1. For training both models, 80% of the data and 20% for testing were used.
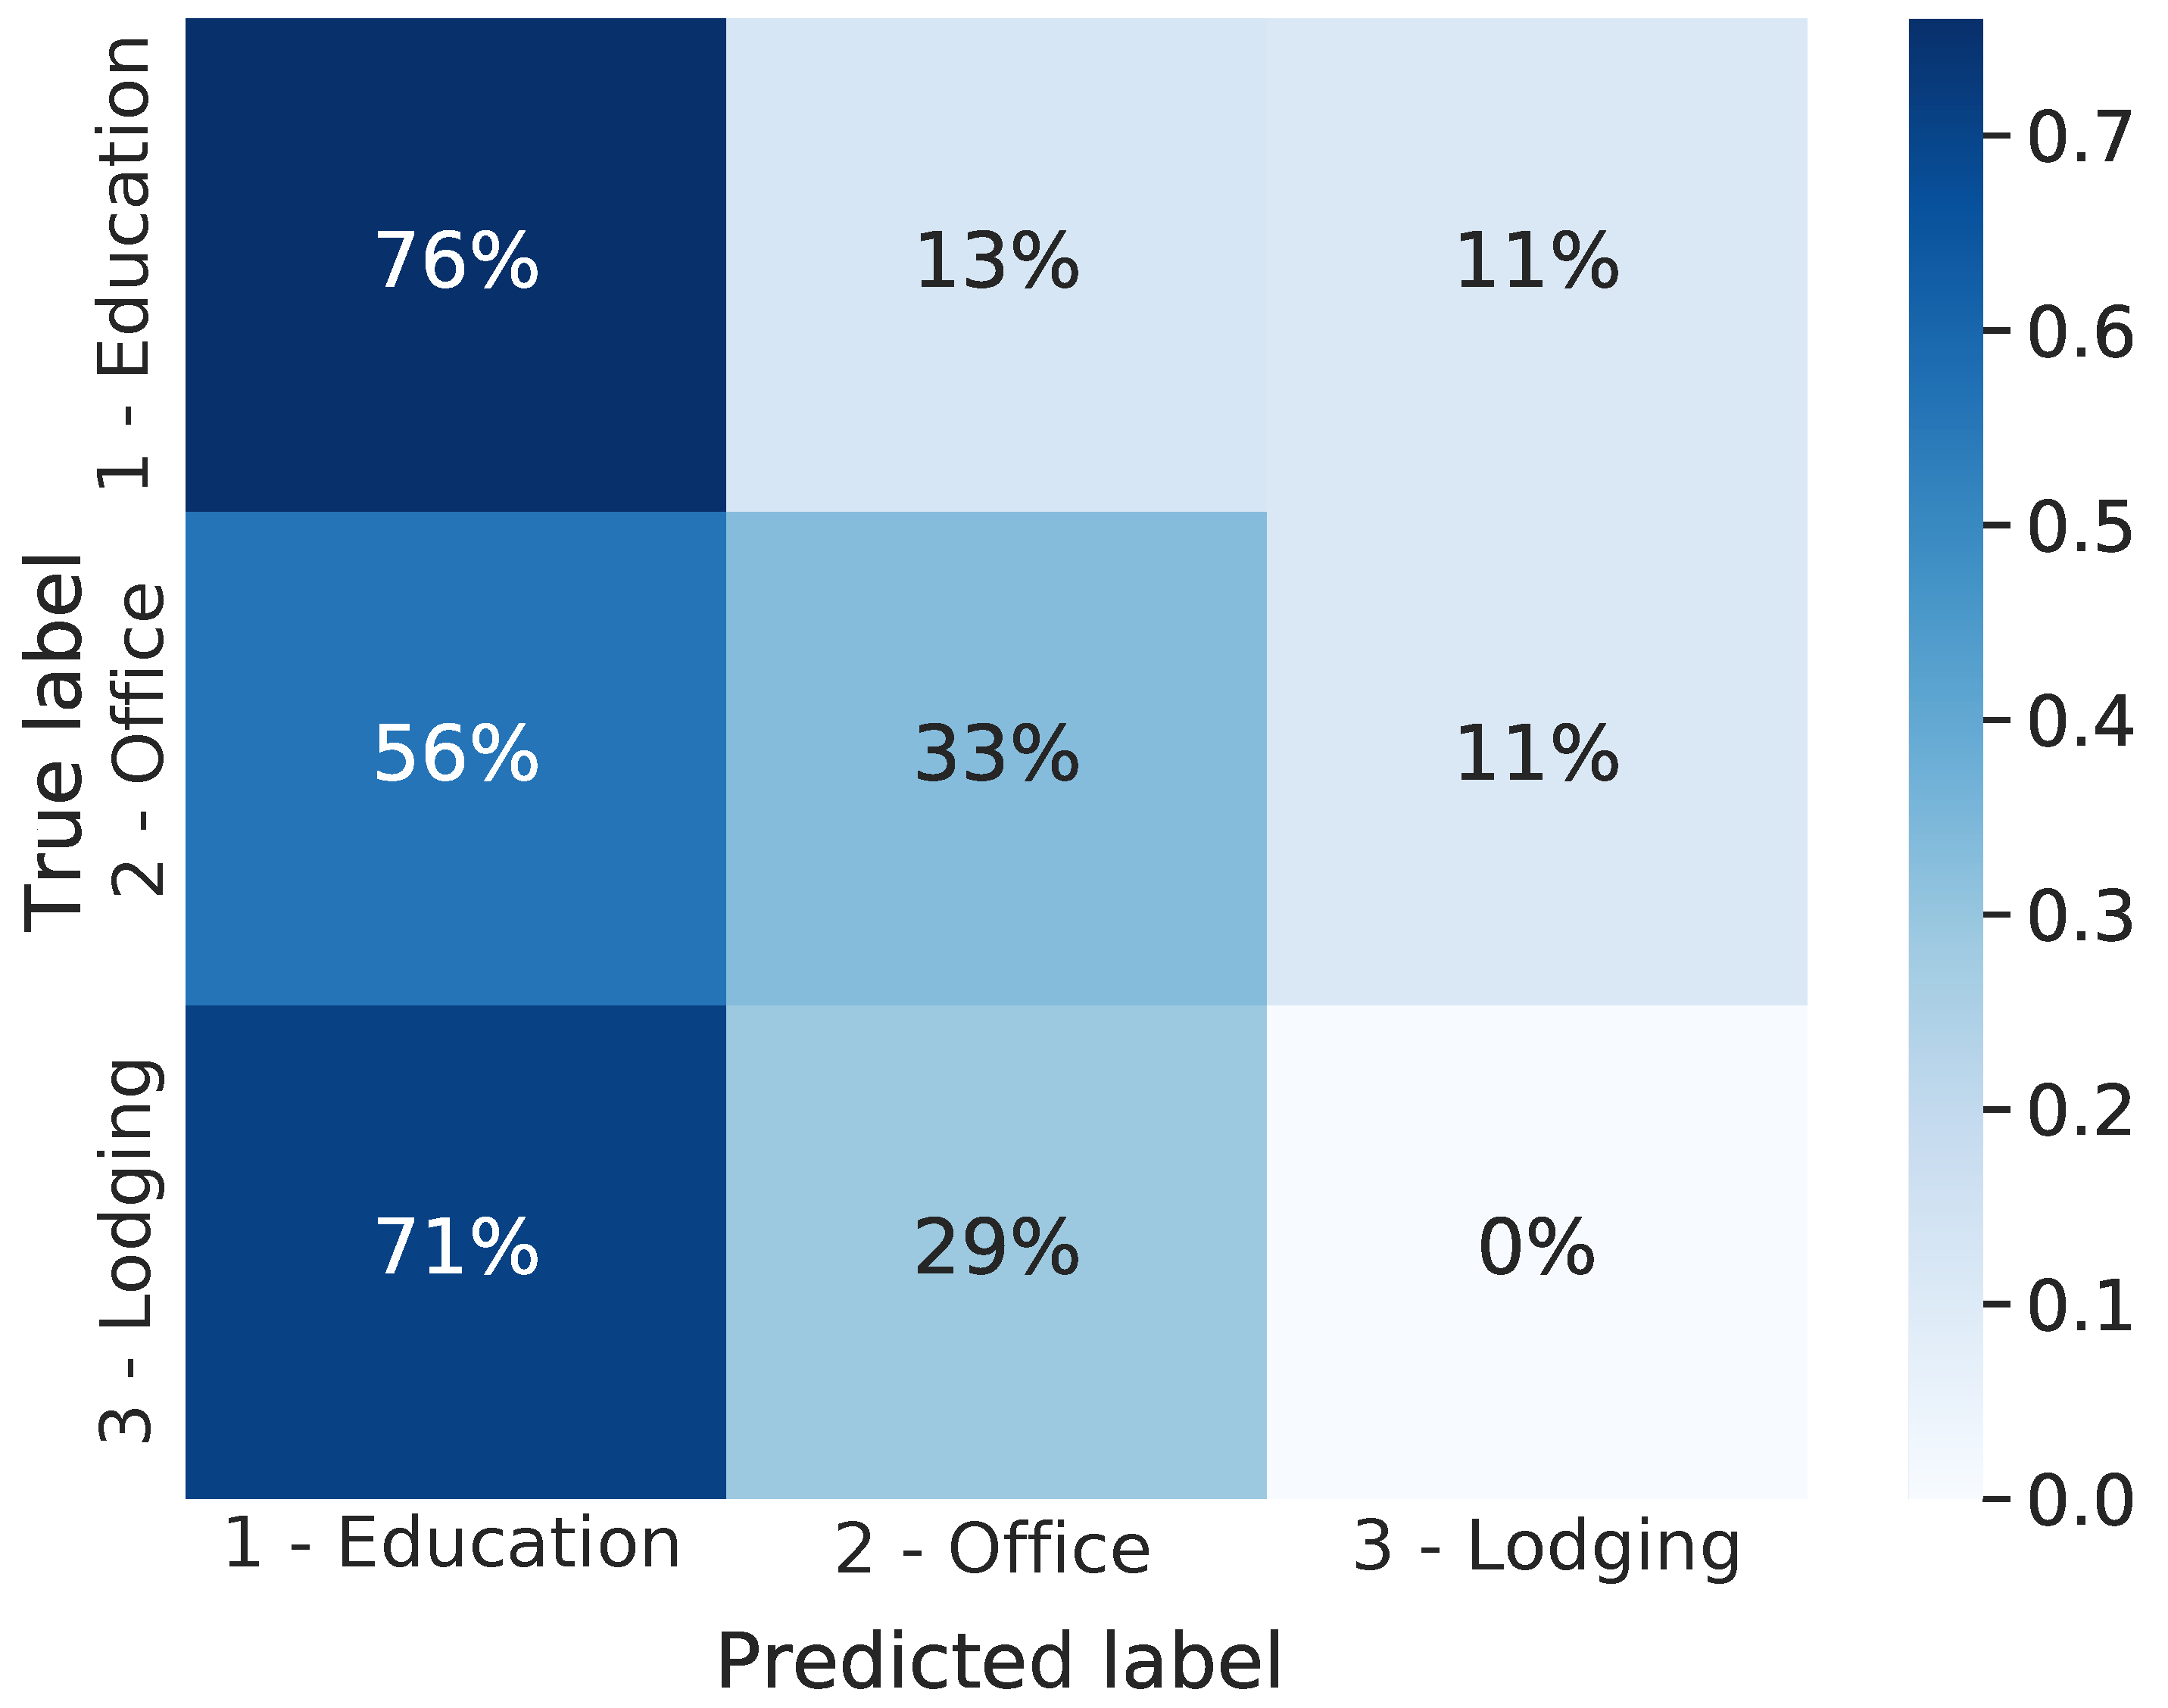
The degree of efficiency of the proposed method is recorded with respect to the confusion matrix of the identification process [14]. The confusion matrix is an matrix used for evaluating the performance of the identification models, where is the number of target classes (Table 1). The matrices compare the actual target labels with those predicted by the ANN models. Figure 6 and Figure 7 present the confusion matrices for both of the tested models. The observation of the results provided by both models exhibits that the ANN-E+G model outperforms the ANN-E model. An interpretation of this observation states that the use of both discord-based load and gas patterns offers more insightful information about the primary operation of each building compared to the ANN-E model. This leads to higher building identification as compared to the case where only load pattern discords are used. Nevertheless, analyzing the accuracy of the identification of each building type (i.e., the main diagonals of each MP matrices) reveals that education buildings show a higher identification accuracy as compared to office and lodging/residential buildings. Both confusion matrices show that both ANNs tested models have a good performance when identifying the educational buildings (ANN-E+G , ANN-E ), and they are less efficient when it comes to identifying the office and lodging buildings. This is an unavoidable drawback based on the data limitation due to the imbalanced pattern population of building types within our dataset. On the other hand, the fact that educational buildings follow a general academic calendar and a daily schedule makes the extracted discords found in the gas and load patterns become quite uniform among all educational buildings. In what concerns the office and lodging buildings, we have no insights regarding their schedule, which leads to the conclusion that the discords found in their gas and load patterns are not correlated with the same events, leading to the big errors.
Notably, the confusion matrices were used to obtain the values of the following performance metrics: identification accuracy, precision, recall, and the F1-score for each model. Equations (6)–(9) describe each of the above-mentioned metrics [15]:
where TP stands for True Positive, TN for True Negative, FP for False Positive, and FN for False Negative.
Figure 8 presents the obtained values for each of the performance metrics (Equations (6)–(9)). Figure 8 shows the average values for all the metrics computed after each fold of the cross-validation. As can be observed, the obtained values support the previously obtained results. It should be emphasized that the ANN-G+E model has higher accuracy, F1-score, precision, and recall compared to the ANN-E model.
4. Conclusions
This work proposes a novel approach based on the combination of the Matrix Profile data mining technique and the Artificial Neural Network model. The approach is applied for identifying the type of building—a process that associates the building with a specific operation (and the validation of this operation). The innovation of the proposed approach is given by the utilization of a two-dimensional source extraction in the form of data discords concurrently identified in both gas and load patterns. This two-dimensional discord set is used as the input to an ANN model that performs the final building type identification.
The obtained results show that the proposed method (denoted as ANN-G+E) via the use of two sources of information offers a higher degree of accuracy in identifying the correct operation of each building as compared to the widely used method of only using the electricity load data. Notably, the F1-score of the performance of the ANN-G+E model is 29% higher than that of the ANN-E model. This indicates the higher efficiency obtained by utilizing two sets of discs as opposed to only one (i.e., electricity load).
The applicability of this novel approach encompasses, to name a few, energy waste elimination through the implementation of different energy efficiency solutions, as well as the optimization of the demand-side process management, safer and reliable operation through fault detection, and the validation of the building operation exclusively for the designated purpose.
Future work will focus on applying the approach on more public datasets of non-residential buildings, such as sports facilities, assembly buildings, and other commercial buildings for bench-marking purposes. Another future direction will be focusing on including water data among the energy and gas patterns.
Author Contributions
All authors conceived the methodology and planned the experiment. C.N. performed the numerical calculations for the suggested experiment. Investigation. A.M.-M.; M.A. supervised the project. All authors have read and agreed to the published version of the manuscript.
Funding
This research received no external funding.
Institutional Review Board Statement
Not applicable.
Informed Consent Statement
Not applicable.
Data Availability Statement
Not applicable.
Conflicts of Interest
The authors declare no conflict of interest.
References
- Han, J.S.; Jeong, Y.K.; Lee, I.W. Analysis of Electric Energy Consumption Patterns: A Case Study of a Real Life Office Building. In Applied Mechanics and Materials; Trans Tech Publications Ltd.: Freinbach, Switzerland, 2013; Volume 330, pp. 158–162. [Google Scholar] [CrossRef]
- Perez-Chacon, R.; Talavera-Llames, R.L.; Martinez-Alvarez, F.; Troncoso, A. Finding Electric Energy Consumption Patterns in Big Time Series Data. In Proceedings of the Distributed Computing and Artificial Intelligence, 13th International Conference, Sevilla, Spain, 1–3 June 2016; Omatu, S., Semalat, A., Bocewicz, G., Sitek, P., Nielsen, I.E., García García, J.A., Bajo, J., Eds.; Springer International Publishing: Cham, Switzerland, 2016; pp. 231–238. [Google Scholar]
- Zhao, Y.; Zhang, C.; Zhang, Y.; Wang, Z.; Li, J. A review of data mining technologies in building energy systems: Load prediction, pattern identification, fault detection and diagnosis. Energy Built Environ. 2020, 1, 149–164. [Google Scholar] [CrossRef]
- Himeur, Y.; Ghanem, K.; Alsalemi, A.; Bensaali, F.; Amira, A. Artificial intelligence based anomaly detection of energy consumption in buildings: A review, current trends and new perspectives. Appl. Energy 2021, 287, 116601. [Google Scholar] [CrossRef]
- Zhao, L.; Zhang, J.; Zhong, C. The Application of Data Mining Technology in Building Energy Consumption Data Analysis. Int. J. Comput. Inf. Eng. 2016, 10, 81–85. [Google Scholar]
- Capozzoli, A.; Piscitelli, M.; Brandi, S.; Grassi, D.; Chicco, G. Automated load pattern learning and anomaly detection for enhancing energy management in smart buildings. Energy 2018, 157, 336–352. [Google Scholar] [CrossRef]
- Araya, D.B.; Grolinger, K.; ElYamany, H.F.; Capretz, M.A.; Bitsuamlak, G. An ensemble learning framework for anomaly detection in building energy consumption. Energy Build. 2017, 144, 191–206. [Google Scholar] [CrossRef]
- Nikolaou, T.; Kolokotsa, D.; Stavrakakis, G. Review on methodologies for energy benchmarking, rating and classification of buildings. Adv. Build. Energy Res. 2011, 5, 53–70. [Google Scholar] [CrossRef]
- Chicco, G.; Napoli, R.; Piglione, F.; Postolache, P.; Scutariu, M.; Toader, C. Load pattern-based classification of electricity customers. IEEE Trans. Power Syst. 2004, 19, 1232–1239. [Google Scholar] [CrossRef]
- Yeh, C.C.M.; Zhu, Y.; Ulanova, L.; Begum, N.; Ding, Y.; Dau, A.; Silva, D.; Mueen, A.; Keogh, E. Matrix Profile I: All Pairs Similarity Joins for Time Series: A Unifying View That Includes Motifs, Discords and Shapelets. In Proceedings of the 2016 IEEE 16th International Conference on Data Mining (ICDM), Barcelona, Spain, 12–15 December 2016; pp. 1317–1322. [Google Scholar] [CrossRef]
- Nwankpa, C.; Ijomah, W.; Gachagan, A.; Marshall, S. Activation Functions: Comparison of trends in Practice and Research for Deep Learning. arXiv 2020, arXiv:1811.03378. [Google Scholar]
- Kingma, D.P.; Ba, J. Adam: A Method for Stochastic Optimization. arXiv 2015, arXiv:1412.6980. [Google Scholar]
- Miller, C.; Meggers, F. The Building Data Genome Project: An open, public data set from non-residential building electrical meters. Energy Procedia 2017, 122C, 439–444. [Google Scholar] [CrossRef]
- Hossin, M.; Sulaiman, M.N. A Review on Evaluation Metrics for Data Classification Evaluations. Int. J. Data Min. Knowl. Manag. Process 2015, 5, 1–11. [Google Scholar] [CrossRef]
- Sokolova, M.; Lapalme, G. A systematic analysis of performance measures for classification tasks. Inf. Process. Manag. 2009, 45, 427–437. [Google Scholar] [CrossRef]
Figure 1.
The two-dimensional building identification steps.

Figure 2.
Diagram of the Matrix Profile technique steps.

Figure 3.
Architecture of the ANN-G+E model.

Figure 4.
(a) Education building load pattern; (b) Matrix Profile with top 10 discords.

Figure 5.
(a) Education building gas pattern; (b) Matrix Profile with top 10 discords.

Figure 6.
ANN-G+E normalized confusion matrix.

Figure 7.
ANN-E normalized confusion matrix.

Figure 8.
Overall performance metrics values.


Table 1.
Identification labels.
| 1 | 2 | 3 | |
|---|---|---|---|
| Label | Education | Office | Lodging |
Publisher’s Note: MDPI stays neutral with regard to jurisdictional claims in published maps and institutional affiliations. |
© 2021 by the authors. Licensee MDPI, Basel, Switzerland. This article is an open access article distributed under the terms and conditions of the Creative Commons Attribution (CC BY) license (https://creativecommons.org/licenses/by/4.0/).
Share and Cite
MDPI and ACS Style
Nichiforov, C.; Martinez-Molina, A.; Alamaniotis, M. An Intelligent Approach for Performing Energy-Driven Classification of Buildings Utilizing Joint Electricity–Gas Patterns. Energies 2021, 14, 7465. https://doi.org/10.3390/en14227465
AMA Style
Nichiforov C, Martinez-Molina A, Alamaniotis M. An Intelligent Approach for Performing Energy-Driven Classification of Buildings Utilizing Joint Electricity–Gas Patterns. Energies. 2021; 14(22):7465. https://doi.org/10.3390/en14227465
Chicago/Turabian StyleNichiforov, Cristina, Antonio Martinez-Molina, and Miltiadis Alamaniotis. 2021. "An Intelligent Approach for Performing Energy-Driven Classification of Buildings Utilizing Joint Electricity–Gas Patterns" Energies 14, no. 22: 7465. https://doi.org/10.3390/en14227465
Note that from the first issue of 2016, this journal uses article numbers instead of page numbers. See further details here.