
The Influence of Environmental Strategy, Environmental Reporting and Environmental Management Control System on Environmental and Economic Performance


Abstract
:
1. Introduction
2. Development of Hypotheses and the Measurement of the Constructs
2.1. Development of Hypotheses
2.2. Measurement Instrument
2.2.1. Environmental Strategy (ES)
2.2.2. Environmental Reporting (ER)
2.2.3. Size
2.2.4. Environmental Management Control System (EMCS)
2.2.5. Economic Performance (EP)
2.2.6. Environmental Performance (EnP)
3. Materials and Methods
3.1. Data Collection, Respondents
3.2. Data Analysis
4. Results
4.1. Assessment of the Reflective Measurement Model
4.2. Assessment of the Structural Model
5. Discussion
6. Conclusions
Author Contributions
Funding
Institutional Review Board Statement
Informed Consent Statement
Data Availability Statement
Acknowledgments
Conflicts of Interest
Appendix A

| Code | Description | Scale |
|---|---|---|
| EnvStrategy_1 | Please indicate if your company addresses environmental issues in its strategy | 1 = No, only according to legislation 2 = Yes, perceived as a strategic topic, but neither discussed nor formulated 3 = Yes, formulated as part of the strategy, but not discussed across the company 4 = Yes, formulated as part of the strategy and discussed across the company 5 = Yes, it is the key strategic priority across company |
| EnvStrategy_2 | Indicate which option best characterizes the approach of your company to utilization of key performance indicators in the area of utilized materials, recycled materials and energy consumption | 1 = No KPI 2 = KPI are measured 2,5 = Irrelevant area for our company 3 = KPI are measured and compared with planned or past values 4 = KPI are measured and compared also with competitors |
| EnvStrategy_3 | Indicate which option best characterizes the approach of your company to utilization of key performance indicators in the area of impact of products on environment | |
| EnvStrategy_4 | Indicate which option best characterizes the approach of your company to utilization of key performance indicators in the area of water withdrawals | |
| EnvStrategy_5 | Indicate which option best characterizes the approach of your company to utilization of key performance indicators in the area of impact on biodiversity | |
| EnvStrategy_6 | Indicate which option best characterizes the approach of your company to utilization of key performance indicators in the area of emissions, effluents and waste | |
| EnvStrategy_7 | Indicate which option best characterizes the approach of your company to utilization of key performance indicators in the area of impacts from product distribution and employee travel | |
| EnvStrategy_8 | Indicate which option best characterizes the approach of your company to utilization of key performance indicators in the area of environmental responsibility of suppliers | |
| EnvReporting_1 | Does your company issue information on environmental issues beyond the minimal legal requirements within annual report? | 1 = No 2 = No, but we assume to do so from the next year 3 = Yes, the amount of information is up to one page 4 = Yes, the amount of information is over one and up to five pages 5 = Yes, the amount of information is over five pages |
| EnvReporting_2 | Does your company issue a standalone corporate responsibility report as a separate document available from your web pages? | 1 = No 2 = No, but we assume to do so from the next year 3 = Yes, the report does not follow any internationally recognized standard 4 = Yes, the report follows an internationally recognized standard (e.g., GRI) but is not audited by a third party 5 = Yes, the report follows an internationally recognized standard (e.g., GRI) and is audited by a third party |
| Size_1 | Assets in thousands EUR | numeric |
| Size_2 | Sales in thousands EUR | |
| EMCS_1 | Please indicate if your company has formalized plans and programs for utilized materials, recycled materials and energy consumption | Measured on scale from 1 = no plans and programs to 5 = plans and programs are prepared systematically for all operations. Answer “irrelevant area for our company” was on the basis of data analysis considered as a middle value. 1 = No plans and programs 2 = Plans and programs are prepared rarely 3 = Plans and programs are prepared repeatedly (irrelevant) 4 = Plans and programs are prepared systematically for particular operations 5 = Plans and programs are prepared systematically for all operations |
| EMCS_2 | Please indicate if your company has formalized plans and programs for impact of products on environment | |
| EMCS_3 | Please indicate if your company has formalized plans and programs for water withdrawals | |
| EMCS_4 | Please indicate if your company has formalized plans and programs for impact on biodiversity | |
| EMCS_5 | Please indicate if your company has formalized plans and programs for emissions, effluents and waste | |
| EMCS_6 | Please indicate if your company has formalized plans and programs for impacts from product distribution and employee travel | |
| EMCS_7 | Please indicate if your company has formalized plans and programs for environmental responsibility of suppliers | |
| EMCS_8 | Please indicate if your company has a formalized structure and systems for utilized materials, recycled materials and energy consumption | Measured on scale from 1 = no formalized system to 5 = a comprehensive system for company in run. Answer “irrelevant area for our company” was on the basis of data analysis considered as a middle value. 1 = No formalized system 2 = No formalized system, implementation considered 3 = Fragments of a system exist 4 = An incomplete system in run 5 = A comprehensive system for company in run |
| EMCS_9 | Please indicate if your company has a formalized structure and systems for impact of products on environment | |
| EMCS_10 | Please indicate if your company has a formalized structure and systems for water withdrawals | |
| EMCS_11 | Please indicate if your company has a formalized structure and systems for impact on biodiversity | |
| EMCS_12 | Please indicate if your company has a formalized structure and systems for emissions, effluents and waste | |
| EMCS_13 | Please indicate if your company has a formalized structure and systems for impacts from product distribution and employee travel | |
| EMCS_14 | Please indicate if your company has a formalized structure and systems for environmental responsibility of suppliers | |
| EnvPerf_1 | Express degree of agreement with statement “Overall, in the area of environmental management, we are doing better than the rival companies” | 1 = Strongly disagree 2 = Disagree 3 = Same as rivals 4 = Agree 5 = Strongly agree |
| EnvPerf_2 | Express degree of agreement with statement “Overall, our products/services are more environmentally friendly than similar products of the rival companies” | |
| EconPerf_1 | Rate the organisation′s performance over the past 5 years against the indicator “revenue development”, with respect to the sector in which the organisation operates | 1 = Well below average in sector 2 = Below average in sector 3 = Average in sector 4 = Above average in sector 5 = Well above average in sector |
| EconPerf_2 | Rate the organisation′s performance over the past 5 years against the indicator “market share development”, with respect to the sector in which the organisation operates | |
| EconPerf_3 | Rate the organisation′s performance over the past 5 years against the indicator “operating profit development”, with respect to the sector in which the organisation operates | |
| EconPerf_4 | Rate the organisation′s performance over the past 5 years against the indicator “return on assets development (operating profit/assets)”, with respect to the sector in which the organisation operates |
References
- Goto, M.; Sueyoshi, T. Sustainable development and corporate social responsibility in Japanese manufacturing companies. Sustain. Dev. 2020, 28, 844–856. [Google Scholar] [CrossRef]
- Ye, N.; Kueh, T.B.; Hou, L.; Liu, Y.; Yu, H. A bibliometric analysis of corporate social responsibility in sustainable development. J. Clean. Prod. 2020, 272, 122679. [Google Scholar] [CrossRef]
- Moon, J. The contribution of corporate social responsibility to sustainable development. Sustain. Dev. 2007, 15, 296–306. [Google Scholar] [CrossRef]
- Xia, B.; Olanipekun, A.; Chen, Q.; Xie, L.; Liu, Y. Conceptualising the state of the art of corporate social responsibility (CSR) in the construction industry and its nexus to sustainable development. J. Clean. Prod. 2018, 195, 340–353. [Google Scholar] [CrossRef]
- Chaudhry, N.I.; Amir, M. From institutional pressure to the sustainable development of firm: Role of environmental management accounting implementation and environmental proactivity. Bus. Strategy Environ. 2020, 29, 3542–3554. [Google Scholar] [CrossRef]
- Abdel-Maksoud, A.; Jabbour, M.; Abdel-Kader, M. Stakeholder pressure, eco-control systems, and firms’ performance: Empirical evidence from UK manufacturers. Account. Forum 2021, 45, 30–57. [Google Scholar] [CrossRef]
- Kuzior, A.; Ober, J.; Karwot, J. Stakeholder expectation of corporate social responsibility practices: A case study of PWiK Rybnik, Poland. Energies 2021, 14, 3337. [Google Scholar] [CrossRef]
- Rodrigue, M.; Magnan, M.; Boulianne, E. Stakeholders’ influence on environmental strategy and performance indicators: A managerial perspective. Manag. Account. Res. 2013, 24, 301–316. [Google Scholar] [CrossRef]
- Senn, J.; Giordano-Spring, S. The limits of environmental accounting disclosure: Enforcement of regulations, standards and interpretative strategies. Account. Audit. Accoun. 2020, 33, 1367–1393. [Google Scholar] [CrossRef]
- Judge, W.Q., Jr.; Douglas, T.J. Performance implications of incorporating natural environmental issues into the strategic planning process: An empirical assessment. J. Manag. Stud. 1998, 35, 241–262. [Google Scholar] [CrossRef]
- Xie, J.; Nozawa, W.; Yagi, M.; Fujii, H.; Managi, S. Do environmental, social, and governance activities improve corporate financial performance? Bus. Strategy Environ. 2019, 28, 286–300. [Google Scholar] [CrossRef] [Green Version]
- Marczewska, M.; Kostrzewski, M. Sustainable business models: A bibliometric performance analysis. Energies 2020, 13, 6062. [Google Scholar] [CrossRef]
- Schneider, S.; Clauß, T. Business models for sustainability: Choices and consequences. Organ. Environ. 2020, 33, 384–407. [Google Scholar] [CrossRef]
- Morioka, S.N.; de Carvalho, M.M. A systematic literature review towards a conceptual framework for integrating sustainability performance into business. J. Clean. Prod. 2016, 136, 134–146. [Google Scholar] [CrossRef]
- Amir, M.; Chaudhry, N.I. Linking environmental strategy to firm performance: A sequential mediation model via environmental management accounting and top management commitment. Pak. J. Commer. Soc. Sci 2019, 13, 849–867. [Google Scholar]
- Endrikat, J.; Guenther, E.; Hoppe, H. Making sense of conflicting empirical findings: A meta-analytic review of the relationship between corporate environmental and financial performance. Eur. Manag. J. 2014, 32, 735–751. [Google Scholar] [CrossRef]
- Lisi, I.E. Translating environmental motivations into performance: The role of environmental performance measurement systems. Manag. Account. Res. 2015, 29, 27–44. [Google Scholar] [CrossRef]
- La Rosa, F.; Liberatore, G.; Mazzi, F.; Terzani, S. The impact of corporate social performance on the cost of debt and access to debt financing for listed European non-financial firms. Eur. Manag. J. 2018, 36, 519–529. [Google Scholar] [CrossRef]
- Habek, P. CSR reporting practices in Visegrad Group countries and the quality of disclosure. Sustainability 2017, 9, 2322. [Google Scholar] [CrossRef] [Green Version]
- Janik, A.; Ryszko, A.; Szafraniec, M. Greenhouse gases and circular economy issues in sustainability reports from the energy sector in the European Union. Energies 2020, 13, 5993. [Google Scholar] [CrossRef]
- Pelikánová, R.M. Corporate social responsibility information in annual reports in the EU-A Czech case study. Sustainability 2019, 11, 237. [Google Scholar] [CrossRef] [Green Version]
- Sedláček, J. Non-financial reporting of industrial corporations—A Czech case study. Acta Univ. Agric. Silvic. Mendel. Brun. 2020, 68, 625–636. [Google Scholar] [CrossRef]
- MacGregor, R.K.; Sroka, W.; Pelikánová, R.M. The CSR perception of front-line employees of luxury fashion businesses. Organizacija 2020, 53, 198–211. [Google Scholar] [CrossRef]
- Pawlowska, E.; Machnik-Slomka, J.; Klosok-Bazan, I.; Gono, M.; Gono, R. Corporate social responsibility of water and sanitation company in the Czech Republic—Case study. Energies 2021, 14, 3981. [Google Scholar] [CrossRef]
- Sroka, W.; Vveinhardt, J. Is a CSR Policy an equally effective vaccine against workplace mobbing and psychosocial stressors? Int. J. Environ. Res. Public Health 2020, 17, 7292. [Google Scholar] [CrossRef] [PubMed]
- Asiri, N.; Khan, T.; Kend, M. Environmental management accounting in the Middle East and North Africa region: Significance of resource slack and coercive isomorphism. J. Clean. Prod. 2020, 267, 121870. [Google Scholar] [CrossRef]
- Ko, W.W.; Liu, G. Environmental strategy and competitive advantage: The role of small- and medium-Sized enterprises’ dynamic capabilities. Bus. Strategy Environ. 2017, 26, 584–596. [Google Scholar] [CrossRef] [Green Version]
- Latan, H.; Chiappetta Jabbour, C.J.; Lopes de Sousa Jabbour, A.B.; Wamba, S.F.; Shahbaz, M. Effects of environmental strategy, environmental uncertainty and top management’s commitment on corporate environmental performance: The role of environmental management accounting. J. Clean. Prod. 2018, 180, 297–306. [Google Scholar] [CrossRef]
- Samad, S. Examining the effects of environmental strategy and competitive advantage on business performance. Manag. Sci. Lett. 2018, 8, 891–902. [Google Scholar] [CrossRef]
- Solovida, G.T.; Latan, H. Linking environmental strategy to environmental performance: Mediation role of environmental management accounting. Sustain. Account. Manag. Policy J. 2017, 8, 595–619. [Google Scholar] [CrossRef]
- Vu, T.T.; Dang, W.V.T. Environmental commitment and firm financial performance: A moderated mediation study of environmental collaboration with suppliers and CEO gender. Int. J. Ethics. Syst. 2020, 37, 53–69. [Google Scholar] [CrossRef]
- Yasir, M.; Majid, A.; Qudratullah, H. Promoting environmental performance in manufacturing industry of developing countries through environmental orientation and green business strategies. J. Clean. Prod. 2020, 275, 123003. [Google Scholar] [CrossRef]
- Melnyk, S.A.; Sroufe, R.P.; Calantone, R. Assessing the impact of environmental management systems on corporate and environmental performance. J. Oper. Manag. 2003, 21, 329–351. [Google Scholar] [CrossRef]
- Fernandez-Feijoo, B.; Romero, S.; Ruiz, S. Commitment to corporate social responsibility measured through global reporting initiative reporting: Factors affecting the behavior of companies. J. Clean Prod. 2014, 81, 244–254. [Google Scholar] [CrossRef]
- Albertini, E. Does environmental management improve financial performance? A meta-analytical review. Organ. Environ. 2013, 26, 431–457. [Google Scholar] [CrossRef]
- Ambec, S.; Lanoie, P. Does it pay to be green? A systematic overview. Acad. Manag. Perspect. 2008, 22, 45–62. [Google Scholar] [CrossRef] [Green Version]
- Hirunyawipada, T.; Pan, Y. When will going green enhance firm performance? J. Mark. Theory Pract. 2020, 28, 226–241. [Google Scholar] [CrossRef]
- Horváthová, E. Does environmental performance affect financial performance? A meta-analysis. Ecol. Econ. 2010, 70, 52–59. [Google Scholar] [CrossRef]
- Huang, D.Z.X. Environmental, social and governance (ESG) activity and firm performance: A review and consolidation. Account. Financ. 2021, 61, 335–360. [Google Scholar] [CrossRef]
- Klassen, R.D.; McLaughlin, C.P. The impact of environmental management on firm performance. Manag. Sci 1996, 42, 1199–1214. [Google Scholar] [CrossRef]
- Mazzi, A.; Toniolo, S.; Manzardo, A.; Ren, J.; Scipioni, A. Exploring the direction on the environmental and business performance relationship at the firm level. Lessons from a literature review. Sustainability 2016, 8, 1200. [Google Scholar] [CrossRef] [Green Version]
- Shahgholian, A. Unpacking the relationship between environmental profile and financial profile; literature review toward methodological best practice. J. Clean. Prod. 2019, 233, 181–196. [Google Scholar] [CrossRef]
- Van der Byl, C.A.; Slawinski, N. Embracing Tensions in corporate sustainability: A review of research from win-wins and trade-offs to paradoxes and beyond. Organ. Environ. 2015, 28, 54–79. [Google Scholar] [CrossRef]
- Trumpp, C.; Guenther, T. Too little or too much? Exploring U-shaped relationships between corporate environmental performance and corporate financial performance. Bus. Strategy Environ. 2017, 26, 49–68. [Google Scholar] [CrossRef]
- Hang, M.; Geyer-Klingeberg, J.; Rathgeber, A.W. It is merely a matter of time: A meta-analysis of the causality between environmental performance and financial performance. Bus. Strategy Environ. 2019, 28, 257–273. [Google Scholar] [CrossRef]
- Hadid, W.; Al-Sayed, M. Management accountants and strategic management accounting: The role of organizational culture and information systems. Manag. Account. Res. 2021, 50, 100725. [Google Scholar] [CrossRef]
- Clarkson, P.M.; Overell, M.B.; Chapple, L. Environmental reporting and its relation to corporate environmental performance. Abacus 2011, 47, 27–60. [Google Scholar] [CrossRef]
- Dagiliene, L.; Frendzel, M.; Sutiene, K.; Wnuk-Pel, T. Wise managers think about circular economy, wiser report and analyze it. Research of environmental reporting practices in EU manufacturing companies. J. Clean. Prod. 2020, 274, 121968. [Google Scholar] [CrossRef]
- Maas, K.; Schaltegger, S.; Crutzen, N. Integrating corporate sustainability assessment, management accounting, control, and reporting. J. Clean. Prod. 2016, 136, 237–248. [Google Scholar] [CrossRef]
- European Union. Directive 2014/95/EU of the European Parliament and of the Council of 22 October 2014 Amending Directive 2013/34/EU as Regards Disclosure of Non-Financial and Diversity Information by Certain Large Undertakings and Groups. 2014. Available online: https://eur-lex.europa.eu/legal-content/EN/TXT/?uri=CELEX%3A32014L0095 (accessed on 28 June 2021).
- Epstein, M.J.; Buhovac, A.R.; Yuthas, K. Managing social, environmental and financial performance simultaneously. Long Range Plan. 2015, 48, 35–45. [Google Scholar] [CrossRef]
- Epstein, M.J.; Roy, M.-J. Sustainability in action: Identifying and measuring the key performance drivers. Long Range Plan. 2001, 34, 585–604. [Google Scholar] [CrossRef]
- Hamann, P.M.; Schiemann, F.; Bellora, L.; Guenther, T.W. Exploring the dimensions of organizational performance: A construct validity study. Organ. Res. Methods 2013, 16, 67–87. [Google Scholar] [CrossRef]
- Ilinitch, A.Y.; Soderstrom, N.S.; Thomas, T.E. Measuring corporate environmental performance. J. Account. Public Policy 1998, 17, 383–408. [Google Scholar] [CrossRef]
- Tyteca, D. On the measurement of the environmental performance of firms—A literature review and a productive efficiency perspective. J. Environ. Manag. 1996, 46, 281–308. [Google Scholar] [CrossRef]
- European Union. Directive 2013/34/EU of the European Parliament and of the Council of 26 June 2013 on the Annual Financial Statements, Consolidated Financial Statements and Related Reports of Certain Types of Undertakings, Amending Directive 2006/43/EC of the European Parliament and of the Council and Repealing Council Directives 78/660/EEC and 83/349/EEC. 2013. Available online: https://eur-lex.europa.eu/legal-content/EN/TXT/PDF/?uri=CELEX:32013L0034&from=CS (accessed on 28 June 2021).
- Czech Republic. Act on Accounting of 1991, 563/1991 Coll. 1991. Available online: https://www.zakonyprolidi.cz/cs/1991-563 (accessed on 28 June 2021).
- Slovak Republic. Act on accounting of 2002, 431/2002 Coll. 2002. Available online: https://www.slov-lex.sk/pravne-predpisy/SK/ZZ/2002/431/20170101 (accessed on 28 June 2021).
- Hair, J.F.; Hult, T.M.; Ringle, C.M.; Sarstedt, M. A Primer on Partial Least Squares Structural Equation Modeling (PLS-SEM), 2nd ed.; Sage Publications: Los Angeles, CA, USA, 2017. [Google Scholar]
- Hair, J.F.; Risher, J.J.; Sarstedt, M.; Ringle, C.M. When to use and how to report the results of PLS-SEM. Eur. Bus. Rev. 2019, 31, 2–24. [Google Scholar] [CrossRef]
- Kock, N.; Hadaya, P. Minimum sample size estimation in PLS-SEM: The inverse square root and gamma-exponential methods. Inf. Syst. J. 2018, 28, 227–261. [Google Scholar] [CrossRef]
- Cohen, J. A power primer. Psychol. Bull. 1992, 112, 155–159. [Google Scholar] [CrossRef]
- Aranda-Usón, A.; Portillo-Tarragona, P.; Marín-Vinuesa, L.M.; Scarpellini, S. Financial resources for the circular economy: A perspective from businesses. Sustainability 2019, 11, 888. [Google Scholar] [CrossRef] [Green Version]
- Hair, J.F.; Sarstedt, M.; Ringle, C.M.; Gudergan, S.P. Advanced Issues in Partial Least Squares Structural Equation Modeling; Sage Publications: Los Angeles, CA, USA, 2018. [Google Scholar]
- Sarstedt, M.; Cheah, J.H. Partial least squares structural equation modeling using SmartPLS: A software review. J. Mark. Anal. 2019, 7, 196–202. [Google Scholar] [CrossRef]
- Reinartz, W.; Haenlein, M.; Henseler, J. An empirical comparison of the efficacy of covariance-based and variance-based SEM. Int. J. Res. Mark. 2009, 26, 332–344. [Google Scholar] [CrossRef] [Green Version]
- Hair, J.F.; Ringle, C.M.; Sarstedt, M. PLS-SEM: Indeed a silver bullet. J. Mark. Theory Pract. 2011, 19, 139–151. [Google Scholar] [CrossRef]
- Dijkstra, T.K.; Henseler, J. Consistent partial least squares path modeling. MIS Q. 2015, 39, 297–316. [Google Scholar] [CrossRef]
- Hair, J.F.; Sarstedt, M.; Ringle, C.M. Rethinking some of the rethinking of partial least squares. Eur. J. Mark. 2019, 53, 566–584. [Google Scholar] [CrossRef]
- Wu, X.; Dluhošová, D.; Zmeškal, Z. Corporate social responsibility and profitability: The moderating role of firm type in Chinese appliance listed companies. Energies 2021, 14, 227. [Google Scholar] [CrossRef]
- Adamik, A.; Sikora-Fernandez, D. Smart organizations as a source of competitiveness and sustainable development in the age of industry 4.0: Integration of micro and macro perspective. Energies 2021, 14, 1572. [Google Scholar] [CrossRef]
- Cyfert, S.; Glabiszewski, W.; Zastempowski, M. Impact of management tools supporting industry 4.0 on the importance of CSR during COVID-19. Generation Z. Energies 2021, 14, 1642. [Google Scholar] [CrossRef]
- Gajdzik, B.; Grabowska, S.; Saniuk, S.; Wieczorek, T. Sustainable development and industry 4.0: A bibliometric analysis identifying key scientific problems of the sustainable industry 4.0. Energies 2020, 13, 4254. [Google Scholar] [CrossRef]


| Descriptive Statistics | Assets (Thousands EUR) | Sales (Thousands EUR) |
|---|---|---|
| Mean | 260,243 | 266,851 |
| Median | 49,532 | 57,248 |
| Standard deviation | 958,494 | 764,040 |
| Skewness | 8.06 | 6.88 |
| Kurtosis | 73.86 | 57.74 |
| Construct | Code | Outer Loadings | p-Value | Composite Reliability | Cronbach′s Alpha | Rho_A | Average Variance Extracted |
|---|---|---|---|---|---|---|---|
| EnvStrategy | 0.900 | 0.873 | 0.877 | 0.534 | |||
| EnvStrategy_1 | 0.585 | 0.000 | |||||
| EnvStrategy_2 | 0.822 | 0.000 | |||||
| EnvStrategy_3 | 0.804 | 0.000 | |||||
| EnvStrategy_4 | 0.775 | 0.000 | |||||
| EnvStrategy_5 | 0.679 | 0.000 | |||||
| EnvStrategy_6 | 0.828 | 0.000 | |||||
| EnvStrategy_7 | 0.647 | 0.000 | |||||
| EnvStrategy_8 | 0.662 | 0.000 | |||||
| EnvReporting | 0.887 | 0.748 | 0.762 | 0.798 | |||
| EnvReporting_1 | 0.911 | 0.000 | |||||
| EnvReporting_2 | 0.874 | 0.000 | |||||
| Size | 0.870 | 0.705 | 0.726 | 0.770 | |||
| Size_1 | 0.850 | 0.000 | |||||
| Size_2 | 0.904 | 0.000 | |||||
| EMCS | 0.944 | 0.935 | 0.937 | 0.545 | |||
| EMCS_1 | 0.769 | 0.000 | |||||
| EMCS_2 | 0.754 | 0.000 | |||||
| EMCS_3 | 0.748 | 0.000 | |||||
| EMCS_4 | 0.743 | 0.000 | |||||
| EMCS_5 | 0.786 | 0.000 | |||||
| EMCS_6 | 0.636 | 0.000 | |||||
| EMCS_7 | 0.717 | 0.000 | |||||
| EMCS_8 | 0.736 | 0.000 | |||||
| EMCS_9 | 0.770 | 0.000 | |||||
| EMCS_10 | 0.701 | 0.000 | |||||
| EMCS_11 | 0.771 | 0.000 | |||||
| EMCS_12 | 0.771 | 0.000 | |||||
| EMCS_13 | 0.668 | 0.000 | |||||
| EMCS_14 | 0.747 | 0.000 | |||||
| EnvPerf | 0.875 | 0.716 | 0.725 | 0.778 | |||
| EnvPerf_1 | 0.899 | 0.000 | |||||
| EnvPerf_2 | 0.864 | 0.000 | |||||
| EconPerf | 0.924 | 0.891 | 0.892 | 0.753 | |||
| EconPerf_1 | 0.876 | 0.000 | |||||
| EconPerf_2 | 0.833 | 0.000 | |||||
| EconPerf_3 | 0.902 | 0.000 | |||||
| EconPerf_4 | 0.860 | 0.000 |
| Construct | EMCS | EconPerf | EnvPerf | EnvReporting | Size | EnvStrategy |
|---|---|---|---|---|---|---|
| EMCS | 0.738 | |||||
| EconPerf | 0.301 | 0.868 | ||||
| EnvPerf | 0.431 | 0.332 | 0.882 | |||
| EnvReporting | 0.517 | 0.317 | 0.400 | 0.893 | ||
| Size | 0.230 | 0.158 | 0.000 | 0.230 | 0.878 | |
| EnvStrategy | 0.744 | 0.210 | 0.346 | 0.488 | 0.141 | 0.730 |
| Construct | EMCS | EconPerf | EnvPerf | EnvReporting | Size |
|---|---|---|---|---|---|
| EMCS | |||||
| EconPerf | 0.327 | ||||
| EnvPerf | 0.518 | 0.417 | |||
| EnvReporting | 0.612 | 0.390 | 0.547 | ||
| Size | 0.280 | 0.213 | 0.040 | 0.318 | |
| EnvStrategy | 0.805 | 0.243 | 0.419 | 0.588 | 0.184 |
| Construct | EMCS | EconPerf | EnvPerf |
|---|---|---|---|
| EMCS | 2.325 | ||
| EnvPerf | 1.000 | ||
| EnvReporting | 1.360 | ||
| Size | 1.057 | 1.058 | |
| EnvStrategy | 1.314 | 2.247 |
| Hypothesis | Hypothesis Description | Coefficient/Specific Indirect Effect | Supposed Sign | p-Value | Evaluation |
|---|---|---|---|---|---|
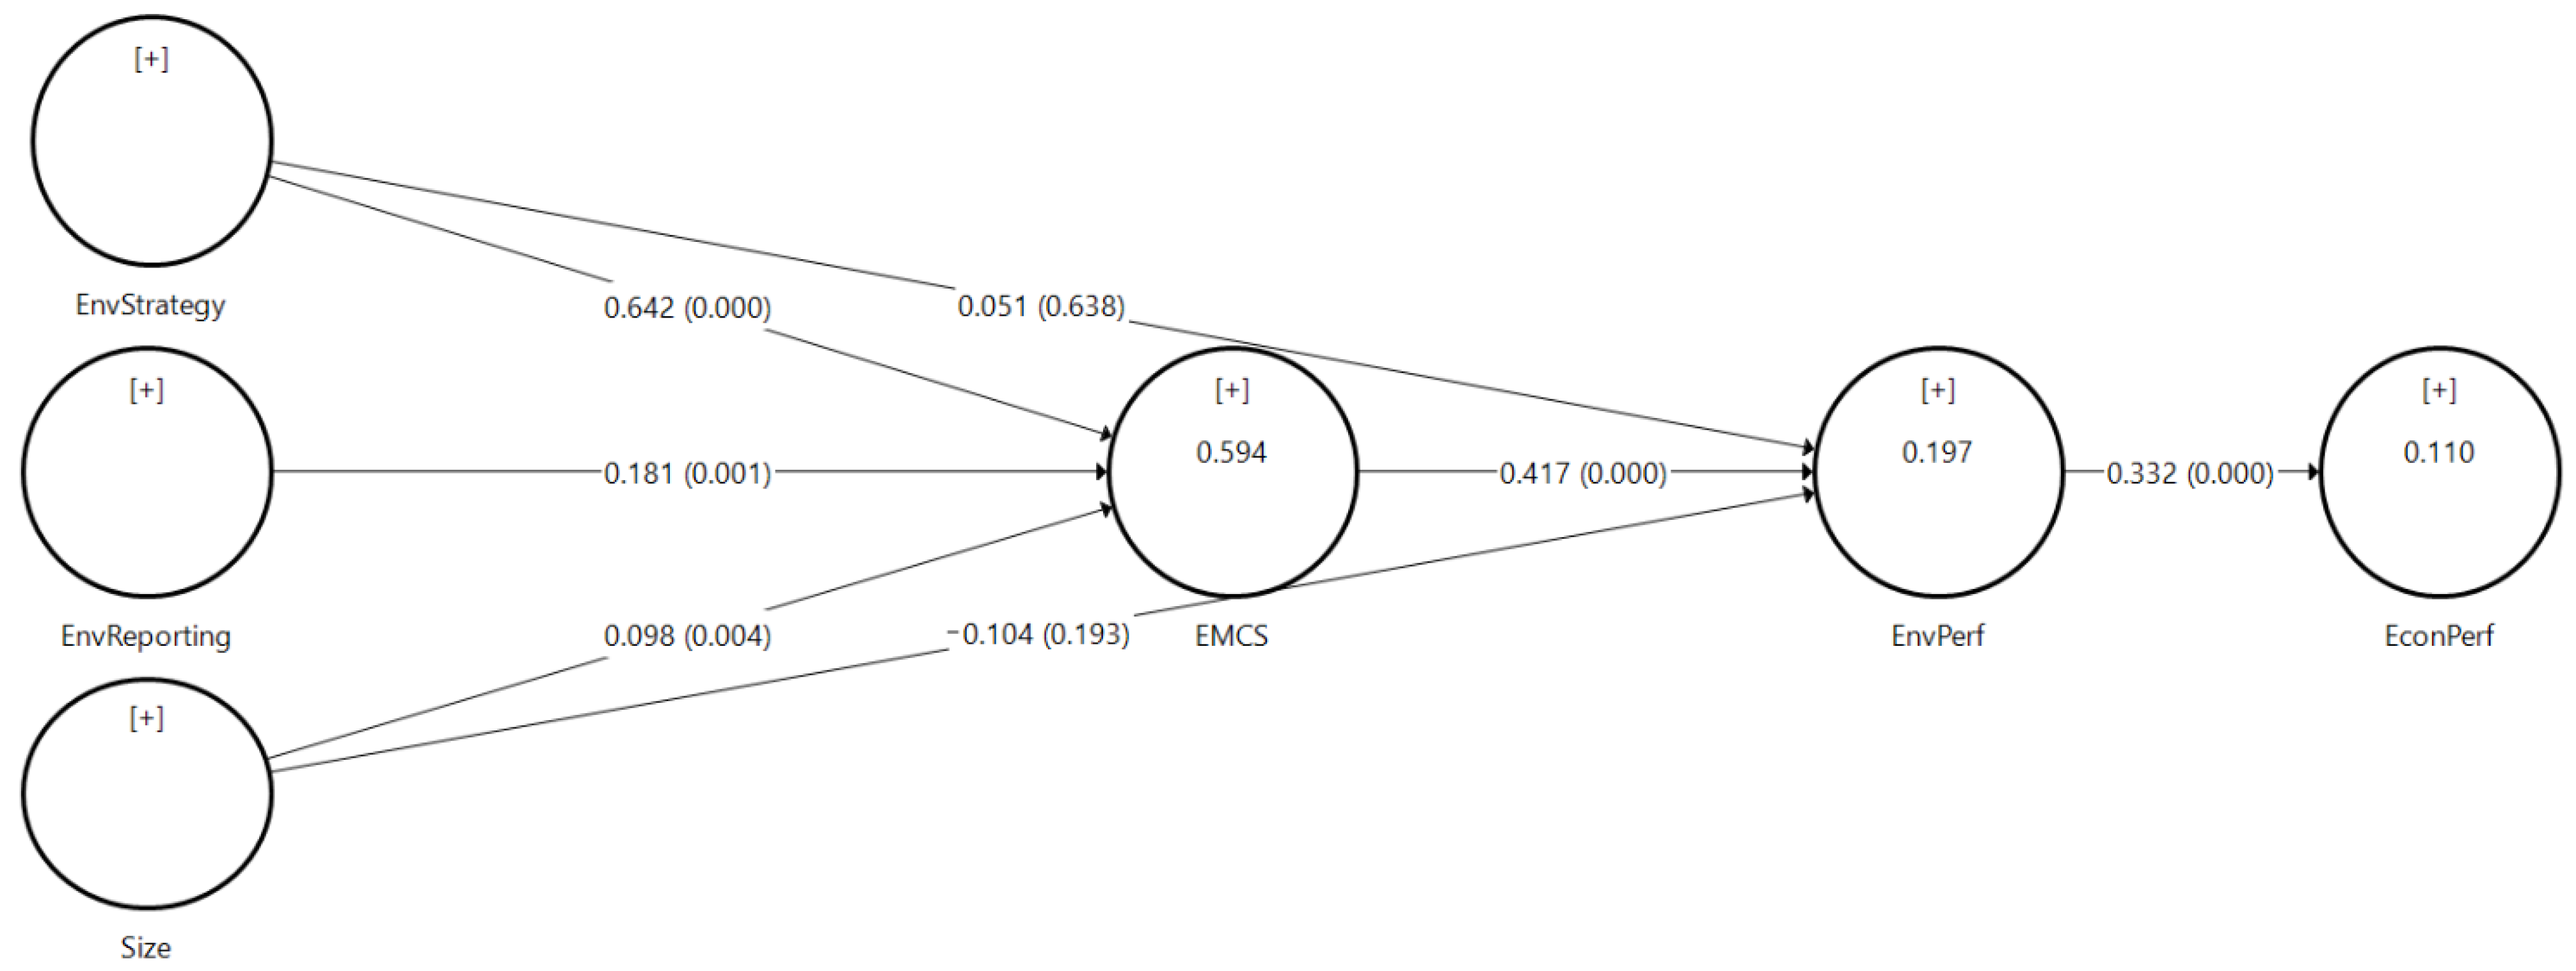
| H1 | EnvStrategy→EnvPerf | 0.051 | + | 0.638 | rejected |
| H2 | EnvStrategy→EMCS | 0.642 | + | 0.000 | supported |
| H3 | EnvStrategy→EMCS→EnvPerf | 0.268 | + | 0.000 | supported |
| H4 | EMCS→EnvPerf | 0.417 | + | 0.000 | supported |
| H5 | EnvReporting→EMCS | 0.181 | + | 0.001 | supported |
| H6 | EnvReporting→EMCS→EnvPerf | 0.076 | + | 0.012 | supported |
| H7 | EnvStrategy→EMCS→EnvPerf→EconPerf | 0.089 | + | 0.004 | supported |
| H8 | EnvReporting→EMCS→EnvPerf→EconPerf | 0.025 | + | 0.046 | supported |
Publisher’s Note: MDPI stays neutral with regard to jurisdictional claims in published maps and institutional affiliations. |
© 2021 by the authors. Licensee MDPI, Basel, Switzerland. This article is an open access article distributed under the terms and conditions of the Creative Commons Attribution (CC BY) license (https://creativecommons.org/licenses/by/4.0/).
Share and Cite
Petera, P.; Wagner, J.; Pakšiová, R. The Influence of Environmental Strategy, Environmental Reporting and Environmental Management Control System on Environmental and Economic Performance. Energies 2021, 14, 4637. https://doi.org/10.3390/en14154637
Petera P, Wagner J, Pakšiová R. The Influence of Environmental Strategy, Environmental Reporting and Environmental Management Control System on Environmental and Economic Performance. Energies. 2021; 14(15):4637. https://doi.org/10.3390/en14154637
Chicago/Turabian StylePetera, Petr, Jaroslav Wagner, and Renáta Pakšiová. 2021. "The Influence of Environmental Strategy, Environmental Reporting and Environmental Management Control System on Environmental and Economic Performance" Energies 14, no. 15: 4637. https://doi.org/10.3390/en14154637