1. Introduction
Considering the diversifying energy strategies of different countries, “green” energy and energy recycling are becoming new targets. Similarly, the last decade has seen a significant demand for cost-efficient portable power supplies for applications in remote areas. Reliance on batteries is the dominant approach, however, the cost, mass, and requirements for continuous maintenance limit remote applications. An alternative to this problem is to harvest ambient energy from wind [
1], human motion [
2], solar, radiation and thermal among others. Two main challenges have to be addressed in this area. The first is to develop or improve instrumentation and tools to create electrical power from renewable natural resources or to collect and recycle “lost” energy from industrial and domestic applications. For example, Araque et al. used a thermoelectric energy harvesting concept to take advantage of the temperature difference between the cooled package and the human body [
3], which was able to generate 1.2 mW with a temperature difference of 25 °C and could be used for oxygen determination in refrigerated intelligent packaging. Furthermore, Ando et al. used another renewable source of energy: they proposed a smart monitoring approach for photo-voltaic (PV) systems at the panel level to optimize PV cell efficiency [
4]. Their objective was to detect critical faults through the continuous monitoring of PV plants. While PV and wind systems are well established, their efficiency depends on the local and usually intermittent weather conditions. In the present case, we focused on soil-based microbial fuel cells (MFCs) as a source of energy in northern remote areas of Canada and particularly in areas which are difficult to access and experience intermittent weather conditions.
The MFC is a well-known bio-electrochemical device that can extract usable energy during the bacteria-catalysed oxidation of dissolved organic molecules [
5]. The devices that support this process are usually two electrode systems with an anode adhered biofilm that produces and transfers electrons into an external electrical circuit, a cathode where a reduction reaction completes the redox reaction cycle and a fuel source which can be wastewater, or environmental soil samples. There are currently many types of MFCs, but the major types include two-chamber or single-chamber liquid-based [
6], benthic [
7] and soil-based [
8] MFCs. Other emerging approaches include flow-based MFCs at either the macro or microscale [
9,
10]. Generally, MFCs operate at any temperature where electroactive bacteria can thrive in the environment, but their performance can improve at higher temperatures before the onset of thermotoxic conditions, which vary.
Among the most important applications are MFCs for wastewater treatment [
11]. Although it has been known for over a century that organic compounds can be a source of power using MFCs [
12], a significant increase in interest has been generated in these devices due to the possibility of using a variant technology, called microbial electrolysis cells (MECs), to assist in the production of hydrogen and methane [
13]. Until MFC power outputs can be increased and MEC can have an impact on the large-scale synthesis of energy molecules, MFCs for sensors [
14] and wireless nodes [
15] in remote low-power applications remain a priority development area.
Currently, most soil MFCs can only produce minimal current (around 0.35
A at 0.7 V) [
16]. Several parameters should be considered for their impact on soil MFC performance, including soil type [
17], hydration state [
11] and pH, ionic strength [
16] and internal resistance [
18]. However, the development of ultra-low power electrical components paths the way for new applications of soil-based MFCs as local power sources for anywhere where there is exposed soil.
In this context, the novelty of our work was to provide a new instrument to generate low-cost energy, mainly in the northern area of the planet. However, our system is based on energy generated by bacteria. The latter are widely available, but the energy cost is not competitive with conventional energy such as hydroelectric and oil. Thus, our work provides energy generation tools that we called a bacteria energy recovery system (BERS) to provide a constant energy source for low power sensors and actuators, especially for use in remote area. This is important for the sensor network deployment. The main advantage of a BERS is its capability to power itself from bacteria without the need for any backup energy source or boot energy [
19]. Moreover, the unique dual switching system enables constant charging even during the energy discharging of stored energy with outputs that are free of voltage spikes, without using any secondary peripheral line conditioning hardware. These unique characteristics make the system independent from other sources of energy and it is only based on bacteria at all circuit stages, thereby distinguishing a BERS from other energy recovery designs [
20,
21,
22].
This paper is organised as follows.
Section 2 describes the system architecture of the power harvesting module, sound sensor, pH sensor and the proposed circuit. Finally,
Section 3 presents the results and discussion.
2. Systems Architecture
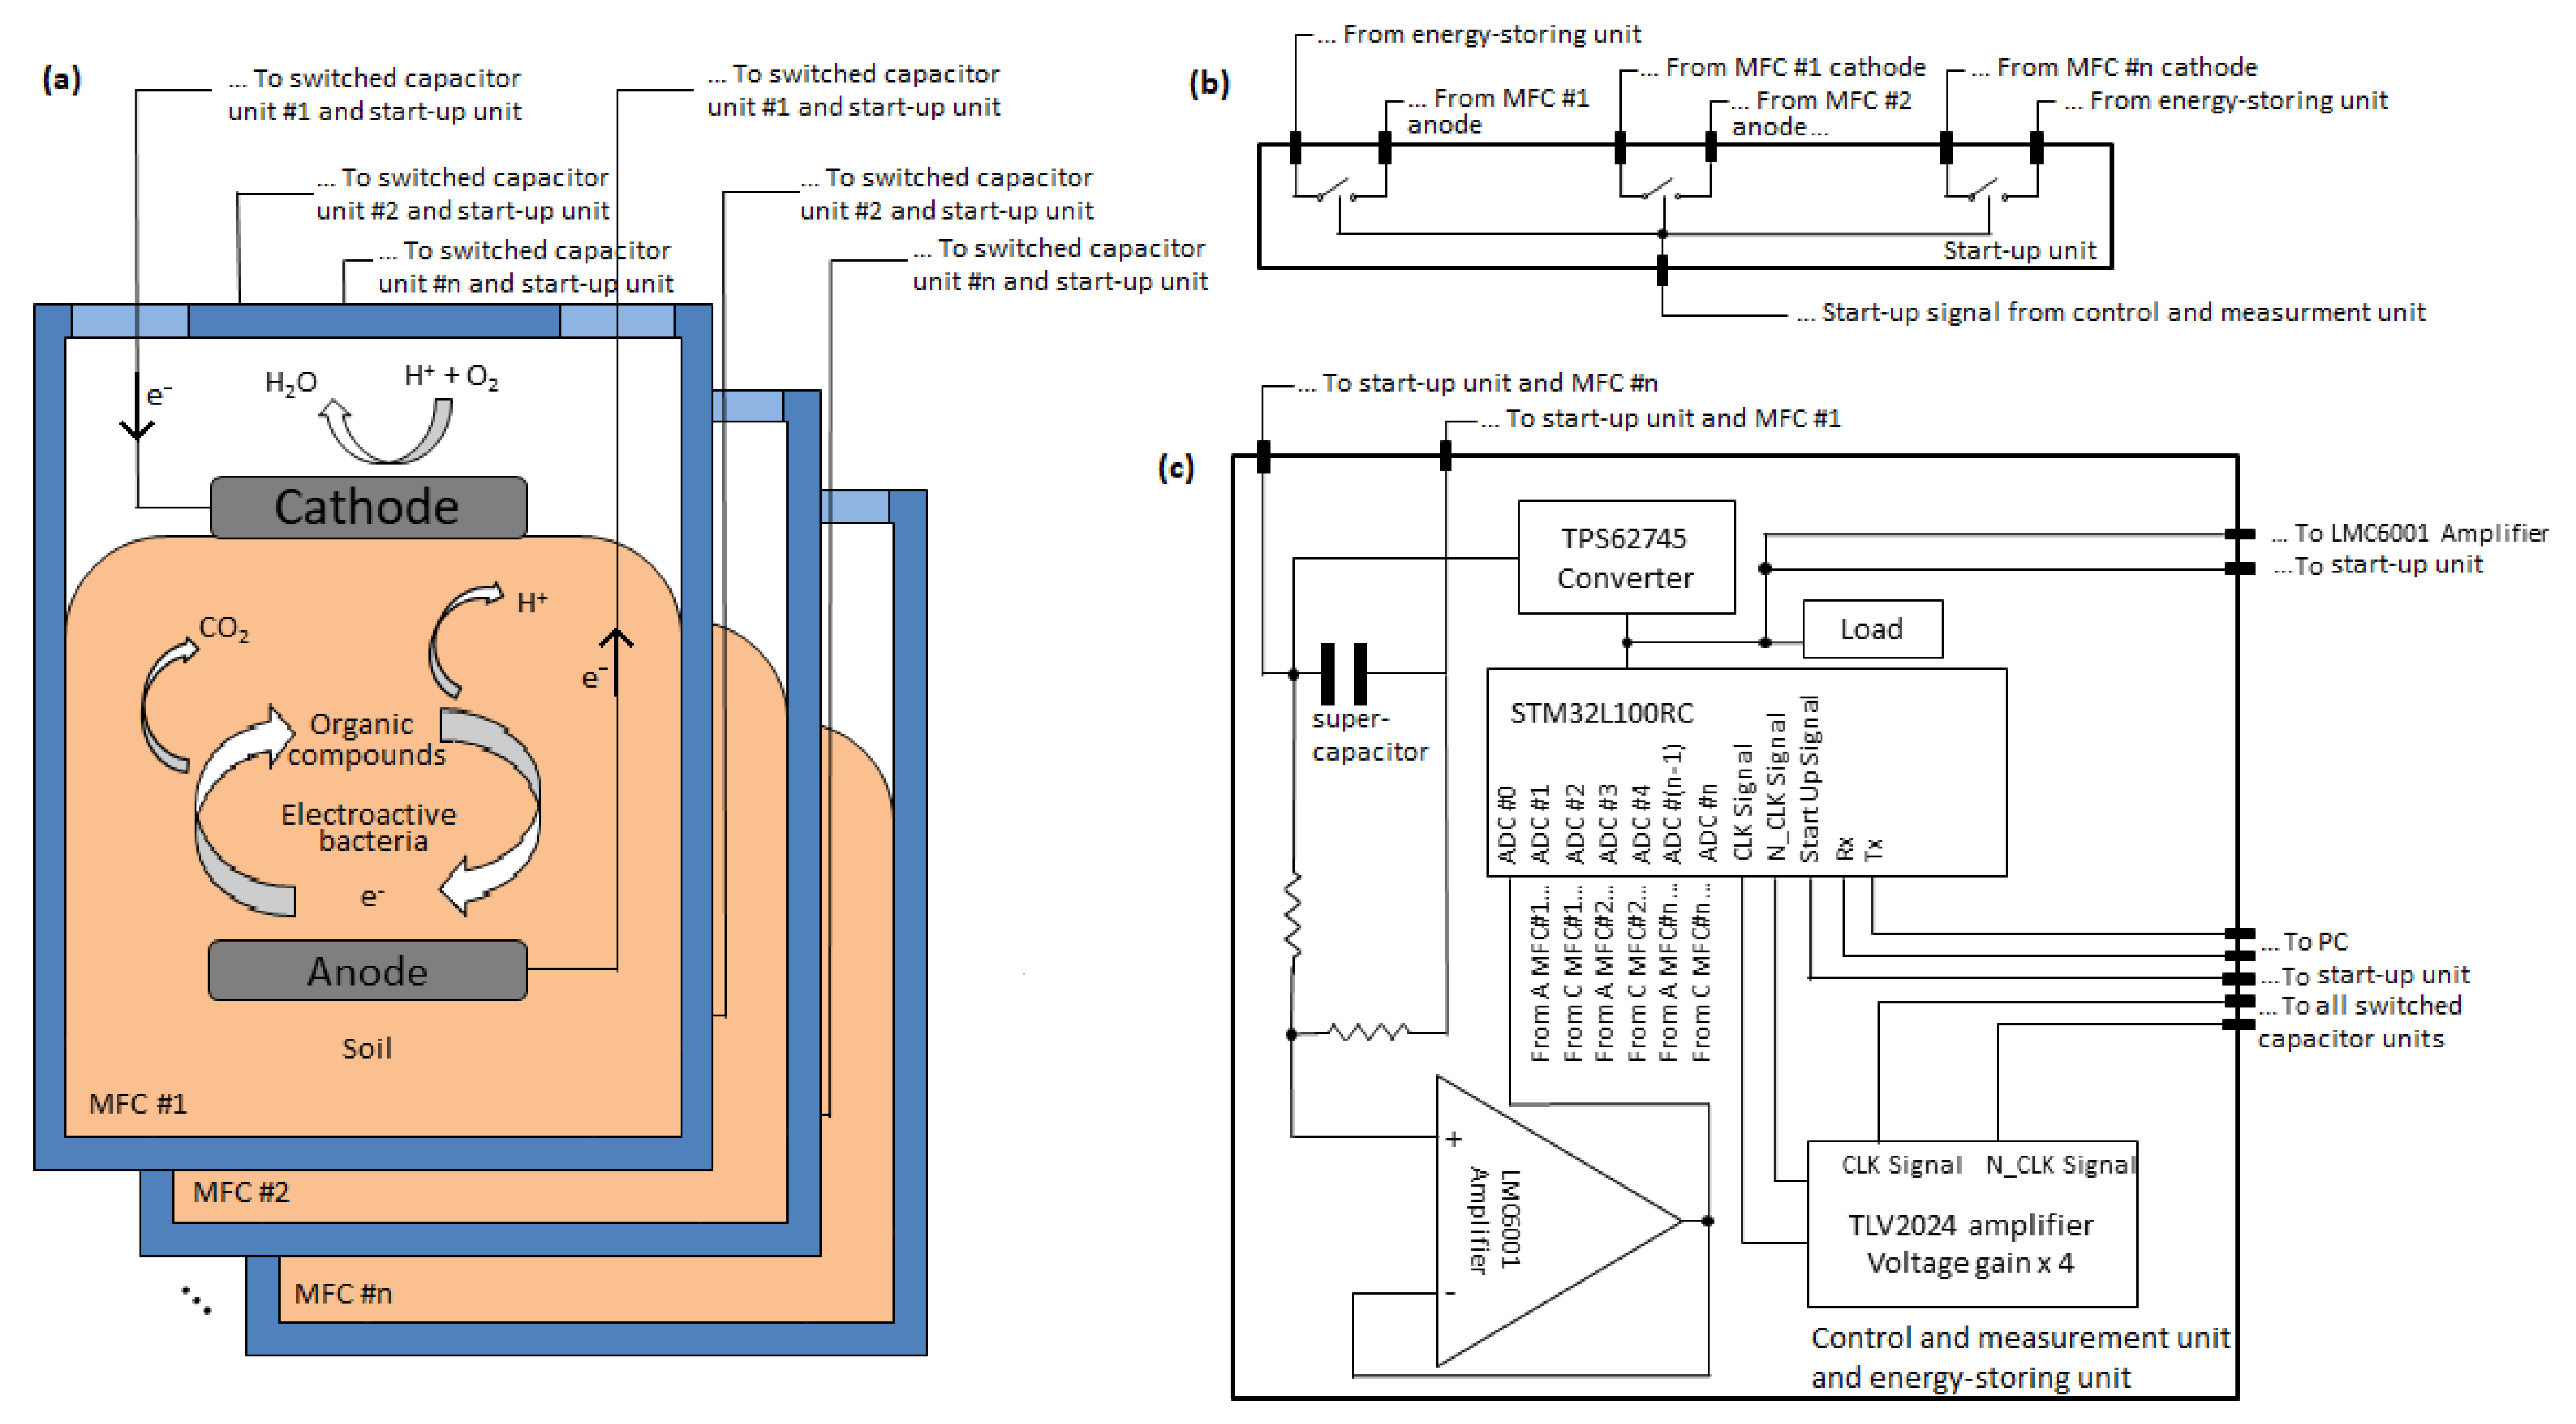
BERS is made of four units and all printed circuit boards were designed in-house: (1) a switched capacitor unit; (2) a control and measurement unit; (3) an energy-storing unit; and (4) a start-up unit (
Figure 1 and
Figure 2).
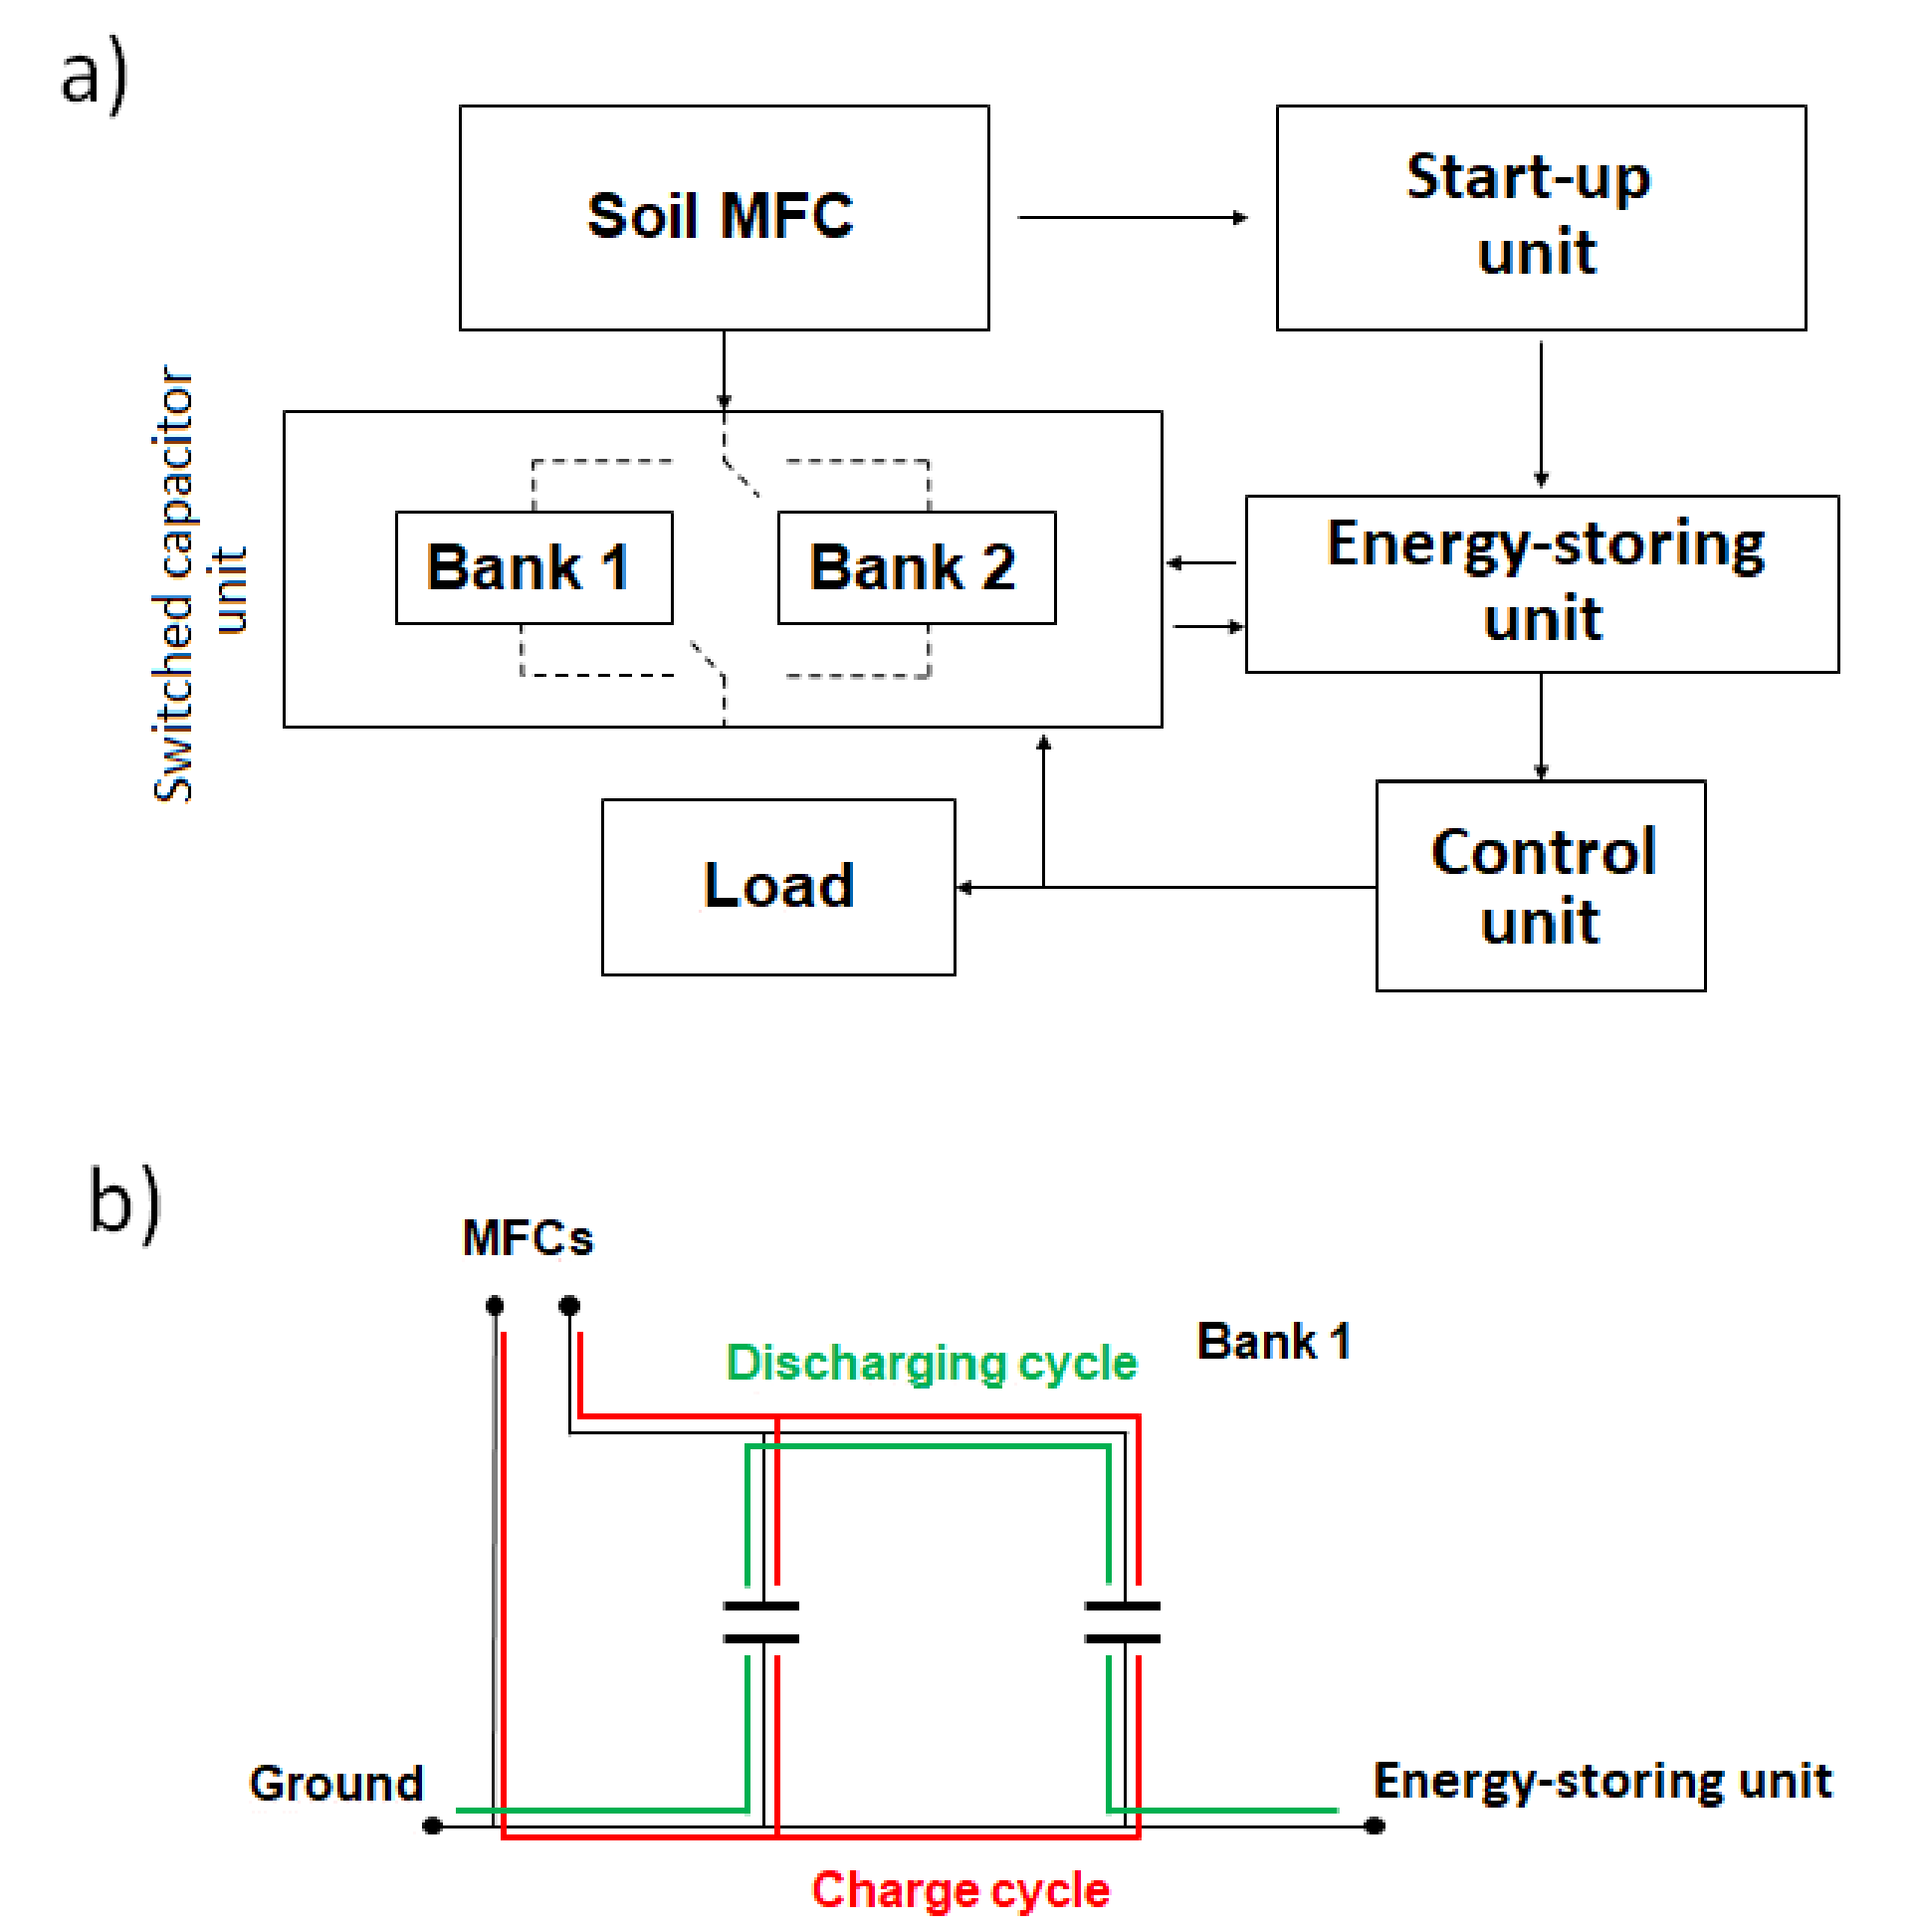
The energy recovery process is divided into two phases. During the first phase, each MFC charges two capacitors in the first capacitor bank. During this charging phase, the two capacitors are connected in parallel to the MFCs. When charged, the capacitor bank configuration is switched from parallel to serial so that the output voltage of MFCs is increased by a factor of two. Then, in the second phase, all charged capacitor banks connected to each MFC are connected in series and discharged into a super-capacitor. This process defines one cycle of the energy recovery system. Indeed, while discharging the capacitor bank the MFCs are disconnected from the first capacitor bank and charging starts on a second. The second capacitor bank follows the same process as the first one. At all times, the capacitor banks of the same MFC cannot be connected together. The discharge phase of the second capacitor bank corresponds to the second cycle of BERS. Using two cycles, we maintain a charge on the super-capacitor at any given moment. Indeed, the super-capacitor will be always charged from first or second capacitor bank units. The behavior of the capacitor bank is reported at
Figure 3. The super-capacitor is the main component of the BERS unit at
Figure 3a. The configuration of the capacitor bank is achieved by a control unit through relays.
Such a system was chosen because it can arbitrarily increase output voltage based on the number of capacitors used in each bank. In our design, we used two capacitors for each bank, which doubles the input voltage for each MFC. Each MFC is controlled by a single switched capacitor unit. All switched capacitor units are connected together in order to amplify the voltage like serial batteries.
The control and measurement unit provides a control signal for the switched capacitor units and records the output voltage of each MFC and energy-storing unit. Then, the data are transmitted to a data processing unit (computer) for user monitoring and data management. A DC/DC module converts the voltage in the energy-storage unit to a constant 3.3 V. The energy-storing unit stores the energy provided by the switched capacitor unit in a super-capacitor. To independently start up the system using only the MFCs, the start-up unit connects all MFCs in series through normally closed switches and connects them to the energy-storing unit. Once 3.3 V is reached, the DC/DC converter is turned on to power the control and measurement unit. The latter immediately opens the normally closed switches in order to let the switched capacitor circuit take control of the MFCs.
The actual system can handle up to seven MFCs. This limitation is due to several technical choices. All embedded data microprocessing was achieved on STM32 microcontroller which is powered by 3.3 V. TPS62745 step-down converter requires an input voltage between 3.3 V and 10 V to provide a regulated output voltage of 3.3 V. The input voltage of the step-down converter is provided by the super-capacitor, which is limited to 9 V for 1 F. Considering that an each MFC provides an average of 0.6 V which is doubled to 1.2 V through two serial capacitors connected to each MFC as previously described, we can connect a maximum of seven MFCs to avoid over-charging the super-capacitor to a voltage higher than 9 V. This limitation is due to our technical choice. However, if we change the super-capacitor to a higher voltage and the step-down converter to a higher limit, the proposed BERS can be extended to a higher number of MFCs than seven.
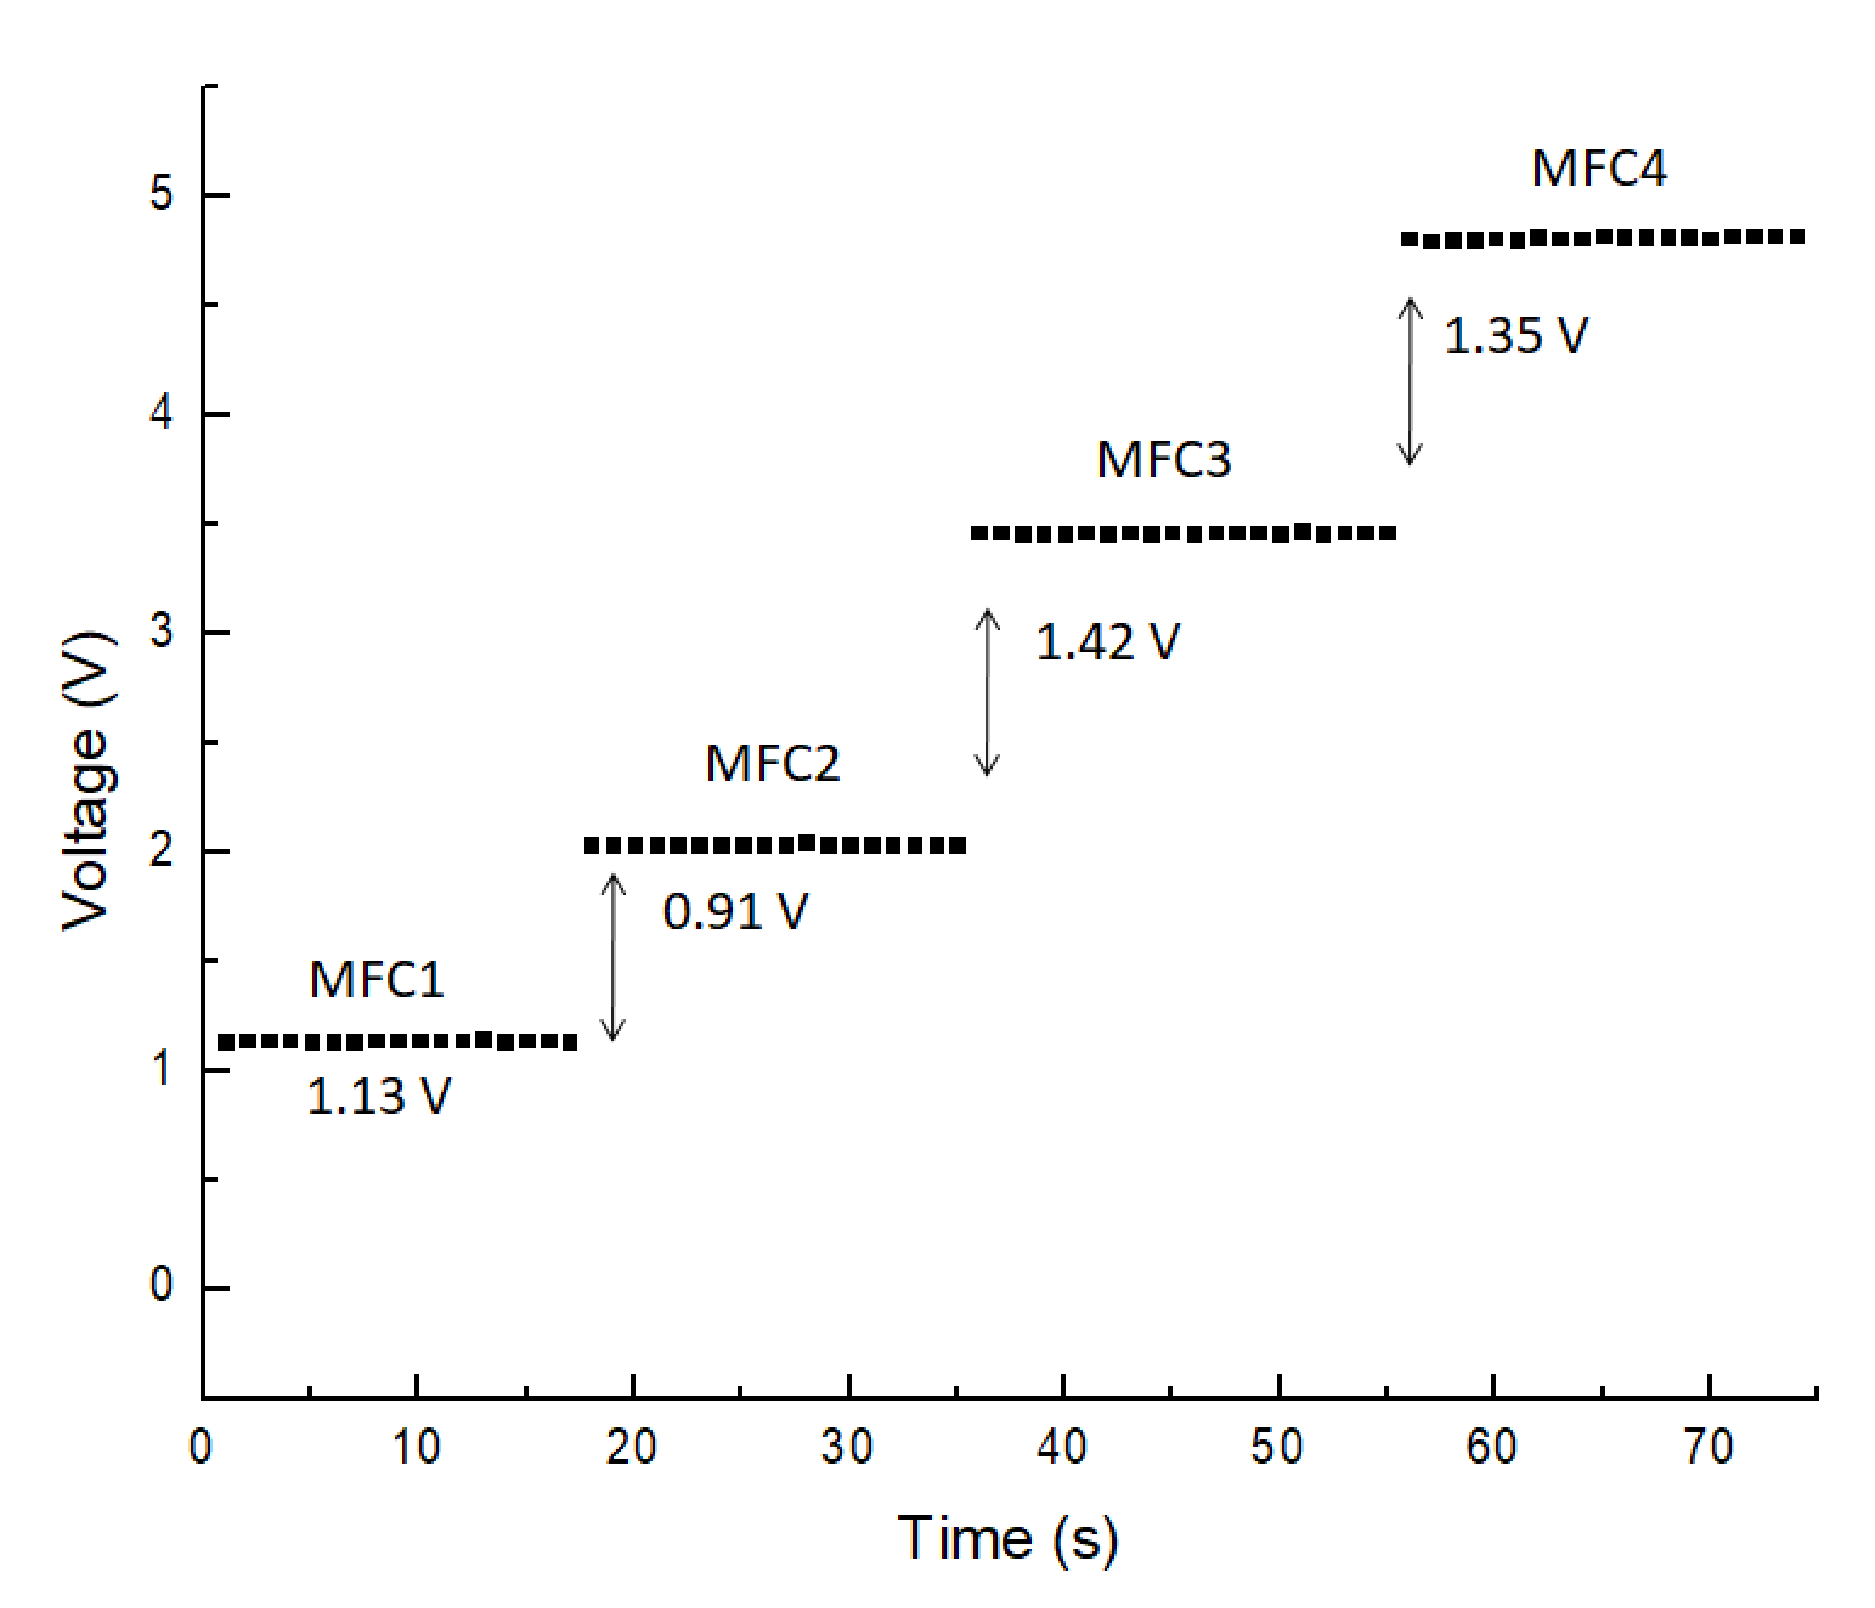
BERS is designed to collect energy from bacteria. Thus, in order to generate 0.14 mW, we used six MFCs. As can be seen at
Figure 4, the total power generated by MFC is not fully linear with the number of MFCs as each MFC can generate different amounts of energy. However, if we considered an average of 0.6 V per MFC, we can notice that the energy generated for an output resistor of 600 k
is 23
W per MFC unit where one MFC unit corresponds to one experimental jar.
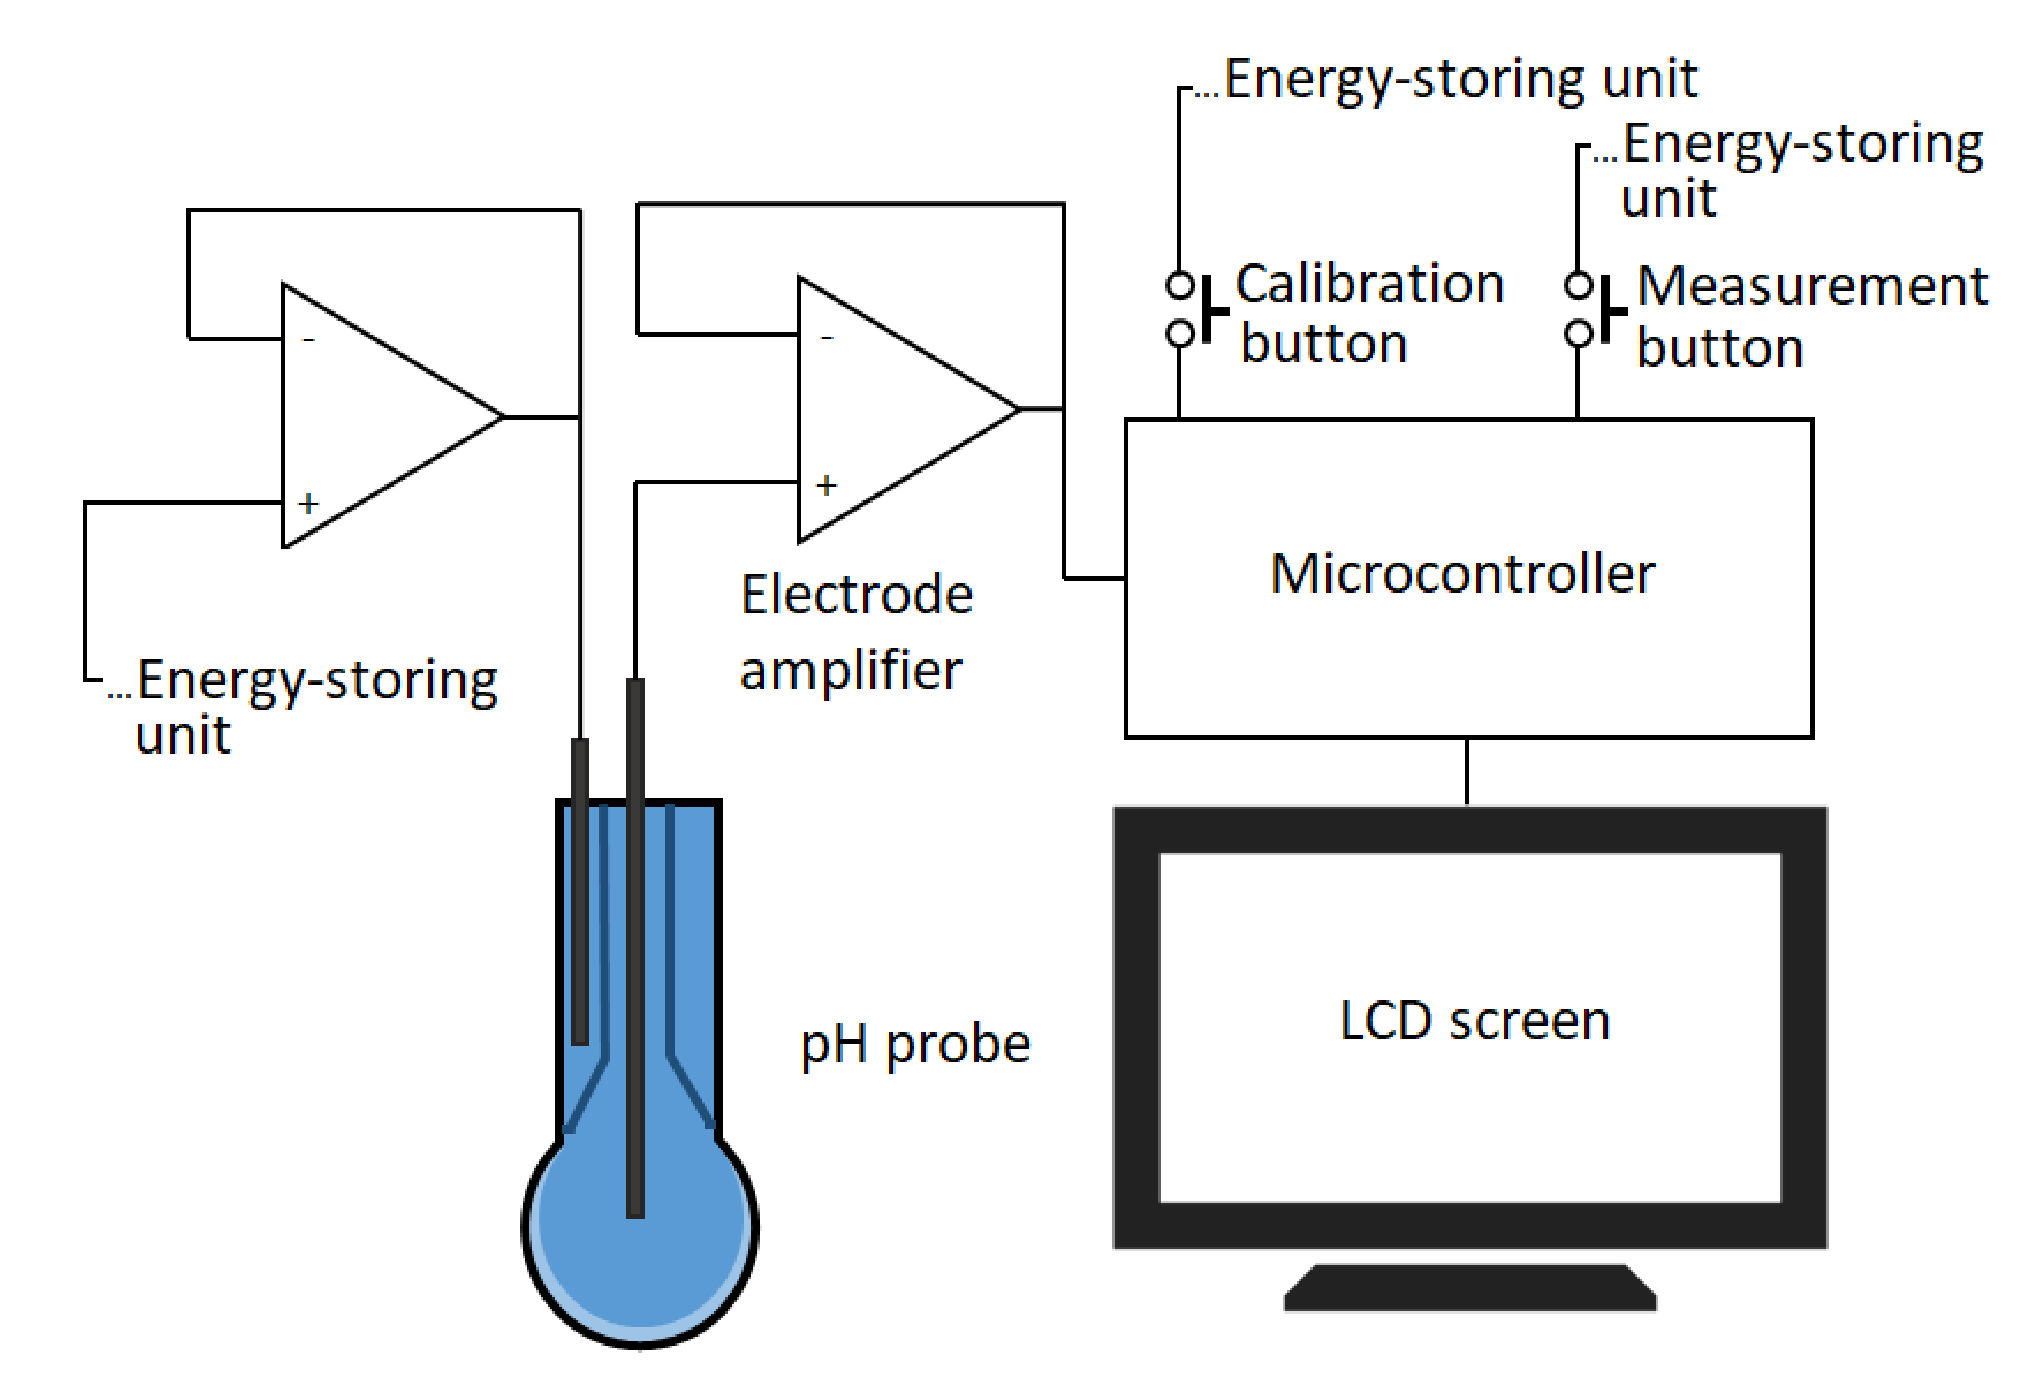
An ultra-low power pH sensor was designed using one electrode amplifier, one operational amplifier, a microcontroller and an LCD screen, as shown in
Figure 5. The current sensed by a pH probe is in the range of pA. A second amplifier was implemented to provide a constant reference voltage. The sensed signal was then sent to a 12-bit analog to digital converter (ADC) embedded in the microcontroller. The microcontroller was also used to calibrate the sensor using three pH buffers with a linear regression, then it converts the voltage into pH. Finally, it sends the pH value to an LCD screen through an SPI protocol.
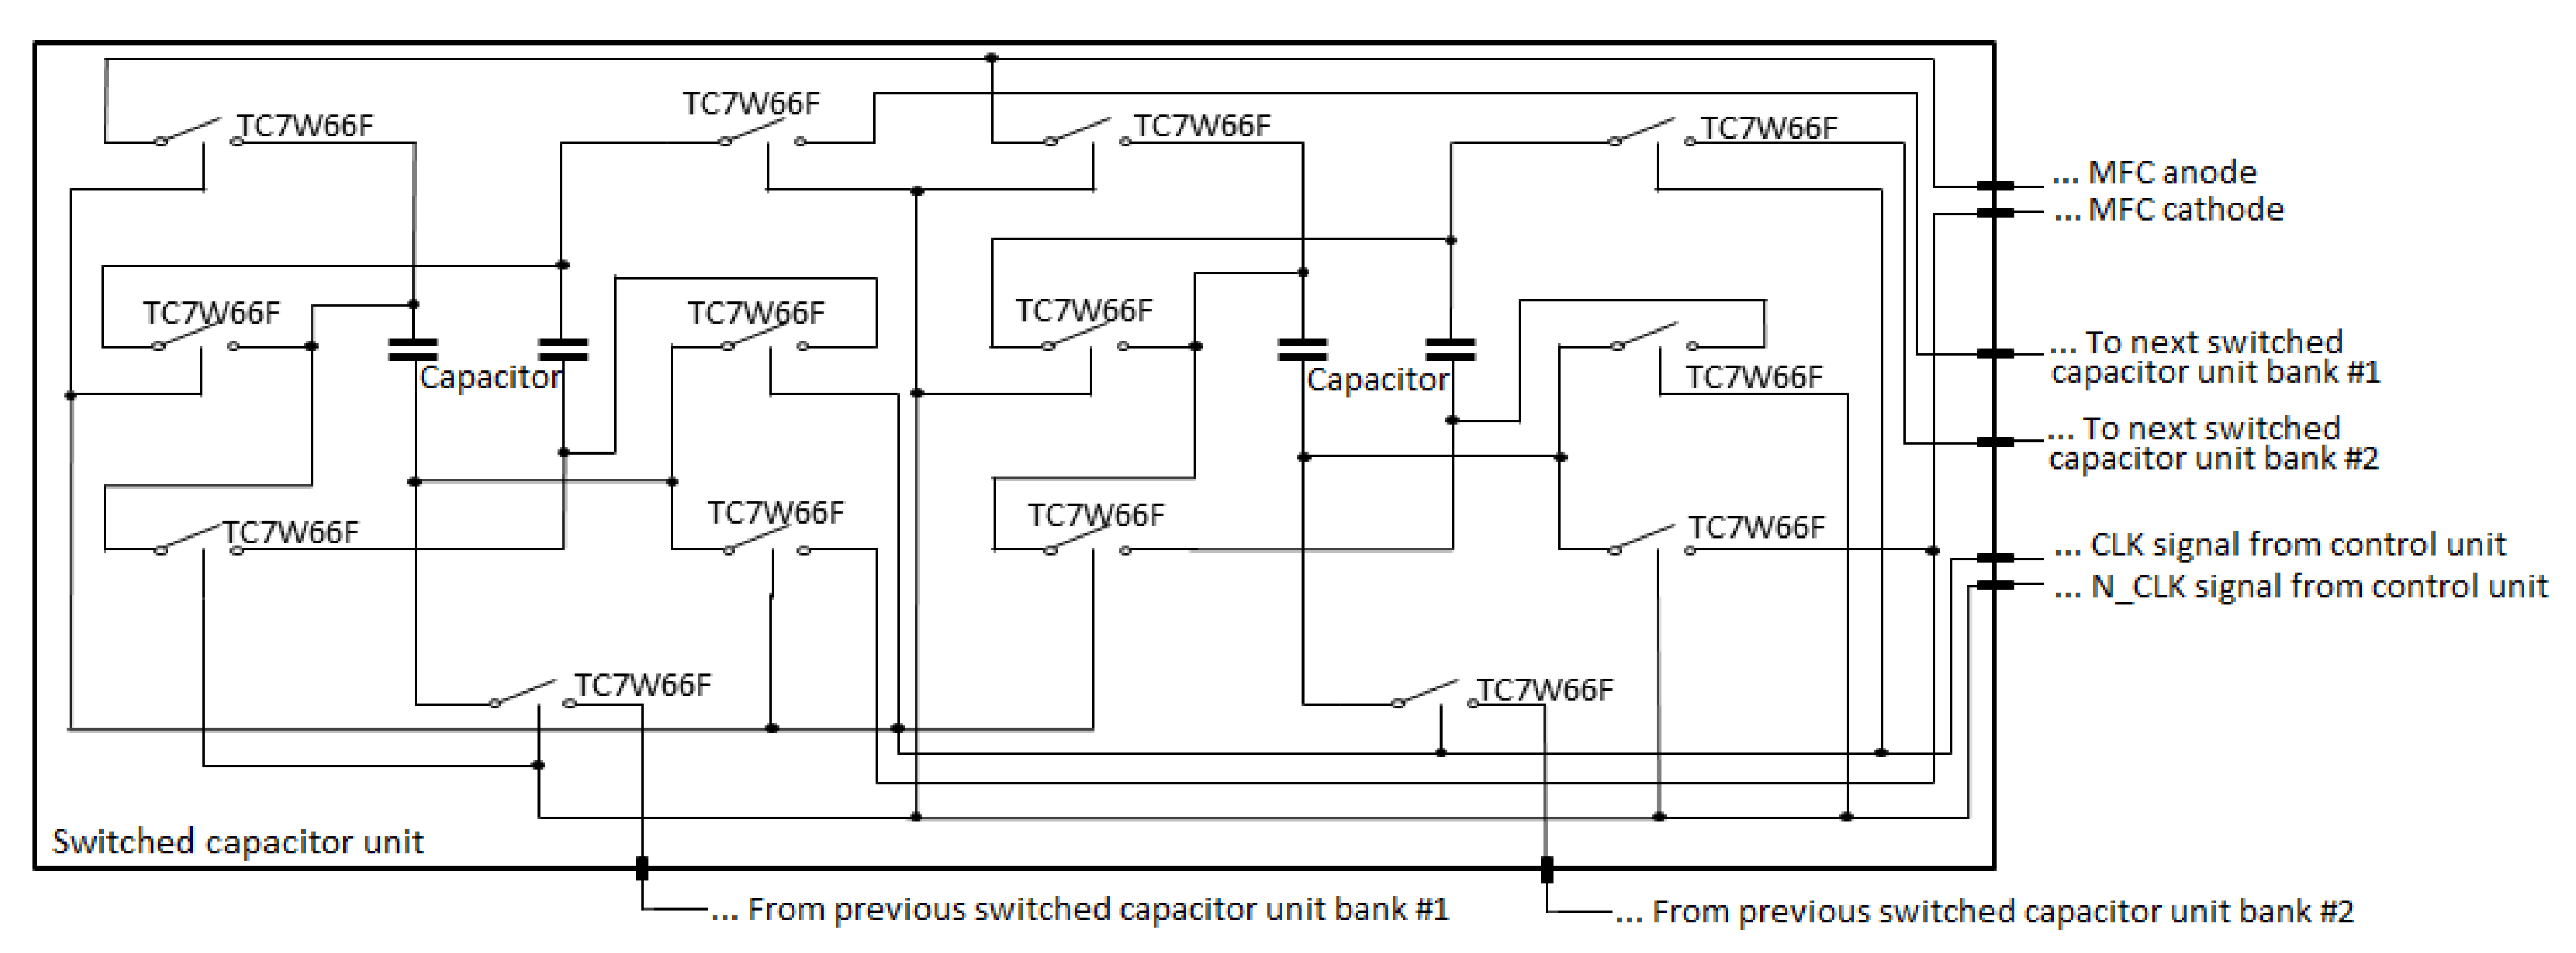
Figure 1 and
Figure 2 show a detailed description of the complete system. Seven switches (TC7W66F, Toshiba, Japan) and two capacitors were embedded in each switched capacitor unit. Variable pulsed width modulation signals with 50% duty cycle and variable frequency were used as control signals. In order to avoid malfunction when the two capacitor banks were shorted together, non-overlapping signals were chosen for the control signals for each bank. System clocks were generated by a STM32L100RC microcontroller (STMicroelectronic, France) in the control and measurement unit. The microcontroller was also used to measure the output voltages of each MFC via an eight on-board analog to digital converters. The TC7W66F switches must have a control voltage equal to their power supply voltage in order to minimize power consumption. Thus, the control signals from the microcontroller were amplified using a TLV2402 amplifier (Texas instrument, Dallas, TX. USA). Since the voltage produced by the switched capacitor unit is higher than the maximum voltage read by the analog-to-digital converter (3.3 V), a voltage divider was connected to a buffer (LMC6001, Texas instrument) to divide the voltage by four. The divided voltage was then multiplied in the user-interface by four to recover the original value. The voltage divider was made using two resistors: 1 M
and a 3 M
. A DC/DC converter (TPS62745, Texas instrument) was used to convert the voltage to 3.3 V. The energy-storing unit consisted of one 9 V and 1 F super-capacitor. The start-up unit requires seven TS5A3159 (Texas instrument) switches.
Table 1 shows the current consumption of each component. The control and measurement unit and the start-up unit consume between 10.8
A and 194.59
A. Each switched capacitor unit consumes 0.725
A. Finally, the pH sensor consumes between 313.14
A and 586.54
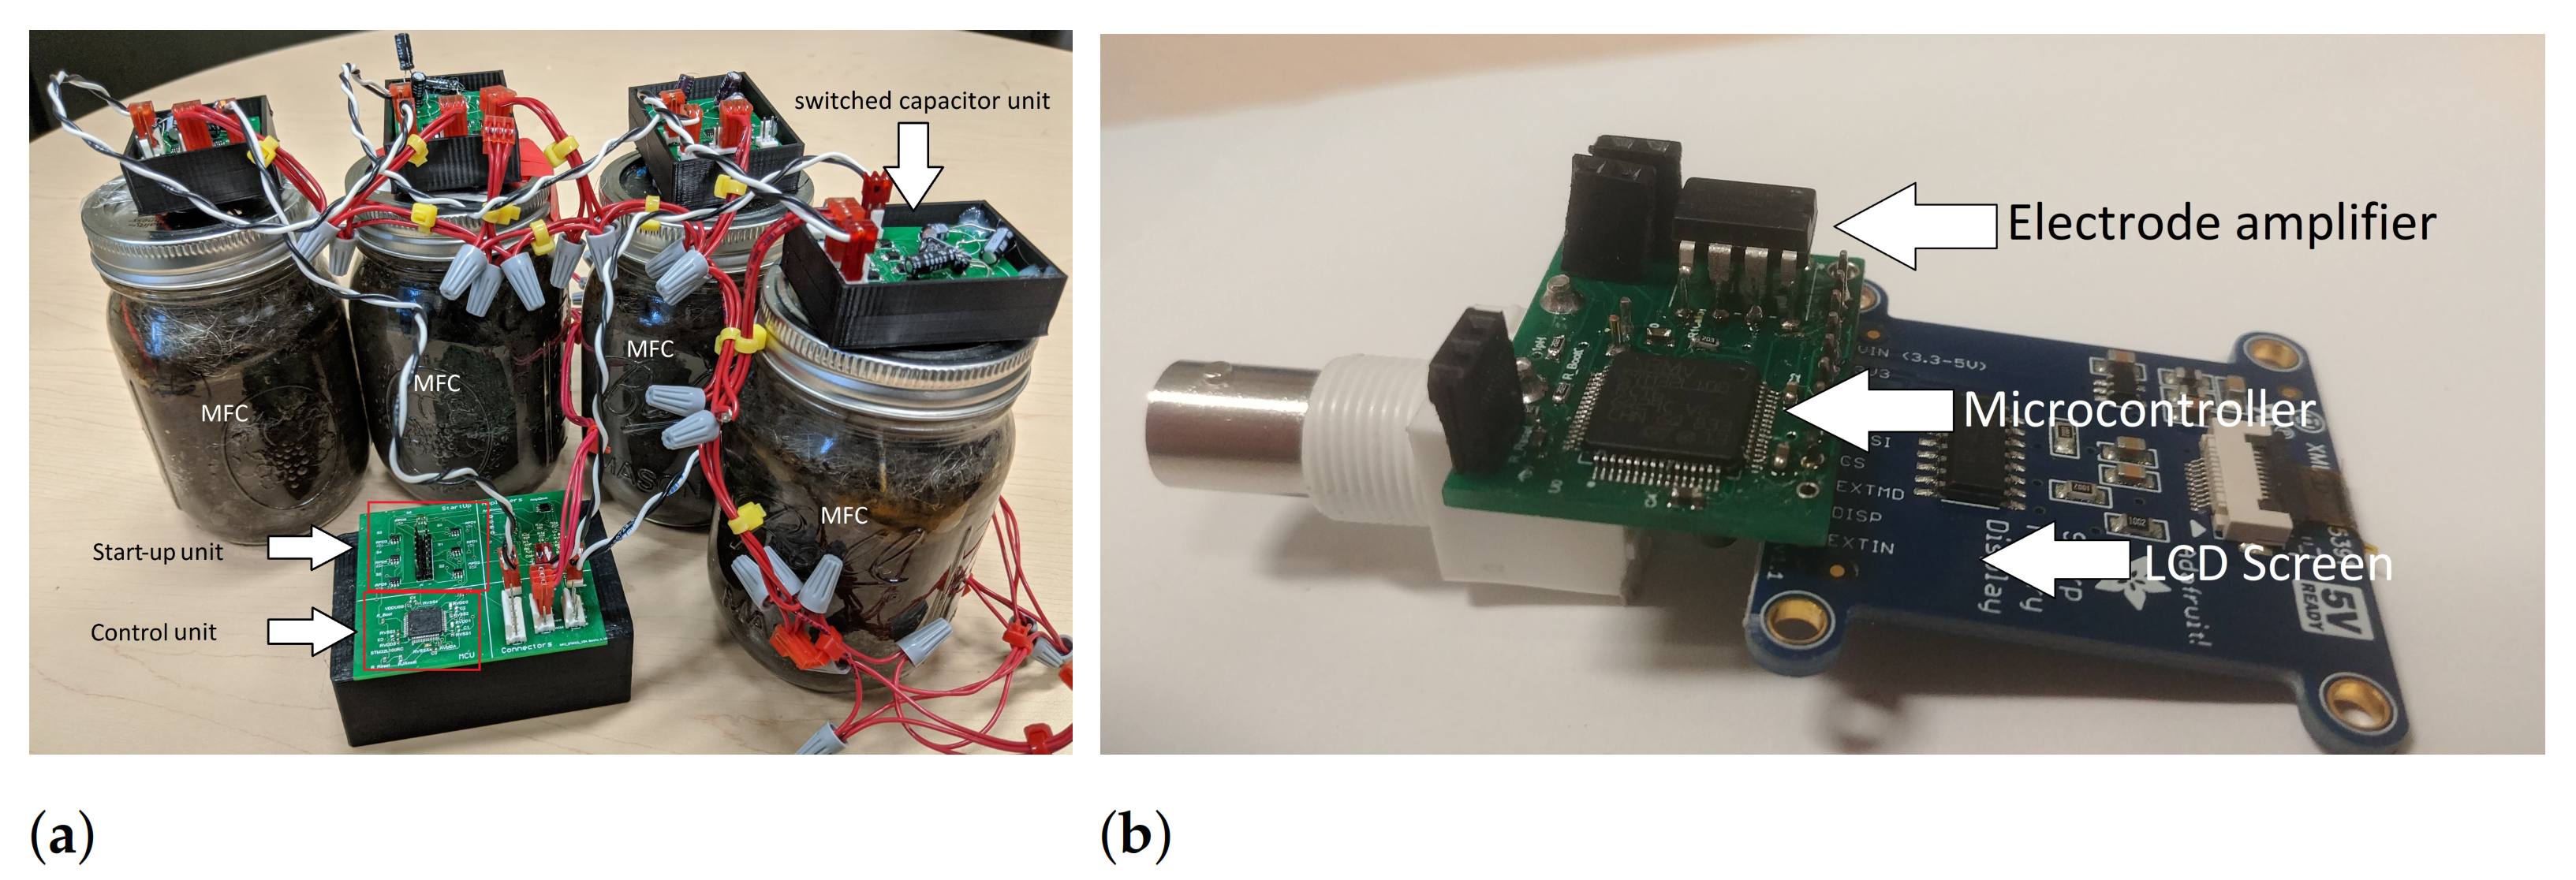
A. Images of the complete system are shown on
Figure 6a,b.
The power generated by BERS is 140 W. Then, to avoid draining too much power when not needed, a mechanical relay disconnected the sensors from BERS.
The duty cycle of the switched capacitor unit was calculated using Equation (
1):
where
R is an equivalent resistance to that of the MFC internal resistance, C is the capacitance of the capacitor in the capacitor bank, two is the number of capacitors per capacitor bank and six is the number of switched capacitor units in series. A typical
R value is 1.5 k
. A Matlab (MathWorks Inc, MA, USA) user interface sets the charging and discharging frequency and duty cycles of MFCs.
Each soil MFC was installed in a 400 mL glass bottle with an inner diameter of 6 cm and a height of 10 cm. The anode and cathode were built using a stainless steel wire wool (Merlin, United Kingdom). The anode weight was 3.5 g with total calculated surface area (Anode) of 225 cm
and the cathode weight was 8.5 g with total calculated surface area of 546 cm
as determined previously [
23]. Three holes were punched in the metal lid to allow electrically insulated wires from the anode and cathode to feed through to the exterior, where they were connected to an external resistor or other electrical measurement hardware.
The soil used in the soil MFCs was obtained from mud pools near a construction site (GPS coordinates: latitude = 46.78095283633 (decimal degrees), longitude = −71.27642004697 (decimal degrees), and altitude = 72 m). As the energy recovery system was of interest, not overall power outputs, no soil pretreatment or nutrients were added. Water content was measured by first measuring the mass of the fully hydrated soil sample (by adding deionized water and pouring out the run-off through the jar opening with the use of an intervening paper filter to keep the soil in place). Then, the soil sample was dried and re-measured. This produced a water-to-soil ratio of 65.2 percent. The MFC mass was measured once per week, and water was added to compensate for evaporation. A moderately alkaline pH was measured (7.93) at the beginning of the experiment for all soil MFCs.
3. Results and Discussion
Table 2 shows the individual voltage and the maximum power of each used MFCs after reaching stable outputs.
Figure 4 shows the cumulative open circuit voltage produced by the BERS after connecting MFCs one by one. Each added MFC results in a linear increase in the recorded value as seen from
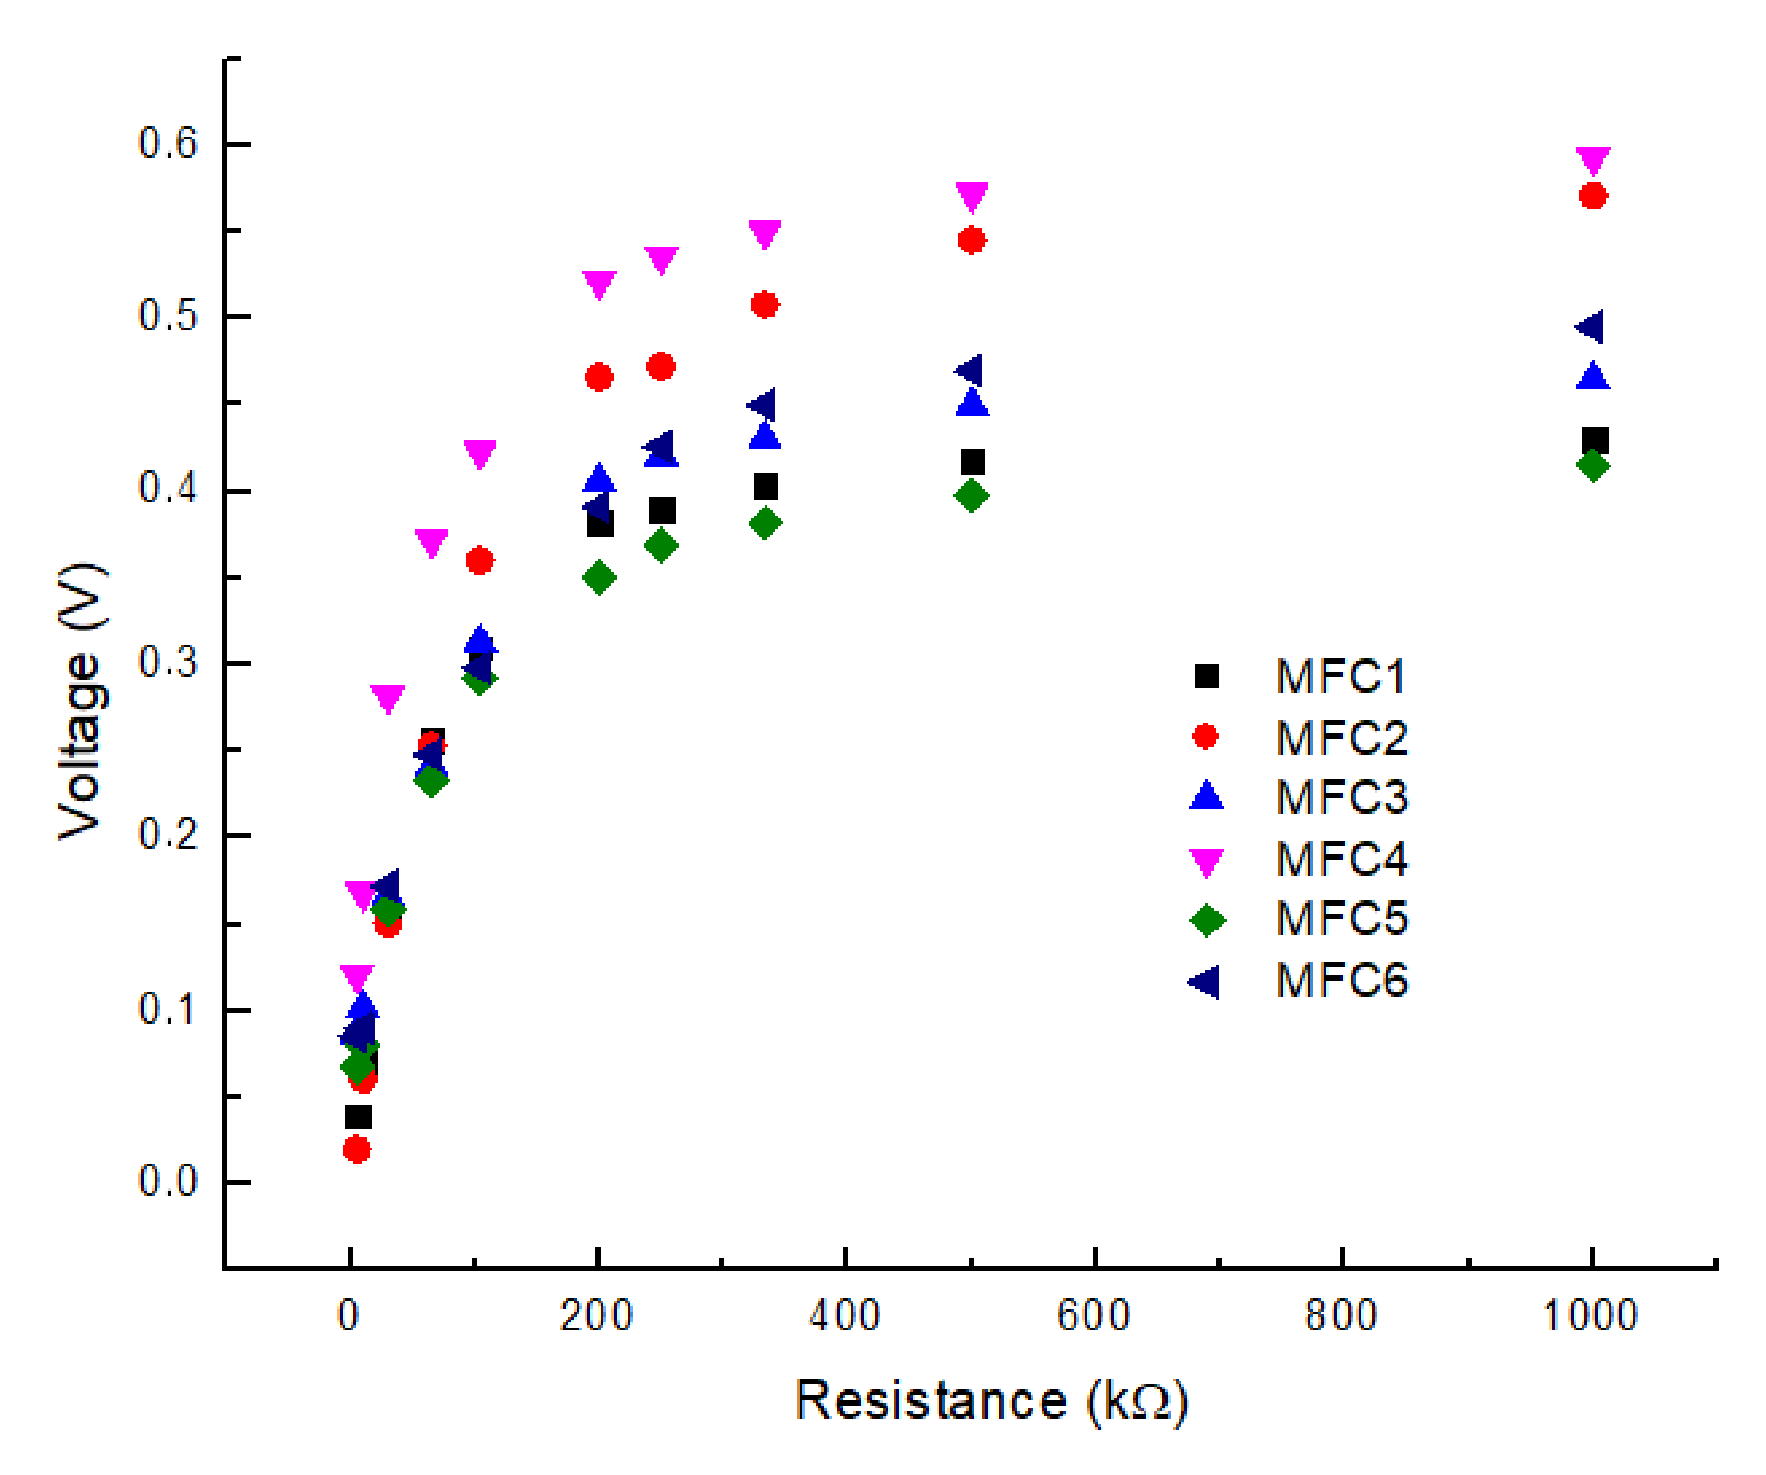
Table 2. While powering the BERS, the voltage of six MFCs was individually measured on
Figure 7 with various resistance values.
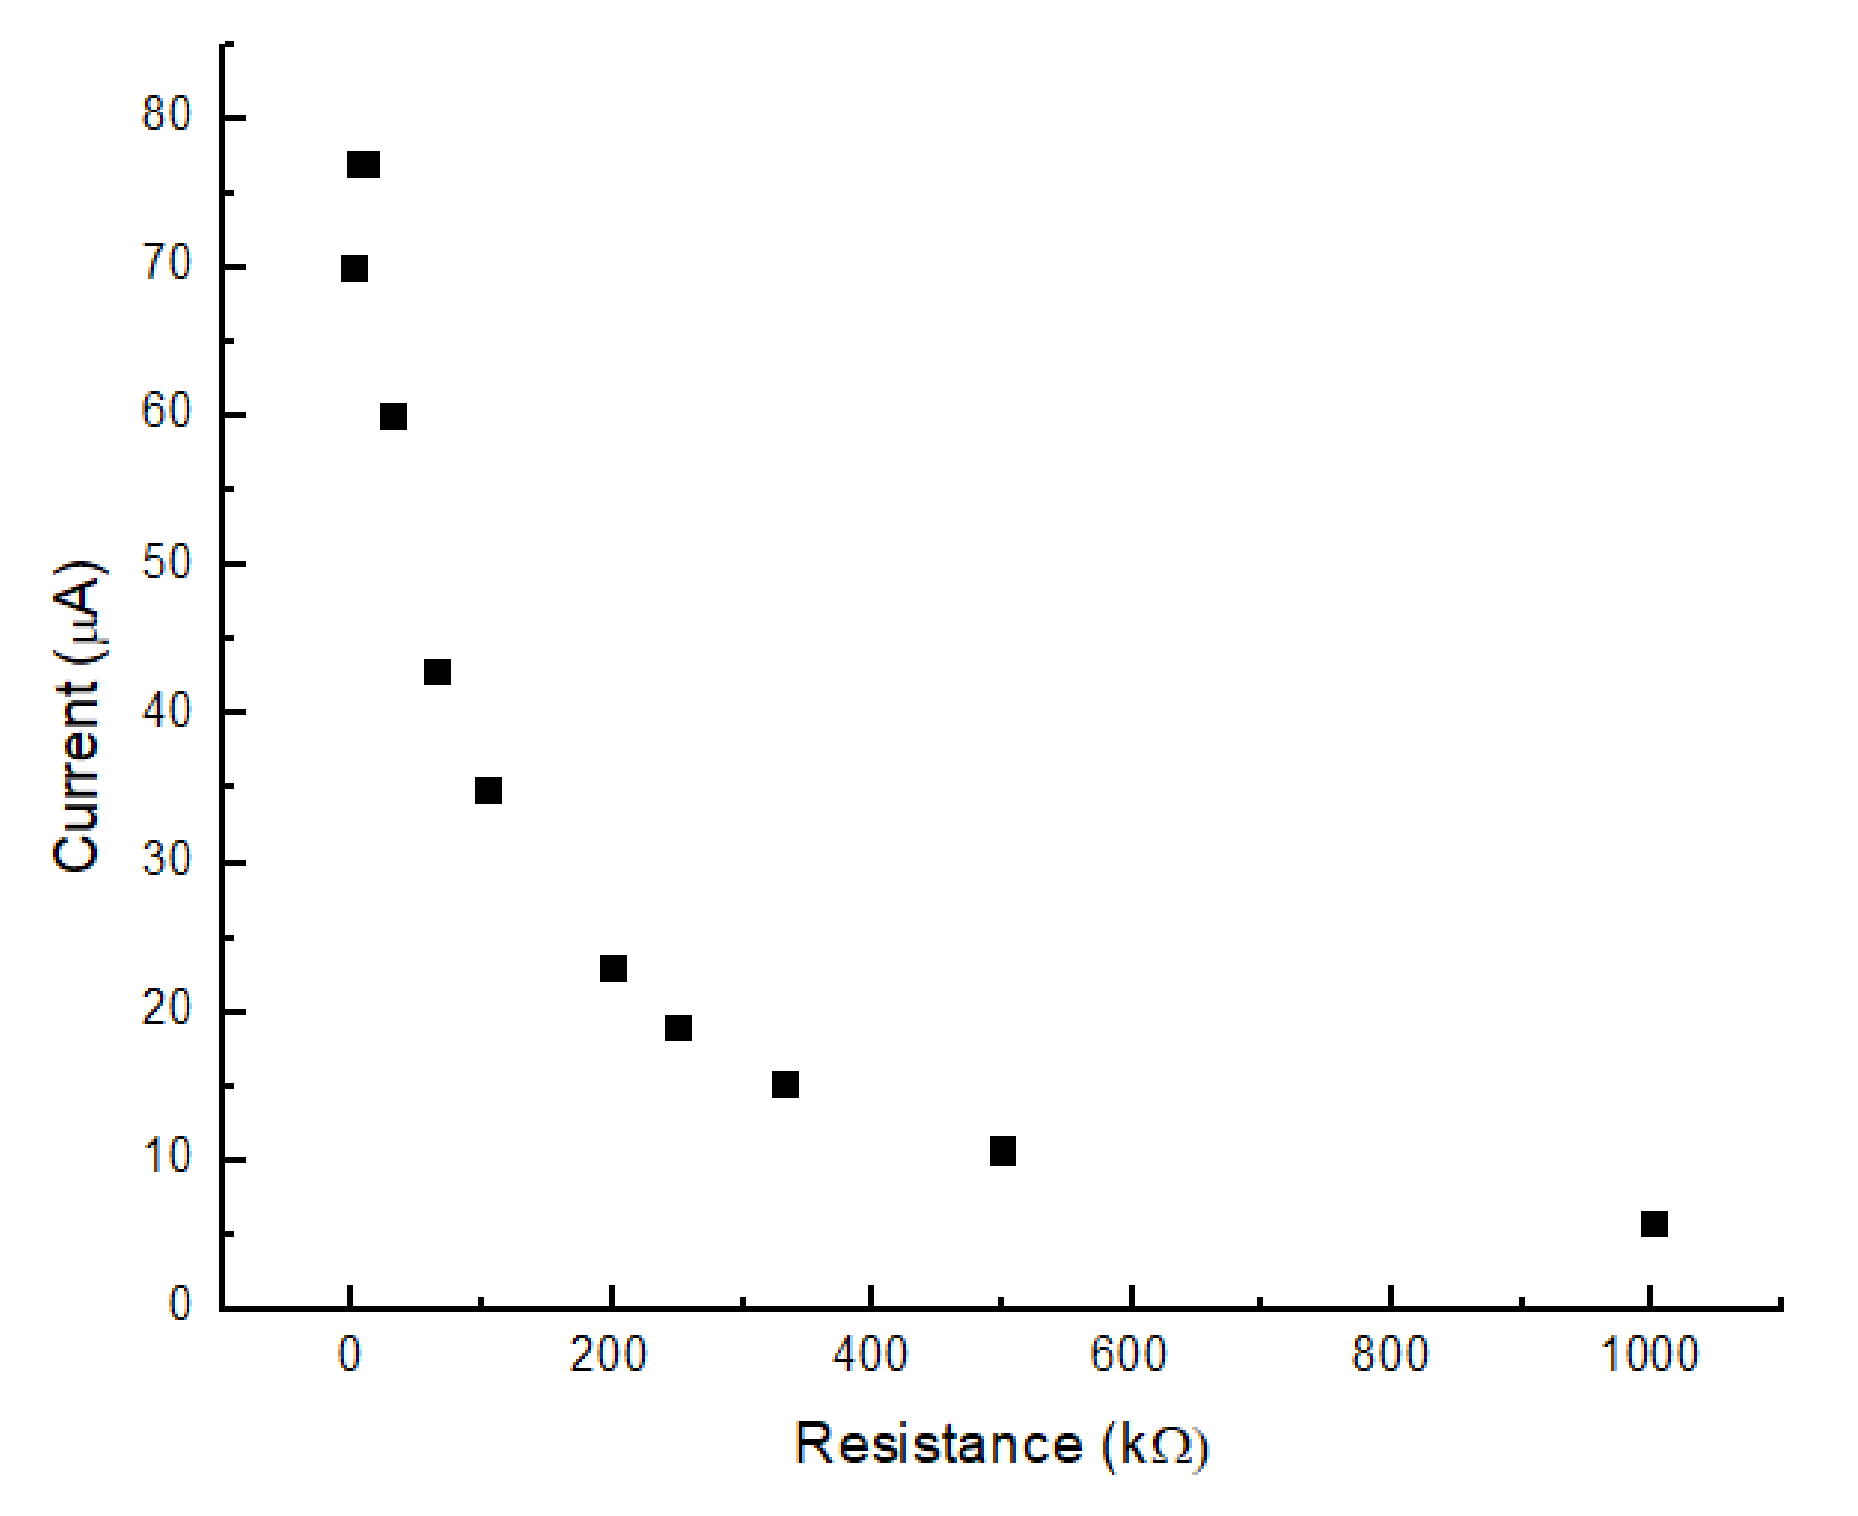
Figure 8 shows the BERS total current output measured with the same resistance values as in
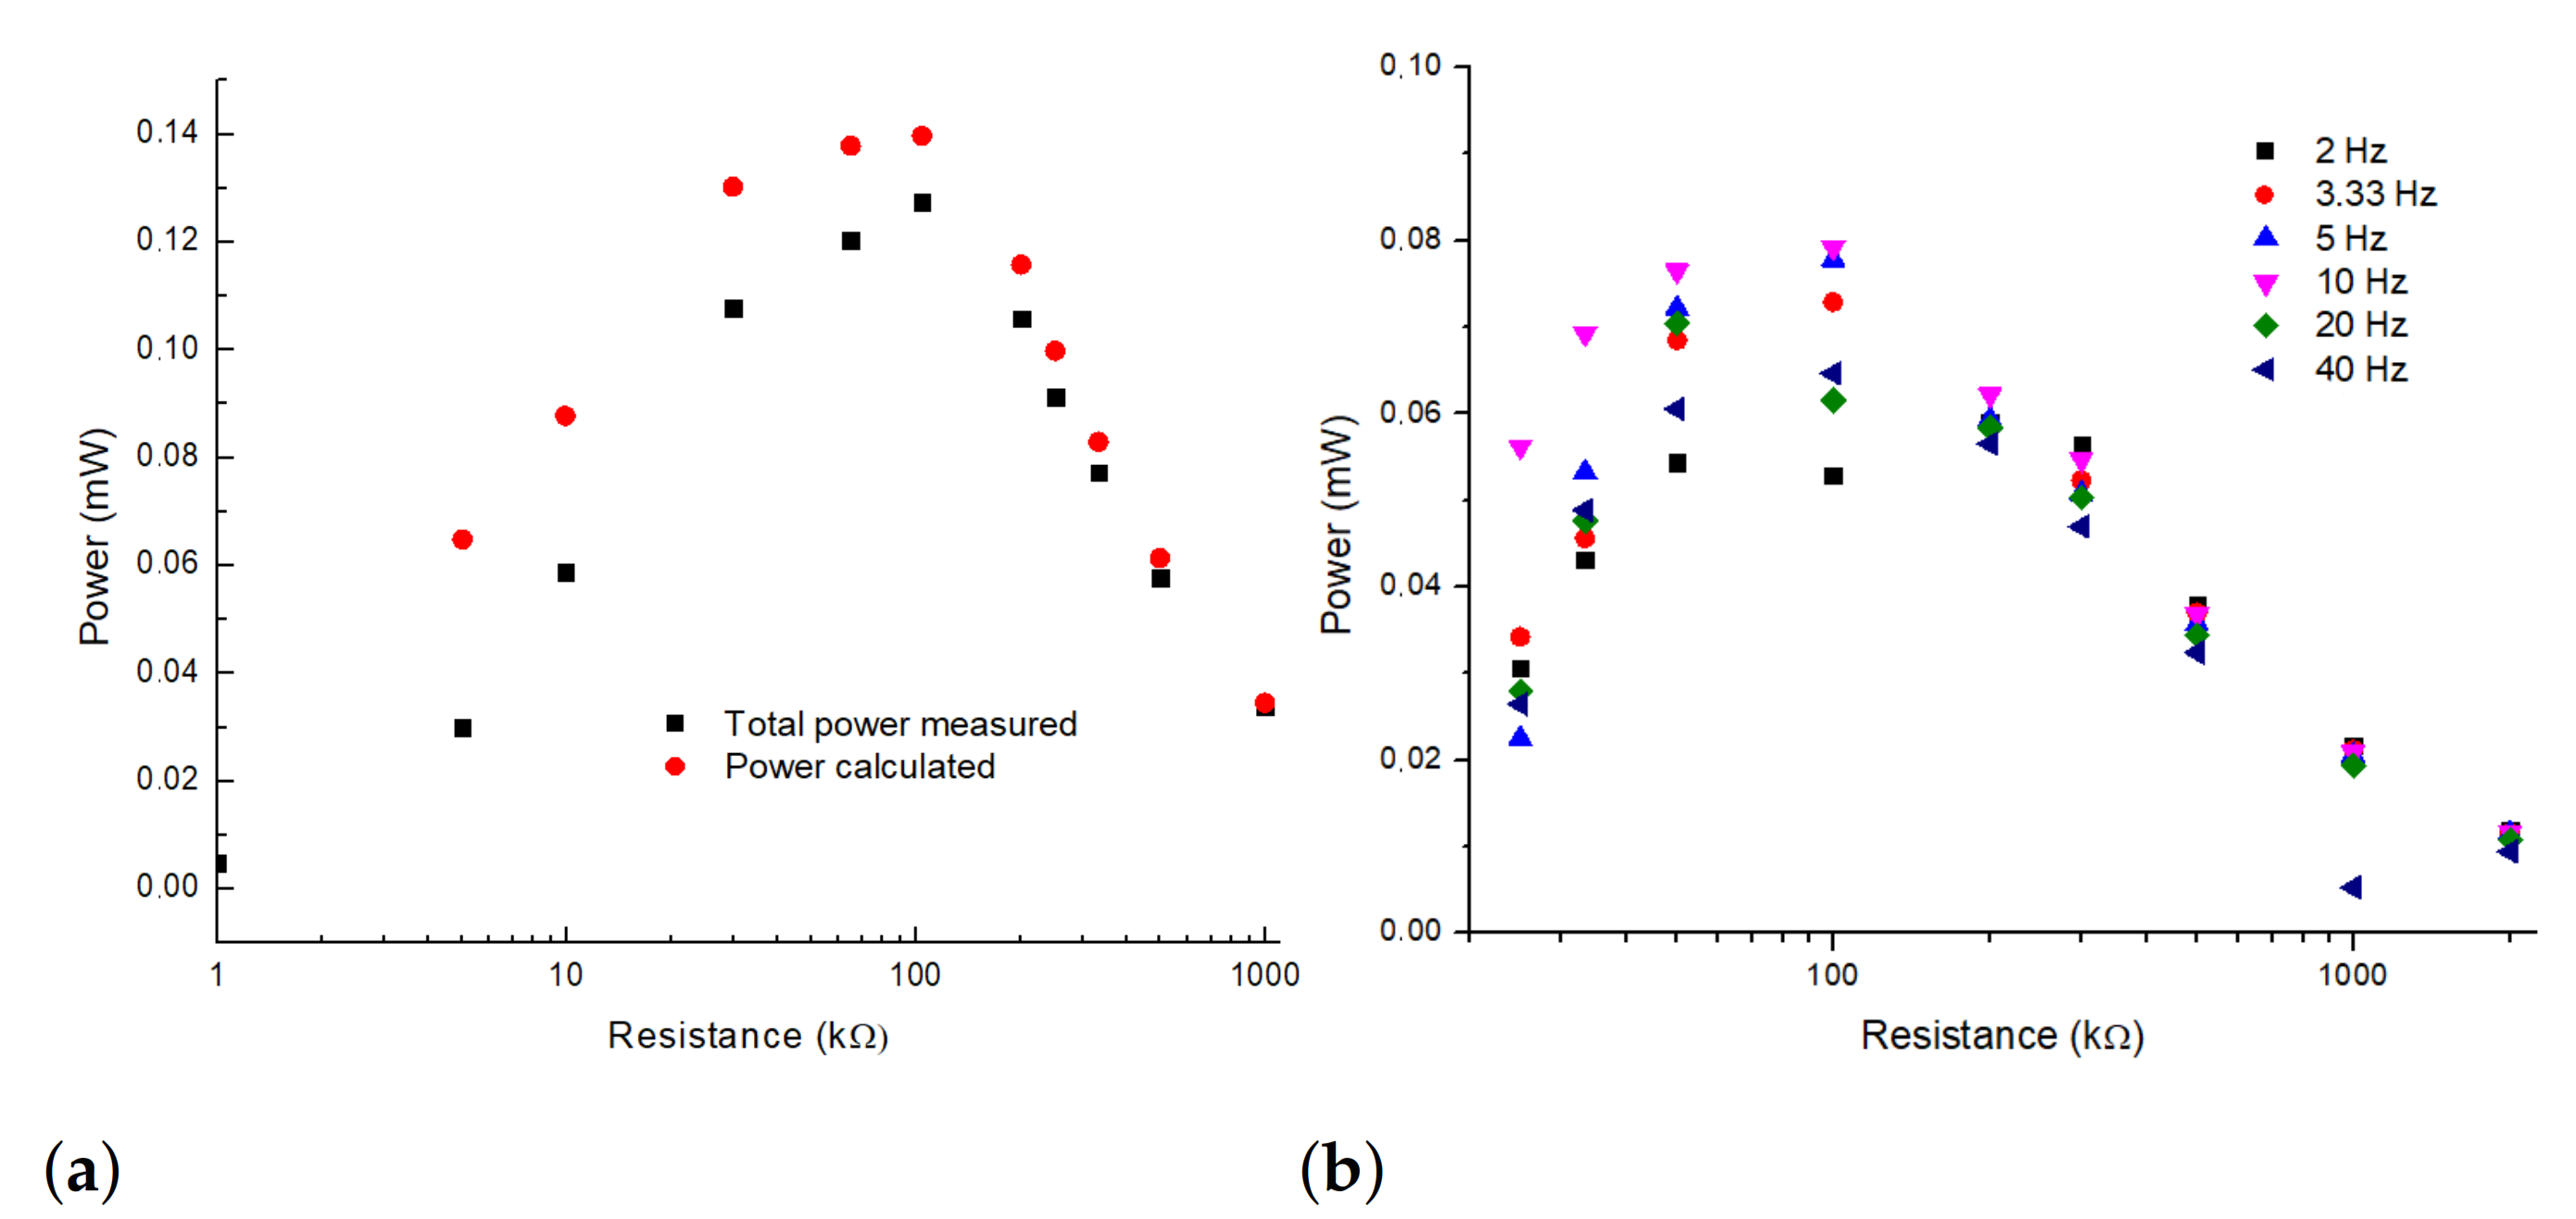
Figure 7. The generated electric power for each MFC and the complete system was measured before being converted to 3.3 V on
Figure 9a. We observed that the power peak of 0.14 mW was reached with an external resistor value of 100 k
and at capacitor switching frequencies of 10 Hz (
Figure 9b). Until now, the idea of power management systems has largely been applied to traditional high-performance liquid-based MFCs [
24]. Recently, the concept was successfully applied to soil MFCs using a voltage booster to charge a battery stack which was then discharged through a second booster and a constant current source. The result was a power increase of 1.9 times per added soil MFC [
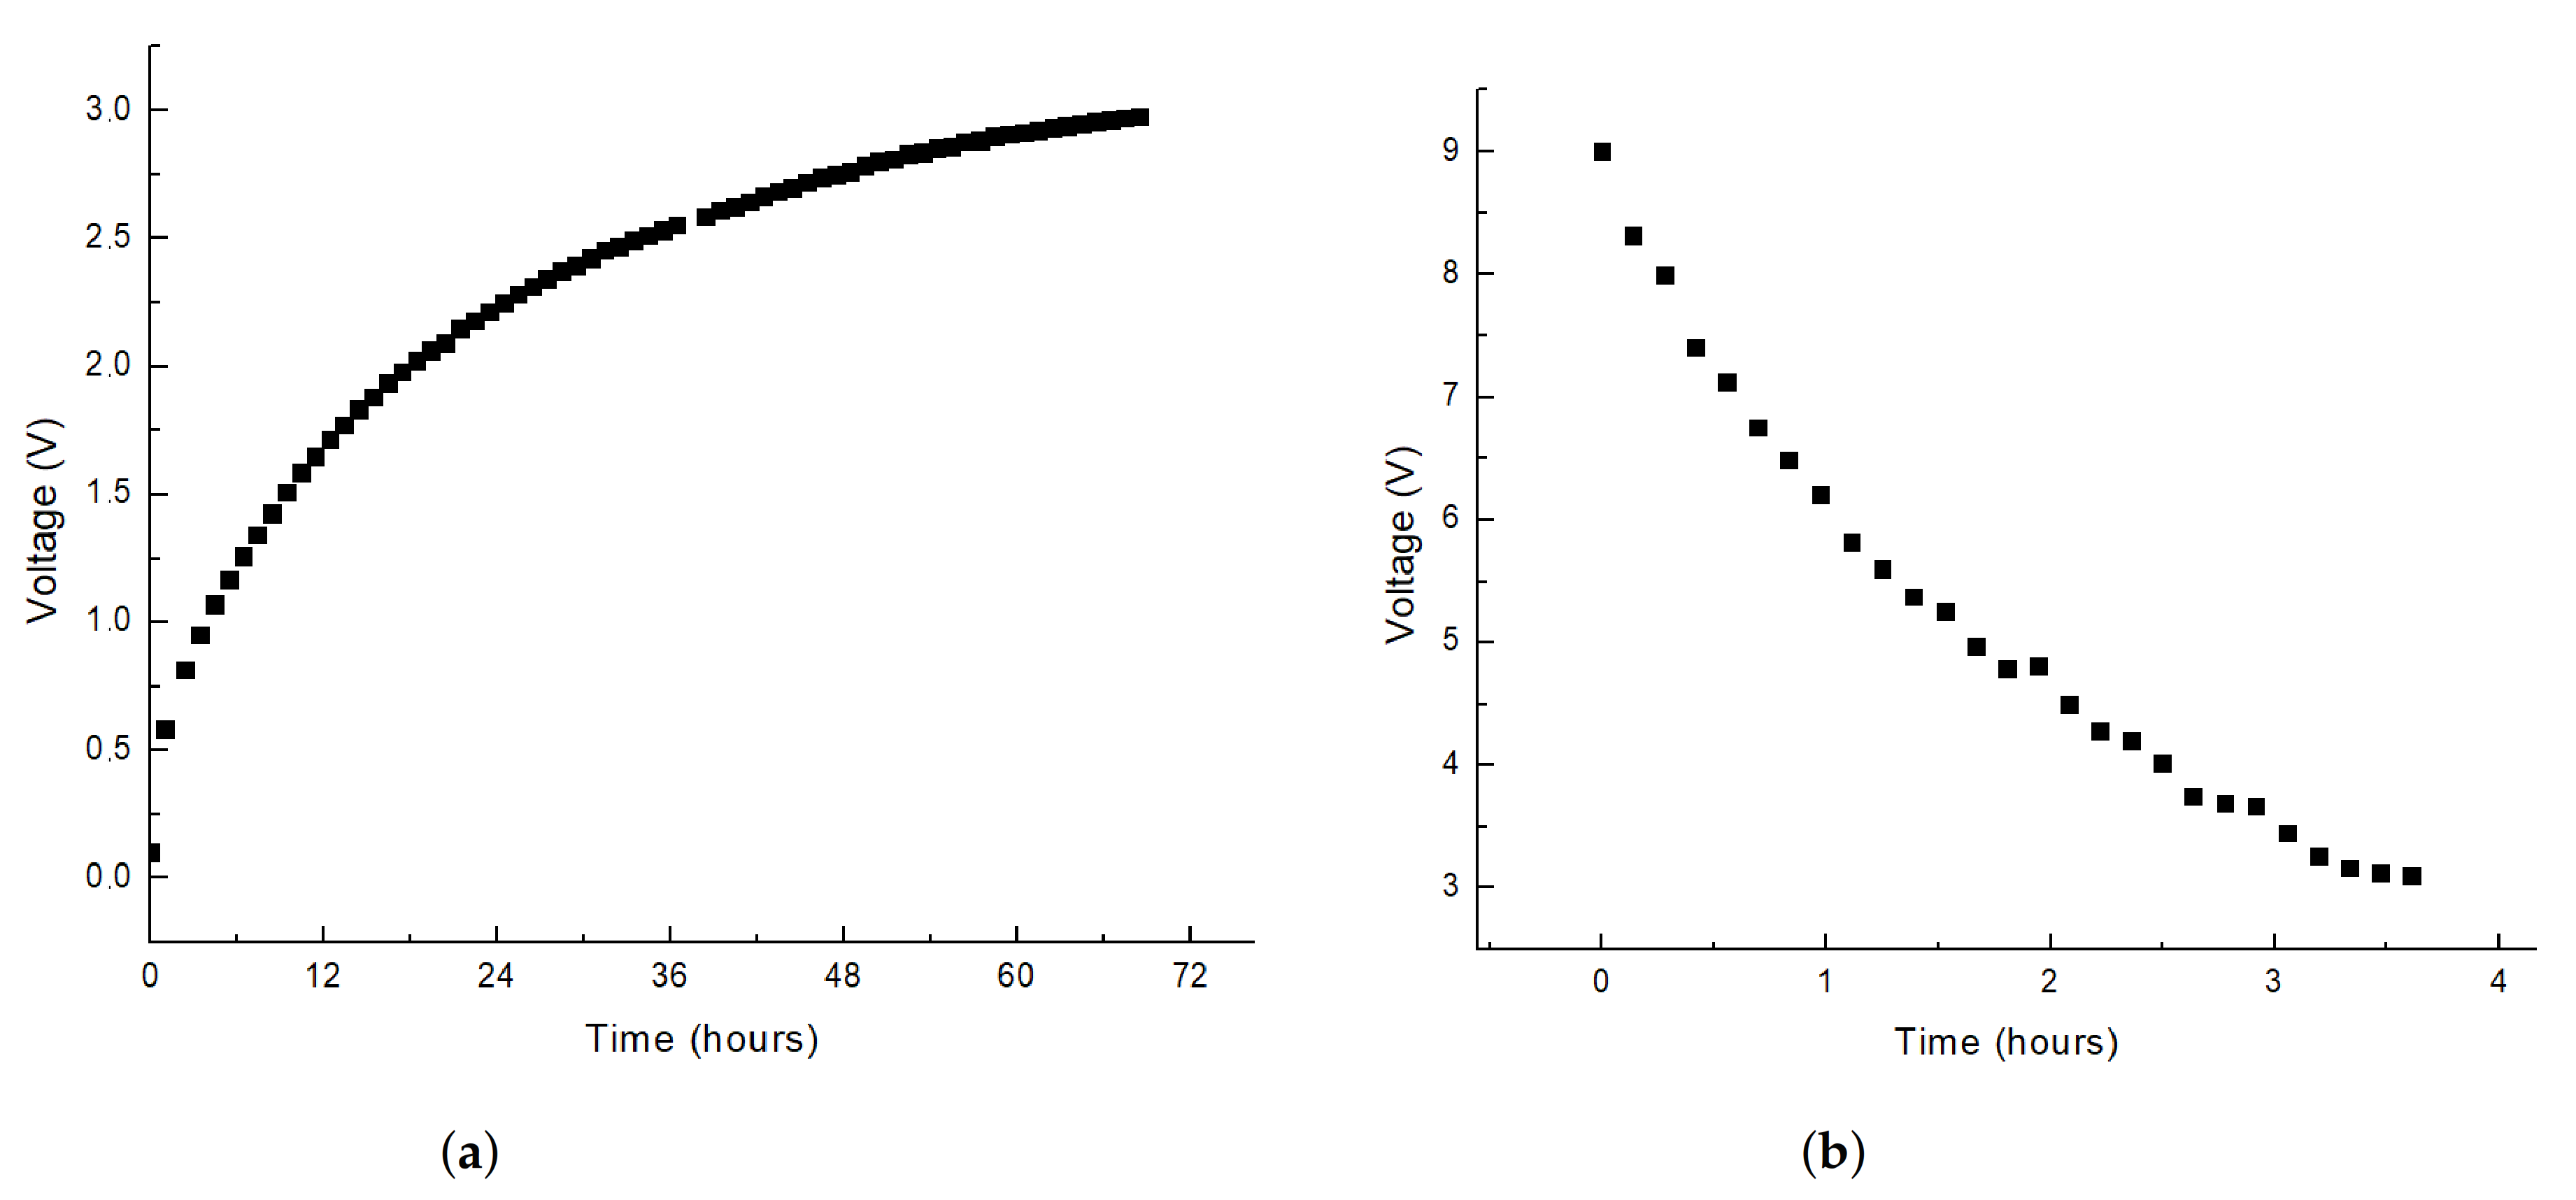
25]. In the present study, in which a dual storage system was used for each MFC/discharge system in our BERS system, we obtained a similar multiplication factor (1.7 per added soil MFC), which had the benefit of using a dual stage energy storage approach that avoided any peaks in our current outputs without using any secondary current conditioner unit. In addition, the ability to tune storage switching frequency could enable further improve optimization as the individual MFC outputs changed before and after reaching maturity. Finally, it takes 3 days to power up the BERS using seven serial MFC connected as shown in
Figure 10a. After this time, the system operated consistently during the experimental procedures, which generally lasted 1 month. Though not specifically monitored, the system stability was expected to last for the same time-scale as that of the individual soil MFCs, which was months for our soil MFC experiments, (data not shown), which is similar to the time-scale of other soil MFC studies [
26]. These results correspond to a laboratory setting with a constant temperature (25
C). However, it should be noted that with the targeted application of remote power sources for the far North, temperatures will be lower, notwithstanding global warming which is under way and most strongly observed in the North. We direct the reader to a recent article in which a full assessment of the role of temperature on the power output of individual MFCs used in this study. In this study, power linearly varied with temperature with a slope of almost 0.4
W·K
, though rapid variations in temperature could result in significant integrated power enhancements over time [
23,
26].
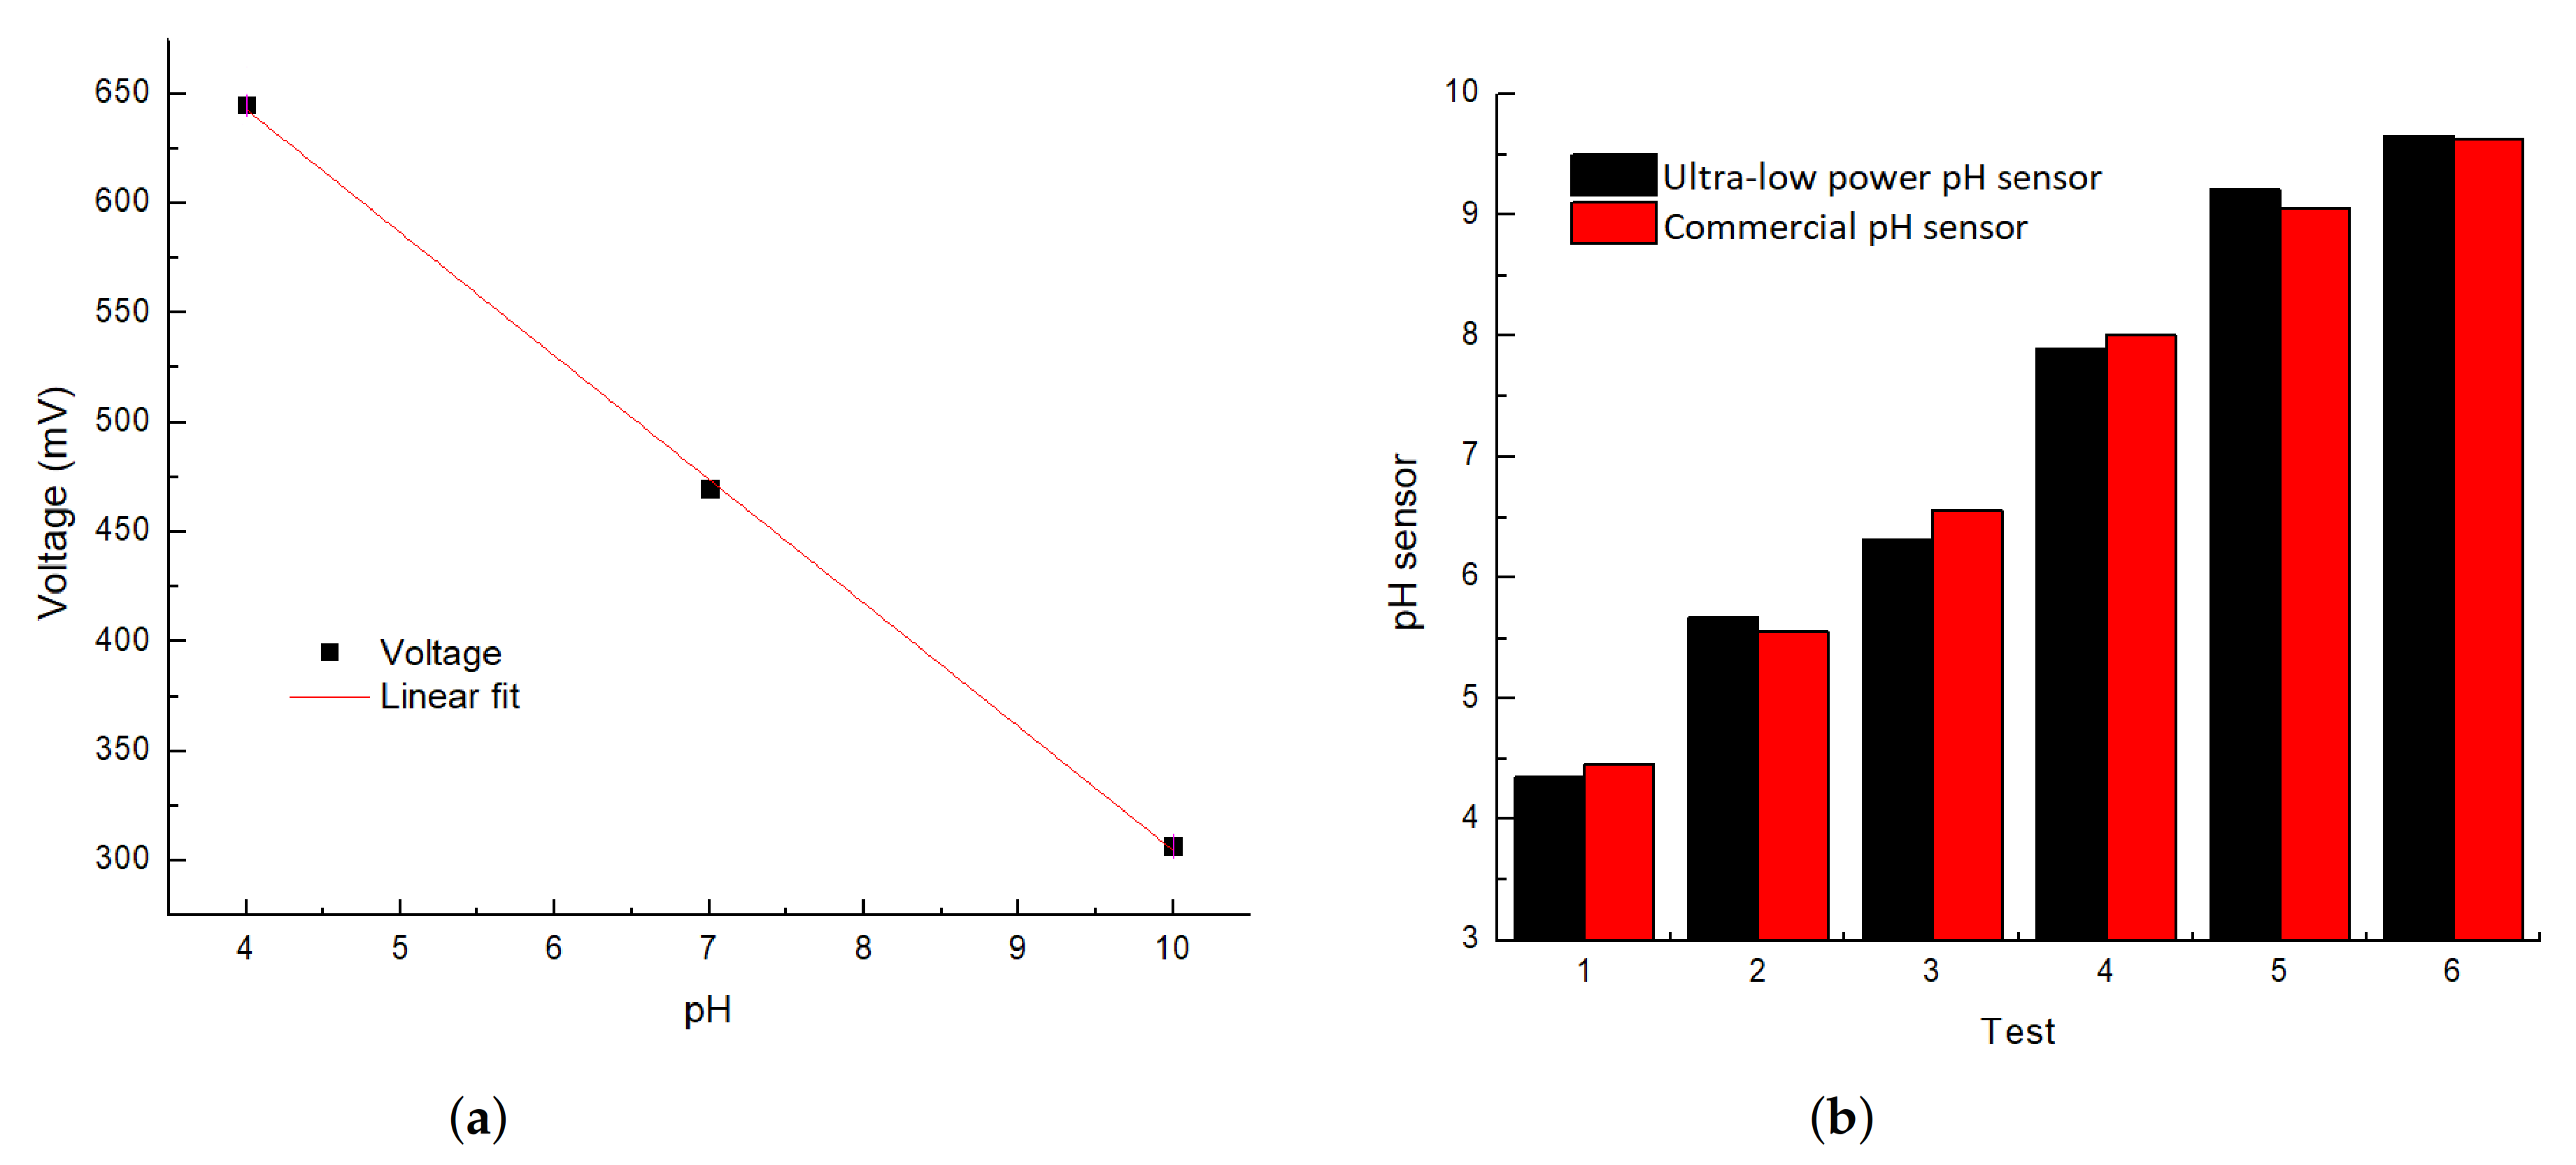
Figure 11b presents the performance of the custom pH sensor versus a commercial one at 25
C. The pH sensor was running for several minutes and continuously monitoring the pH of the same solution. We observed a fluctuation of 0.01. Thus, we mainly considered only one decimal for data reliability. The error margin was below 5%. Furthermore,
Figure 11a shows that the voltage (E) versus pH (
]) has a linear shape, as expected from the Nernst equation:
which is equivalent to:
where
Y is the voltage,
is
,
X is
and
is the reference voltage. The calculated coefficient
at room temperature was 57 mV/pH. The
obtained using our pH sensor at room temperature was 56.33 mV/pH, which is coherent with the calculated one. The graph reported in
Figure 11a is needed for calibration purposes. The sensor only detects voltage, which needs to be converted to pH. We used pH reference solutions (4, 7 and 10) for a linear fit, as shown at
Figure 11a. The BERS can continuously power the pH sensor without discharging the energy-storing unit. If the pH sensor is used remotely, it can be continuously used for up to 4 h (
Figure 11b).
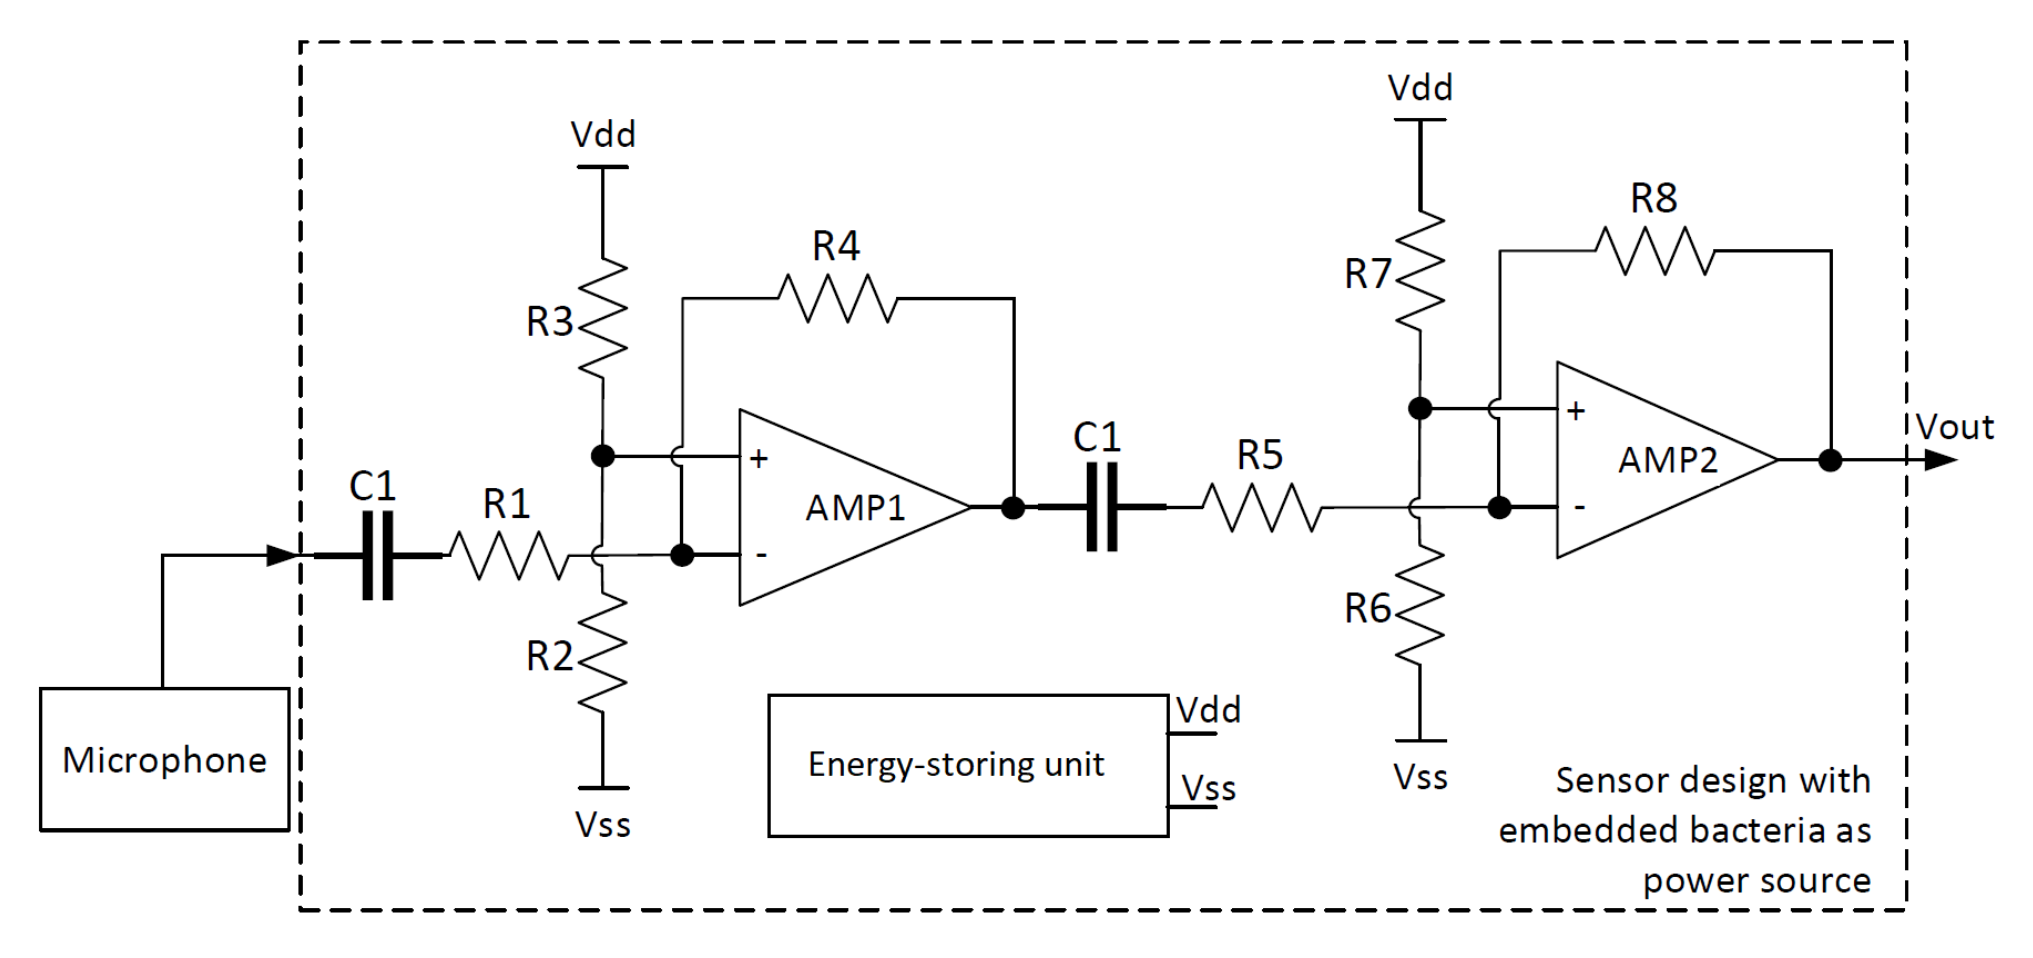
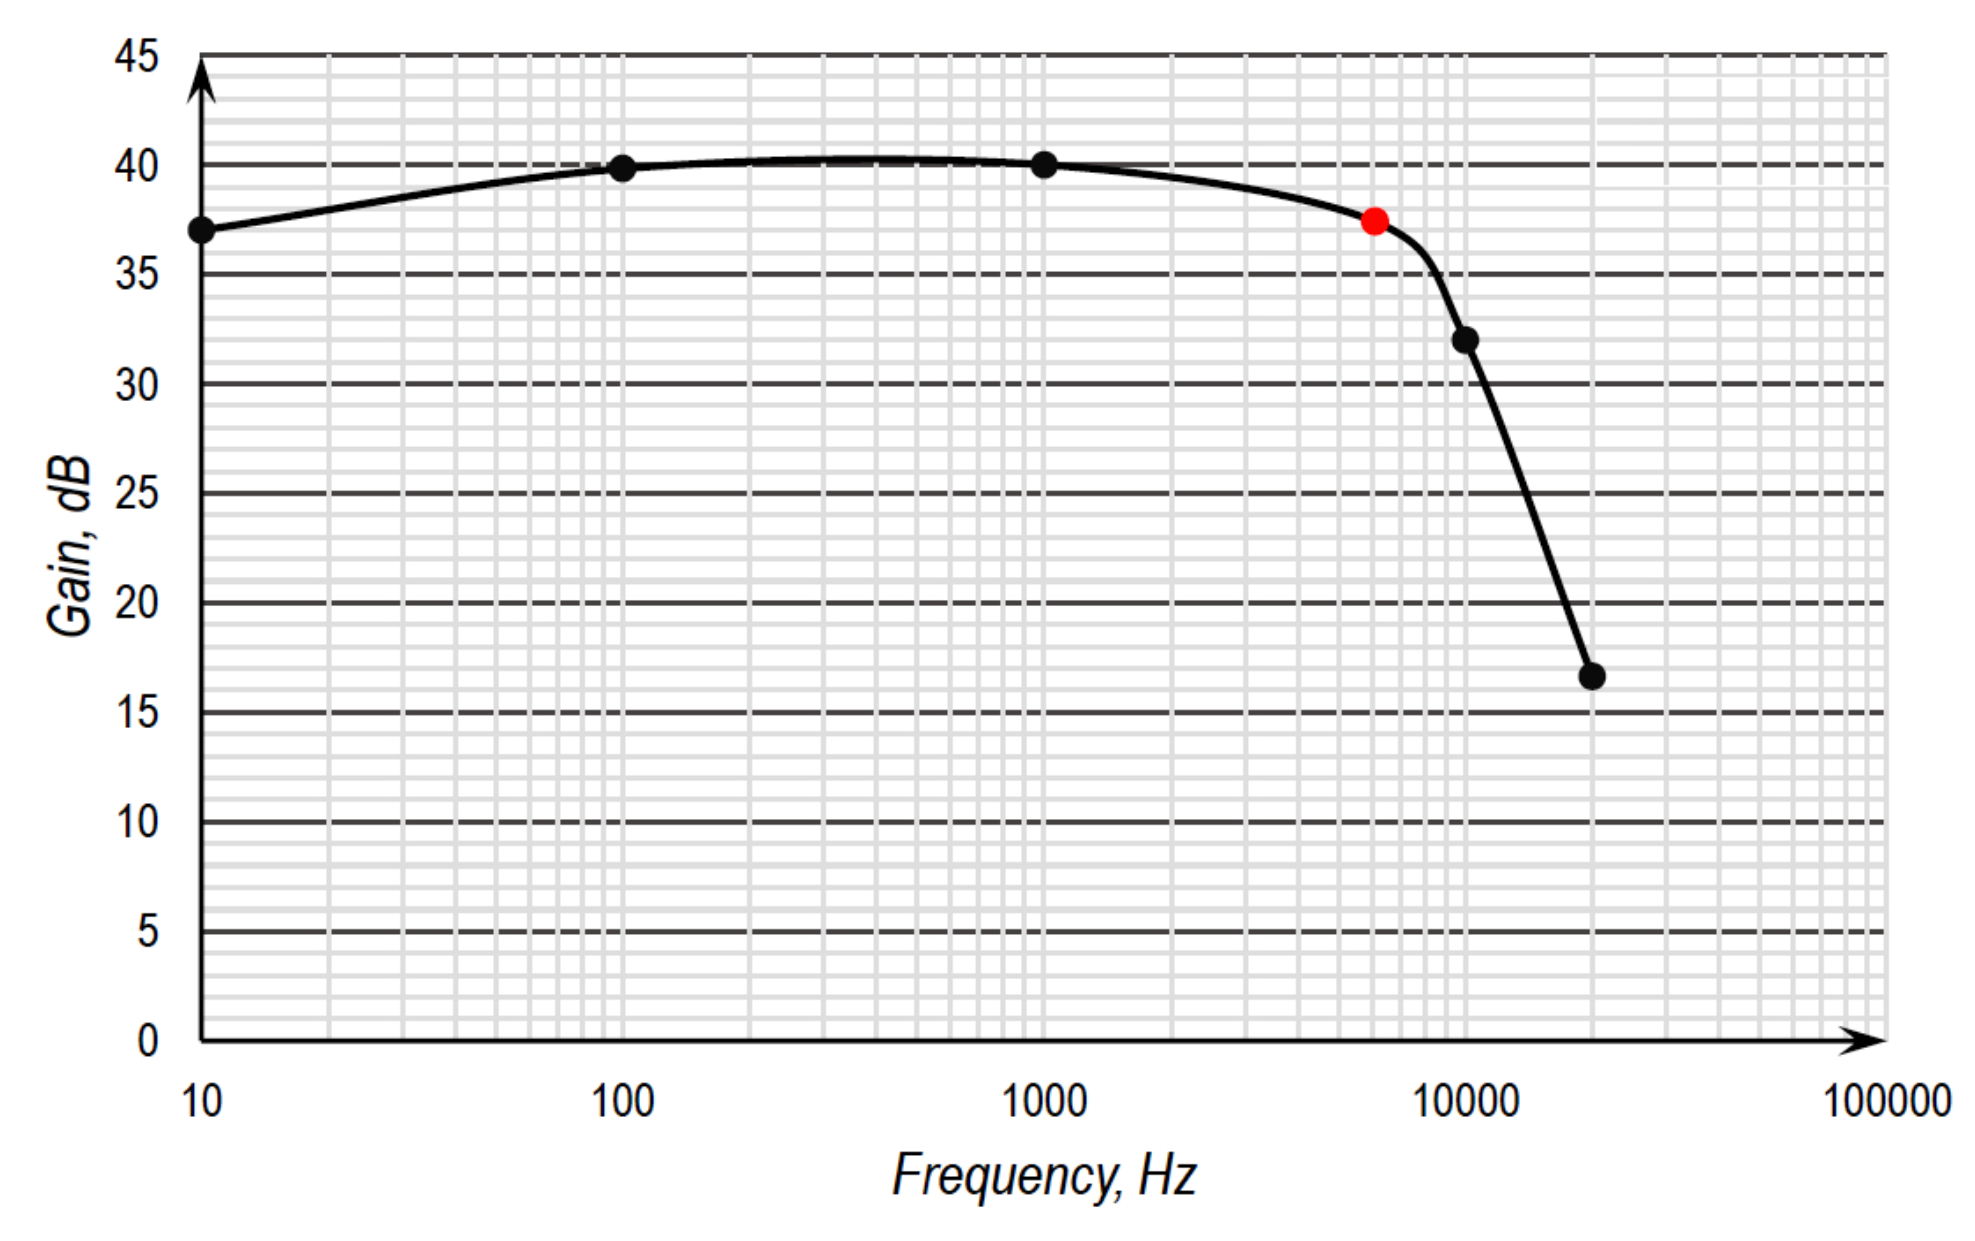
Then, a sound sensor powered by the BERS was implemented. A microphone was connected to a two-stage amplifier for increased sensitivity. Each amplification stage had a gain of 10, which provided a total gain of 100 for the complete sensor. The amplification circuit is shown in
Figure 12. Each amplification stage has one amplifier (MCP6142, Microchip, AZ, USA) which is a low-power rail-to-rail operational amplifier with quiescent current of 600 nA, a minimal operating voltage of 1.4 V, a gain bandwidth of 100 kHz, and a 24 V/ms slew rate. Sound/air vibration was detected using a passive dynamic microphone to reduce power consumption within a frequency range of 20 Hz to 20 kHz. The microphone output signal amplitude goes up to 4 mV, and sound/vibration reaches 60 dB. The output signal was amplified up to 400 mV. Experimental results show that the amplifier cutoff frequency was at 6.1 kHz (
Figure 13), which is enough to record human voice at fundamental frequencies [
27]. Sensor current consumption when it is in active mode is less than 11
A. Then, when two banks of MFC were connected (i.e., super-capacitor charged to 2.4 V), the collected electric power reached 26.5
W. The energy-storing unit powers the sensor only when it is in active mode. Otherwise, it keeps being charged by the MFCs.
We designed a first prototype of a BERS. We proved the functionality and reliability of the BERS in practical cases to power sensor networks in the northern area of Canada where a power electrical network is still not connected. The BERS was designed to work with seven MFCs. However, it can be extended to a larger network. The main problem which we can observe with the BERS is its dependence to weather conditions which has an impact on bacteria behavior. However, considering the hard northern weather conditions and limited access to this area, it is still a good compromise. The BERS is not designed for high power consumption electronics, its main usage is for extremely low power consumption applications.


 ,
, 


