Article

Identifiability Analysis of Degradation Model Parameters from Transient CO2 Release in Low-Temperature PEM Fuel Cell under Various AST Protocols

1
Faculty of Mechanical Engineering, University of Ljubljana, Aškerčeva 6, 1000 Ljubljana, Slovenia
2
Faculty of Education, University of Ljubljana, Kardeljeva Ploščad 16, 1000 Ljubljana, Slovenia
3
Institute of Chemical Engineering and Environmental Technologies, Graz University of Technology, Inffeldgasse 25C, 8010 Graz, Austria
*
Author to whom correspondence should be addressed.
Energies 2021, 14(14), 4380; https://doi.org/10.3390/en14144380
Submission received: 26 May 2021 / Revised: 10 July 2021 / Accepted: 16 July 2021 / Published: 20 July 2021

Abstract

:
The detrimental effects of the catalyst degradation on the overall envisaged lifetime of low-temperature proton-exchange membrane fuel cells (LT-PEMFCs) represent a significant challenge towards further lowering platinum loadings and simultaneously achieving a long cycle life. The elaborated physically based modeling of the degradation processes is thus an invaluable step in elucidating causal interaction between fuel cell design, its operating conditions, and degradation phenomena. However, many parameters need to be determined based on experimental data to ensure plausible simulation results of the catalyst degradation models, which proves to be challenging with the in situ measurements. To fill this knowledge gap, this paper demonstrates the application of a mechanistically based PEMFC modeling framework, comprising real-time capable fuel cell performance, and platinum and carbon support degradation models, to model transient CO2 release rates in the LT-PEMFCs with the consistent calibration of reaction rate parameters under multiple different accelerated stress tests at once. The results confirm the credibility of the physical and chemical modeling basis of the proposed modeling framework, as well as its prediction and extrapolation capabilities. This is confirmed by an increase of only 29% of root mean square deviations values when using a model calibrated on all three data sets at once in comparison to a model calibrated on only one data set. Furthermore, the unique identifiability and interconnection of individual model calibration parameters are determined via Fisher information matrix analysis. This analysis enables optimal reduction of the set of calibration parameters, which results in the speed up of both the calibration process and the general simulation time while retaining the full extrapolation capabilities of the framework.

1. Introduction

Low-temperature proton-exchange membrane fuel cells (LT-PEMFCs) are emerging as a feasible zero-emission tank-to-wheel energy conversion technology for use in transport applications. In the past five years, the fuel cell industry has had a moderate 20% year-on-year growth in megawatts shipped [1]. New and revised environmental and climate policies in the EU, North America, Asia, and other regions, together with corresponding financial instruments, are boosting fuel cell (FC) research and development, which will likely lead to even faster FC industry growth in the next decade. The achievement of these goals is inherently interlinked with the simultaneous reduction in production costs and the prolongation of service life. Tackling these challenges calls for the application of conjoint predictive FC performance and degradation modeling tools. This is reasoned by the fact that fuel cells degrade via several intertwined degradation mechanisms, which feature different characteristic times under transient operating conditions and different rates that depend on the local values of specific operational parameters (temperature, species concentrations, and electric potential field evolutions). Studies [2,3,4] showed that the local rates of Pt dissolution, redeposition, migration, and agglomeration strongly depend on the local values of these specific operational parameters and thus on the operating conditions of the FC. Due to the simultaneous action of different intertwined mechanisms featuring different dependencies on the local values of specific operational parameters, lumped degradation models cannot adequately simulate FC degradation. This is reasoned by the fact that the whole chain of individual degradation mechanisms in the empirical modeling approach used in lumped degradation models [5,6,7] does not consider the spatial and temporal resolution of these specific operational parameters.
To enrich the suite of modeling tools for the development of LT-PEMFCs, a real-time capable system-level modeling framework of PEMFC operation [8] and degradation was recently developed and presented in [9]. The framework is based on an intertwined mechanistically, spatially, and temporarily resolved FC operation and degradation model, comprising several cathode platinum degradation mechanisms, such as carbon and platinum oxidation phenomena, platinum dissolution, redeposition, detachment, and agglomeration. This novel modeling framework, which was validated on high-temperature proton-exchange membrane fuel cell (HT-PEMFC) data, enables the consistent modeling of particle size redistribution and the loss of electrochemical surface area in the transient operating regime of the fuel cell. Sufficient computation speed, required for a system-level modeling framework, is ensured by meticulously adjusting the complexity of the model, which must cover all relevant phenomena and reach the desired accuracy. The computational fastness of a framework is extremely important not only during the first stages of fuel cell development, when fast exploration of the design space is needed, or for hardware-in-the-loop applications but also during the parametrization procedure.
The latter is unavoidable even in elaborate physically based computation models, such as the one presented in this paper, as many parameters need to be determined based on experimental data for the model to properly describe the observed degradation of the catalyst. Easier and faster parametrization can be achieved if the calibration parameters used during parametrization can be uniquely determined, thus enabling fast convergence of the optimization problem to the global minima. Obtaining a proper set of calibration parameters of the modeling framework using optimization methods is considered especially important in the case of the submodel of the electrochemical oxidation of Pt and carbon surfaces, which is the precursor for the subsequent growth of Pt particles, either by the dissolution and redeposition of Pt ions or by particle detachment and agglomeration due to the corrosion of carbon support. The most reliable experimental method for the identification of electrochemical degradation processes in the catalyst layer of PEMFCs is the real-time in situ measurement of CO2 release rates. As explained later in the paper, the CO2 release rate is affected not only by the electrochemical reactions on the carbon surface but also by the electrochemical reaction dynamics on the Pt particle surface, interacting with carbon via the spillover mechanism of surface oxide groups.
The individual degradation processes in the PEMFC catalyst layer have been studied in detail over the years, and models addressing them have already reached significant maturity. Carbon corrosion, which influences the isolation and detachment of Pt particles and promotes the flooding of the electrodes [10], was modeled by simple electrochemical models in 1D [11] and 2D [12] by considering both carbon and Pt surface groups [2,13] or by even more complex microscopic models [14,15]. Platinum oxidation is rarely modeled alone [16]. It is more often analyzed along with other electrochemical reactions. As recognized by Pandy [2], carbon corrosion cannot be properly described by a simple one-step Butler–Volmer electrochemical process. The accelerated stress test (AST) experiments on fuel cell catalysts revealed that CO2 emissions are substantially increased during voltage cycling and are affected by both the voltage window size and residence rates at specific voltages [13,17]. Several models capable of addressing these phenomena have been proposed, for example by Pandy [2] and Macauley [13], featuring complex interaction between the formation of oxide groups and the accumulation on carbon and Pt surfaces. These models are capable of very precise prediction of temporally resolved CO2 emissions, consistent with experimental data [13]. However, due to the large number of reactions and calibration parameters, their applicability is limited in the context of system modeling, where high computation speed and the simple calibration of parameters are of paramount importance.
To predict changes in fuel cell performance, these models need to be further expanded to accommodate electrochemical reactions that lead to Pt dissolution [3,18,19,20], redeposition [4], and migration in the membrane [4,19]. Additionally, the effects of Pt detachment, agglomeration [21], and Ostwald ripening [20,22] on changes in the Pt particle size distribution in the catalyst layer and the consequent loss of active surface [23,24] have to be addressed as well. Both of the previously mentioned mechanisms influence the growth of Pt particles in size, which makes it difficult to distinguish the individual contributions based solely on the measurement of Pt particle size growth [25].
A fully conjoint model of fuel cell operation and catalyst degradation containing all the aforementioned processes has recently been proposed and tested by our group for use in HT-PEMFC systems [9]. In this model, the complexity of oxide group interactions was reduced to the simplest possible level, which still properly describes the voltage cycling effect. On the other hand, an important aspect, the shift in surface energy due to its curvature, has been implemented via the Kelvin formula [3,9,19]. This is often overlooked in modeling carbon corrosion [2,13], but it is crucial in the catalyst environment where electrochemical reactions on the surface of nanoscopic Pt particles take place. This size dependence, causing the decrease in equilibrium electric potential for Pt surface group formations on small particles and highly influencing the surface coverage dynamics, was described in [9] by tracking the oxidation dynamics for Pt particles of different sizes. In the present paper, the model was further adapted for use in LT-PEMFCs and improved with a more physically consistent model of carbon corrosion. It includes the separate tracking of carbon corrosion around the Pt particles and on the carbon support surface, which is not affected by any interaction with Pt. This modeling approach results in more physically appropriate modeling of the spillover of hydroxy groups and thus the oxidation dynamics.
The literature overview shows that this novel contribution assesses the applicability of a mechanistically based PEMFC modeling framework on the LT-PEMFCs by performing a proper calibration of reaction rate parameters for transient CO2 release rates under multiple different ASTs at once. The results confirm the credibility of the physical and chemical modeling basis of the proposed framework, as well as its prediction and extrapolation capabilities. Furthermore, the importance, identifiability, and interconnection of individual model calibration parameters are determined via Fisher information matrix (FIM) analysis, which shows that the parameters describing dissolution phenomena are not uniquely determinable on the given data set. This is due to the negligible effects of the dissolution in experiments of the given duration. Based on the results, a significant reduction of the calibration parameter set is proposed, which will enable a speed up of not only the calibration process but also of the general simulation time for the experiments of the given duration while retaining the full extrapolation capabilities of the framework.

2. Materials and Methods

2.1. Modeling Framework

The conjoint fuel cell operation and degradation models, used in the presented analysis, were already extensively presented in [9,26] for high-temperature PEMFC system modeling purposes. Even though some degradation phenomena are significantly different in LT-PEMFCs, such as membrane degradation because of the difference between membrane materials utilized [27], the carbon support and catalyst materials used in LT-PEMFCs are similar, and thus, a similar mechanism comprising the most significant reaction pathways can be applied here as well [2]. Therefore, the proposed modeling framework can also be utilized for this kind of fuel cell system, provided that the proper calibration of temperature-dependent parameters, i.e., reaction rate parameters, takes place. Furthermore, equilibrium potentials ( E 0 ), which are dependent on the number of electrons transferred ( n ), elementary charge (e), and the changed Gibbs potential between reactants and products [28]:
n e E 0 = Δ G = Δ H T Δ S ,
and reaction rates, which are affected by the changed enthalpies of transition states Δ H + + [28]. One of the most prevalent differences between LT and HT-PEMFCs is the origin of water and protons participating in reactions. In the HT-PEMFCs, the latter originate from phosphoric acid, which is used as the membrane ionic conductor. Hence, their concentration is directly related to the pH values of the acid. Additionally, water concentration is more directly related to feed gas properties, as in the case of LT-PEMFCs, where the concentration of water and protons strongly depends on the membrane humidity.
Therefore, tackling such complex intertwined processes calls for the application of a mechanistically, spatially, and temporarily resolved FC operation model. In the conjoint model, the FC operation model calculates the local conditions in the catalyst layer, namely the local electric potential, temperature, humidity, and the aforementioned concentration of protons, using an advanced hybrid analytical–numerical (HAN) modeling approach [8,29,30,31]. Its hybrid nature enables high computational efficiency by combining a one-dimensional (1D) numerical and a two-dimensional (2D) analytical solution. In the HAN approach, a fuel cell with straight parallel channels is numerically discretized in the direction of the channels. This 1D numerical discretization yields shallow 2D slices consisting of a cathode feed, a membrane electrode assembly (MEA), and an anode feed, where each feed part is divided into one channel and two gas diffusion layer (GDL) domains (under the channel and under the rib), yielding seven domains. The species transport in each of the feed domains is calculated with an analytical solution of a 2D diffusion equation. The resulting gas concentrations at the catalyst are then used to determine the relationship between the voltage and the current generation based on the Butler–Volmer equation and the voltage drop across the membrane.
The local conditions in the catalyst layer, calculated by the HAN model, are then used as the inputs for the catalyst degradation model [26]. The main initiator of the catalyst degradation is the process of electrochemical surface oxidation of Pt and carbon support. The electrochemical surface oxidation process is affected by temperature, voltage, and humidity encountered during fuel cell operation. In this work, we use a modified version of the models proposed by the authors in [13,17], with the complexity of oxide group interactions being reduced to the simplest possible level while still properly describing the voltage cycling effect.
Our model of the oxidation of Pt and carbon surfaces is described by a two-step process. First, the hydroxy group (OH) is formed from water on a suitable surface defect ( Pt * ,   C * ) under sufficiently high electric potential, described by equilibrium reactions [2,3,9,13,19]:
C 1 :     C * + H 2 O     C OH + H + + e ; E C 1 = 0.20   V   RHE ,
Pt 1 :   Pt * + H 2 O     Pt OH + H + + e ; E Pt 1 = 0.80   V   RHE .
The spillover of hydroxy groups from the Pt particle surface to the adjacent carbon support causes a reaction between the two, resulting in the corrosion of carbon [2,9,13]:
PtC :   Pt OH + C OH     C * + Pt * + CO 2 + 2 H + ;   E PtC = 0.65   V   RHE ,
Carbon corrosion can also occur in the absence of spillover hydroxy groups by the interaction between C–OH groups and water via reaction [2,9,13]:
CC :   C OH + H 2 O C * + CO 2 + 3 H + + 3 e ; E CC = 0.95   V   RHE ,
However, not all surface hydroxy groups contribute to carbon corrosion. The reactions PtC and CC compete with two other electrochemical reactions, transforming reactive OH groups into a passive oxide film at a high electric potential. These reactions are modeled as surface oxide groups Pt = O and C = O on Pt and the carbon surface [2,3,9,13,19]:
C 2 :     C OH     C = O + H + + e ; E C 2 = 0.80   V   RHE ,
Pt 2 :   Pt OH     Pt = O + H + + e ; E Pt 2 = 0.98   V   RHE .
The reaction rates of all six electrochemical reactions are modeled using Butler–Volmer formulas [2,3,19]:
r C 1 ( r ) = k C 1 [ a H 2 O Θ C ( r ) e α C 1 ( U c a t E C 1 ) / b a H + Θ C OH ( r ) e ( 1 α C 1 ) ( U c a t E C 1 ) / b ] ,
r C 2 ( r ) = k C 2 [ Θ C OH ( r ) e α C 2 ( U c a t E C 2 ) / b a H + Θ C = O ( r ) e ( 1 α C 2 ) ( U c a t E C 2 ) / b ]
r Pt 1 ( r ) = k Pt 1 [ a H 2 O Θ Pt ( r ) e α Pt 1 ( U c a t E Pt 1 ( r ) r O x Θ O x ) b k r e v a H + Θ Pt OH ( r ) e ( 1 α Pt 1 ) ( U c a t E Pt 1 ( r ) ) / b ]
r Pt 2 ( r ) = k Pt 2 [ Θ Pt OH ( r ) e α Pt 2 ( U c a t E Pt 2 ( r ) r O x Θ O x ) / b k r e v a H + Θ Pt = O ( r ) e ( 1 α Pt 2 ) ( U c a t E Pt 2 ( r ) ) / b ]
r PtC ( r ) = k PtC Θ C OH ( r ) Θ Pt OH ( r ) e 2 α PtC ( U c a t E PtC ) / b
r CC ( r ) = k CC a H 2 O Θ C OH ( r ) e 3 α CC ( U c a t E CC ) / b
The reaction rates are determined by the concentrations of relevant surface groups, expressed as a percentage of available sites being free of oxides ( Θ C , Θ Pt ) or occupied by a specific oxide group ( Θ C OH , Θ Pt OH , Θ C = O , Θ Pt = O ). This enables the separate tracking of carbon corrosion around the Pt particles and on the carbon support surface, which is not affected by the interaction with Pt. Fuel cell operating conditions affect the reaction rates via water ( a H 2 O ) and proton ( a H + ) activity, the local electric potential difference between the catalyst material and the adjacent ionomer ( U c a t ) , and temperature ( T ). This is expressed as a Tafel slope b = R T / F , where R denotes the general gas constant, and F the Faraday constant. The specifics of each reaction dynamics are described by its reaction rate constant k i , charge transfer coefficient α i , equilibrium potential E i , and in the case of Pt oxidation, the irreversibility coefficient k r e v .
An important aspect in modeling carbon corrosion in the catalyst environment is the shift in surface energy due to its curvature. This is especially pronounced when modeling the electrochemical reactions on the surface of nanoscopic Pt particles. The potential shift, described by the Kelvin formula, causes the decrease in equilibrium electric potential for Pt surface group formations, calculated for a particle of size r . as [3,19]:
E Pt 1 ( r ) = E Pt 1 + 1 2 F r ( σ Pt OH M Pt OH ρ Pt OH σ Pt M Pt ρ Pt )
E Pt 2 ( r ) = E Pt 2 + 1 2 F r ( σ Pt = O M Pt = O ρ Pt = O σ Pt OH M Pt OH ρ Pt OH )
where σ , M , and ρ denote the surface tension, molar mass, and density, respectively, of Pt and Pt surface hydroxy and oxide groups. This shift causes the formation of surface groups on Pt particles to occur at lower voltages than in the case of a plain Pt surface, thus an important improvement over the dynamic proposed in [2].
Based on the reaction rates in Equations (8)–(13), the surface oxide coverages are dynamically calculated as follows [2,3,9,13,19]:
d Θ Pt ( r ) d t = F Γ Pt [ r Pt 1 ( r ) + r PtC ( r ) ]
d Θ Pt OH ( r ) d t = F Γ Pt [ r Pt 1 ( r ) r Pt 2 ( r ) r PtC ( r ) ]
d Θ Pt = O ( r ) d t = F Γ Pt r Pt 2 ( r )
d Θ C ( r ) d t = F Γ C [ r C 1 ( r ) + r CC ( r ) + r PtC ( r ) ] ,
d Θ C OH ( r ) d t = F Γ C [ r C 1 ( r ) r C 2 ( r ) r CC ( r ) r PtC ( r ) ]
d Θ C = O ( r ) d t = F Γ C r C 2 ( r ) ,
where Γ Pt and Γ C denote the surface density of the defect sites on the Pt and carbon surface [4,32,33], suitable for the formation of the oxide groups, expressed as surface charge density As / m 2 . Note that the coverage dynamics depend on particle size r , which is not the same for all Pt particles in the catalyst. Their sizes are distributed according to some distribution with a mean particle size r _ and standard deviation σ r . To properly cover this effect while retaining low computational load the coverages were calculated for particles of 5 different sizes, r = r _ ,   r _ ± σ r ,   r _ ± 2 σ r .
One also needs to consider that not all of the carbon surface is affected by the spillover of hydroxy groups, and the oxidation dynamics of the carbon surface is therefore different. This is addressed in the model by separately calculating oxidation reaction rates on the “plain” (subscript P) carbon surface, unaffected by Pt particles, from the surface coverages of “plain” carbon surfaces, denoted as Θ C , P ,   Θ C OH , P ,   Θ C = O , P :
r C 1 , P = k C 1 [ a H 2 O Θ C , P e α C 1 ( U c a t E C 1 ) / b a H + Θ C OH , P e ( 1 α C 1 ) ( U c a t E C 1 ) / b ] ,
r C 2 , P = k C 2 [ Θ C OH , P e α C 2 ( U c a t E C 2 ) / b a H + Θ C = O , P e ( 1 α C 2 ) ( U c a t E C 2 ) / b ]
r CC , P = k CC a H 2 O Θ C OH , P e 3 α CC ( U c a t E CC ) / b
The surface coverages of this part on Θ C , P ,   Θ C O H , P ,   Θ C = O , P “plain” carbon surfaces [2,9]
d Θ C , P d t = F Γ C [ r C 1 , P + r CC , P + r PtC , P ]
d Θ C OH , P d t = F Γ C [ r C 1 , P r C 2 , P r PtC , P ]
d Θ C = O , P d t = F Γ C r C 2 , P
The CO2 production rate due to corrosion is calculated by summing up the contributions to corrosion around particles of all sizes and of a plain carbon surface. It is assumed that the hydroxide spillover affects the vicinity of Pt particle surface approximately equal to the half of particle surface, i.e., S PtC ( r ) = 2 π r 2 . The total CO2 emission rate is therefore expressed as mass flow:
ϕ m , CO 2 ( t ) = M C   S C r C C , P ( t ) + r M C   S PtC ( r ) [ r PtC ( r , t ) + r CC ( r , t ) ] N ( r )   ,
where the number of particles of a specific size N ( r ) is determined from an assumed Gaussian distribution and the total number of particles in a catalyst, and the total carbon surface S C is determined from the specific surface area of carbon support used in the catalyst. Resulting from carbon oxidation, the detachment of Pt particles from carbon support leads to their eventual agglomeration and therefore a loss of catalyst active area [9]. However, as the experiments were of a relatively short duration, which inherently means that the model was utilized with short simulation times, this effect is negligible and will thus not be analyzed in detail in the scope of this paper.
The proposed scheme, featuring only two types of surface groups on Pt and carbon, is sufficient to describe the peaks in CO2 emissions during voltage cycling. When the catalyst voltage is held between 0.2 and 0.8 V, the hydroxy groups are accumulated on the carbon surface via reaction C1 in Equation (2) [2], but they do not cause corrosion, as the voltage is too low for either the formation of Pt–OH groups via reaction Pt1 with which the C–OH groups could react or for corrosion via reaction CC. When the voltage is increased, the accumulated C–OH groups readily react with the newly formed Pt–OH groups via reaction PtC at U c a t > 0.8   V or with water via reaction CC at U c a t > 0.95   V [2]. In both cases, the amount of corroded carbon can be significantly higher than it would be in the case of a constant high voltage.

Modeling Transport Phenomena in Connecting Pipes

Conjoint models interact in a way that the degradation modeling framework behaves as one dedicated zero-dimensional (0D) reactor for each respective computational domain of the FC operation model and is thus defined by the resolution of the FC operation model. Consequently, the generated flux of CO2, a direct result of carbon support corrosion, first propagates through the GDL and then into the cathode channel. The effect of transport phenomena is the smearing of the concentration peaks, which are consequently reduced in height and broadened in width. The smearing of the concentration peaks is further intensified with the introduction of connecting pipes, which are a necessary part of the experimental setup and connect the fuel cell outlet and the gaseous exhaust analyzer. To accommodate this additional smearing effect due to transport phenomena in a pipeline, a convection–diffusion equation in 1D is employed:
d C ( x , t ) d t = D d 2 C ( x , t ) d x 2 v d C ( x , t ) d x + R ( 0 , t ) ,
where C is concentration, D is effective diffusivity, v is velocity, R is the source of CO 2 , and x is the 1D direction in which the given differential equation was numerically solved.

2.2. Experimental

2.2.1. Fuel Cell Setup

For the experiments, a 25 cm2 polymer electrolyte membrane fuel cell with a triple serpentine flow field design was used. The implemented catalyst coated membrane (CCM) consisted of a Chemours NafionTM NR-212 of Chemours Delaware, USA membrane and a carbon-supported Pt catalyst with the carbon support and catalyst consisting of Vulcan carbon black and HiSpec 5000 Pt catalyst of Johnson Matthey Fuel Cells, London, UK, respectively. This catalyst was sprayed by a spray coater (SONOTEK ExactaCoat OP3 of Sono-Tek Corporation, 12547, Milton, NY, USA) onto the membrane, resulting in catalyst loadings of 0.05 mg/cm2 (20 wt.% Pt) on the anode side and 0.25 mg/cm2 (50 wt.% Pt) on the cathode side. For the gas diffusion layers, Sigracet® 39BC of the company SGL Carbon, Wiesbaden, Germany was used.
The whole fuel cell test bench configuration is presented in Figure 1.

2.2.2. ASTs Measurements

The ASTs were conducted by cycling the voltage twenty times between a lower potential limit at 0.6 V and an upper potential limit at 0.95 V with different hold times ranging from 0.5 min to 5 min (see Table 1) using a Zahner electrochemical workstation (PP 240) of ZAHNER-elektrik GmbH & Co., Kronach, Germany. During the experiment, the fuel cell temperature was kept at 80 °C, and the mass flow of hydrogen, as well as synthetic air, was held constant at 225 mL min−1 and 645 mL min−1 (stoichiometry of 1.25 and 1.5 at 20 A), respectively, with a relative humidity of 100% on both sides.
As seen in Table 1, the lower and upper potential limits for ASTs were chosen to study carbon corrosion, as in the US Department of Energy Protocol. Different holding times were used to investigate the effect of Pt–OH (0.95 V) and C–OH (0.6 V) accumulation on the carbon support deterioration. High humidity favored the corrosion of carbon, synthetic air was utilized to study the degradation of the membrane.
CO2 concentrations of the exhaust gas on the cathode side were analyzed with an Uras 14 detector of an ABB Advance Optima AO2020, of ABB, Mannheim, Germany continuous gas analyzer. In order to get fast responses, nitrogen with a mass flow of 520 mL min−1 was introduced into the exhaust gas, and the water was removed in a condenser inside the gas analyzer before CO2 concentrations were measured.
Based on [34], the assembled fuel cell was conditioned for three hours before the actual AST by ramping the voltage between three voltage plateaus (0.6 V, 0.5 V, and 0.4 V) and holding the voltage constant for one minute every time.

2.3. Optimization Procedure

The model of PEMFC operation has been extensively validated [8,29,30,35,36] with spatially resolved results generated by a validated 3D Multiphase, Multiphysics CFD tool [36,37], and experimental data [8,36]. Hence, this contribution focuses only on the calibration and validation of the degradation model and the potential reductions of the set of calibration parameters of the model and consequentially of the modeling expression.
To determine a set of calibration parameters, firstly, inputs based on operational conditions and known physical constants were inserted. These inputs include molar masses and general constants easily acquired in the literature. This is a general but instrumental step to ensuring both the high generality and good prediction capability of the parametrized model while still avoiding overfitting. On the other hand, the detailed material properties of the catalyst components, reaction rates, and other temperature-dependent parameters are much more difficult to determine. Therefore, they were selected to form a set of calibration parameters. These parameters are reaction rate constants of electrochemical reactions: k Pt 1 , k Pt 2 , k Pt Dis , k C 1 , k C 2 , k PtC , k CC ; charge transfer coefficients: α Pt 1 , α Pt 2 , α Pt Dis , α C 1 , α C 2 , α PtC , α CC ; and initial Pt and carbon surface group concentrations: Θ Pt i n i t , Θ Pt OH i n i t , Θ C i n i t , Θ C OH i n i t .
The determined set of calibration parameters presents a basis for the calibration procedure, which is based on the process of minimization of the penalty function value. As a result, the model output is fitted to the experimental data, with physically plausible constraints introduced on the calibration parameters, which, as a result, have physically plausible values. Based on the fact that the optimization problem has a significantly vast variation space consisting of 18 calibration parameters and the fact that the problem is highly nonlinear, differential evolution [38], a global optimization algorithm, was applied in the first step of optimization, which was parallelized with the aim of reducing computational time. Differential evolution is an evolutionary algorithm that does not need the optimization to be differentiable, which inherently means that it is less prone to getting stuck in local minima. After 300 generations with a population size of 148, differential evolution was swapped with the computationally less-demanding Nelder–Mead algorithm (“fminsearch” [39]), which is a much faster local optimization algorithm using a gradient descent approach with which the final values of the calibration parameters were determined.

2.4. Calibration Parameter Sensitivity and Intercorrelation

Each experimental data set offers a limited amount of information about the individual calibration parameters of the model. Parameter sensitivity is invaluable in successfully assessing which parameters can be uniquely determined without intercorrelation to others and to what degree of certainty the individual parameter values can be determined. It can be performed with various methods, i.e., with the high-dimensional model representations (HDMRs) [40] or with the Fourier Amplitude Sensitivity Test [41]. In this paper, it was performed using Fisher information [42], which offers not only insight into individual calibration parameter sensitivity to the given experimental data and consequential identifiability of the calibration parameter [43] but also into the intercorrelation of calibration parameters with the analysis of diagonal and nondiagonal elements of the FIM, respectively. Based on the latter, the reduction of the set of calibration parameters can be proposed without affecting generality and the extrapolation capabilities of the model, thus reducing the necessary computational time needed for a successful calibration procedure, as shown in [44].

3. Results and Discussion

3.1. Degradation Model Calibration and Validation

Calibration and validation are performed via a comparison of modeled and measured transient CO2 release rates under three different ASTs on a single-cell LT-PEMFC, using potential levels from the standardized DOE AST protocol (0.6–0.95 V) [45] with different residence times at low and high voltage. This difference in residence times leads to changed temporal CO2 emission dynamics. Prolonged holds at low potential contribute to the formation of C–OH and its accumulation on the carbon surface, while prolonged holds at a high potential contribute to the formation of Pt–OH and OH radicals. Interplay between them leads to a pronounced spike of CO2 formation when an increase and decrease in potential occurs, as presented in Equation (4). When the potential is increased, the C–OH is exposed to the Pt–OH and OH radicals that form at high potentials, which leads to the reaction presented by Equation (4). This reaction produces CO2, which is then continuously produced at a high potential in smaller quantities when C–OH reacts with water (see Equation (5)). On the other hand, when the potential is suddenly decreased, the Pt–OH and OH radicals that accumulated during high potentials are exposed to the newly forming C–OH, which leads to a second characteristic spike in the CO2 emissions. The effects of the described phenomena on CO2 emissions can be seen in all three plots presented in Figure 2. The highest amplitudes of CO2 concentrations are observed in AST No. 2, whereas the lowest on average are observed in AST No. 3. In AST No. 3 prolonged holds at a high potential influence the concentration ratio between the formed Pt–OH and C–OH, with the latter’s concentration being smaller. This ratio influences CO2 emissions not only due to the C–OH reaction with Pt–OH but also the C–OH reaction with water at a high potential.
The results of the calibrated system-level modeling framework show good agreement between the model and experimental data for both the single-experiment calibration and the multiple-experiment calibration at once, which can be seen in Figure 2. Additionally, the results are analyzed by a detailed study of the root mean square deviations (RMSDs) of the output of the framework for values of the calibration parameters obtained by single and multiple experiments, as presented in Table 2. The results show that the increase in RMSD values in the case of multiple experiments is marginal for the first two ASTs and noticeable but not major for the third AST, demonstrating good extrapolation capabilities of the modeling framework. The reasoning behind the larger increase in RMSD values in the case of the third AST is a nonmatching duration of the hold for high and low potential values. A prolonged hold at a high potential results in the continuous production of CO2 via the reaction path presented with Equation (5), which shifts the “background level” of emissions. The latter are in the case of the shorter holds with matching durations defined mainly by initial Pt and carbon surface group concentrations, which are, when calibrating on all three ASTs at once, defined to better suit two out of three tests and as a direct consequence result in higher RMSD for the third AST. However, the obtained values of the most suitable set of calibration parameters, resulting in the best agreement between experimental and model results for all three ASTs simultaneously, have physically plausible values (Appendix A, Table A2) and are in line with literature values. The results thus prove the credibility of the physical and chemical modeling basis of the proposed system-level modeling framework on LT-PEMFCs.

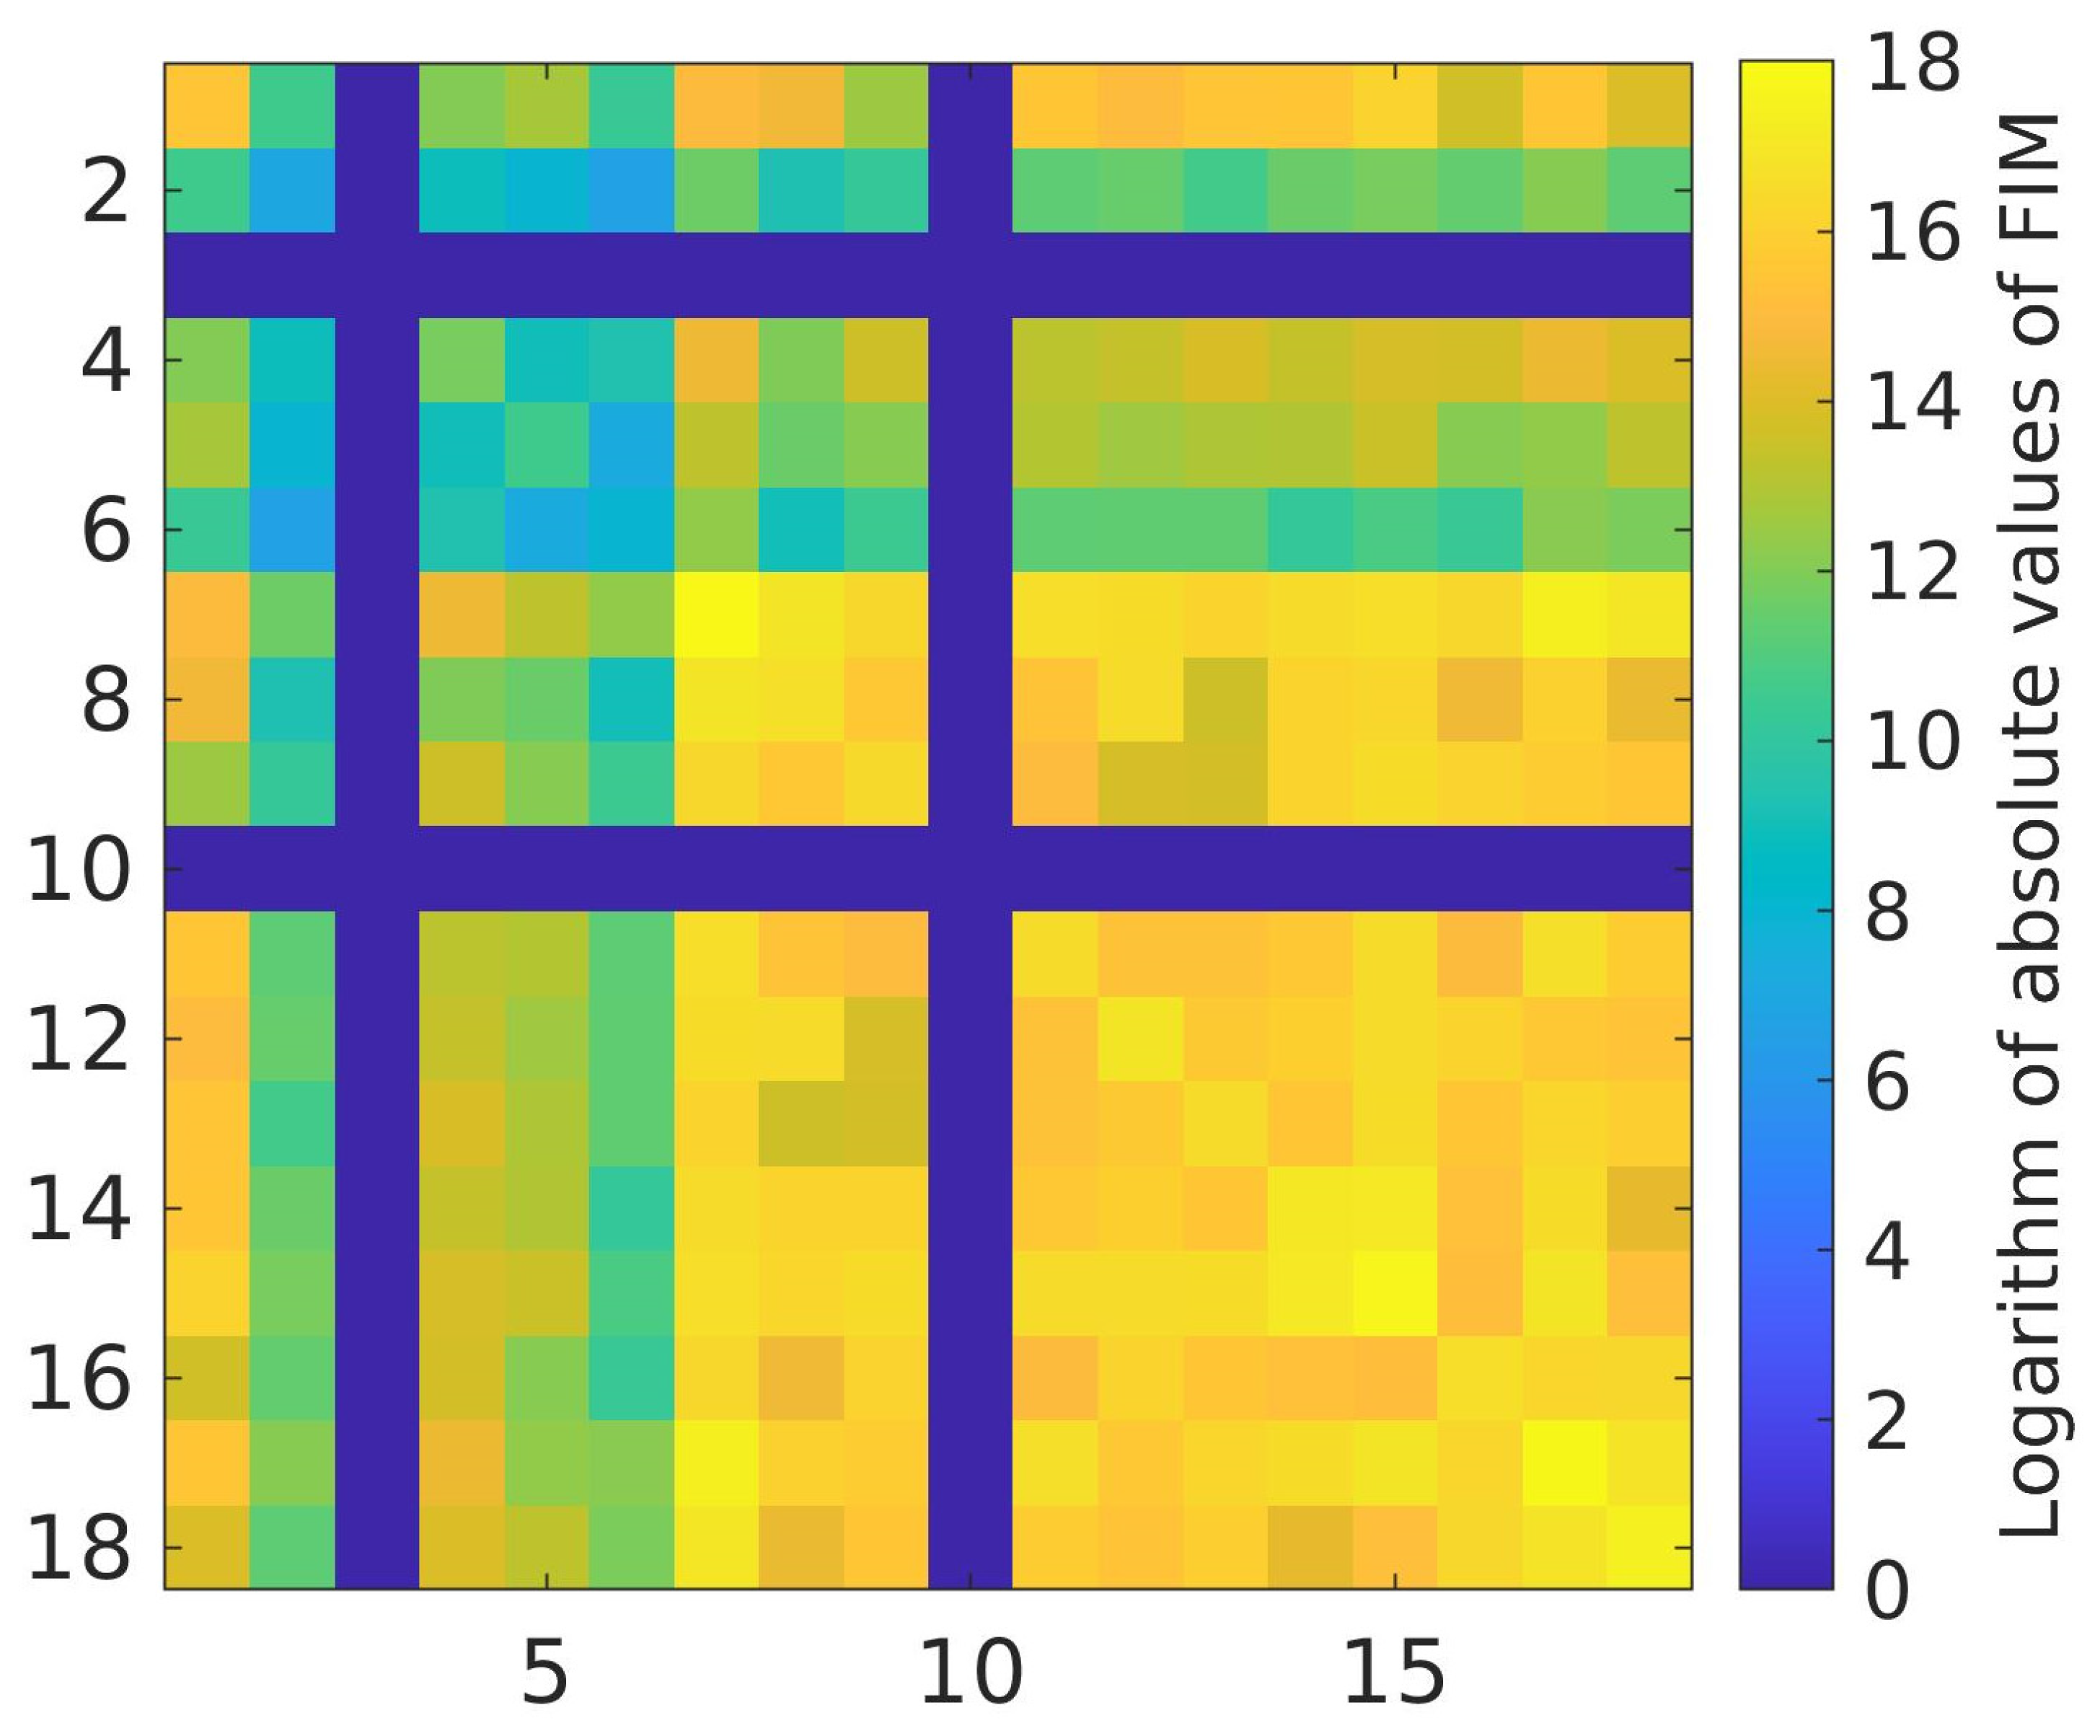
3.2. Calibration Parameter Sensitivity and Intercorrelation

The quality of the obtained fit is one of the most important results of the model; however, the same fit quality can be obtained in cases of an ill-determined set of calibration parameters with a much higher number of parameters in comparison to the smallest possible set of uniquely determinable calibration parameters. Even though the output of the model is the same in both cases, the fast convergence to the global minima is achieved only in the case of the smallest possible set of uniquely determinable calibration parameters.
To test this aspect of the developed model, an FIM was calculated, and its eigenvalue decomposition was carried out and subsequently analyzed. The FIM obtained with the calibrated model is presented in Figure 3. Each individual element in this matrix carries information about the parameters and their interdependence. Diagonal elements represent the certainty of the determination of the calibration parameter, i.e., the inverse of the error in calibration parameter value; therefore, a higher value here means a lower error. Thus, the parameters used for modeling the effects of platinum dissolution, namely (3- k Pt Dis and 10- α Pt Dis ), cannot be uniquely determined on the given data set. This numerical result fully supports the physical depiction of platinum dissolution process behavior, which does not significantly contribute to the degradation of the platinum catalyst during a few hours of measuring. Therefore, it does not affect the CO2 emission rates. On the other hand, the results show that for the majority of calibration parameters pairs k ,   α , α can be determined with much higher certainty. However, this is not the case for k CC and α CC , which describe carbon corrosion in the absence of spillover hydroxy groups by the interaction between C–OH groups and water (Equation (5)), where both CC parameters are exceptionally well determined. The obtained result is expected, as the CC reaction is one of the more detrimental reactions for carbon support longevity. Furthermore, its product, CO2, is directly observed, whereas other reactions affect the CO2 release codependently, thus the amount of information about CC parameters is the highest out of all model parameters.
Nondiagonal elements represent the correlation between individual parameters. High values here mean that there is a high possibility that little separation between both parameters exists and that they are highly dependent on each other and consequentially cannot be well defined separately using this data set. However, when the diagonal values are not high for all calibration parameters, it could also mean that this is just an effect of the higher diagonal value of the parameter with which the mixed second-order partial derivative is formed. This can also be explained with an n-dimensional space parabola, where n is the number of calibration parameters. The FIM represents the derivative of the curvature of the n-dimensional surface. This means that if there is a significant gradient in the direction of one calibration parameter, there is a significant likelihood that this will affect gradients in the adjoining directions if the n-dimensional curve is continuous and twice continuously differentiable. Therefore, these nondiagonal elements only hint towards the independence or the intertwining of the parameters. This is confirmed or rebutted via the FIM’s eigenvalue decomposition. The latter shows strong interconnectivity only between the worst defined calibration parameters describing platinum dissolution phenomena. The observed interconnectivity can be addressed in one of two ways, by devising an optimal data set based on the model-based design of experiments (DoE) methodology as proposed in [43] or by performing a reduction of the set of calibration parameters of the model.

Proposed Reduction of the Set of Calibration Parameters of the Model

The results of the parameter sensitivity analysis show that the calibration parameters describing platinum dissolution phenomena are not determined with high certainty; furthermore, they are not uniquely determinable on the given data set and exhibit significant interconnectivity, which means that based on the functional dependency of the two:
r Pt Dis ( r ) = k Pt Dis Θ Pt ( e α Pt Diss ( U c a t E Pt Diss ) b Pt Diss C Pt 2 + C Pt 2 + , r e f e ( 1 α Pt Diss ) ( U c a t E Pt Diss ) b Pt Diss )
They could be lumped together by using a Tafel approximation of Equation (30) and linearizing the remaining exponent. Consequentially only one joint calibration parameter k α Pt Dis could be calibrated from the obtained expression:
r Pt Dis ( r ) = k α Pt Dis Θ Pt α Pt Diss ( U c a t E Pt Dis ) / b Pt Diss
The other option is to omit α Pt Diss and k Pt Dis from the optimization procedure and adopt their values from the literature, which would result in a reduction of the optimization time by at least 11% without affecting the predictability of the modeling framework during simulation campaigns that last several hours, where the effects of dissolution for overall catalyst degradation are at least an order of magnitude smaller than most prevalent degradation mechanisms. The third option would be setting r Pt Dis to zero, which would enable the speed up of not only the calibration process but also general simulation time for experiments of the given duration, while retaining full extrapolation capabilities of the framework during short simulation campaigns.
Even without the proposed model reductions, the results confirm the credibility of the physical and chemical modeling basis of the proposed frameworks, deeming the effects of the dissolution in experiments of the given duration negligible, which is fully in line with the experimental data presented in [41]. On the other hand, the identifiability of the remaining calibration parameters is high, and they are uniquely determinable. Furthermore, the proposed modeling framework exhibits good extrapolation capabilities. These capabilities enable not only an in-depth understanding of the cause-and-effect chain from FC operation to its degradation but also its use in the common V-development process. Where the modeling framework can be used in the system-level development phases covering the early development stages for the exploration of design space and for designing the system in model-in-the-loop (MiL) applications, as well as the later validation and calibration phases aimed at hardware-in-the-loop (HiL) applications and the development of control functionalities and strategies.

4. Conclusions

The paper presents a mechanistically based PEMFC performance and degradation modeling framework. It was calibrated on the LT-PEMFCs by performing a proper calibration of reaction rate parameters for transient CO2 release rates under three different ASTs at once. The main differentiators between them were the holding times at 0.95 V and 0.6 V, which were used to investigate the effect of Pt–OH and C–OH accumulation on carbon support deterioration. The results confirm the credibility of the physical and chemical modeling basis of the proposed frameworks by achieving relatively low RMSD values for both single and multiple time traces utilized in the calibration procedure. This ability to adequately simulate multiple experiments with the same values of the calibration parameters substantiates the claim of good prediction and extrapolation capabilities of the modeling framework and validates its mechanistic basis. Furthermore, the identifiability and interconnection of individual model calibration parameters are assessed via Fisher information matrix analysis, which shows that the parameters describing dissolution phenomena are not uniquely determinable on the given data set. This numerical result fully supports the physical depiction of platinum dissolution process behavior, which does not significantly contribute to the degradation of the platinum catalyst during a few hours of measuring. Based on the results, a reduction of the calibration parameter set is proposed, enabling the speed up of not only the calibration process but also of the general simulation time, while retaining full extrapolation capabilities of the framework.
The proposed modeling framework, therefore, represents significant progress in the area of system-level models aimed at combined performance and lifetime modeling and optimization. This confirms the modeling framework as a suitable candidate for crossing the system-level part of the V-development process and efficiently contributing to the model-supported development of advanced clean energy conversion technologies.

Author Contributions

Conceptualization, A.K. (Andraž Kravos), A.K. (Ambrož Kregar), K.M., V.H. and T.K.; Methodology, A.K. (Andraž Kravos), A.K. (Ambrož Kregar) and K.M.; Software, A.K. (Andraž Kravos) and A.K. (Ambrož Kregar); Validation, A.K. (Andraž Kravos), A.K. (Ambrož Kregar) and K.M.; Formal Analysis, A.K. (Andraž Kravos); Investigation, A.K. (Andraž Kravos), A.K. (Ambrož Kregar) and K.M.; Resources, K.M.; Data Curation, K.M.; Writing—Original Draft Preparation, A.K. (Andraž Kravos), A.K. (Ambrož Kregar) and K.M.; Writing—Review and Editing, A.K. (Andraž Kravos), A.K. (Ambrož Kregar), K.M., V.H. and T.K.; Visualization, A.K. (Andraž Kravos) and K.M.; Supervision, V.H. and T.K.; Project Administration, V.H. and T.K.; Funding Acquisition, V.H. and T.K. All authors have read and agreed to the published version of the manuscript.

Funding

The research is partially funded by the Slovenian Research Agency (Research Core Funding No. P2-0401), by the CD Laboratory for Innovative Control and Monitoring of Automotive Powertrain Systems and by the Austrian Research Promotion Agency (Research Project No. 854867: SoH4PEM; Research Project No. 871541: HyPE-FC).

Institutional Review Board Statement

Not applicable.

Informed Consent Statement

Not applicable.

Conflicts of Interest

The authors declare no conflict of interest. The funders had no role in the design of the study; in the collection, analyses, or interpretation of data; in the writing of the manuscript, or in the decision to publish the results.

Appendix A. Model Parameters

The values of the material parameters used in the model, such as material densities, surface tensions, and molar masses, obtained from the literature, are listed in Table A1, alongside the source from which the value was taken.
The calibration parameter values obtained in the optimization procedure for all three experiments at once are provided in Table A2, alongside their units and short descriptions.
Table A1. List of model parameters obtained from the literature.
ParameterValueUnitsDescriptionSource
ρ Pt 21,090 kg   m 3 Pt densityRef. [46]
ρ Pt OH 14,170 kg   m 3 Pt–OH densityCalc. from Ref. [46]
ρ Pt = O 14,100 kg   m 3 Pt=O densityRef. [46]
ρ C 2000 kg   m 3 Carbon support density-
σ Pt 2.73 J   m 2 Pt surface tensionRef. [46]
σ Pt OH 1.34 J   m 2 Pt–OH surface tensionCalc. from Ref. [46]
σ Pt = O 1 J   m 2 Pt=O surface tensionRef. [46]
M Pt 0.195 kg   mol 1 Pt molar massRef. [46]
M Pt OH 0.212 kg   mol 1 Pt–OH molar massCalc. from Ref. [46]
M Pt = O 0.211 kg   mol 1 Pt=O molar massRef. [46]
M C 0.012 kg   mol 1 Carbon molar mass-
M H 2 O 0.018 kg   mol 1 Water molar mass-
r Ox 30,000 J   mol 1 Pt oxide interactionRef. [46]
k rev 0.3-Pt oxidation reversibilityRef. [20]
Γ Pt 2.15 As   m 2 Pt surface site densityRef. [46]
Γ C 4.6 As   m 2 Carbon surface site densityRefs. [4,32]
c Pt 2 + , ref 1000 mol   m 3 Reference Pt 2 + concentrationRef. [46]
Table A2. List of model calibration parameters and their calibrated values.
ParameterValueUnitsDescription
k Pt 1 2.4744 nmol   m 2 s 1 Pt→Pt–OH reaction rate
k Pt 2 28,351 nmol   m 2 s 1 Pt–OH→Pt=O reaction rate
k Pt Dis 3.9306 nmol   m 2 s 1 Pt→Pt2+ reaction rate
k C 1 156.71 nmol   m 2 s 1 C→C–OH reaction rate
k C 2 392.56 nmol   m 2 s 1 C–OH→CO reaction rate
k PtC 12,422 nmol   m 2 s 1 CO2 production reaction rate
k CC 0.1786 nmol   m 2 s 1 C–OH→CO2 reaction rate
α Pt 1 0.3910-Pt→Pt–OH transfer coefficient
α Pt 2 0.5080-Pt–OH→Pt=O transfer coefficient
α Pt Dis 0.4792-Pt→Pt2+ transfer coefficient
α C 1 0.5290-C→C–OH transfer coefficient
α C 2 0.5031-C–OH→CO transfer coefficient
α PtC 0.5201-CO2 production transfer coefficient
α CC 0.5498-C–OH→CO2 transfer coefficient
Θ Pt init 0.1985-Initial free Pt surface
Θ Pt OH init 0.4181-Initial surface covered with OH
Θ C init 0.2068-Initial free C surface
Θ C OH init 0.1929-itial surface covered with OH

References

  1. Hart, D.; Lehner, F.; Jones, S.; Lewis, J.; Klippenstein, M. E4tech Fuel Cell Industry Review 2018; E4tech: London, UK, 2018. [Google Scholar]
  2. Pandy, A.; Yang, Z.; Gummalla, M.; Atrazhev, V.V.; Kuzminyh, N.Y.; Sultanov, V.I.; Burlatsky, S. A Carbon Corrosion Model to Evaluate the Effect of Steady State and Transient Operation of a Polymer Electrolyte Membrane Fuel Cell. J. Electrochem. Soc. 2013, 160, F972–F979. [Google Scholar] [CrossRef] [Green Version]
  3. Darling, R.; Meyers, J. Kinetic Model of Platinum Dissolution in PEMFCs. J. Electrochem. Soc. 2003, 150. [Google Scholar] [CrossRef]
  4. Bi, W.; Fuller, T.F. Modeling of PEM Fuel Cell Pt/C Catalyst Degradation. J. Power Sources 2008, 178, 188–196. [Google Scholar] [CrossRef]
  5. Reimer, U.; Schumacher, B.; Lehnert, W. Accelerated Degradation of High-Temperature Polymer Electrolyte Fuel Cells: Discussion and Empirical Modeling. J. Electrochem. Soc. 2014, 162, F153–F164. [Google Scholar] [CrossRef]
  6. Kim, J.; Kim, M.; Kang, T.; Sohn, Y.-J.; Song, T.; Choi, K.H. Degradation Modeling and Operational Optimization for Improving the Lifetime of High-Temperature PEM (Proton Exchange Membrane) Fuel Cells. Energy 2014, 66, 41–49. [Google Scholar] [CrossRef]
  7. Pohl, E.; Maximini, M.; Bauschulte, A.; vom Schloß, J.; Hermanns, R.T.E. Degradation Modeling of High Temperature Proton Exchange Membrane Fuel Cells Using Dual Time Scale Simulation. J. Power Sources 2015, 275, 777–784. [Google Scholar] [CrossRef]
  8. Tavčar, G.; Katrašnik, T. A Real Time Capable Quasi 3D System Level Model of PEM Fuel Cells. Fuel Cells 2020, 20, 17–32. [Google Scholar] [CrossRef]
  9. Kregar, A.; Tavčar, G.; Kravos, A.; Katrašnik, T. Predictive System-Level Modeling Framework for Transient Operation and Cathode Platinum Degradation of High Temperature Proton Exchange Membrane Fuel Cells. Appl. Energy 2020, 263, 114547. [Google Scholar] [CrossRef]
  10. Promislow, K.; Chang, P.; Haas, H.; Wetton, B. Two-Phase Unit Cell Model for Slow Transients in Polymer Electrolyte Membrane Fuel Cells. J. Electrochem. Soc. 2008, 155, A494. [Google Scholar] [CrossRef]
  11. Meyers, J.P.; Darling, R.M. Model of Carbon Corrosion in PEM Fuel Cells. J. Electrochem. Soc. 2006, 153, A1432. [Google Scholar] [CrossRef]
  12. Takeuchi, N.; Fuller, T.F. Modeling and Investigation of Design Factors and Their Impact on Carbon Corrosion of PEMFC Electrodes. J. Electrochem. Soc. 2008, 155, B770. [Google Scholar] [CrossRef]
  13. Macauley, N.; Papadias, D.D.; Fairweather, J.; Spernjak, D.; Langlois, D.; Ahluwalia, R.; More, K.L.; Mukundan, R.; Borup, R.L. Carbon Corrosion in PEM Fuel Cells and the Development of Accelerated Stress Tests. J. Electrochem. Soc. 2018, 165, F3148–F3160. [Google Scholar] [CrossRef]
  14. Malek, K.; Franco, A.A. Microstructure-Based Modeling of Aging Mechanisms in Catalyst Layers of Polymer Electrolyte Fuel Cells. J. Phys. Chem. B 2011, 115, 8088–8101. [Google Scholar] [CrossRef] [PubMed]
  15. Franco, A. A Physical Multiscale Model of the Electrochemical Dynamics in a Polymer Electrolyte Fuel Cell—An Infinite Dimensional Bond Graph Approach. Ph.D. Thesis, Université Claude Bernard Lyon, Villeurbanne, France, 2005. [Google Scholar]
  16. Redmond, E.L.; Setzler, B.P.; Alamgir, F.M.; Fuller, T.F. Elucidating the Oxide Growth Mechanism on Platinum at the Cathode in PEM Fuel Cells. Phys. Chem. Chem. Phys. 2014, 16, 5301–5311. [Google Scholar] [CrossRef]
  17. Borup, R.L.; Papadias, D.D.; Mukundan, R.; Spernjak, D.; Langlois, D.A.; Ahluwalia, R.; More, K.L.; Grot, S. Carbon Corrosion in PEM Fuel Cells during Drive Cycle Operation. Ecs Meet. Abstr. 2015. [Google Scholar] [CrossRef]
  18. Franco, A.A.; Coulon, R.; Ferreira de Morais, R.; Cheah, S.K.; Kachmar, A.; Gabriel, M.A. Multi-Scale Modeling-Based Prediction of PEM Fuel Cells MEA Durability under Automotive Operating Conditions. Ecs Trans. 2019, 25, 65–79. [Google Scholar] [CrossRef]
  19. Darling, R.M.; Meyers, J.P. Mathematical Model of Platinum Movement in PEM Fuel Cells. J. Electrochem. Soc. 2005, 152, A242. [Google Scholar] [CrossRef]
  20. Li, Y.; Moriyama, K.; Gu, W.; Arisetty, S.; Wang, C.Y. A One-Dimensional Pt Degradation Model for Polymer Electrolyte Fuel Cells. J. Electrochem. Soc. 2015, 162, F834–F842. [Google Scholar] [CrossRef] [Green Version]
  21. Ruckenstein, E.; Pulvermacher, B. Growth Kinetics and the Size Distributions of Supported Metal Crystallites. J. Catal. 1973, 29, 224–245. [Google Scholar] [CrossRef]
  22. Holby, E.F.; Sheng, W.; Shao-Horn, Y.; Morgan, D. Pt Nanoparticle Stability in PEM Fuel Cells: Influence of Particle Size Distribution and Crossover Hydrogen. Energy Environ. Sci. 2009, 2, 865–871. [Google Scholar] [CrossRef]
  23. Baroody, H.A.; Stolar, D.B.; Eikerling, M.H. Modelling-Based Data Treatment and Analytics of Catalyst Degradation in Polymer Electrolyte Fuel Cells. Electrochim. Acta 2018, 283, 1006–1016. [Google Scholar] [CrossRef]
  24. Urchaga, P.; Kadyk, T.; Rinaldo, S.G.; Pistono, A.O.; Hu, J.; Lee, W.; Richards, C.; Eikerling, M.H.; Rice, C.A. Catalyst Degradation in Fuel Cell Electrodes: Accelerated Stress Tests and Model-Based Analysis. Electrochim. Acta 2015, 176, 1500–1510. [Google Scholar] [CrossRef]
  25. Kregar, A.; Kravos, A.; Katrašnik, T. Methodology for Evaluation of Contributions of Ostwald Ripening and Particle Agglomeration to Growth of Catalyst Particles in PEM Fuel Cells. Fuel Cells 2020, 20, 487–498. [Google Scholar] [CrossRef]
  26. Kregar, A.; Tavčar, G.; Kravos, A.; Katrašnik, T. Predictive Virtual Modelling Framework for Performance and Platinum Degradation Modelling of High Temperature PEM Fuel Cells. Energy Procedia 2019, 158, 1817–1822. [Google Scholar] [CrossRef]
  27. Chandan, A.; Hattenberger, M.; El-kharouf, A.; Du, S.; Dhir, A.; Self, V.; Pollet, B.G.; Ingram, A.; Bujalski, W. High Temperature (HT) Polymer Electrolyte Membrane Fuel Cells (PEMFC)—A Review. J. Power Sources 2013, 231, 264–278. [Google Scholar] [CrossRef]
  28. House, J.E. Principles of Chemical Kinetics; Bibliyografya Ve Indeks; Wm. C. Brown; Academic Press; Elsevier: London, UK, 2007; ISBN 978-0-697-32881-6. [Google Scholar]
  29. Tavčar, G.; Katrašnik, T. An Innovative Hybrid 3D Analytic-Numerical Approach for System Level Modelling of PEM Fuel Cells. Energies 2013, 6, 5426–5485. [Google Scholar] [CrossRef] [Green Version]
  30. Tavčar, G.; Katrašnik, T. An Innovative Hybrid 3D Analytic-Numerical Model for Air Breathing Parallel Channel Counter-Flow PEM Fuel Cells. Acta Chim. Slov. 2014, 61, 284–301. [Google Scholar]
  31. Tavčar, G.; Katrašnik, T. A Computationally Efficient Hybrid 3D Analytic-Numerical Approach for System Level Modelling of PEM Fuel Cells. In Proceedings of the 5th European PEFC and H2 Forum 2015, Lucerne, Switzerland, 30 June–3 July 2015. [Google Scholar]
  32. Sanders, I.J.; Peeten, T.L. Carbon Black: Production, Properties, and Uses; Chemical Engineering Methods and Technology; Nova Science Publishers, Nova Press: Hauppauge, NY, USA, 2011; ISBN 978-1-61209-535-6. [Google Scholar]
  33. Cherstiouk, O.V.; Simonov, A.N.; Moseva, N.S.; Cherepanova, S.V.; Simonov, P.A.; Zaikovskii, V.I.; Savinova, E.R. Microstructure Effects on the Electrochemical Corrosion of Carbon Materials and Carbon-Supported Pt Catalysts. Electrochim. Acta 2010, 55, 8453–8460. [Google Scholar] [CrossRef]
  34. Bezmalinović, D.; Radošević, J.; Barbir, F. Initial Conditioning of Polymer Eelectrolyte Membrane Fuel Cell by Temperature and Potential Cycling. Acta Chim. Slov. 2015, 62, 83–87. [Google Scholar] [CrossRef] [Green Version]
  35. Tavčar, G.; Katrašnik, T. A Computationally Efficient Hybrid 3D Analytic-Numerical Approach for Modelling Species Transport in a Proton Exchange Membrane Fuel Cell. J. Power Sources 2013, 236, 321–340. [Google Scholar] [CrossRef]
  36. Tatschl, R.; Fink, C.; Tavčar, G.; Urthaler, P.; Katrašnik, T. A Scalable PEM Fuel Cell Modelling Approach to Support FCEV Component and System Development. In Proceedings of the 5th European Battery, Hybrid and Fuel Cell Electric Vehicle Congress, Geneva, Switzerland, 14–16 March 2017. [Google Scholar]
  37. Fink, C.; Fouquet, N. Three-Dimensional Simulation of Polymer Electrolyte Membrane Fuel Cells with Experimental Validation. Electrochim. Acta 2011, 56, 10820–10831. [Google Scholar] [CrossRef]
  38. Storn, R.; Price, K. Differential Evolution—A Simple and Efficient Heuristic for Global Optimization over Continuous Spaces. J. Glob. Optim. 1997, 11, 341–359. [Google Scholar] [CrossRef]
  39. The Mathworks, I., MATLAB Optimization Toolbox; The MathWorks: Matlab: Natick, MA, USA, 2018; Available online: https://www.mathworks.com/help/optim/ (accessed on 19 July 2021).
  40. Ziehn, T.; Tomlin, A.S. GUI–HDMR—A Software Tool for Global Sensitivity Analysis of Complex Models. Environ. Model. Softw. 2009, 24, 775–785. [Google Scholar] [CrossRef]
  41. Cherevko, S.; Keeley, G.P.; Geiger, S.; Zeradjanin, A.R.; Hodnik, N.; Kulyk, N.; Mayrhofer, K.J.J. Dissolution of Platinum in the Operational Range of Fuel Cells. ChemElectroChem 2015, 2, 1471–1478. [Google Scholar] [CrossRef] [Green Version]
  42. Kay, S.M. Fundamentals of Statistical Signal Processing: Estimation Theory; Prentice-Hall, Inc.: Upper Saddle River, NJ, USA, 1993; ISBN 0-13-345711-7. [Google Scholar]
  43. Kravos, A.; Ritzberger, D.; Hametner, C.; Jakubek, S.; Katrašnik, T. Methodology for Efficient Parametrisation of Electrochemical PEMFC Model for Virtual Observers: Model Based Optimal Design of Experiments Supported by Parameter Sensitivity Analysis. Int. J. Hydrogen Energy 2021, 46, 13832–13844. [Google Scholar] [CrossRef]
  44. Kravos, A.; Ritzberger, D.; Tavcar, G.; Hametner, C.; Jakubek, S.; Katrašnik, T. Thermodynamically Consistent Reduced Dimensionality Electrochemical Model for Proton Exchange Membrane Fuel Cell Performance Modelling and Control. J. Power Sources 2020, 454, 227930. [Google Scholar] [CrossRef]
  45. Multi-Year Research, Development, and Demonstration Plan, Section 3.4 Fuel Cells; Fuel Cell Technologies Office U.S. DOE: Washington, DC, USA, 2016.
  46. Strahl, S.; Husar, A.; Franco, A.A. Electrode Structure Effects on the Performance of Open-Cathode Proton Exchange Membrane Fuel Cells: A Multiscale Modeling Approach. Int. J. Hydrogen Energy 2014, 39, 9752–9767. [Google Scholar] [CrossRef] [Green Version]
Figure 1. Fuel cell test bench that was used for the experiments.
Energies 14 04380 g001
Figure 2. Comparison of transient concentration values obtained by the experiment and with the calibrated model for (a) AST No.1, (b) AST No.2, and (c) AST No.3.
Energies 14 04380 g002
Figure 3. FIM values of the globally calibrated model (1— k Pt 1 , 2— k Pt 2 , 3— k Pt Dis , 4— k C 1 , 5— k C 2 , 6— k PtC , 7— k CC , 8— α Pt 1 , 9— α Pt 2 , 10— α Pt Dis , 11— α C 1 , 12— α C 2 , 13— α PtC , 14— α CC , 15— Θ Pt i n i t , 16— Θ Pt OH i n i t , 17— Θ C i n i t , 18— Θ C OH i n i t ).
Energies 14 04380 g003
Table 1. Upper and lower potential limit (Uupper, Ulower), as well as hold times (tupper, tlower), of the conducted ASTs.
AST No.Uupper (V)Ulower (V)tupper (min)tlower (min)Number of Cycles
10.950.60.50.520
25520
350.520
Table 2. RMSD values obtained with calibration performed on a single data set and all three data sets at once.
AST No.RMSD1RMSD3
10.35870.3959
20.40280.4541
30.70752.1347
Publisher’s Note: MDPI stays neutral with regard to jurisdictional claims in published maps and institutional affiliations.

