
Chemical Characterization of Microcystis aeruginosa for Feed and Energy Uses
by
 , , , and
Larissa Souza Passos
1,† ,
,
Éryka Costa Almeida
1,†,
Claudio Martin Pereira de Pereira
2,
Alessandro Alberto Casazza
3,* ,
,
Attilio Converti
3 and
Ernani Pinto
1,4,5
1
Department of Clinical and Toxicological Analysis, Faculty of Pharmaceutical Sciences, University of São Paulo (USP), Av. Prof. Lineu Prestes 580, Bl. 17, São Paulo 05508-900, Brazil
2
Center for Chemical, Pharmaceutical and Food Sciences, Bio-Forensic Research Group, Federal University of Pelotas (UFPel), Pelotas 96010-900, Brazil
3
Department of Civil, Chemical and Environmental Engineering, Pole of Chemical Engineering, Università degli Studi di Genova (UNIGE), via Opera Pia 15, I-16145 Genova, Italy
4
Center of Nuclear Energy in Agriculture (CENA), University of São Paulo (USP), Av. Centenário, 303–Piracicaba, São Paulo 13416-000, Brazil
5
Food Researc-h Center (FoRC–CEPID), University of São Paulo (USP), Rua do Lago, 250, Ed. Semi Industrial, bloco C, São Paulo 05508-080, Brazil
*
Author to whom correspondence should be addressed.
†
These authors contributed equally to this work.
Energies 2021, 14(11), 3013; https://doi.org/10.3390/en14113013
Submission received: 24 February 2021
/
Revised: 12 May 2021
/
Accepted: 17 May 2021
/
Published: 23 May 2021
(This article belongs to the Special Issue Valorisation of Wastes: Environmental Sustainability and Production of Biofuels by Advanced Technologies)
Abstract
:Cyanobacterial blooms and strains absorb carbon dioxide, drawing attention to its use as feed for animals and renewable energy sources. However, cyanobacteria can produce toxins and have a low heating value. Herein, we studied a cyanobacterial strain harvested during a bloom event and analyzed it to use as animal feed and a source of energy supply. The thermal properties and the contents of total nitrogen, protein, carbohydrate, fatty acids, lipid, and the presence of cyanotoxins were investigated in the Microcystis aeruginosa LTPNA 01 strain and in a bloom material. Microcystins (hepatotoxins) were not detected in this strain nor in the bloom material by liquid chromatography coupled to mass spectrometry. Thermogravimetric analysis showed that degradation reactions (devolatilization) initiated at around 180 °C, dropping from approximately 90% to 20% of the samples’ mass. Our work showed that despite presenting a low heating value, both biomass and non-toxic M. aeruginosa LTPNA 01 could be used as energy sources either by burning or producing biofuels. Both can be considered a protein and carbohydrate source similar to some microalgae species as well as biomass fuel. It could also be used as additive for animal feed; however, its safety and potential adverse health effects should be further investigated.
1. Introduction
Several examples in the literature show that some cyanobacteria species are used to produce energy, such as biodiesel or hydrogen gas (H2) generation, high added value inputs, or feed for animals [1,2,3]. However, such studies consider isolated species and strains of non-toxic cyanobacteria grown in bench-scale photobioreactors [4,5,6]. Some species are suitable for dense cultivation to directly fix carbon dioxide (CO2) and produce cell biomass [7]. Studies on the use of cellular material in blooms are scarce, mainly due to the risk of cyanotoxins’ presence [8,9]. Nonetheless, some cyanobacteria strains, for example, the LTPNA 01, LTPNA 03, LTPNA 05, and CCIBt3106 strains of the Microcystis aeruginosa species, do not produce cyanotoxins [10,11]. Jacinavicius et al. [10] suggest that without the extra cost of synthesizing microcystins, such non-toxic strains could invest in nutrient reserves.
There is a huge amount of cell biomass in the water body during cyanobacterial blooms that could be used somehow. In lakes and water reservoirs, mainly for human supply, blooms are a major problem, as this biomass has to be removed in water treatment plants, increasing costs and requiring the use of chemicals [12].
The options for the treatment and removal of cyanobacterial biomass during blooms generally use oxidizing agents such as hydrogen peroxide, potassium permanganate, or flocculating agents for the subsequent decantation of cell material at the bottom of the reservoir [13]. The procedures used to treat blooms’ episodes do not include biomass use; they are only aimed at its elimination or phase transfer.
The number of cyanobacterial cells per milliliter can reach millions and the total cell mass, many tons, depending on the reservoir area [14,15]. Some studies have shown that biomass can be used as an energy source or to produce active metabolites and fractionated material containing carbohydrates, proteins, and polyunsaturated fatty acids of food and pharmaceutical interest [16]. Microcystis spp. biomass has been suggested as a protein source for animal feed due to its high availability and protein content. This biomass use could reduce the dependence on soy and other crops that affect and degrade terrestrial ecosystems [9]. For animal feed production, the food source needs to have specific chemical and biochemical properties, such as fatty acids, proteins, carbohydrates, lipids, antioxidants, vitamins, ash, and carotenoids [17,18]. Performing this characterization is the basis for understanding the potential candidate for feed production.
Therefore, in this study, a reservoir sample was used, containing a non-toxic strain (LTPNA 01) of the cyanobacterial species M. aeruginosa isolated from a bloom episode and investigated for possible exploitation. For this purpose, it has been hypothesized that this strain would have biotechnological potential to be used as a source of animal feed and energy.
2. Materials and Methods
2.1. Cyanobacterial Bloom Sampling, Cyanobacteria Isolation, and Microorganism Identification
Bloom samples were collected from the Salto Grande Reservoir margins (Americana city, São Paulo State, Brazil, 22°42’07.2’’ S 47°16’05.4’’ W; 530 m above the sea level). A 20-mm phytoplankton net was used to concentrate the samples when necessary. Unicellular strains were isolated and grown in ASM−1 medium with 1% agar, a photoperiod of 12 h light and 12 h dark, 50 μmol photons m−2 s−1, and temperature of 25 °C in the Laboratory of Toxins and Natural Products of Algae and Cyanobacteria (LTPNA). Bortoli et al. [11] identified and described the strain Microcystis aeruginosa LTPNA 01. Samples of this strain were collected at the end of the exponential growth phase between days 20 and 25. Then, 250 mL of the bloom material and the strain Microcystis aeruginosa LTPNA 01 were centrifuged, lyophilized, and stored in a −20 °C freezer until analysis.
The lyophilized samples (10 mg) were extracted for 15 min with 75% methanol by vortexing and sonicating in an ice bath. Then, the samples were centrifuged for 15 min (10,000 g), and the supernatants were removed and centrifuged again for 5 min before LC-MS/MS analysis (see Section 2.10 for detailed description).
2.2. Determination of Ash
The determination of the ash content was performed based on Gressler et al. [19] and according to AOAC [20] procedure. An electric oven (Robertshaw, Pyrotec, São Paulo, SP, Brazil) was used to turn the freeze-dried materials of both bloom and culture samples into ashes by heating them at 500 °C for five hours. Ash content was quantified gravimetrically.
2.3. Total Lipid Content
The lipid content was extracted according to Sanchez-Machado et al. [21]. The lyophilized samples (500 mg) were added to chloroform and methanol (2:1) in a Pyrex® tube. After 2 min vortexing, the extract was filtered in a Whatman 41 paper, and the residue was re-extracted with the same solvents (5 mL and 30 s vortexing). The extract was filtered again in a Whatman 41 paper; the two filtrates were combined and dried under a nitrogen flow. For each lipid extract, the determination of total lipids was performed gravimetrically in triplicate.
2.4. Fatty Acid Composition of Cyanobacterial Samples
The extraction and analysis of the fatty acid composition were based on the procedures described in Gressler et al. [19], AOAC 996.06 [20], and AOCS Ce 1 h-05 [22]. The analyses were performed using a QP2010 Plus gas chromatograph coupled to mass spectrometry (GC-MS/MS) (Shimadzu, Kyoto, Japan), with a capillary column of fused silica SP-2560, 100 m (0.25 μm film) (Supelco, Bellefonte, PA, USA). The standard Fatty Acid Methyl esters (lipids Supelco standards 18 919) were butyric, capric, caprylic, lauric, myristic, palmitic, stearic, arachidic, and lignoceric acids; C 14:1n-5cis; C 15:1n-5cis; C 16: 1n-7cis; C 17:1n-7cis; C 18:1n-9cis; C 20:1n-9cis; 22:1n-9cis; C 24:1n-9cis; C 18:2n-6cis; C 18: 3n-3cis; C 18:3n-6cis; C 18:4n-3cis; C 20:2n-6cis; C 20:3n-6cis; C 20:3n-3cis; C 20:4n-6cis; C 20: 5n-3cis; C 22:2n-6cis; C 22:6n-3cis; C 18:1n-9trans; and C 18: 2n-6trans.
2.5. Determination of Total Carbohydrates
Total carbohydrates were measured based on the phenol-sulfuric acid method described by Dubois et al. [23]. Freeze-dried samples of both Microcystis bloom and cultured material (5 mg) were extracted with ultrapure water (10 mL) and submitted to ultrasound for 2 min. Cold ethanol (1 mL, −20 °C) was added to 1 mL of the water extract to precipitate proteins. The supernatant (1 mL) was centrifuged for 10 min (11,180× g) and filtered through a membrane with 0.44 µm pore diameter. The filtered solutions were dried (Speedvac®, for 10 min, at room temperature), and the solid material was dissolved in 0.2 mL of 5% phenol solution, which was followed by adding 1 mL of concentrated sulfuric acid and shaking the mixture for 30 min. The absorbance was measured at 490 nm and used to quantify polysaccharides based on the glucose standard curve. A calibration curve was obtained by measuring the absorbances of six glucose solutions with concentrations varying from 10 to 100 µg/mL. The total carbohydrate content of each sample was determined in triplicate, and the results were shown as average ± standard deviation.
2.6. Determination of Total Protein
A modified method was based on the classical protein determination procedure described by Bradford [24]. Soluble protein determination was performed using a Bio-Rad (Hercules, CA, USA) protein assay kit adapted for a 96-well plate, and absorbance measurements were taken at λ = 595 nm. A calibration curve was prepared using solutions of BSA in ultrapure water with concentrations varying from 0.1 to 300 g/L. A UV mini-1240 UV-vis spectrophotometer (Shimadzu, São Paulo, SP, Brazil) was used. Samples were prepared with both bloom and cultured material. Soluble proteins were extracted based on the procedure described by Gressler et al. [19]. First, 10 mg of freeze-dried samples were extracted for soluble protein, and then, centrifugation was performed (15 min at 5000 × g at 4 °C). Subsequently, 760 µL of distilled water and 200 µL of Bio-Rad dye were added to the supernatant to obtain a concentration of 4 µg/μL. Then, a 100 µL portion of this solution was transferred to a 96-well plate, and absorbance measurements were carried out. The soluble protein in each sample was determined in triplicate, and the results were shown as average ± standard deviation.
2.7. Determination of Total Nitrogen
The protocol recommended by the Association of Official Analytical Chemists 976.06 and Kjeldahl method [25] were employed to determine crude proteins, named herein as total nitrogen. Total nitrogen was determined using 25 mg of either sample. The protein content of the biomass was determined according to the AOAC [26] method 976.06, the nitrogen content was multiplied by a factor of 6.25, and the results were shown as average ± standard deviation (n = 3).
2.8. Differential Scanning Calorimetry (DSC)
A differential scanning calorimetry equipment (Shimadzu, model DSC-50, Japan) was used to determine the reaction heat by heat flux (QDSC) data, measuring the temperature from 23.38 ± 0.10 °C (room temperature) to 600 °C. Synthetic air (20.00 ± 0.05% oxygen and 80.00 ± 0.05% nitrogen; White Martins, Rio de Janeiro, RJ, Brazil) was used as oxidizing gas at a flow rate of 50 mL/min. The heating rates (β) used were 2.5, 5, and 10 °C/min, and the acquisition rate was 12 samples per min. An initial sample mass of 3.14 ± 0.14 mg was placed in a 6 × 1.5 mm aluminum crucible with a 1 mm pierced lid for each run.
2.9. Thermogravimetric Analysis (TGA)
A thermogravimetric analyzer (readability of 0.001 mg) was used to obtain TGA and DTG curves (model TGA-50, Shimadzu, Kyoto, Japan). The same flow rates, oxidizing gas, heating, and acquisition were used for the Differential Scanning Calorimetry (DSC) analysis. For each run, an initial sample mass of 3.121 ± 0.273 mg was placed in an 8 µL alumina pan. The TGA/DTG curves were modified by transport phenomena effects using heating rates higher than 10 °C/min [27].
2.10. Detection of Microcystins by LC-MS/MS
The obtained extracts were analyzed for the detection of microcystins, using a liquid chromatograph (Shimadzu Prominence, Kyoto, Japan) coupled to a high-resolution Quadrupole/Time-of-Flight (QTOF) mass spectrometer (MicroTOF QII, Bruker Daltonics, MA, USA), with electrospray ionization in positive mode (LC-MS/MS). The chromatographic column used in the separation was Fusion-RP (4 mm, 150 × 2.0 mm; Phenomenex, Torrance, CA, USA). The mobile phases used were 5 mmol/L of ammonium formate and 0.1% formic acid (A) and acetonitrile (B). The conditions of the ionization source applied were flow rate of 200 μL/min; linear elution gradient of 10 to 60% in B in 30 min; gas temperature and nitrogen flow of 200 °C and 5 mL/min, respectively; nebulizer pressure 35 psi; capillary voltage of 3500 V, and nozzle voltage of 500 V. The analyses were performed according to the methods of Bortoli et al. [11].
2.11. Pigment Extraction from Biomass and Cell Cultures
Extractions for pigment analyses were performed according to Sigaud-Kutner et al. [28], with some adjustments, in a liquid chromatograph LC-10AD (Shimadzu) equipped with an auto-injector SIL-10A (Shimadzu), a photodiode detector SPD-M10AV (Shimadzu), and a system controller CBM-10A (Shimadzu). The software class-LC10 recorded and integrated the detector signal. The analytical standards of the pigment chlorophyll-a, and the carotenoids myxoxanthin, echinenone, and β-carotene were acquired from DHI (Hørsholm, Denmark). The separation of pigments in the samples was performed in a Hibar LiChrosorb RP-18 column (250 mm × 4 mm; particle size 5 µm; Merck, São Paulo, Brazil), with a precolumn guard RP-18 (particle size 5 µm, Supelco, São Paulo, Brazil).
2.12. Statistical Analyses
The Shapiro–Wilk test was used to check the normality of the data. Subsequently, the Student’s t-test was performed to compare the data of M. aeruginosa and bloom material. The analyses were performed using the SigmaPlot software version 12.5, and statistical differences were considered when p ≤ 0.05.
3. Results
3.1. Microcystis Aeruginosa LTPNA 01 Growth Curve
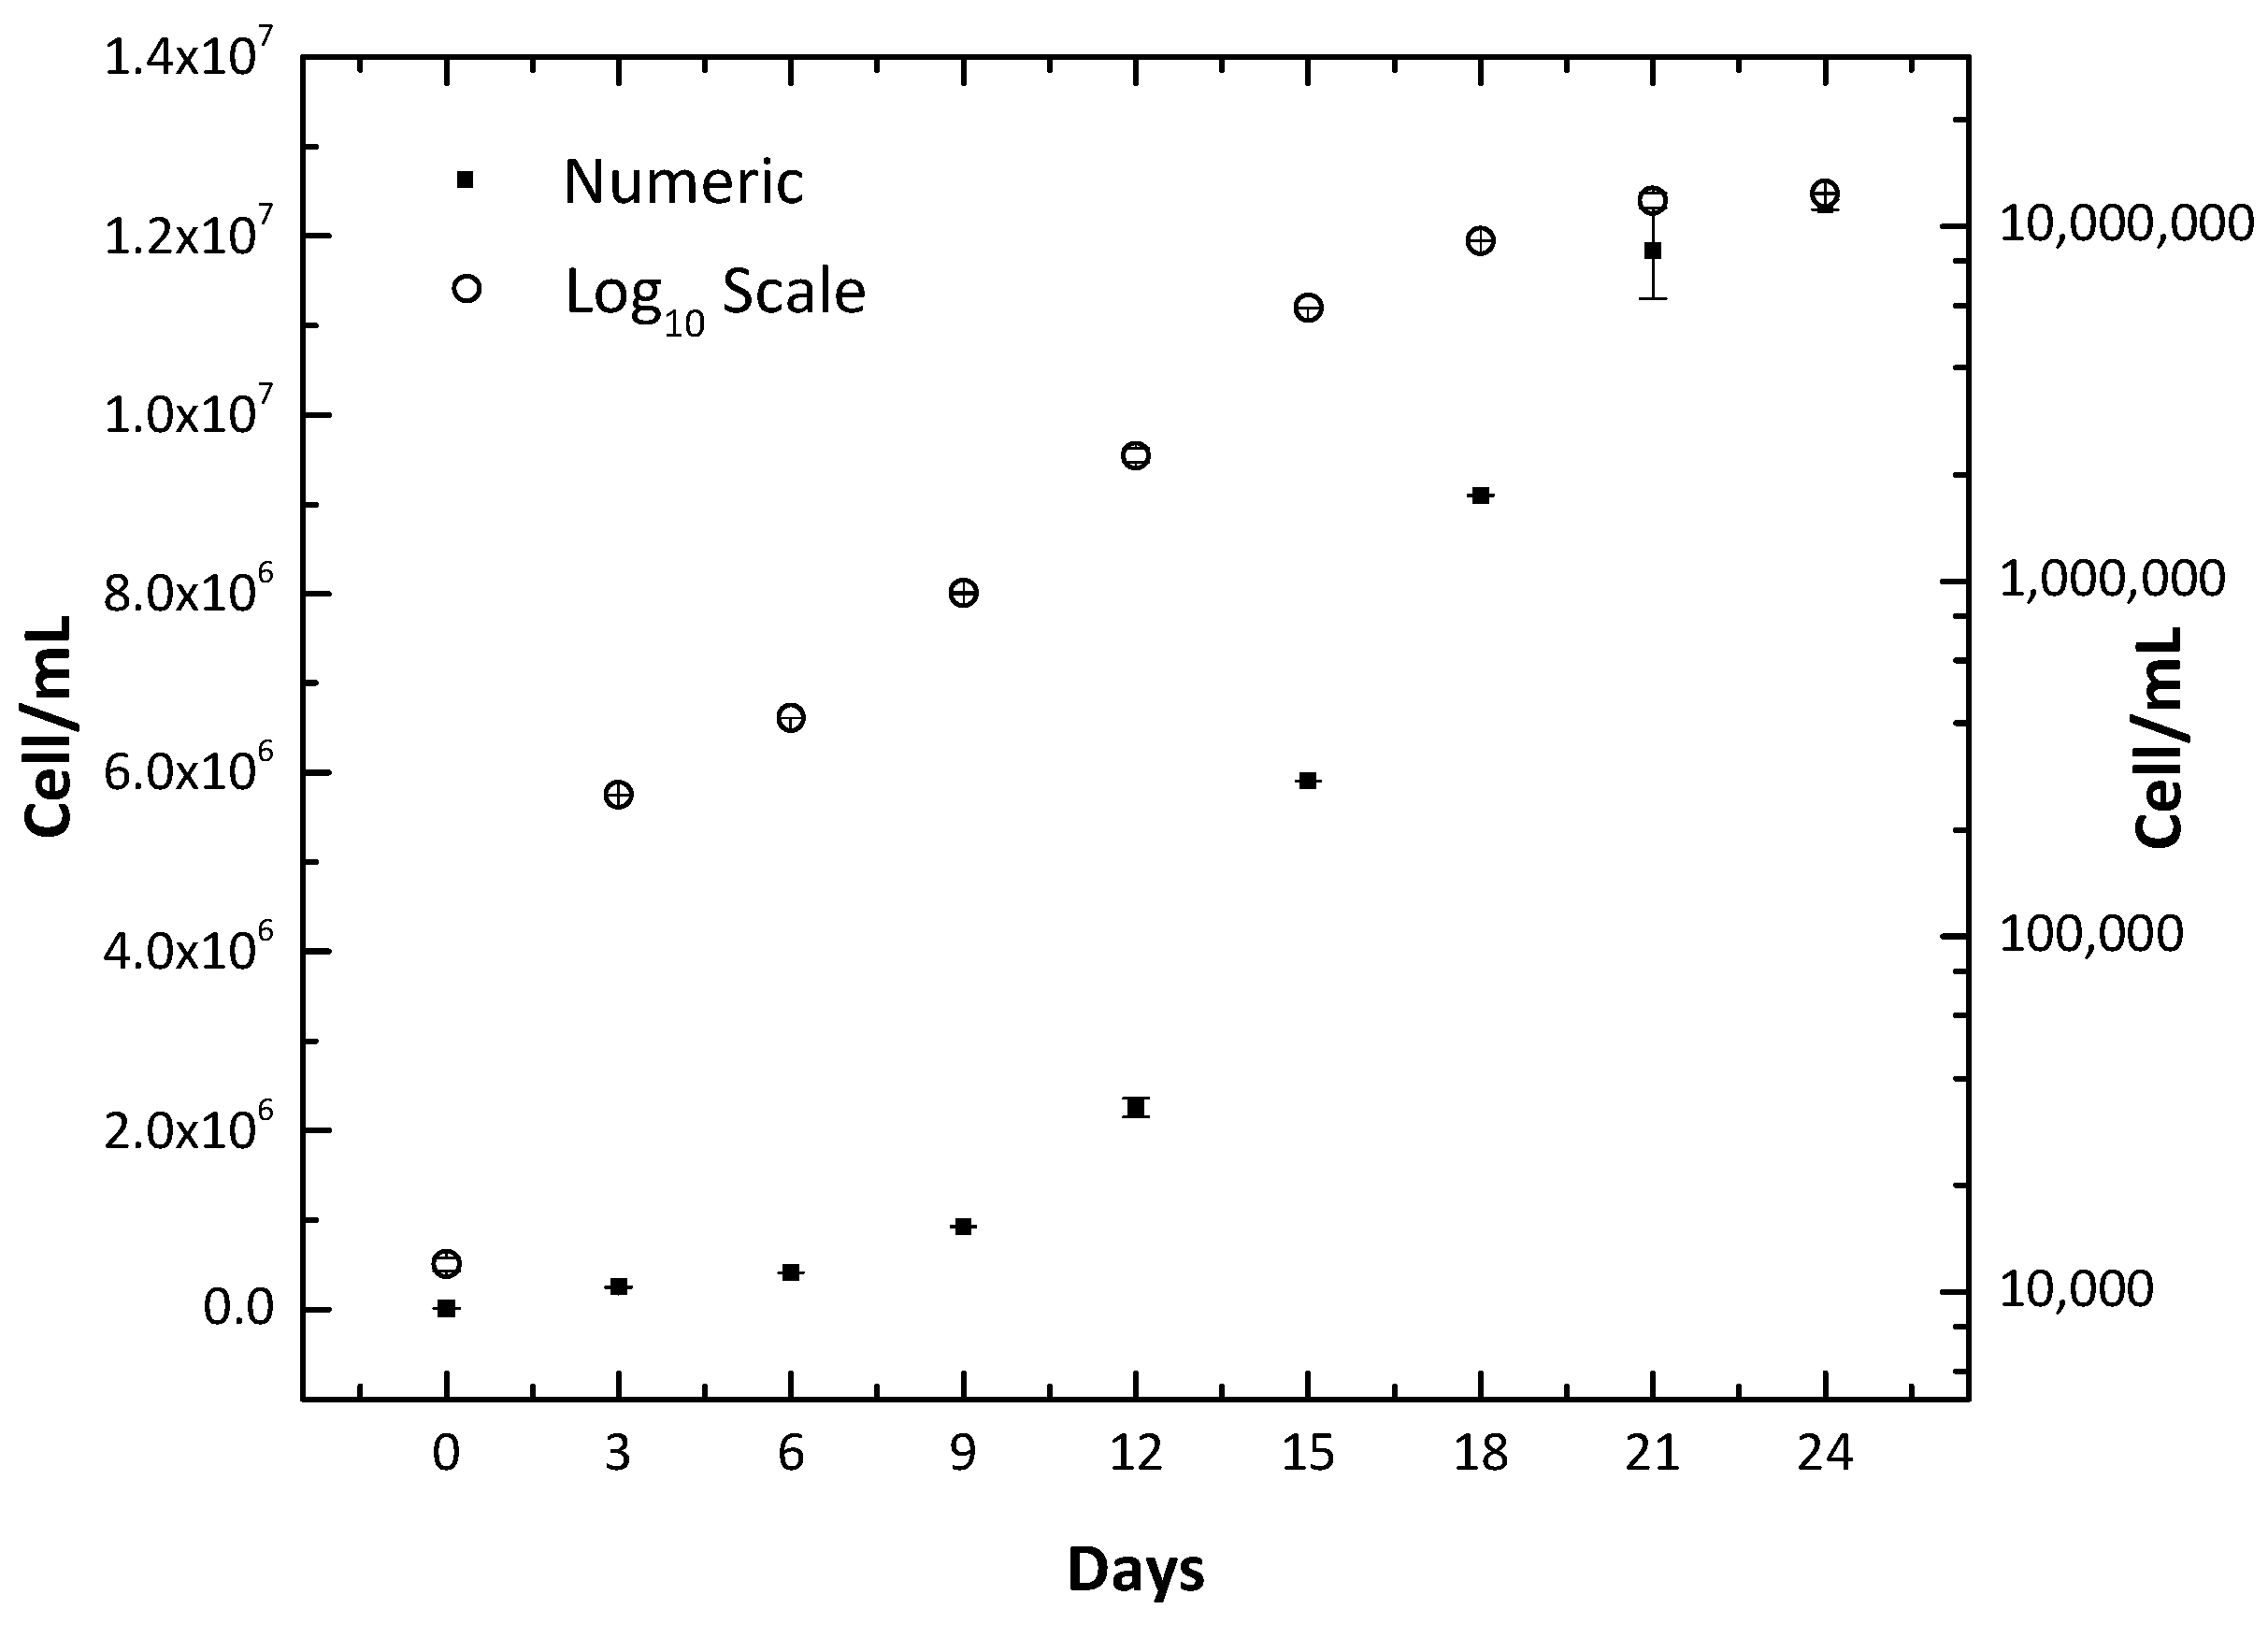
The cyanobacterial strain LTPNA 01 initiated its logarithmic growth on the third day of cultivation. This phase lasted until the 24th day, approximately 1.2 × 10⁷ cells/mL. The numeric and logarithmic growth curves are illustrated in Figure 1.
3.2. Nutrients and Ash of Microcystis Aeruginosa LTPNA 01 and Bloom Material
Lipids, carbohydrates, and ash were higher for the bloom material than for M. aeruginosa LTPNA 01 (p = 0.02; p ≤ 0.001; p ≤ 0.001, respectively). Nitrogen (p = 0.85) and proteins (p = 0.33) did not show significant differences between the two samples. The data are shown in Table 1.
3.3. Fatty Acid Composition of Cyanobacterial Samples
The content of saturated fatty acids (FA) was on average 7.5 g/kg (0.75%) for LTPNA 01 and 11.8 g/kg (1.18%) for bloom material; there was no significant difference between the two samples (p = 0.55). The monosaturated fatty acids in the bloom samples were approximately seven times higher than for LTPNA 01. The polyunsaturated fatty acids showed values of 0.22 and 0.24% for LTPNA 01 and bloom, respectively, with no statistically significant difference (p = 0.25). The content of trans fatty acids was 0.01 and 0.06% for LTPNA 01 and bloom, respectively. The data are shown in Table 2.
3.4. Thermogravimetric Analyses (TGA)
For both Microcystis LTPNA 01 and the bloom sample, the weight loss during thermogravimetric analysis (TGA) started at 50 °C due to water evaporation (Figure 2). The dehydration process lasted until approximately 180 °C. In the derivative of the thermogravimetric (DTG) curves, this stage presented one and two peaks for the strain LTPNA 01 and the bloom sample, respectively. Above 100/150 °C up to 200/250 °C, no significant mass release was recorded. The degradation reactions (devolatilization) initiated at around 180 °C, accounting for approximately 90 to 20% of sample mass. The DTG curve for the LTPNA 01 strain (Figure 2A) was characterized by the formation of one well-defined peak, followed by two “shoulders” and the other two well-defined peaks. The bloom sample DTG curve (Figure 2B) was characterized by the formation of two “shoulders” and one well-defined peak. These responses may indicate that the reaction time was not enough for a correct representation of the complex thermal decomposition of cyanobacterial biomass. At 400 °C, the decomposition process started, and the weight loss was smaller, accounting for about 10% of samples’ mass at 600 °C. Samples DTG curves presented small peaks (almost imperceptible for the bloom sample) in this phase.
3.5. Pigments from Biomass and Cell Cultures
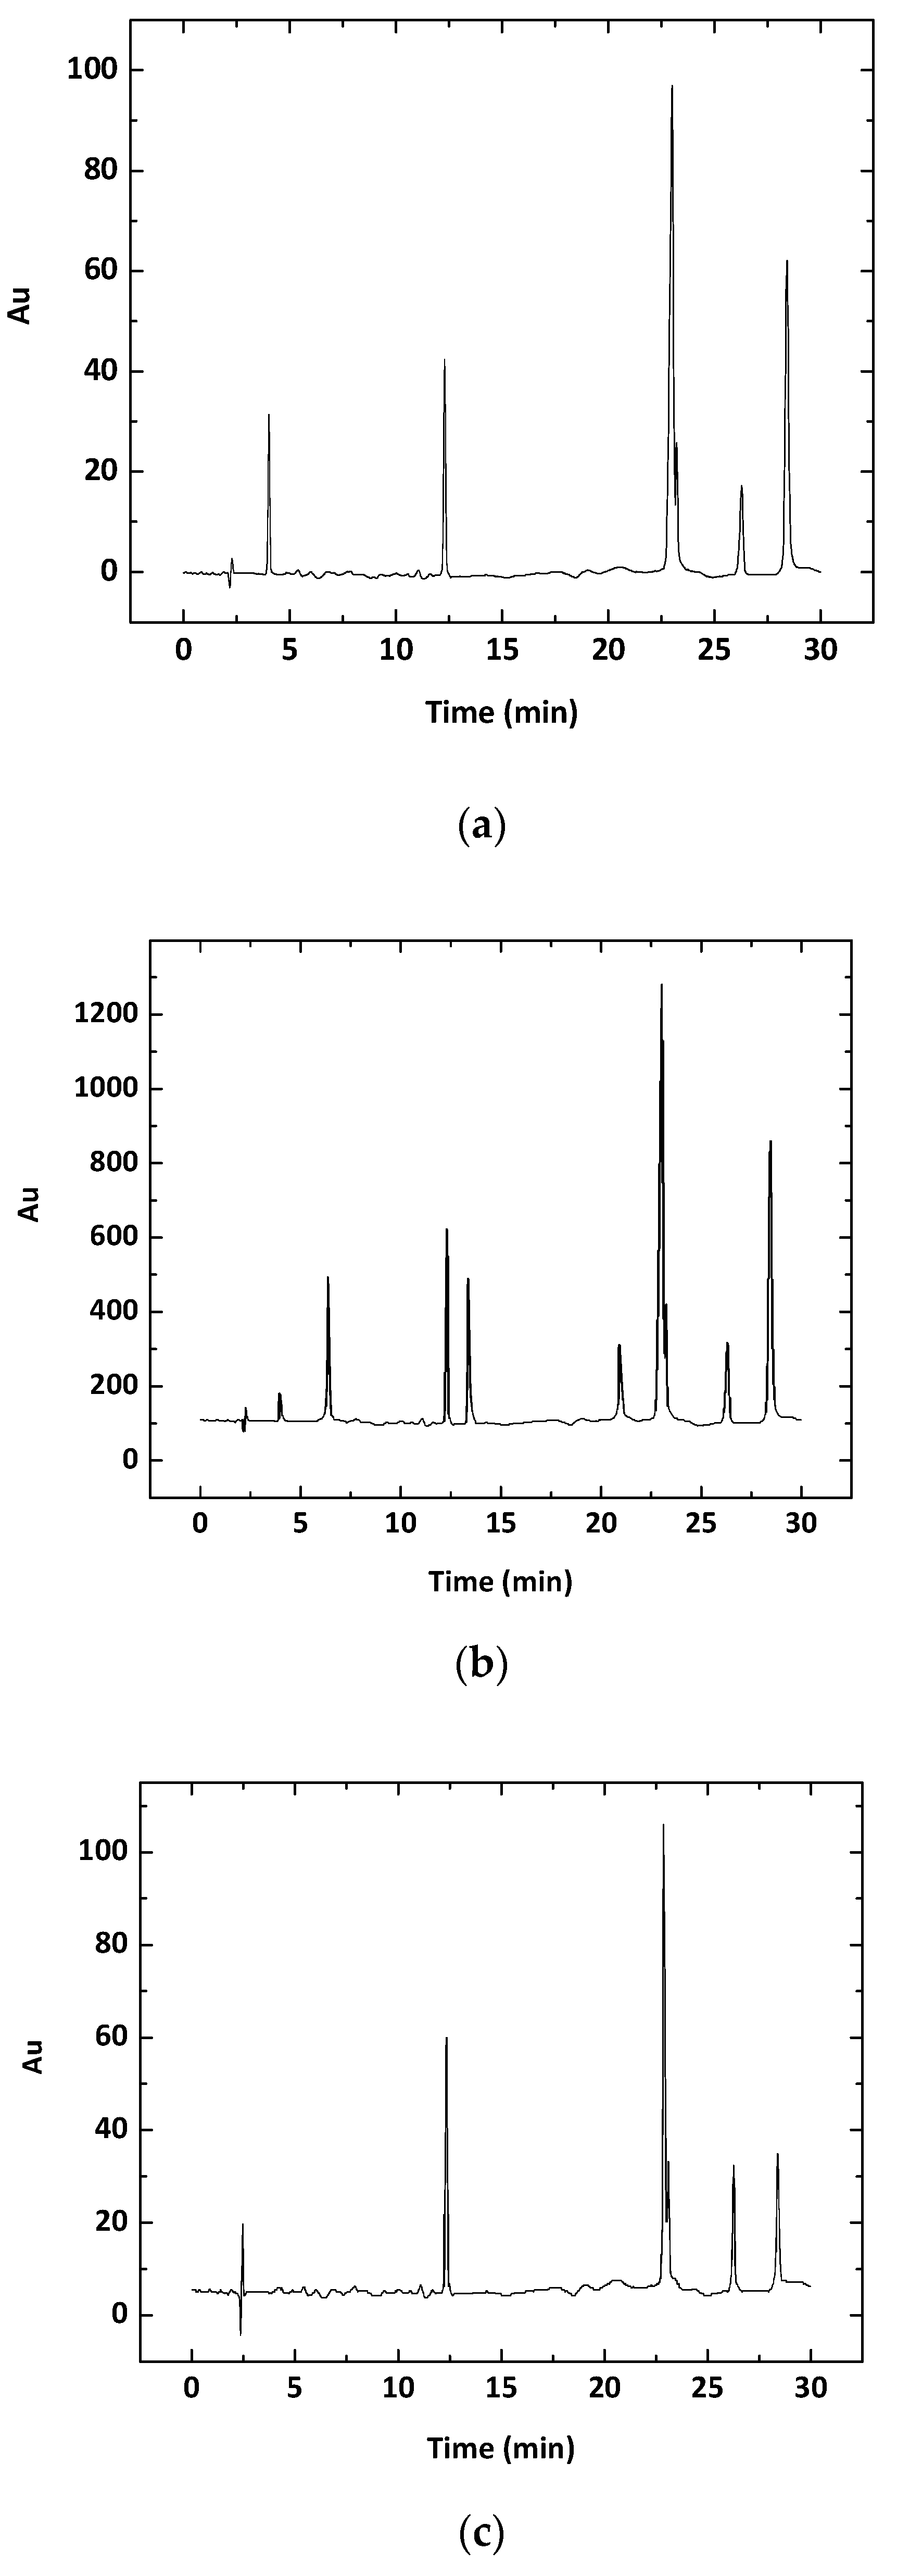
Liquid chromatography (LC) showed the presence of the photosynthetic pigments mixoxanthin (12.29 min), chlorophyll-a (13.02 min), echinenone (26.32 min), and β-carotene (28.44 min) in both the strain LTPNA 01 and the bloom material (Figure 3). Table 3 lists the pigment contents by dry weight (nmol/g of DW) in both LTPNA 01 and bloom, all showing significant differences: myxoxanthin (p = 0.02), Chl-a (p ≤ 0.001), echinenone (p = 0.002), and β-Car (p ≤ 0.001).
3.6. Detection of Microcystins by Liquid Chromatography Coupled to Mass Spectrometry (LC-MS/MS)
No microcystins were detected in both Microcystis LTPNA 01 and the bloom sample.
4. Discussion
Marine and freshwater algae have been extensively studied for energy production. For example, green algae are widely used to produce biofuels due to the many benefits they offer, including mitigating the greenhouse effect [29]. This feature also applies to cyanobacteria, as numerous studies have shown the biotechnological potential of their biomass for energy production and their bioactive compounds in the pharmaceutical and food industries [30,31,32]. One of the concerns with cyanobacteria is their ability to produce toxic substances, called cyanotoxins, which are pharmacologically classified as neurotoxins, hepatotoxins, cytotoxins, and toxins that irritate by contact (lipopolysaccharides) [33]. One of the best-known toxins is microcystin produced by some strains of the species Microcystis aeruginosa. However, this toxin was not detected through LC-MS/MS analysis either in the M. aeruginosa LTPNA 01 strain used in this work or the bloom collected in the field. In addition, in a previous study, no genes expressing the production of microcystins (i.e., mycs genes) were found in this strain. The mycs’ genes were analyzed by RT-PCR according to Risseti [34] (Doctoral Thesis) protocols. Details of how the microcystin genes involved in its biosynthesis were detected and data are presented in the Doctoral Thesis of Dr. Carolina Hoff Risseti cited herein (https://teses.usp.br/teses/disponiveis/64/64133/tde-18012013-142454/en.php).
Lipids, proteins, carbohydrates, ashes, and moisture are mainly found in the chemical composition of algae and cyanobacteria. According to Kim et al. [29], these compounds’ concentration will depend on the species and the culture conditions (i.e., temperature, light, and nutrients). In general, our results show good quality and quantity of fatty acids, proteins, and carbohydrates, indicating a potential biotechnological use. They also corroborate with the investigation performed by Chen et al. [9], in which the biomass of Microcystis spp. showed a potential nutritional value (e.g., carbohydrates, proteins, fatty acids, lipids, pigments, antioxidants, vitamins, and minerals). According to Der Poel et al. [17], nutritional levels (e.g., fatty acids, proteins, carbohydrates, lipids, ash, and carotenoids) must be characterized to identify a potential candidate for the production of feed. In our work, it was possible to characterize these chemical and biochemical properties in the cyanobacterial biomass and the LTPNA 01 strain. Therefore, given their nutritional composition and the absence of microcystins in samples, they may be recommended for use as an additive in animal feed (especially for small ruminant animals,), thus contributing to their nutritional supply (e.g., lipids, ash, proteins, and carbohydrates) [35,36]. In a recent study, the addition of increasing doses of marine microalgae (Schizochytrium) meal up to 6% of the total diet in Ile de France lambs was evaluated [37]. The authors observed a reduction in some of the animal’s parameters (dry matter intake, performance, and feeding efficiency) and increased meat lipid oxidation. However, there was also an improvement in meat quality (increased concentrations of some fatty acids and reduced level of total cholesterol), confirming that marine microalgae meal could be used as feed ingredient for meat quality and livestock production. Therefore, even the non-toxic M. aeruginosa (from the bloom and LTPNA 01 strain) could exhibit these features, even though biomass doses still need to be further investigated to confirm their potential use.
The pigments found in good percentages in both samples (mixoxanthin, chlorophyll-a, echinenone, and β-carotene) are fundamental for the organism’s functioning, including photosynthetic processes. Proteins are also essential for algae and cyanobacteria, as they are involved in various processes in these organisms, such as growth, repair, and cell maintenance, acting in the defense against invaders, and functioning as chemical messengers. Therefore, it is crucial to have a protein content that guarantees all cellular functionalities [38]. However, the protein content in the strain LTPNA 01 (14.38%) or the bloom (15.07%) was lower than the values found in the filamentous cyanobacteria Arthrospira platensis (61.70%) [38] and the green microalgae Chlamydomonas reinhardtii wild type (47.4%), C. reinhardtii CW15 + (45.7%), and Chlorella vulgaris (54.9%) [39].
In addition to needing light, carbon, and water for photosynthetic processes, algae and cyanobacteria need inorganic nutrients (i.e., nitrogen, phosphorus, and potassium) for various metabolic functions, such as essential biomolecules reproduction and synthesis including cellular proteins. Thus, the nitrogen concentration is proportional to the protein content, since it is part of the amino acid composition. The nitrogen content in the strain LTPNA 01 (4.25%) and the bloom (4.23%) was lower than the values found in A. platensis (10.38%) [38], C. reinhardtii wild type (10.7%), and C. reinhardtii CW15 + (11.1%), and C. vulgaris (6.7%) [39]. The carbohydrate content in the strain LTPNA 01 (34.66%) was similar to the value found in A. platensis (30.78%) [38] and higher than C. vulgaris (20.99%) [40], which are both lower than the bloom sample (48.64%).
The total contents of lipids in the LTPNA 01 strain (2.60%) and the bloom material (3.22%) were close to the value reported by Almeida et al. [38] for C. vulgaris (3.22%) but higher than those found in A. platensis (0.8–1.15%) [38,40] and the microalgae Monoraphidium sp. [41]. However, Kebelmann et al. [39] found higher values of lipid content in C. reinhardtii wild type (18.1%), C. reinhardtii CW15 + (22.4%), and C. vulgaris (15.5%). Such a great variability should undoubtedly be ascribed to the different culture conditions, since it is known that the lipid content in microalgae increases considerably under conditions of nitrogen shortage or environmental stress [42,43]. According to Almeida et al. [38], the low content of lipids in microalgae may be inappropriate for producing biofuels through the transesterification process of fatty acids, which is the most common process studied in the literature for the production of biofuel.
On the other hand, the ash content in both the LTPNA 01 strain (22.5%) and the bloom material (33.2%) was remarkably higher than the values found in C. vulgaris (4.66%), A. platensis (6.37–7.94%) [38,44], and Chlorella pyrenoidosa (5.7%) [45].
Thermal degradation of microalgae and cyanobacteria occurs in three main steps, namely dehydration, devolatilization, and decomposition. For the microalgae Nannochloropsis sp., these steps occurred in the temperature ranges 25–180 °C, 180–540 °C, and 540–800 °C, respectively [46], while for the species C. vulgaris and A. platensis, they occurred at 25–130 °C, 130–480 °C, and 480–900 °C [38]. Both the LTPNA 01 strain and bloom sample used in the present study showed thermogravimetric curves with profiles similar to those reported in the above studies. Particularly, the dehydration process occurred between 50 and 180 °C, the devolatilization reactions occurred between 180 and 400 °C, and the decomposition started at 400 °C, reaching around 10% of the samples’ mass at 600 °C. In the dehydration step, free water and water weakly bound to the biomolecules evaporated. In the devolatilization step, the main cell components (proteins, carbohydrates, and lipids) were decomposed [38], while the sample residue was carbonized in the decomposition (or carbonization) one. Despite the similarities in the TGA of our samples, some differences are more evident in the DTG curves. Although the main cell components are the same, the TGA/DTG curves profiles may vary between different microalgae and cyanobacteria species [38]. The bloom sample probably contained other species of these organisms besides M. aeruginosa, which, in addition to variations in their nutrients composition, could explain the differences observed between the samples.
5. Conclusions
In conclusion, liquid chromatography coupled to mass spectrometry analysis showed that the bloom sample and the isolated M. aeruginosa strain (LTPNA 01) did not contain microcystins, which is one of the cyanotoxins classes. It was also demonstrated that the cell material might be used as an energy source (either by burning or producing biofuels) despite its low burning power. Moreover, fractions of the bloom and the isolated strain have quality and quantity of carotenoids, fatty acids, proteins, and carbohydrates that suggest a better destination than the bottom of the reservoirs. Therefore, both the biomass and LTPNA 01 strain can be considered a protein and carbohydrate source similar to the energy use of some microalgae species as biomass fuel. It could also be used as an additive for animal feed; however, safety and health investigations and assessments are required before its use.
Author Contributions
Conceptualization, L.S.P.; É.C.A. and E.P.; methodology, C.M.P.d.P., A.C. and A.A.C.; formal analysis, C.M.P.d.P., A.C. and A.A.C.; investigation, É.C.A., L.S.P., C.M.P.d.P., A.C. and A.A.C.; data curation, C.M.P.d.P., A.C. and A.A.C.; writing—original draft preparation, É.C.A. and L.S.P.; writing—review and editing, E.P.; visualization, E.P.; supervision, E.P.; project administration, E.P.; funding acquisition, E.P. All authors have read and agreed to the published version of the manuscript.
Funding
This research was funded by FAPESP (São Paulo State Research Foundation), grant number 2013/07914-8 and 2020/00109-6; FUSP (University of São Paulo Foundation), grant number 1979; CAPES (Coordination for the Improvement of Higher Education Personnel), grant number 23038.001401/2018-92 and 88882.327696/2019-01, and CNPq (National Council for Scientific and Technological Development), grant number 313970/2020-3 and 439065/2018-6.
Institutional Review Board Statement
Not applicable.
Informed Consent Statement
Not applicable.
Data Availability Statement
The data that support the findings of this study are available from the corresponding and first authors, L.S.P. and A.A.C., upon reasonable request.
Acknowledgments
We acknowledge Fabyana Maria dos Anjos and Sara Fonseca Jung (University of São Paulo) for helping with the quantification of microcystins and fatty acids.
Conflicts of Interest
The authors declare no conflict of interest. The funders had no role in the study’s design, the collection, analyses, or interpretation of data, the writing of the manuscript, or the decision to publish the results.
References
- Pulz, O.; Gross, W. Valuable products from biotechnology of microalgae. Appl. Microbiol. Biotechnol. 2004, 65, 635–648. [Google Scholar] [CrossRef] [PubMed]
- Tamagnini, P.E.; Leitao, P.; Oliveira, D.; Ferreira, F.; Pinto, D.J.; Harris, T.; Heidorn, P.; Lindblad, P. Cyanobacterial hydrogenases: Diversity, regulation and applications. FEMS Microbiol. Rev. 2010, 31, 692–720. [Google Scholar] [CrossRef] [Green Version]
- Parmar, A.; Singh, N.K.; Pandey, A.; Gnansounou, E.; Madamwar, D. Cyanobacteria and microalgae: A positive prospect for biofuels. Bioresour. Technol. 2011, 102, 10163–10172. [Google Scholar] [CrossRef] [PubMed]
- Herridge, D.F.; Peoples, M.B.; Boddey, R.M. Global inputs of biological nitrogen fixation in agricultural systems. Plant Soil 2008, 311, 1–18. [Google Scholar] [CrossRef]
- Markou, G.; Georgakakis, D. Cultivation of filamentous cyanobacteria (blue-green algae) in agro-industrial wastes and wastewaters: A review. Appl. Energy 2011, 88, 3389–3401. [Google Scholar] [CrossRef]
- Borowitzka, M.A. High-value products from microalgae-their development and commercialization. J. Appl. Phycol. 2013, 25, 743–756. [Google Scholar] [CrossRef]
- Rodolfi, L.; Zittelli, G.C.; Bassi, N.; Padovani, G.; Biondi, N.; Bonini, G.; Tredici, M.R. Microalgae for oil: Strain Selection, induction of lipid synthesis and outdoor mass cultivation in a low-cost photobioreactor. Biotechnol. Bioeng. 2009, 102, 100–112. [Google Scholar] [CrossRef]
- Paerl, H.W.; Otten, T.G. Harmful cyanobacterial blooms: Causes, consequences, and controls. Microb. Ecol. 2013, 65, 995–1010. [Google Scholar] [CrossRef] [PubMed]
- Chen, L.J.P.; Giesy, O.; Adamovsky, Z.; Svirčev, J.; Meriluoto, G.A.; Codd, B.; Mijovic, T.; Shi, X.; Tuo, S.C.; Li, B.Z.; et al. Challenges of using blooms of Microcystis spp. in animal feeds: A comprehensive review of nutritional, toxicological and microbial health evaluation. Sci. Total Env. 2021, 764, 142319. [Google Scholar] [CrossRef]
- Jacinavicius, F.R.; Pacheco, A.B.F.; Chow, F.; Verissimo da Costa, G.C.; Kalume, D.E.; Rigonato, J.; Sant’Anna, C.L. Different ecophysiological and structural strategies of toxic and non-toxic Microcystis aeruginosa (cyanobacteria) strains assessed under culture conditions. Algal Res. 2019, 41, 101548. [Google Scholar] [CrossRef]
- Bortoli, S.; Oliveira-Silva, D.; Krüger, T.; Dörr, F.A.; Colepicolo, P.; Volmer, D.A.; Pinto, E. Growth and microcystin production of a Brazilian Microcystis aeruginosa strain (LTPNA 02) under different nutrient conditions. Rev. Bras. Farm. 2019, 24, 389–398. [Google Scholar] [CrossRef] [Green Version]
- He, X.X.; Liu, Y.L.; Conklin, A.; Westrick, J.; Weavers, L.K.; Dionysiou, D.D.; Lenhart, J.J.; Mouser, P.J.; Szlag, D.; Walker, H.W. Toxic cyanobacteria and drinking water: Impacts, detection, and treatment. Harmful Algae 2016, 54, 174–193. [Google Scholar] [CrossRef] [PubMed]
- Svrcek, C.; Smith, D.W. Cyanobacteria toxins and the current state of knowledge on water treatment options: A review. J. Env. Eng. Sci. 2004, 3, 155–185. [Google Scholar] [CrossRef]
- Paerl, H.W.; Huisman, J. Climate change: A catalyst for global expansion of harmful cyanobacterial blooms. Env. Microbiol. Rep. 2009, 1, 27–37. [Google Scholar] [CrossRef] [PubMed]
- Paerl, H.W.; Paul, V.J. Climate change: Links to global expansion of harmful cyanobacteria. Water Res. 2012, 46, 1349–1363. [Google Scholar] [CrossRef] [PubMed]
- Abed, R.M.M.; Dobretsov, S.; Sudesh, K. Applications of cyanobacteria in biotechnology. J. Appl. Microbiol 2009, 106, 1–12. [Google Scholar] [CrossRef] [PubMed]
- Der Poel, A.F.B.; Abdollahi, M.R.; Cheng, H.; Colovic, R.; Hartog, L.A.; Miladinovic, D.; Hendriks, W.H. Future directions of animal feed technology research to meet the challenges of a changing world. Anim. Feed Sci. Technol. 2020, 270, 114692. [Google Scholar] [CrossRef]
- Patil, V.; Reitan, K.I.; Knutsen, G.; Mortensen, L.M.; Källqvist, T.; Olsen, E.; Vogt, G.; Gislerød, H.R. Microalgae as source of polyunsaturated fatty acids for aquaculture. Plant Biol. 2005, 6, 57–65. [Google Scholar]
- Gressler, V.; Sumie, N.; Mutue, Y.; Fujii, T.; Colepicolo, P.; Mancini, J.; Rosangela, F.; Torres, P.; Pinto, E. Lipid, fatty acid, protein, amino acid and ash contents in four Brazilian red algae species. Food Chem. 2010, 120, 585–590. [Google Scholar] [CrossRef]
- AOAC. Official Method 996.06. Official Methods of Analysis of AOAC International, 18th ed.; AOAC International: Gaithersburg, MD, USA, 2005. [Google Scholar]
- Sánchez-Machado, D.I.; López-Cervantes, J.; López-Hernández, J.; Paseiro-Losada, P. Fatty acids, total lipid, protein and ash contents of processed edible seaweeds. Food Chem. 2004, 85, 439–444. [Google Scholar] [CrossRef]
- AOCS. Official Method Ce 1h-05. Official Methods and Recommended Practices of the AOCS, 5th ed.; AOCS Press: Champaign, IL, USA, 2005. [Google Scholar]
- Dubois, M.; Gilles, K.A.; Hamilton, J.K.; Rebers, P.A.; Smith, F. Colorimetric method for determination of sugars and related substances. Anal. Chem. 1956, 28, 350–356. [Google Scholar] [CrossRef]
- Bradford, M.M. Rapid and sensitive method for quantitation of microgram quantities of protein utilizing principle of protein-dye binding. Anal. Biochem. 1976, 76, 248–254. [Google Scholar] [CrossRef]
- McKenzie, H.A.; Wallace, H.S. The Kjeldahl determination of Nitrogen: A critical study of digestion conditions—Temperature, Catalyst, and Oxidizing agente. Aust. J. Chem. 1954, 7, 55–70. [Google Scholar] [CrossRef]
- AOAC. Official method 976.06—protein (crude) in animal feeds. In Official Method of Analysis, 15th ed.; Helrick, K., Ed.; Association of Official Analytical Chemists: Arlington, VA, USA, 1990; Volume 72. [Google Scholar]
- Rueda-Ordóñez, Y.J.; Tannous, K. Isoconversional kinetic study of the thermal decomposition of sugarcane straw for thermal conversion processes. Bioresour. Technol. 2015, 196, 136–144. [Google Scholar] [CrossRef]
- Sigaud-Kutner, T.C.S.; Pinto, E.; Okamoto, O.K.; Latorre, L.R.; Colepicolo, P. Changes in superoxide dismutase activity and photosynthetic pigment content during growth of marine phytoplankters in batch-cultures. Physiol. Plant. 2002, 114, 566–571. [Google Scholar] [CrossRef]
- Kim, Y.S.; Yi, J.; Do, J.M.; Chang, J.; Yoon, H.S. Characterization of fatty acid components from Tetradesmus obliquus KNUA019 (Chlorophyta, Scenedesmaceae) for a resource of biofuel production. Braz. J. Bot. 2019, 42, 431–439. [Google Scholar] [CrossRef]
- Issaa, A.; Ali, E.; Abdel-Basset, R.; Awad, M.F.; Ebied, M.; Hassan, S.A. The impact of nitrogen concentrations on production and quality of food and feed supplements from three cyanobacteria and potential application in biotechnology. Biocatal. Agric. 2020, 24, 101533. [Google Scholar] [CrossRef]
- Pagels, F.; Guedes, A.C.; Amaro, H.M.; Kijjoa, A.; Vasconcelos, V. Phycobiliproteins from cyanobacteria: Chemistry and biotechnological applications. Biotechnol. Adv. 2019, 37, 422–443. [Google Scholar] [CrossRef]
- Patel, A.; Matsakas, L.; Rova, U.; Christakopoulos, P. A perspective on biotechnological applications of thermophilic microalgae and cyanobacteria. Bioresour. Technol. 2019, 278, 424–434. [Google Scholar] [CrossRef]
- Codd, G.A.; Morrison, L.F.; Metcalf, J.S. Cyanobacterial toxins: Risk management for health protection. Toxicol. Appl. Pharm. 2005, 203, 264–272. [Google Scholar] [CrossRef]
- Risseti, C.H. Bioactive molecules and phylogeny of Brazilian cyanobacterial isolates from genera Dolichospermum, Sphaerospermopsis, Cuspidothrix, Cylindrospermopsis and Microcystis. Ph.D. Thesis, University of São Paulo, São Paulo, Brazil, 2012. [Google Scholar]
- RC. Nutrient Requirements of Small Ruminants: Sheep, Goats, Cervids and New World Camelids; National Academic Press: Washington, DC, USA, 2007. [Google Scholar]
- Arruda, M.C.G.; Almeida, M.T.; Bertoco, J.P.A.; Pereira-Junior, S.A.G.; Castro-Filho, E.; Feliciano, A.L.; Rodrigues, J.L.; Torres, R.N.S.; Costa, R.V.; Grilo, L.M.S.F.S.S.; et al. Soybean molasses to replace corn for feedlot lambs on growth performance, carcass characteristics, and meat quality. Transl. Anim. Sci. 2021, 5, 1–15. [Google Scholar] [CrossRef] [PubMed]
- Valença, R.L.; Sobrinho, A.G.S.; Borghi, T.H.; Meza, D.A.R.; Andrade, N.; Silva, L.G.; Bezerra, L.R. Performance, carcass traits, physicochemical properties and fatty acids composition of lamb’s meat fed diets with marine microalgae meal (Schizochytrium sp.). Livest. Sci. 2021, 243, 104387. [Google Scholar] [CrossRef]
- Almeida, H.N.; Calixto, G.Q.; Chagas, B.M.E.; Melo, D.M.A.; Resende, F.M.; Melo, M.A.F.; Braga, R.M. Characterization and pyrolysis of Chlorella vulgaris and Arthrospira platensis: Potential of bio-oil and chemical production by Py-GC/MS analysis. Environ. Sci. Pollut. Res. 2017, 24, 14142–14150. [Google Scholar] [CrossRef]
- Kebelmann, K.; Hornung, A.; Karsten, U.; Griffiths, G. Intermediate pyrolysis and product identification by TGA and Py-GC/MS of green microalgae and their extracted 661 protein and lipid components. Biomass Bioenerg. 2013, 49, 38–48. [Google Scholar] [CrossRef]
- Chagas, B.M.E.; Dorado, C.; Serapiglia, M.J.; Mullen, C.A.; Boateng, A.A.; Melo, M.A.F.; Ataíde, C.H. Catalytic pyrolysis-GC/MS of Spirulina: Evaluation of a highly proteinaceous biomass source for production of fuels and chemicals. Fuel 2016, 179, 124–134. [Google Scholar] [CrossRef]
- Gomes, A.F.; Gomes, M.P.S.; Di Souza, L.; Costa, M. Thermal and chromatographic characterization of biomass, lipid material, and microalgal biodiesel from Monoraphidium sp. J. Therm. Anal. Calorim. 2015, 119, 1861–1866. [Google Scholar] [CrossRef]
- Converti, A.A.; Casazza, A.A.; Ortiz, E.Y.; Perego, P.; Del Borghi, M. Effect of temperature and nitrogen concentration on the growth and lipid content of Nannchloropsis oculata and Chlorella vulgaris for biodiesel production. Chem. Eng. Process. 2009, 48, 1146–1151. [Google Scholar] [CrossRef]
- Frumento, D.; Casazza, A.A.; Al Arni, S.; Converti, A. Cultivation of Chlorella vulgaris in tubular photobioreactors: A lipid source for biodiese1 production. Bichem. Eng. J. 2013, 81, 120–125. [Google Scholar] [CrossRef]
- Mirizadeh, S.; Casazza, A.A.; Converti, A.; Nosrati, M.; Shojaosadati, S.A. Repetitive non-destructive extraction of lipids from Chlorella vulgaris grown under stress conditions. Bioresour. Tecnol. 2021, 326, e124798. [Google Scholar] [CrossRef]
- Gai, C.; Zhang, Y.; Chen, W.T.; Zhang, P.; Dong, Y. Thermogravimetric and kinetic analysis of thermal decomposition characteristics of low-lipid microalgae. Bioresour. Technol. 2013, 150, 139–148. [Google Scholar] [CrossRef]
- Marcilla, A.; Gómez-Siurana, A.; Gomis, C.; Chápuli, E.; Catalá, M.C.; Valdés, F.J. Characterization of microalgal species through TGA/FTIR analysis: Application to nannochloropsis sp. Thermochim. Acta 2009, 484, 41–47. [Google Scholar] [CrossRef]
Figure 1.
Microcystis aeruginosa LTPNA 01 growth curve in both numeric and log10 scales. Error bars denote standard deviation (SD).
Figure 1.
Microcystis aeruginosa LTPNA 01 growth curve in both numeric and log10 scales. Error bars denote standard deviation (SD).

Figure 2.
Thermogravimetric curves (TGA) and their derivatives (DTG) for (a) Microcystis LTPNA 01 and (b) a bloom sample from 50 to 600 °C.
Figure 2.
Thermogravimetric curves (TGA) and their derivatives (DTG) for (a) Microcystis LTPNA 01 and (b) a bloom sample from 50 to 600 °C.

Figure 3.
Chromatograms of the analytical standards of (a) photosynthetic pigments, (b) Microcystis aeruginosa LTPNA 01 (b), and (c) a bloom sample collected in the field. Retention time (minutes): 4.05 (unidentified pigment); 12.29 (mixoxanthin); 23.02 (chlorophyll-a); 26.32 (echinenone), and 28.44 (β-carotene).


Table 1.
Comparison of nutrients and ash of Microcystis aeruginosa LTPNA 01 and bloom material (g/kg of dry weight or %, n = 5, average ± coefficient of variation).
Table 1.
Comparison of nutrients and ash of Microcystis aeruginosa LTPNA 01 and bloom material (g/kg of dry weight or %, n = 5, average ± coefficient of variation).
| Samples | Lipid (g/kg) | Nitrogen (g/kg) | Protein (g/kg) | Carbohydrate (g/kg) | Ash (%) |
|---|---|---|---|---|---|
| M. aeruginosa LTPNA 01 | 26.0 ± 2.4 | 42.5 ± 2.2 | 143.8 ± 8.3 | 346.6 ± 20.7 | 22.5 ± 1.5 |
| Bloom material | 32.2 ± 4.0 * | 42.3 ± 1.5 | 150.7 ± 12.5 | 486.4 ± 12.5 * | 33.2 ± 0.6 * |
* Significant difference by the Student’s t-test (p ≤ 0.05).
Table 2.
M. aeruginosa LTPNA 01 and bloom material fatty acid composition (g/kg of dry weight, n = 5, average ± CV).
Table 2.
M. aeruginosa LTPNA 01 and bloom material fatty acid composition (g/kg of dry weight, n = 5, average ± CV).
| Fatty Acid | M. aeruginosa LTPNA 01 | Bloom Material |
|---|---|---|
| Saturated | ||
| 12:00 | 0.00 ± 0.00 | 0.11 ± 0.00 |
| 14:00 | 1.94 ± 0.06 | 2.71 ± 0.28 |
| 15:00 | 0.10 ± 0.01 | 0.34 ± 0.01 |
| 16:00 | 5.02 ± 0.18 | 7.99 ± 0.63 |
| 18:00 | 0.48 ± 0.06 | 0.66 ± 0.63 |
| Total | 7.54 | 11.81 |
| Monounsaturated | ||
| 16:1n-7 | 0.12 ± 0.00 | 0.12 ± 0.00 |
| 18:1cn-9 | 0.45 ± 0.02 | 4.19 ± 0.53 |
| Total | 0.57 | 4.31 |
| Polyunsaturated | ||
| 18:2cn-6 | 0.12 ± 0.01 | 0.28 ± 0.05 |
| 20:2n-6 | 0.12 ± 0.01 | 0.00 ± 0.00 |
| 20:3n-6 | 0.41 ± 0.02 | 0.10 ± 0.00 |
| 20:4n-6 | 0.52 ± 0.02 | 0.73 ± 0.01 |
| 20:5n-3 | 1.05 ± 0.10 | 1.26 ± 0.10 |
| Total | 2.23 | 2.37 |
| 18:1tn-9 (Trans) | 0.14 ± 0.00 | 0.64 ± 0.00 |
| Ratio n-3/n-6 | 2.0 | 1.7 |
| % saturated FA | 0.75 | 1.18 |
| % monounsaturated FA | 0.06 | 0.43 |
| % PUFA | 0.22 | 0.24 |
| % trans FA | 0.01 | 0.06 |
FA = fatty acids; PUFA = polyunsaturated fatty acids; CV. Acids: 12:00 = lauric; 14:00 = myristic; 15:00 = pentadecylic; 16:00 = palmitic; 18:00 = stearic; 16:1n-7 = palmitelaidic; 18:1cn-9 = oleic; 18:2cn-6 = linoleic; 20:2n-6 = eicosadienoic; 20:3n-6 = dihomo-γ-linolenic; 20:4n-6 = arachidonic; 20:5n-3 = eicosapentaenoic; 18:1tn-9 = elaidic.
Table 3.
Pigments content in the cells of the LTPNA 01 strain and the bloom sample: myxoxanthin, echinenone, chlorophyll-a, and β-carotene by dry weight (nmol/g of DW).
Table 3.
Pigments content in the cells of the LTPNA 01 strain and the bloom sample: myxoxanthin, echinenone, chlorophyll-a, and β-carotene by dry weight (nmol/g of DW).
| Pigment | LTPNA 01 | Bloom sample |
|---|---|---|
| Myxoxanthin | 61.30 ± 8.64 | 89.37 ± 9.00 * |
| Chlorophyll-a | 146.93 ± 6.15 | 454.60 ± 42.00 * |
| Echinenone | 47.23 ± 0.95 | 55.90 ± 1.90 * |
| β-carotene | 91.43 ± 4.32 | 146.90 ± 4.40 * |
Asterisk marks (*) indicate significant differences between the bloom sample and LTPNA 01 strain.
Publisher’s Note: MDPI stays neutral with regard to jurisdictional claims in published maps and institutional affiliations. |
© 2021 by the authors. Licensee MDPI, Basel, Switzerland. This article is an open access article distributed under the terms and conditions of the Creative Commons Attribution (CC BY) license (https://creativecommons.org/licenses/by/4.0/).
Share and Cite
MDPI and ACS Style
Passos, L.S.; Almeida, É.C.; de Pereira, C.M.P.; Casazza, A.A.; Converti, A.; Pinto, E. Chemical Characterization of Microcystis aeruginosa for Feed and Energy Uses. Energies 2021, 14, 3013. https://doi.org/10.3390/en14113013
AMA Style
Passos LS, Almeida ÉC, de Pereira CMP, Casazza AA, Converti A, Pinto E. Chemical Characterization of Microcystis aeruginosa for Feed and Energy Uses. Energies. 2021; 14(11):3013. https://doi.org/10.3390/en14113013
Chicago/Turabian StylePassos, Larissa Souza, Éryka Costa Almeida, Claudio Martin Pereira de Pereira, Alessandro Alberto Casazza, Attilio Converti, and Ernani Pinto. 2021. "Chemical Characterization of Microcystis aeruginosa for Feed and Energy Uses" Energies 14, no. 11: 3013. https://doi.org/10.3390/en14113013
Note that from the first issue of 2016, this journal uses article numbers instead of page numbers. See further details here.