
Comparison of Tank and Battery Storages for Photovoltaic Water Pumping
by
 , , and
Camille Soenen
1,2,*, 
Vincent Reinbold
3,4,
Simon Meunier
3,4,
Judith A. Cherni
1,
Arouna Darga
3,4 ,
,
Philippe Dessante
3,4 and
Loïc Quéval
3,4 1
Centre for Environmental Policy, Imperial College London, London SW7 2AZ, UK
2
Mechanics Department, Ecole Polytechnique, Institut Polytechnique de Paris, 91120 Palaiseau, France
3
GeePs, CNRS, CentraleSupélec, Université Paris-Saclay, 91192 Gif-sur-Yvette, France
4
GeePs, CNRS, Sorbonne Université, 75252 Paris, France
*
Author to whom correspondence should be addressed.
Energies 2021, 14(9), 2483; https://doi.org/10.3390/en14092483
Submission received: 28 March 2021
/
Revised: 20 April 2021
/
Accepted: 23 April 2021
/
Published: 27 April 2021
(This article belongs to the Special Issue Simulation and Optimization of Electrotechnical Systems)
Abstract
:Photovoltaic water pumping systems (PVWPS) are a promising solution to improve domestic water access in low-income rural areas. It is challenging, however, to make them more affordable for the local communities. We develop here a comparative methodology to assess relevant features of both widely employed PVWPS architecture with water tank storage, and hardly used PVWPS architecture with a battery bank instead of tank storage. The quantitative comparison is carried out through techno-economic optimization, with the goal of minimizing the life cycle cost of PVWPS with constraints on the satisfaction of the water demand of local inhabitants and on the groundwater resource sustainability. It is aimed to support decision-makers in selecting most appropriate storage for domestic water supply projects. We applied the methodology in the rural village of Gogma, Burkina Faso. Results indicate that the life-cycle cost of an optimized PVWPS with batteries is $24.1k while it is $31.1k if a tank is used instead. Moreover, reduced impact on groundwater resources and greater modularity to adapt to evolving water demand is noted if using batteries. However, as batteries must be replaced regularly and recycled adequately, PVWPS’ financial accessibility could increase only if sustainable and efficient operation, maintenance, and recycling facilities for batteries were present or developed locally.
1. Introduction
Photovoltaic water pumping systems (PVWPS) are a promising way to provide sustainable water access for domestic use in off-grid communities [1]. A correlation between the lack of running water and solar resources has been found [2,3], and the cost of PV systems is now competitive with other conventional systems like diesel [4,5]. However, it is still a significant challenge to make them affordable for the communities living in such low-income areas. Different architectures of PVWPS have been installed in rural communities [6,7]. A PVWPS for domestic use consists of a PV array, a motor-pump, a fountain to collect water, and a storage device. The architectures differ mainly by their storage technologies. A system with a water tank is called here a tank PVWPS, and a system with a battery bank is called a battery PVWPS [1,8].
The tank PVWPS is most widely spread for domestic use [9]. In the literature, optimizations have been carried out, especially on the sizing of the tank and the PV array, to minimize the system cost while satisfying the water demand. Muhsen et al. optimised a PVWPS providing water to 120 inhabitants in Malaysia [10]. Bouzidi [11] and Bakelli [12] optimized PVWPS in Algeria, providing 60 m3 and 6 m3 of water for daily domestic use. Meunier et al. optimized a PVWPS for domestic use for 280 inhabitants of a village in Burkina Faso [13].
The battery PVWPS is less spread for domestic use but certain qualitative features of this architecture have been highlighted in the literature. For example, Anis & Nour specify that employing a battery maximizes solar power use allowing for panel size reduction, and thus the cost of the PV array [14]. Khan et al. [15] and Meah et al. [16] explain that they disregard battery storage to reduce the system’s life cycle cost and maintenance needs. Gopal et al. [17] and Chand & Kalamkar [18] established that a battery increases the cost and the complexity of the system while decreasing its efficiency.
As these studies report some contradicting findings; their conclusions do not allow a substantial basis for the selection of an optimal architecture between the two. Selecting the best system for a given case requires a quantitative comparison of optimized systems [19,20]. To our best knowledge, no article performs such a quantitative comparison for PVWPS for domestic use.
For irrigation, a quantitative comparison was performed by Basalike in his thesis [21]. He compared the tank PVWPS and battery PVWPS for a case study in Rwanda. The two architectures are sized by an intuitive method, and an economic comparison is then performed. The thesis concludes that for irrigation in Rwanda, the battery architecture has a higher initial cost than the tank architecture but is more performant and profitable because it produces a surplus of electricity than can be sold. Nevertheless, the method of [21] is not based on optimization, and its results could thus be refined. Indeed, as mentioned in [22], intuitive methods usually result in oversizing systems compared to optimization. Moreover, the results for irrigation should not be extrapolated to domestic water access. Water demand and uses strongly differ in terms of volume and temporal distribution [23]. Additionally, the constraints are less tight for irrigation: the aggregated required volume is fixed, but the periods and flow rates of irrigation can vary [24].
Pardo et al. [25] compared these two storage options (tank and battery) in another framework which is an urban water pressurized network. They designed a method to compare the two options based on their payback period. This method requires a calibrated hydraulic model and considers the monthly consumption of an urban network and not the hourly water need of a population. They concluded that, for their case study, battery storage is less expensive but also that there is no universal solution because it depends on the network and location specificities.
This article aims to assess advantages and limitations that characterize tank and battery architectures for PVWPS for domestic water supply in off-grid communities. In contrast to the existing literature, our study employs an original techno-economic optimization and a comparative methodology, designed for the current study. The method is applied to find the most suitable architecture for a given case study in Burkina Faso. The method designed here only needs data on the population water consumption, the irradiance, and the temperature so it can be replicated for other locations and communities. We also discuss the results in light of a few aspects which have hardly been considered previously, i.e., impact on groundwater resources and difficulties with systems operation and maintenance.
2. Methodology
2.1. Architectures
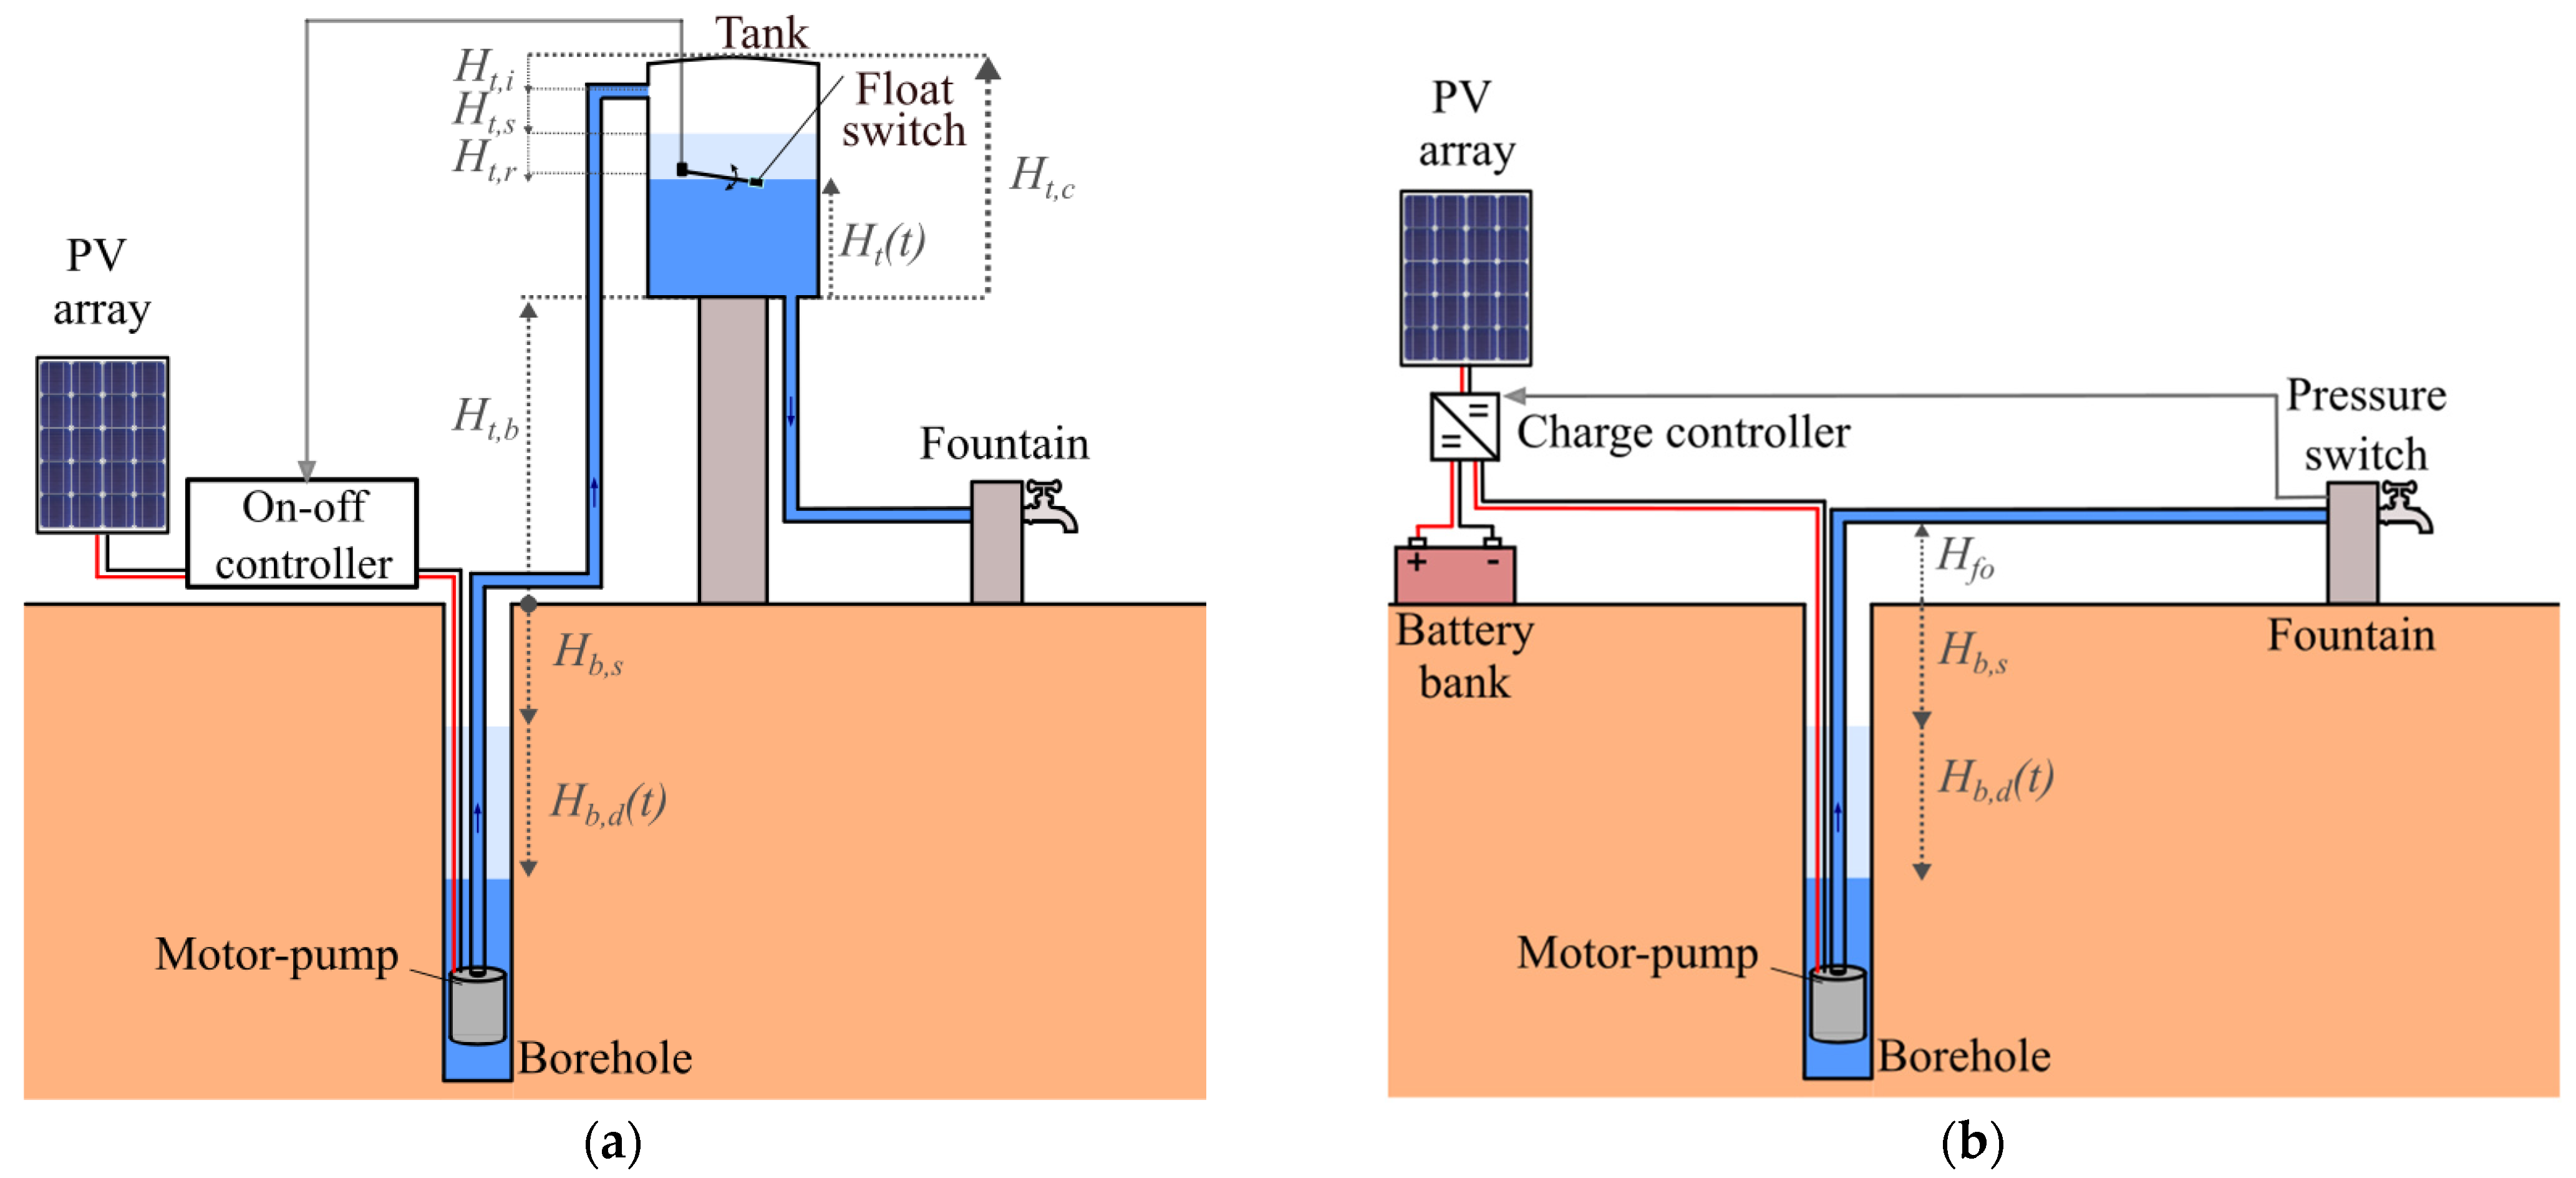
The tank and battery architectures are represented in Figure 1. The tank architecture is made of a PV array; a maximum power point tracker (MPPT), which tracks the best operating point of the PV array; a motor-pump (with a DC motor or an inverter and an AC motor); an elevated water tank in steel (expensive and reliable) or plastic (cheap but not fully reliable, so not considered in this study); a controller to start and stop the motor-pump according to the water volume in the tank; a fountain to collect water and pipes [6,8,26]. The battery architecture is made of a PV array; a battery bank; a MPPT charge controller to control the power flow from the PV array to the battery bank or the motor pump; a motor-pump; a pressure switch to start and stop the motor-pump, according to the fountain tap opening; a fountain and pipes [17,21,27].
2.2. Technical Models
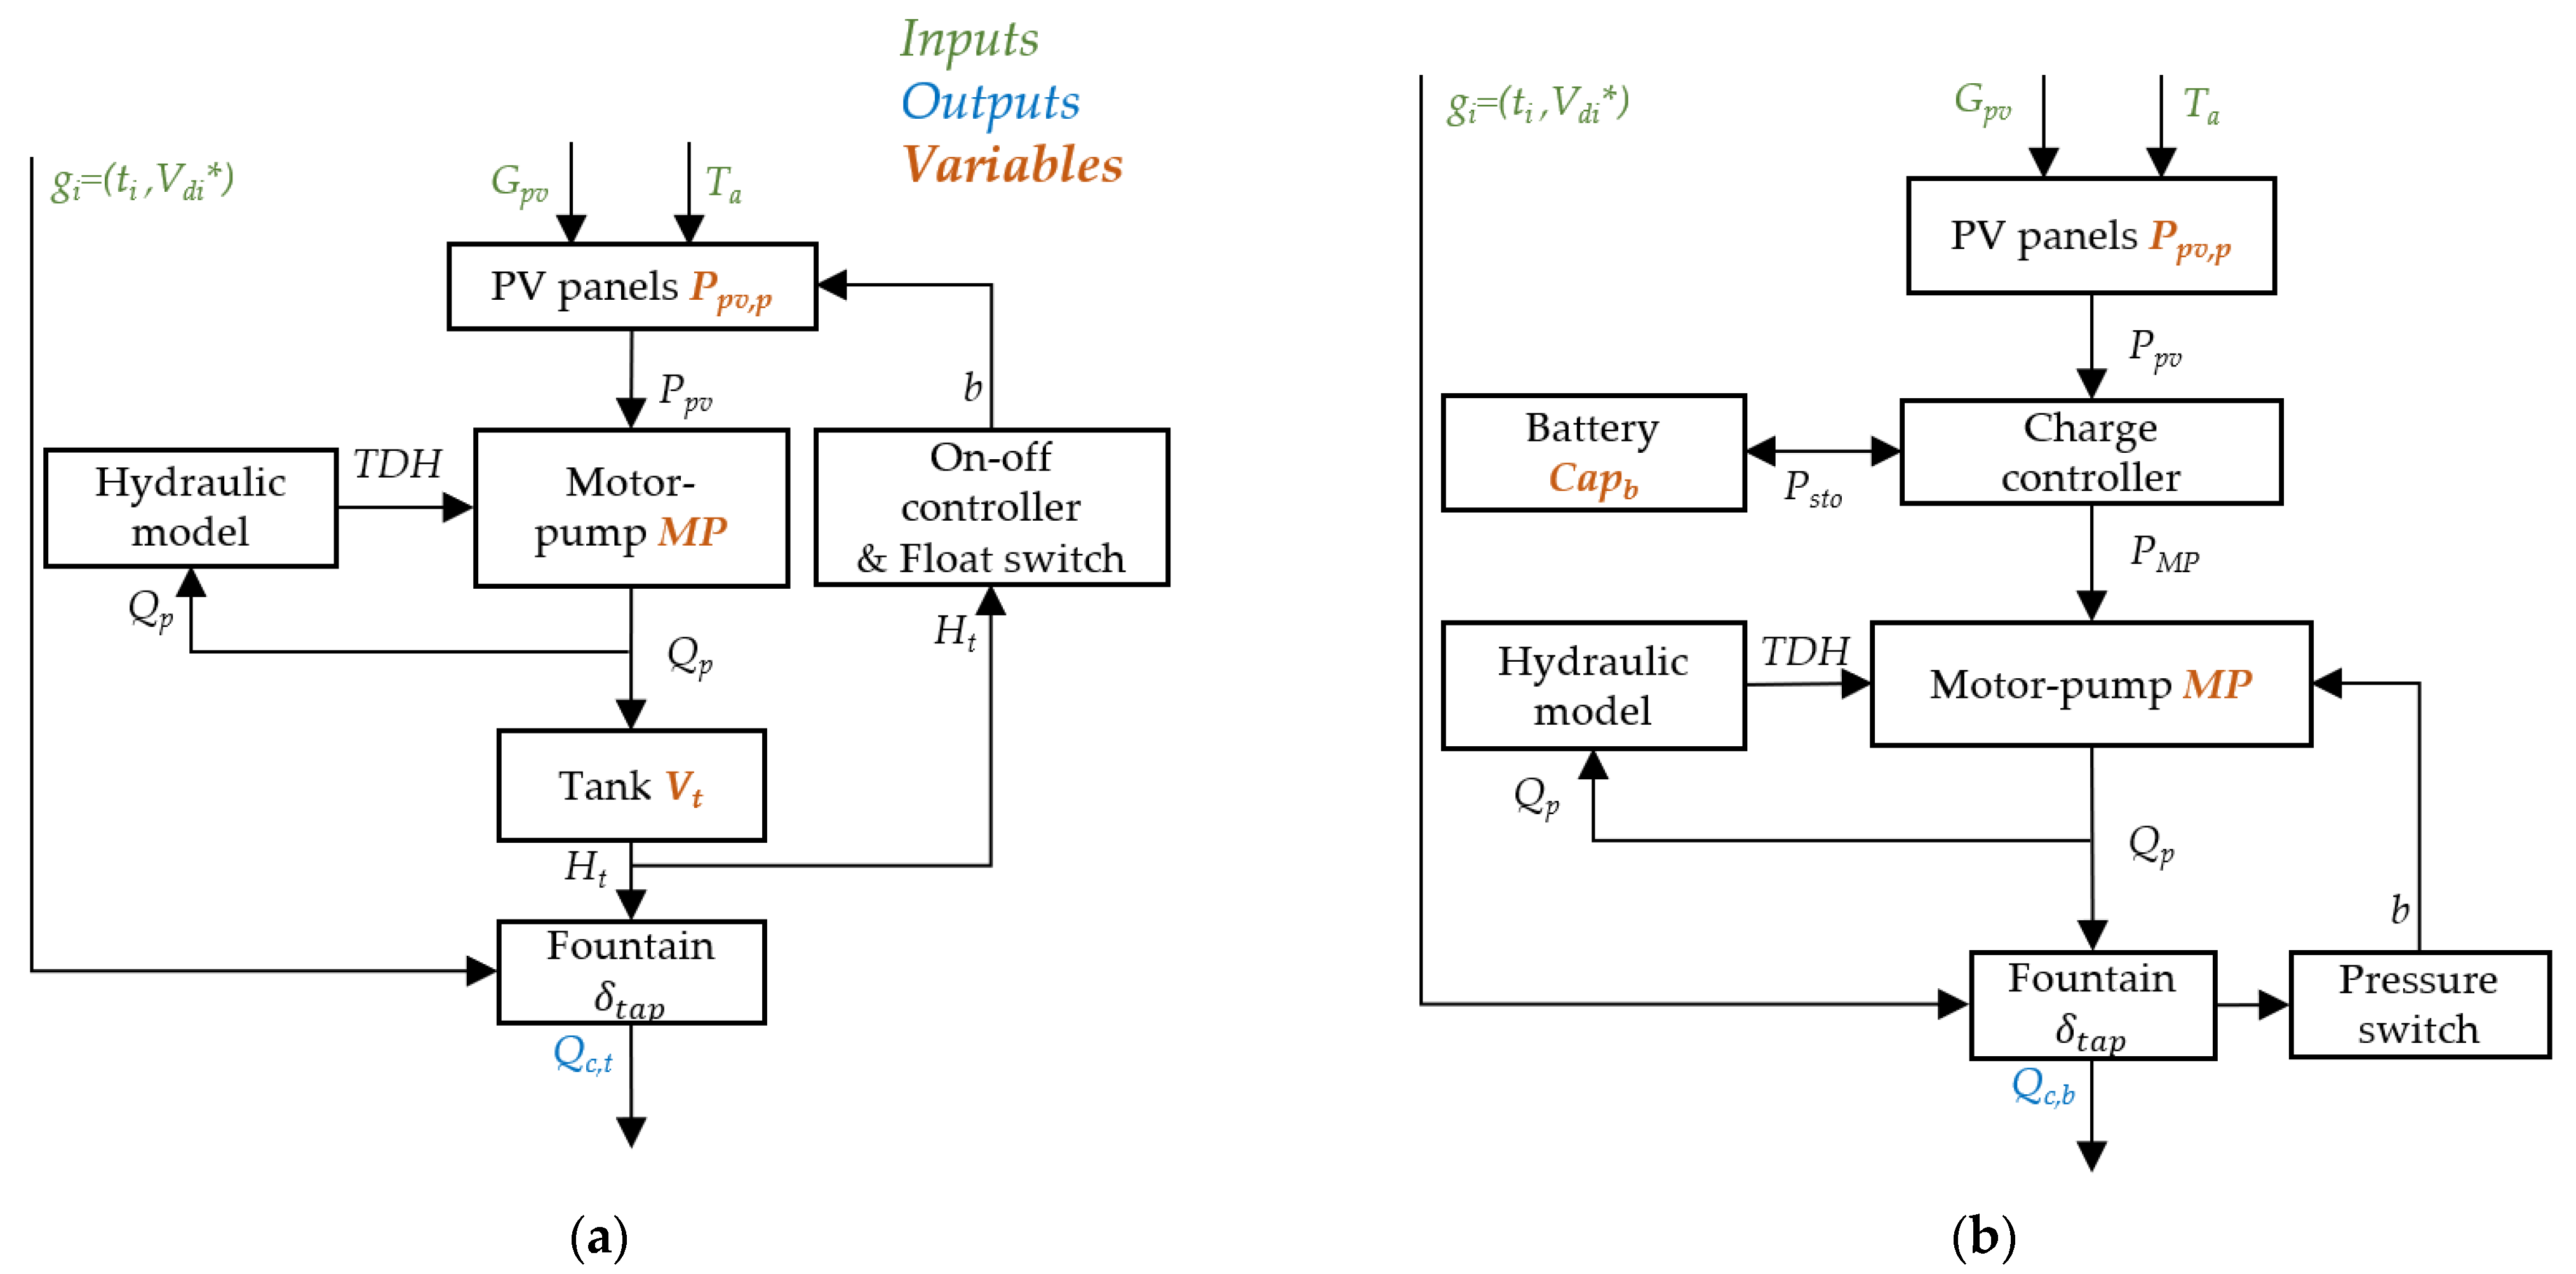
Figure 2 shows the block diagrams of the tank and battery PVWPS technical models. The inputs of both models are the ambient temperature , the irradiance and the user’s water demand, which is represented by , where is the time of arrival of the user group and is the water volume demanded by the group . The models’ output is the flow rate of collected water at the tap, for the tank architecture and for the battery architecture. The sizing variables are the PV array peak power , the size of the storage device (tank volume or battery bank capacity ), and the motor-pump reference . They will be used as optimisation variables (see Section 4).
2.2.1. Tank Architecture
We detailed the technical model of the tank PVWPS in [28]. For the sake of completeness, we restate the equations, which are solved numerically in a sequential manner. The power output production of the PV array is computed using:
where (W) is the peak power of the PV array in standard test conditions (STC), is the temperature coefficient of the maximum power point, is the normal operating cell temperature. is the on-off controller trigger signal, which allows transferring () or not () the power from the PV array to the motor-pump. The value of is determined by the water level in the tank , measured by a float switch. When the water goes above the stop level, the on-off controller turns off the motor-pump, and when the water goes below the restart level, the controller turns on the motor-pump.
is the pumped flow rate and is determined by the input power to the motor-pump and the total dynamic head through an abacus provided by the manufacturer [29]. The total dynamic head is given by:
where is the coefficient associated with pressure losses in the pipe between the motor-pump and the tank, is the aquifer losses coefficient, and is the borehole losses coefficient. The heights , , and are represented in Figure 1. The flow rate from the tank to the fountain is:
where models if the tape is open ( = 1) or closed ( = 0). is a parameter that depends mainly on the tank height; it is assumed constant here. The tap opens at the arrival of a group of users and closes when the group has collected its needed volume .
The water level in the tank is determined by:
where is the cylindrical tank base area.
2.2.2. Battery Architecture
The PV model, the motor-pump model and the hydraulic model are the same for the battery PVWPS as for the tank PVWPS. The battery controller regulates the discharge and charge by connecting and disconnecting the motor-pump and the PV array. The PV array is disconnected when the battery is full. The motor-pump is disconnected when the battery voltage goes below the stop level and is reconnected when the voltage goes above the restart level . For charging the battery, a scheme with bulk, absorption, and floating phases is considered. During the bulk phase, the current is equal to the PV current until the battery reaches voltage of During the absorption phase, the voltage is kept constant at . During the float phase, the voltage is kept constant at . The efficiency of the charge controller is . For the discharge, the current cannot exceed .
We consider lead-acid batteries as they are the most commonly available in low-income rural areas [30,31]. The battery is modelled by:
where is the power entering the batteries, is the energy stored in the battery, is the power produced by the PV array, is the power consumed by the motor-pump, and is the efficiency of the battery. The efficiency is equal to 90% when the state of charge (SOC) is below 66%, for a SOC superior to 66%, and it is considered equal to 1 for discharging [32]. The voltage of the battery during discharging is computed from [33]:
where is the current of the battery and the internal resistance. and are coefficients fitted from the datasheet of manufacturers [34,35,36].
The total dynamic head is given by:
The motor-pump is activated by a pressure switch installed on the tap. We consider that the motor-pump switches on at the tap’s opening and switches off at the tap’s closing. We consider that the water pumped flow rate is kept constant at the desired flow . The power consumed by the motor-pump is deduced from and through the motor-pumps characteristics:
where is a polynomial that fits the motor-pump characteristic, and is the binary signal given by the pressure switch. is the maximum input power in the motor-pump, given by:
where is the nominal current of the motor-pump.
If the battery and the PV array cannot provide the , the power to the motor-pump is lower and corresponds to the addition of the PV array generation and of the maximum power from the battery. The final is then inferior to and is computed from the recalculated and . The collected water rate at the tap is equal to the pumped flow rate .
Another crucial part of the battery PVWPS model is the computation of the battery lifetime. Indeed, batteries in that kind of climate usually last between 3 [37] and 5 years [38]. The battery’s lifetime determines the replacement needs and impacts the system replacement costs. The improved Rainflow counting model is used to assess the battery lifespan [39] and the effect of temperature is estimated through the Arrhenius law [40]. The lifetime in years is thus given by:
where is an amplitude of reference equal to 10%, , and are the amplitude and final state of charge of cycle k; with k ranging all the cycles of discharge of the battery in one typical year. is the activation energy of the reaction (~50,000 J/mol for ageing reactions in lead-acid batteries), the molar gas constant (8.3143 J/mol/°C) and the temperature (°C). We consider that the batteries’ calendar ageing limits the lifespan to a maximum of years given by the manufacturer at 20 °C [34]. This maximal lifetime admissible for batteries is also multiplied by the factor of the Arrhenius law.
2.3. Economic Model
The output of the economic model is the life cycle cost . This life cycle cost is split into variable costs, which depend on the sizing and the architecture of the PVWPS, and a fixed cost:
where is the discounted variable capital cost, is the sum of the discounted variable replacement costs, is the sum of the discounted variable maintenance costs, and is the life cycle fixed cost. Only the variable costs are detailed because the fixed cost does not impact the optimisation results [41]. The term is detailed in [13] and includes the initial, maintenance, and replacement costs of the borehole, the pipes, and taps.
The variable initial cost is:
where ,, and are the capital costs of the PV array, the motor-pump, the tank, and the battery, respectively; for a tank PVWPS, and for a battery PVWPS. The annual maintenance cost is estimated at 1% of the initial cost each year [13]. Thus, the discounted variable maintenance cost is:
where is the discount rate, and is the lifetime of the system. The discounted replacement cost is given by:
where , the replacement costs for PVWPS at year i is:
where , , , , are equal to 1 if i is a multiple of the PV array lifetime , the motor-pump lifetime , the tank lifetime , the battery lifetime or the charge controller lifetime , respectively, and 0 otherwise.
3. Case Study
3.1. PVWPS in Gogma, Burkina Faso
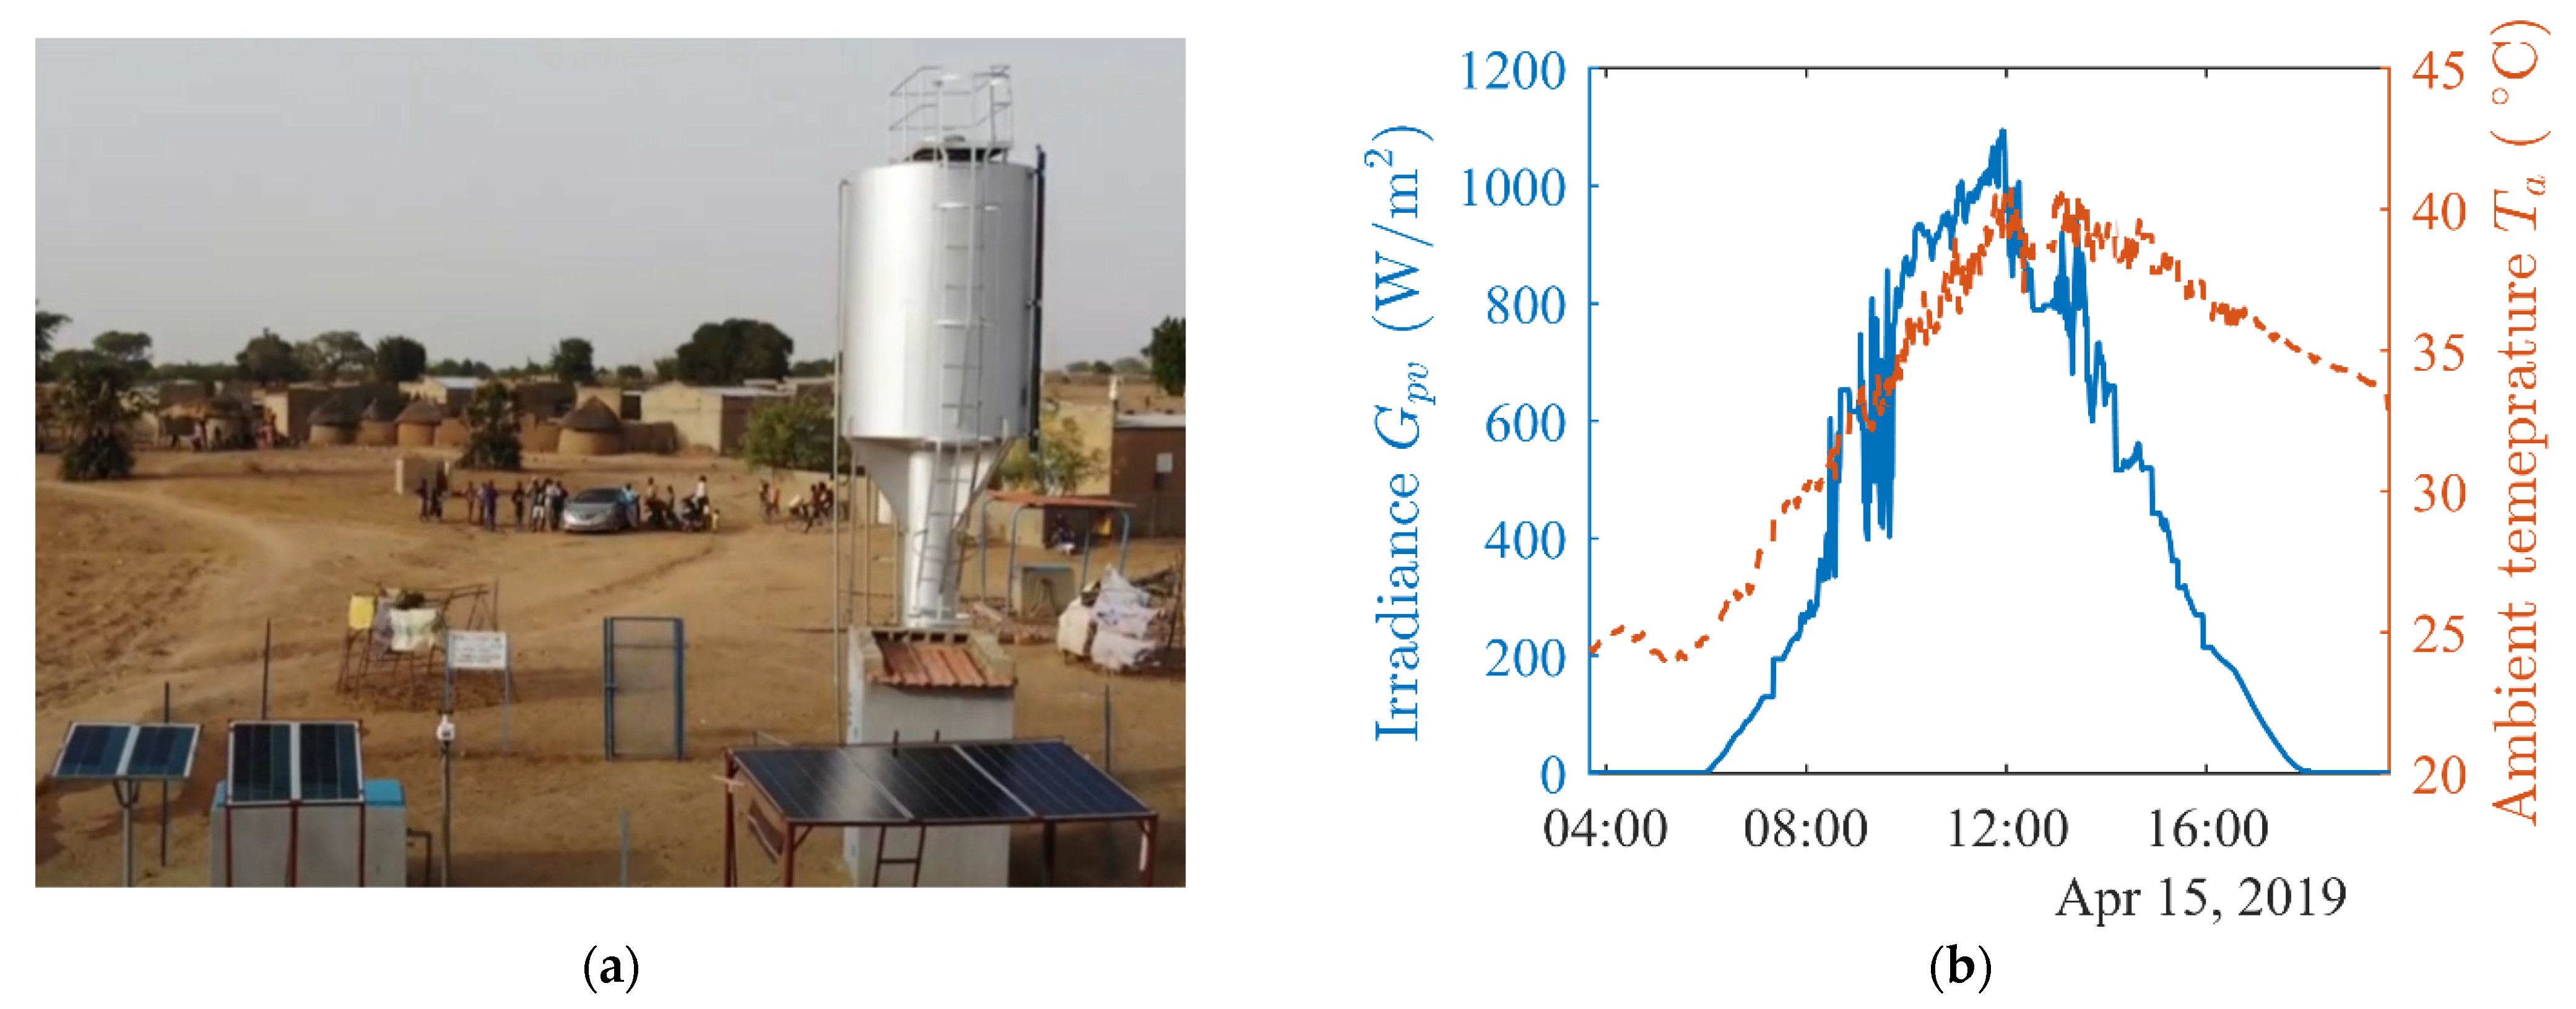
In the following, we consider the case study of the village of Gogma, located in the centre-eastern Burkina Faso, Sub-Sahara African. The village hosts 1100 inhabitants and there is no running water. A tank PVWPS is installed in Gogma since January 2018. Figure 3a shows this installation. A video of the system is also available on: https://youtu.be/VrjM0edKVsI (accessed on 17 March 2021). The PV array has a peak power of 610 Wp, the motor-pump reference is a SQFlex 5A-7 (Grundfos) and the tank volume is 11.4 m3. The PVWPS provides water to around 280 inhabitants of the village. Around 8 m3 are pumped daily during the dry season and around 6 m3 during wet season [26].
Since January 2018, we have been collecting the irradiance on the plane of the PV array , the ambient temperature , and the collected flow rate in Gogma with a time step of ~2.2 s [28]. The data used were rescaled to an equally spaced temporal resolution of 1 min by nearest interpolation [42,43]. The water demand is inferred from the collected flow rate and is characterized by a list of user groups , with their arrival time and their water demand volume . It is possible to determine the demand profile from the collected flow rate because the current system of Gogma is oversized. An extract of the data measured by the sensors is shown in Figure 3b. We present the user groups deduced from the collected flow rate in Figure 3c and the daily demand profile in Figure 3d.
3.2. Technical and Economic Models Parameters
4. Quantitative Comparison through Techno-Economic Optimization
4.1. Method
To find the most suitable architecture for a particular case, it is necessary to compare the optimized systems. We make separate optimizations for the two architectures and then compare these optimizations’ results to determine the cheapest architecture. For each optimization, we use the differential evolution algorithm detailed in reference [47]. Technical models are evaluated during two weeks of the dry season (from the 8th to 21st of April 2019) and two weeks of the wet season (from the 24th of June to the 7th of July 2019) [41], to represent the whole year.
4.2. Formulation
The optimizations are formulated as follows:
For tank architecture:
such that
For battery architecture:
such that
The optimization’s objective is to minimize the life cycle cost (see Equation (12)). The optimization variables are the PV array peak power , the motor-pump reference the size of the storage devices (tank volume or battery capacity ), and the reference value of control mode in the case of a battery architecture. We consider that the PV array peak power can be comprised between 100 and 2000 Wp and the tank volume between 5 and 30 m3 [13]. The principal constraint is to meet the current water demand at Gogma’s PVWPS. We formulate this constraint by checking that the volume delivered between the arrival of a group i (at ) and the arrival of the next group (at ) is larger than the water demand volume of the group (see Figure 3 and Section 3.1). The groups are constructed in such a way that they are separated by at least 20 min or a period without demand. is the number of groups of users. Another constraint is that the water level in the borehole must remain above the position of the motor-pump. In Gogma, the motor-pump is 30 m below ground. The last constraint is that the total dynamic head must remain lower than the maximum pumping height given in the datasheet of the motor-pump reference MP [41].
5. Results of the Optimizations and Comparison of Architectures
Table 3 presents the results of the optimization for both architectures. Another control mode of the motor-pump has been studied for battery architecture: a control by fixed power. The results found are very similar to those obtained for battery architecture with flow rate control, and the optimal sizing has slightly larger life cycle cost [30]. Therefore, these results are not detailed in this article.
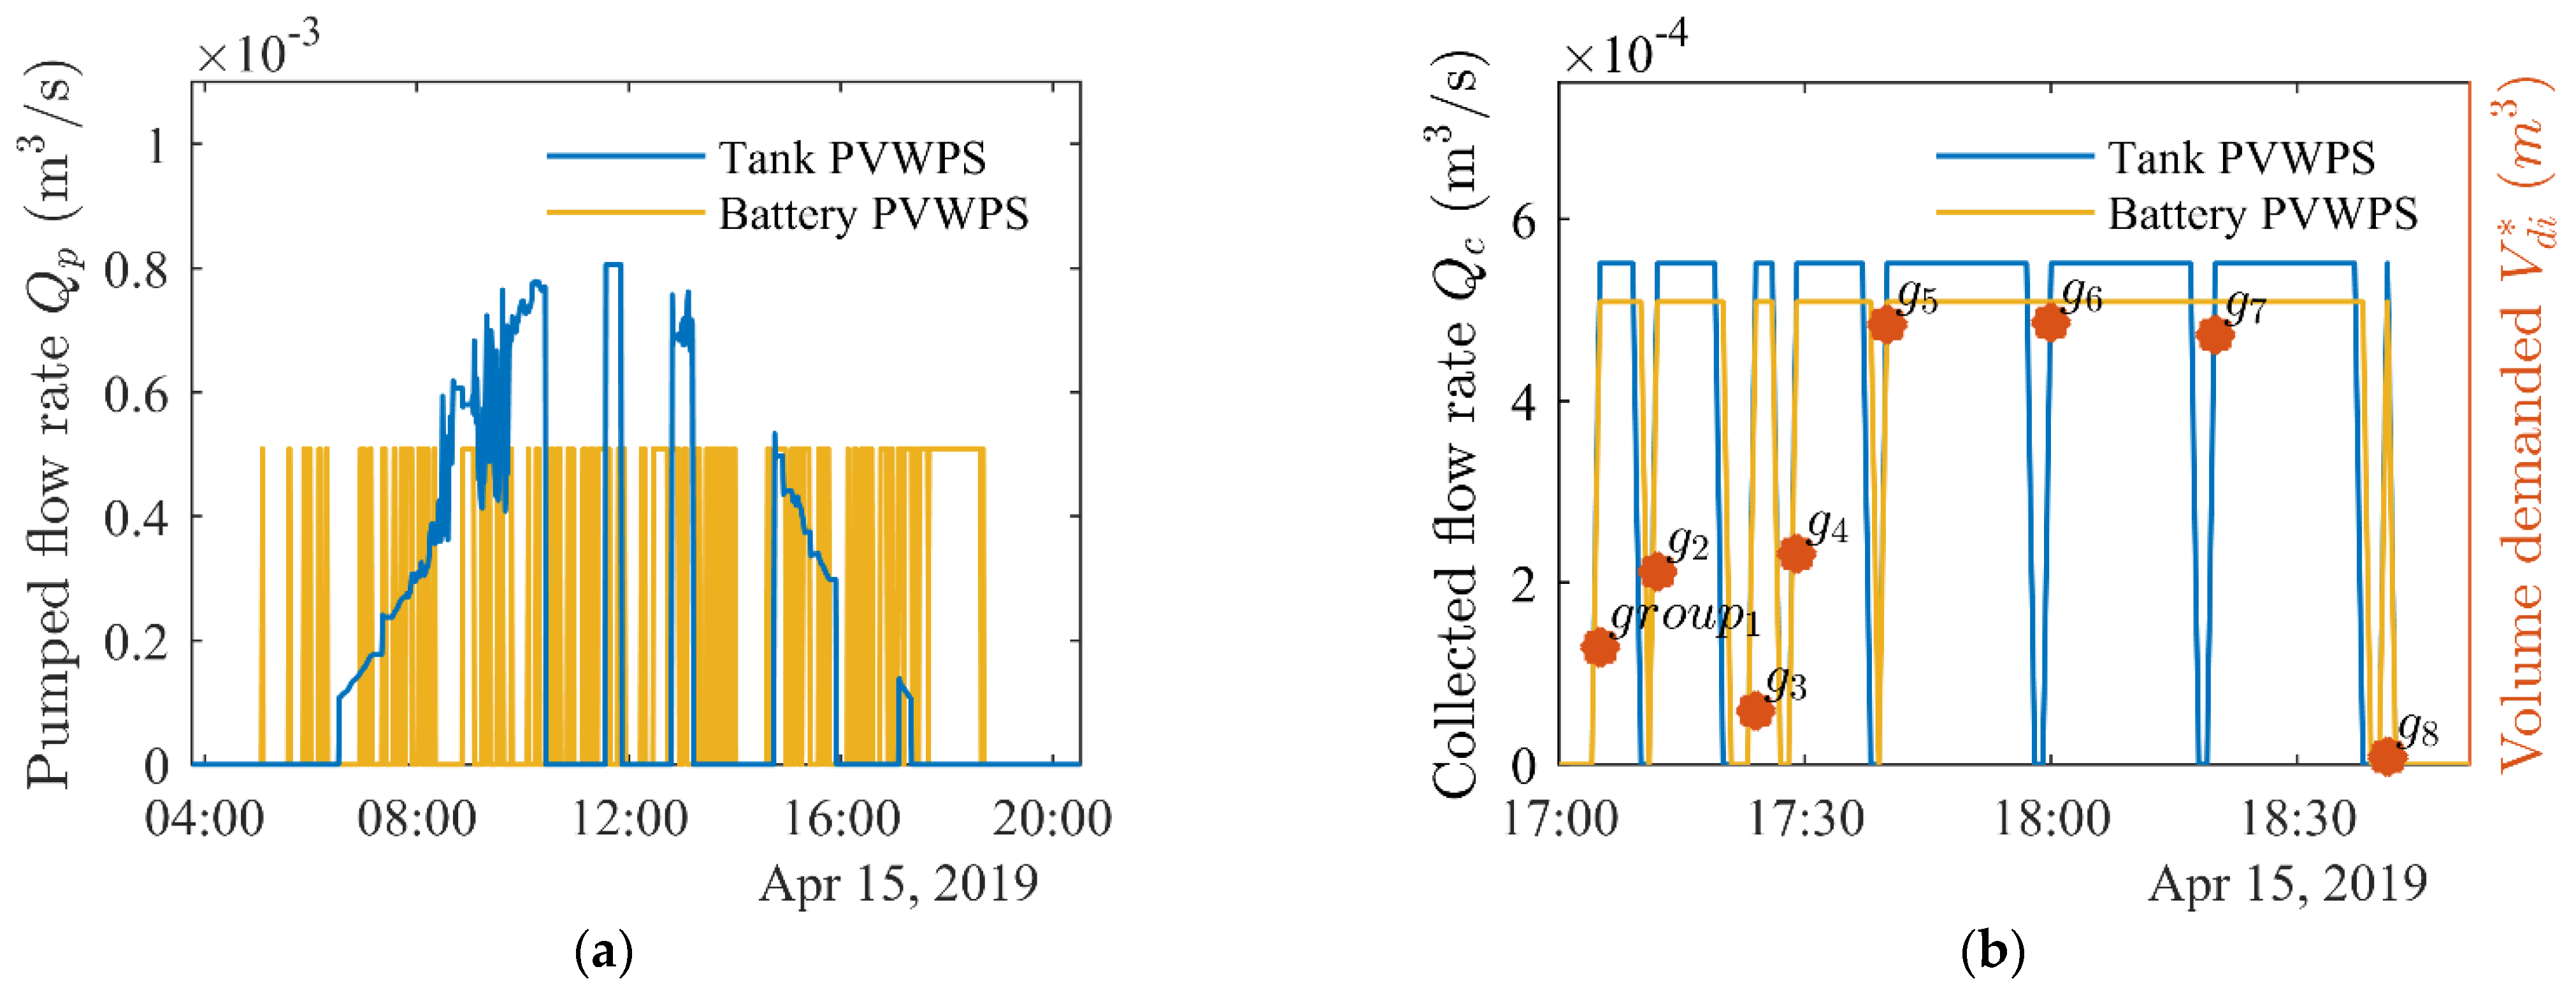
Figure 4 compares the pumped and collected flow rates on a fraction of the 15th of April 2019, for both optimized architectures. It shows that the pumped flow rate is larger for the tank PVWPS but that the motor-pump starts and stops more for the battery PVWPS. The collected flow rates are similar for both PVWPS and each group demand is satisfied. While the tank architecture has been experimented on in [28], the battery architecture still needs to be implemented and monitored to experimentally confirm these results.
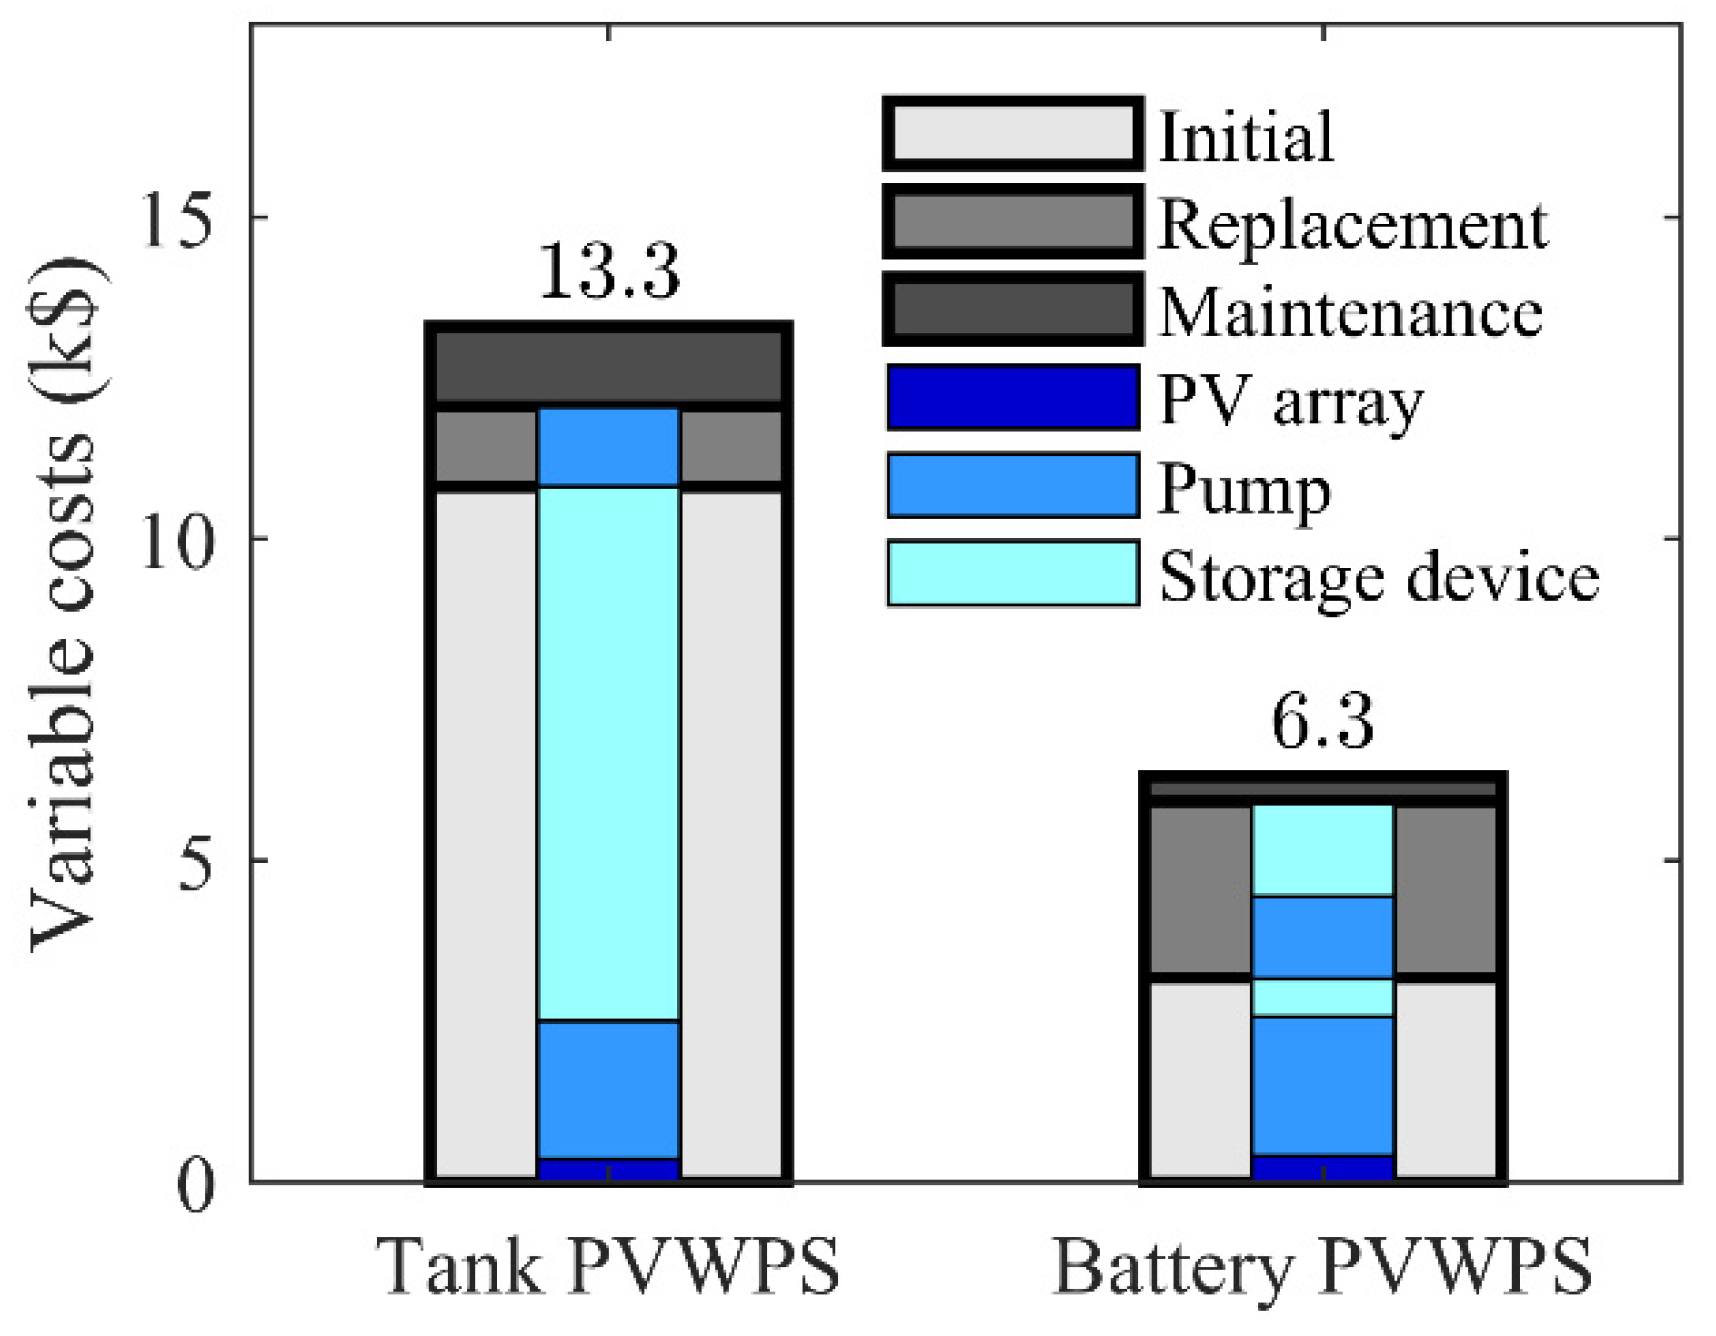
Figure 5 presents the breakdown of the variable costs for each system. It shows the repartition between the costs for initial installation, maintenance, and replacement. It also shows the different components’ share in these costs.
In terms of life cycle cost, the battery architecture is cheaper for the case study of Gogma. This is mainly due to the difference in initial cost between both architectures (see Figure 5) because of the cost of storage devices. Indeed, the tank is a lot more expensive than the battery bank. However, it is interesting to note that the variable costs represent only 27 to 43% of the LCC. Thus, the choice of an adapted architecture and the optimization of sizing impacts only a fraction of the cost.
Non-economic criteria should also be considered: modularity, number of starts, and stops of the motor-pump, availability, impact on groundwater resources and toxicity.
Firstly, the battery architecture is more modular than the tank architecture. It is easier to change the battery bank’s capacity (during a replacement of the whole battery bank) than to change the tank’s volume. As it can be hard to estimate the water demand, the sizing can be challenging to adjust, and having flexibility after the installation of the system is a great advantage. Moreover, the demand of a population can change during the lifetime of the system, because of the population’s evolution and activities. Once again, the modularity of battery PVWPS is beneficial.
Secondly, the battery PVWPS is more stressful for the motor-pump than the tank PVWPS. In the presented case study, the tank PVWPS requires a maximum of eight starts and stops of the motor-pump per day with an average of four starts and stops; while the battery PVWPS requires a maximum of 107 starts and stops per day with an average of 84 starts and stops and a lot of starts and stops is more damaging for the pump than a continuous operation. However, the number of starts and stops remains in the range of operation of the considered motor-pumps for both architectures (at least 150 starts and stops per day [48,49]).
Thirdly, the use of batteries can also decrease the system availability. Indeed, in this case study, five replacements of the battery are needed throughout the lifetime of the PVWPS. Moreover, battery lifetime can be largely reduced if the discharge cycles are not well managed and regulated by an adapted charge controller [37,38,50]. The risk brought by batteries on the overall system’s availability is increased by thefts, notably because batteries are relatively small and expensive [51]. Battery replacements must be planned to ensure a long operation time of the system despite their relatively short lifetime. Several examples show that these replacements can be hard to ensure. It has been reported that technicians were sometimes unable to provide replacements [52], mostly because adequate batteries were not available. Sometimes the deep cycles batteries were replaced by automotive batteries [53]. These batteries cannot stand deep cycles, so they will have a shorter lifespan and endanger the system’s sustainability. An adapted replacement framework must then be implemented when a battery PVWPS is installed.
Fourthly, in terms of impact on groundwater resources, the battery architecture threatens the sustainability of groundwater resources in the case of Gogma less. In our case study, thanks to the controlled pumping rate (see Figure 4a), the battery PVWPS has a maximum pumped flow rate of 17.9 L/min inferior to the tank one. Excessive pumped flow rates and drawdown can have dangerous consequences on the borehole and the whole aquifer [54]. Narvarte et al. underlined that an important pumped flow rate could damage the internal surface below the water table and create some voids. This phenomenon can result in the collapse of the borehole [55]. Moreover, important pumped flow rates may modify the structure of the surrounding soil and of the pressure map, and can create cavities like sinkholes [56] or even subsidence of the whole region [57].
Finally, in terms of toxicity, lead-acid batteries contain lead and antimony, which are particularly toxic. Leaks often resulting from a lack of maintenance [58] and can be dangerous for human health and the surrounding environment. Moreover, the unregulated recycling of lead batteries in Burkina Faso creates a health danger for the population (lead exposure) and concerns non-governmental organizations [59]. On the contrary, tanks that are usually found in these areas are made of stainless steel [44] which is not toxic but they can be a source of pollution if they are not decommissioned at their end of life.
6. Conclusions
The techno-economic analysis carried out for the village of Gogma defines optimal sizing for two architectures: battery and tank. The optimization results indicate that opting for a battery PVWPS instead of a tank PVWPS reduces the life cycle cost of the system by 22% ($31.1k for tank architecture and $24.1k for battery architecture). Moreover, the distribution of costs over the lifetime of the system is different between the two solutions. The initial cost is slightly larger for a tank PVWPS (84% for the tank architecture against 74% for the battery architecture). The results found for this case study could be relevant to similar isolated villages. As the initial and life cycle costs are barriers to installation for rural communities, the PVWPS with battery storage may benefit a larger community share.
However, the battery PVWPS requires to be replaced several times throughout its lifetime (20 years) while the tank lasts the whole PVWPS lifetime.
Each decision-maker will therefore have to select the best PVWPS adapted to his or her situation, considering the results of this techno-economic optimization and other aspects described here.
Several tracks can be considered to mitigate the difficulties brought by using batteries. The system’s maintenance including battery replacements could be closely supervised by the installer, during the whole lifetime of the system. Local people could also be trained to maintain the system. It is possible to mitigate some viability problems directly in the techno-economic optimization by adding, for instance, a constraint on the minimum lifetime of batteries, and choosing sizing where replacements are less frequent. However, it is essential to keep in mind that, given the climate in sub-Saharan Africa, current lead-acid batteries can last at the most four years, making their replacements unavoidable. Finally, only lead-acid batteries have been considered in this article because data collection showed that it is the only technology currently widely available in low-income rural areas. However, lithium-ion batteries, which are emerging in rural and isolated areas for stand-alone renewable energy systems [60], could mitigate some challenges, notably thanks to their longer lifespan and greater modularity [31,61,62]. They could thus be the object of future work. Note that an ageing model and charge control adapted to lithium-ion batteries should then be implemented.
In regard to the tank architecture, it would be helpful to expand the range of data collected for tank costs as this could allow the use of cheaper tanks, smaller than 5 m3 volume. For volumes between 2 and 10 m3, plastic tanks, which are cheaper, are usually used. A study of their costs in Burkina Faso has already been performed [44] but a study of their suitability for drinkable water is necessary before including them into the optimization.
The optimization methodology and comparison approach developed in this article may be used elsewhere in developing countries, and where irradiance, temperature, and water demand of the population are known. Our research did not yield a universal and most suitable architecture, but provides a methodology for optimizing and comparing these two systems in any situation. Therefore, this study can be useful to non-governmental organizations, companies, and governments that aim to install PVWPS for domestic water supply. First, it can guide their choice of architecture and help them to size the components. Second, it allows to predict the PVWPS operation before installation.
Author Contributions
Conceptualization, C.S., V.R., S.M., J.A.C., A.D., P.D. and L.Q.; methodology, C.S., V.R., S.M., J.A.C. and L.Q.; software, C.S., S.M., and P.D.; investigation, C.S.; data curation, C.S., S.M., and A.D.; writing—original draft preparation, C.S.; writing—review and editing, C.S., V.R., S.M., J.A.C., A.D., P.D. and L.Q.; visualization, C.S.; supervision, V.R., S.M., J.A.C. and L.Q.; project administration, V.R., S.M. and J.A.C. All authors have read and agreed to the published version of the manuscript.
Funding
This research was supported by a public grant overseen by the French National Research Agency (ANR) as part of the «Investissement d’Avenir» program, through the “IDI 2016” project funded by the IDEX Paris-Saclay, ANR-11-IDEX0003-02.
Data Availability Statement
Data can be made available upon request.
Acknowledgments
We thank the 280 contributors of the Turning Sun into Water project and the associations Eau Fil du Soleil and Respublica that allowed to finance the photovoltaic water pumping system of Gogma.
Conflicts of Interest
The authors declare no conflict of interest.
Nomenclature
| triggering signal from the switch | |
| battery capacity (Wh) | |
| CAPEX (battery, charge controller, motor-pump, PV array, tank) ($) | |
| final state of charge of cycle k | |
| initial variable cost ($) | |
| maintenance variable cost ($) | |
| replacement variable cost ($) | |
| temperature coefficient of the maximum power point (°C−1) | |
| depth of discharge of cycle k | |
| amplitude of reference | |
| discount rate | |
| state of the tap (open/close) | |
| type of architecture (battery/tank) | |
| activation energy (J/mol) | |
| energy stored in battery (Wh) | |
| irradiance on the plane of PV (W/m2) | |
| group of users (time of arrival, volume of water demanded (m3)) | |
| height between bottom of the tank and water level in the tank (m) | |
| height of tank (m) | |
| height between top of the tank and its entry level (m) | |
| height between entry level and stop level in the tank (m) | |
| height between stop level and restart level in the tank (m) | |
| level of water in the tank (m) | |
| height between ground level and static water level in the borehole (m) | |
| height between static water level and water level during pumping (m) | |
| height between ground level and fountain (m) | |
| maximum TDH for motor-pumps (m) | |
| efficiency of battery charging | |
| efficiency of charge controller | |
| current from battery to motor-pump (A) | |
| maximum current from battery (A) | |
| nominal current of motor-pump (A) | |
| aquifer losses coefficient (s/m2) | |
| lifetime (battery, charge controller, motor-pump, PV array, tank) (year) | |
| life cycle cost ($) | |
| fixed part of life cycle cost ($) | |
| reference of motor pump | |
| borehole losses coefficients (s2/m5) | |
| variable replacement costs of year i ($) | |
| NOCT | Normal Operating Cell Temperature |
| power consumed by the motor-pump (W) | |
| maximum power to motor-pump (W) | |
| power generated by PV array (W) | |
| peak power of PV array (Wp) | |
| power to battery (W) | |
| reference flow rate (m3/s) | |
| nominal flow rate of the fountain tank (m3/s) | |
| , | collected flow rate of tank/battery architecture (m3/s) |
| pumped flow rate (m3/s) | |
| battery resistance (Ω) | |
| Arrhenius constant (J.mol−1.K−1) | |
| surface of the base of the tank (m2) | |
| state of charge of the battery | |
| ambient temperature (°C) | |
| total dynamic head (m) | |
| voltage of battery during absorption/float phase (V) | |
| (t) | voltage of battery (V) |
| reconnection level of motor-pump for charge controller (V) | |
| disconnection level of motor-pump for charge controller (V) | |
| volume of tank (m3) | |
| pipe pressure losses coefficient (s2/m5) |
References
- Muhsen, D.H.; Khatib, T.; Nagi, F. A review of photovoltaic water pumping system designing methods, control strategies and field performance. Renew. Sustain. Energy Rev. 2017, 68, 70–86. [Google Scholar] [CrossRef]
- Barhdadi, A. Photovoltaic Water Pumping Systems in Rural Areas Photovoltaic Water Pumping Systems in Rural Areas. In Proceedings of the 4 International Conference on Water Resources and Arid Environments (ICWRAE 4), Riyadh, Saudi Arabia, 5–8 December 2010; pp. 836–843. [Google Scholar]
- Aliyu, M.; Hassan, G.; Elamin, I.M.; Said, S.A.; Siddiqui, M.U.; Alawami, A.T. A review of solar-powered water pumping systems. Renew. Sustain. Energy Rev. 2018, 87, 61–76. [Google Scholar] [CrossRef]
- Li, G.; Jin, Y.; Akram, M.W.; Chen, X. Research and current status of the solar photovoltaic water pumping system—A review. Renew. Sustain. Energy Rev. 2017, 79, 440–458. [Google Scholar] [CrossRef]
- Parajuli, R.; Pokharel, G.R.; Østergaard, P.A. A comparison of diesel, biodiesel and solar PV-based water pumping systems in the context of rural Nepal. Int. J. Sustain. Energy 2014, 33, 536–553. [Google Scholar] [CrossRef]
- Chilundo, R.J.; Mahanjane, U.S.; Neves, D. Design and Performance of Photovoltaic Water Pumping Systems: Comprehensive Review towards a Renewable Strategy for Mozambique. J. Power Energy Eng. 2018, 6, 32–63. [Google Scholar] [CrossRef] [Green Version]
- Skretas, S.B.; Papadopoulos, D.P. Systematic procedure for efficient design of electric water pumping systems fed by PV or/and WECS: Application using measured meteorological data for the city of Xanthi/Thrace, Greece. Energy Convers. Manag. 2008, 49, 596–607. [Google Scholar] [CrossRef]
- Chandel, S.S.; Nagaraju Naik, M.; Chandel, R. Review of solar photovoltaic water pumping system technology for irrigation and community drinking water supplies. Renew. Sustain. Energy Rev. 2015, 49, 1084–1099. [Google Scholar] [CrossRef]
- Chandel, S.S.; Naik, M.N.; Chandel, R. Review of performance studies of direct coupled photovoltaic water pumping systems and case study. Renew. Sustain. Energy Rev. 2017, 76, 163–175. [Google Scholar] [CrossRef]
- Dhiaa Muhsen, H.; Ghazali, A.B.; Khatib, T. Multiobjective differential evolution algorithm-based sizing of a standalone photovoltaic water pumping system. Energy Convers. Manag. 2016, 118, 32–43. [Google Scholar] [CrossRef]
- Bouzidi, B. New sizing method of PV water pumping systems. Sustain. Energy Technol. Assess. 2013, 4, 1–10. [Google Scholar] [CrossRef]
- Bakelli, Y.; Hadj Arab, A.; Azoui, B. Optimal sizing of photovoltaic pumping system with water tank storage using LPSP concept. Sol. Energy 2011, 85, 288–294. [Google Scholar] [CrossRef]
- Meunier, S. Optimal Design of Photovoltaic Water Pumping Systems for Rural Communities—A Technical, Economic and Social Approach. Ph.D. Thesis, Université Paris-Saclay, Gif-sur-Yvette, France, 2019. [Google Scholar]
- Anis, W.R.; Nour, M.A. Optimum design of a photovoltaic powered pumping system. Energy Convers. Manag. 1994, 35, 1123–1130. [Google Scholar] [CrossRef]
- Khan, M.T.A.; Ahmed, M.R.; Ahmed, S.I.; Khan, S.I. Design and performance analysis of water pumping using solar PV. In Proceedings of the 2nd International Conference on the Developments in Renewable Energy Technology, ICDRET 2012, Dhaka, Bangladesh, 26–28 March 2012; pp. 48–51. [Google Scholar]
- Meah, K.; Fletcher, S.; Ula, S. Solar photovoltaic water pumping for remote locations. Renew. Sustain. Energy Rev. 2008, 12, 472–487. [Google Scholar] [CrossRef]
- Gopal, C.; Mohanraj, M.; Chandramohan, P.; Chandrasekar, P. Renewable energy source water pumping systems—A literature review. Renew. Sustain. Energy Rev. 2013, 25, 351–370. [Google Scholar] [CrossRef]
- Chand, V.; Kalamkar, V.R. Solar photovoltaic water pumping system—A comprehensive review. Renew. Sustain. Energy Rev. 2016, 59, 1038–1067. [Google Scholar] [CrossRef]
- Khatib, T.; Mohamed, A.; Sopian, K. A review of photovoltaic systems size optimization techniques. Renew. Sustain. Energy Rev. 2013, 22, 454–465. [Google Scholar] [CrossRef]
- Muhsen, D.H.; Ghazali, A.B.; Khatib, T.; Abed, I.A.; Natsheh, E.M. Sizing of a standalone photovoltaic water pumping system using a multi-objective evolutionary algorithm. Energy 2016, 109, 961–973. [Google Scholar] [CrossRef]
- Basalike, P. Design, Optimization and Economic Analysis of Photovoltaic Water Pumping Technologies. Master’s Thesis, School of Business, Society and Engineering, Mälardalen University, Eskilstuna Västeras, Sweden, 2015. [Google Scholar]
- Sidrach-de-Cardona, M.; López, L.M. A simple model for sizing stand alone photovoltaic systems. Sol. Energy Mater. Sol. Cells 1998, 55, 199–214. [Google Scholar] [CrossRef]
- Vick, B.D.; Clark, R.N. Determining the optimum solar water pumping system for domestic use, livestock watering or irrigation. In Proceedings of the 38th ASES National Solar Conference, SOLAR, Buffalo, New York, NY, USA, 11–16 May 2009; Volume 4, pp. 2212–2239. [Google Scholar]
- Watson, S.; Bian, D.; Sahraei, N.; Winter, A.G.; Buonassisi, T.; Peters, I.M. Advantages of operation flexibility and load sizing for PV-powered system design. Sol. Energy 2018, 162, 132–139. [Google Scholar] [CrossRef]
- Pardo, M.Á.; Cobacho, R.; Bañón, L. Standalone photovoltaic direct pumping in urban water pressurized networks with energy storage in tanks or batteries. Sustainability 2020, 12, 738. [Google Scholar] [CrossRef] [Green Version]
- Meunier, S.; Queval, L.; Darga, A.; Dessante, P.; Marchand, C.; Heinrich, M.; Cherni, J.A.; De La Fresnaye, E.A.; Vido, L.; Multon, B.; et al. Modelling and optimal sizing of photovoltaic water pumping systems—Sensitivity analysis. In Proceedings of the 2019 14th International Conference on Ecological Vehicles and Renewable Energies, EVER 2019, Monte-Carlo, Monaco, 8–10 May 2019. [Google Scholar]
- Kazem, H.A.; Al-Waeli, A.H.A.; Chaichan, M.T.; Al-Mamari, A.S.; Al-Kabi, A.H. Design, measurement and evaluation of photovoltaic pumping system for rural areas in Oman. Environ. Dev. Sustain. 2017, 19, 1041–1053. [Google Scholar] [CrossRef]
- Meunier, S.; Heinrich, M.; Quéval, L.; Cherni, J.A.; Vido, L.; Darga, A.; Dessante, P.; Multon, B.; Kitanidis, P.K.; Marchand, C. A validated model of a photovoltaic water pumping system for off-grid rural communities. Appl. Energy 2019, 241, 580–591. [Google Scholar] [CrossRef] [Green Version]
- Grundfos SQFlex Data Booklet. Available online: https://www.solarpumpsafrica.com/wp-content/uploads/2014/07/SQ-Flex-Data-Booklet-May-2017.pdf (accessed on 3 April 2020).
- Soenen, C. An Analysis of Adapted Storage Approaches for Photovoltaic Water Pumping Systems in Developing Countries. Master’s Thesis, Imperial College London, London, UK, 2020. [Google Scholar]
- Dufo-Lopez, R.; Zubi, G.; Fracastoro, G.V. Tecno-economic assessment of an off-grid PV-powered community kitchen for developing regions. Appl. Energy 2012, 91, 255–262. [Google Scholar] [CrossRef]
- Stevens, J.W.; Corey, G.P. Study of lead-acid battery efficiency near top-of-charge and the impact on PV system design. In Proceedings of the Conference Record of the IEEE Photovoltaic Specialists Conference, Washington, DC, USA, 13–17 May 1996; pp. 1485–1488. [Google Scholar]
- Dini, M. Modélisation et Identification des Paramètres Internes d’une Batterie au Plomb pour la Gestion d’un Microgrid. Master’s Thesis, Centrale Supélec, Gif-sur-Yvette, France, 2019. [Google Scholar]
- Victron Energy Gel et AGM Batteries Datasheet. Available online: https://www.victronenergy.com/upload/documents/Datasheet-GEL-and-AGM-Batteries-EN.pdf (accessed on 7 May 2020).
- Ultracell Ucg 100AH-12V Lead-Acid Battery. Available online: https://ultracell.co.uk/www.ultracell.co.uk/products/ucg-batteries/12v.html (accessed on 17 January 2020).
- Felicity Solar Solar Battery: User Instructions. Available online: https://www.energy-xprt.com/downloads/felicity-solar-model-fl-g-200ah12v-12v-200ah-gel-solar-battery-brochure-811472 (accessed on 17 January 2020).
- Gustavsson, M.; Mtonga, D. Lead-acid battery capacity in solar home systems—Field tests and experiences in Lundazi, Zambia. Sol. Energy 2005, 79, 551–558. [Google Scholar] [CrossRef]
- ACP-EU Energy Facility. Batteries—A Key Constraint for Off-Grid Solar. Experiences from EU-Supported Projects 2007–2019; FONDEM: Paris, France, 2019; pp. 1–27. [Google Scholar]
- Langella, R.; Testa, A.; Ventre, C. A new model of lead-acid batteries lifetime in smart grid scenario. In Proceedings of the Energycon 2014—IEEE International Energy Conference, Dubrovnik, Croatia, 13–16 May 2014; pp. 1343–1348. [Google Scholar]
- Nguyen, T.M.P. Lead Acid Batteries in Extreme Conditions: Accelerated Charge, Maintaining the Charge with Imposed Low Current, Polarity Inversions Introducing Non-Conventional Charge Methods. Ph.D. Thesis, Université Montpellier II, Montpellier, France, 2009. [Google Scholar]
- Vezin, T.; Meunier, S.; Quéval, L.; Cherni, J.A.; Vido, L.; Darga, A.; Dessante, P.; Kitanidis, P.K.; Marchand, C. Borehole water level model for photovoltaic water pumping systems. Appl. Energy 2020, 258, 114080. [Google Scholar] [CrossRef]
- Meunier, S.; Queval, L.; Heinrich, M.; De La Fresnaye, E.A.; Cherni, J.A.; Vido, L.; Darga, A.; Dessante, P.; Multon, B.; Kitanidis, P.K.; et al. Effect of irradiance data on the optimal sizing of photovoltaic water pumping systems. In Proceedings of the Conference Record of the IEEE Photovoltaic Specialists Conference, Chicago, IL, USA, 16–21 June 2019; pp. 653–658. [Google Scholar]
- Meunier, S.; Queval, L.; Darga, A.; Dessante, P.; Marchand, C.; Heinrich, M.; Cherni, J.; Vido, L.; Multon, B. Influence of The Temporal Resolution of The Water Consumption Profile on Photovoltaic Water Pumping Systems Modelling and Sizing. In Proceedings of the 2018 7th International Conference on Renewable Energy Research and Applications, Paris, France, 14–17 October 2018; pp. 494–499. [Google Scholar]
- De La Fresnaye, E.A. A Financial and Technical Assessment of Solar Versus Hand Water Pumping for Off-Grid Area—The Case of Burkina Faso. Master’s Thesis, Imperial College London, London, UK, 2018. [Google Scholar]
- Meunier, S.; Queval, L.; Darga, A.; Dessante, P.; Marchand, C.; Heinrich, M.; Cherni, J.A.; De La Fresnaye, E.A.; Vido, L.; Multon, B.; et al. Sensitivity Analysis of Photovoltaic Pumping Systems for Domestic Water Supply. IEEE Trans. Ind. Appl. 2020, 56, 6734–6743. [Google Scholar] [CrossRef]
- Victron Energy Contrôleurs de Charge SmartSolar Avec Sortie de Charge. Available online: https://www.victronenergy.com/solar-charge-controllers/smartsolar-mppt-75-10-75-15-100-15-100-20 (accessed on 27 February 2021).
- Price, K.; Storn, R.; Lampinen, J. Differential Evolution: A Practical Approach to Global Optimization; Rozenberg, G., Ed.; Springer: Berlin/Heidelberg, Germany, 2005; ISBN 9783540209508. [Google Scholar]
- Lorentz the Solar Water Pumping Company PS2: The Complete, Efficient, Solar Water Pumping Solution Delivering You more Water! Available online: https://partnernet.lorentz.de/files/lorentz_ps2_product-brochure_en.pdf (accessed on 31 October 2019).
- Franklin Electric. Franklin Water Products. Available online: https://franklinwater.com/ (accessed on 12 July 2020).
- Hankins, M. Solar Electric Systems for Africa: A Guide for Plannning and Installing Solar Systems in Rural Africa; Simalenga, T., Ed.; Commonwealth Science Council: London, UK, 1995; ISBN 9781437735789.
- Short, T.D.; Oldach, R. Solar powered water pumps: The past, the present—And the future? J. Sol. Energy Eng. Trans. ASME 2003, 125, 76–82. [Google Scholar] [CrossRef]
- Dornan, M. Solar-based rural electrification policy design: The Renewable Energy Service Company (RESCO) model in Fiji. Renew. Energy 2011, 36, 797–803. [Google Scholar] [CrossRef]
- Martz, J.E.; Roberts, A.F. Operational Performance of the Photovoltaic-Powered Grain Mill and Water Pump at Tangaye, Burkina Faso (Formerly Upper Volta); Final Report; NASA: Washington, DC, USA, 1985.
- Foster, S.; Chilton, P. Groundwater: The processes and global significance of aquifer degradation. Philos. Trans. R. Soc. B Biol. Sci. 2003, 358, 1957–1972. [Google Scholar] [CrossRef] [Green Version]
- Narvarte, L.; Lorenzo, E.; Caamano, E. PV pumping analytical design and characteristics of boreholes. Sol. Energy 2000, 68, 49–56. [Google Scholar] [CrossRef]
- Doǧan, U.; Yilmaz, M. Natural and induced sinkholes of the Obruk Plateau and Karapidotlessnar-Hotam Plain, Turkey. J. Asian Earth Sci. 2011, 40, 496–508. [Google Scholar] [CrossRef]
- Teatini, P.; Ferronato, M.; Gambolati, G.; Gonella, M. Groundwater pumping and land subsidence in the Emilia-Romagna coastland, Italy: Modeling the past occurrence and the future trend. Water Resour. Res. 2006, 42, 1–19. [Google Scholar] [CrossRef]
- Zhang, J.; Chen, C.; Zhang, X.; Liu, S. Study on the Environmental Risk Assessment of Lead-Acid Batteries. Procedia Environ. Sci. 2016, 31, 873–879. [Google Scholar] [CrossRef] [Green Version]
- United Nations Environment Programm. Workshop on Sound Management of Used Lead Acid Batteries in Africa; UNEP: Ouagadougou, Burkina Faso, 2017. [Google Scholar]
- Zubi, G.; Dufo-López, R.; Carvalho, M.; Pasaoglu, G. The lithium-ion battery: State of the art and future perspectives. Renew. Sustain. Energy Rev. 2018, 89, 292–308. [Google Scholar] [CrossRef]
- Diouf, B.; Pode, R. Potential of lithium-ion batteries in renewable energy. Renew. Energy 2015, 76, 375–380. [Google Scholar] [CrossRef]
- Anuphappharadorn, S.; Sukchai, S.; Sirisamphanwong, C.; Ketjoy, N. Comparison the economic analysis of the battery between lithium-ion and lead-acid in PV stand-alone application. Energy Procedia 2014, 56, 352–358. [Google Scholar] [CrossRef] [Green Version]
Figure 1.
(a) Tank PVWPS. (b) Battery PVWPS. : height between the ground level and the bottom of the tank, : tank height, (<0): height between the top of the tank and the water entry in the tank, (<0): height between the water entry and the stop controller level, (<0): height between the stop controller level and the restart level, : water level in the tank, (<0): height between the ground level and the static water level in the borehole, (<0): height between the static level and the water level in the borehole (i.e., the drawdown), : the height between the ground level and the fountain’s tap.

Figure 2.
(a) Model of a PVWPS with tank storage. (b) Model of a PVWPS using battery storage.

Figure 3.
(a) Overview of the PVWPS of Gogma. (b) Measured irradiance on the plane of the PV modules and ambient temperature (model inputs). (c) Measured collected flow rate. (d) Group of users (model inputs).
Figure 3.
(a) Overview of the PVWPS of Gogma. (b) Measured irradiance on the plane of the PV modules and ambient temperature (model inputs). (c) Measured collected flow rate. (d) Group of users (model inputs).


Figure 4.
(a) Comparison of pumped flow rates for both optimized architectures. (b) Comparison of collected flow rates for both optimized architectures.
Figure 4.
(a) Comparison of pumped flow rates for both optimized architectures. (b) Comparison of collected flow rates for both optimized architectures.

Figure 5.
Breakdowns of variable costs of both optimized architectures.


Table 1.
Technical parameters for Gogma.
| Common to the Tank and Battery PVWPS | Relative to the Tank PVWPS | Relative to the Battery PVWPS |
|---|---|---|
| System | Tank [45] | Lead-acid batteries [34,35,36] |
| L = 20 years | = 4.2 m | = 48 V |
| = 3.4 m | = 6 mΩ | |
| PV array [45] | = 0.4 m | = 43.2 V |
| = 0.1 m | = 7.5 V | |
| = 0.1 m | = 8 years | |
| Motor-pump [29,41] | Fountain | Charge controller [46] |
| = 8.4 A | 5.5 × 10⁻⁴ m3/s | = 44.4 V |
| Models: SQFlex 5A-3, SQFlex | = 55.2 V | |
| 0.6–2, SQFlex 8A-5, SQFlex8A- | = 57.6 V | |
| 3, SQFlex 11A-3, SQFlex 1.2-2 | = 55.2 V | |
| SQFlex 5A-7 and SQFlex2.5-2 | = 98% | |
| = 20 A | ||
| Hydraulic model [41] | ||
| = 2.4 × 10³ s/m2 | Fountain | |
| = 8.4 × 10⁵ s²/m5 | = 1 m | |
| = 4.9 × 10⁶ s²/m5 | ||
| = 7.5 m |
Table 2.
Economic parameters for Gogma.
| Common to Tank and Battery PVWPS | Relative to the Tank PVWPS | Relative to the Battery PVWPS |
|---|---|---|
| PV array [13] | Steel tank [13] | Lead-acid batteries [30] |
| [$] = 20 years | = = 20 years | is obtained from Equation (11) |
| Motor-pump [13] | Charge controller [30,46] | |
| $ = 10 years | 150 $ = 5 years | |
| Discount rate [44] | ||
| = 5.6% | ||
| Fixed costs [13] | ||
Table 3.
Comparison of tank and battery optimal PVWPS.
| Tank PVWPS | Battery PVWPS | ||
|---|---|---|---|
| Sizing | PV peak power | 410 Wp | 462 Wp |
| Motor-pump reference | SQFlex 2.5-2 | SQFlex 2.5-2 | |
| Tank volume | 5 m3 | ||
| Battery capacity | 1673 Wh | ||
| 30.4 L/min | |||
| Economic | Variable costs | $13.3 k | $6.3 k |
| Fixed costs | $17.8 k | $17.8 k | |
| $31.1 k | $24.1 k | ||
| Maintenance | Storage replacements | 0 | 5 |
| Starts and stops per day | max: 8–mean: 4 | max: 107–mean: 84 | |
| Availability of spare parts | Not applicable | Low | |
| Environment | Toxicity | Low | High (lead) |
| Maximum pumped flow rate | 48.3 L/min | 30.4 L/min | |
| Lowest water level in the borehole | −10.0 m | −8.9 m | |
Publisher’s Note: MDPI stays neutral with regard to jurisdictional claims in published maps and institutional affiliations. |
© 2021 by the authors. Licensee MDPI, Basel, Switzerland. This article is an open access article distributed under the terms and conditions of the Creative Commons Attribution (CC BY) license (https://creativecommons.org/licenses/by/4.0/).
Share and Cite
MDPI and ACS Style
Soenen, C.; Reinbold, V.; Meunier, S.; Cherni, J.A.; Darga, A.; Dessante, P.; Quéval, L. Comparison of Tank and Battery Storages for Photovoltaic Water Pumping. Energies 2021, 14, 2483. https://doi.org/10.3390/en14092483
AMA Style
Soenen C, Reinbold V, Meunier S, Cherni JA, Darga A, Dessante P, Quéval L. Comparison of Tank and Battery Storages for Photovoltaic Water Pumping. Energies. 2021; 14(9):2483. https://doi.org/10.3390/en14092483
Chicago/Turabian StyleSoenen, Camille, Vincent Reinbold, Simon Meunier, Judith A. Cherni, Arouna Darga, Philippe Dessante, and Loïc Quéval. 2021. "Comparison of Tank and Battery Storages for Photovoltaic Water Pumping" Energies 14, no. 9: 2483. https://doi.org/10.3390/en14092483
Note that from the first issue of 2016, this journal uses article numbers instead of page numbers. See further details here.