
Performance of a Rotating Detonation Rocket Engine with Various Convergent Nozzles and Chamber Lengths

 , and
, and
Abstract
:
1. Introduction
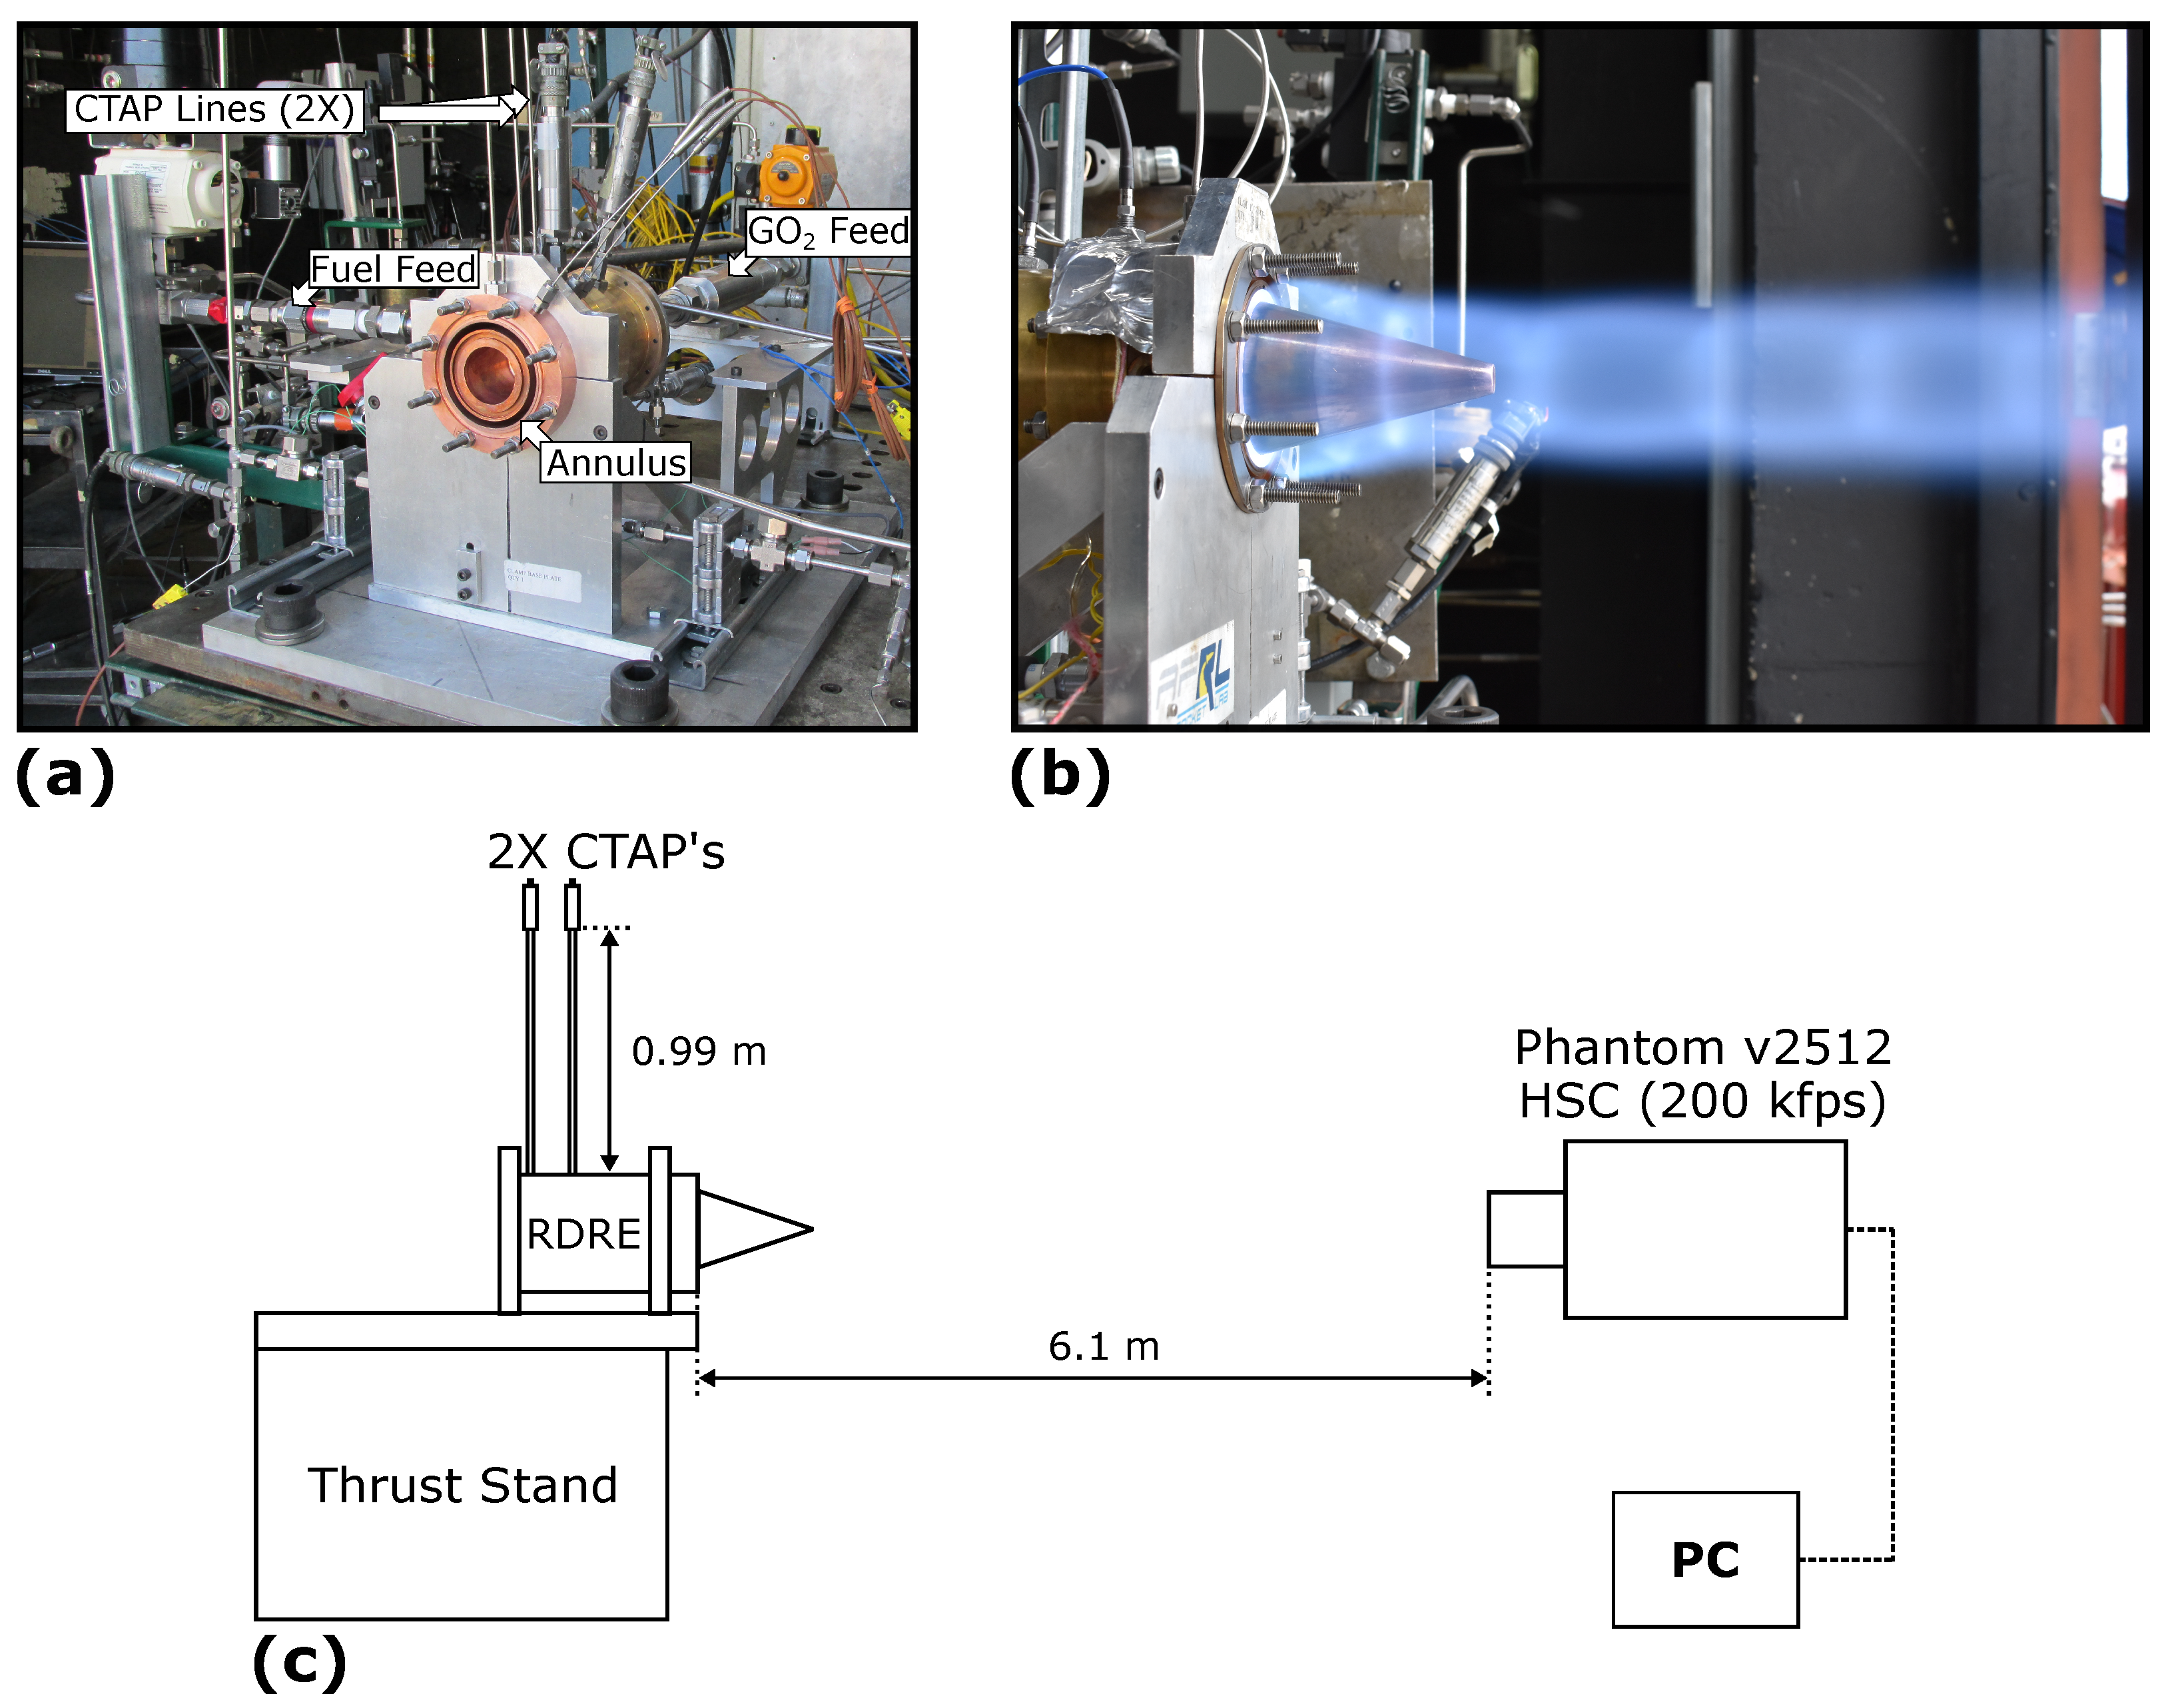
2. Experiment Setup
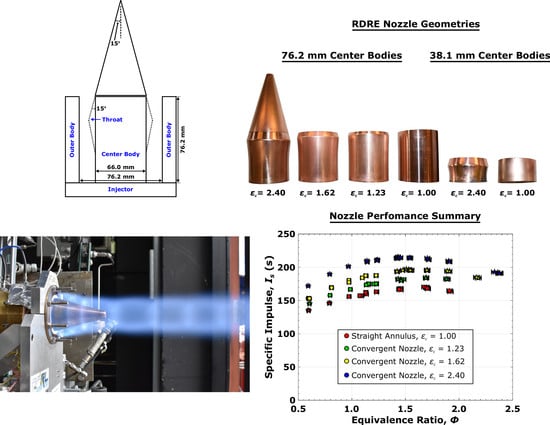
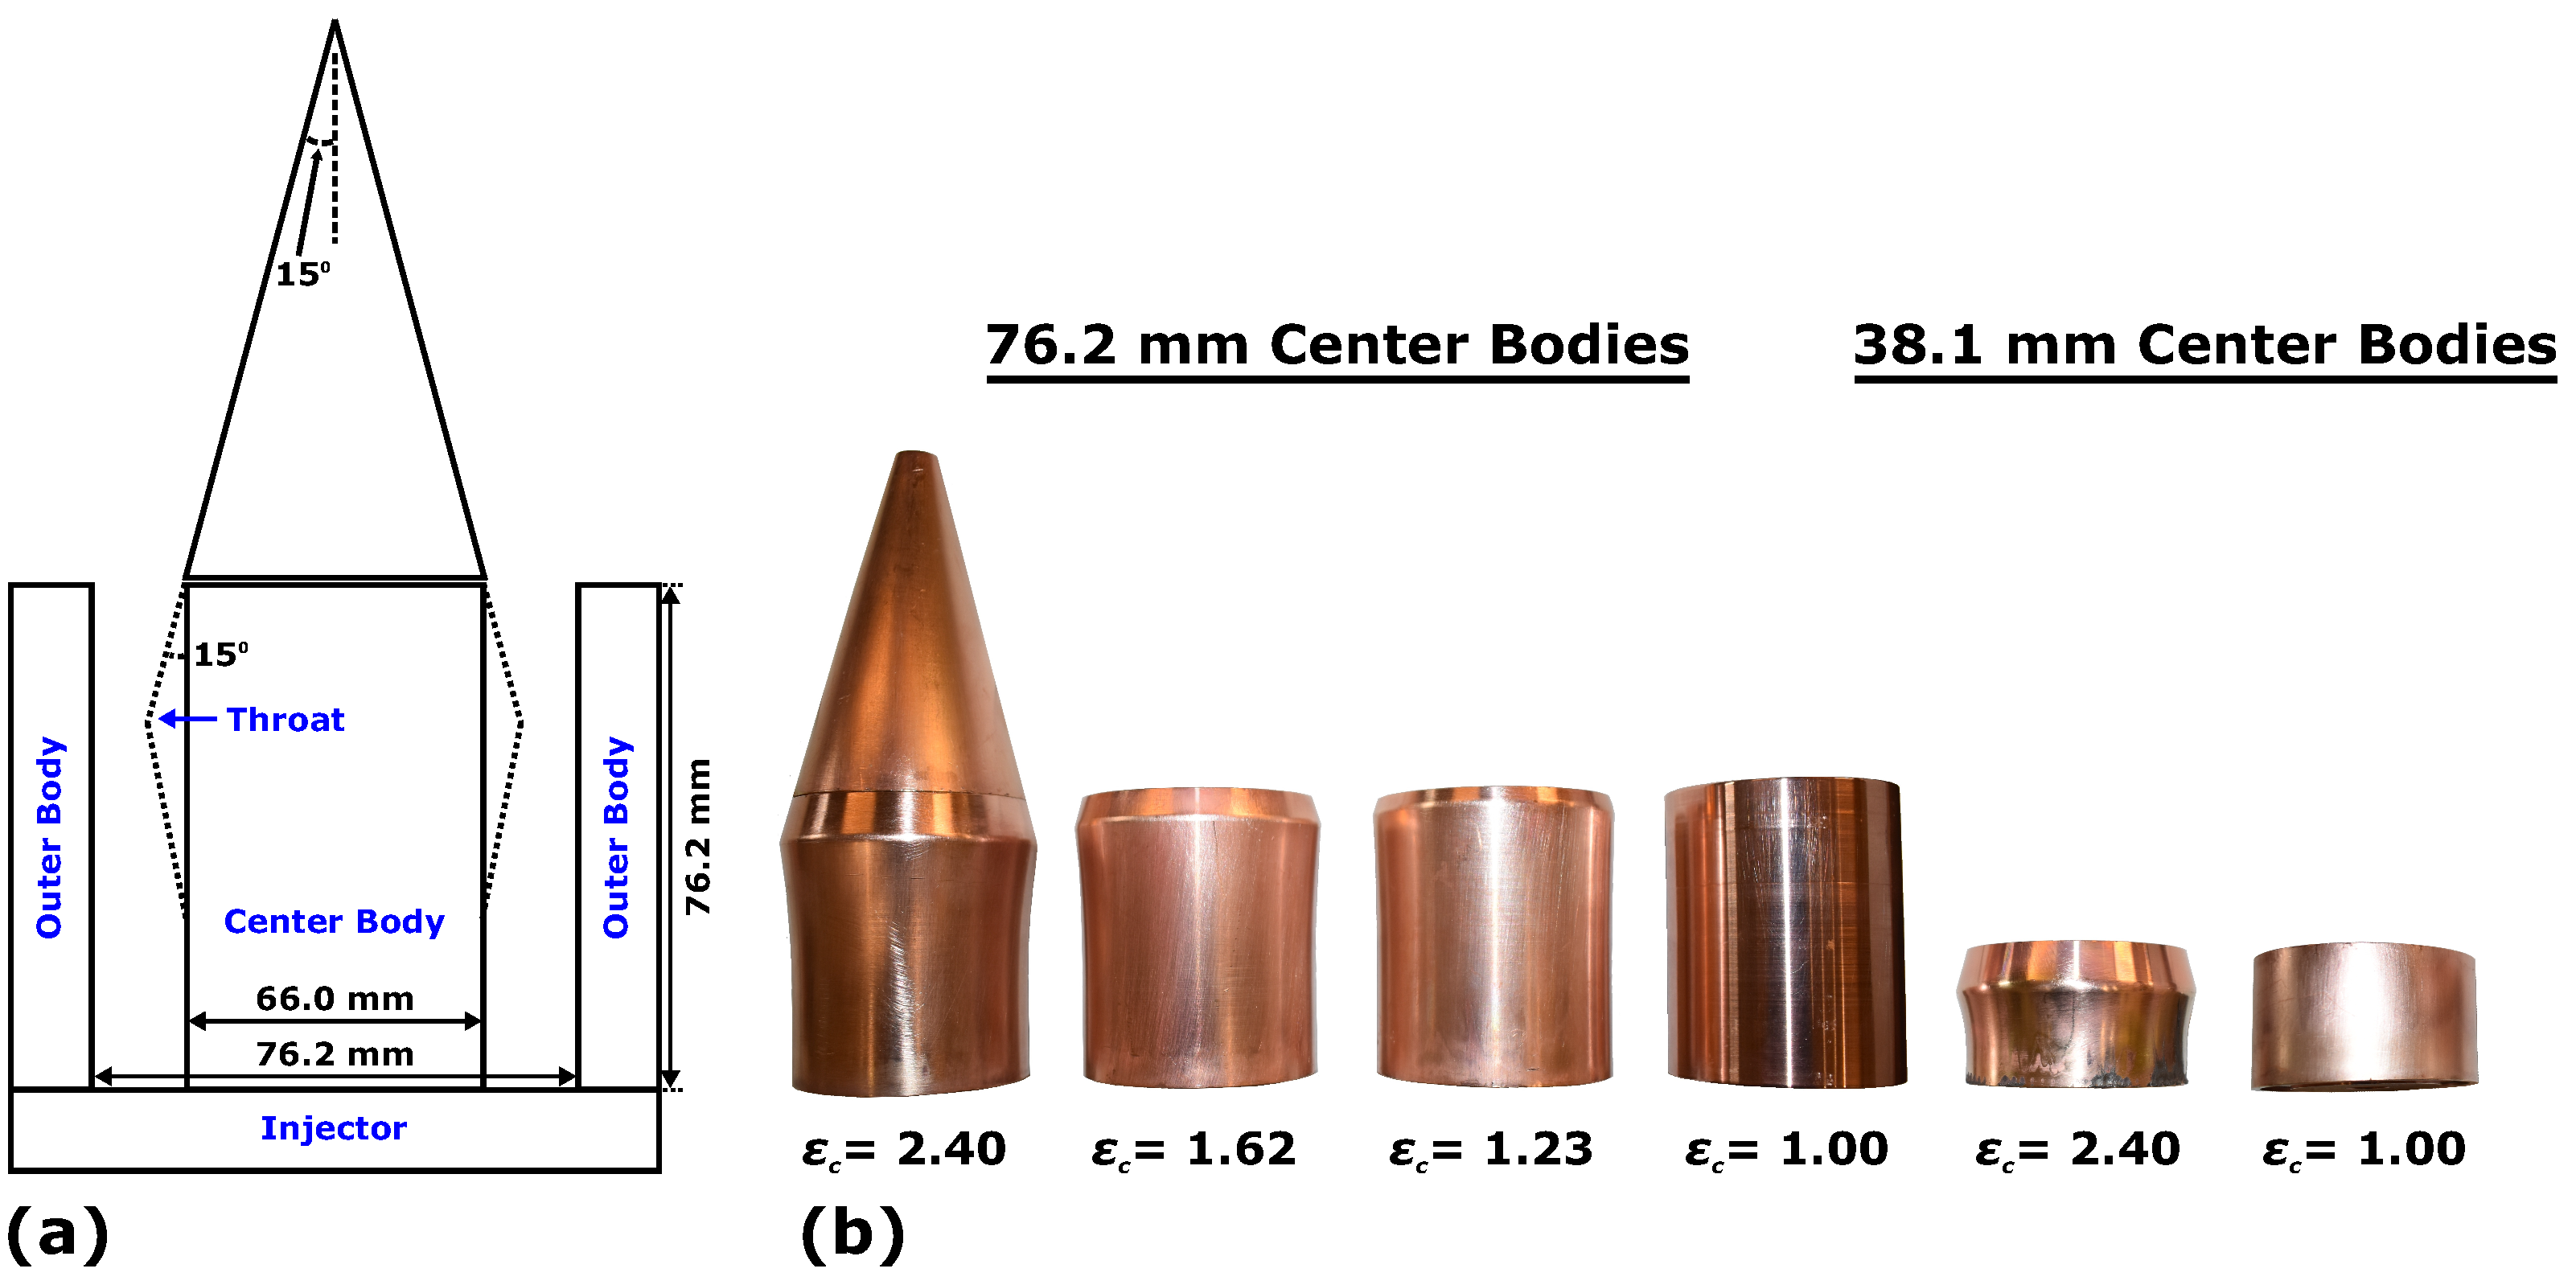
Convergent Nozzle Geometries
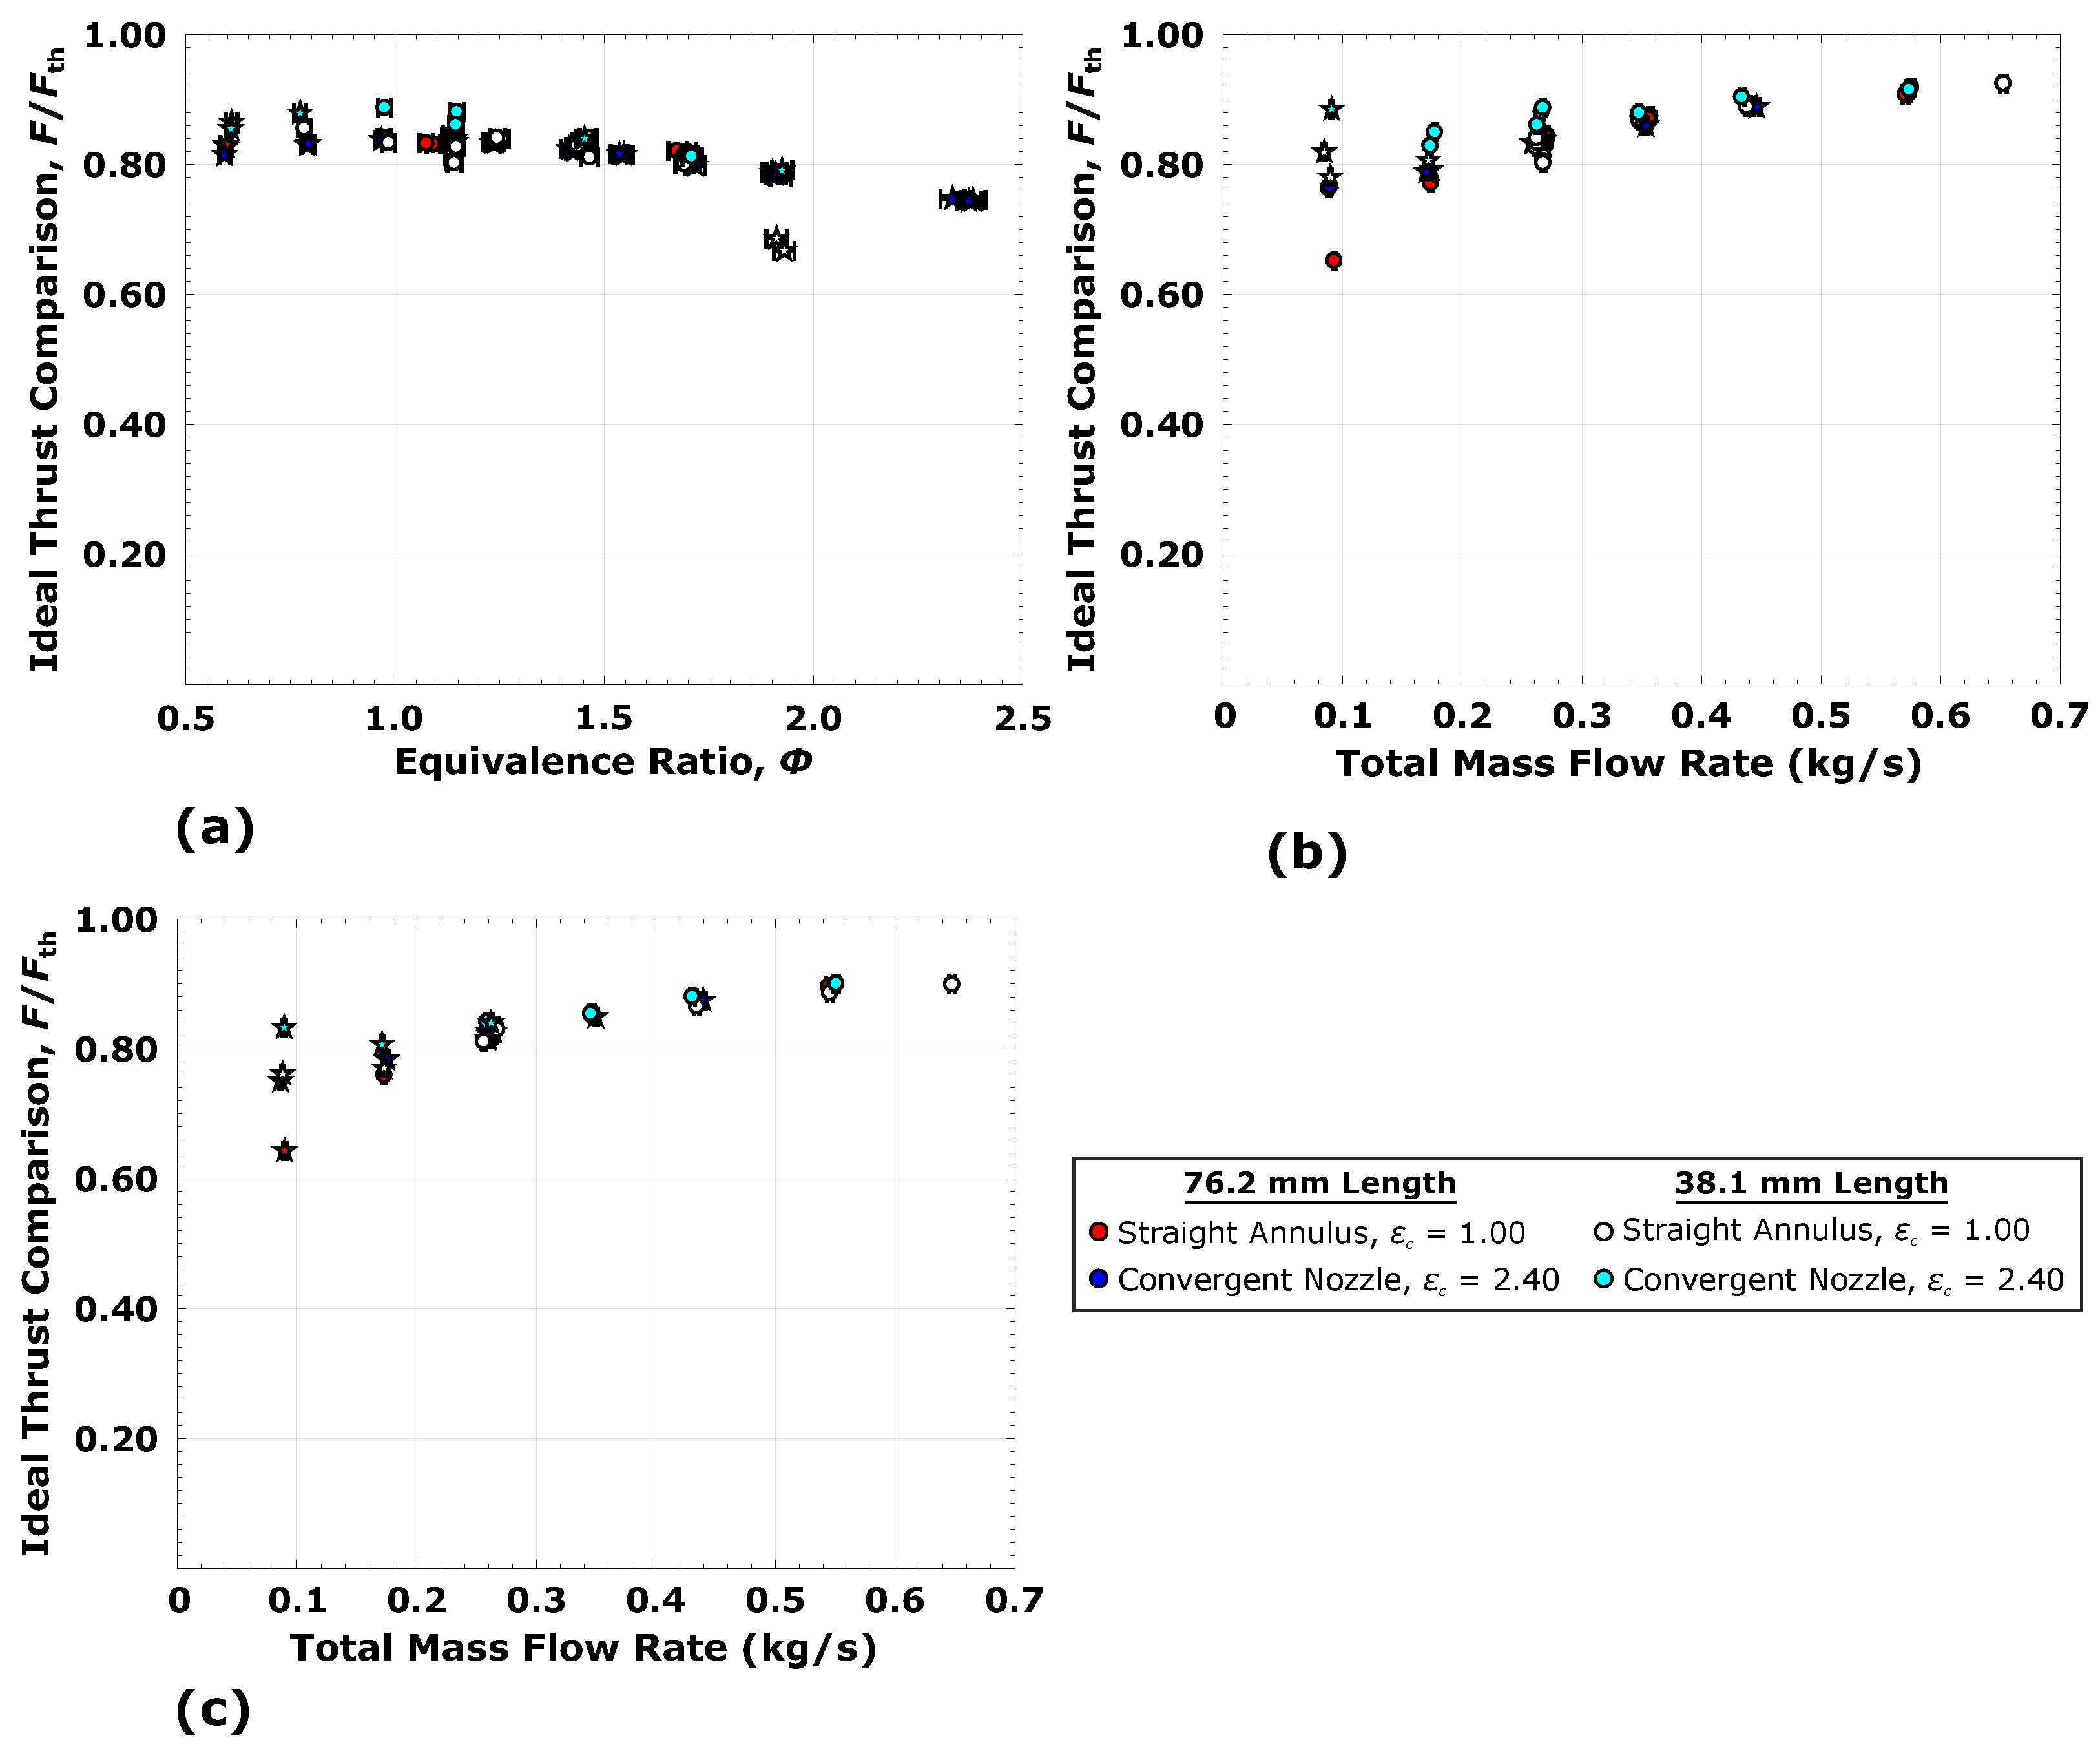
3. Convergent Nozzle Study: Full Annular Length Geometries
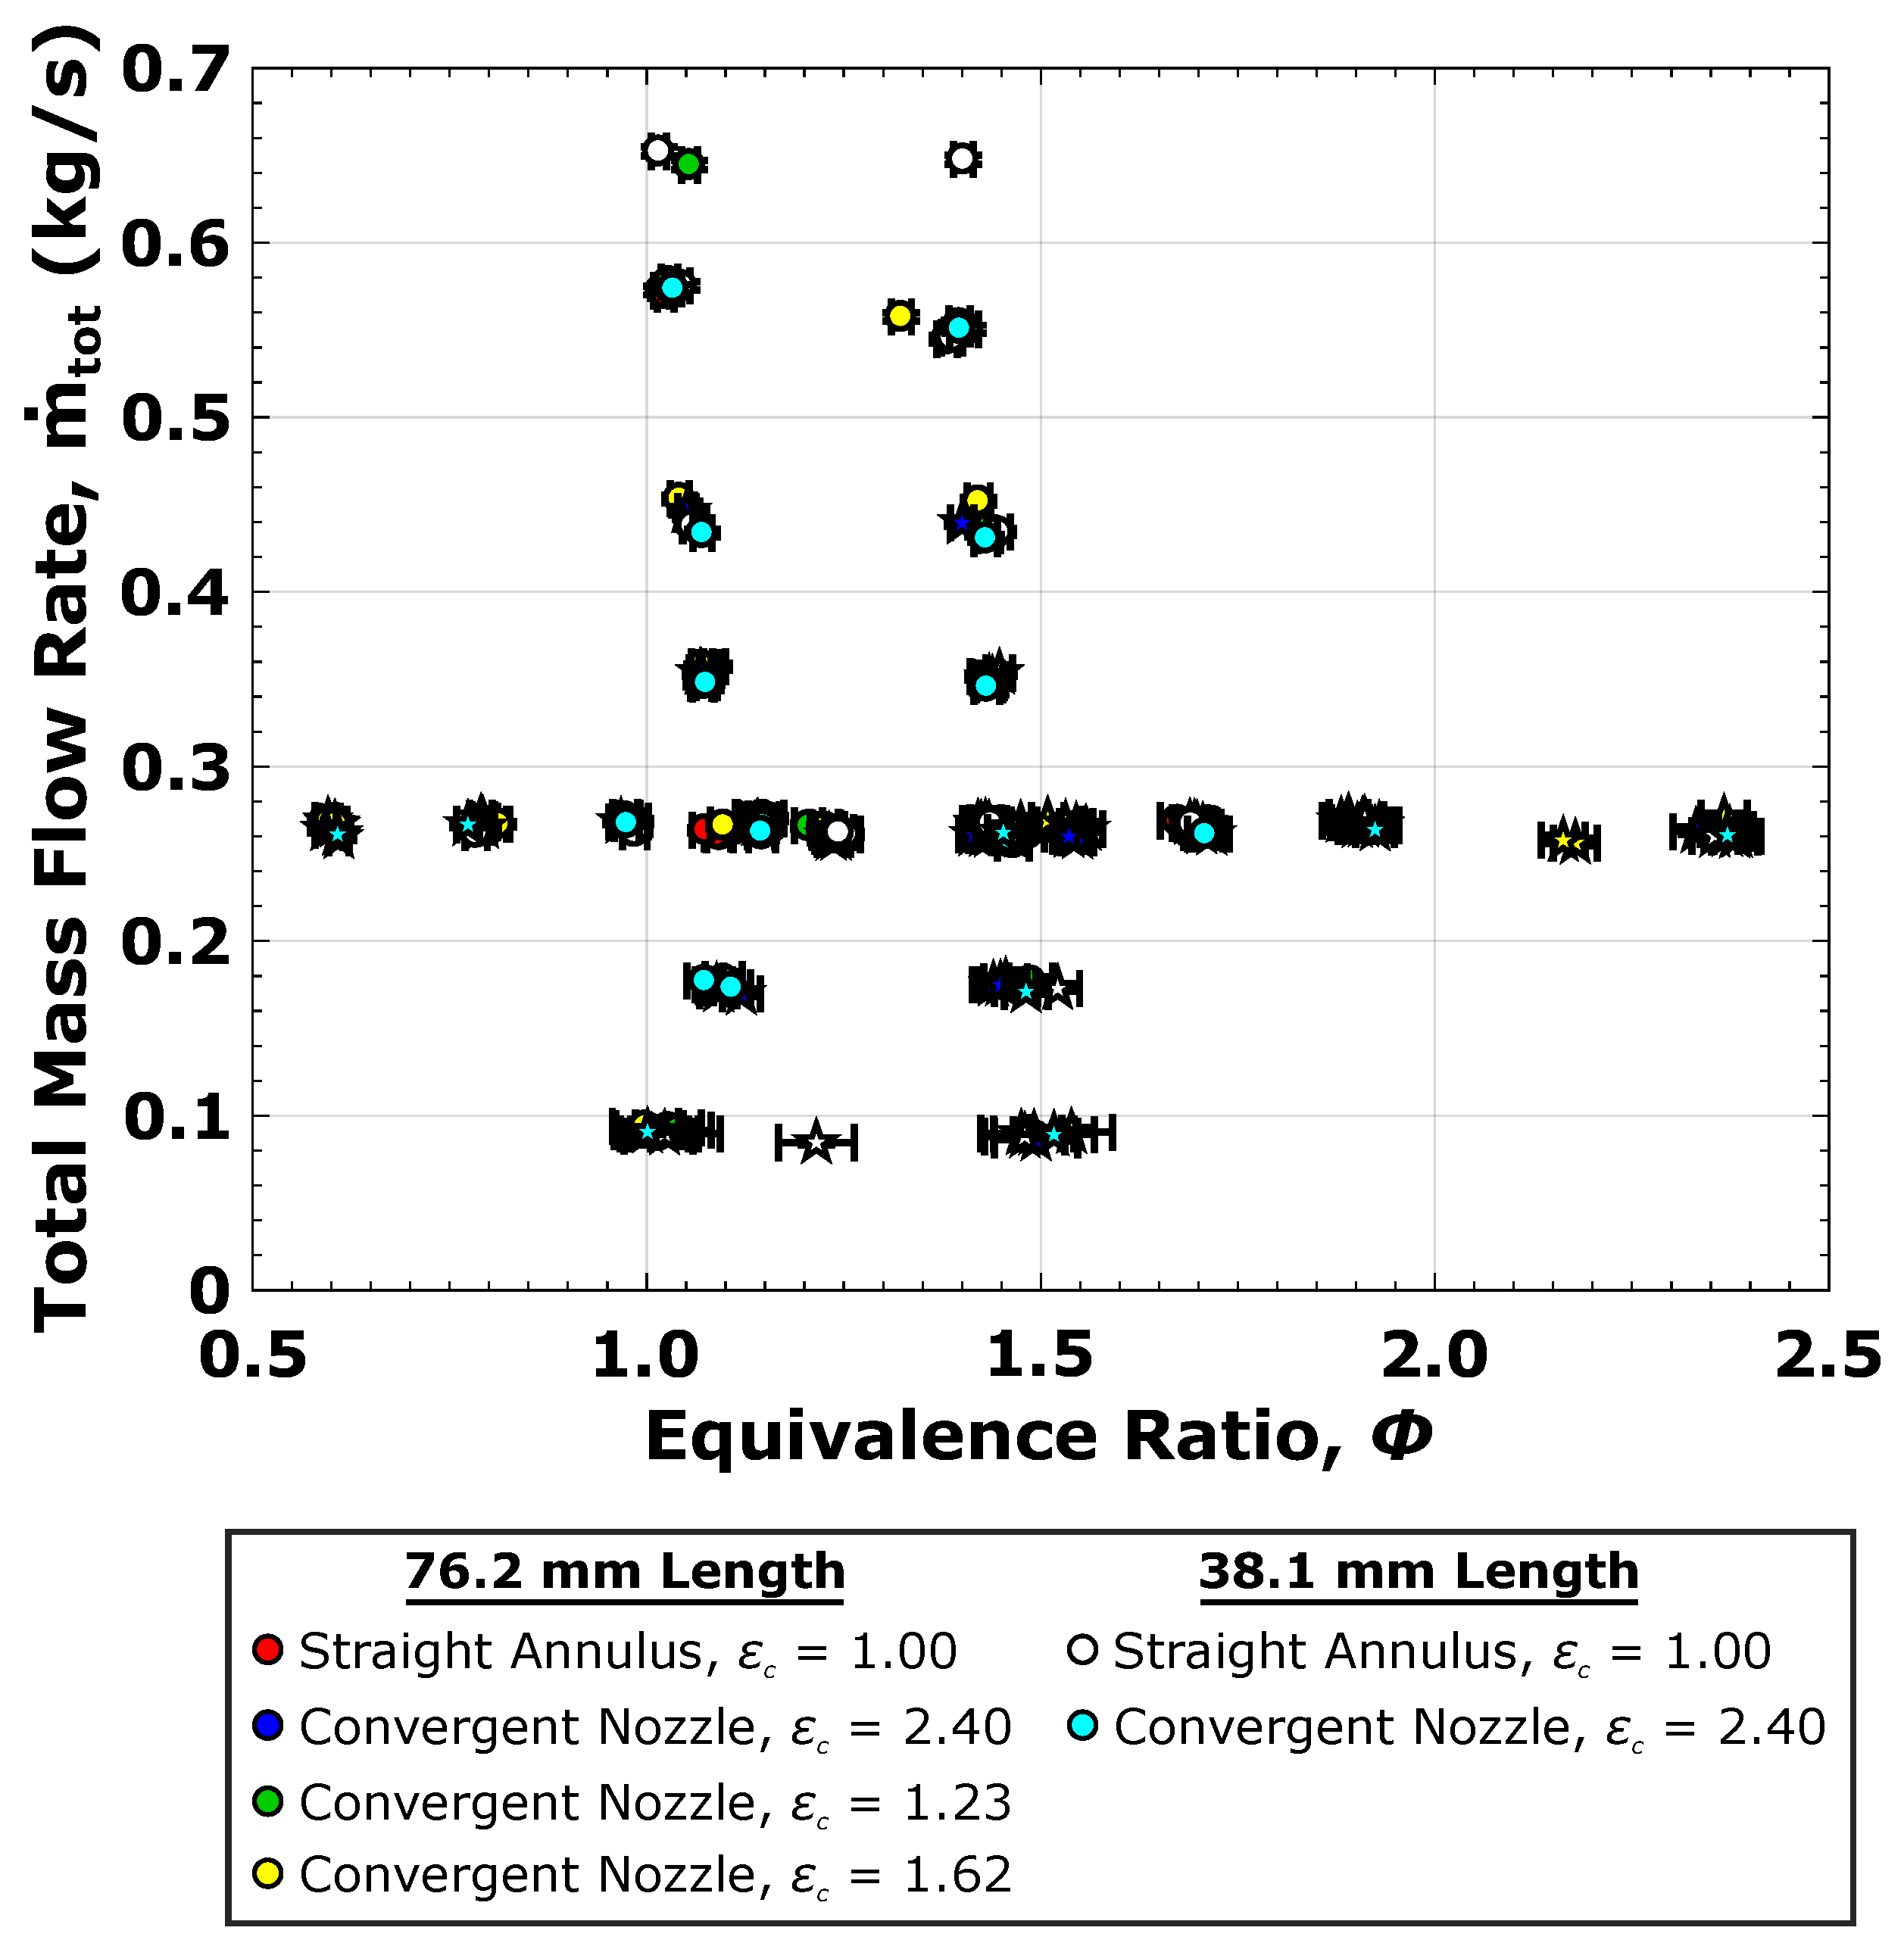
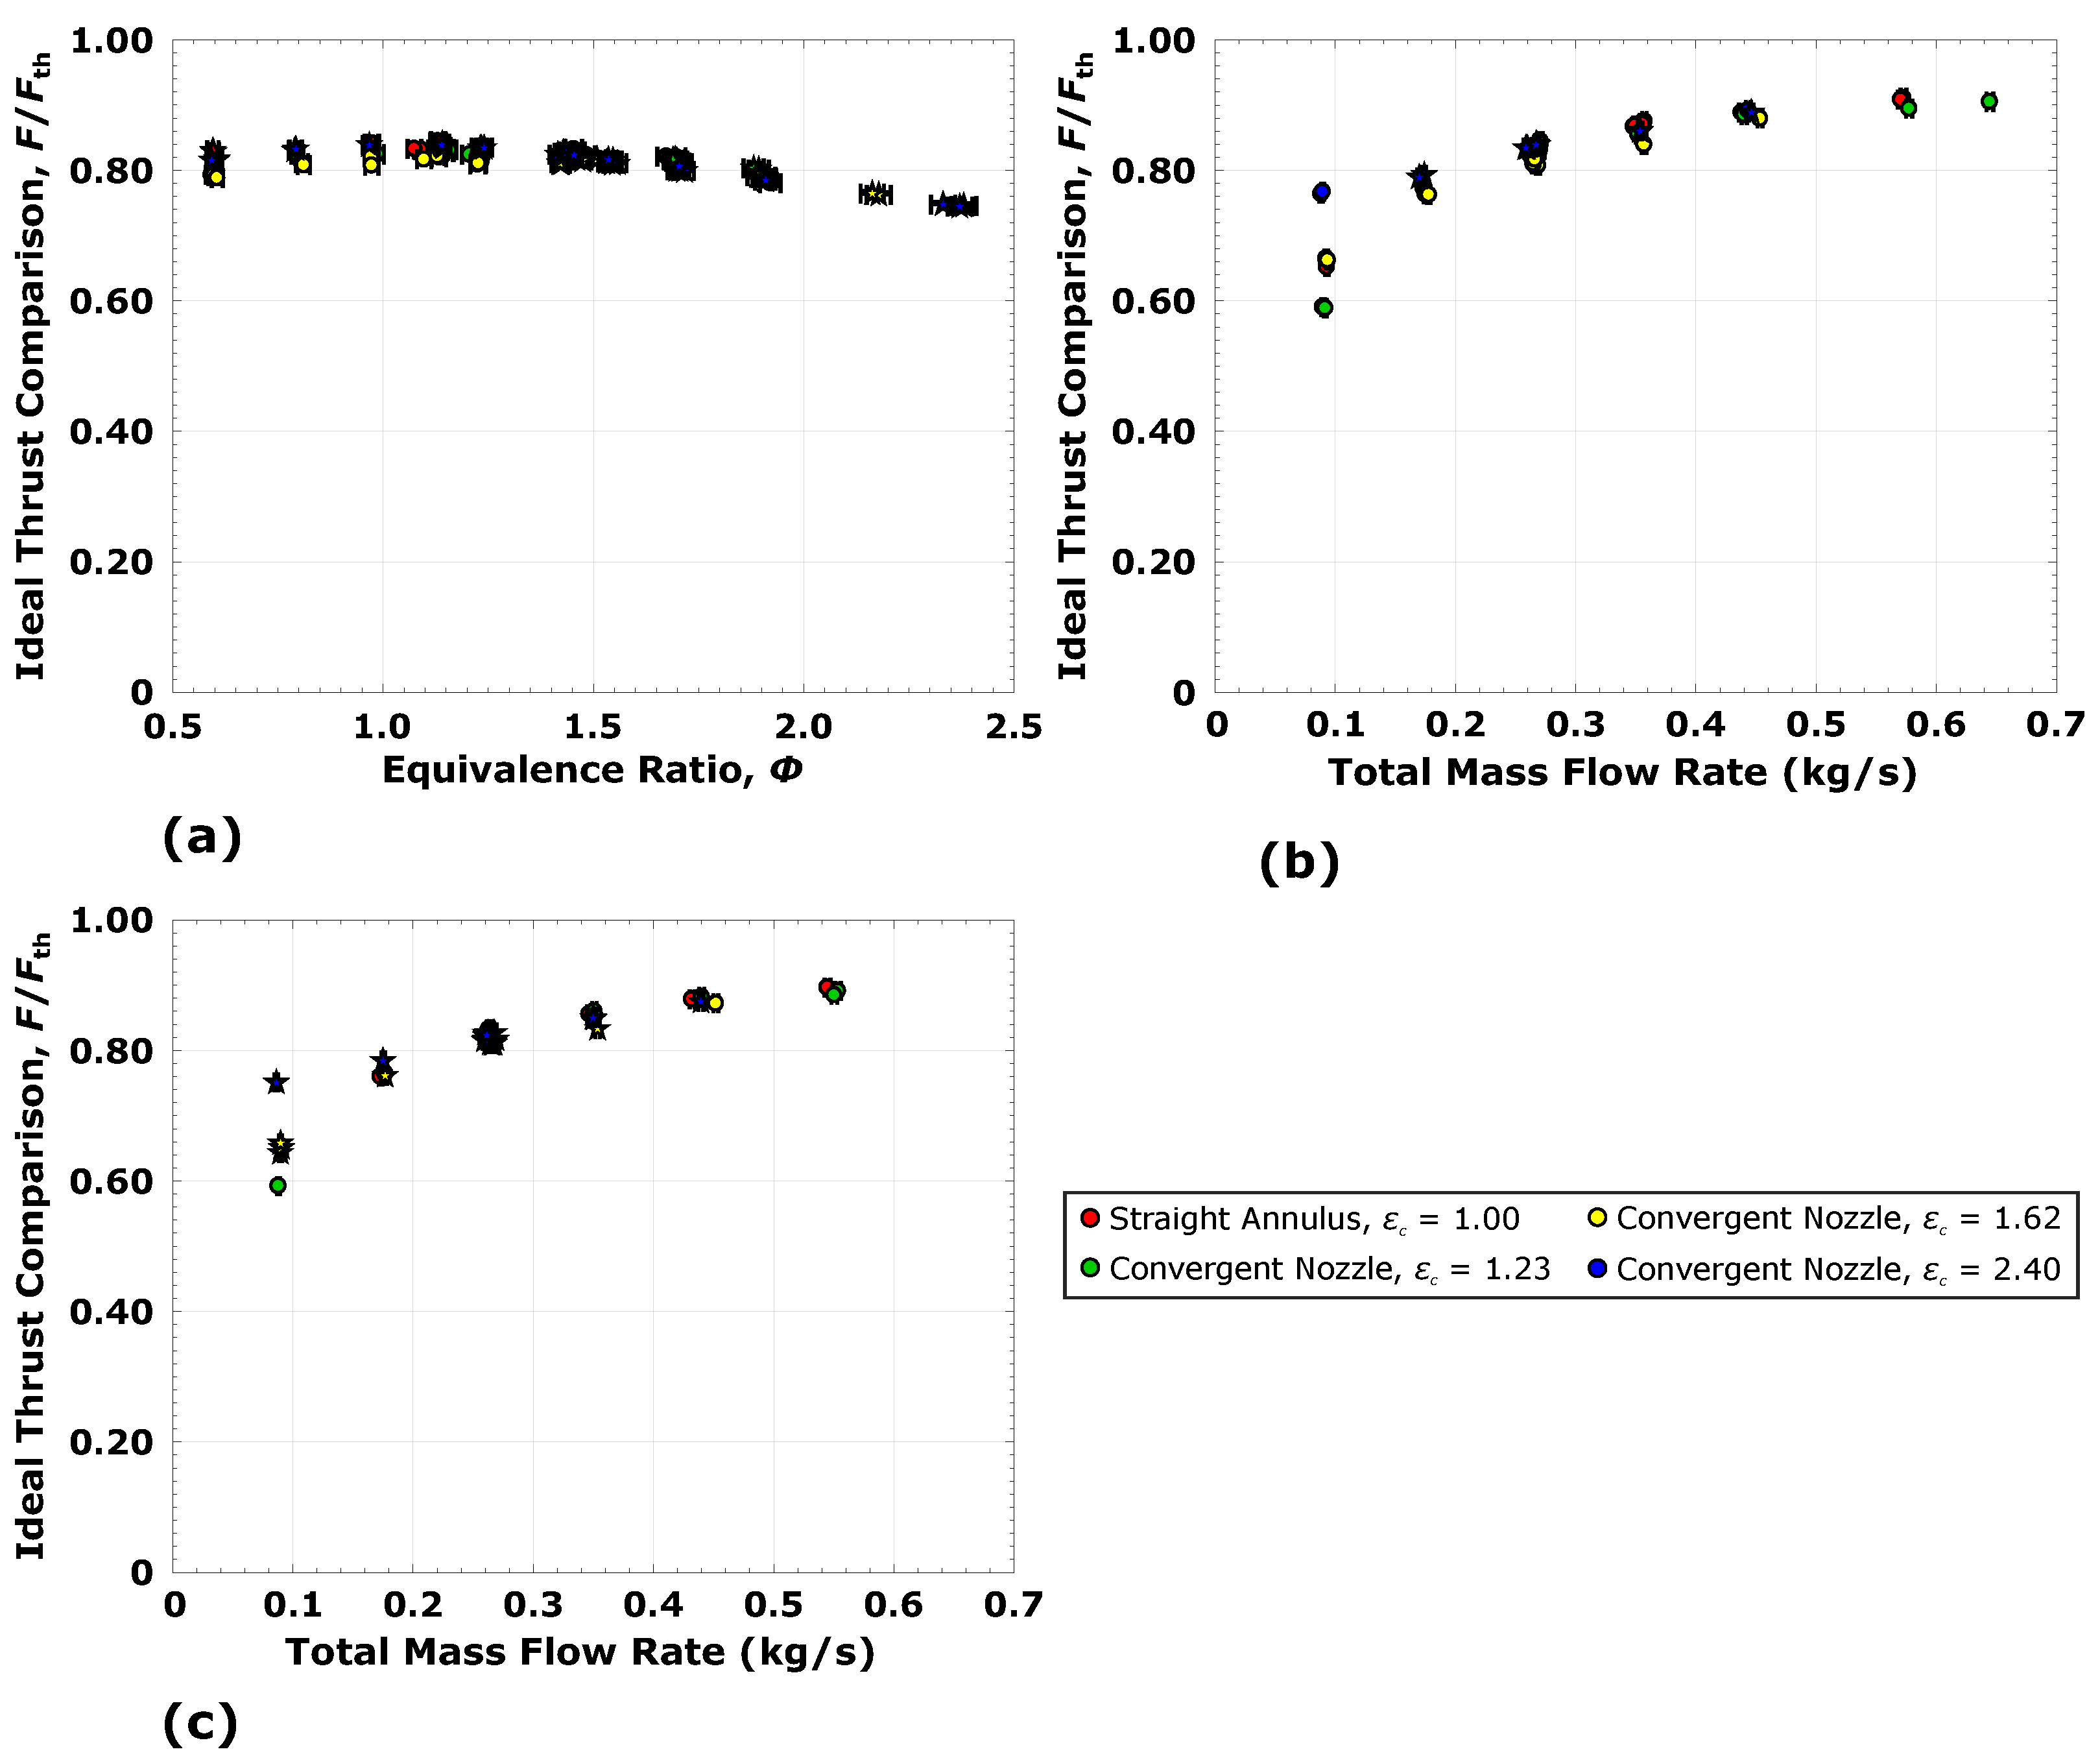
3.1. Engine Operability and Performance
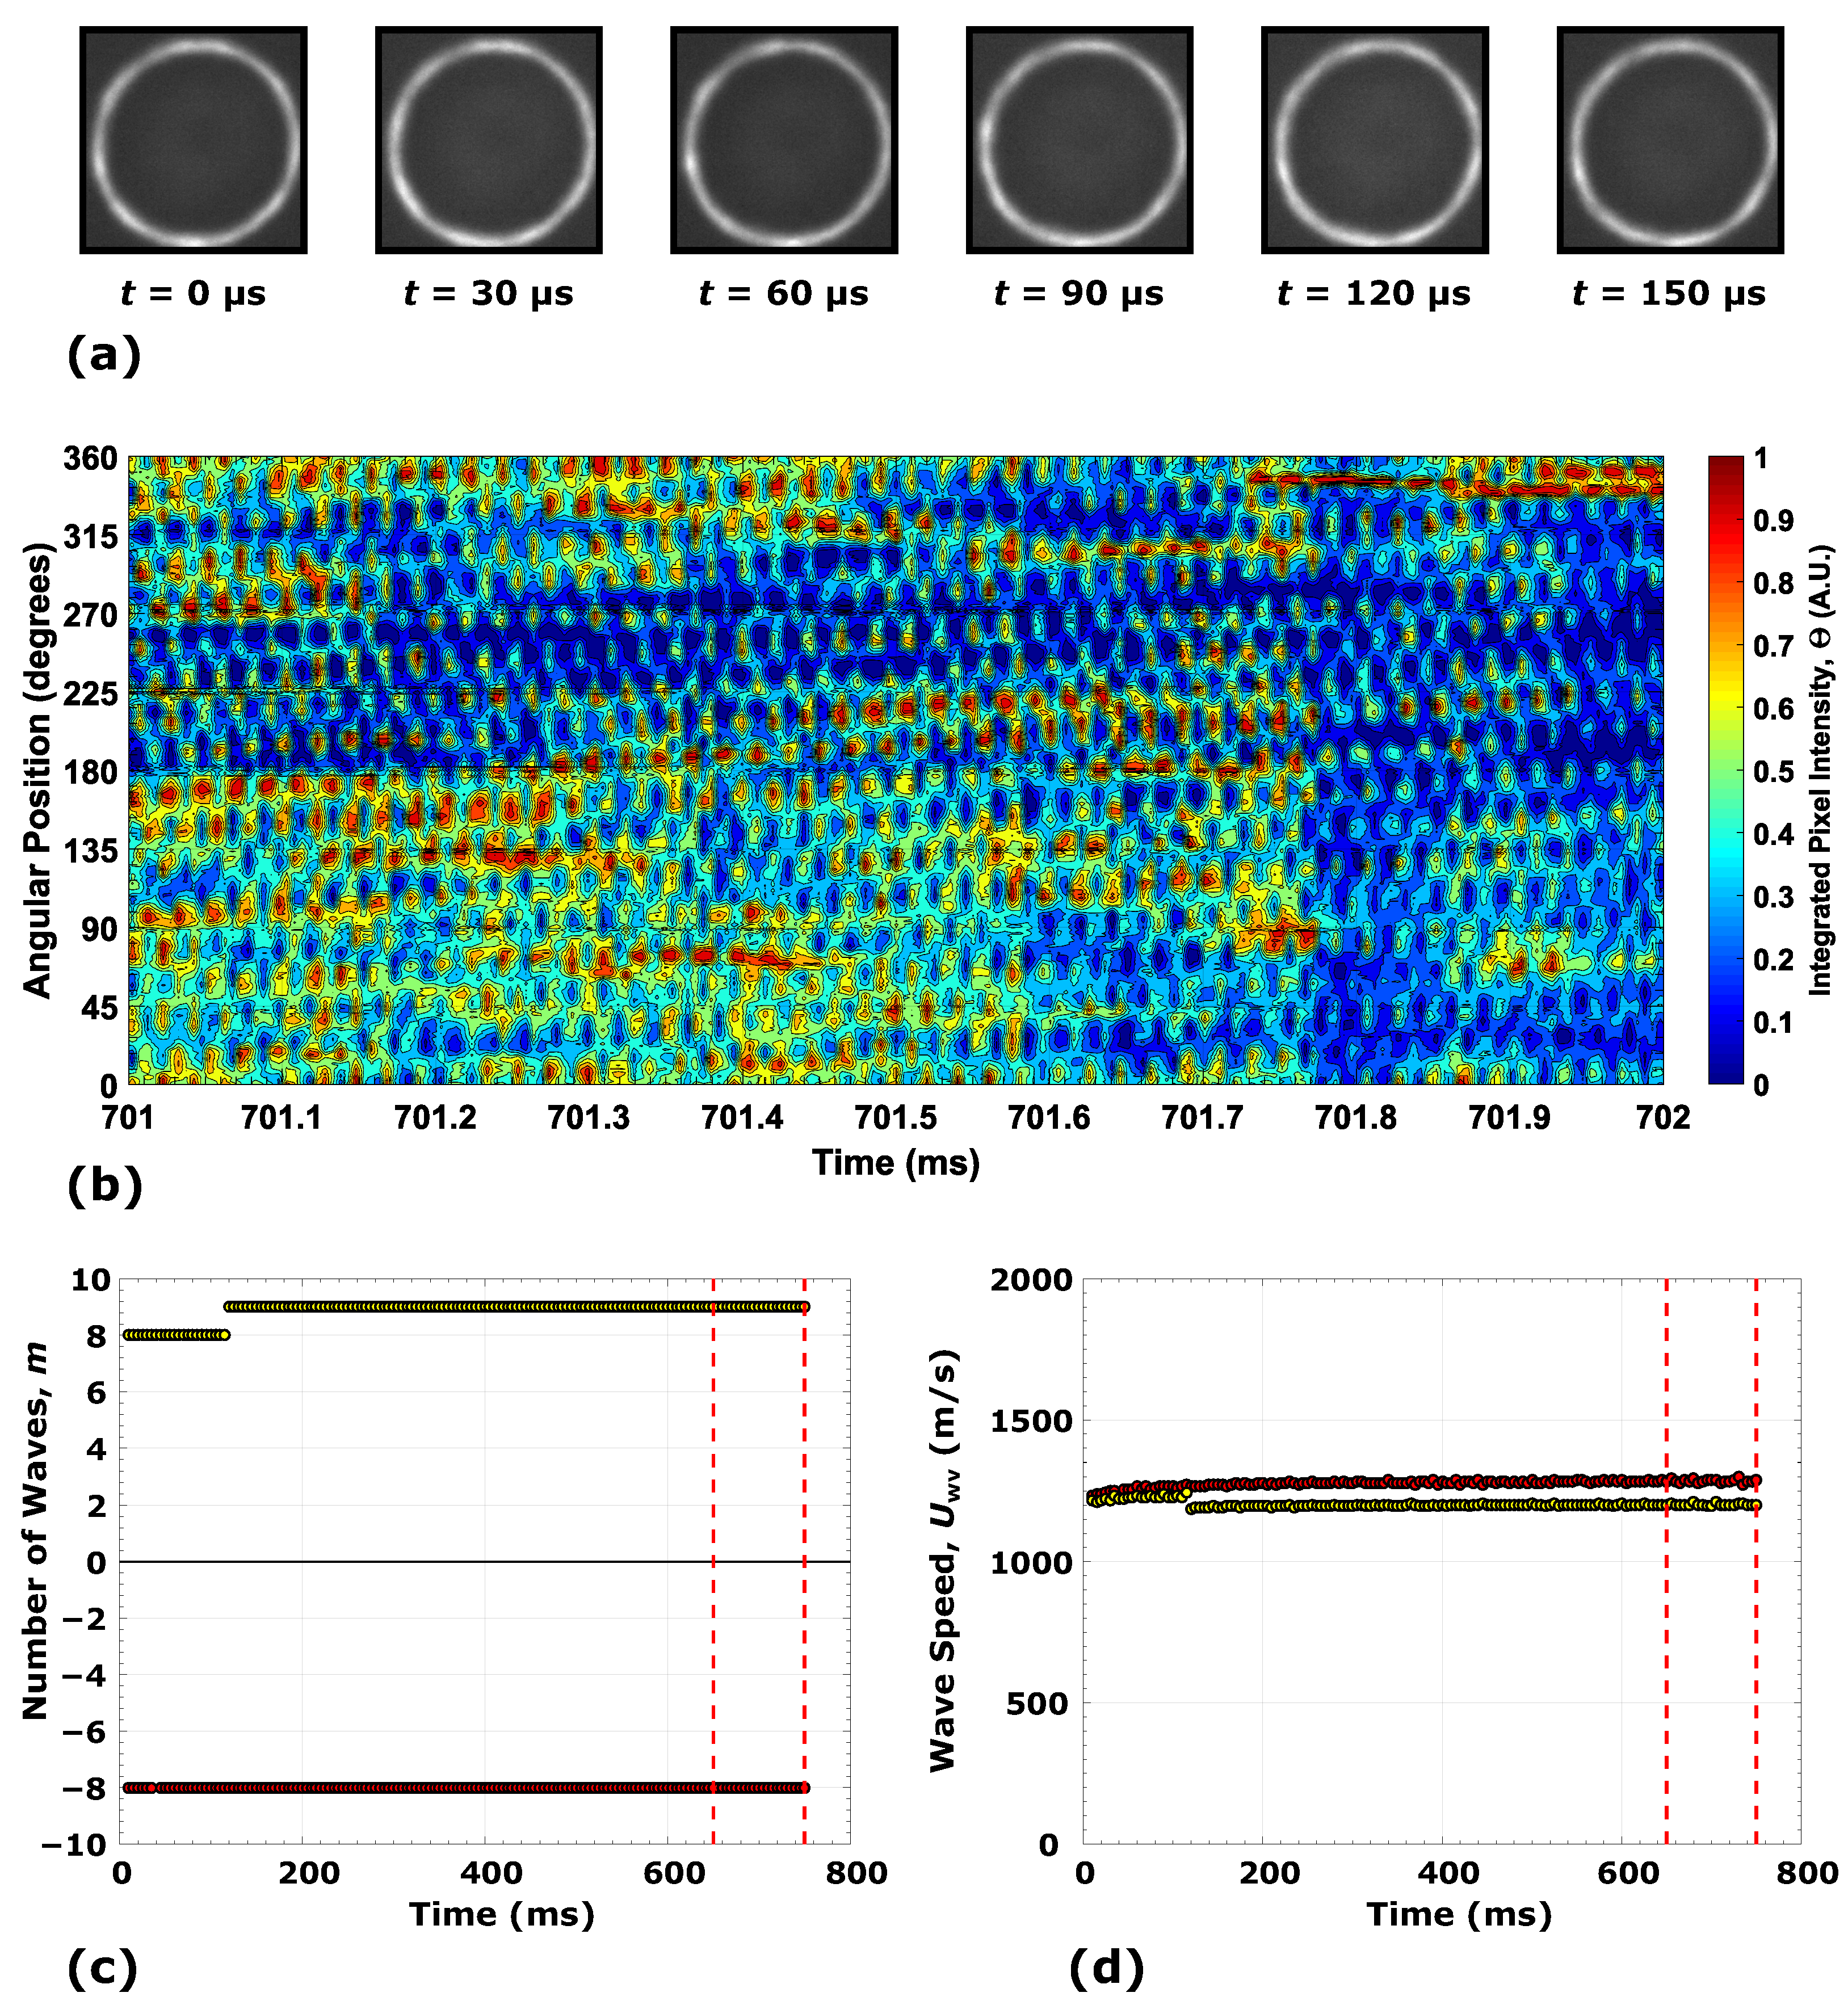
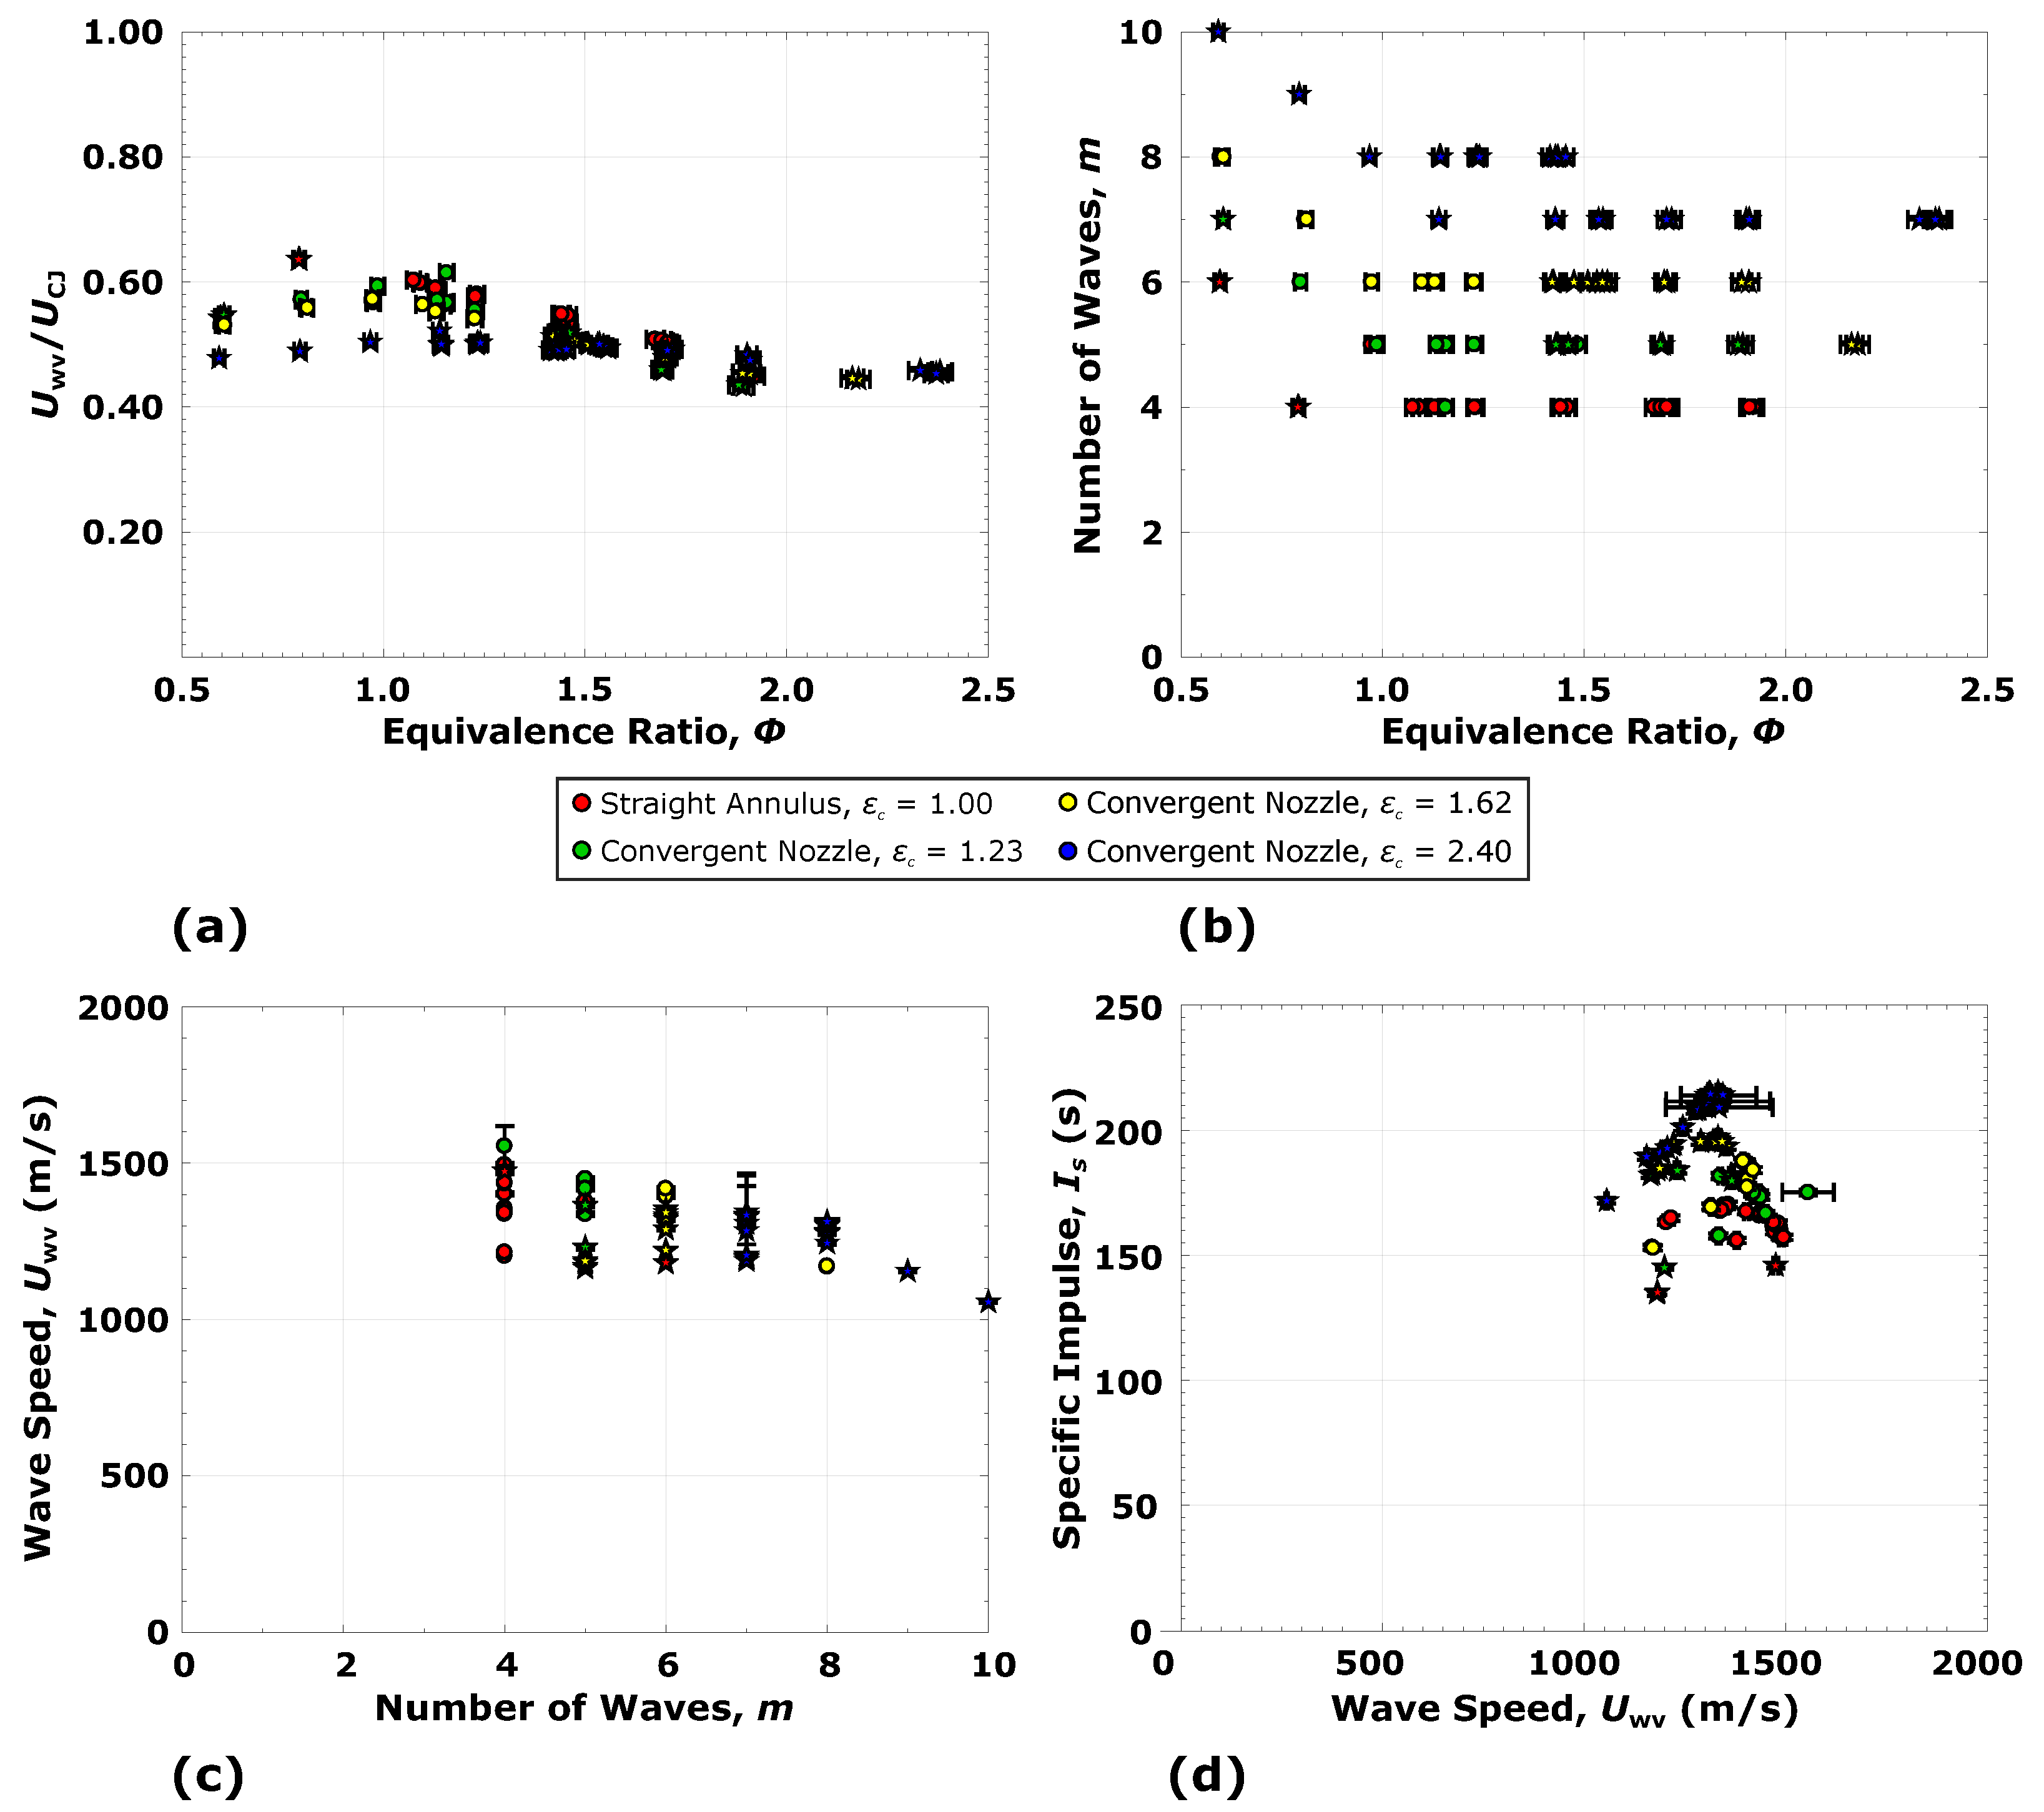
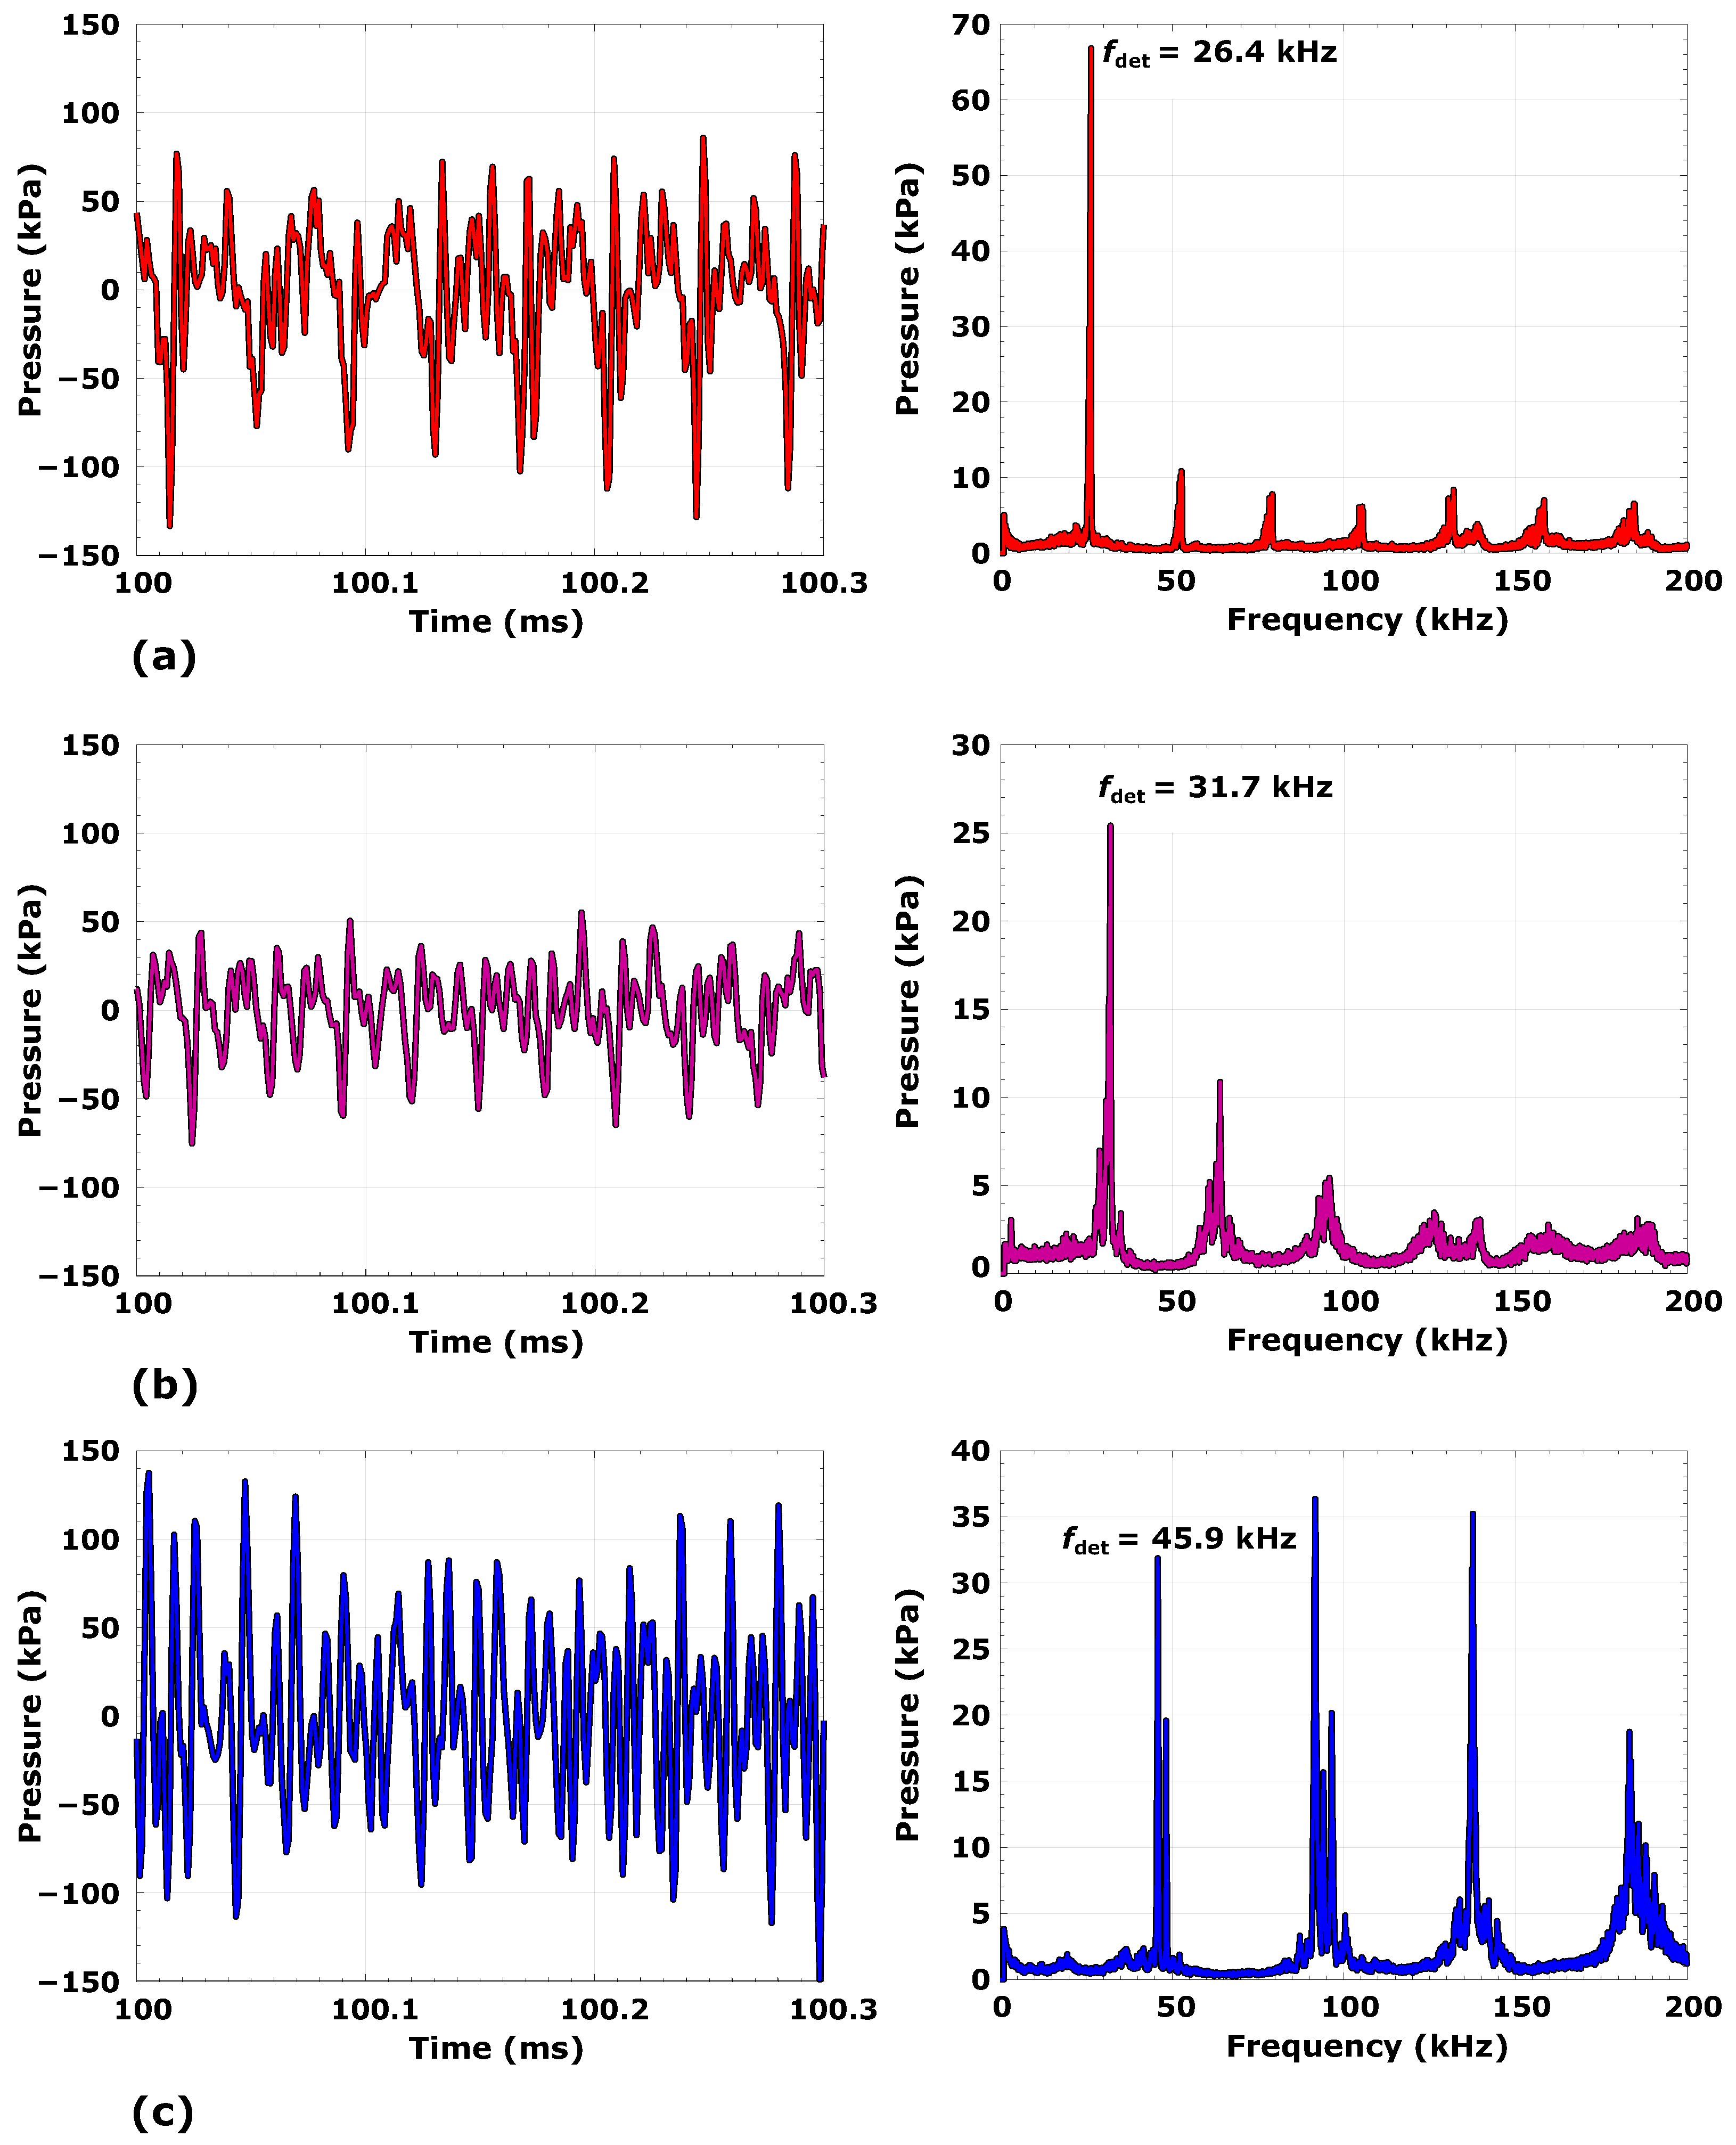
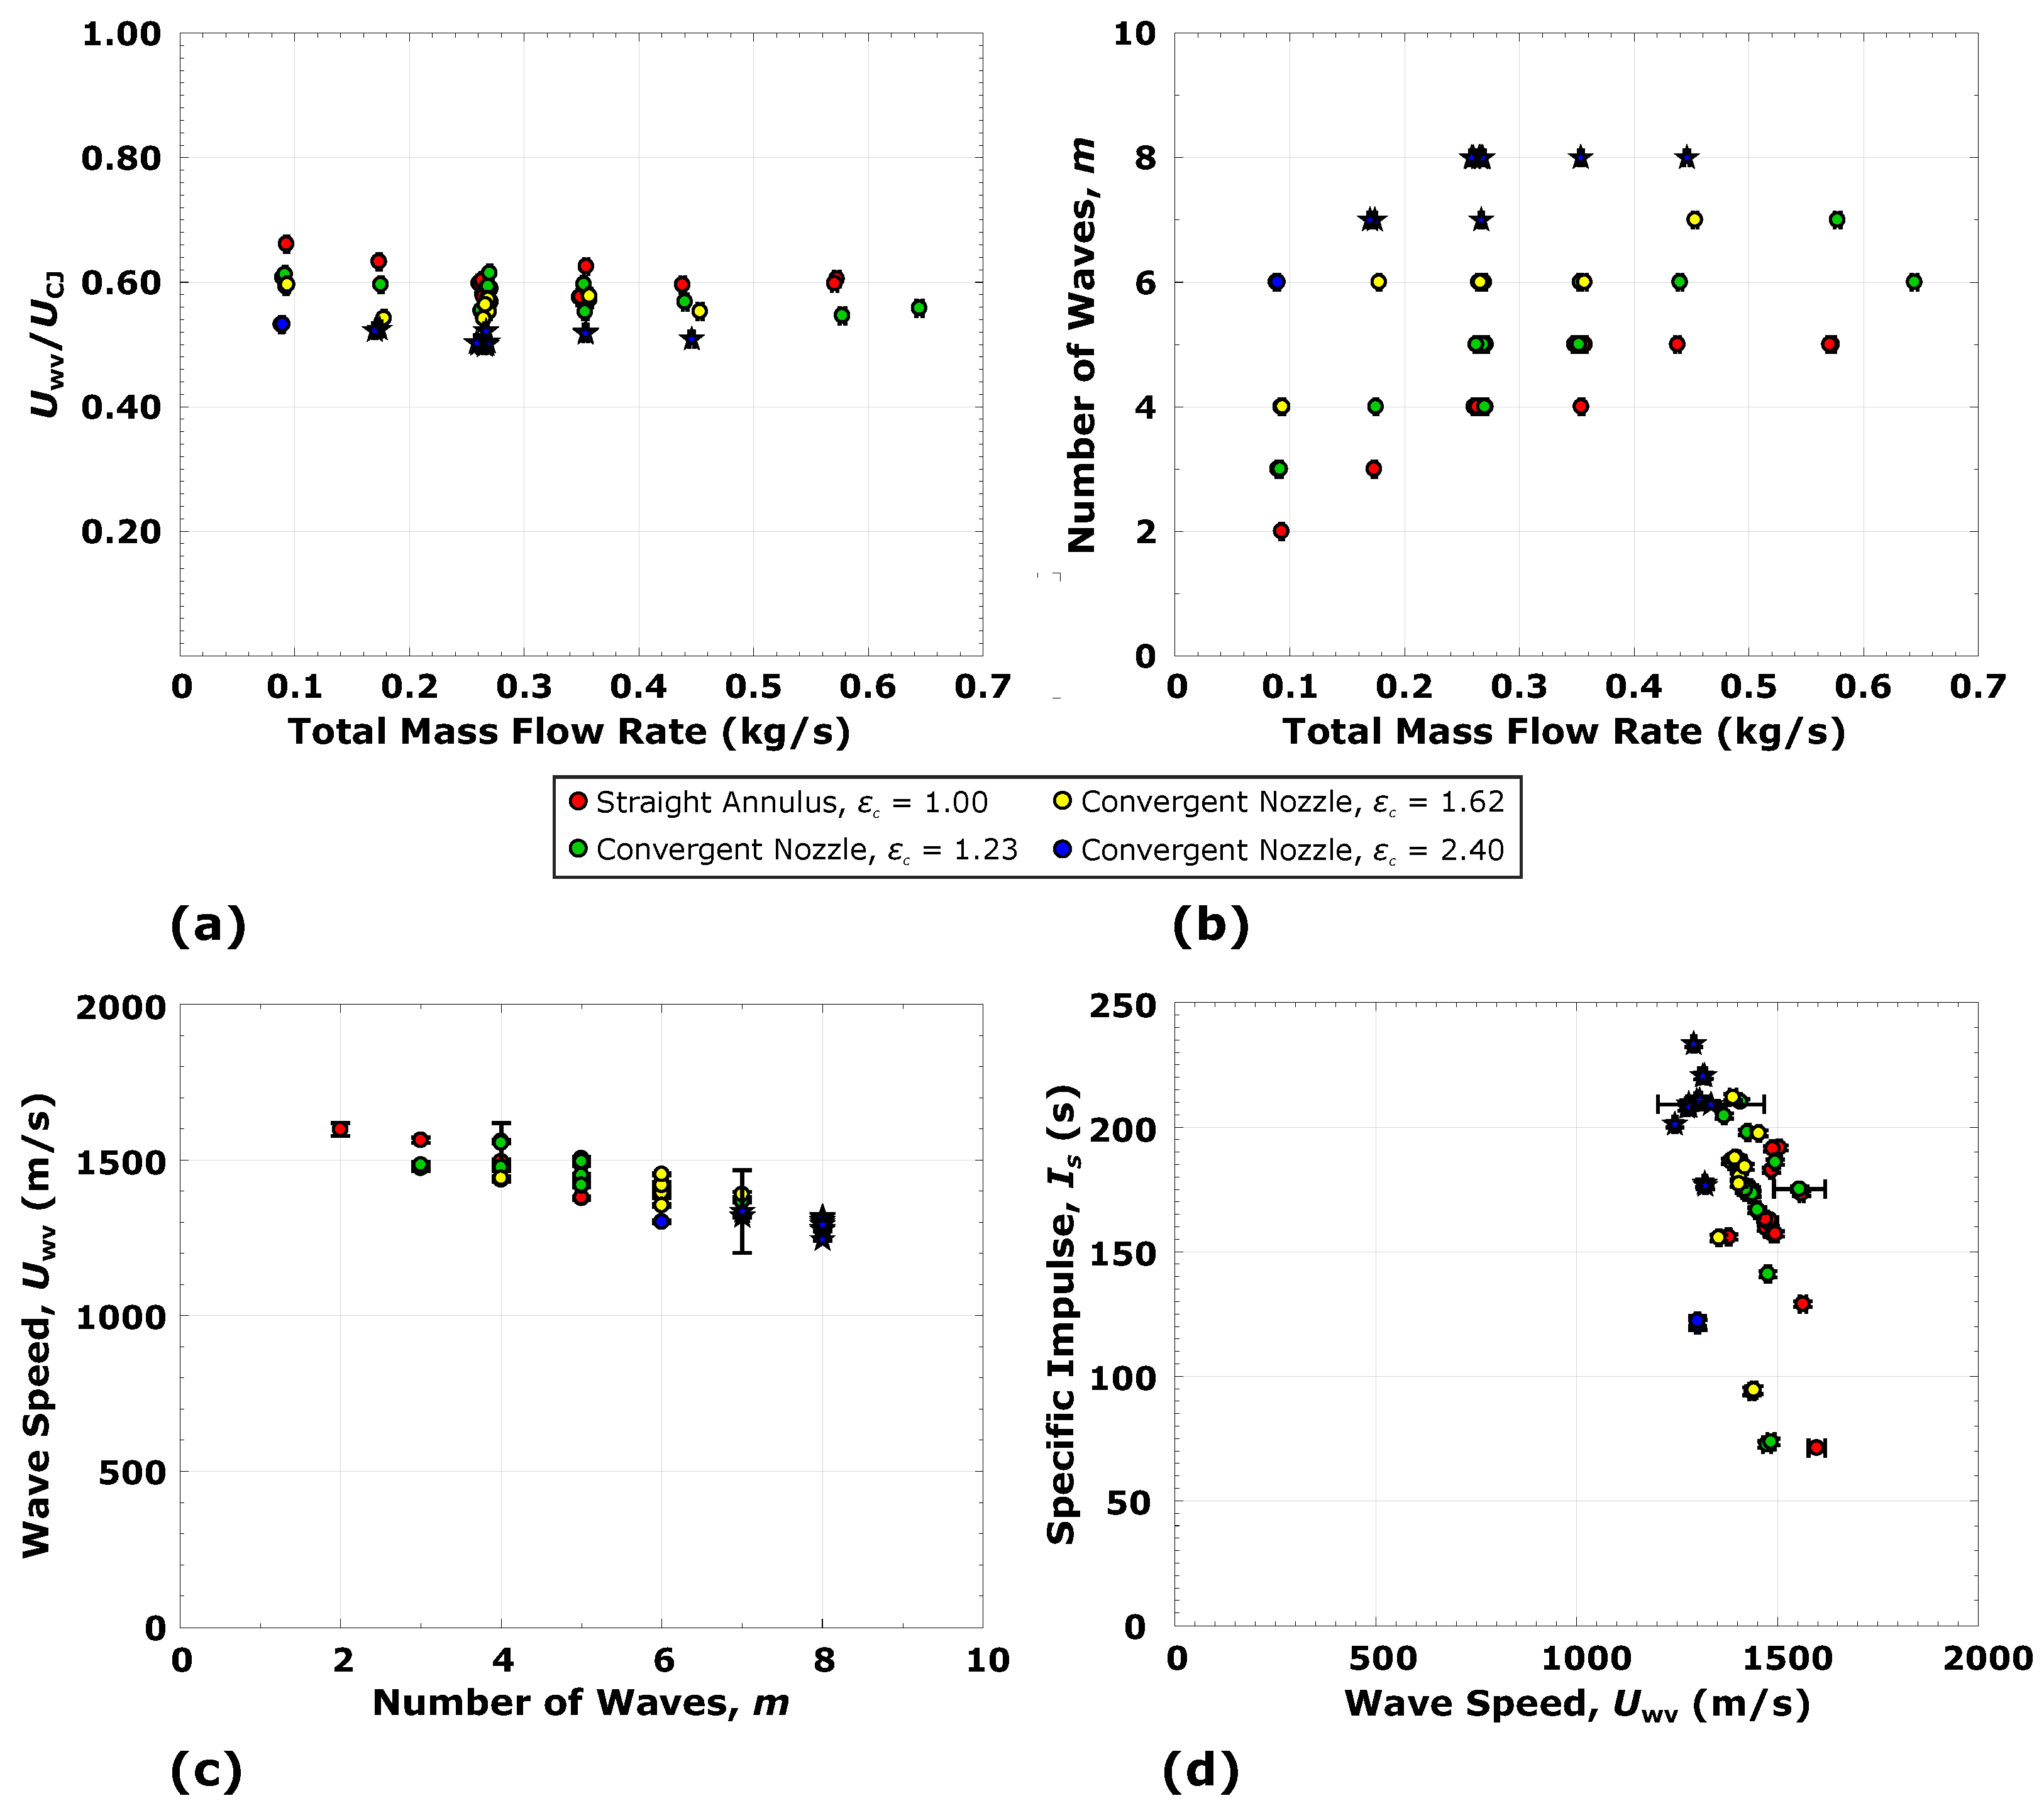
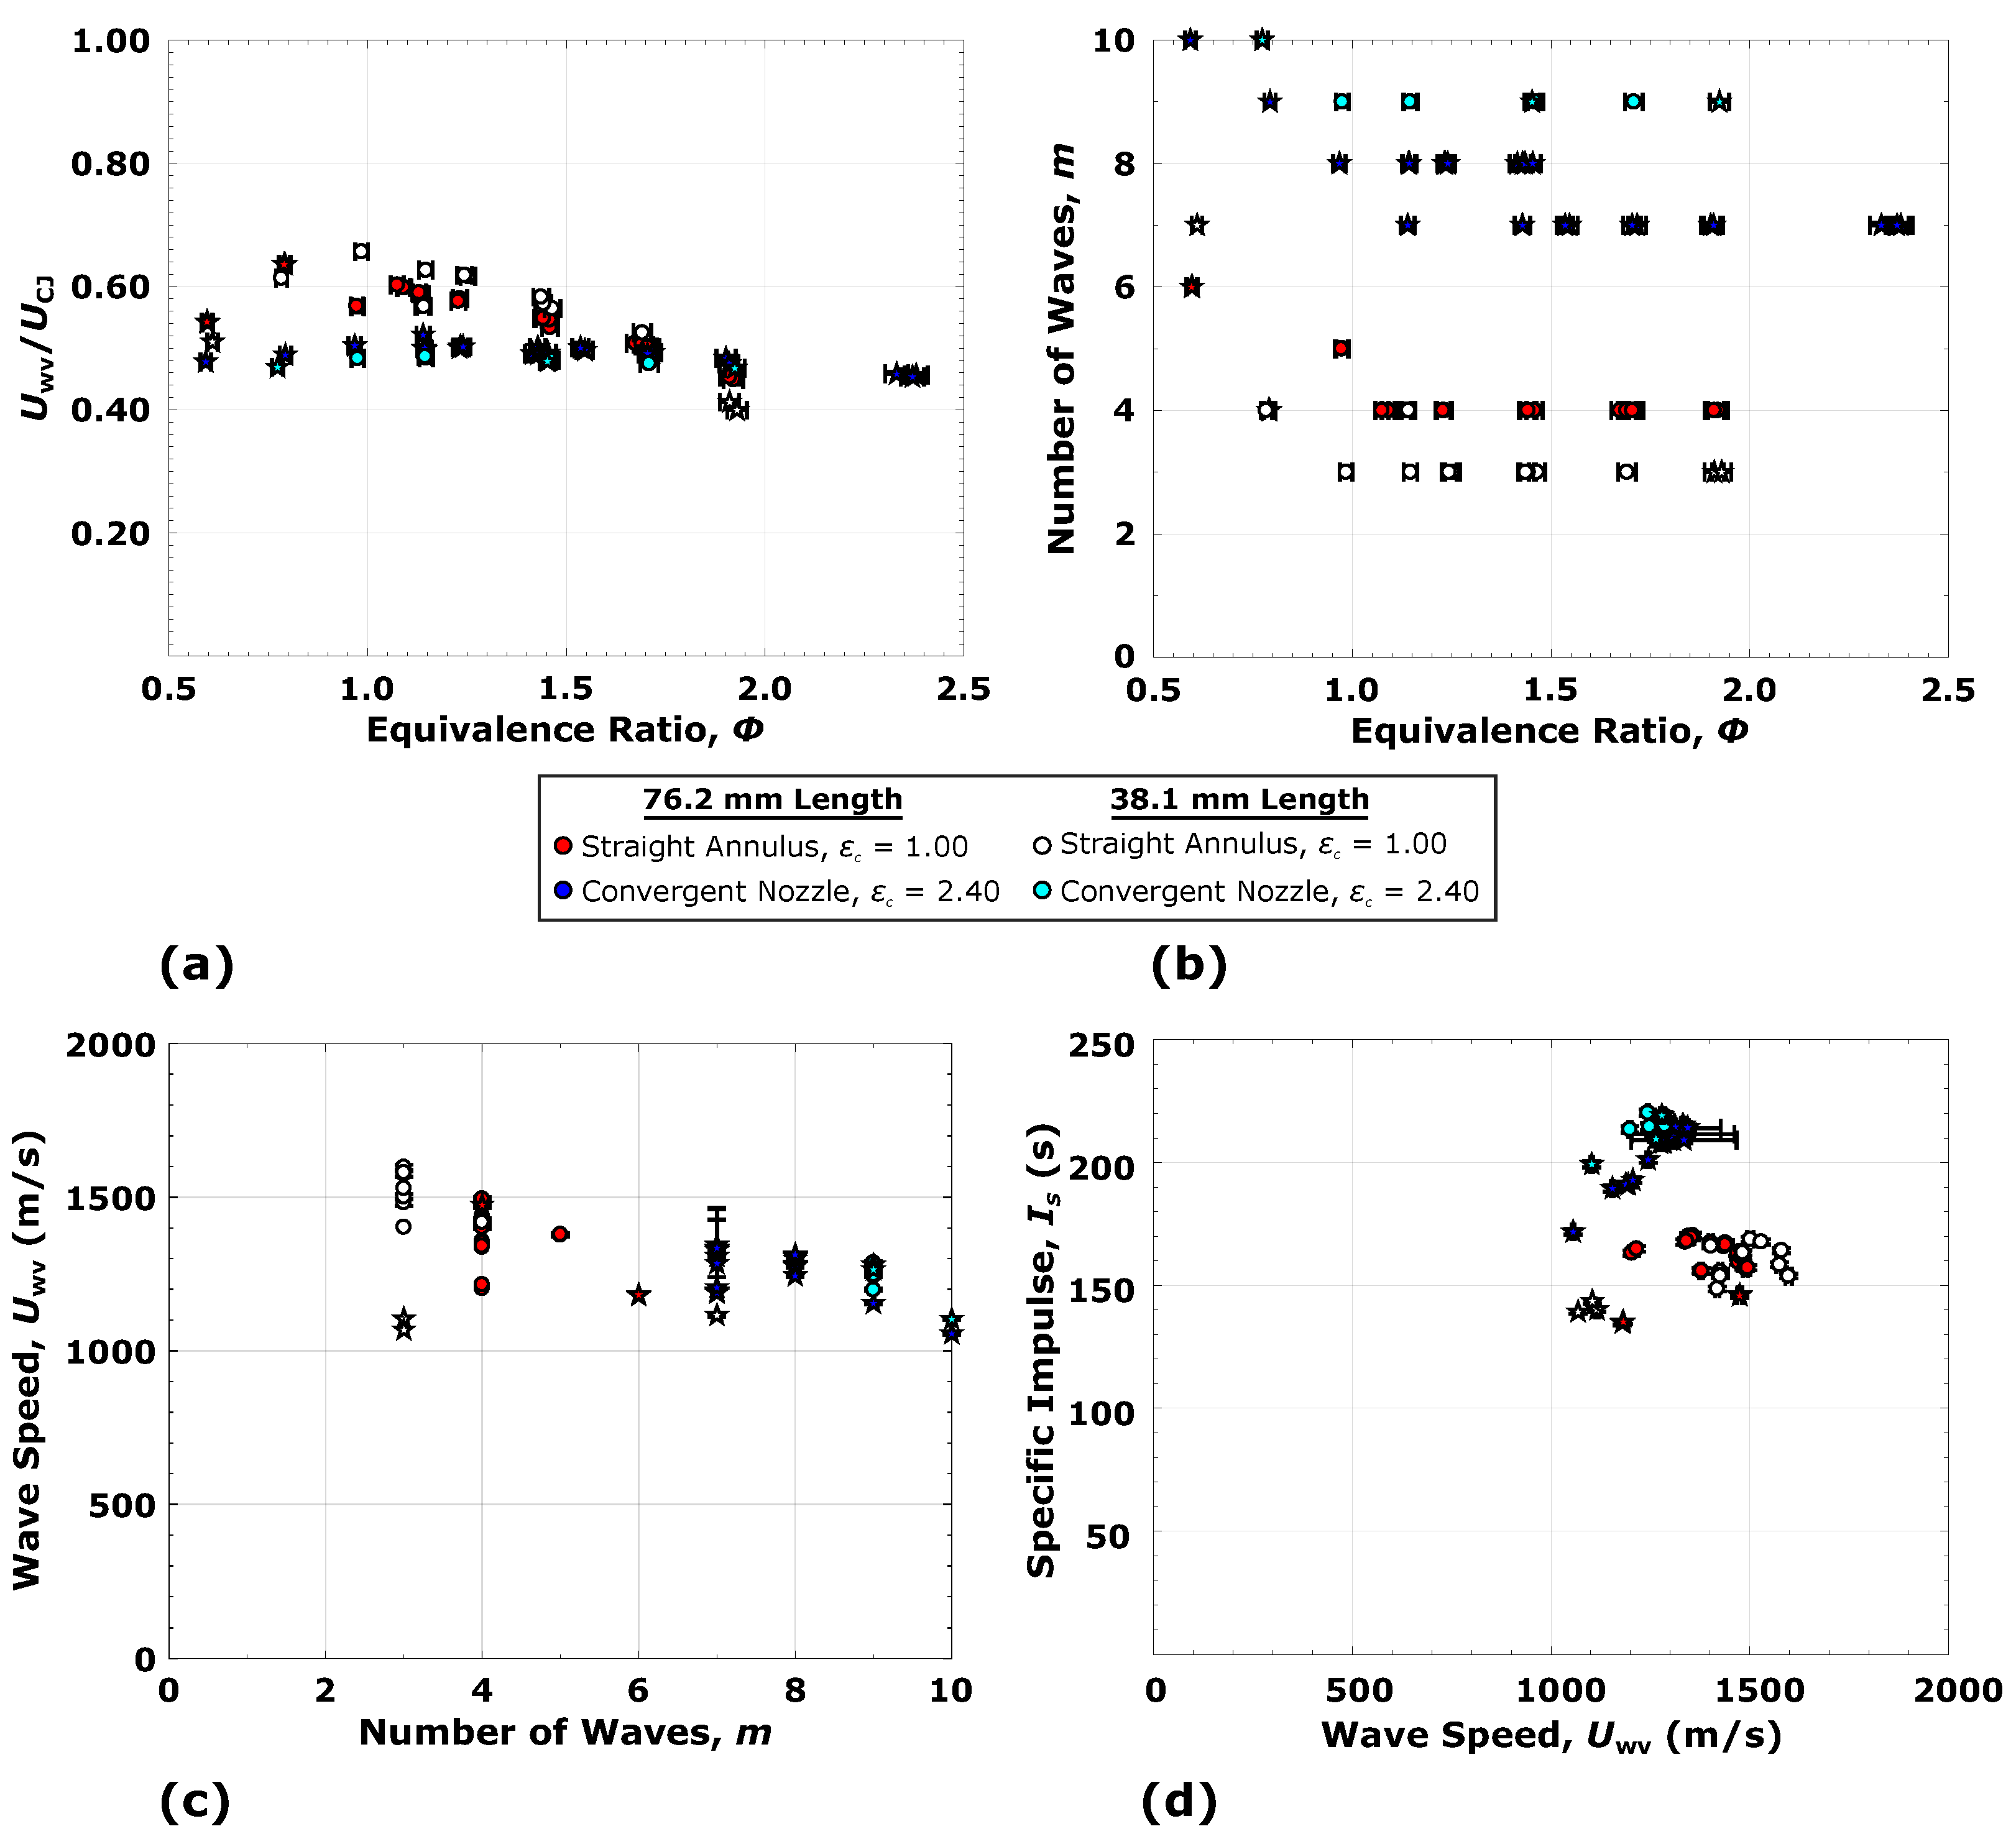
3.2. Detonation Mode Characteristics
4. Convergent Nozzle Study: Reduced Length Geometries
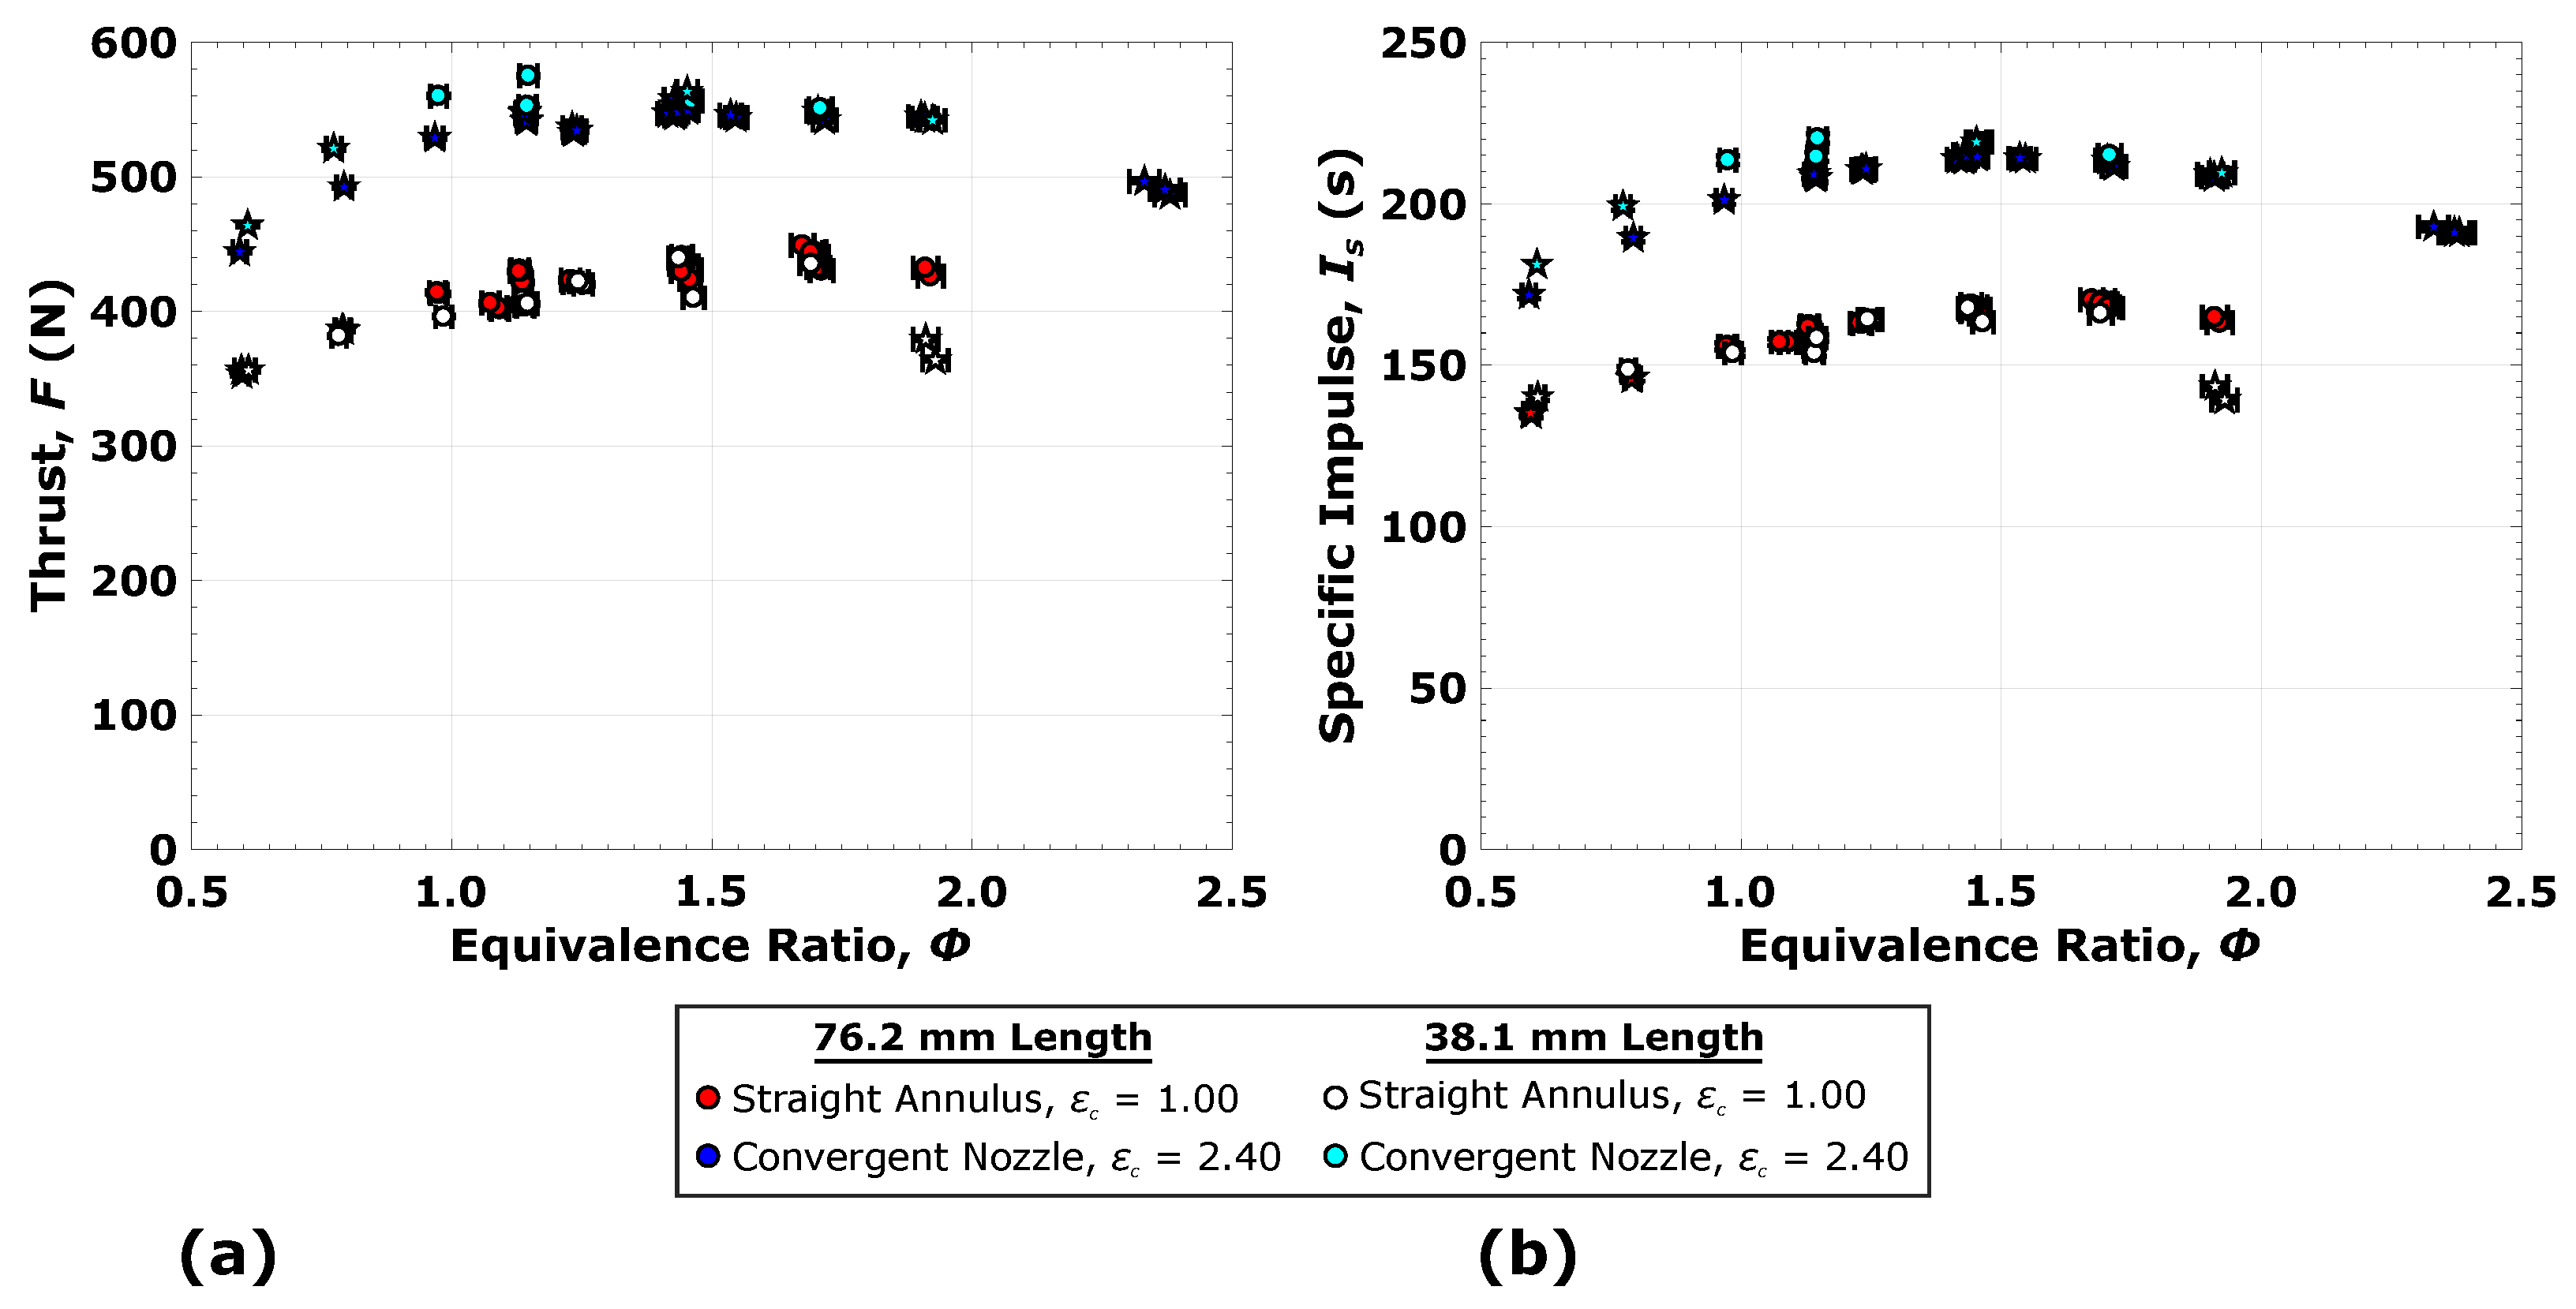
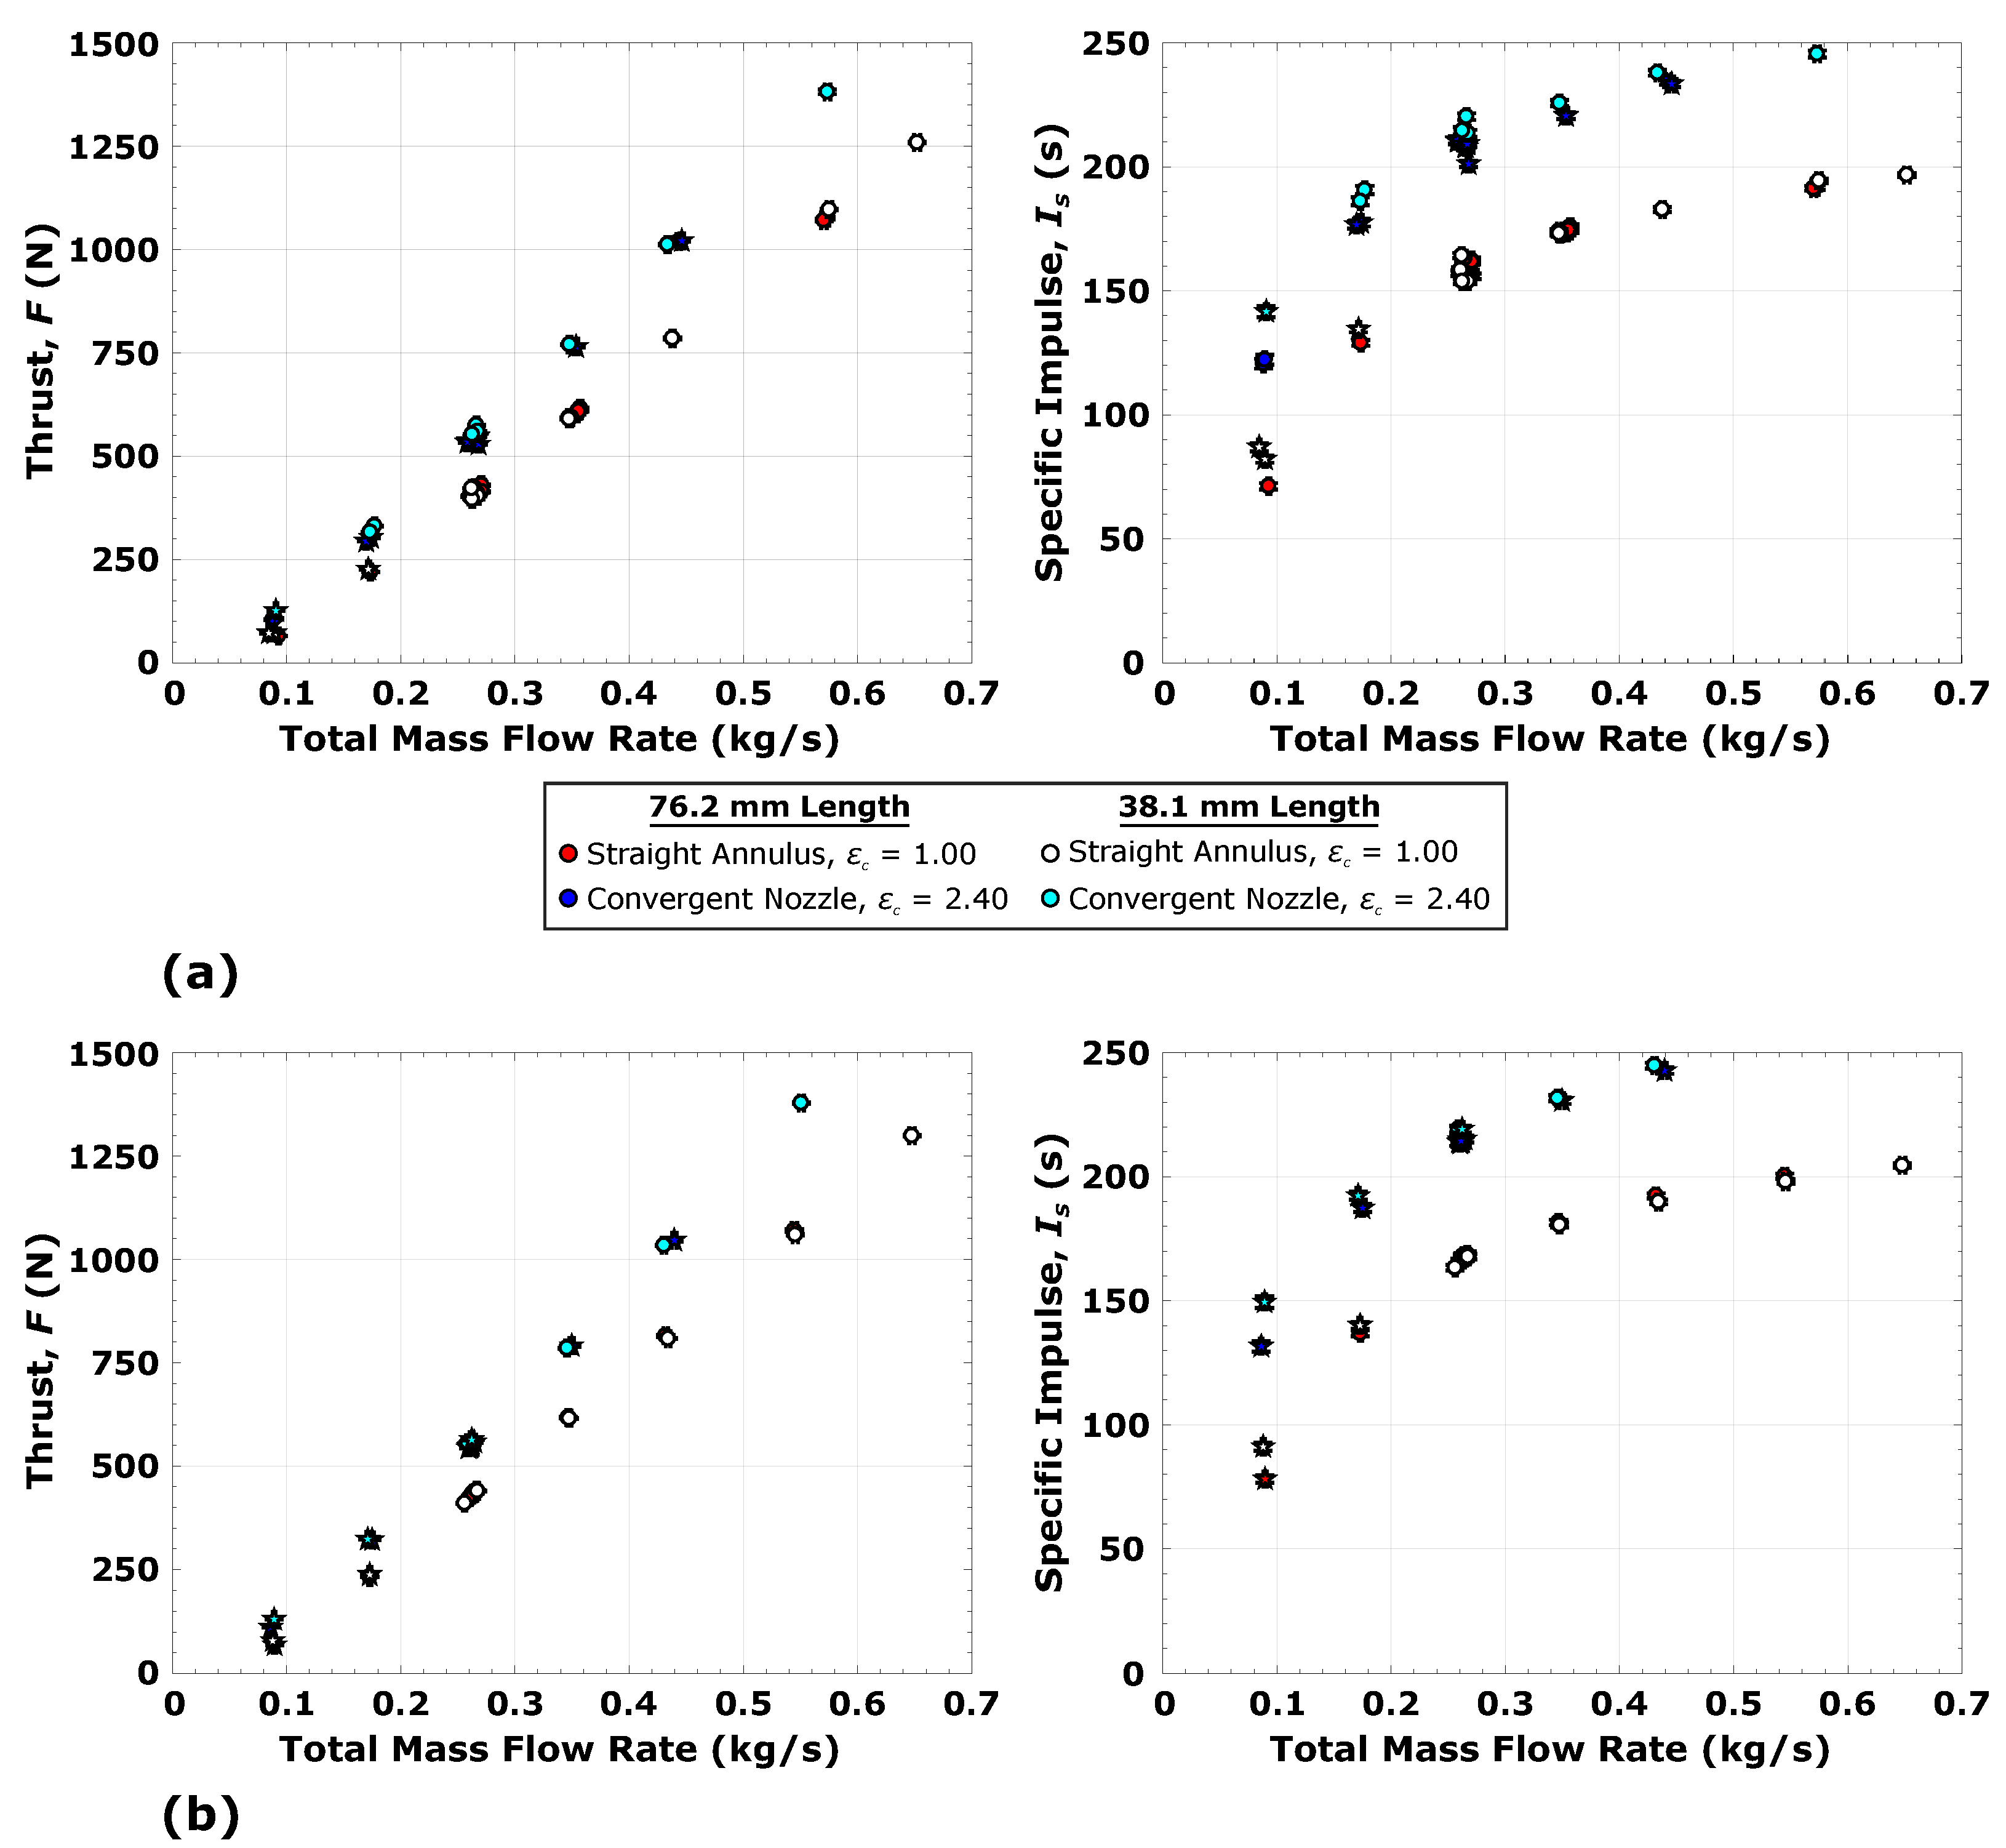
4.1. Engine Operability and Performance
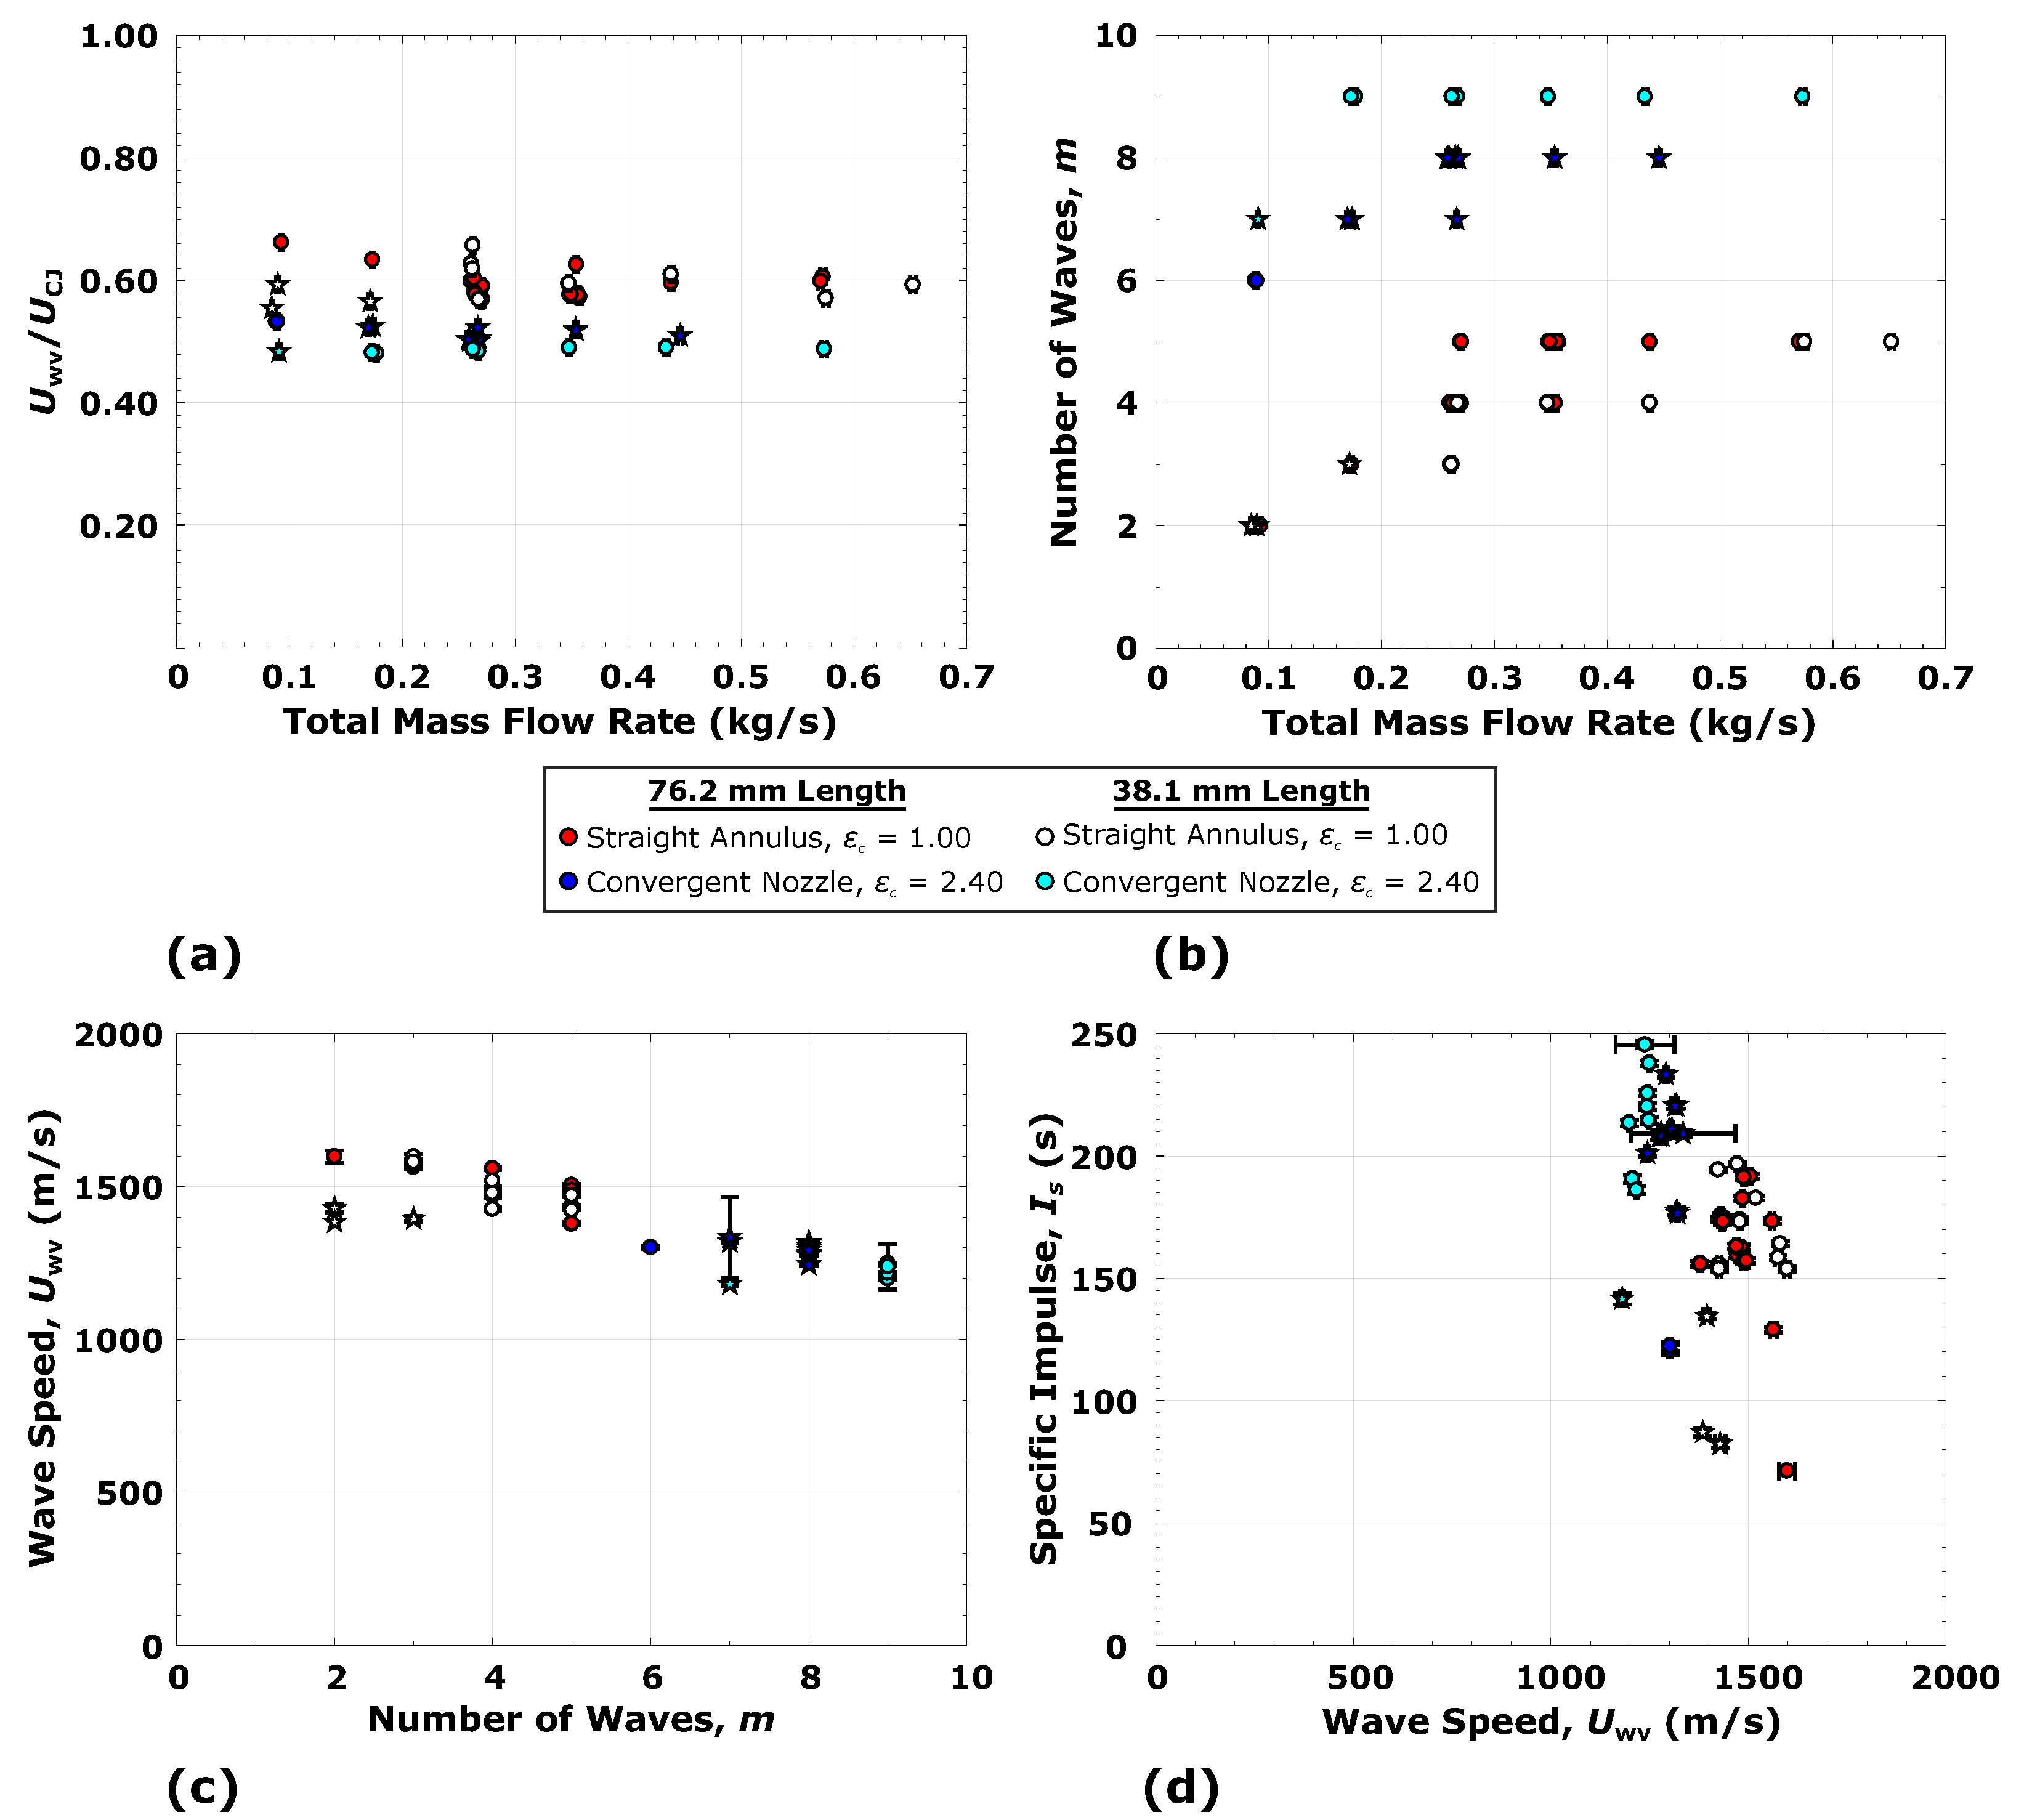
4.2. Detonation Mode Characteristics
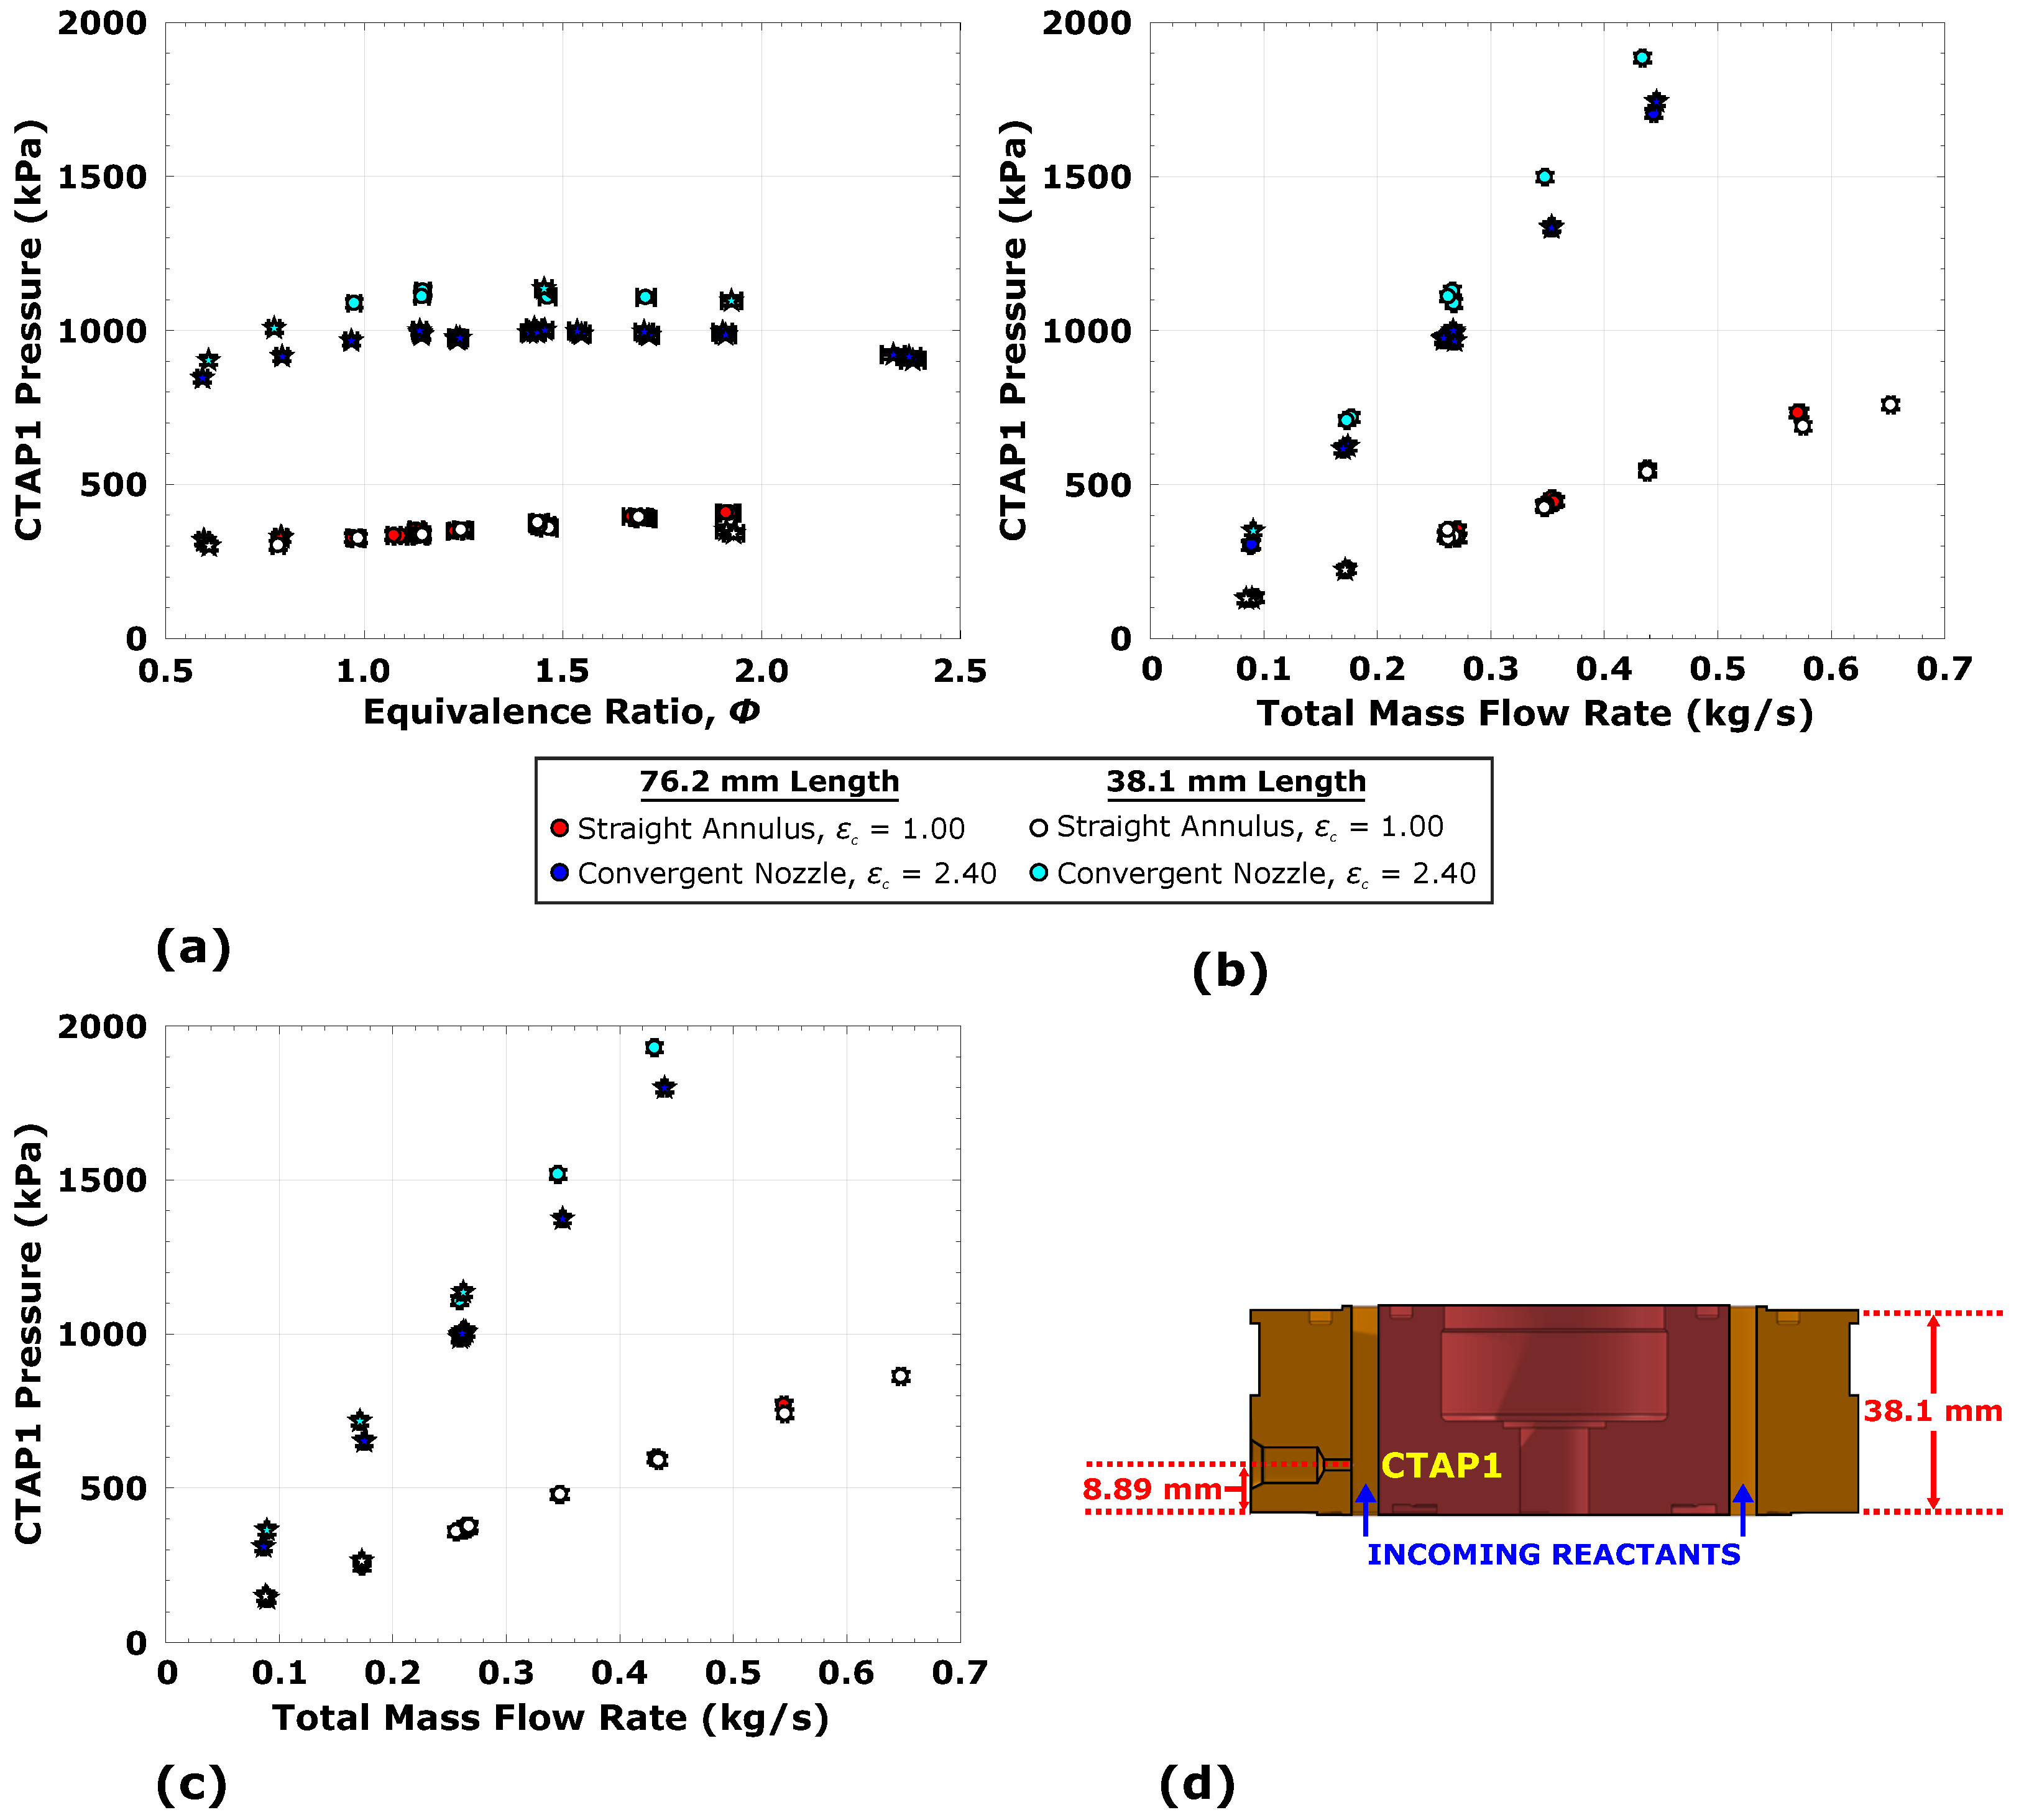
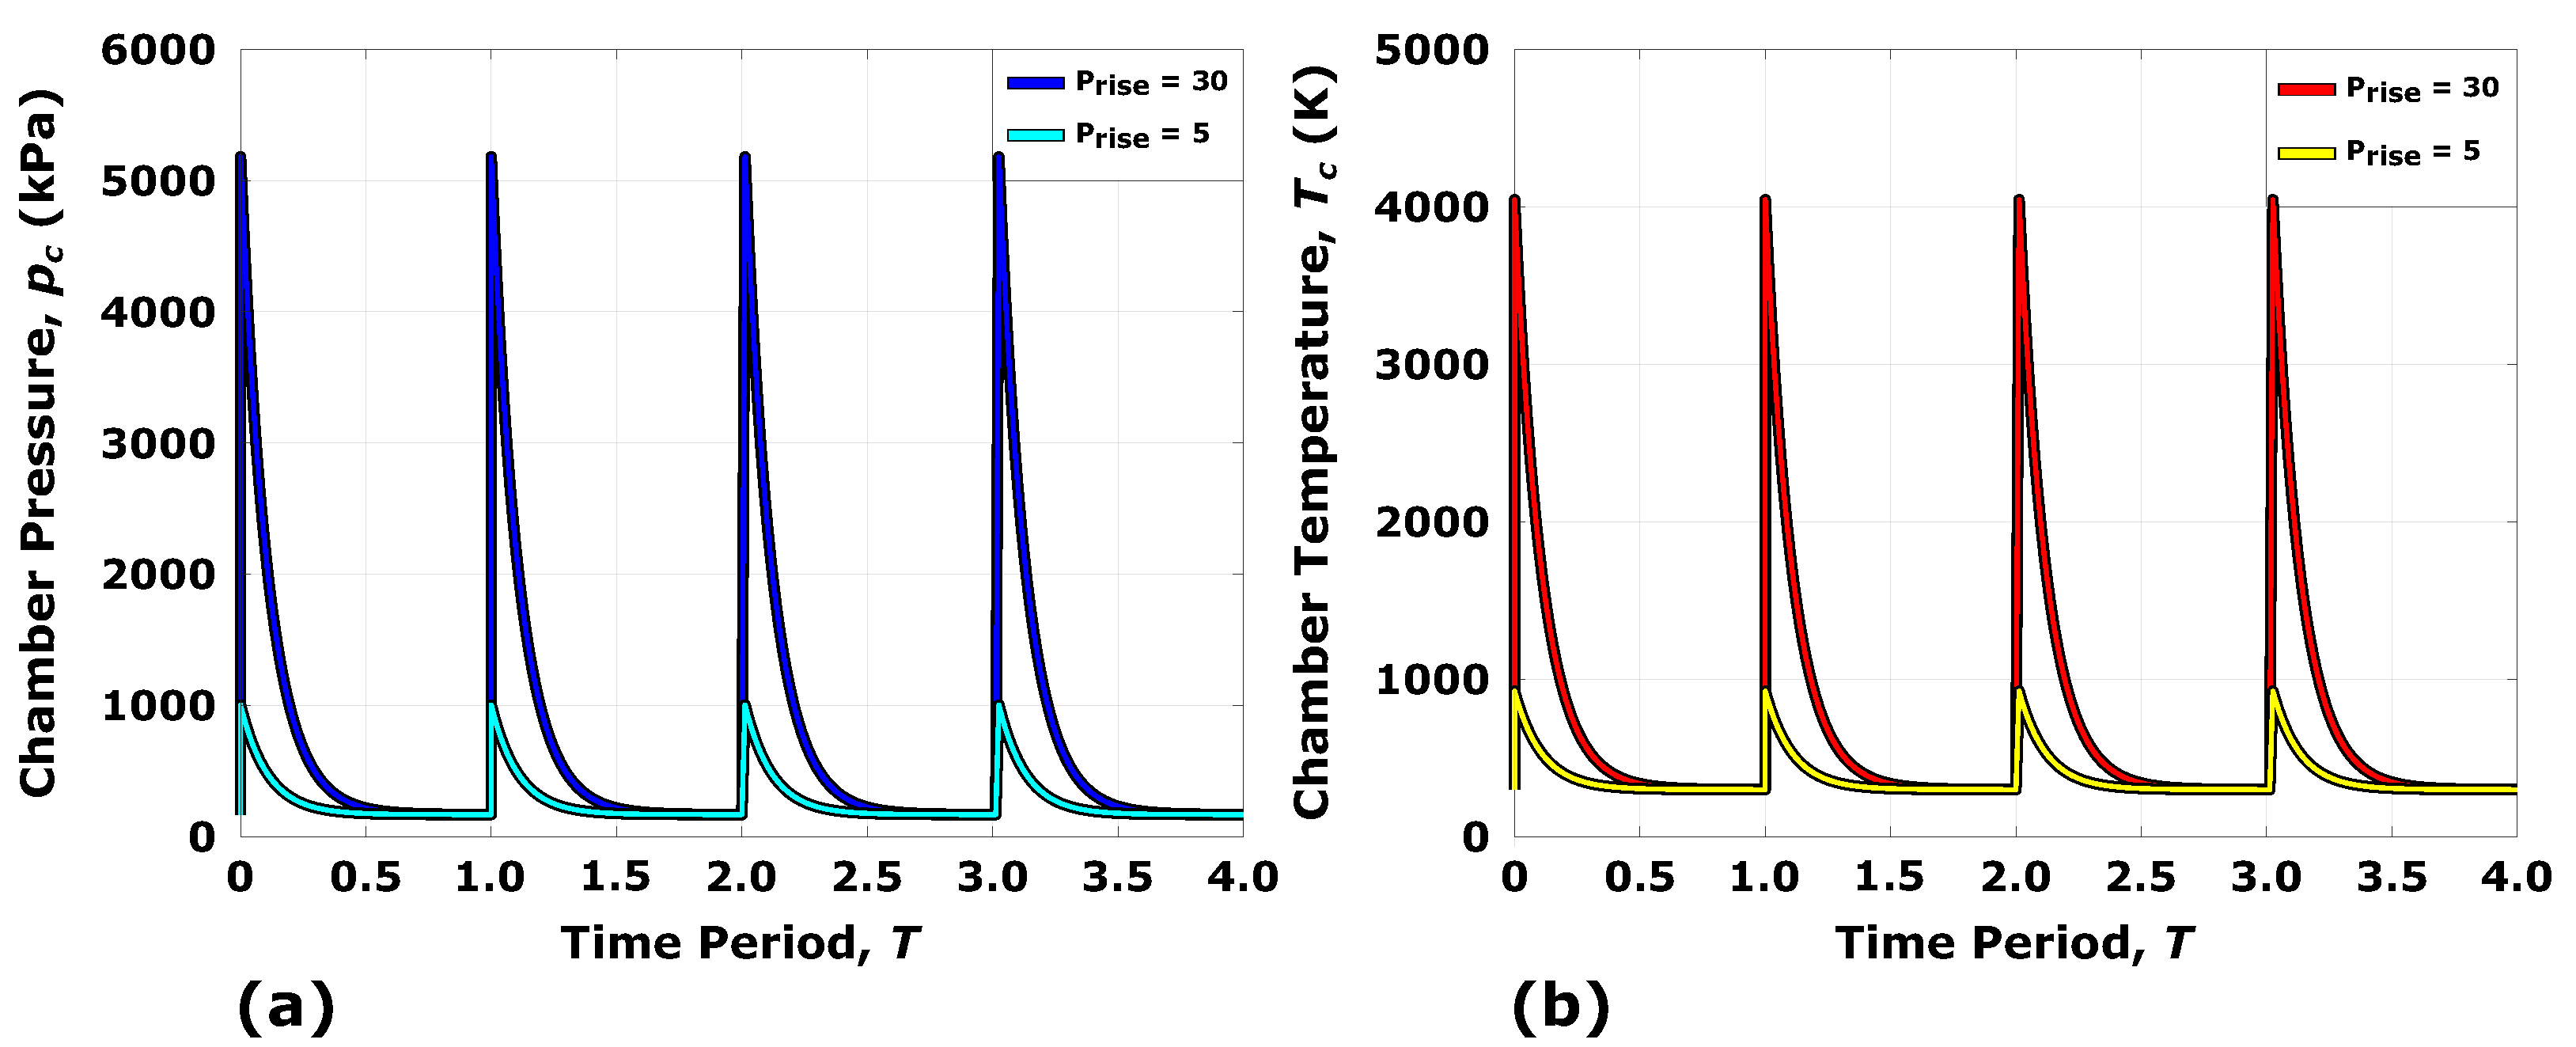
5. Injector Recovery Analysis
Injection Recovery: Modeling and Simulation
6. Conclusions
Author Contributions
Funding
Acknowledgments
Conflicts of Interest
References
- Bykovskii, F.; Zhdan, S.; Vedernikov, E.F. Continuous Spin Detonations. J. Propuls. Power 2006, 22, 1204–1216. [Google Scholar] [CrossRef]
- Smith, R.D.; Stanley, S.B. Experimental Investigation of Rotating Detonation Rocket Engines for Space Propulsion. J. Propuls. Power 2021, 1–11. [Google Scholar] [CrossRef]
- Frolov, S.M.; Aksenov, V.S.; Ivanov, V.S.; Medvedev, S.N.; Shamshin, I.O. Flow Structure in Rotating Detonation Engine with Separate Supply of Fuel and Oxidizer: Experiment and CFD. In Shock Wave and High Pressure Phenomena; Springer International Publishing: Cham, Switzerland, 2017; pp. 39–59. [Google Scholar] [CrossRef]
- Stechmann, D.P.; Heister, S.D.; Sardeshmukh, S.V. High-Pressure Rotating Detonation Engine Testing and Flameholding Analysis with Hydrogen and Natural Gas. In Proceedings of the 55th AIAA Aerospace Sciences Meeting, Grapevine, TX, USA, 9–13 January 2017. [Google Scholar] [CrossRef]
- Bennewitz, J.; Bigler, B.; Hargus, W.; Danczyk, S.; Smith, R. Characterization of Detonation Wave Propagation in a Rotating Detonation Rocket Engine using Direct High-Speed Imaging. In Proceedings of the 54th AIAA Joint Propulsion Conference, Cincinnati, OH, USA, 9–11 July 2018. [Google Scholar]
- Goto, K.; Nishimura, J.; Higashi, J.; Taki, H.; Ukai, T.; Hayamizu, Y.; Yamada, T.; Watanabe, S.; Hotta, K.; Inakawa, T.; et al. Preliminary Experiments on Rotating Detonation Rocket Engine for Flight Demonstration Using Sounding Rocket. In Proceedings of the 2018 AIAA Aerospace Sciences Meeting, Kissimmee, FL, USA, 8–12 January 2018. [Google Scholar] [CrossRef]
- Frolov, S.M.; Aksenov, V.S.; Ivanov, V.S.; Medvedev, S.N.; Shamshin, I.O.; Yakovlev, N.N.; Kostenko, I.I. Rocket Engine with Continuous Detonation Combustion of the Natural Gas–Oxygen Propellant System. Dokl. Phys. Chem. 2018, 478, 31–34. [Google Scholar] [CrossRef]
- Bykovskii, F.A.; Zhdan, S.A.; Vedernikov, E.F. Continuous Detonation of the Liquid Kerosene—Air Mixture with Addition of Hydrogen or Syngas. Combust. Explos. Shock Waves 2019, 55, 589–598. [Google Scholar] [CrossRef]
- Paxson, D.E.; Schwer, D.A. Operational Stability Limits in Rotating Detonation Engine Numerical Simulations. In Proceedings of the AIAA Scitech 2019 Forum, San Diego, CA, USA, 7–11 January 2019. [Google Scholar] [CrossRef]
- Goto, K.; Nishimura, J.; Kawasaki, A.; Matsuoka, K.; Kasahara, J.; Matsuo, A.; Funaki, I.; Nakata, D.; Uchiumi, M.; Higashino, K. Propulsive Performance and Heating Environment of Rotating Detonation Engine with Various Nozzles. J. Propuls. Power 2019, 35, 213–223. [Google Scholar] [CrossRef]
- Bluemner, R.; Bohon, M.D.; Paschereit, C.O.; Gutmark, E.J. Effect of inlet and outlet boundary conditions on rotating detonation combustion. Combust. Flame 2020, 216, 300–315. [Google Scholar] [CrossRef]
- Stechmann, D.P. Experimental Study of High-Pressure Rotating Detonation Combustion in Rocket Enviroments. Ph.D. Thesis, Purdue University, West Lafayette, IN, USA, 2017. [Google Scholar]
- Bigler, B.R.; Bennewitz, J.W.; Schumaker, S.A.; Danczyk, S.A.; Hargus, W.A. Injector Alignment Study for Variable Mixing in Rotating Detonation Rocket Engines. In Proceedings of the AIAA Scitech 2019 Forum, San Diego, CA, USA, 7–11 January 2019. [Google Scholar] [CrossRef]
- Bennewitz, J.W.; Bigler, B.R.; Pilgram, J.J.; Hargus, W.A. Modal Transitions in Rotating Detonation Rocket Engines. Int. J. Energetic Mater. Chem. Propuls. 2019, 18, 91–109. [Google Scholar] [CrossRef]
- Smith, R.D.; Stanley, S.B. Experimental Investigation of Continuous Detonation Rocket Engines for In-Space Propulsion. In Proceedings of the 52nd AIAA/SAE/ASEE Joint Propulsion Conference, Salt Lake City, UT, USA, 25–27 July 2016. [Google Scholar]
- Stevens, C.; Fotia, M.; Hoke, J.; Schauer, F. Comparison of Transient Response of Pressure Measurement Techniques with Application to Detonation Waves. In Proceedings of the 53rd AIAA Aerospace Sciences Meeting, Kissimmee, FL, USA, 5–9 January 2015. [Google Scholar]
- Lightfoot, M.D.; Danczyk, S.A.; Watts, J.M.; Schumaker, S.A. Accuracy and Best Practices for Small-Scale Rocket Engine Testing; Technical Report; AFRL-RZ-ED-TP-2011-420; Air Force Research Laboratory Wright-Patterson AFB: Dayton, OH, USA, 2011. [Google Scholar]
- Taylor, J.R. An Introduction to Error Analysis: The Study of Uncertainties in Physical Measurements, 2nd ed.; University Science Books: Sausalito, CA, USA, 1997. [Google Scholar]
- Beckwith, T.G.; Roy, D.M.; Lienhard, J.H. Mechanical Measurements, 6th ed.; Pearson Prentice Hall: Upper Saddle River, NJ, USA, 2007. [Google Scholar]
- Gordon, S.; McBride, B.J. Computer Program for Calculation of Complex Chemical Equilibrium Compositions and Applications, Part I: Analysis; Technical Report NASA RP-1311; National Aeronautics and Space Administration, Lewis Research Center: Cleveland, OH, USA, 1994. [Google Scholar]
- Sutton, G.P.; Biblarz, O. Rocket Propulsion Elements, 8th ed.; John Wiley & Sons, Inc.: Hoboken, NJ, USA, 2010. [Google Scholar]
- Bennewitz, J.; Bigler, B.; Schumaker, S.; Hargus, W. Automated Image Processing Method to Quantify Rotating Detonation Wave Behavior. Rev. Sci. Instrum. 2019, 90. [Google Scholar] [CrossRef] [PubMed]
- Wolanski, P. Rotating Detonation Wave Stability. In Proceedings of the 23rd International Colloquium For Dynamics of Explosions and Reactive Systems, Irvine, CA, USA, 24–29 July 2011. [Google Scholar]
- Chapman, D. On the Rate of Explosion in Gases. Lond. Edinb. Dublin Philos. Mag. J. Sci. 1899, 47, 90–104. [Google Scholar] [CrossRef] [Green Version]
- Lietz, C.; Desai, Y.; Munipalli, R.; Schumaker, S.A.; Sankaran, V. Flowfield analysis of a 3D simulation of a rotating detonation rocket engine. In Proceedings of the AIAA Scitech 2019 Forum, San Diego, CA, USA, 7–11 January 2019. [Google Scholar] [CrossRef]
- Bykovskii, F.A.; Zhdan, S.A. Current status of research of continuous detonation in fuel–air mixtures (Review). Combust. Explos. Shock Waves 2015, 51, 21–35. [Google Scholar] [CrossRef]
- Kayser, J.C.; Shambaugh, R.L. Discharge coefficients for compressible flow through small-diameter orifices and convergent nozzles. Chem. Eng. Sci. 1991, 46, 1697–1711. [Google Scholar] [CrossRef]
- EPA. Risk Management Program Guidance for Offsite Consequence Analysis; Technical Report EPA 550-B-99-009; Chemical Emergency Preparedness and Prevention Office: Washington, DC, USA, 1999.
- Zucrow, M.J.; Hoffman, J.D. Gas Dynamics: Volume 1; John Wiley & Sons, Inc.: Hoboken, NJ, USA, 1976. [Google Scholar]
- Redhal, S.C.; Burr, J.R.; Yu, K.H. Fuel Injection Dynamics and Detonation Wave Interaction in Rectangular Channel. In Proceedings of the AIAA Scitech 2019 Forum, San Diego, CA, USA, 7–11 January 2019. [Google Scholar] [CrossRef]
- Kim, W.W.; Menon, S. An unsteady incompressible Navier–Stokes solver for large eddy simulation of turbulent flows. Int. J. Numer. Methods Fluids 1999, 31, 983–1017. [Google Scholar] [CrossRef]
- Génin, F.; Menon, S. Studies of shock/turbulent shear layer interaction using Large-Eddy Simulation. Comput. Fluids 2010, 39, 800–819. [Google Scholar] [CrossRef]
- Masquelet, M.; Menon, S. Large-Eddy Simulation of Flame-Turbulence Interactions in a Shear Coaxial Injector. J. Propuls. Power 2010, 26, 924–935. [Google Scholar] [CrossRef]
- Srinivasan, S.; Ranjan, R.; Menon, S. Flame Dynamics During Combustion Instability in a High-Pressure, Shear-Coaxial Injector Combustor. Flow Turbul. Combust. 2015, 94, 237–262. [Google Scholar] [CrossRef]
- Gottiparthi, K.C.; Menon, S. A Study of Interaction of Clouds of Inert Particles with Detonation in Gases. Combust. Sci. Technol. 2012, 184, 406–433. [Google Scholar] [CrossRef]
- Yang, S.; Ranjan, R.; Yang, V.; Sun, W.; Menon, S. Sensitivity of predictions to chemical kinetics models in a temporally evolving turbulent non-premixed flame. Combust. Flame 2017, 183, 224–241. [Google Scholar] [CrossRef]
- Lietz, C.; Desai, Y.; Hargus, W.A.; Sankaran, V. Parametric investigation of rotating detonation rocket engines using large eddy simulations. In Proceedings of the AIAA Propulsion and Energy 2019 Forum, Indianapolis, IN, USA, 19–22 August 2019. [Google Scholar] [CrossRef]
- Lietz, C.; Ross, M.; Desai, Y.; Hargus, W.A. Numerical investigation of operational performance in a methane-oxygen rotating detonation rocket engine. In Proceedings of the AIAA Scitech 2020 Forum, Orlando, FL, USA, 6–10 January 2020. [Google Scholar] [CrossRef]
- Ross, M.; Lietz, C.; Desai, Y.; Hamilton, J.; Hargus, W. Investigation into the Impact of an Exit Constriction on Rotating Detonation Rocket Engines, Using Large Eddy Simulations; Technical Report AD1108842; Air Force Research Laboratory: Edwards, CA, USA, 2019. [Google Scholar]
- Prakash, S.; Fiévet, R.; Raman, V.; Burr, J.; Yu, K.H. Analysis of the Detonation Wave Structure in a Linearized Rotating Detonation Engine. AIAA J. 2020, 58, 5063–5077. [Google Scholar] [CrossRef]
- Pal, P.; Kumar, G.; Drennan, S.; Rankin, B.A.; Som, S. Numerical Modeling of Supersonic Combustion in a Non- Premixed Rotating Detonation Engine. In Proceedings of the 11th U.S. National Combustion Meeting, Pasadena, CA, USA, 24–27 March 2019. [Google Scholar]
- Schwer, D.; Kailasanath, K. Feedback into Mixture Plenums in Rotating Detonation Engines. In Proceedings of the 50th AIAA Aerospace Sciences Meeting Including the New Horizons Forum and Aerospace Exposition, Nashville, TN, USA, 9–12 January 2012. [Google Scholar] [CrossRef]


| Contraction Ratio | Annular Length | Nozzle Throat | Throat Axial |
|---|---|---|---|
| (mm) | Size (mm) | Distance (mm) | |
| 1.23 | 76.2 | 3.98 | 73.9 |
| 1.62 | 76.2 | 3.00 | 70.4 |
| 2.40 | 76.2 | 2.01 | 66.6 |
| 2.40 | 38.1 | 2.01 | 27.2 |
| (kg/s) | (kg/s) | (kg/s) | (kPa) | (kPa) | CTAP1 (kPa) | m | c/ | |
|---|---|---|---|---|---|---|---|---|
| 0.207 | 0.056 | 0.263 | 1.07 | 2207 | 2044 | 334 | 4 | 0.60 |
| Ratio | Ratio | (kPa) | (K) | Oscillation Event |
|---|---|---|---|---|
| 5.00 | 2.10 | 262 | 369 | None (Fully Choked) |
| 10.0 | 4.19 | 356 | 439 | Partially Unchoked |
| 20.0 | 8.38 | 545 | 581 | Small Magnitude Backflow |
| 30.0 | 12.57 | 734 | 722 | Large Magnitude Backflow |
Publisher’s Note: MDPI stays neutral with regard to jurisdictional claims in published maps and institutional affiliations. |
© 2021 by the authors. Licensee MDPI, Basel, Switzerland. This article is an open access article distributed under the terms and conditions of the Creative Commons Attribution (CC BY) license (https://creativecommons.org/licenses/by/4.0/).
Share and Cite
Bennewitz, J.W.; Bigler, B.R.; Ross, M.C.; Danczyk, S.A.; Hargus, W.A., Jr.; Smith, R.D. Performance of a Rotating Detonation Rocket Engine with Various Convergent Nozzles and Chamber Lengths. Energies 2021, 14, 2037. https://doi.org/10.3390/en14082037
Bennewitz JW, Bigler BR, Ross MC, Danczyk SA, Hargus WA Jr., Smith RD. Performance of a Rotating Detonation Rocket Engine with Various Convergent Nozzles and Chamber Lengths. Energies. 2021; 14(8):2037. https://doi.org/10.3390/en14082037
Chicago/Turabian StyleBennewitz, John W., Blaine R. Bigler, Mathias C. Ross, Stephen A. Danczyk, William A. Hargus, Jr., and Richard D. Smith. 2021. "Performance of a Rotating Detonation Rocket Engine with Various Convergent Nozzles and Chamber Lengths" Energies 14, no. 8: 2037. https://doi.org/10.3390/en14082037