
Enhancement of Food Waste Management and Its Environmental Consequences
by
 , , and
Jan den Boer
1 ,
,
Gudrun Obersteiner
2,*,
Sebastian Gollnow
2,
Emilia den Boer
3 and
Renata Bodnárné Sándor
4 1
Department of Applied Bioeconomy, Faculty of Life Sciences and Technology, Wrocław University of Environmental and Life Sciences, 51-630 Wroclaw, Poland
2
Department of Water, Atmosphere and Environment, Institute of Waste Management, University of Natural Resources and Life Sciences, 1190 Vienna, Austria
3
Chair of Environmental Protection Engineering, Faculty of Environmental Engineering, Wroclaw University of Science and Technology, 50-370 Wroclaw, Poland
4
Division for SMART Systems (BAY-SMART), Bay Zoltán Nonprofit Ltd. for Applied Research, 3519 Miskolc, Hungary
*
Author to whom correspondence should be addressed.
Energies 2021, 14(6), 1790; https://doi.org/10.3390/en14061790
Submission received: 28 February 2021
/
Revised: 16 March 2021
/
Accepted: 16 March 2021
/
Published: 23 March 2021
(This article belongs to the Special Issue Enhanced Biogas Production)
Abstract
:This paper assesses the potential environmental effects of the optimization of the kitchen waste management in Opole. The separate collection of kitchen waste is improved by distribution of separate collection kits consisting of an in-home bin and 10 L biodegradable bags. The surplus of collected kitchen waste is diverted from treatment in a mechanical-biological pretreatment (MBP) along with the residual waste to anaerobic digestion (AD) with the biowaste. This has positive effects on European and Polish goals, ambitions, and targets, such as (i) increasing the level of renewables in the primary energy supply, (ii) decreasing the level of greenhouse gas (GHG) emissions, (iii) increasing the level of preparation for reuse and recycling of municipal waste. The environmental effects of 1 ton additionally separately collected and treated kitchen waste are determined by using life cycle assessment. It was shown that in all selected impact categories (global warming potential, marine eutrophication potential, acidification potential, and ozone depletion potential) a clear environmental benefit can be achieved. These benefits are mainly caused by the avoided emissions of electricity and heat from the Polish production mix, which are substituted by energy generation from biogas combustion. Optimization of the waste management system by diversion of kitchen waste from mechanical-biological pretreatment to anaerobic digestion can lead to considerable saving of 448 kg CO2-eq/t of waste diverted. With an estimated optimization potential for the demonstration site of 40 kg/inh·year for the city of Opole, this would lead to 680,000 t CO2-eq savings per year for the whole of Poland. The sensitivity analysis showed that with a choice for cleaner energy sources the results would, albeit lower, show a significant savings potential.
1. Introduction
The ambition of the European Union when it comes to making the energy sector greener is strongly evolving; from the 20-20-20 target for 2020 over intermediate goals of a share of at least 27% of renewable sources in the EU-wide electricity production and 32% for the overall primary energy supply by the year 2030 [1,2,3,4]. The share of energy from biomass and the renewable share of waste is thought to increase to over two-thirds of the renewable share by 2030 [4]. For the greenhouse gas (GHG) emissions, the ambition is even higher with a planned increase of the 2030 reduction target of 40% to 55% compared to the 1990 level. Moreover, the European Union aims to becoming climate neutral, with net zero GHG emissions by 2050, as was set out in the proposal for the first European Climate Law [5,6].
As a keystone within the European Green Deal the Circular Economy Action Plan was launched [7]. Central goal is striving to reuse and circulation of the material content products and packaging after their (first) use phase. This refers both to organic and non-organic materials. Part of the Circular Economy Action Plan is the development of an Integrated Nutrient Management Plan, which should ensure, among others, enhancing the recovery of nutrients [7].
In the renewal of the Law on Maintaining Cleanliness and Order in Communes, the Polish government interpreted European requirements, targets, and ambitions in a continuously growing goal for municipal waste management [8]. Whereas the goal until 2020 was to prepare for reuse and recycling at least 50% by weight of the following fractions of municipal waste, paper, metal, plastic, and glass, after 2020 the focus is enlarged beyond the dry recyclables and includes organic waste as well. Starting from a goal of 20% by weight for 2020 a fast increase to 55% of preparation for reuse and recycling of the entire fraction of municipal waste by 2025 is prescribed. This goal for the Polish municipalities is further rising until the level of 65% from 2035 and onwards.
In the Polish city of Opole, a biowaste collection scheme from households has been in place for some years. However, even though the results of separate collection of kitchen waste are higher than the Polish average, there is still plenty opportunities for optimization of the system. Compared to European countries that are well advanced in terms of waste management it becomes clear that the optimum has not been reached yet. An improvement of the collected amounts of kitchen waste, combined with a consequent change in treatment of the thus additionally collected kitchen waste (from mechanical-biological pretreatment (MBP) along with the residual waste to anaerobic digestion (AD) along with the biowaste) would contribute to all of the European and Polish goals, ambitions and targets mentioned above:
- Increase the level of renewables in the primary energy supply;
- Decrease the level of GHG emissions;
- Increase the level of preparation for reuse and recycling of municipal waste.
This paper assesses the potential environmental effects of the optimization of the kitchen waste management in Opole. Anaerobic digestion as a technology for agricultural waste treatment has been assessed in many studies [9,10]. Studies focusing on AD of municipal biowaste and, especially, household kitchen waste are considerably fewer [11,12,13]. Most of these focus on the comparison to the variants of incineration and landfilling and in some cases to food waste prevention as well. Life cycle assessment studies of mechanical-biological pretreatment are less abundant than studies on AD. Most of these however, focus on the treatment of the entire flow of mixed or residual waste, not specifically aiming at food waste [13,14,15,16]. In the current paper the optimization of separate biowaste collection by providing pre-collection and the diversion of the waste from MBP to AD is analyzed.
2. Materials and Methods
2.1. Goal and Scope
Within the STREFOWA project (Strategies to reduce and manage food waste in Central Europe) 16 pilot actions were established to demonstrate various options for the reduction of food waste generation, the increase of food re-distribution, and the improvement of food waste management (www.reducefoodwaste.eu, accessed on 4 February 2021) [17]. The pilot actions were conducted in Austria, Hungary, Czech Republic, Italy, and Poland. One of the food waste management pilot actions considered the improvement of the separate collection of biowaste in the city of Opole, Poland in spring 2019.
In Opole, a biowaste collection scheme from households was already in place. In selected areas of low-rise, medium-rise, and high-rise premises in addition to the already existing system of outside biobins, two types of pre-collection aids, inside bins and biodegradable bags, were distributed. The bags were biodegradable ecovio® FS2312 bags by BASF, whereas the bins were 10 L polypropylene. Over a period of several weeks prior to and after the distribution of the biowaste collection sets (inside bin, 10 biodegradable bags (10 L) and info materials with instructions and a questionnaire for the inhabitants) the amounts and composition of both the residual and biowaste were monitored. The thus additionally separately collected kitchen waste is diverted from treatment in a mechanical-biological pretreatment (MBP) plant (within the residual waste as without separate collection) to a composting plant (within the biowaste). However, as in the future an anaerobic digestion (AD) plant is planned in Opole, the treatment option of AD is considered in the assessment.
The function of the studied system was to increase the amount of separately collected kitchen waste and treat it in an AD plant instead of in an MBP plant. The waste logistics were not considered to be changed (no decrease in collection and transport movements of residual waste, no increase in collection and transport movements of biowaste). In addition, analogically to Ekvall et al., the materials contained in the waste itself are considered to be free of environmental burdens [18].
The functional unit of the studied system is: “the diversion of 1 ton of kitchen waste from non-segregated treatment by mechanical-biological pretreatment to separately collected treatment by anaerobic digestion.”
The biodegradable bags used to improve the collection results, are part of the scenario. The inside kitchen bins were included in the assessment as well, assuming a 10 year lifetime. In the baseline scenario, no bags or bins were part of the assessment. In both the baseline scenario and the separated collection scenario also the effects of treatment residues were considered: landfilling (the fine fraction) and use as refuse derived fuel (RDF, the coarse fraction) after MBP; landspreading of compost for AD (after maturation of the digestion residue).
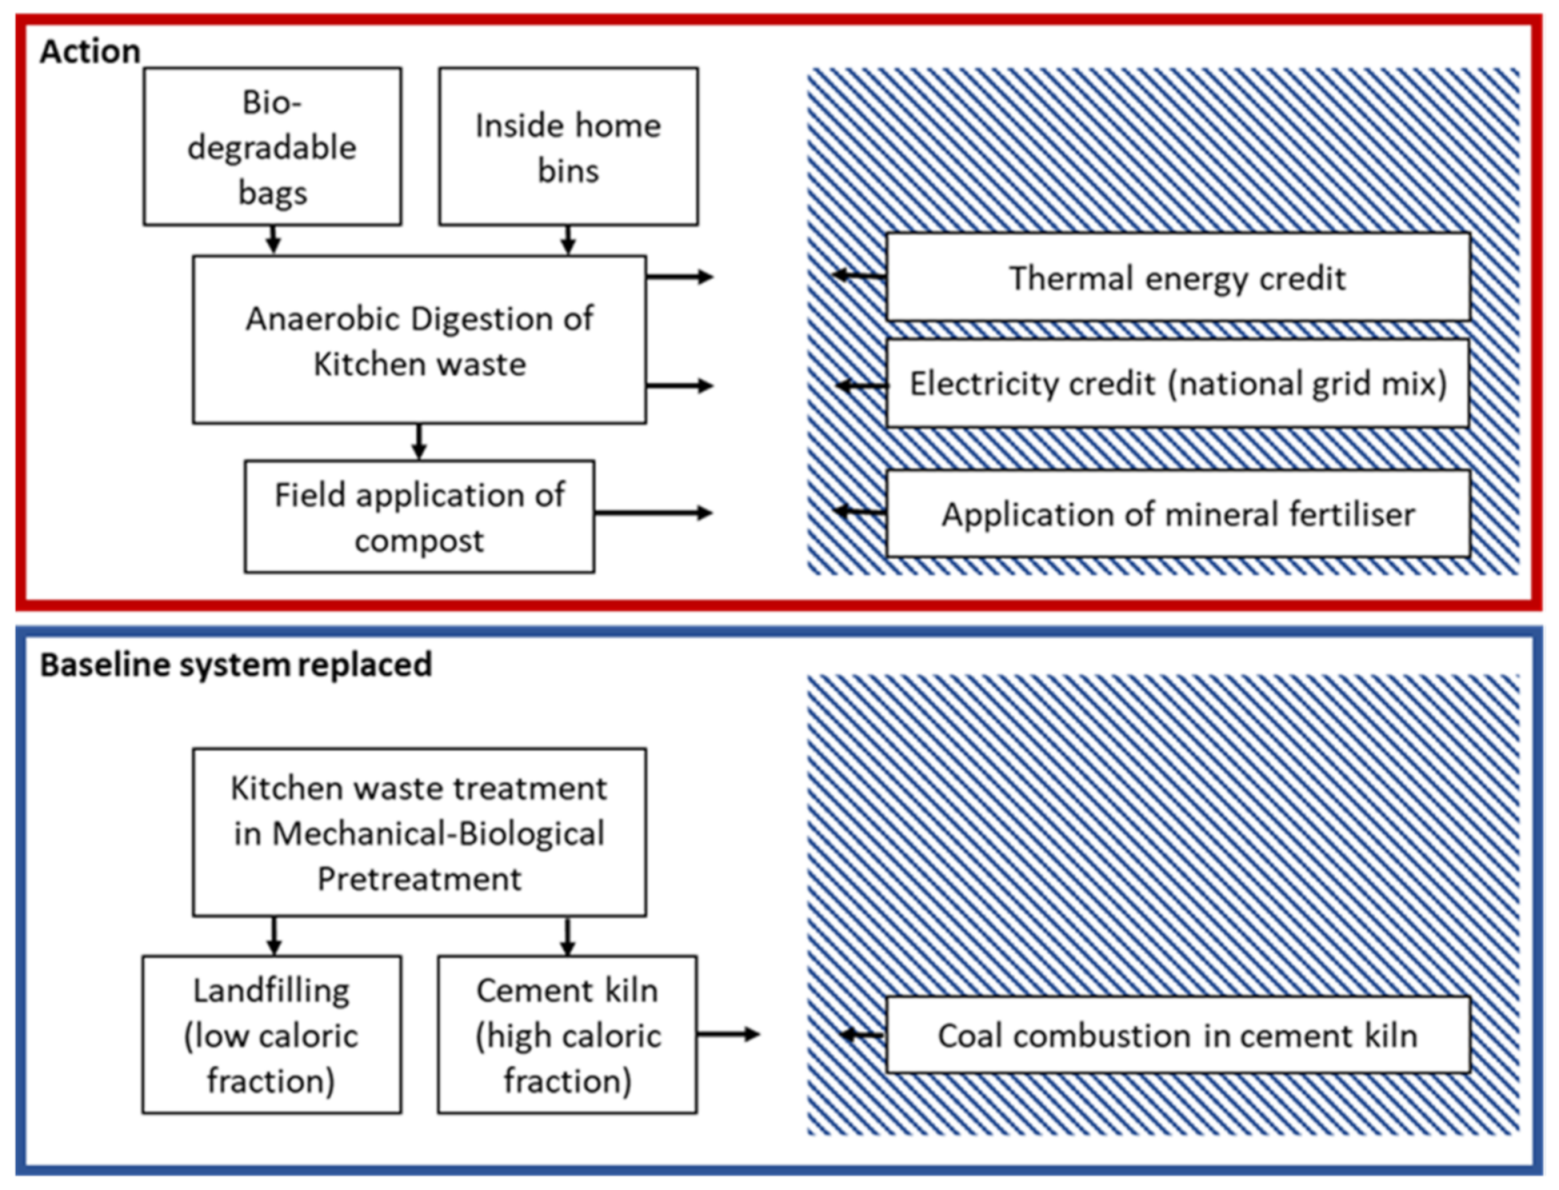
Implementation of nutrients and organic matter to the soil by landspreading of digestate-based compost were considered by taking into consideration the replacement of artificial fertilizers and straw. In the Figure 1 below the boundaries of the undertaken study are shown.
In the figure above the top system represents the newly applied pilot action, in which biowaste is segregated by the inhabitants using biodegradable bags and inside home bins. Through the separate collection system, the kitchen waste is finally treated in an AD-plant. The baseline system reflects the current situation in Opole for the share of the kitchen waste that is not yet separately collected: it is commingled with the residual waste and treated in an MBP-plant. In both scenarios, the processes on the right hand constitute primary processes that are substituted by the products of the waste treatment processes.
2.2. Life Cycle Inventory
2.2.1. Baseline Scenario
Comparing the separate collection results of biowaste in the area where no biowaste separate collection kits were distributed, in the period 6 weeks after the distribution the amounts were 13% lower in the low-rise area and 15% lower in the middle rise area. For the high-rise area no data were available. As a conservative estimation, no decrease was assumed.
The kitchen waste is treated in the mechanical-biological pretreatment plant in Opole. The major share of residues consists of low caloric fraction, which is landfilled. A smaller share ends up in the high caloric (coarse) fraction, substituting hard coal combustion in a cement kiln.
2.2.2. Scenario: Improved Separate Collection and Treatment of Kitchen Waste in Opole
In Opole biowaste separation kits consisting of an inside home bin and a roll of 10 biodegradable bags were distributed among 618 households (262 high-rise, 234 medium-rise and 122 low-rise premises). Another 167 households refused to accept the kits or could not be reached. Prior to and after the implementation of the biodegradable bags the amounts of biowaste as well as residual waste were monitored. In addition, the composition of these waste flows was analyzed. With an estimated one bag per week, the number of bags for the six week period adds up to 3708. With an estimated lifetime of inside home bins of 10 years, the number of used up bins allocated to the use period of 6 weeks adds up to 7.1.
When comparing the collected amounts during 6 weeks before and 6 weeks after distribution of the biowaste separate collection kit, for the low-rise buildings an increase of biowaste of 139% was observed. For the medium-rise buildings this was 65%, whereas for the high-rise buildings it was significantly lower at 5%. In the Table 1 below the collection results of both the reference and the pilot group are shown.
Considering both the decline in the reference group and the increase in the pilot group, the total amount of biowaste collected additionally amounts to 152% in the low-rise, 80% in the middle-rise, and 5% in the high-rise area. With a distribution in Opole of 20% low-rise, 20% middle-rise, and 60% high-rise buildings (based on the number of collection routes) respectively, the citywide potential of kitchen waste that could be separated additionally is estimated at 49% of the currently collected amount of biowaste.
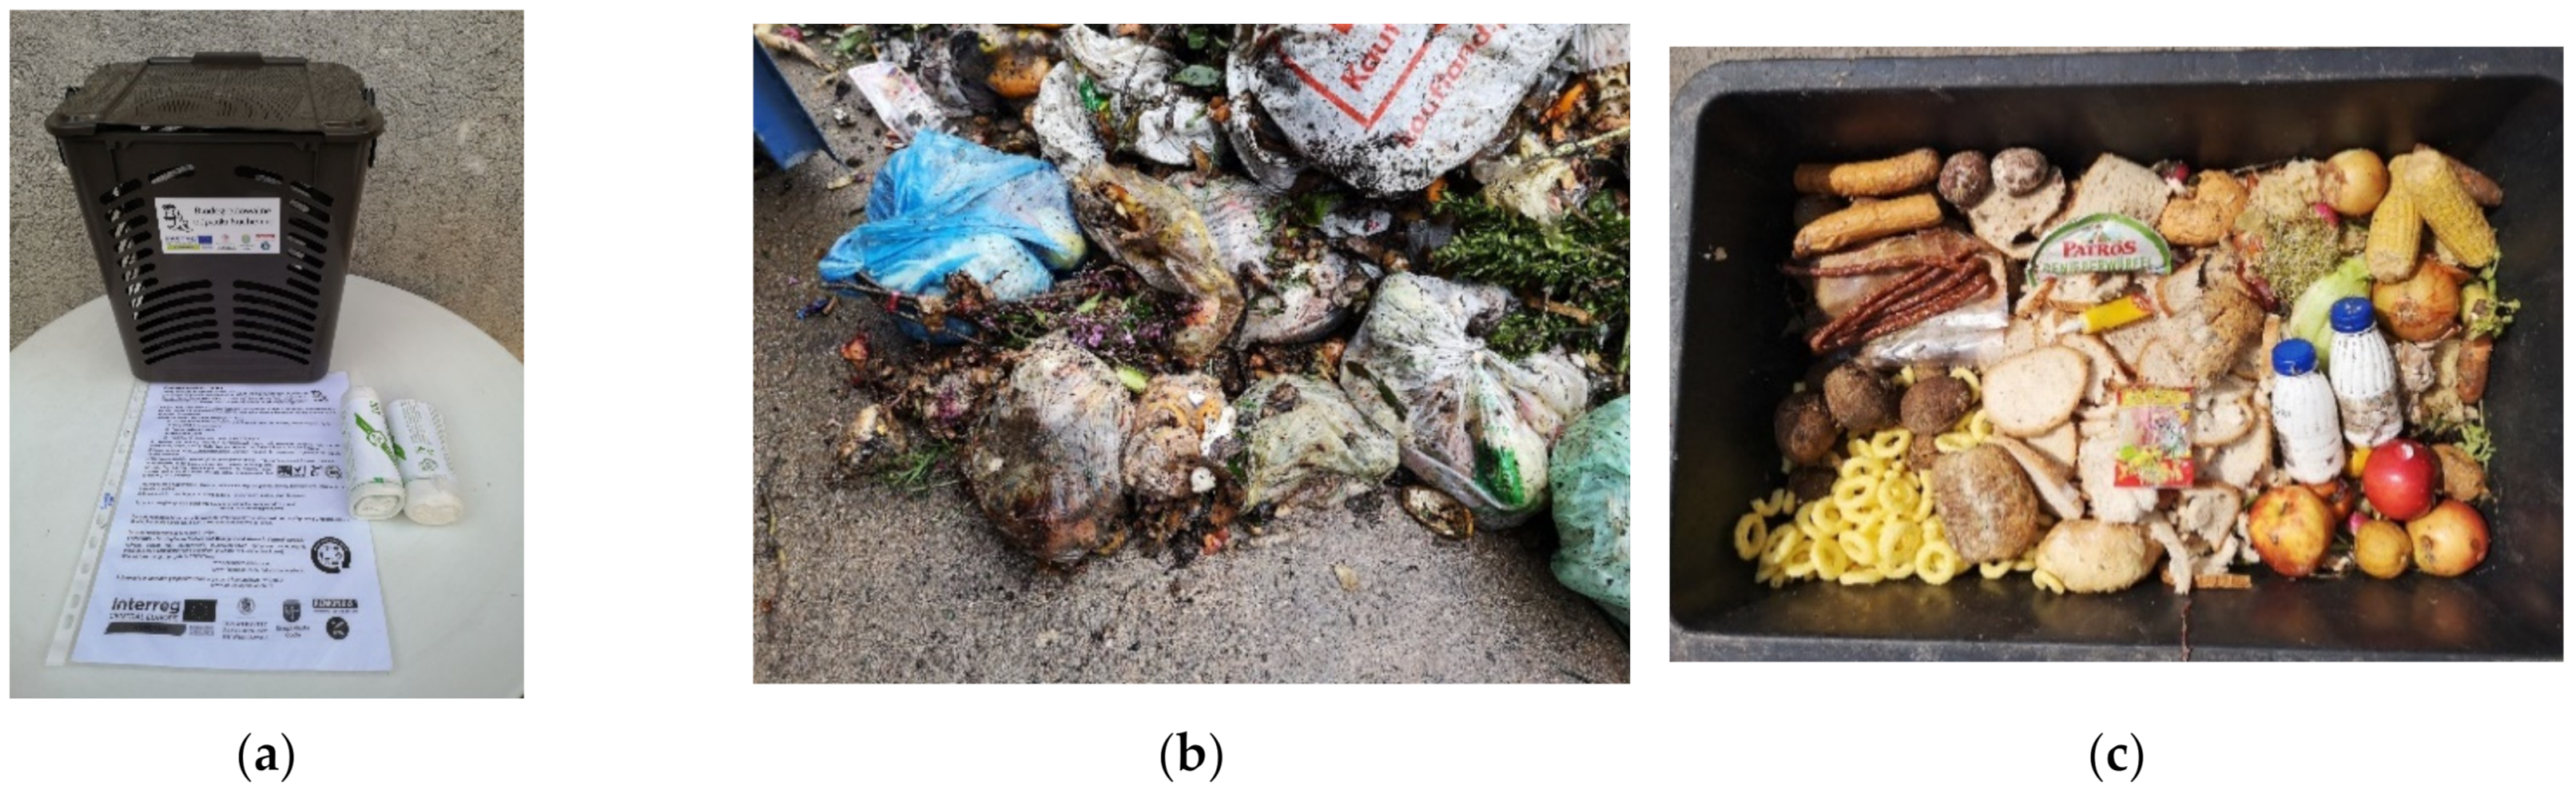
In absolute numbers the additionally collected biowaste amounts to 5.7 ton in the low-rise, 4.1 ton in the middle-rise, and 0.1 ton in the high-rise area. In the entire pilot area this adds up to 10.8 ton over the considered six weeks period. This is equivalent to respectively 113, 82, and 1.6 kg/inh·year for the considered areas (including those inhabitants that did not receive the starting kit, without seasonal influences). Considering the residential distribution in Opole of 20:20:60, this amounts to 40 kg/inh·year for the average citizen. In the Figure 2 below the distributed biowaste collection sets (inside home bin, 10 bags and info materials), the used biodegradable bags within the biowaste flow as well as the share of avoidable kitchen waste is shown. The shares of avoidable and non-avoidable kitchen waste were determined in both the residual waste and biowaste flow by means of sorting analyses.
2.2.3. Production and Treatment Operations
For food waste as low-polluted, moist and structurally poor biogenic waste fermentation is a better process option than incineration or composting. Therefore, an anaerobic digestion treatment was used for this scenario in the assessment. This also correlates with the plans of the city of Opole, where the construction of such a plant is considered.
The technology of continuous dry fermentation was selected for food and kitchen waste as the most suitable process for modelling. Dry matter contents of 30% for biowaste are well suited for e.g., plug flow fermentation. In this study the technologies are not further discussed, details can be found in the literature (e.g., [19]). The produced biogas is combusted producing electricity and heat. The net energy production is substituting the Polish electricity mix and hard coal heating respectively. The digestion residues are composted, producing compost. The biogas potential of the input materials in this study is estimated based on literature values. For biowaste, average values of 80–130 m3 biogas/t FM are obtained in the literature [19]. For the considered food and kitchen waste, a higher biogas potential is to be expected. Based on the interpretation of Faulstich and Prechtl and Lampert et al., a biogas potential of up to 580 m3/t oDM can be expected [20,21]. Lab tests of the considered material showed a potential of 541 m3/t oDM, which value was applied in the modeling of the scenario.
Problems arise when digestate is directly land spread, as pollutants concentrate in it and both pollutants and nutrients are present in water-soluble form. By composting low-pollutant digestate, the nutrients can be incorporated into stable organic compounds (humus). This means that they no longer might constitute a risk to groundwater, but still are available to plants. In this scenario, it is assumed that the digestion residue produced during the fermentation is subsequently fed into a fermentation residue composting process and compost is produced. The compost is applied to agricultural land and fertilizer credits are assumed for the substitution of mineral fertilizer by macronutrients contained in compost [22].
Assuming that the plants considered in this study are equipped with a closed digestate store and are operated according to the state-of-the-art, fugitive biogas emissions amounting to 2% of the total production for wet and dry fermentation are considered. In addition to these diffuse biogas emissions, further emissions must be taken into account during the combustion or energy conversion of the biogas. A direct apportionment of the raw biogas components to the emissions from biogas utilization is not possible, as the biogas is subjected to e.g., desulphurization or dehydration beforehand. The process-specific emissions from combustion, such as carbon monoxide and nitrogen oxides, in turn depend almost exclusively on the process control. The sulfur dioxide emissions, in turn, are related to the hydrogen sulfide load after desulphurization. This is assumed to be 100 ppm for this study, whereby the energy consumption of desulphurization is included in the total energy consumption of the plant. The methane slip from the combined heat and power plant (CHP) is assumed to be 1% of the methane input according to [21]. Emission factors for carbon monoxide, nitrous oxide and nitrogen oxides are modelled according to [23].
The actual purpose of fermentation plants results from the energetic use of the biogas produced. In this study, it is assumed that the remaining biogas or its methane content is converted into thermal and electrical energy in a CHP unit. An electrical efficiency of 35% and a thermal efficiency of 45% according to Lampert et al. are assumed for the CHP [21]. After deducting the own energy consumption, the potential usable energy output from the biogas plant results, which is used as heat or fed into the electricity grid.
The collection and transport of the kitchen waste is identical for both scenarios and is therefore not considered in the assessment. Both the residual and biowaste collection system are in place in Opole, collection areas and treatment locations are identical. A diversion of kitchen waste from one to the other system would have a limited influence only at route lengths. However, the increase in one route would be outbalanced by the decrease in the other. Moreover, in practice no changes are to be expected. In this study, the exclusive use of compost in agriculture or landscaping is assumed. For this application, an average transport distance of 15 km is assumed. This includes transport by lorry as well as spreading with e.g., tractors.
In order to ensure optimal utilization, structural material must be added to the composting process. This is covered on the one hand by the material resulting from the final screening and on the other hand by material from the nearby garden waste composting plant. The structural material is considered to be free of environmental burden, as it is a waste material. The main inventory data are summarized in Table 2.
In the baseline scenario, the behavior of kitchen waste in mechanical-biological pretreatment was modelled according to the aerobic MBP module in the LCA-IWM model [24]. In this model the behavior of each waste fraction within the residual waste is determined separately. The treatment of kitchen waste (together with the other waste fractions) by presorting, windsorting, metals separation, and screening (80 mm screen) leads to a coarse (5%) and a fine fraction (95%). The coarse fraction (over 80 mm) ends up in the RDF flow, for energetic use in cement kilns. Thus, a total of 10.8 kg hard coal is substituted per 1000 kg of kitchen waste input. The fine fraction, after biological pretreatment consisting of an aerobic intensive rotting phase and a post-rotting phase, is reduced to 254 kg/t input material and enters the landfill. As this is a stabilized waste landfill, no landfill gas is utilized. A total of 25 kWh electricity, 30 MJ heat, and 0.5 L diesel per ton of landfill input are consumed, combined for all landfill processes (compaction, heating, gas treatment, leachate treatment).
In the pilot scenario, the production of biodegradable bags was modelled based on the production of standard plastic films [22], with a share of 46% of polyactic acid biopolymer and 54% of ecoflex® F Blend C1200 as found in BASFs ecovio® FS2312. Table 3 provides details on modelling of the production of the biodegradable bags used in the pilot scenario.
The production process of ecoflex® F Blend C1200 needed for the production of ecovio biodegradable bags was adapted from ethylene vinyl acetate copolymer production with as monomers a molar 1:1:1 share of adipic acid, butane diol, and terephtalic acid. In the Table 4 below amounts of materials and energy needed are provided.
The application of the produced compost after the digestion of the diverted kitchen waste from the residual waste flow to the biowaste flow was modelled according to the model for anaerobic digestion by Obersteiner and Pertl [26]. The main air emissions caused by the application of compost are caused by the decomposition of contained nitrogen and comprise of 0.15 g ammonia, 0.26 g nitrogen monoxide, and 0.38 g nitrous oxide per kg of applied compost. The application of compost produces a variety of positive effects for the soil and thus also has an influence on agricultural yield. Knappe et al. summarizes different compost application possibilities (agriculture, hobby horticulture, commercial horticulture, earthworks, …) [27]. Depending on the application purpose, the substituted processes also change and thus have an influence on the credited environmental impacts. In this study, no precise inventory analysis of the application of compost in the area of influence could be made. Therefore, it is conservatively assumed that 100% of the finished compost produced is applied to agricultural land, where it is used for humus reproduction. Thus, the material cycle is closed, according to the principles of the Circular Economy [28]. The application of compost replaces other fertilizers. Table 5 provides details on the substituted materials.
The substitution of fertilizers is based on a 1-to-1 replacement of N, P, and K. The carbon contained in the compost is considered to be 52% humus-C. In Knappe et al., the imputation of humus reproduction is carried out via the equivalence processes 50% intercropping and 50% straw use [27]. This means that for agricultural land use without compost use, intercropping would be necessary to balance the humus balance in the soil, i.e., to prevent soil depletion. The use of straw is made possible by the fact that the application of compost allows the straw to be removed, which would otherwise have to remain in the field to keep the humus balance, i.e., the humus C content in the soil. The division of benefits into these two possible forms of humus reproduction (intercropping and straw use) was chosen in the literature to correspond to a balance of use and to compensate for any uncertainties.
In order to implement these assumptions, the humus reproduction capacity of intercropping and straw must be calculated and compared to that of the composts available. Knappe et al. give a humus reproduction capacity of 110 kg humus-C/t dry matter intercrop and 100 kg humus-C/t straw [27]. The humus reproduction capacity of finished composts is just above 50% of the organic carbon [29] and is assumed to be 52% in this study. In Knappe et al. it is assumed that the available straw is used as bedding for horse husbandry, thus saving wood chips from primary production [27]. In straw however, the share of humus-C is assumed to amount 10% of the dry matter. Apart from that, a replacement factor of two is applied.
In addition to intercropping and the available straw, other equivalence processes are applied. Namely, it is assumed that the plant nutrients nitrogen, phosphorus, potassium as well as magnesium and calcium contained in compost would otherwise have to be applied through classic mineral fertilizers. Based on Knappe et al., it is assumed that all nitrogen minus nitrogen losses during application are to be considered fertilizer-effective when used for humus reproduction [27]. For potassium, phosphorus, and calcium, 100% plant availability is assumed, whereas only 10% is assumed for magnesium. Furthermore, for the mineral fertilizer substitution it is assumed that 15% of the nitrogen used is emitted as ammonia [27]. No allocation was applied in the modelled scenarios.
2.3. Life Cycle Impact Assessment
The presented LCA was performed following the ISO 14040:2006 and 14044:2006 methodology using the references of the International Life Cycle Data (ILCD) system method [30,31,32,33]. The impact assessment categories and other metrics considered to be of high relevance to the goal of the assessment were chosen according to ILCD 2010 and IPCC AR5 impact assessment methods [32,34]. The choice of Impact Categories follows the Strefowa project, in which a total of 16 Pilot Actions on food waste prevention and management were performed and analyzed.
Global warming potential was chosen because of its relevance to climate change and high public and institutional interest, deemed to be one of the most pressing environmental issues of our time. Eutrophication and acidification were chosen because they are closely connected to air, soil, and water quality and capture the environmental burdens associated with commonly regulated emissions such as NOx, SO2, and others. Ozone depletion potential was chosen because of its high political relevance, which eventually led to the worldwide ban of more active ozone-depleting substances; the phase-out of less active substances is due to be completed by 2030. Contrary to the Pilot Actions on food waste prevention and re-use, the Pilot Actions considered in this article on food waste management do not take into consideration the production phase of the food. Thus the impact categories typical for agricultural activities that were considered in other parts of the Strefowa project, Land Use and Fresh Water Footprint, were not considered here. In Table 6 the impact assessment methodologies are shown.
No normalization or weighting of the results was undertaken. The GaBi software professional 9.2 (Spheratm, Leinfelden-Echterdingen, Germany) tool was used to perform the LCA analysis [22].
3. Results and Discussion
In the considered case study, the improvement of the kitchen waste management in the city of Opole is studied. Instead of collection and treatment together with the residual waste in an installation for mechanical-biological pretreatment, the kitchen waste is collected separately within the biowaste flow and treated in an anaerobic digestion plant. In the following, the potential effects of treatment in both cases are shown for the considered impact categories: global warming potential (GWP), marine eutrophication potential (MEP), acidification potential (AP), and ozone depletion potential (ODP).
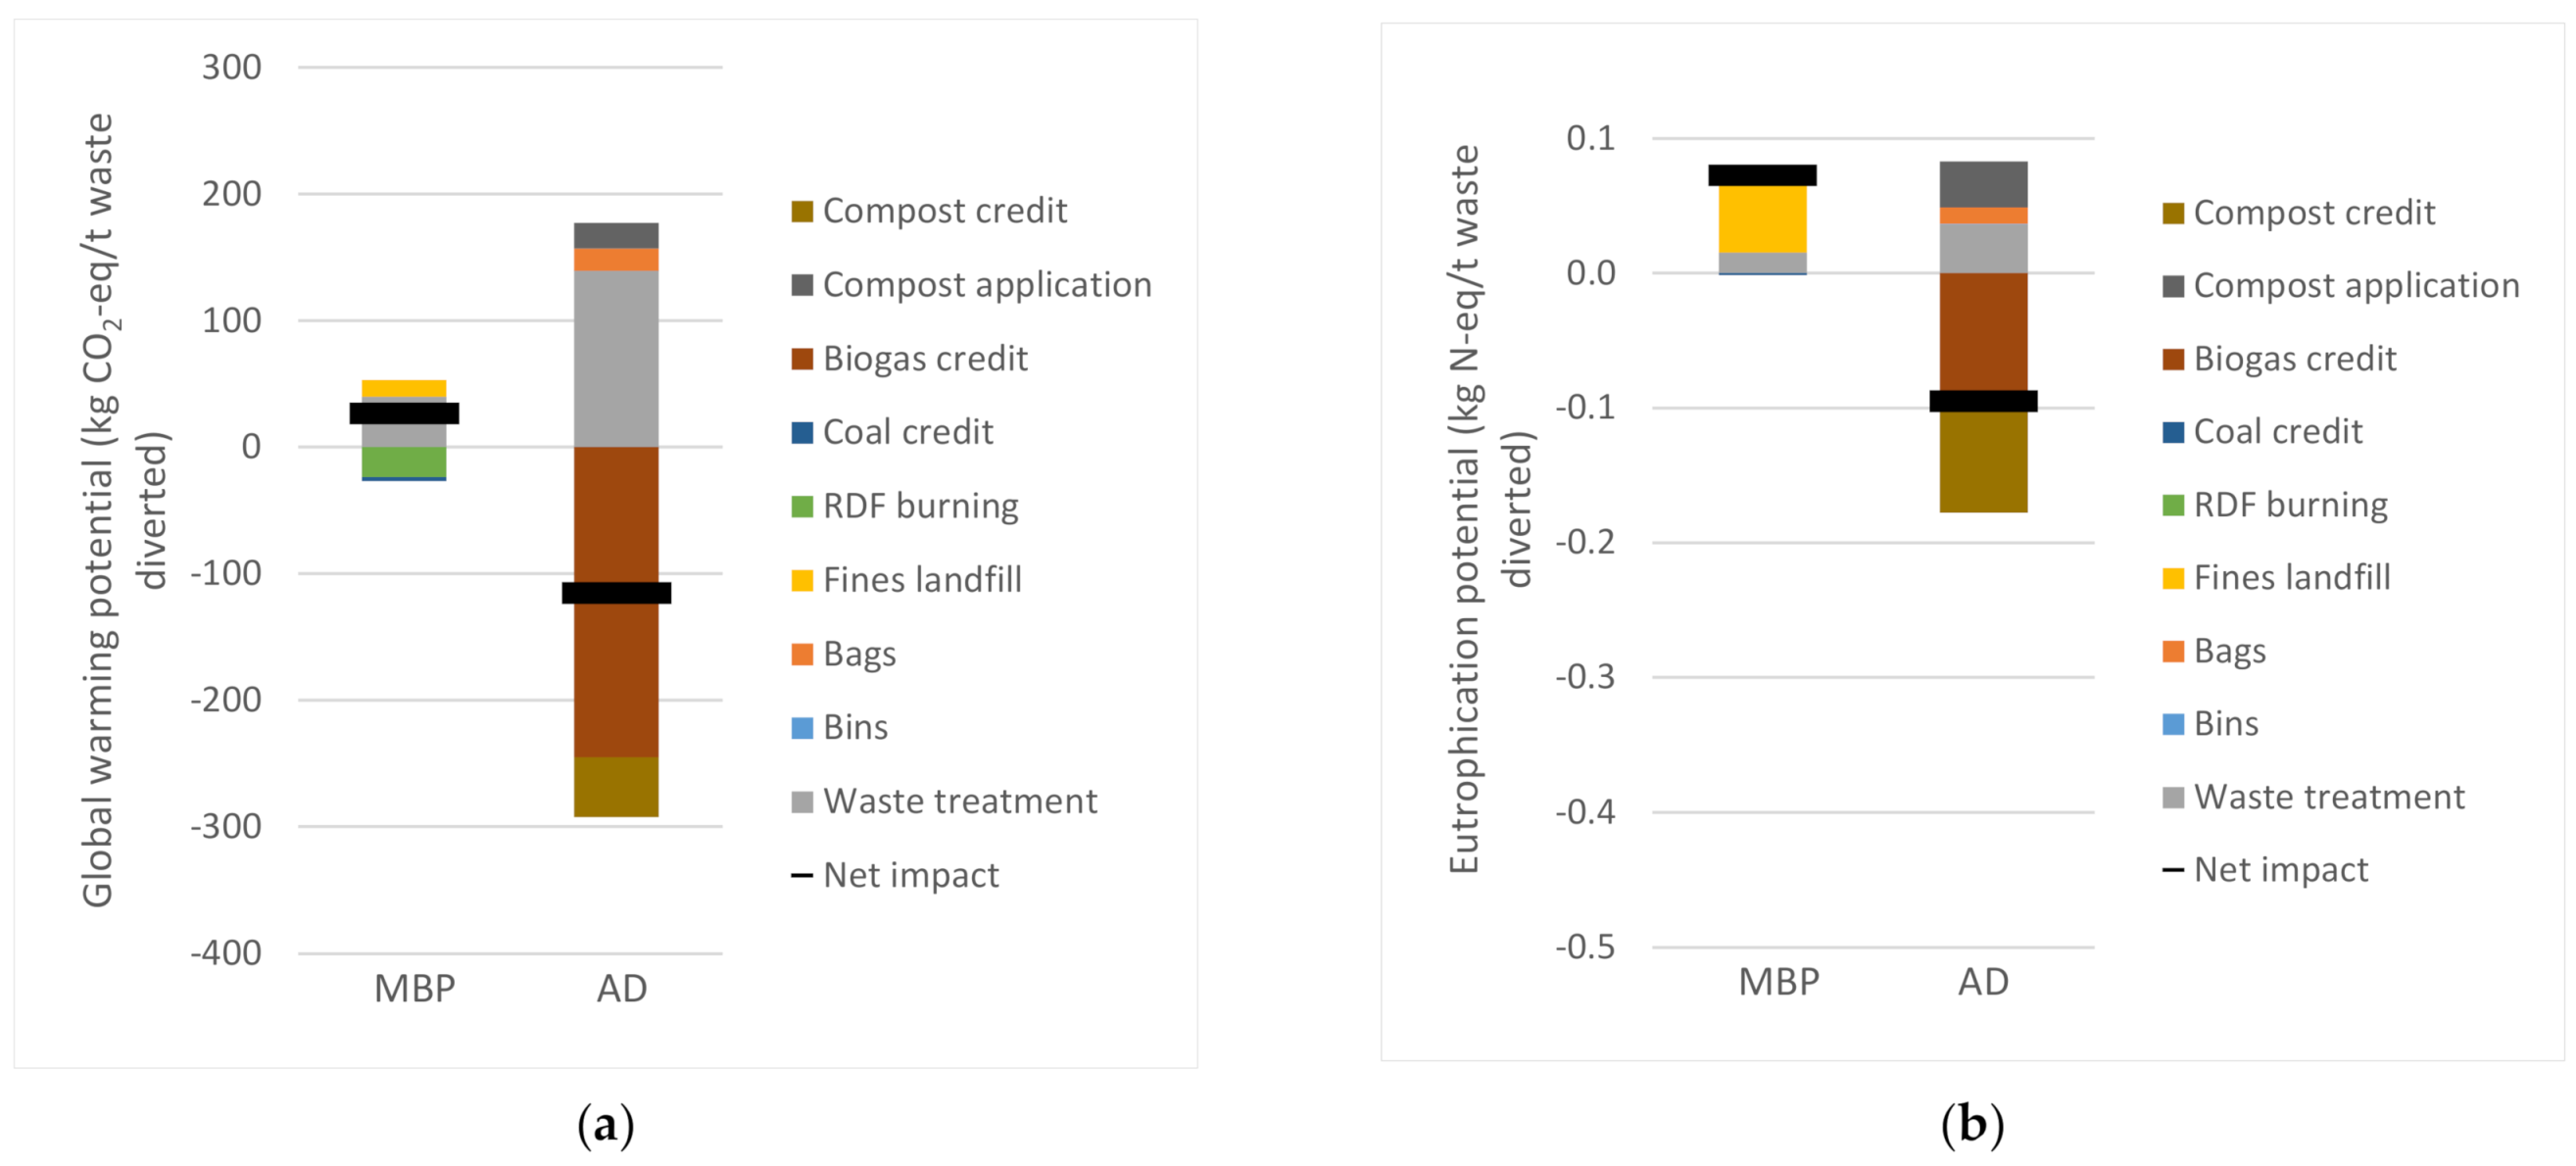
3.1. Global Warming Potential
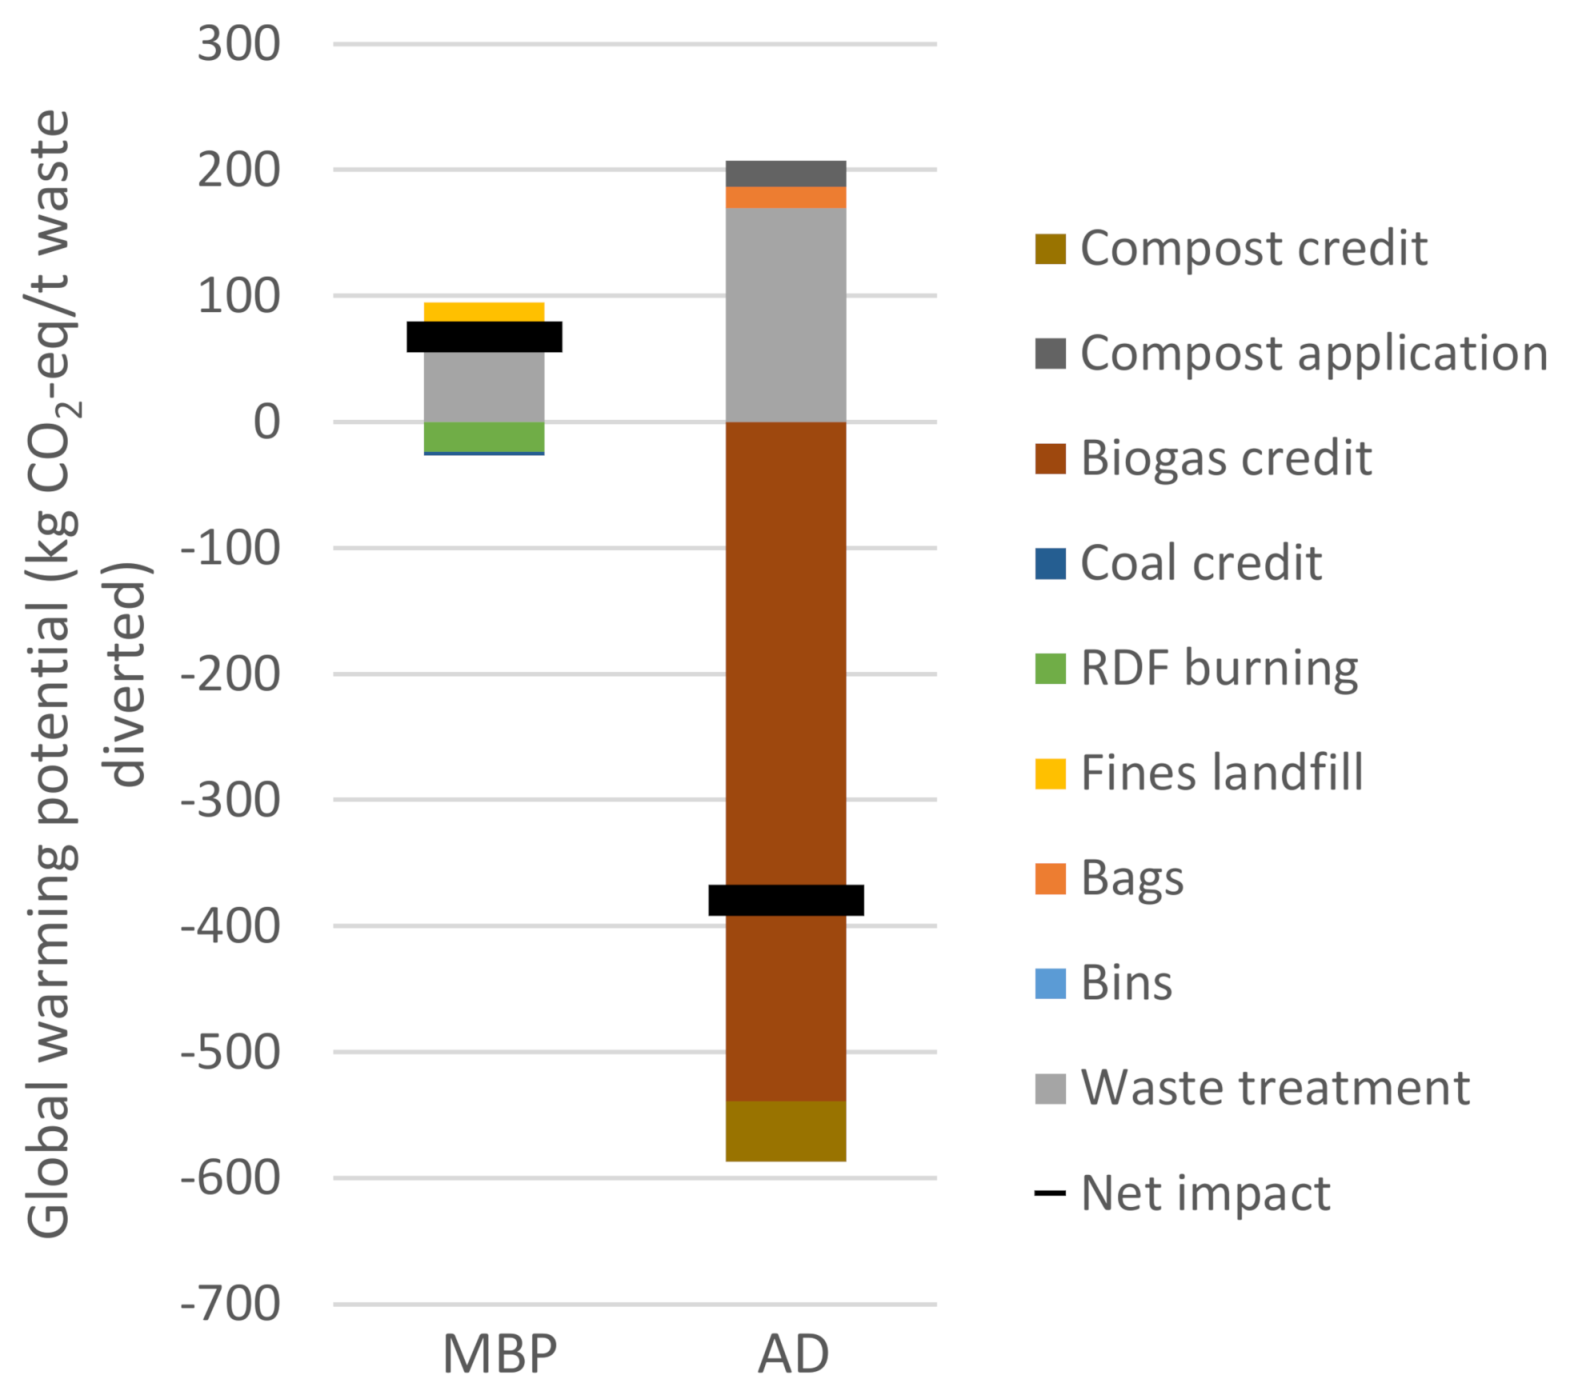
In the Figure 3 below the potential global warming effects of treatment in both cases are shown.
The overall GHG emissions for the baseline (MBP) scenario was 68 kg CO2-eq/t (whereas the scenario of improved separate collection and treatment of kitchen waste (AD) was causing an overall amount of GHG emissions of −380 kg CO2-eq/t. Thus the improved AD scenario causes an overall decline in global warming impact of 448 kg CO2-eq/t of waste diverted.
The impacts in the waste treatment processes themselves are approx. twice higher for the MBP plant than for AD. Emissions from the production of the necessary power and diesel combustion are the main causes in the MBP, whereas in the AD the digestion process itself is considered a net energy producer. The electricity and diesel need of the post-rotting process however contribute to the GWP impact, as does the methane emissions during the digestion process. In the baseline scenario the landfilling of the stabilized fine fraction uses electricity, heat, and diesel. The energy production and diesel combustion have a minor impact on the overall scenario. A small part of the kitchen waste ends up in the coarse fraction for RDF burning in a cement kiln. The difference in emissions between RDF and hard coal combustion cause a negative GWP impact, based on the renewable character of the kitchen waste (biogenic carbon).
In the scenario of improved separate collection and treatment of kitchen waste, the production of bins has no significant impact on the overall scenario. The bags production accounts for 17 kg CO2-eq/t of waste diverted, the main contributors being polylactide (PLA) biopolymer and adipic acid production (in both cases predominantly CO2 emissions). Another environmental burden in terms of GWP is caused by the emission of mostly nitrous oxide during the application of compost on the field (20 kg CO2-eq/t of waste diverted). The most environmental benign process however is the substitution processes of the energy produced by biogas combustion (−540 kg CO2-eq/t). As the Polish energy mixes for both electricity and heat are predominantly coal based, the substitution thereof causes a high level of avoided emissions. Also the application of compost to agricultural fields enables savings of fertilizers (N, P, and K substitution) and supply of organic carbon to the soil (in total 20 kg CO2-eq/t of waste diverted).
3.2. Marine Eutrophication Potential
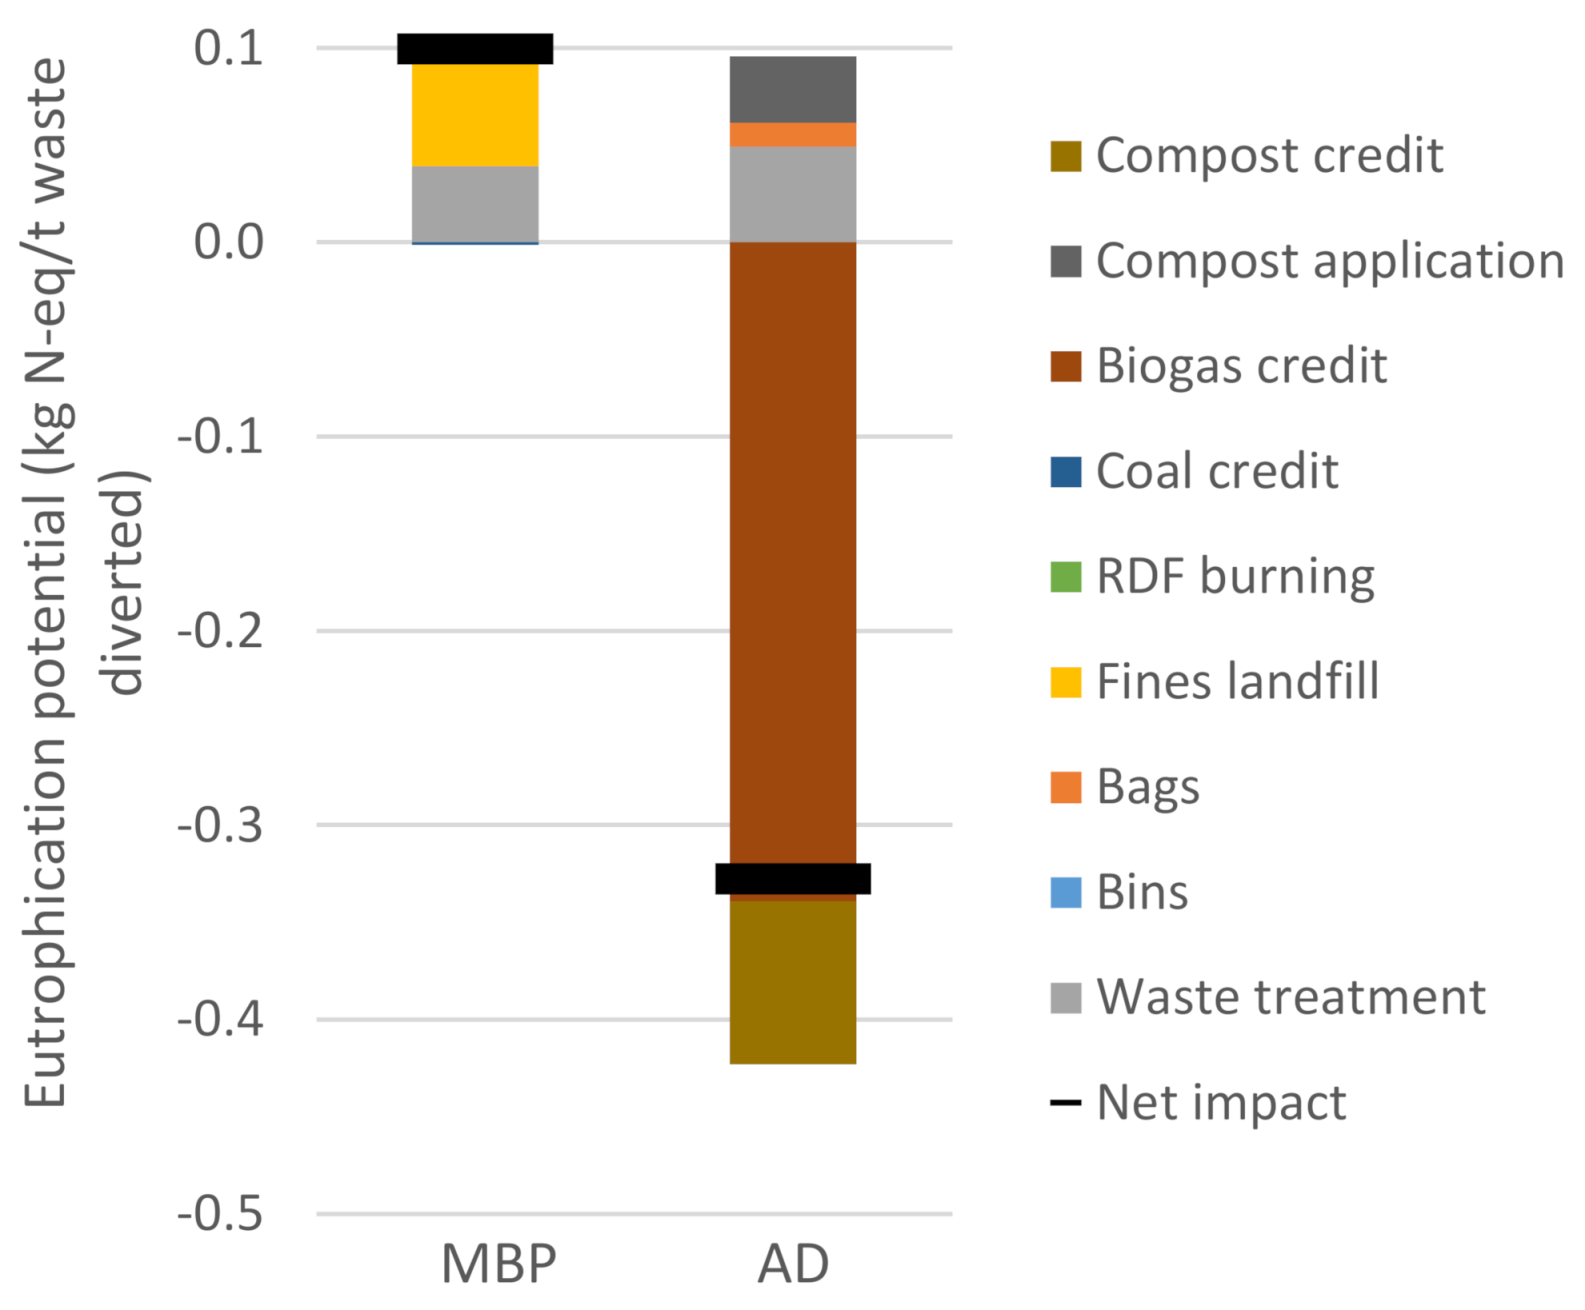
In the Figure 4 below the marine eutrophication potential for both the baseline and the scenario of improved separate collection and treatment of kitchen waste is shown.
Also the marine eutrophication potential is clearly lower for the diversion of kitchen waste to AD (total impact: −0.33 kg N-eq/t waste diverted) in comparison to the baseline of MBP (0.10 kg N-eq/t). Thus, the total environmental relieve of increasing separate collection and treatment of kitchen waste in AD totals to 0.44 kg N-eq/t waste diverted.
For both scenarios, the waste treatment operation itself constitutes an environmental burden: 0.039 for MBP and, larger for AD: 0.049 kg N-eq/t waste diverted. In the MBP plant emissions of nitrogen and ammonia to water are the main contributors, whereas in the AD plant nitrogen oxide emissions in both the fermentation step and the compost application. The main contributor however in the baseline scenario is the landfill of the stabilized fine fraction: 0.062 N-eq/t waste diverted. The main contributing emissions are nitrogen and ammonia emissions through landfill leachate and to a significantly lesser extend NOx emissions from the generation of electricity needed in the landfill operation.
In the AD scenario, the production of biodegradable bags constitutes a minor burden to the environment when it comes to marine eutrophication potential. The application of compost to soil (0.034 kg N-eq/t waste diverted) is more relevant, mainly caused by nitrogen monoxide and to a lesser extend ammonia emissions caused by compost degradation processes. The heat (−0.13 kg N-eq/t waste diverted) and especially electricity (−0.20 kg N-eq/t waste diverted) produced by biogas combustion causes a significant environmental relief. In both cases, NOx emissions from combustion processes are the main contributors. Also the substitution of fertilizers by compost is benign to the environment (−0.084 kg N-eq/t waste diverted). Avoided ammonia emissions by substituted ammonia fertilizer as well as avoided NOx emissions for timber spruce production mainly contribute here.
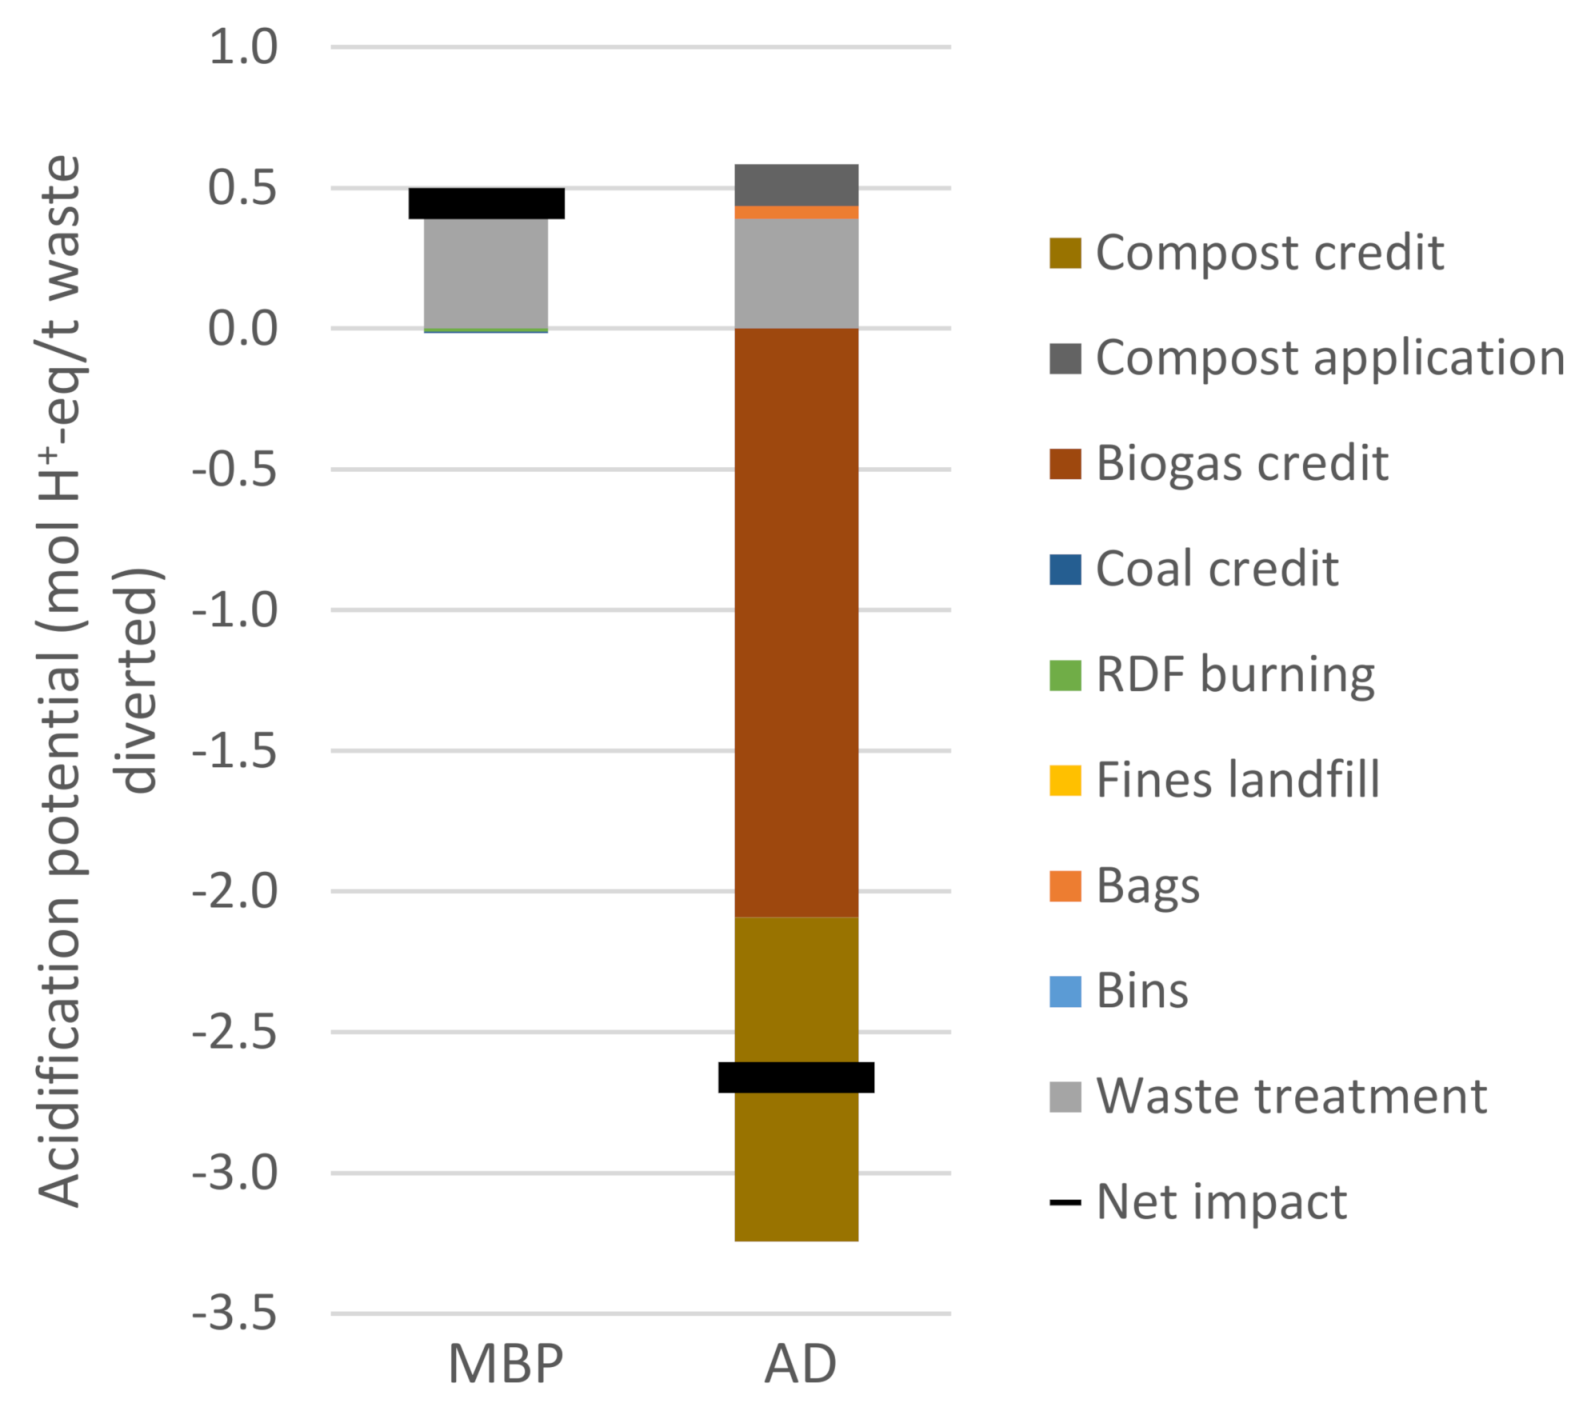
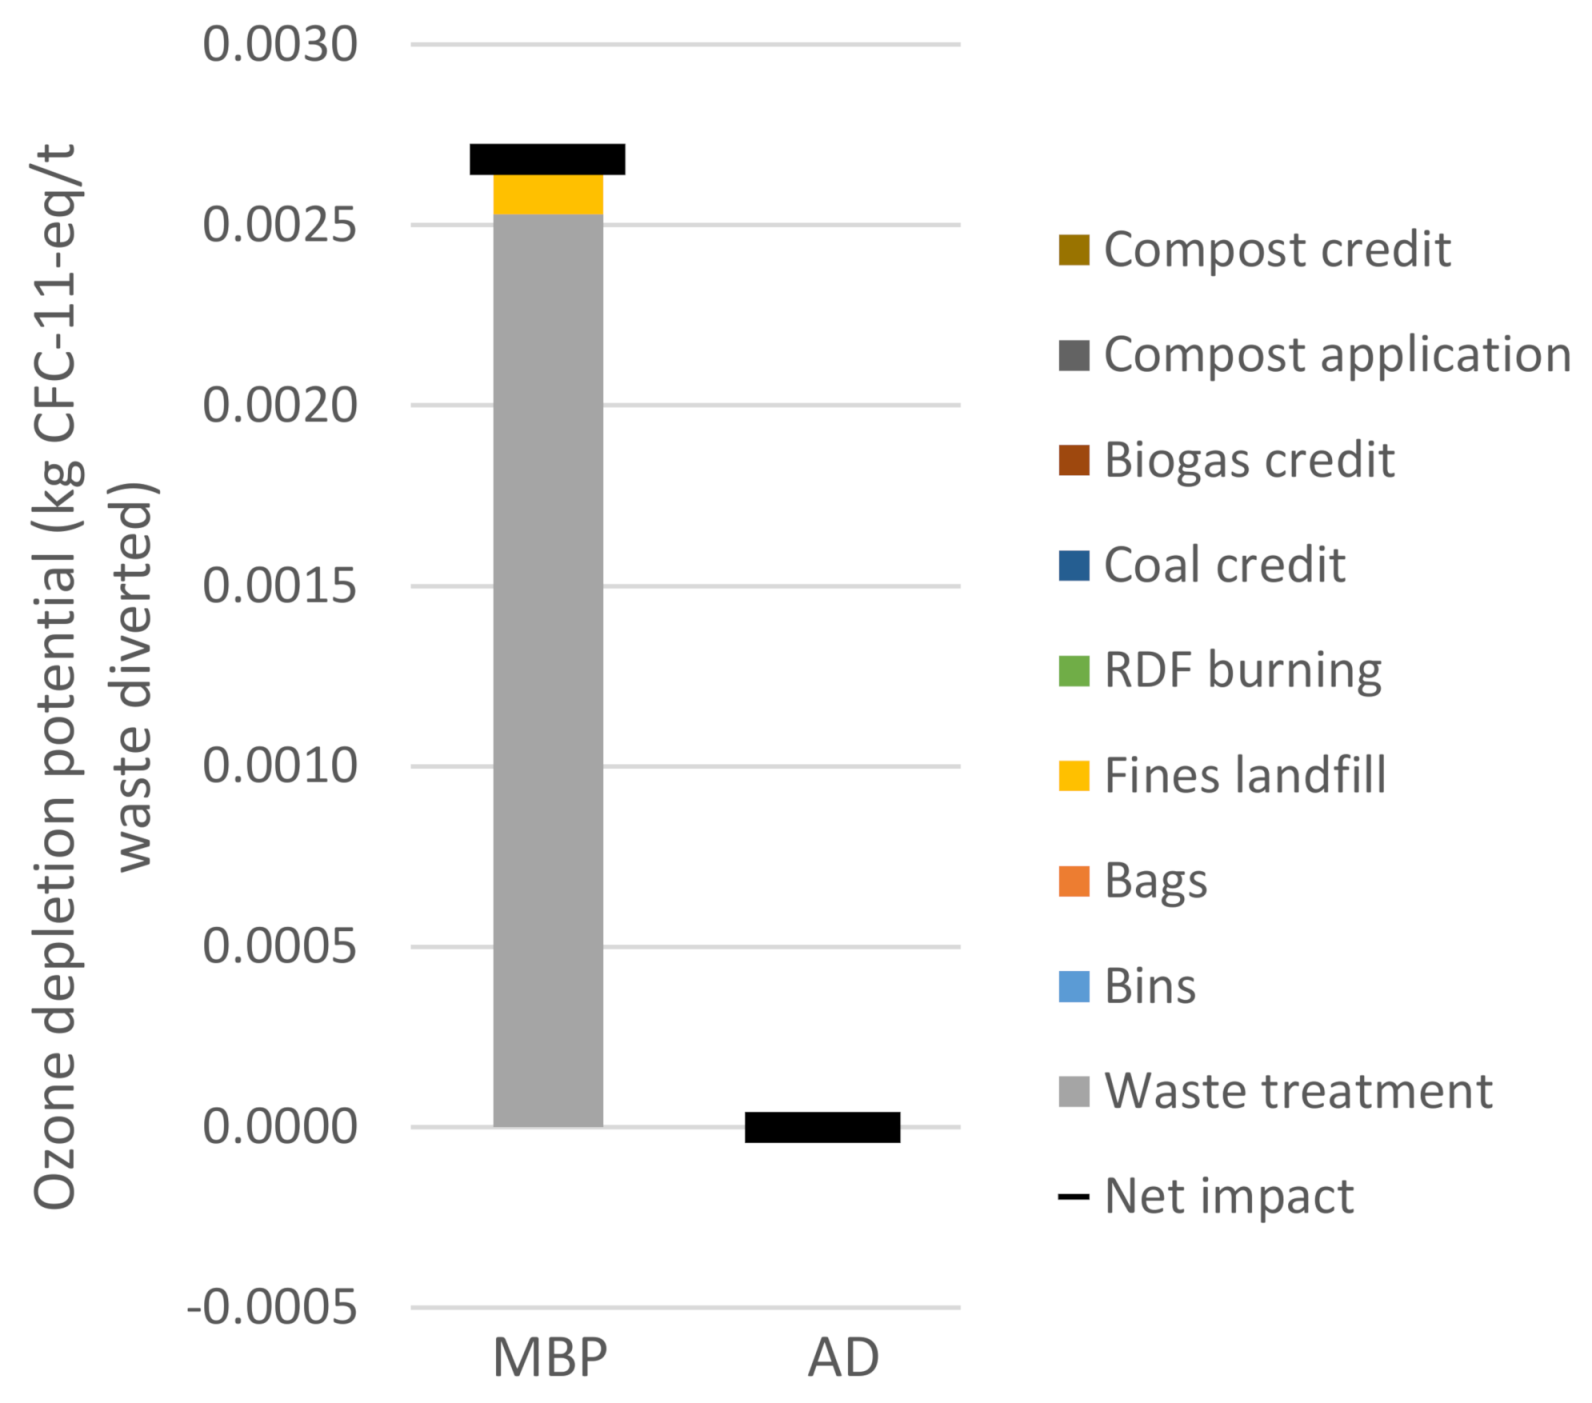
3.3. Acidification Potential
In the Figure 5 below the potential acidification for both considered scenarios is shown.
The baseline scenario (MBP) shows an overall acidification potential of 0.45 mol H+-eq/t waste diverted. The scenario of improved separate collection and treatment of kitchen waste (AD) however causes an overall relief of the environment (−2.7 mol H+-eq/t waste diverted). Hence, a total environmental gain in acidification potential of −3.15 mol H+-eq/t waste diverted was achieved.
In both cases the waste treatment operations show a similar environmental effect (0.43 mol H+-eq/t waste diverted for MBP, 0.39 mol H+-eq/t waste diverted for AD). The main contributors in the MBP operation are ammonia emissions in the biological stabilization process and SO2 emissions and to a lesser extend NOx emissions in the production of the needed electricity in that process (mainly caused by coal combustion, as it is the Polish electricity mix). For the AD operation, this is mainly caused by the same emissions in the post-rotting step.
The scenario of improved separate collection and treatment of kitchen waste shows a slight burden from the production of biodegradable bags. The application of compost to agricultural soil causes emissions of nitrogen monoxide and ammonia, which have an acidification potential effect. The biogas credit, by substitution of electricity and heat from the Polish mix, shows an environmental relief of −2.1 mol H+-eq/t waste diverted, with the main contributors being emission of SO2 and NOx. The compost credit shows a smaller environmental relief of −1.2 mol H+-eq/t waste diverted, mainly caused by ammonia emissions during the application of substituted ammonia fertilizer.
3.4. Ozone Depletion Potential
Figure 6 shows the ozone depletion potential for both the MBP (baseline) and the AD scenario.
In the baseline scenario, the ODP environmental impacts are dominated by the emissions of the MBP process (2.5 × 10⁻³ kg CFC-11-eq/t waste diverted). The main contributing emissions are dichlorofluoromethane and trichlorofluoromethane in the biological stabilization step. The landfill of the stabilized fine fraction shows minor impacts caused by dichlorofluoromethane emissions as well. The baseline scenario has a total potential environmental burden in the category ozone depletion of 2.7 × 10⁻³ kg CFC-11-eq/t waste diverted. The impacts in the scenario of improved separate collection and treatment of kitchen waste (AD) are very limited, −1.2 × 10⁻⁸ kg CFC-11-eq/t waste diverted, so that the total environmental gain in ODP constitutes 2.7 × 10⁻³ kg CFC-11-eq/t waste diverted.
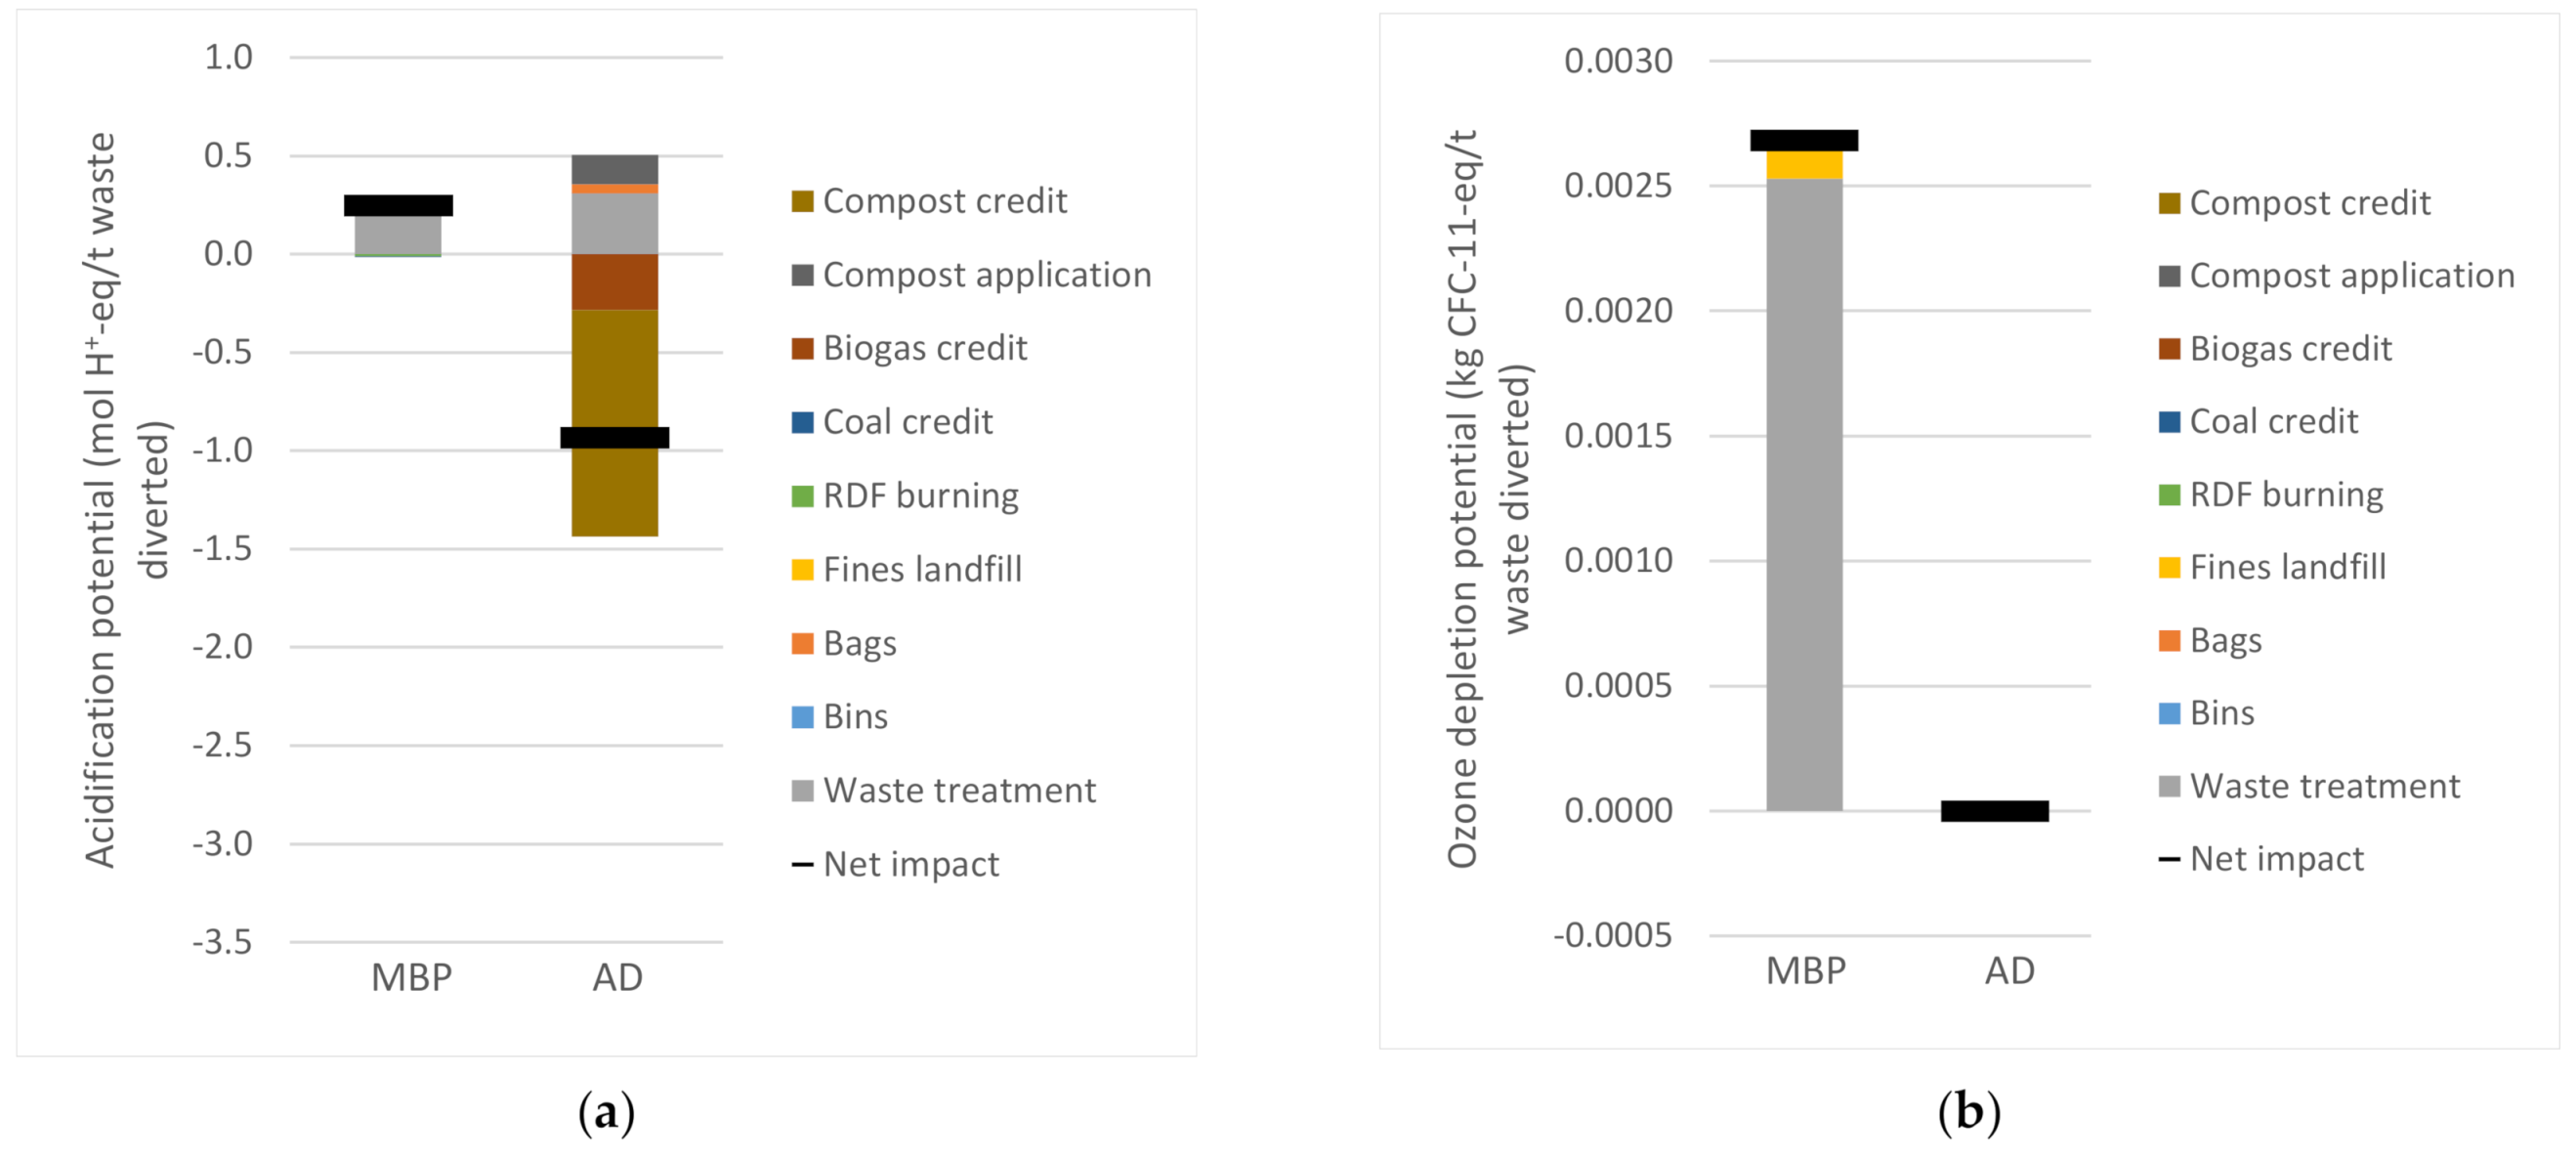
3.5. Sensitivity
The optimization of the waste management system by diversion of kitchen waste from mechanical-biological pretreatment to anaerobic digestion shows an environmental gain in all considered impact categories. In other studies, comparing the treatment of biowaste in AD instead of MBP an environmental relief is achieved as well. In Knappe et al. the global warming potential is estimated at +73 kg CO2-eq/t of waste for MBP and −185 kg CO2-eq/t of waste for AD, leading to an environmental gain of 258 kg CO2-eq/t of waste diverted [27]. This is substantially less than the 448 kg CO2-eq/t of waste diverted in the current study (+68 kg CO2-eq/t of waste for MBP and −380 kg CO2-eq/t of waste for AD). The reasons for the differences in the outcomes are slightly varying types of waste (biowaste vs. kitchen waste) and consequently varying biogas potentials, presence of biodegradable bags and kitchen bins in the current study and most importantly, differences in power and heat production (both for the consumption in the waste treatment operations and in the credits for the replacement by the energy produced in the treatment operations). In the current study the Polish electricity mix and heat from hard coal were considered. Below, as a sensitivity, the results from the modelled scenarios are shown with an Austrian electricity mix and heat from natural gas. Austria has a considerably cleaner electricity mix and was also the leading country in which the Strefowa project was applied.
In comparison to the application of the Polish electricity mix and heat from hard coal, the use of the Austrian electricity mix and heat from natural gas leads to substantially lower environmental gains (compare Figure 3, Figure 4, Figure 5 and Figure 6 to Figure 7 and Figure 8). For the global warming potential the potential environmental gain of the optimization of the waste management system by diversion of kitchen waste from mechanical-biological pretreatment to anaerobic digestion amounts to 142 CO2-eq/t of waste diverted. This is lower than in the original scenarios in this study (448 kg CO2-eq/t of waste diverted), but also lower than in Knappe et al. (258 kg CO2-eq/t of waste diverted) [26]. In the latter, however, the German situation was reflected, having a less clean electricity mix than Austria.
4. Conclusions
The optimization of the collection and treatment of kitchen food waste has a positive effect on the environment. In the baseline scenario, in which kitchen waste is collected within the residual waste and treated in an aerobic mechanical-biological pretreatment plant, the environment is burdened. However, if the kitchen waste is collected separately within the biowaste flow, with help of an in-house bin and biodegradable bags, and consequently treated in an anaerobic digestion plant, the environment is relieved. This pattern was demonstrated in all considered impact categories, global warming potential, marine eutrophication potential, acidification potential, and ozone depletion potential. Therefore, the result of the assessment can be considered as robust. The environmental effects of the collection of the kitchen waste were not part of the assessment, as they are considered to be similar in both scenarios. Optimization of the waste management system by diversion of kitchen waste from mechanical-biological pretreatment to anaerobic digestion can lead to considerable saving of 448 kg CO2-eq/t of waste diverted.
The estimated optimization potential for the demonstration site, the city of Opole, amounts to 40 kg/inh·year for the average citizen. As Opole has, compared to the Polish background, a rather well developed waste management system with over-average separate collection results for biowaste, this amount can be taken as a conservative optimization potential for the whole of Poland. Thus, with a population of 38 million a total national optimization potential of over 1.5 million t of kitchen waste diversion could be achieved in Poland. This would lead to a saving of 680,000 t CO2-eq savings per year.
In the above assessment, the energy (electricity, heat) both consumed and produced in the considered scenarios is accounted for as being produced by the average Polish production facilities, or substituting these. As both scenarios have a comparable energy consumption and the AD scenario has a considerably higher energy production, the modelled energy generation mixes provide the assessment with a large difference between the considered scenarios (as the Polish energy production mixes are relatively emission intensive, being mainly based on coal). In the sensitivity analysis it was shown that a change to cleaner energy production modules (Austrian electricity mix, heat from natural gas) leads to significant lower environmental gains. However, still the optimization of the collection and treatment of kitchen food waste clearly has a positive effect on the environment.
Author Contributions
Conceptualization, J.d.B.; methodology, J.d.B., G.O., S.G., and R.B.S.; software, J.d.B.; validation, J.d.B., G.O., and S.G.; formal analysis, J.d.B., G.O.; investigation, J.d.B.; resources, J.d.B. and G.O.; data curation, J.d.B. and E.d.B.; writing—original draft preparation, J.d.B., G.O.; writing—review and editing, J.d.B., E.d.B., G.O., S.G., and R.B.S.; visualization, J.d.B.; supervision, J.d.B. All authors have read and agreed to the published version of the manuscript.
Funding
This scientific paper was partly co-financed by the European Union Interreg CENTRAL EUROPE Programme (Call 1 2016–2019) under grant agreement n° CE192, on the realization of the inter-national project STREFOWA: “Strategies to Reduce and Manage Food Waste in Central Europe.” Open access funding provided by BOKU Vienna Open Access Publishing Fund.
Data Availability Statement
Not applicable.
Acknowledgments
The authors would like to thank the Zakład Komunalny Sp. z o.o. in Opole for their support during the conduction of the research.
Conflicts of Interest
The authors declare no conflict of interest.
Abbreviations
| AD | Anaerobic Digestion |
| AP | Acidification Potential |
| GHG | Greenhouse Gas |
| GWP | Global Warming Potential |
| ILCD | International Life Cycle Data |
| IPCC | Intergovernmental Panel on Climate Change |
| LCA | Life Cycle Assessment |
| MBP | Mechanical-Biological Pretreatment |
| MEP | Marine Eutrophication Potential |
| ODM | Organic Dry Matter |
| ODP | Ozone Depletion Potential |
| PLA | Polylactide (polylactide acid) |
| RDF | Refuse Derived Fuel |
| STREFOWA | “Strategies to reduce and manage food waste in Central Europe” |
References
- European Parliament and Council. Directive 2009/28/EC of the European Parliament and of the Council of 23 April 2009 on the Promotion of the Use of Energy from Renewable Sources and Amending and Subsequently Repealing Directives 2001/77/EC and 2003/30/EC; European Parliament and Council: Brussels, Belgium, 2009; Available online: https://eur-lex.europa.eu/legal-content/EN/TXT/?uri=CELEX:32009L0028 (accessed on 26 January 2021).
- European Commission. Clean Energy for All Europeans-Publications Office of the EU; European Commission: Luxembourg, 2019; Available online: https://op.europa.eu/en/publication-detail/-/publication/b4e46873-7528-11e9-9f05-01aa75ed71a1?pk_campaign=Twitter (accessed on 26 January 2021).
- European Commission. Going Climate-Neutral by 2050-Publications Office of the EU; European Commission: Luxembourg, 2019; Available online: https://op.europa.eu/en/publication-detail/-/publication/92f6d5bc-76bc-11e9-9f05-01aa75ed71a1 (accessed on 26 January 2021).
- PricewaterhouseCoopers EU Services. Sustainable and Optimal Use of Biomass for Energy in the EU beyond 2020 Final Report PricewaterhouseCoopers EU Services EESV’s Consortium to EC Directorate General for Energy Directorate C1-Renewables and CCS Policy; PricewaterhouseCoopers EU Services: Zaventem, Belgium, 2017. [Google Scholar]
- European Commission. Proposal for a Regulation of the European Parliament and of the Council Establishing the Framework for Achieving Climate Neutrality and Amending Regulation (EU) 2018/1999. COM(2020) 80 Final; European Commission: Brussels, Belgium, 2020; Available online: https://eur-lex.europa.eu/legal-content/EN/TXT/?qid=1588581905912&uri=CELEX:52020PC0080 (accessed on 12 March 2021).
- European Parliament. The European Green Deal. European Parliament Resolution of 15 January 2020 on the European Green Deal (2019/2956(RSP)); European Parliament: Brussels, Belgium, 2020; Available online: https://www.europarl.europa.eu/doceo/document/TA-9-2020-0005_EN.pdf (accessed on 12 March 2021).
- European Commission. A New Circular Economy Action Plan-For a Cleaner and More Competitive Europe. COM(2020) 98 Final; European Commission: Brussels, Belgium, 2020; Available online: https://eur-lex.europa.eu/legal-content/EN/TXT/?qid=1583933814386&uri=COM:2020:98:FIN (accessed on 26 January 2021).
- Kancelaria Sejmu. Ustawa Z Dnia 13 Września 1996 R.O Utrzymaniu Czystości I Porządku W Gminach. Dz. U. 1996 Nr 132 Poz. 622; Kancelaria Sejmu: Warszawa, Poland, 2020. Available online: http://isap.sejm.gov.pl/isap.nsf/download.xsp/WDU19961320622/U/D19960622Lj.pdf (accessed on 26 January 2021).
- Muench, S.; Guenther, E. A systematic review of bioenergy life cycle assessments. Appl. Energy 2013, 112, 257–273. [Google Scholar] [CrossRef]
- Bernstad, A.; Jansen, J.L.C. Review of comparative LCAs of food waste management systems-Current status and potential improvements. Waste Manag. 2012, 32, 2439–2455. [Google Scholar] [CrossRef]
- Slorach, P.C.; Jeswani, H.K.; Cuéllar-Franca, R.; Azapagic, A. Environmental sustainability of anaerobic digestion of household food waste. J. Environ. Manag. 2019, 236, 798–814. [Google Scholar] [CrossRef] [PubMed]
- Bernstad, A.; Jansen, J.L.C. A life cycle approach to the management of household food waste-A Swedish full-scale case study. Waste Manag. 2011, 31, 1879–1896. [Google Scholar] [CrossRef] [PubMed]
- Oldfield, T.L.; White, E.; Holden, N.M. An environmental analysis of options for utilising wasted food and food residue. J. Environ. Manag. 2016, 183, 826–835. [Google Scholar] [CrossRef] [PubMed]
- Fei, F.; De Clercq, D.; Wen, Z.; Huang, S. China Ministry Science and Technology commissioned project View project Mechanical biological treatment of municipal solid waste: Energy efficiency, environmental impact and economic feasibility analysis. Artic. J. Clean. Prod. 2018, 178, 731–739. [Google Scholar] [CrossRef]
- Montejo, C.; Tonini, D.; Márquez, M.D.C.; Astrup, T.F. Mechanical–biological treatment: Performance and potentials. An LCA of 8 MBT plants including waste characterization. J. Environ. Manag. 2013, 128, 661–673. [Google Scholar] [CrossRef] [PubMed] [Green Version]
- Grzesik, K.; Malinowski, M. Life Cycle Assessment of Mechanical–Biological Treatment of Mixed Municipal Waste. Environ. Eng. Sci. 2017, 34, 207–220. [Google Scholar] [CrossRef]
- Reduce Food Waste in Europe. Available online: http://www.reducefoodwaste.eu/index.html (accessed on 4 February 2021).
- Ekvall, T.; Assefa, G.; Bjö, A.; Eriksson, O.; Ran Finnveden, G. What life-cycle assessment does and does not do in assessments of waste management. Waste Manag. 2007, 27, 989–996. [Google Scholar] [CrossRef] [PubMed]
- Kern, M.; Raussen, T.; Funda, K.; Lootsma, A.; Hofmann, H. Aufwand und Nutzen Einer Optimierten Bioabfall-Verwertung Hinsichtlich Energieeffizienz, Klima-und Ressourcenschutz. Witzenhausen-Institut Für Abfall; Umwelt und Energie GmbH: Dessau-Roßlau, Germany, 2010. [Google Scholar]
- Faulstich, M.; Prechtl, S. Studie Zur Nachhaltigen Verwertung Von Gärresten (E115). In Im Auftrag Vom Bayerischen Staatsministerium Für Umwelt, Gesundheit und Verbraucherschutz Mit Unterstützung Des EFRE-strukturfonds; ATZ Entwicklungszentrum: Sulzbach-Rosenberg, Germany, 2005. [Google Scholar]
- Lampert, C.; Tesar, M.; Thaler, P. Klimarelevanz und Energieeffizienz Der Verwertung Biogener Abfälle (KEVBA); Umweltbundesamt GmbH: Vienna, Austria, 2011; ISBN 9783990041567. [Google Scholar]
- Sphera Solutions Ltd. GaBi Software-System and Database for Life Cycle Engineering; Sphera Solutions Ltd.: Stuttgart, Germany, 2020. [Google Scholar]
- Boldrin, A.; Neidel, T.L.; Damgaard, A.; Bhander, G.S.; Møller, J.; Christensen, T.H. Modelling of environmental impacts from biological treatment of organic municipal waste in EASEWASTE. Waste Manag. 2011, 31, 619–630. [Google Scholar] [CrossRef] [PubMed] [Green Version]
- Den Boer, J.; den Boer, E.; Jager, J. LCA-IWM: A decision support tool for sustainability assessment of waste management systems. Waste Manag. 2007, 27, 1032–1045. [Google Scholar] [CrossRef] [PubMed]
- Ecoinvent. Ecoinvent Database v3.6; Ecoinvent: Zurich, Switzerland, 2020. [Google Scholar]
- Pertl, A.; Obersteiner, G. Ökologische Auswirkungen Ausgewählter Abfallwirtschaftlicher Maßnamen. Re-Use–Green Events–Lebensmittelabfallvermeidung–Bioabfallbehandlung; Unpublished report in within the ERDF funded project Future of Waste; ABF-BOKU: Vienna, Austria, 2014. [Google Scholar]
- Knappe, F.; Vogt, R.; Lazar, S.; Höke, S. Optimierung Der Verwertung Organischer Abfälle; Warenkorb: Dessau-Roßlau, Germany, 2012. [Google Scholar]
- European Environment Agency. Circular Economy in Europe—Developing the Knowledge Base—European Environment Agency Report No 2/2016; European Environment Agency: Copenhagen, Denmark, 2016; Available online: https://www.eea.europa.eu/publications/circular-economy-in-europe (accessed on 12 March 2021).
- Amlinger, F.; Peyr, S.; Hildebrandt, U.; Müsken, J.; Cuhls, C.; Clemens, J. Stand Der Technik Der Kompostierung Richtlinie Des Bundesministeriums Für Land- und Forstwirtschaft, Umwelt und Wasserwirtschaft; LVWG: Frankfurt, Germany, 2005. [Google Scholar]
- International Organisation for Standardization. ISO 14040:2006-Environmental Management—Life Cycle Assessment—Principles and Framework; International Organisation for Standardization: Geneva, Switzerland, 2016; Available online: https://www.iso.org/standard/37456.html (accessed on 27 January 2021).
- International Organisation for Standardization. ISO 14044:2006-Environmental Management—Life Cycle Assessment—Requirements and Guidelines; International Organisation for Standardization: Geneva, Switzerland, 2016; Available online: https://www.iso.org/standard/38498.html (accessed on 12 March 2021).
- European Commission-Joint Research Centre-Institute for Environment and Sustainability. International Reference Life Cycle Data System (ILCD) Handbook–Recommendations for Life Cycle Impact Assessment in the European Context, 1st ed.; European Commission-Joint Research Centre-Institute for Environment and Sustainability: Brussels, Beligum, 2011; ISBN 9789279174513. [Google Scholar]
- Guinee, J.B. Handbook on life cycle assessment operational guide to the ISO standards. Int. J. Life Cycle Assess. 2002, 7, 311–313. [Google Scholar] [CrossRef]
- Stocker, T.F.; Qin, D.; Plattner, G.K.; Tignor, M.M.B.; Allen, S.K.; Boschung, J.; Nauels, A.; Xia, Y.; Bex, V.; Midgley, P.M. Climate Change 2013 the Physical Science Basis: Working Group I Contribution to the Fifth Assessment Report of the Intergovernmental Panel on Climate Change; Cambridge University Press: Cambridge, UK, 2013; Volume 9781107057999, ISBN 9781107415324. [Google Scholar]
Figure 1.
A system overview of the studied pilot action in Opole: The “action” includes all activities directly attributable to the pilot action. The action is compared against the “baseline system replaced” to quantify net benefits achieved.
Figure 1.
A system overview of the studied pilot action in Opole: The “action” includes all activities directly attributable to the pilot action. The action is compared against the “baseline system replaced” to quantify net benefits achieved.

Figure 2.
Biowaste collection sets (a), used biodegradable bags (b) and avoidable kitchen waste (c) in the pilot action in Opole.
Figure 2.
Biowaste collection sets (a), used biodegradable bags (b) and avoidable kitchen waste (c) in the pilot action in Opole.

Figure 3.
The global warming potential (excl. biogenic carbon) of the diversion of 1 t kitchen waste from residual waste (treatment in MBP) to biowaste (treatment in AD) in the city of Opole.
Figure 3.
The global warming potential (excl. biogenic carbon) of the diversion of 1 t kitchen waste from residual waste (treatment in MBP) to biowaste (treatment in AD) in the city of Opole.

Figure 4.
The marine eutrophication potential of the diversion of 1 t kitchen waste from residual waste (treatment in MBP) to biowaste (treatment in AD) in the city of Opole.
Figure 4.
The marine eutrophication potential of the diversion of 1 t kitchen waste from residual waste (treatment in MBP) to biowaste (treatment in AD) in the city of Opole.

Figure 5.
The acidification potential of the diversion of 1 t kitchen waste from residual waste (treatment in MBP) to biowaste (treatment in AD) in the city of Opole.
Figure 5.
The acidification potential of the diversion of 1 t kitchen waste from residual waste (treatment in MBP) to biowaste (treatment in AD) in the city of Opole.

Figure 6.
The ozone depletion potential of the diversion of 1 t kitchen waste from residual waste (treatment in MBP) to biowaste (treatment in AD) in the city of Opole.
Figure 6.
The ozone depletion potential of the diversion of 1 t kitchen waste from residual waste (treatment in MBP) to biowaste (treatment in AD) in the city of Opole.

Figure 7.
Sensitivity: the global warming potential (excl. biogenic carbon) (a) and the ozone depletion potential (b) of the diversion of 1 t kitchen waste from residual waste (treatment in MBP) to biowaste (treatment in AD) in the city of Opole. Austrian electricity mix and heat from natural gas.
Figure 7.
Sensitivity: the global warming potential (excl. biogenic carbon) (a) and the ozone depletion potential (b) of the diversion of 1 t kitchen waste from residual waste (treatment in MBP) to biowaste (treatment in AD) in the city of Opole. Austrian electricity mix and heat from natural gas.

Figure 8.
Sensitivity: the acidification potential (excl. biogenic carbon) (a) and the marine eutrophication potential (b) of Table 1. t kitchen waste from residual waste (treatment in MBP) to biowaste (treatment in AD) in the city of Opole. Austrian electricity mix and heat from natural gas.
Figure 8.
Sensitivity: the acidification potential (excl. biogenic carbon) (a) and the marine eutrophication potential (b) of Table 1. t kitchen waste from residual waste (treatment in MBP) to biowaste (treatment in AD) in the city of Opole. Austrian electricity mix and heat from natural gas.


Table 1.
Collection of biowaste before and after implementation of the pilot action [ton for the considered area].
Table 1.
Collection of biowaste before and after implementation of the pilot action [ton for the considered area].
| Research Period | 6 Weeks Period before Starter Kit distribution [ton] | 6 Weeks Period after Starter Kit Distribution [ton] | Change | ||||
|---|---|---|---|---|---|---|---|
| Residential Area | Reference Group | Pilot Group | Reference Group | Pilot Group | Reference Group | Pilot Group | Total |
| 1-Family Houses | 27.29 | 3.77 | 23.76 | 9.02 | −13% | 139% | 152% |
| Semi-Blocks | 25.44 | 6.17 | 21.56 | 10.15 | −15% | 65% | 80% |
| Blocks | n.d. | 2.20 | n.d. | 2.31 | n.d. | 5% | 5% |
Table 2.
In-and outputs of the treatment of 1 ton of kitchen waste from increased separate collection.
Table 2.
In-and outputs of the treatment of 1 ton of kitchen waste from increased separate collection.
| Inputs | Amount | Unit | Reference |
|---|---|---|---|
| Baseline scenario: Mechanical-Biological Pretreatment | |||
| Input MBP | 1000 | kg | |
| Electricity cons | 55 | kWh/t input | [22,24] |
| Diesel cons | 0.5 | l/t input | [22,24] |
| Fine fraction to landfill | 254 | kg/t kitchen waste | [24] |
| Coarse fraction to cement kiln | 48 | kg/t kitchen waste | [24] |
| Hard coal substitution | 0.225 | kg/kg coarse fraction | [24] |
| Pilot scenario: Anaerobic Digestion | |||
| Input AD | 1004.2 | kg (additionally biodegradable bags) | |
| Inside home bins | 0.12 | kg/t kitchen waste | Polypropylene [22] |
| Biodegradable bags | 4.2 | kg/t kitchen waste | 46% PLA/54% Ecoflex [22,25] |
| Biogas | 156 | kg/t kitchen waste | [26], adjusted |
| Power generation (net) | 2.23 | kWh/kg biogas | [22,26] |
| Steam generation (net) | 11.60 | MJ/kg biogas | [22,26] |
| Compost (from digestate) | 202 | kg/t kitchen waste | [26] |
| Power consumption | 55 | kWh/kg digestate | [22,26] |
| Diesel consumption | 1.26 | kg/t digestate | [22,26] |
Table 3.
Material and energy balance for the production of 1 kg of considered biodegradable bags.
| Parameter | Unit | Value | Process/Reference |
|---|---|---|---|
| ecoflex® F Blend C1200 | kg | 0.46 | BASF SE, GLO: plastic film PP, PE, PVC [22] |
| Polylactic acid | kg | 0.54 | US: Ingeo Polylactide (PLA) biopolymer production (NatureWorks, [22]) |
| Lubricating oil | g | 0.193 | RER: Lubricating oil production (Ecoinvent 3.6 [25]) |
| Plastic production waste | kg | 0.04 | |
| Electricity | kWh | 0.46 | PL: Electricity grid mix ts [22] |
| Thermal energy | MJ | 0.21 | PL: Thermal energy from natural gas ts [22] |
Table 4.
Material and energy balance for the production of 1 kg of ecoflex® F Blend C1200.
| Parameter | Unit | Value | Process/Reference |
|---|---|---|---|
| Adipic acid | kg | 0.363 | DE: Adipic acid ts [22] |
| Butane diol | kg | 0.224 | DE: Butanediol ts [22] |
| Terephtalic acid | g | 0.413 | EU-28: Terephtalic acid production mix (PlasticsEurope, [22]) |
| Electricity | kWh | 0.33 | DE: Electricity grid mix ts [22] |
| Thermal energy | MJ | 2.0 | DE: Thermal energy from natural gas ts [22] |
Table 5.
Substitution effects of compost application, per 1 kg compost applied.
| Parameter | Unit | Value | Process/Reference |
|---|---|---|---|
| Ammonia | g | 15.8 | DE: Ammonia (liquid, agriculture) PE [22,26] |
| Potassium chloride | g | 21.2 | DE: Potassium chloride (agrarian) PE [22,26] |
| Raw phosphate | g | 22.1 | GLO: Rock phosphate mix (32.4% P2O5) PE [22,26] |
| Straw/wood | kg | 0.95 | DE: Timber spruce (12% moisture) PE [22,26] |
| Ammonia emission | g | 1.58 | Caused by ammonia application [26] |
Table 6.
Impact assessment methodologies applied for the assessment of the environmental impact of food waste management optimization.
Table 6.
Impact assessment methodologies applied for the assessment of the environmental impact of food waste management optimization.
| Impact Category | Description | Reference Unit | Source |
|---|---|---|---|
| Global Warming Potential (100-year Horizon), IPCC AR5 | A measure of greenhouse gas emissions, such as CO2 and methane. These emissions are causing an increase in the absorption of radiation emitted by the earth, increasing the natural greenhouse effect. This may in turn have adverse impacts on ecosystem health, human health, and material welfare. | kg CO2-eq | [34] |
| Marine eutrophication, ILCD v1.09 | Eutrophication covers all potential impacts of excessively high levels of macronutrients. Nutrient enrichment may cause an undesirable shift in species composition and elevated biomass production in ecosystems. In aquatic ecosystems increased biomass production may lead to depressed oxygen levels, because of the additional consumption of oxygen in biomass decomposition. | kg N-eq | [32] |
| Acidification, ILCD v1.09 | A measure of emissions that cause acidifying effects to the environment. The acidification potential is a measure of a molecule’s capacity to increase the hydrogen ion (H+) concentration in the presence of water, thus decreasing the pH value. Potential effects include fish mortality, forest decline, and the deterioration of building materials. | mol H+-eq | [32] |
| Ozone depletion, ILCD v1.09 | A measure of air emissions that contribute to the depletion of the stratospheric ozone layer. Depletion of the ozone leads to higher levels of UVB ultraviolet rays reaching the earth’s surface with detrimental effects on humans and plants. | kg CFC-11-eq | [32] |
Publisher’s Note: MDPI stays neutral with regard to jurisdictional claims in published maps and institutional affiliations. |
© 2021 by the authors. Licensee MDPI, Basel, Switzerland. This article is an open access article distributed under the terms and conditions of the Creative Commons Attribution (CC BY) license (http://creativecommons.org/licenses/by/4.0/).
Share and Cite
MDPI and ACS Style
Boer, J.d.; Obersteiner, G.; Gollnow, S.; Boer, E.d.; Bodnárné Sándor, R. Enhancement of Food Waste Management and Its Environmental Consequences. Energies 2021, 14, 1790. https://doi.org/10.3390/en14061790
AMA Style
Boer Jd, Obersteiner G, Gollnow S, Boer Ed, Bodnárné Sándor R. Enhancement of Food Waste Management and Its Environmental Consequences. Energies. 2021; 14(6):1790. https://doi.org/10.3390/en14061790
Chicago/Turabian StyleBoer, Jan den, Gudrun Obersteiner, Sebastian Gollnow, Emilia den Boer, and Renata Bodnárné Sándor. 2021. "Enhancement of Food Waste Management and Its Environmental Consequences" Energies 14, no. 6: 1790. https://doi.org/10.3390/en14061790
Note that from the first issue of 2016, this journal uses article numbers instead of page numbers. See further details here.