Article

Numerical Investigation of an RCCI Engine Fueled with Natural Gas/Dimethyl-Ether in Various Injection Strategies

by
Ayat Gharehghani
1,*,
Alireza Kakoee
1,
Amin Mahmoudzadeh Andwari
2,3,
Thanos Megaritis
2,* and
Apostolos Pesyridis
2,4
1
School of Mechanical Engineering, Iran University of Science and Technology, Narmak, Tehran 16846-13114, Iran
2
Center for Advanced Powertrain and Fuels Research (CAPF), Department of Mechanical, Aerospace and Civil Engineering, Brunel University, London UB8 3PH, UK
3
Vehicle, Fuel and Environment Research Institute (VFERI), School of Mechanical Engineering, College of Engineering, University of Tehran, Tehran 14399-56191, Iran
4
College of Engineering, Alasala Colleges, King Fahad Bin Abdulaziz Rd., Dammam 31483, Saudi Arabia
*
Authors to whom correspondence should be addressed.
Energies 2021, 14(6), 1638; https://doi.org/10.3390/en14061638
Submission received: 24 January 2021 / Revised: 24 February 2021 / Accepted: 10 March 2021 / Published: 15 March 2021

Abstract

:
Reactivity control compression ignition engines illustrated suitable abilities in emission reduction beside high thermal efficiency. In this research, nine various direct fuel injection strategies were studied numerically: three cases with single injection strategy and six cases with split injection and different start of injection (SOI). In all simulated cases, equivalence ratio kept constant (i.e., 0.3). Among various strategies, single injection showed higher IMEP as a factor of efficiency with about 5.39 bar that occurred at SOI = 60 before top dead center (bTDC), while lower efficiency was observed for split injection case with 50%-50% injections of fuel in each injection stage. Start of combustion (SOC), burn duration and CA50 as factors for combustion characteristics were affected with SOI changes. In single SOI strategies, more advanced injection caused more advanced SOC where there was about 1.3 CAD advancing from 40 to 80 bTDC injection. Spilt SOI showed more advanced SOC, which, also more advanced, was allocated to 50%-50% split injection strategy. There was also the same trend in CA50 changes during change in SOI. Burn duration variations were insignificant and all of them approximately close to 4.5 CAD. According to the emissions researched in this study (Nitrogen Oxides (NOx), monoxide carbon (CO) and unburned hydro carbons (UHC)), all of these pollutants are below euro six diesel standards. Contours of emissions show that there were appropriate SOI for each case study, which were 45 degree bTDC for single strategy, 48 degree bTDC for 80%-20% mass injection and 70 degree bTDC for 50%-50% cases.

1. Introduction

Reactivity controlled compression ignition (RCCI), homogenous control compression ignition (HCCI) and pre-mixed controlled compression ignition (PCCI) are considered as three methods of low temperature combustion (LTC) as methods to have lower emissions in the direction of lower temperature and lean combustion [1]. In fact, these three methods provide a more diluted mixture of fuels in higher homogeneity to have more lean and complete combustion [2]. Among these three methods, RCCI engines, which use two different fuels with two different reactivities, in addition to having a more diluted mixture, also have the possibility to have more complete combustion due to low reactivity fuel (LRF) [3,4,5]. In this type of engines, usually low reactivity fuel imports to the cylinder from the intake port and high reactivity fuel injects to the cylinder directly. As such limitations lead lean combustion on engine operational condition to have more stability and efficiency, there are different strategies in the direction of providing better combustion in these types of engines [6]. Cetane number and mixture of fuel reactivity are two important, effective factors in the combustion quality in RCCI engines. There are various research on using different fuels and mixtures, collated in C. Bae et al.’s 2017 review; research on various fuels, mutant compression ratio, exhaust gas recirculation usage and glow plug as well as injecting pilot fuel has been investigated [7]. Geometry changes have also been investigated by researchers to provide more homogenous mixture beside higher combustion quality. In 2010, Higashino et al., used a thermal isolated pre-chamber in an HCCI natural gas (NG) CI engine [8]. Roethlisberger et al., 2009, investigated the roles of pre-chamber on a spark ignition (SI) engine where more smooth working and lower in-cylinder temperature were observed in their research [9]. Investigating on throat size effects on combustion of an SI engine was numerically performed by Stanislaw Szwaja et al. in 2013 [10]. Zheng et al., 2005, used pre-chamber to investigate various properties such as mixture formation, fluid flow and nitrogen oxides emissions in a CI engine [11]. A comparison study on using pre-chamber was done by Salahi et al., in 2015 in a case of numerical works in a natural gas/diesel RCCI engine, where they investigated effects of pre-chamber on combustion quality and exhaust emissions [12]. In 2018, Kakoee et al., investigated the effects of additives (Hydrogen) on engine performance and emissions in a NG/Diesel RCCI engine [4]. Further, in their recent works in 2019 they investigated an RCCI engine equipped with a pre-chamber in case of hydrogen addition effects on two various fuel mixtures, NG/diesel and NG/DME, and their results show different behavior of these two mixture fuels against hydrogen addition [2,3]. In the case of geometry analysis, Balasubramanian et al., performed an investigation on combustion and emission characteristics by applying 11 various bowl geometry in a numerical study research [13].
In the way of using alternative fuel mixtures in RCCI engines, Moradi et al., in 2020 investigated hydrogen addition influences on a NG/diesel RCCI engine, and they observed that hydrogen addition reduces unburned hydrocarbons (UHC) and carbon dioxides (CO2) while increasing nitrogen oxides (NOx) [14]. These results were also obtained in Kakoee et al.’s investigations on hydrogen additions [2,3]. Because of the use of two different fuels with various reactivities, changing fuels ratio in RCCI engines was attractive for researchers, where Olsen et al., in 2007 studied effects of NG percentages on combustion characteristics and exhaust emission on a NG/Diesel RCCI engine [15]. They found that there are more UHC and CO2 besides lower NOx in higher percentages of natural gas. Bio-diesel, as a high reactivity fuel, was also used by Ghareghani et al., to investigate fuel properties such as Cetane number influences on combustion in a NG/Bio-diesel RCCI engine [16]. Injection timing is also an alternative research focus to study engine power output and emissions, and there are various investigations in this field. An RCCI engine fueled with gasoline/n-heptane was investigated in 2015 by Zhu et al., to obtain effects of injection timing and fuels ratio [17]. Han et al., in 2018, studied various start of injection strategies and energies input properties on a NG/diesel RCCI multi-cylinder, heavy-duty engine [18]. Another experimental research was done by Soloiu et al., in 2013 to investigate injection timing of HRF to determine its effect on emissions and engine output of an N-butanol/Biodiesel RCCI engine [19]. The combustion properties of a2-butanol/diesel RCCI engine were studied by Pan et al., in 2017 to investigate the effect of 2-butanol percentage on engine emissions and efficiency. Jesus Benajes et al., made an experimental investigation on injection timing of four different low reactivity fuels in high and low engine load, and they found that the effects of SOI angle have different influences on emissions from high to low loads; this was observed also in other properties such as IMEP [20]. Influences of fuel fractions and injection timing were studied in an RCCI gasoline/biodiesel numerical model by J. Li et al., where they showed that advanced SOI caused an advance in start of combustion and also increased NOx emissions; this change decreased HC and CO emissions [21]. Fuel injection parameters were also modeled in 2016 by M. Nazemi et al., and spray angle, SOI timing and fuel injection pressure was investigated in this research. More advanced SOI produce lower NOx and higher amounts of HC and CO [22]. A light duty diesel/gas RCCI engine was studied by Kamran Poorghasemi et al., in 2017.It was observed in their research that gross indicated efficiency increases with advancing SOI, where CA50 also advanced, and emission was influenced by changing main SOI where in NOx decreased with SOI advancing, in contrast to the increase of HC and CO. Advancing in main SOI led to more delay in start of combustion [23]. Double injection timing strategy was investigated by Jing Li, et al., in 2018 while a main topic in their research was Dwell contact CAD effects on engine performance and emissions [24]. Various port injected fuel with n-heptane as high reactivity fuel were investigated during injection timing strategy in 2015 by Lifeng Zhu et.al. Five various injection angles were investigated and this research shows advancing in SOC due to advancing in start of injection. It was also observed that more advancing SOI has more ignition delay in CAD. Exhaust NO emission show lower amounts in more advanced SOI where the amount of HC and CO increases during advancing start of injection. Higher temperature and pressure was also observed in more advanced SOI [25]. An optimization work on injection parameter combustion chamber geometry was studied by Jie Liu. et al., in 2018. More than 200 case data were calculated during the optimization process, which has various data in start of combustion related to three various combustion chambers. In their results, more NO was observed in more advanced SOI besides higher HC and CO [26]. Iso-Butanol/Diesel RCCI heavy-duty engine was studied numerically by Mobasheri et al., in 2018 and they showed that, in three various injected pressure, there are different behavior of NOx emission during advancing SOI, until 50 CAD aTDC where the amount of NOx decreased, but in SOI between 50 and60 the amount of NOx increased. CO and HC emission also have the same condition against these SOI changes. Advanced SOI increased temperature until50 CAD aTDC, in which maximum pressure and temperature occurred in this point also; after this crank angle temperature and pressure decreased [27]. Peak pressure rise rate and combustion stability were investigated against injection timing in an RCCI engine by Saxena M.R et al., in 2018. In this study, two different blends of high low reactivity fuels were investigated against SOI variation. This experimental research showed that advancing in SOI led to lower pressure and in-cylinder temperature. There was also a minimum peak pressure rise rate at 30 CAD before top dead center(bTDC).IMEP was increased during SOI advancing in two fuel blending [28].
Dimethyl ether as a HRF is produced from various methods such as natural gas, waste products, crude oils and biomasses. Its characteristic is approximately the same as liquefied petroleum gases, although its high reactivity made it attractive for researchers to use it in CI engines. In 2007, Kong et al., investigated a NG/DME RCCI engine numerically with detailed chemical kinetic solution [29]. Arcoumaniset et al., in 2008 studied different various works to show DME usage in CI engines, spark ignition and rotary applications [30]. As it was mentioned before, Liu et al., has done research on a NG/DME RCCI with hydrogen as additive [13]. In addition to the comparative study of NG/Diesel and NG/DME by Kakoee et al. [4], usage of DME in various percentages to obtain optimum HRF fuel percentage and research on its behavior against hydrogen addition was done in 2019 [2,3].
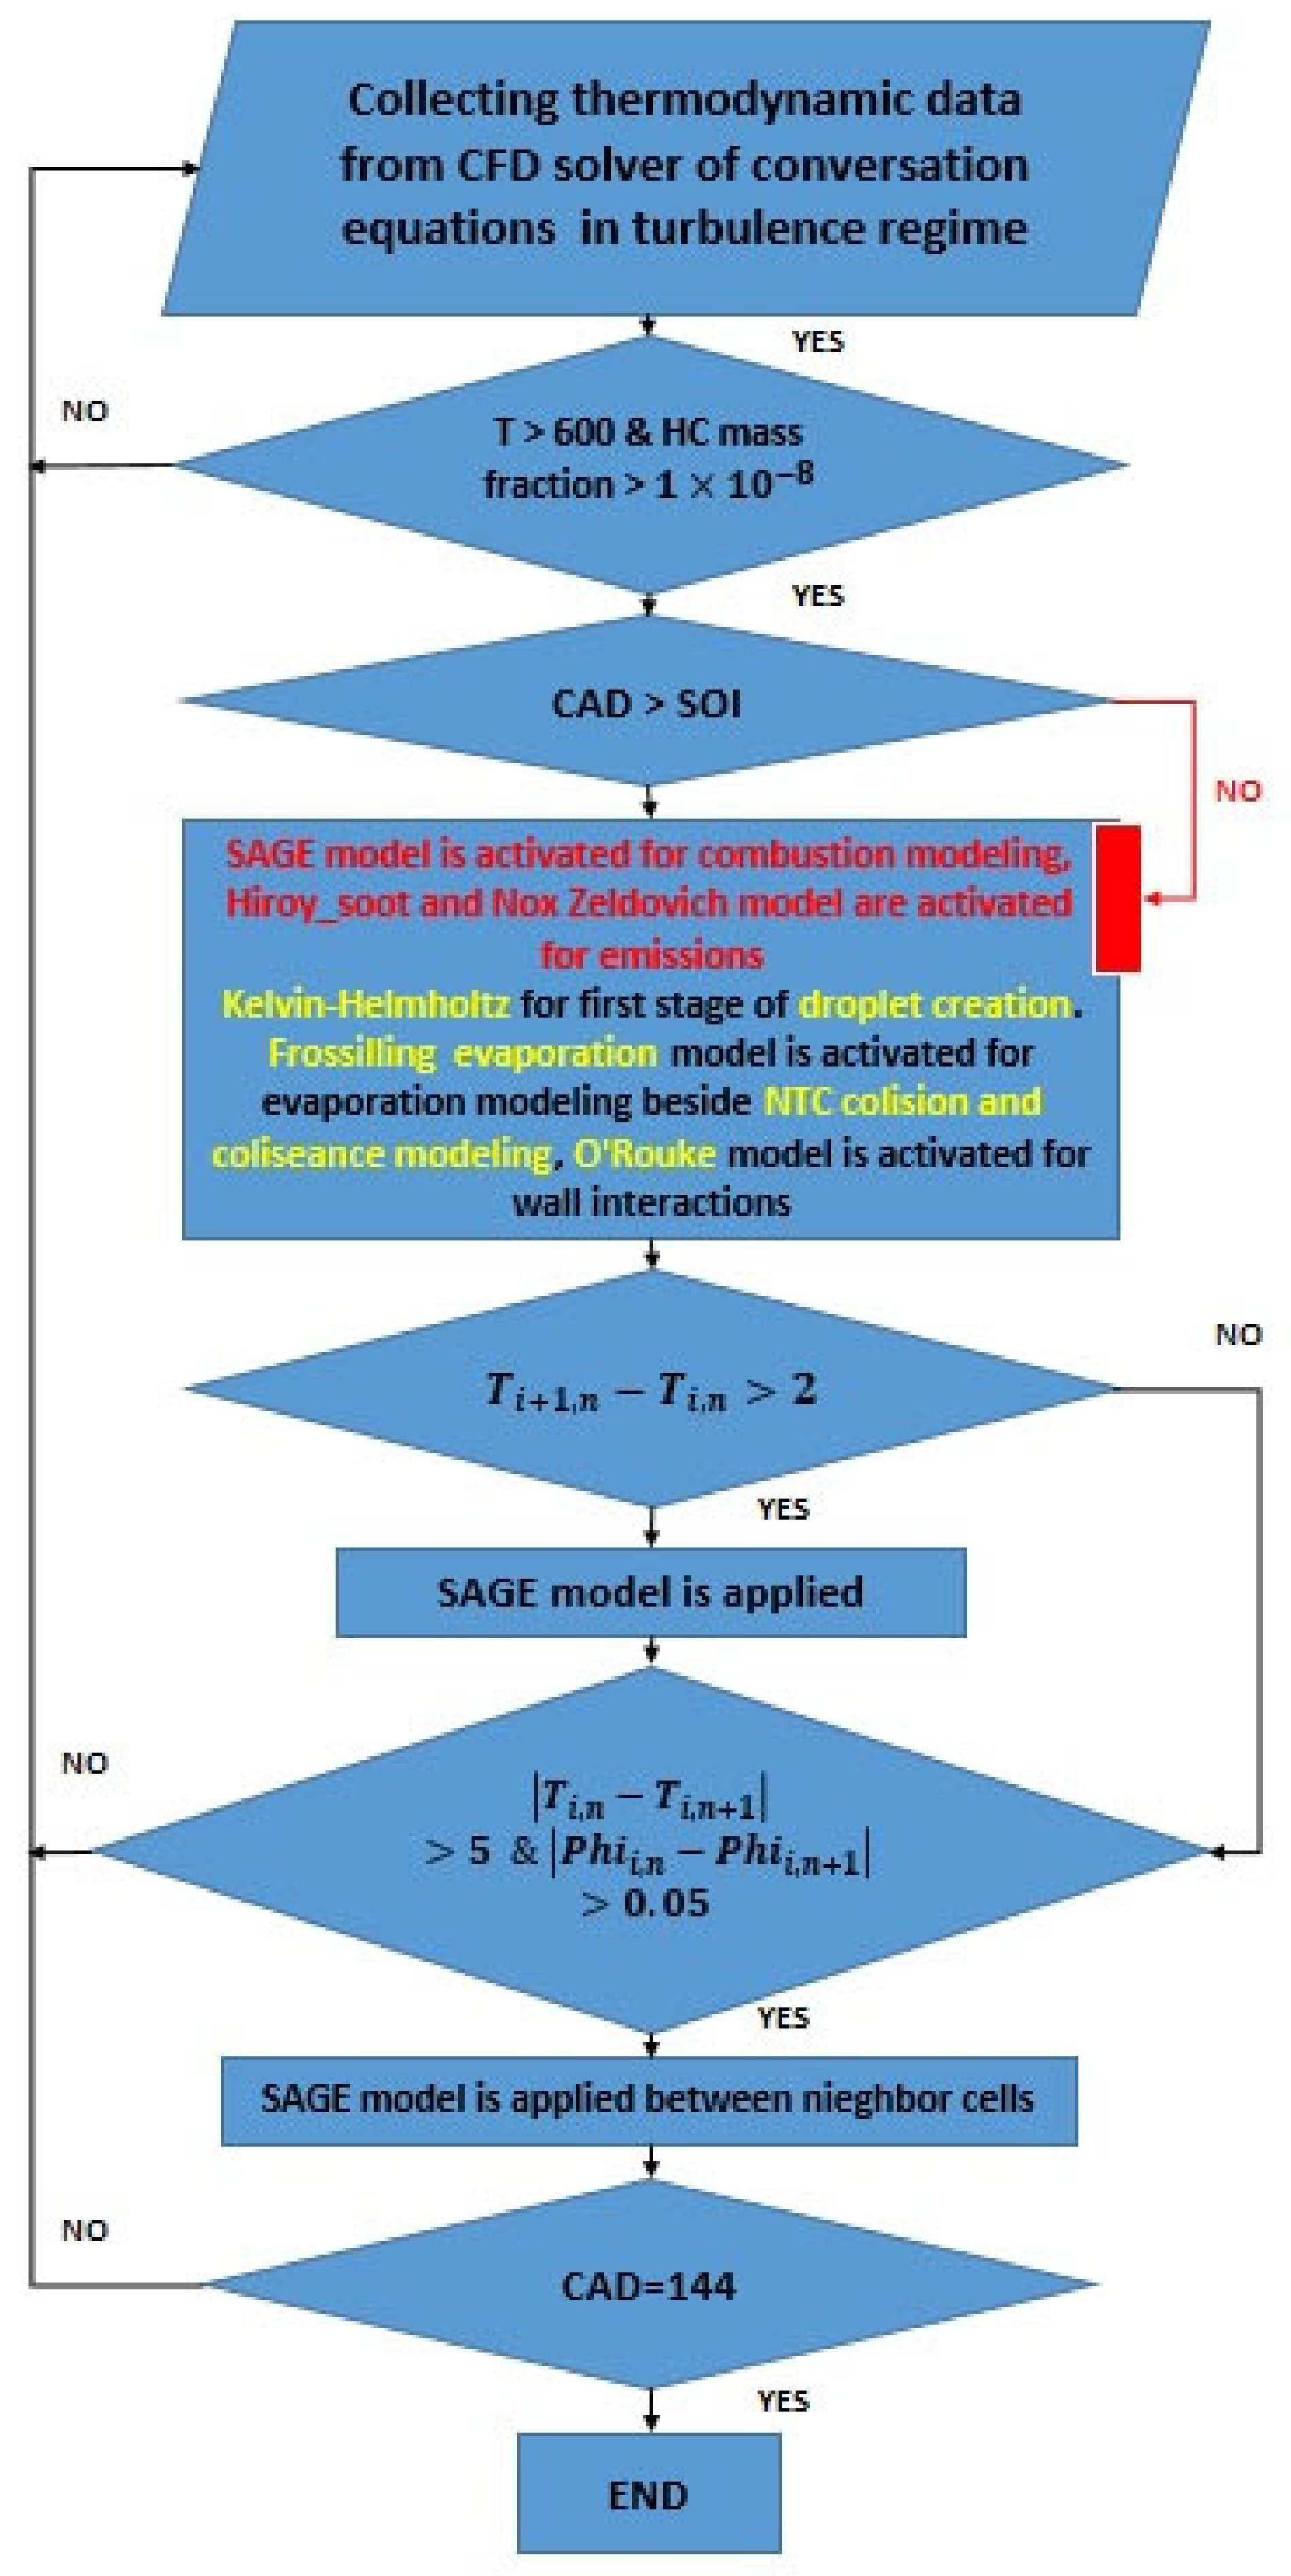
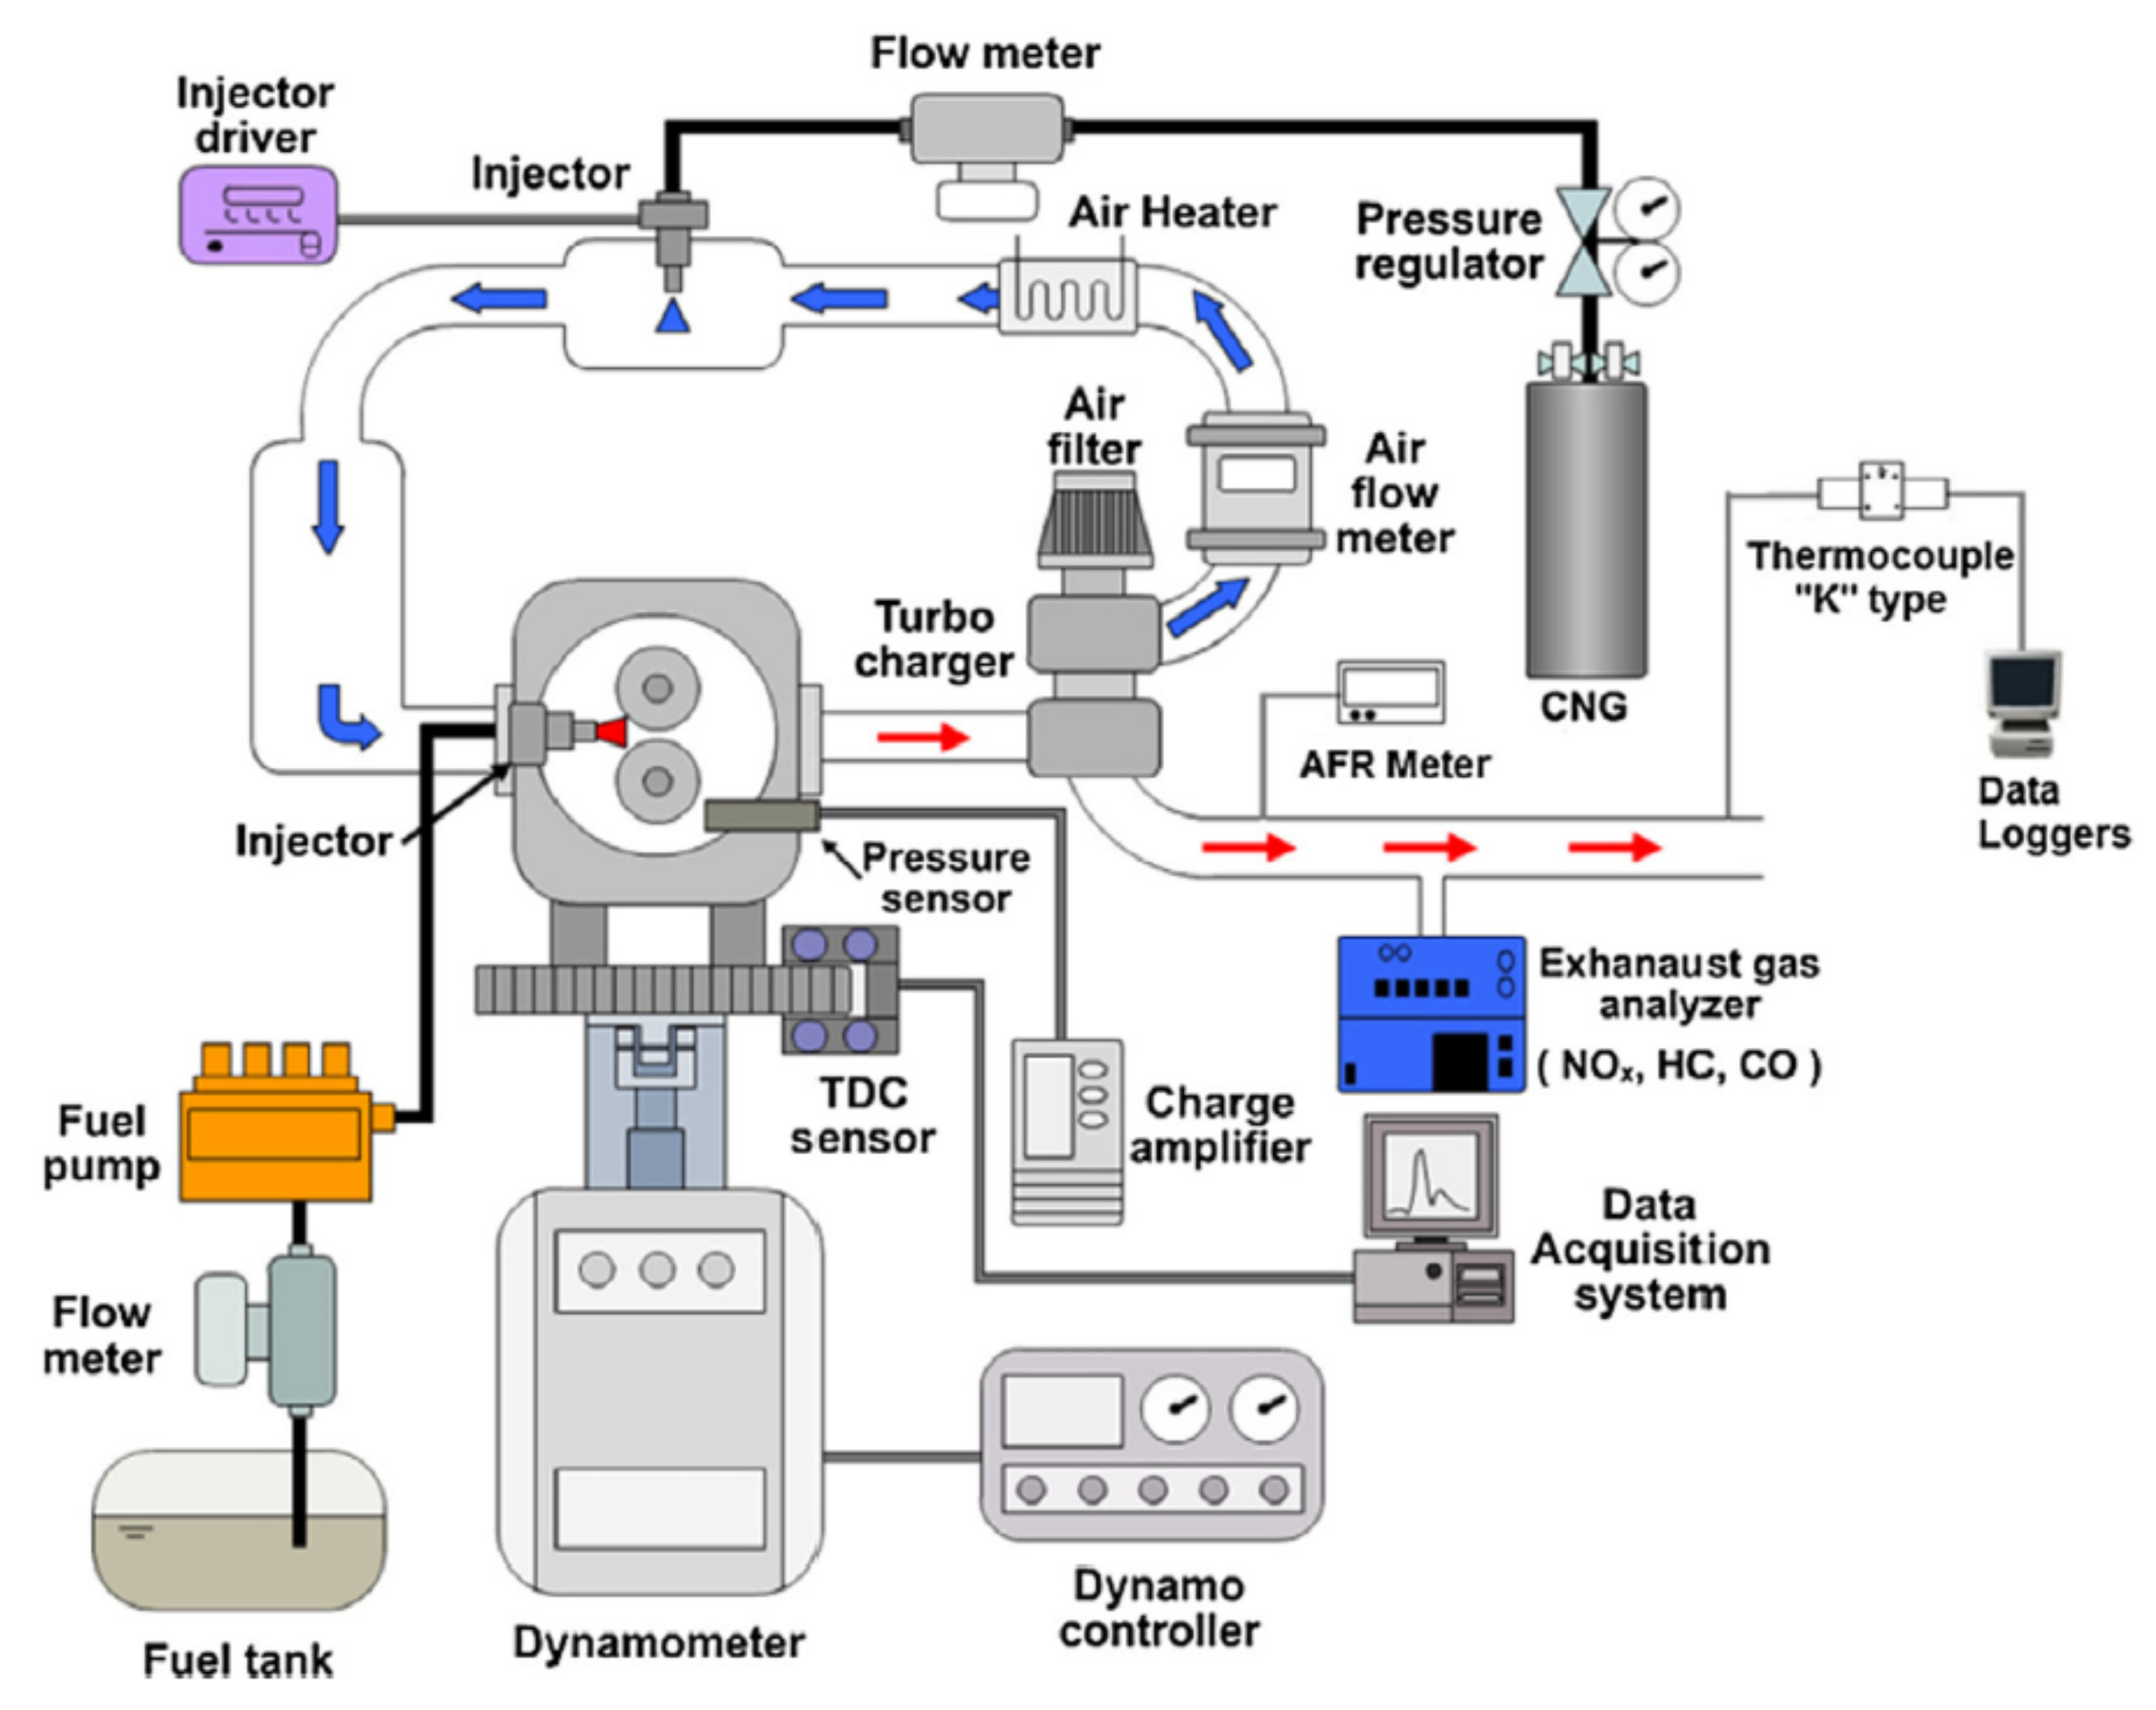
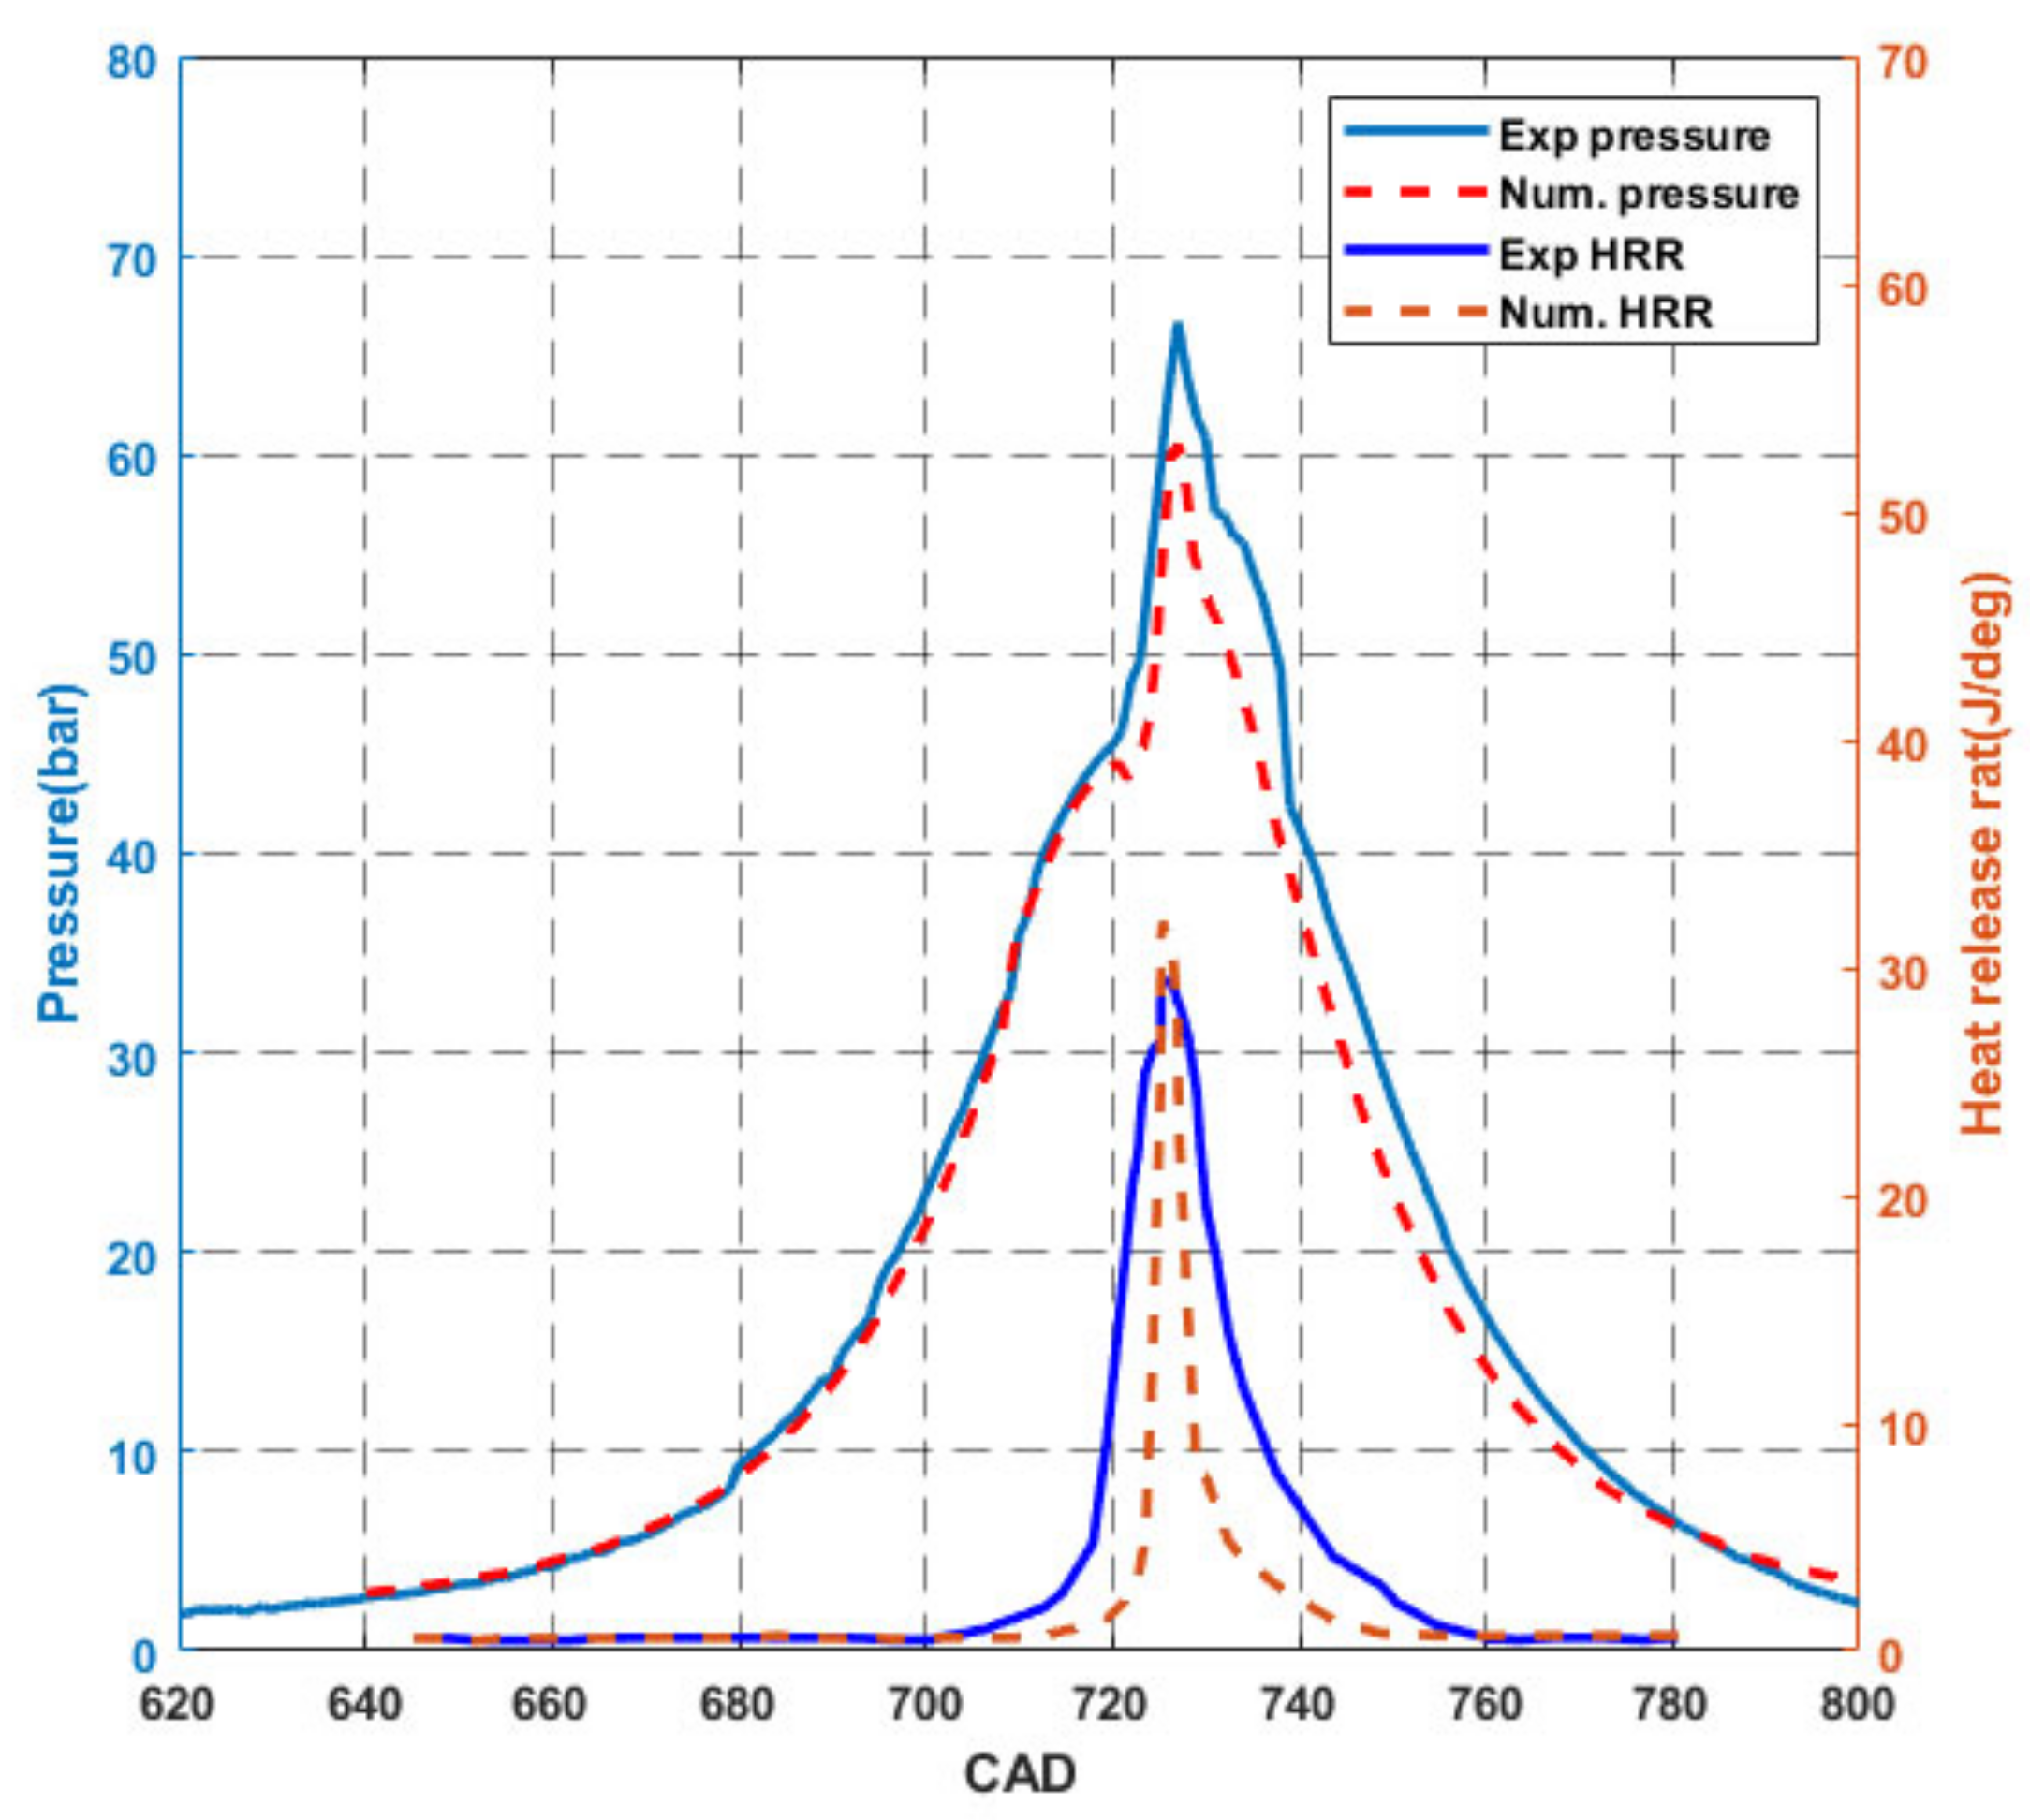
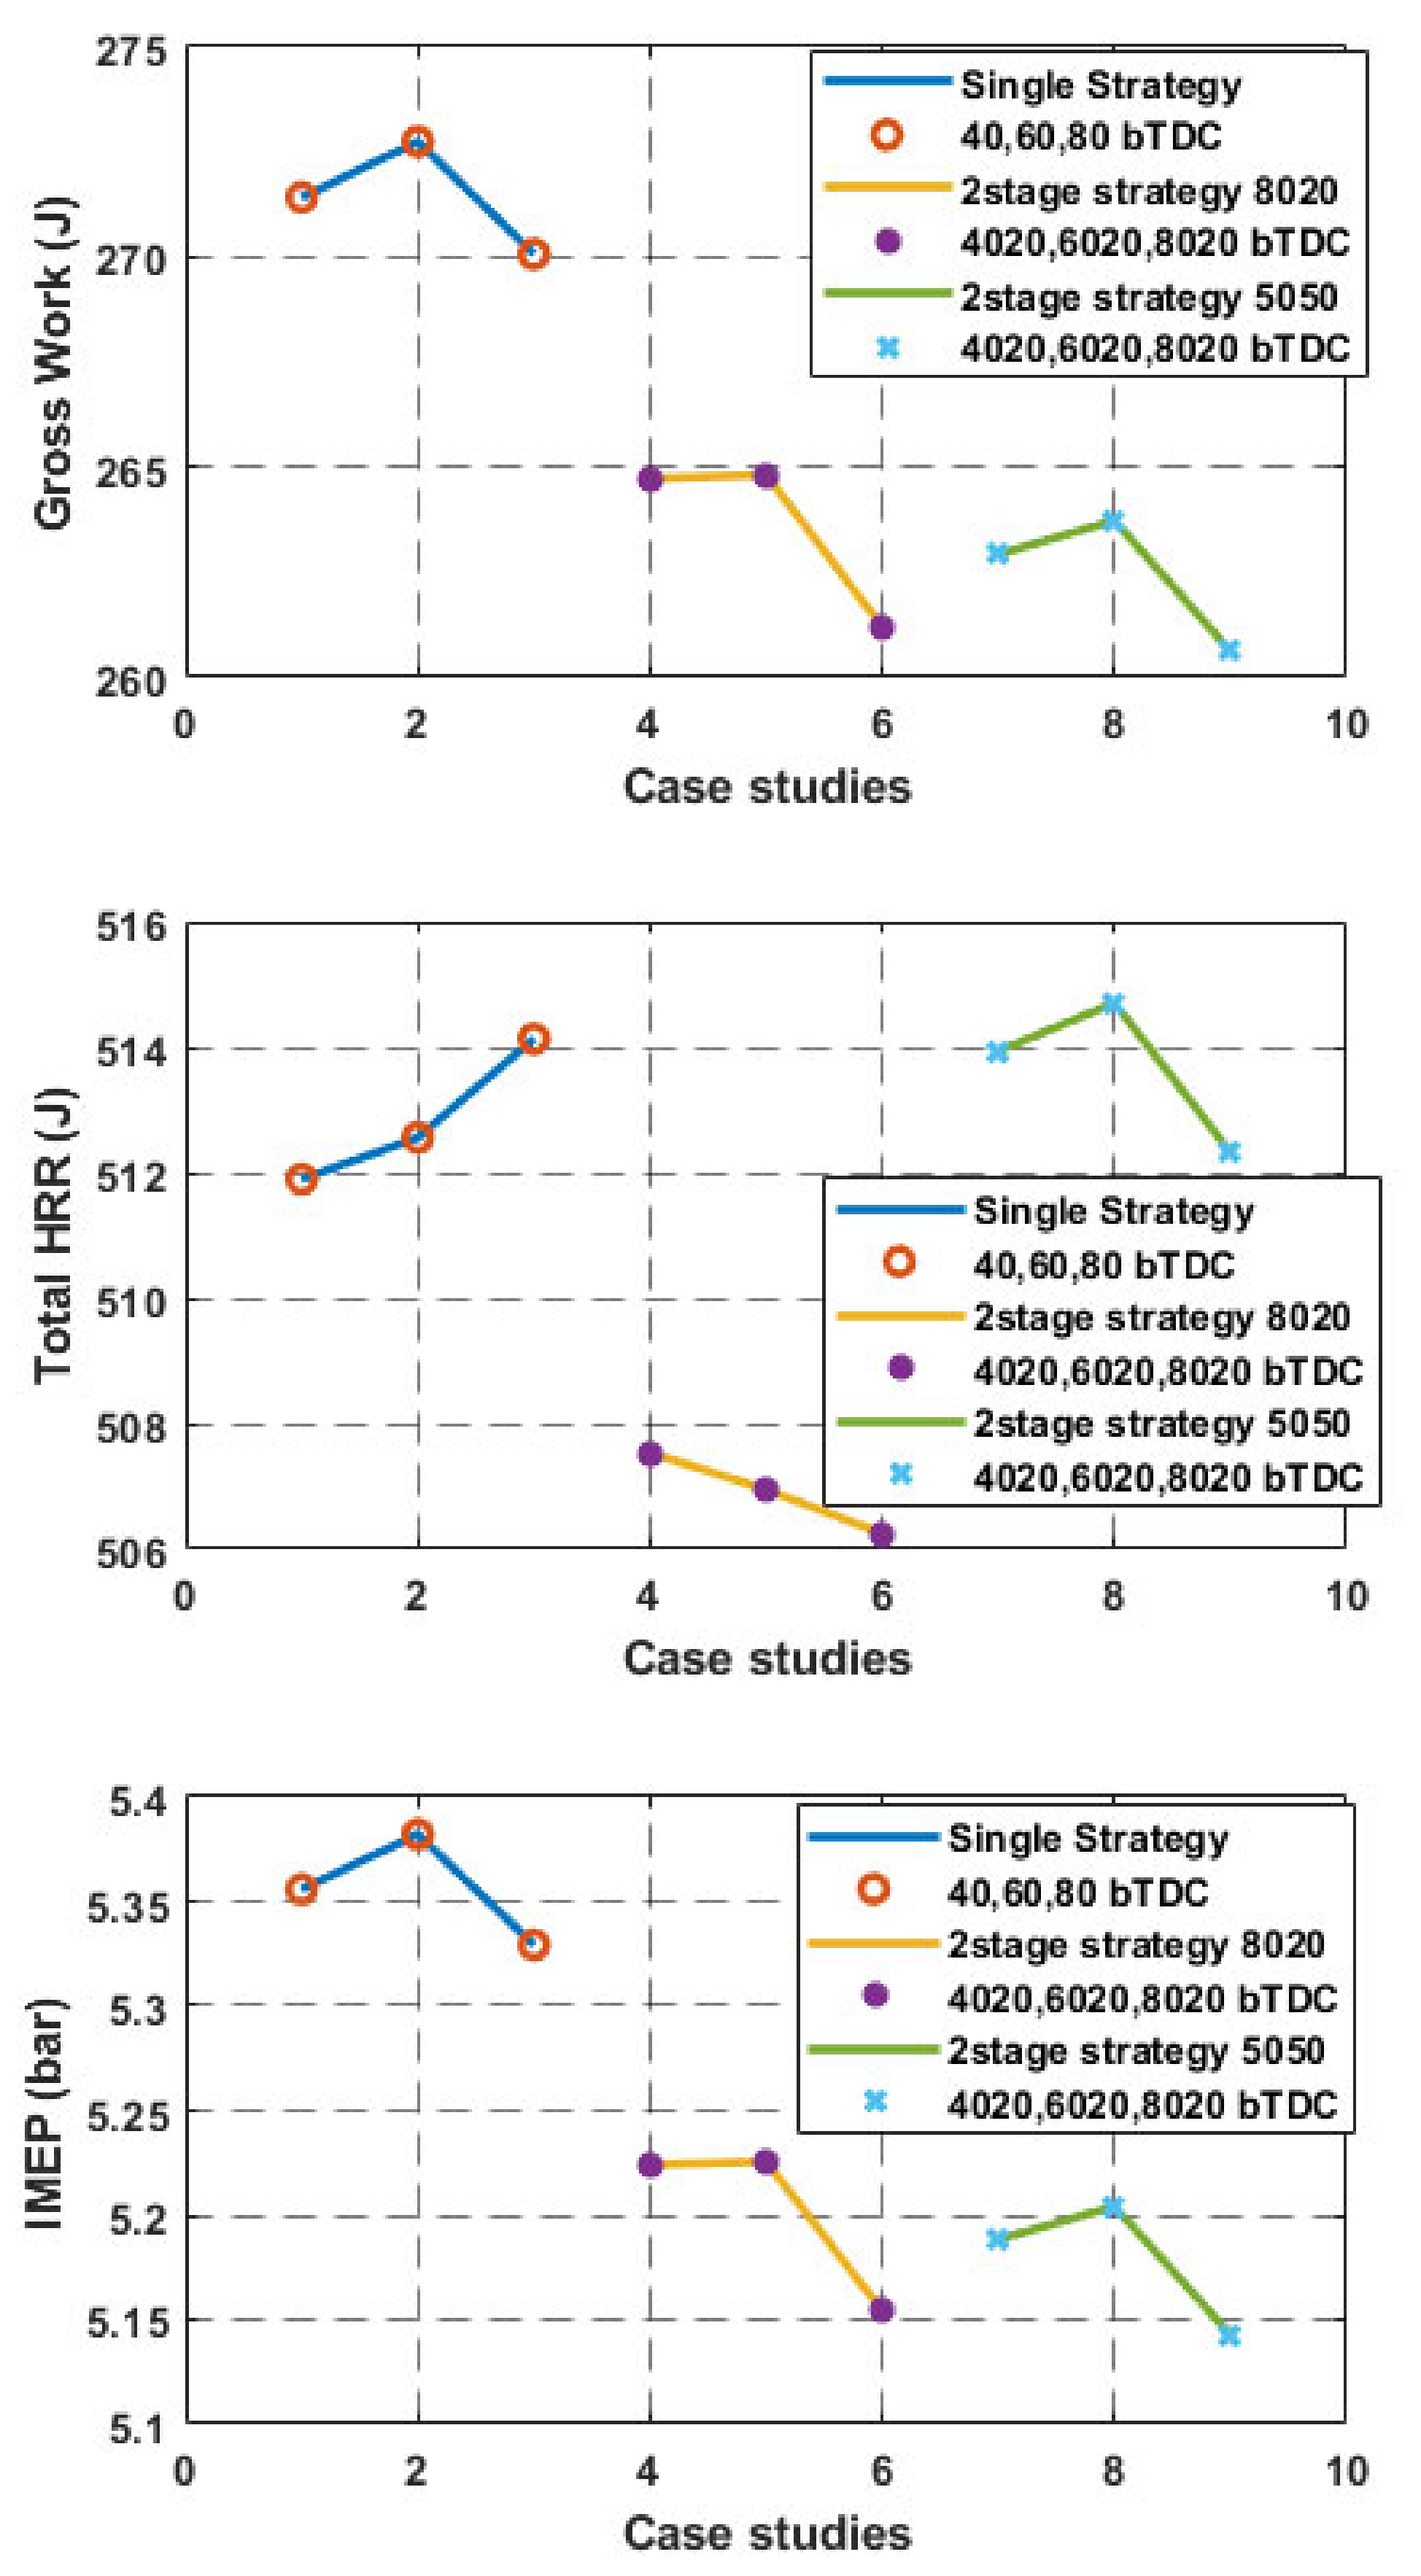
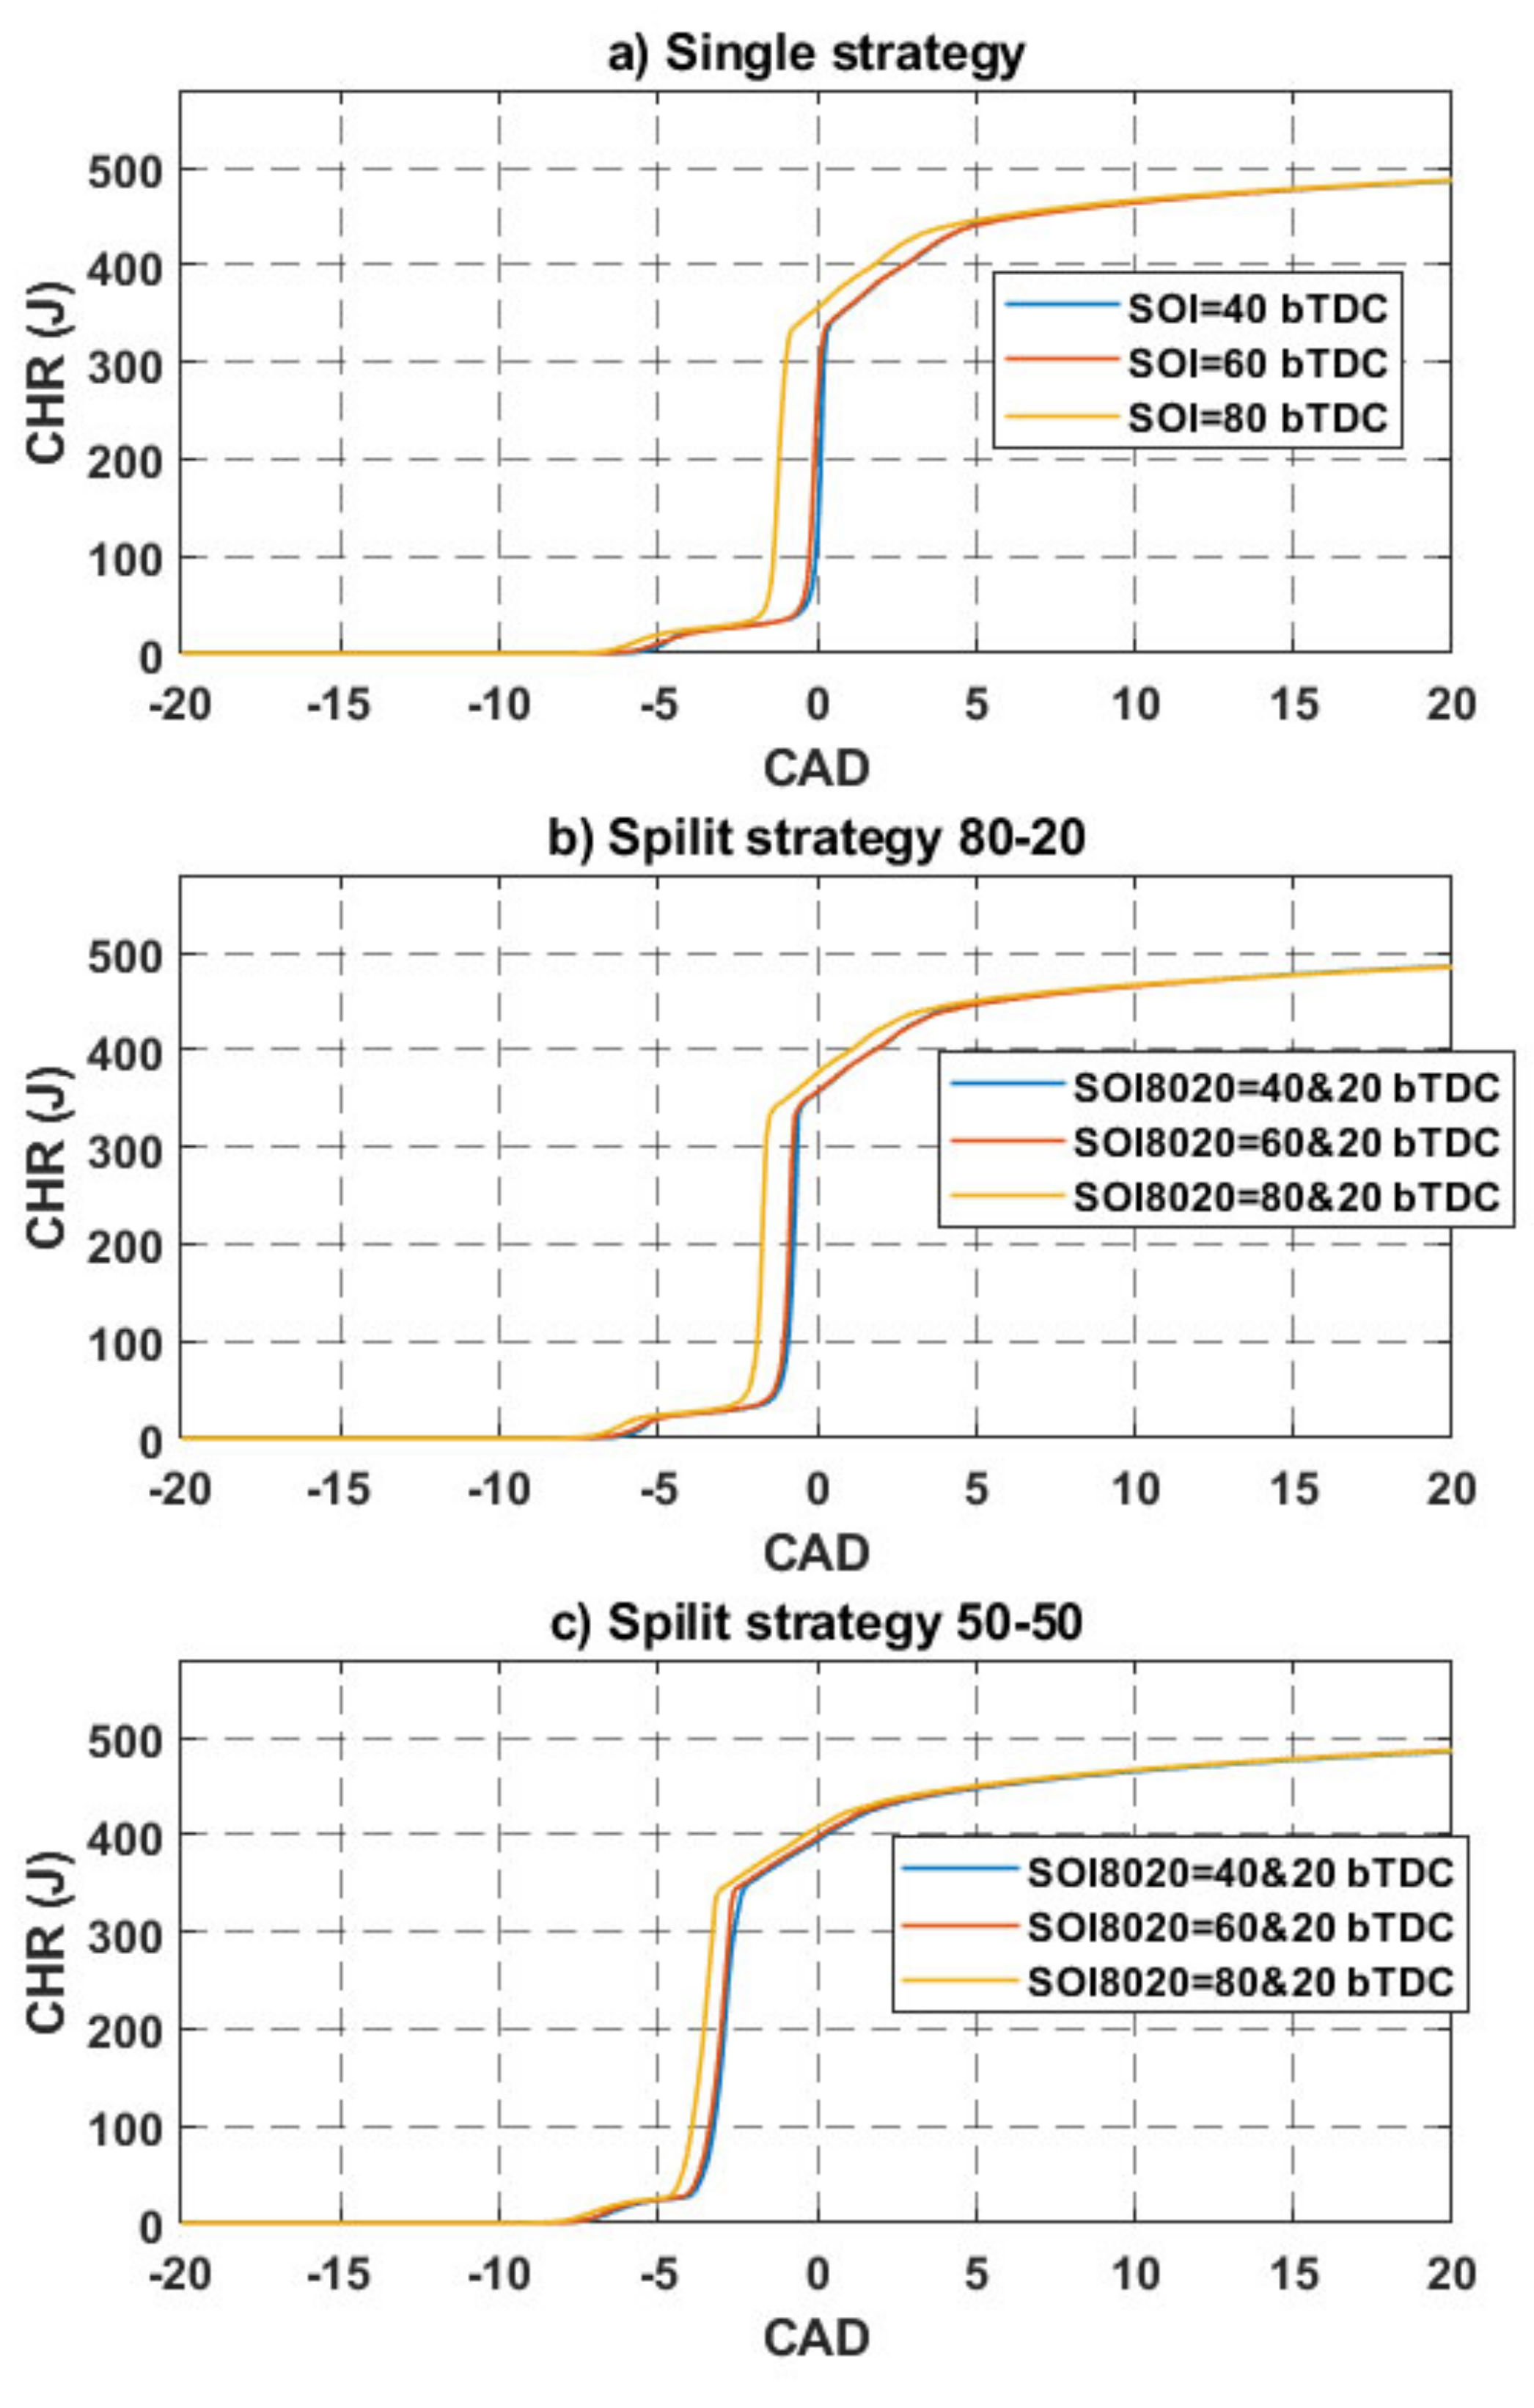
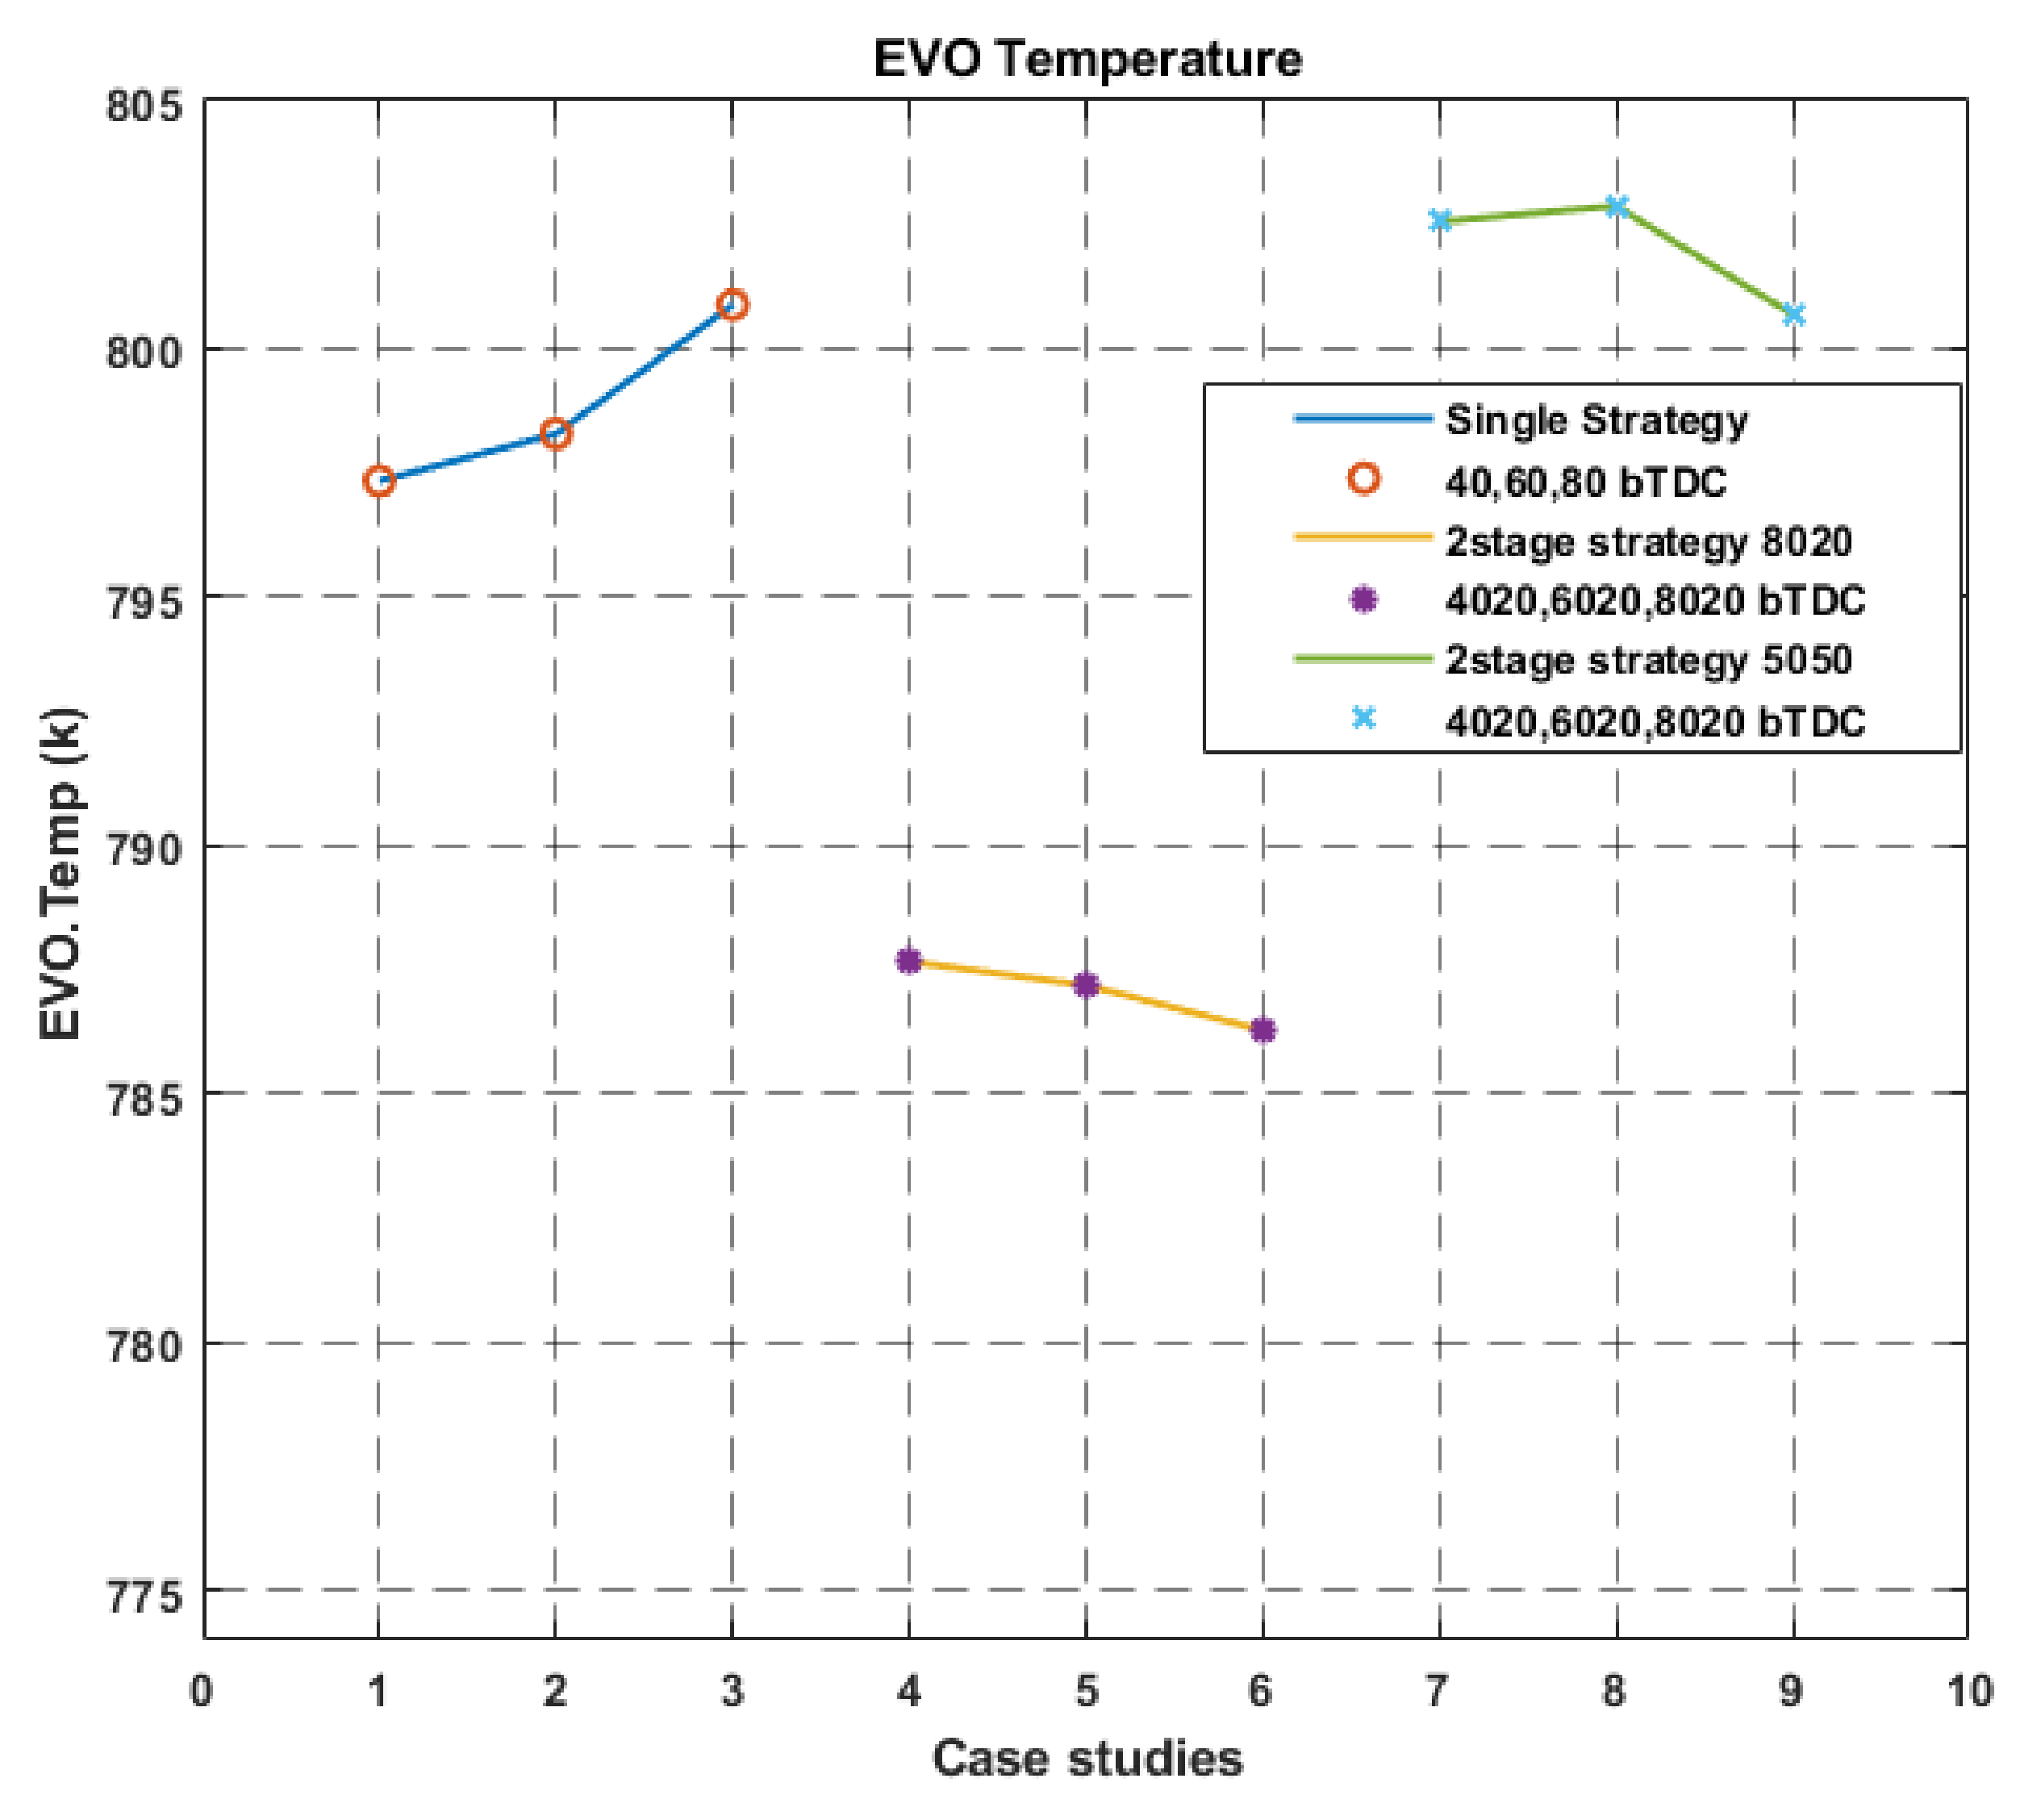
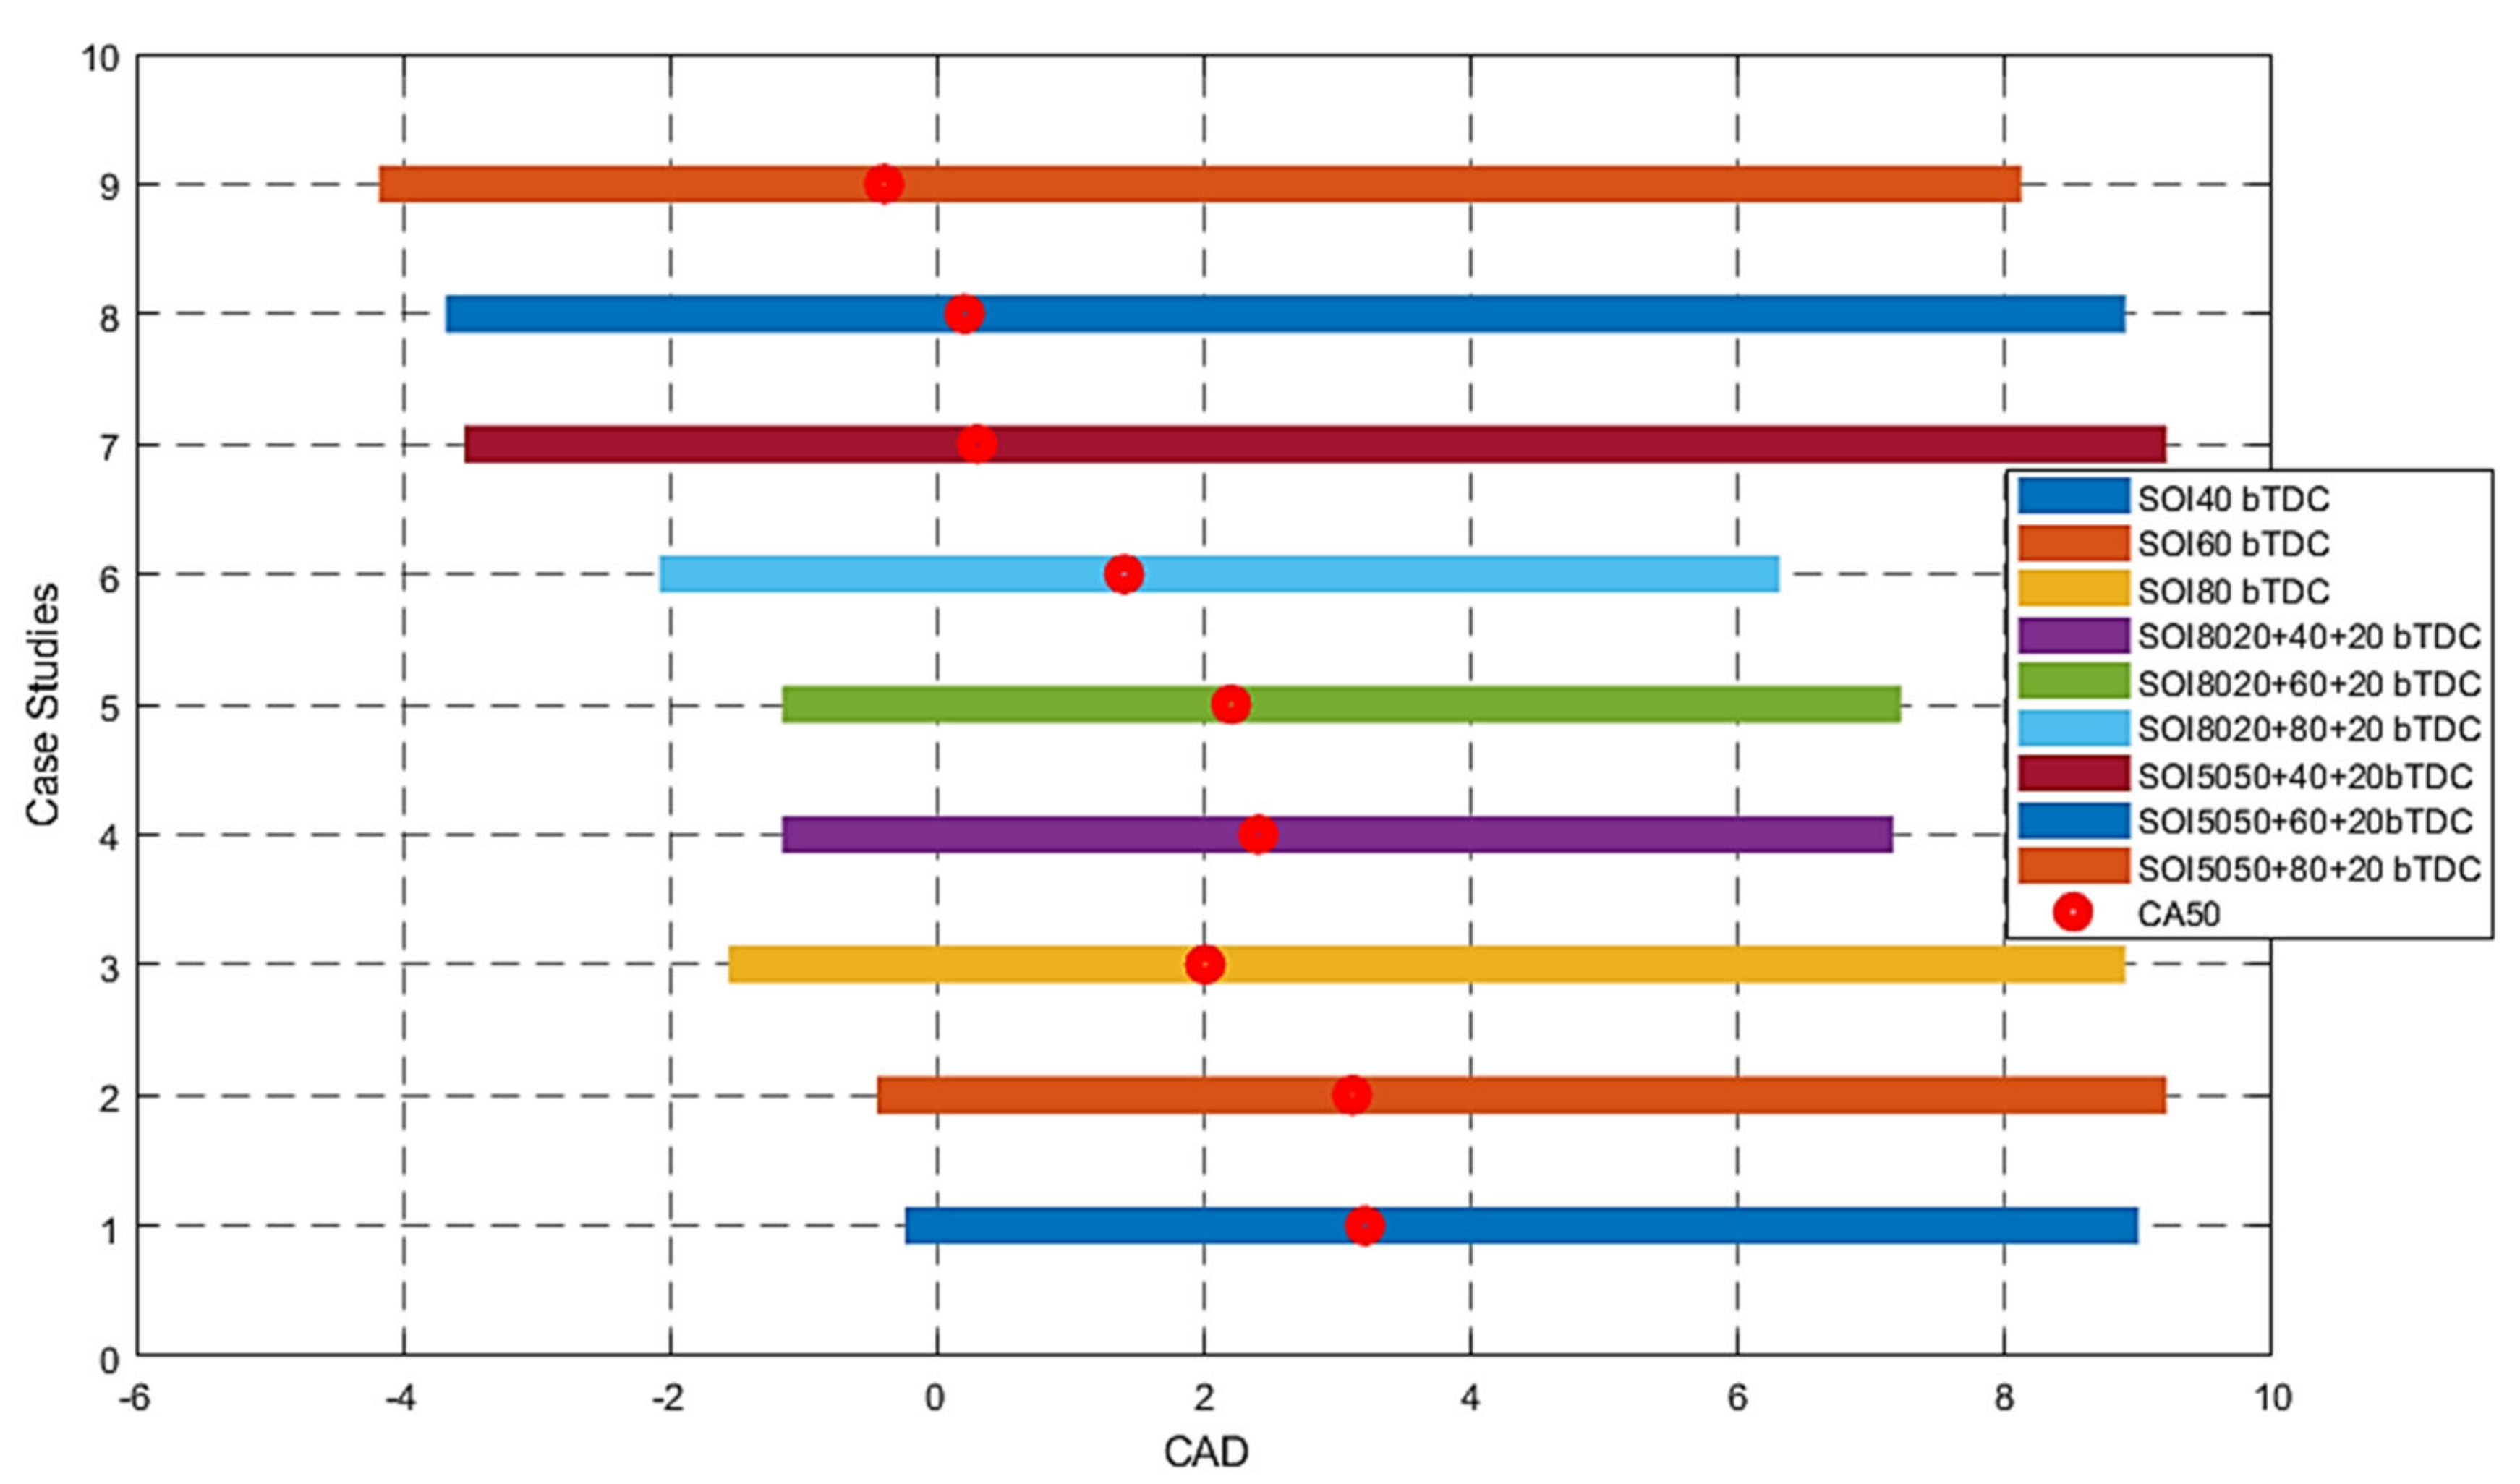
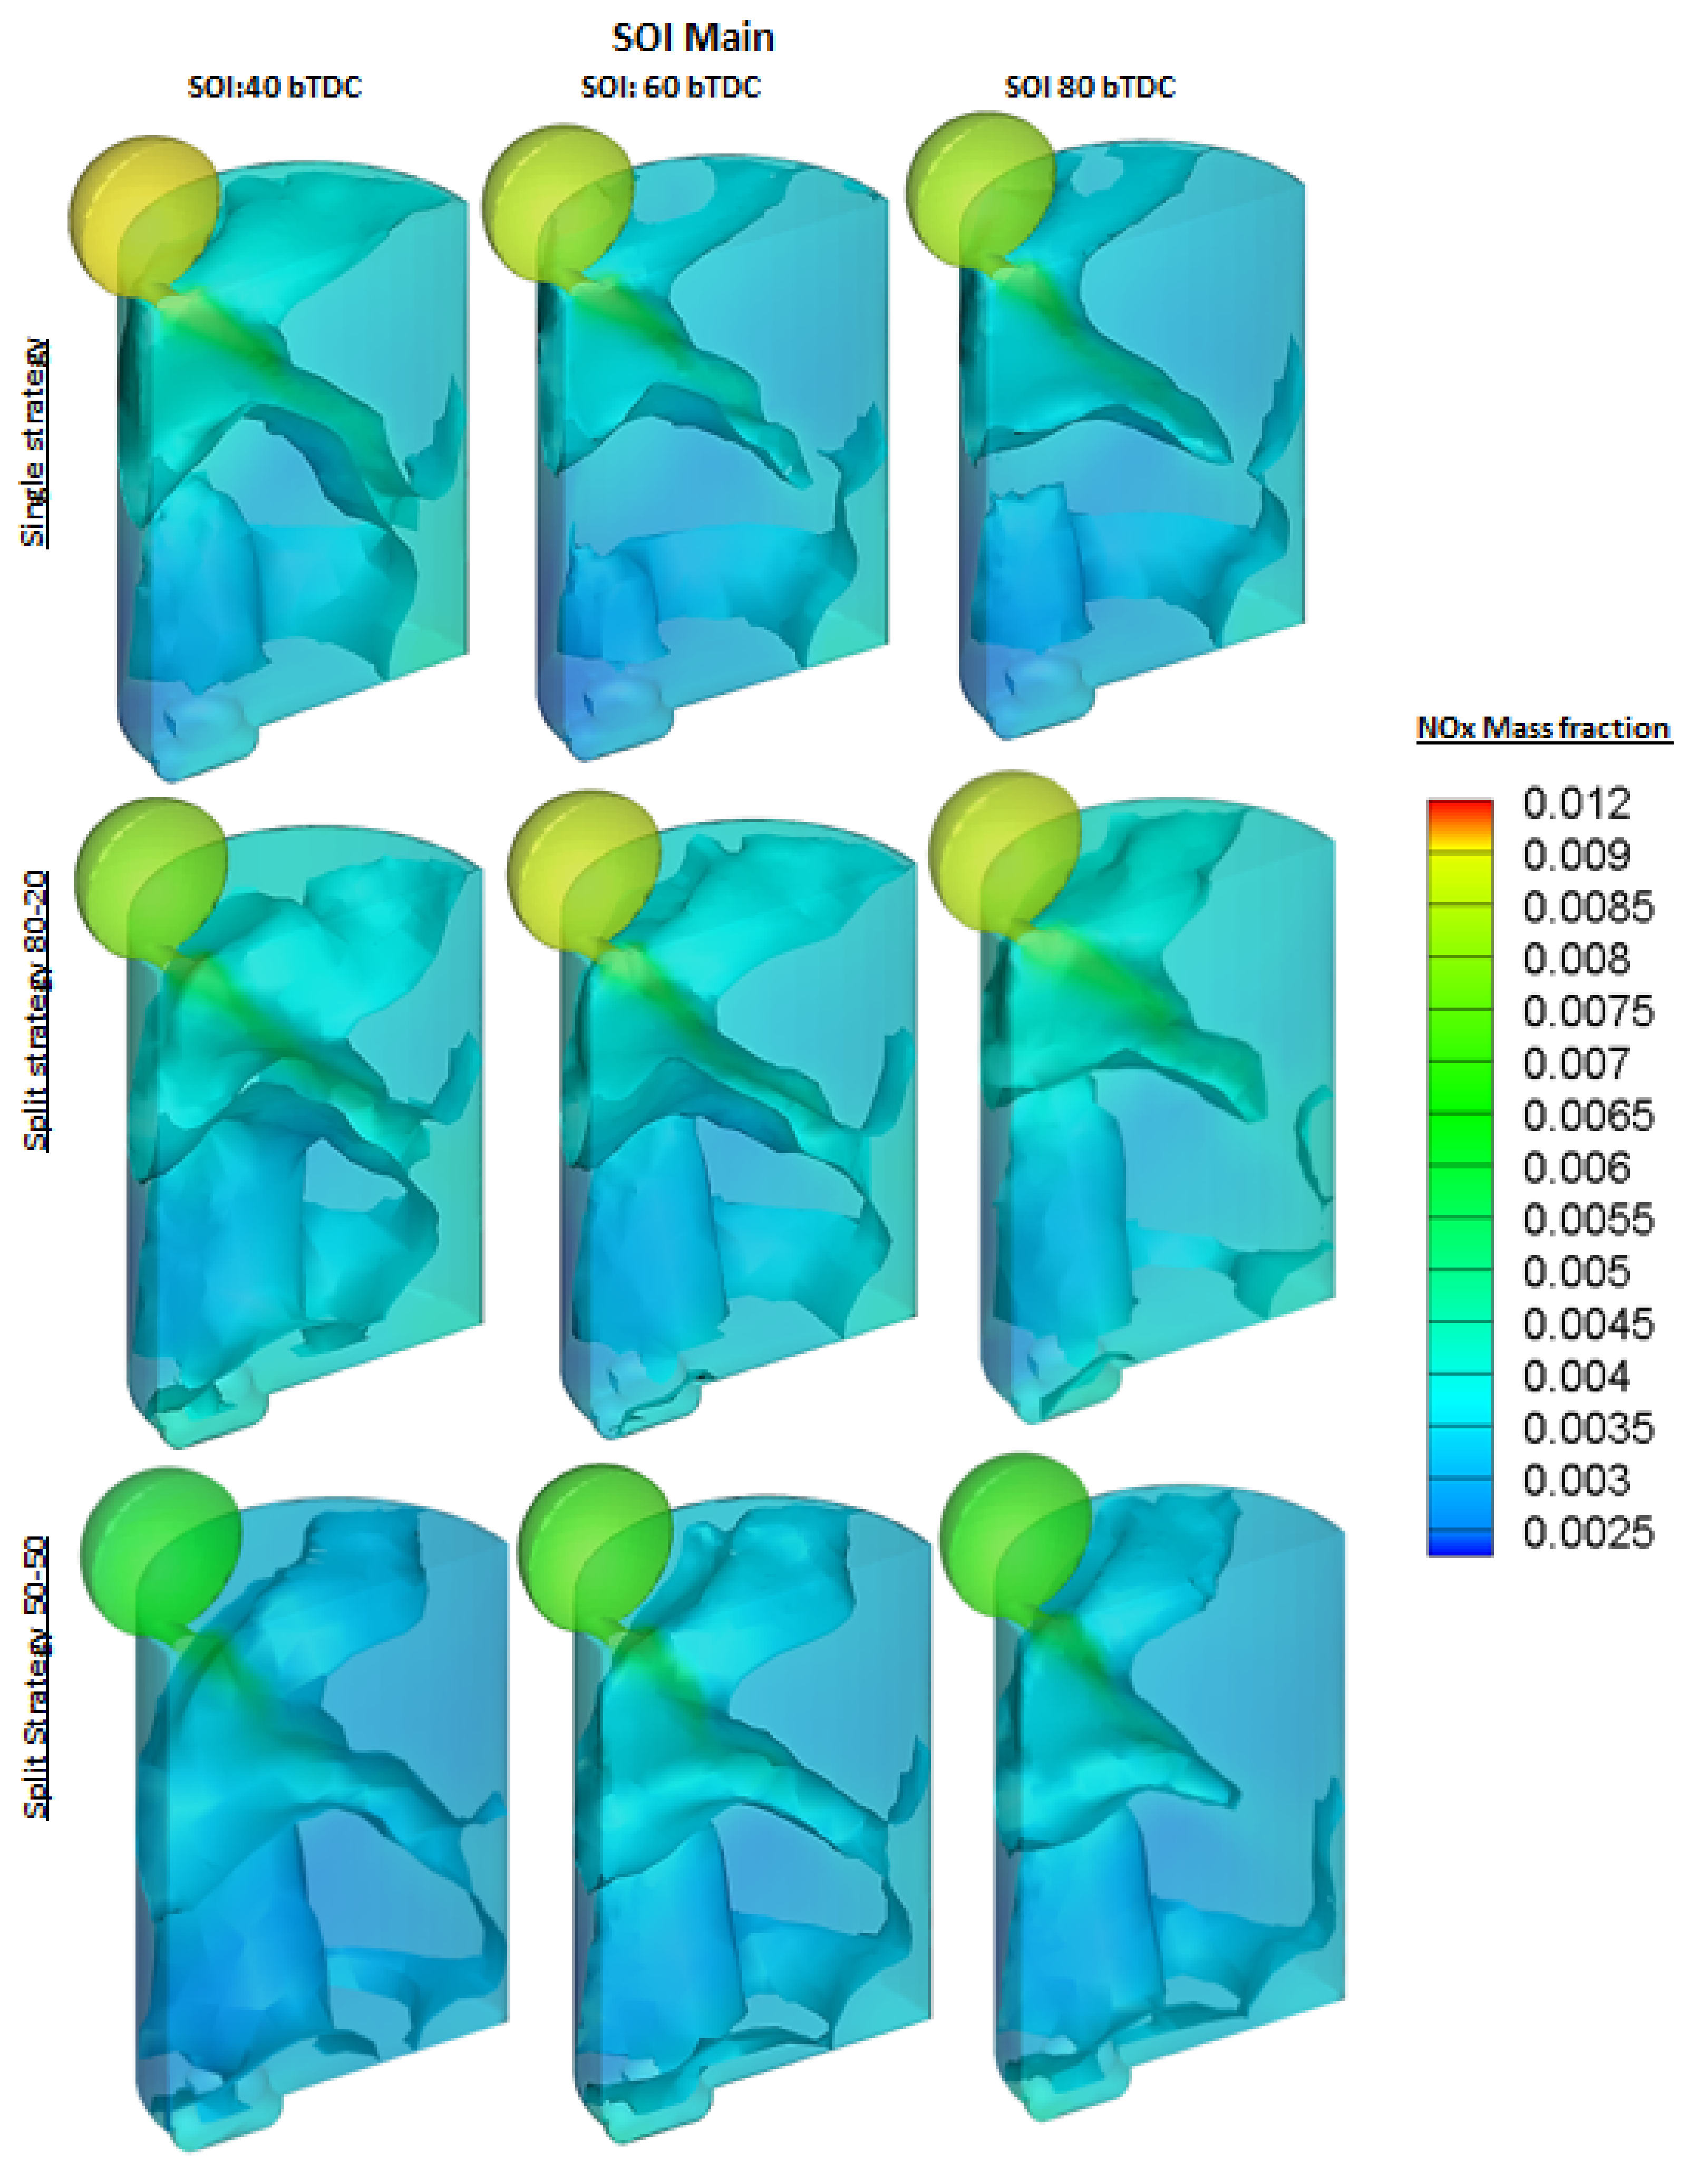
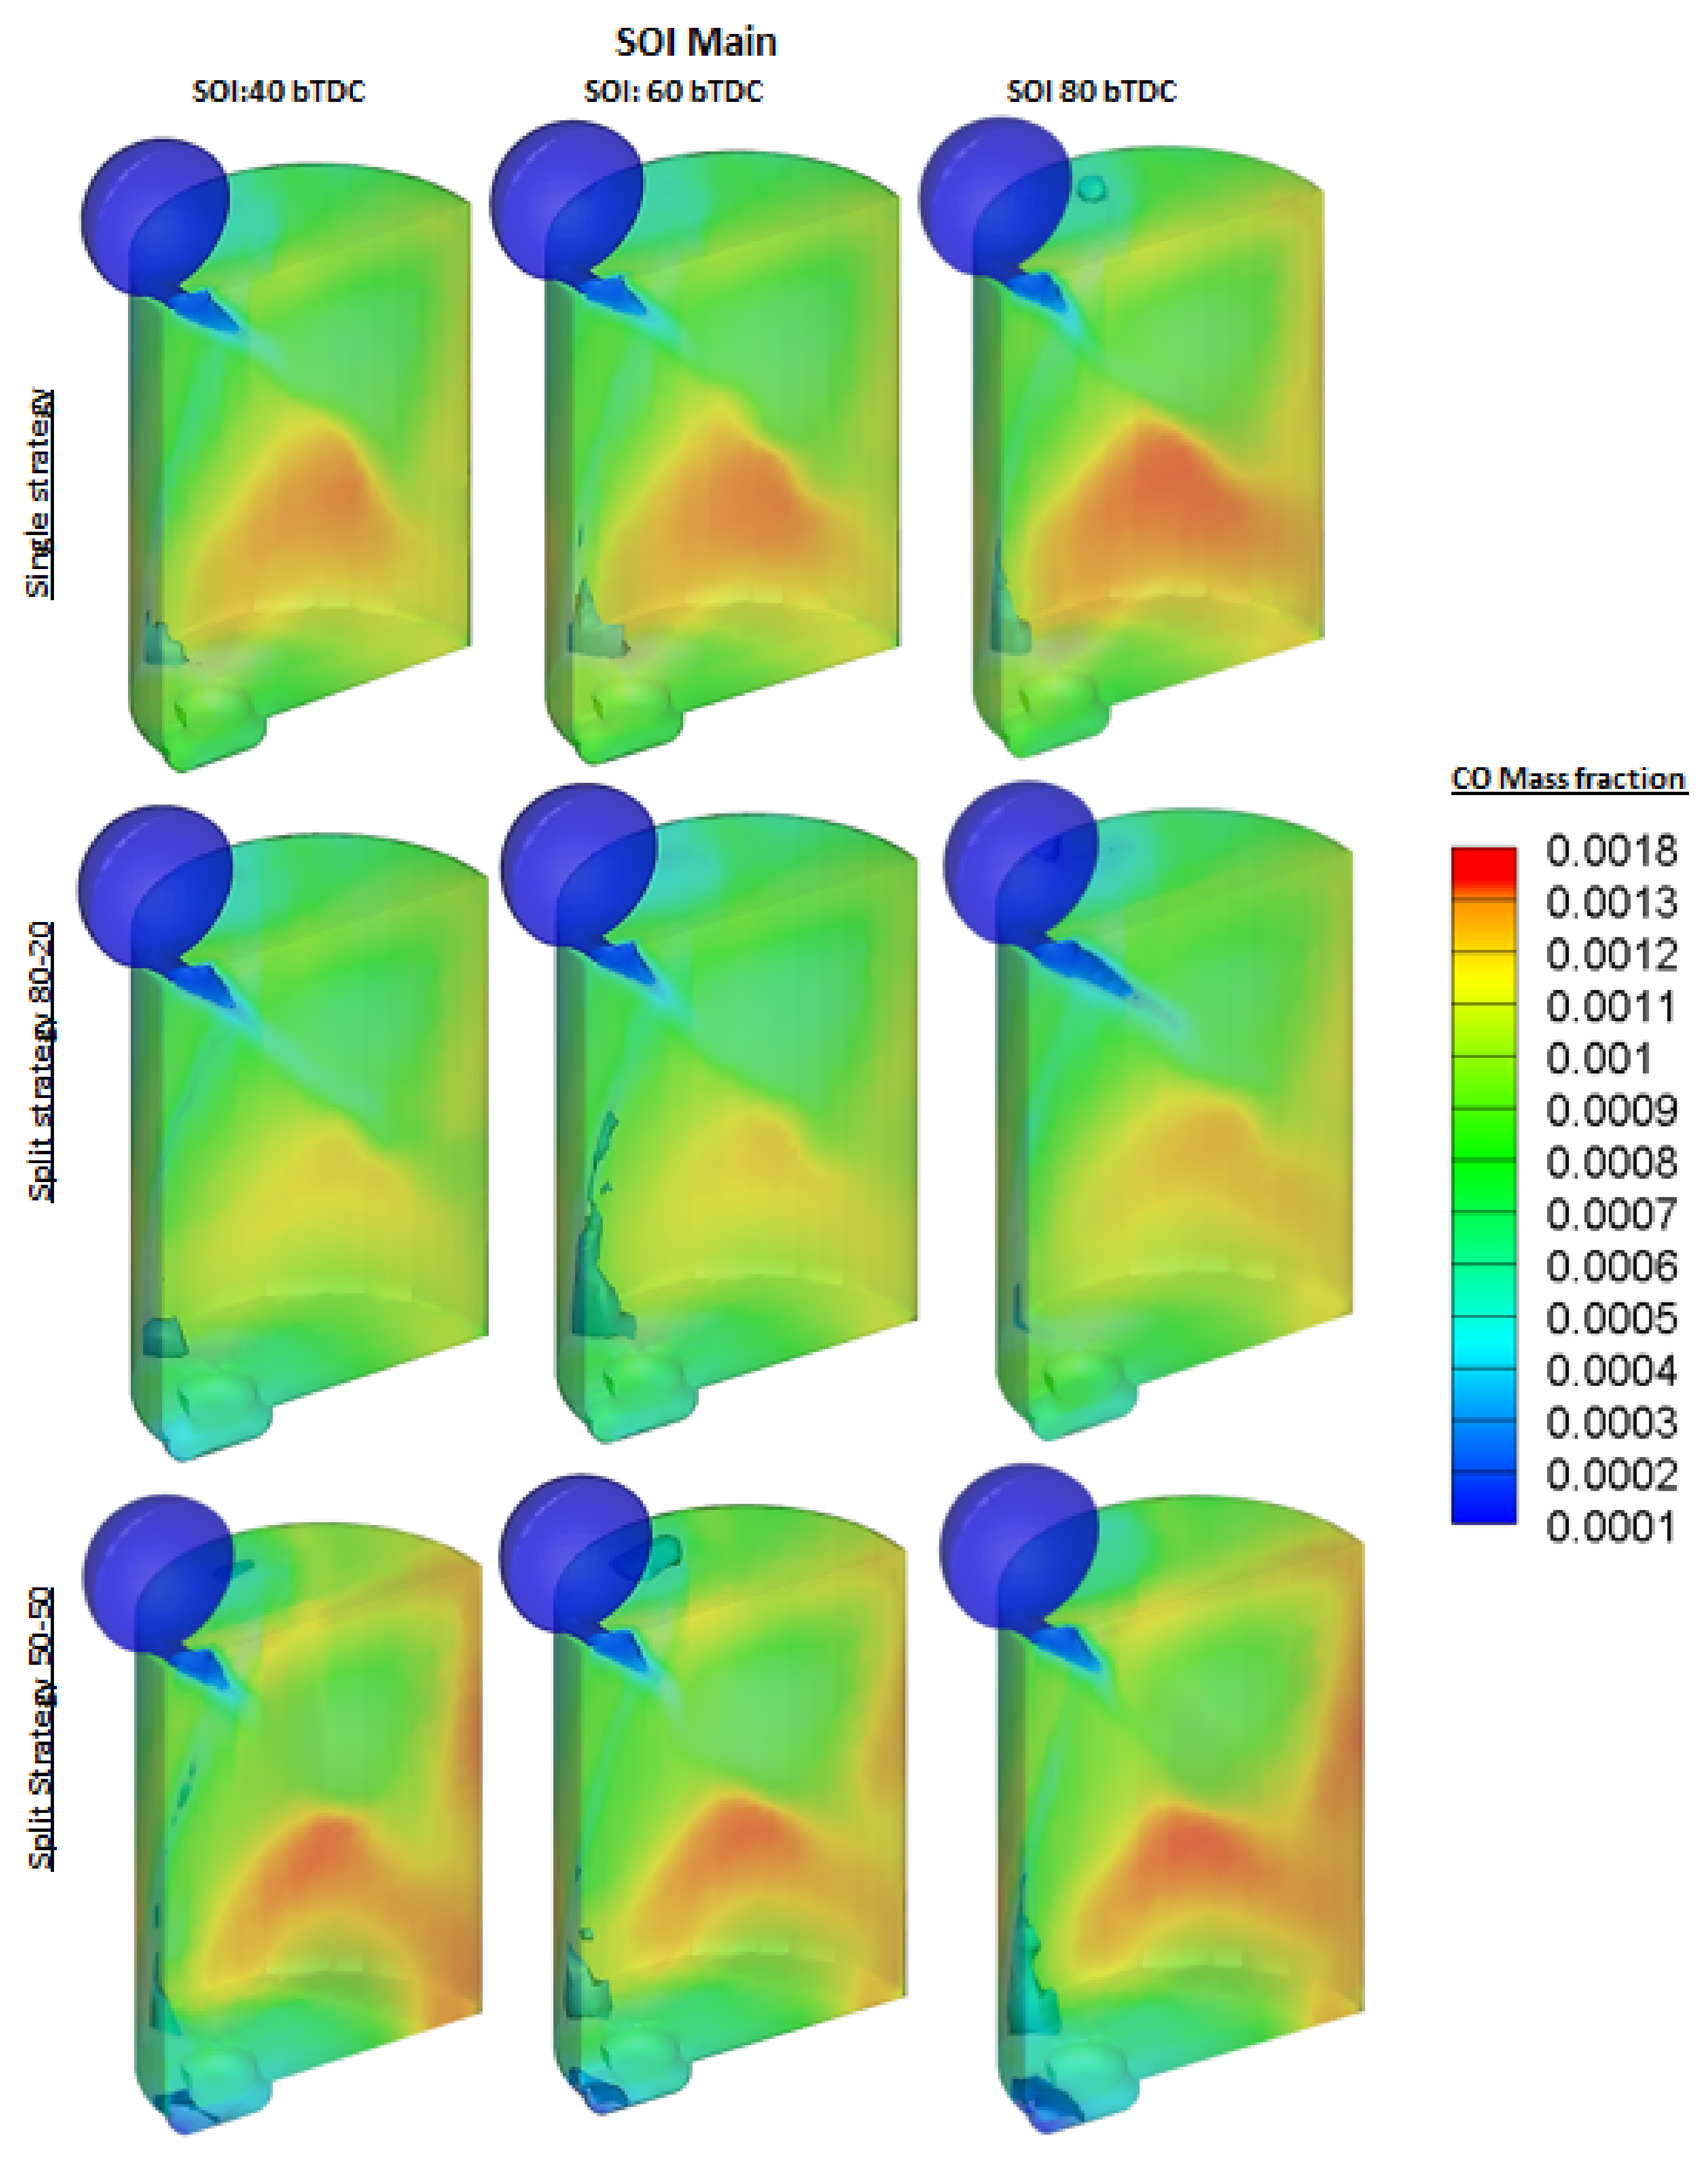
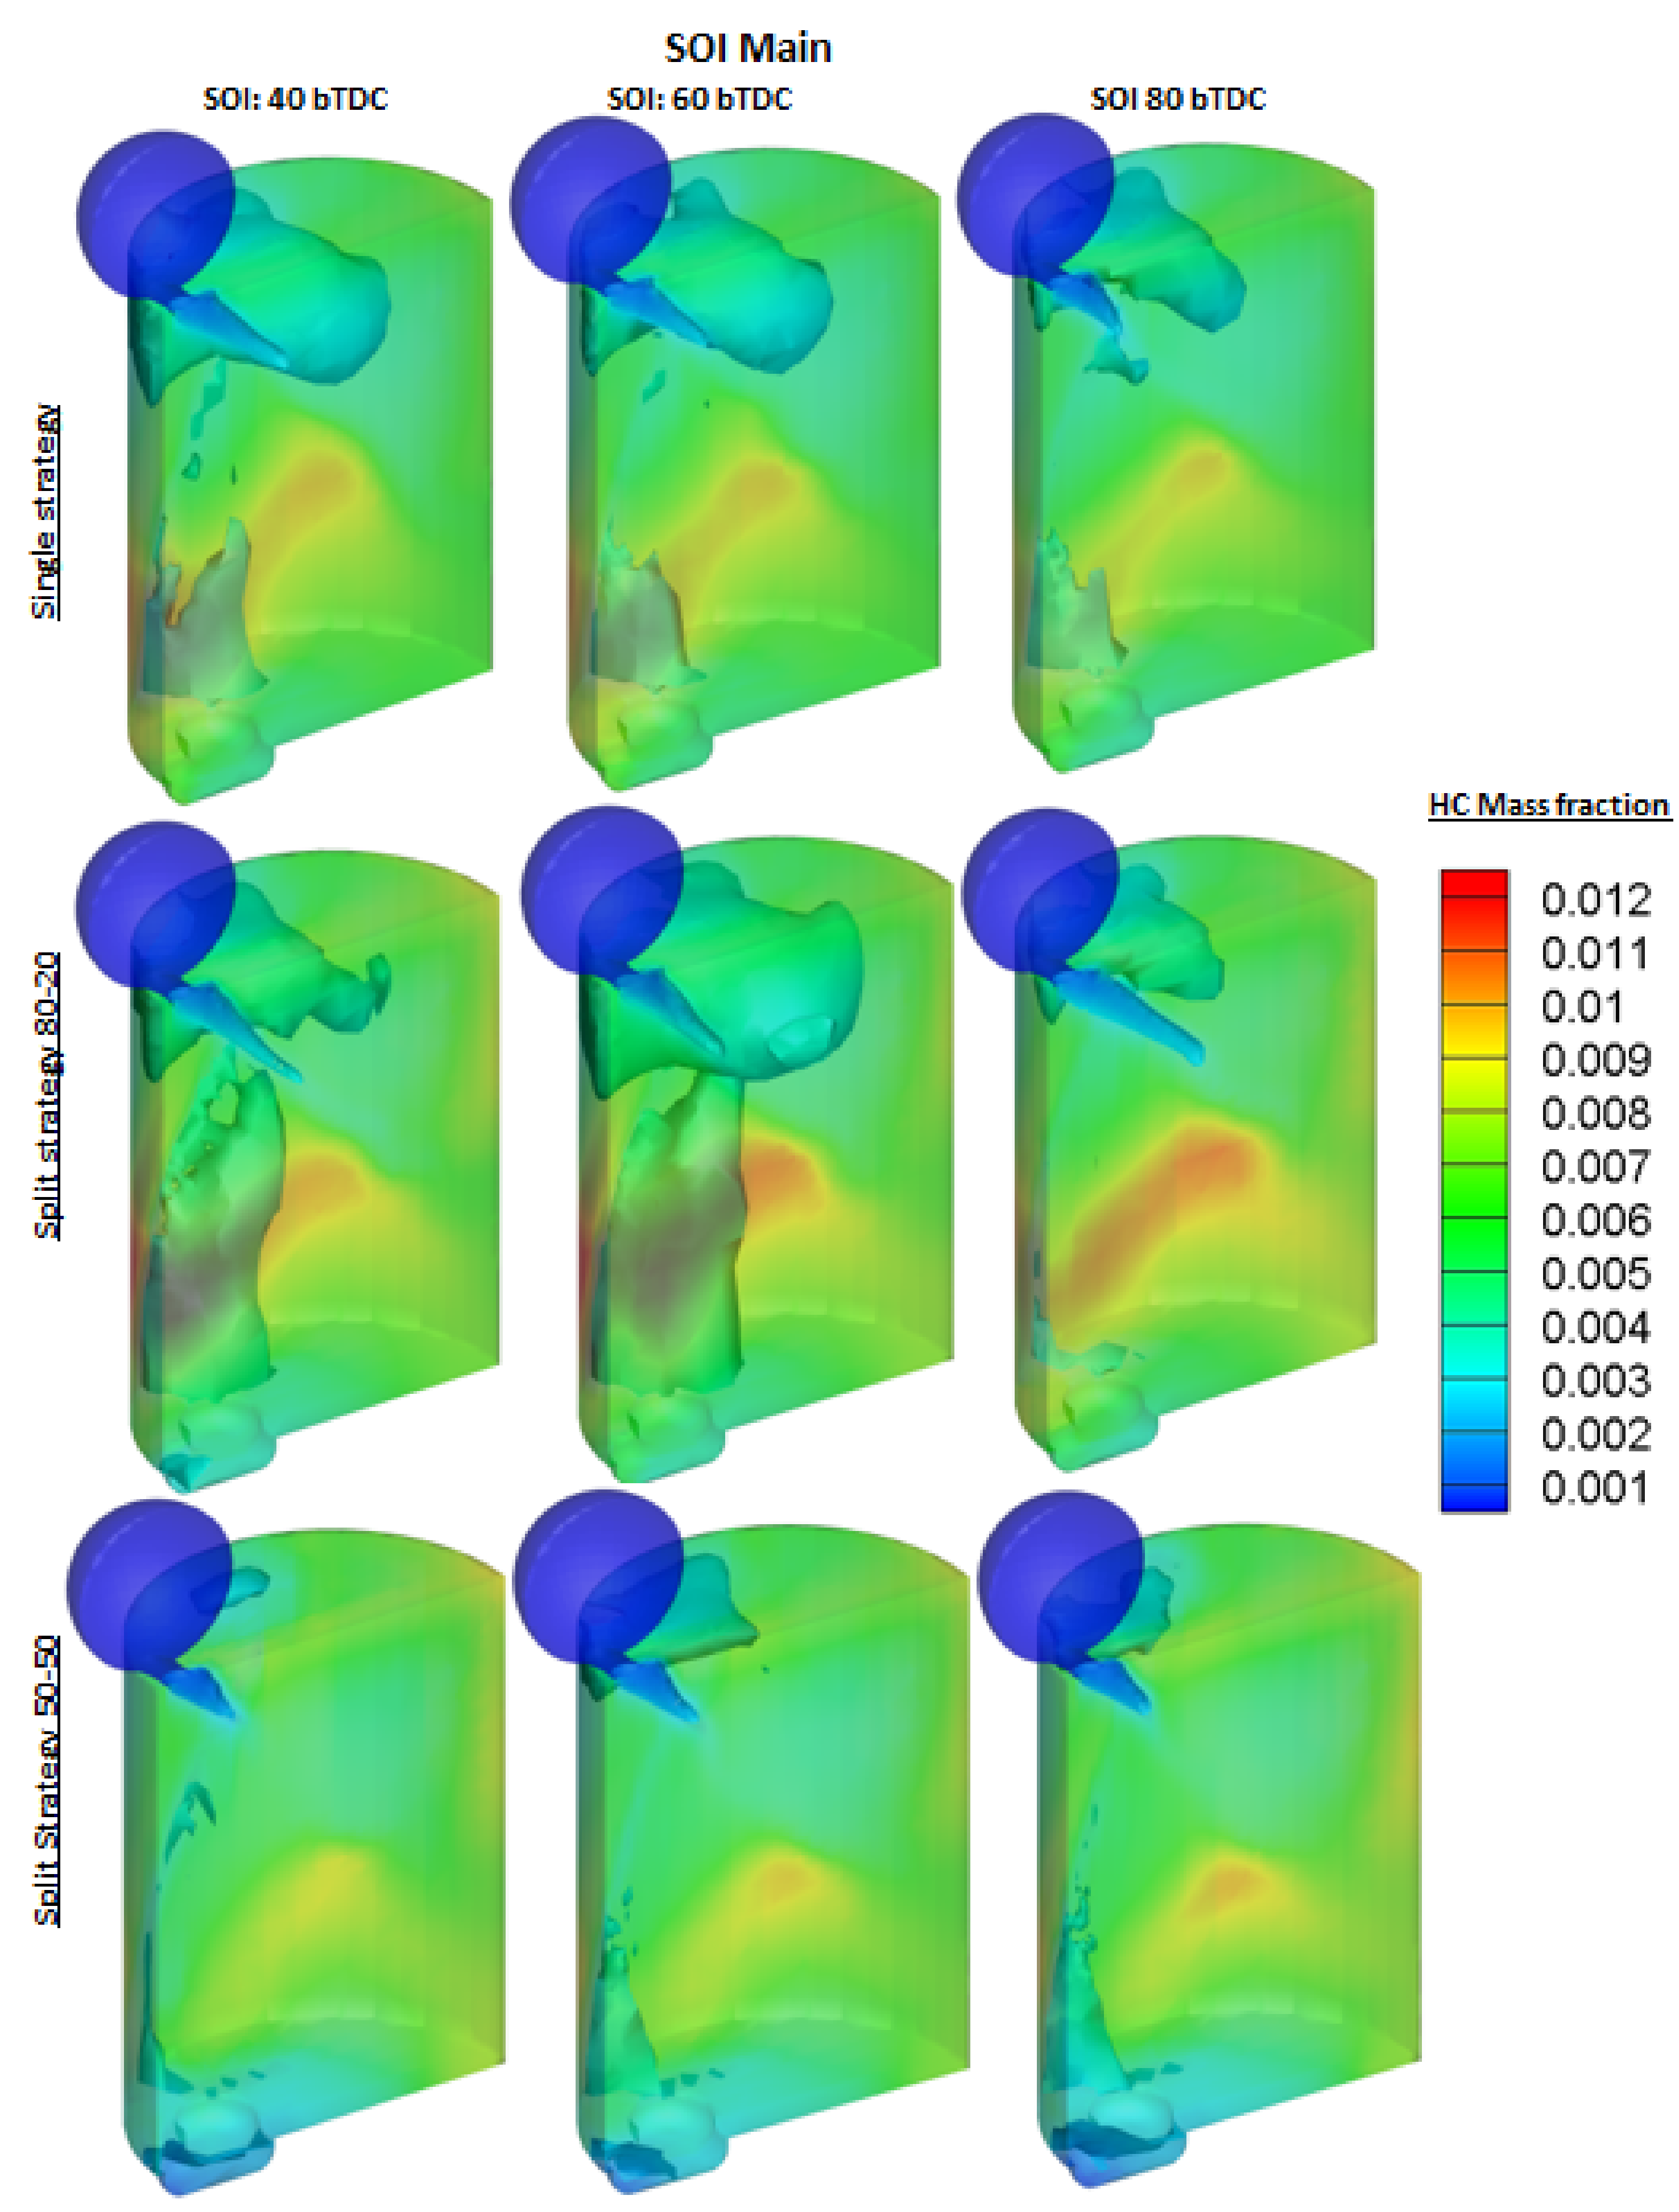
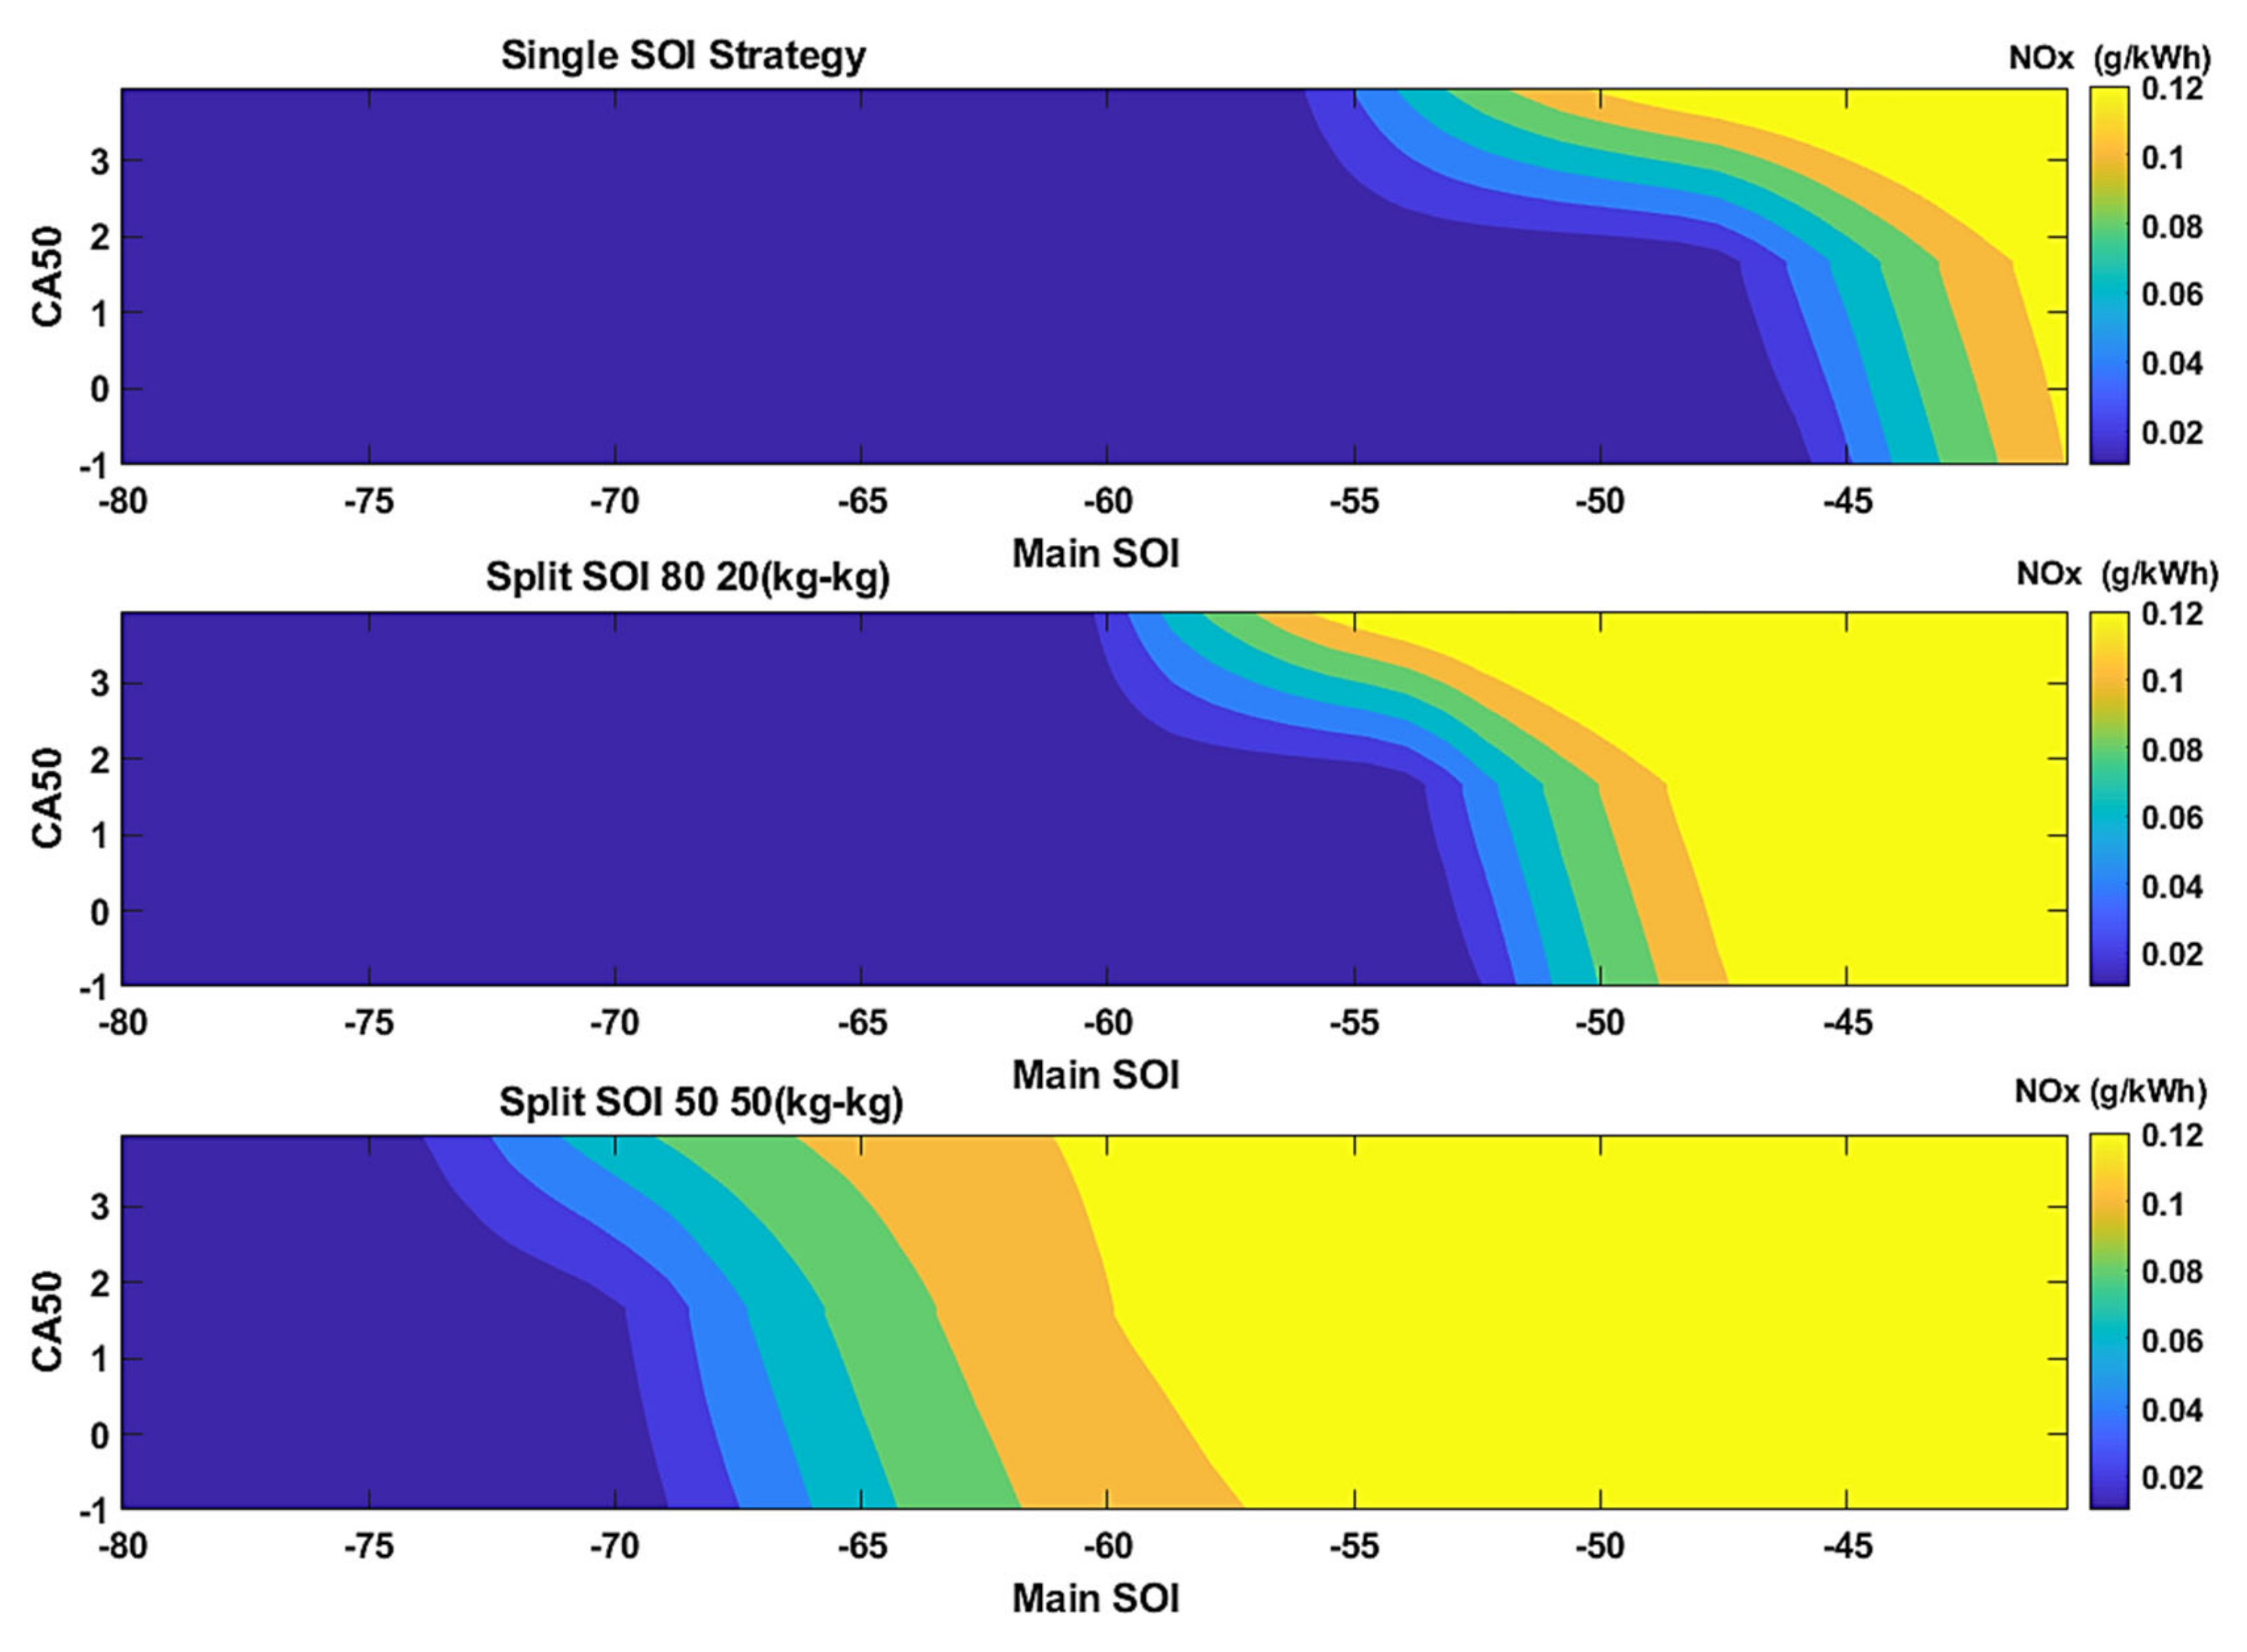
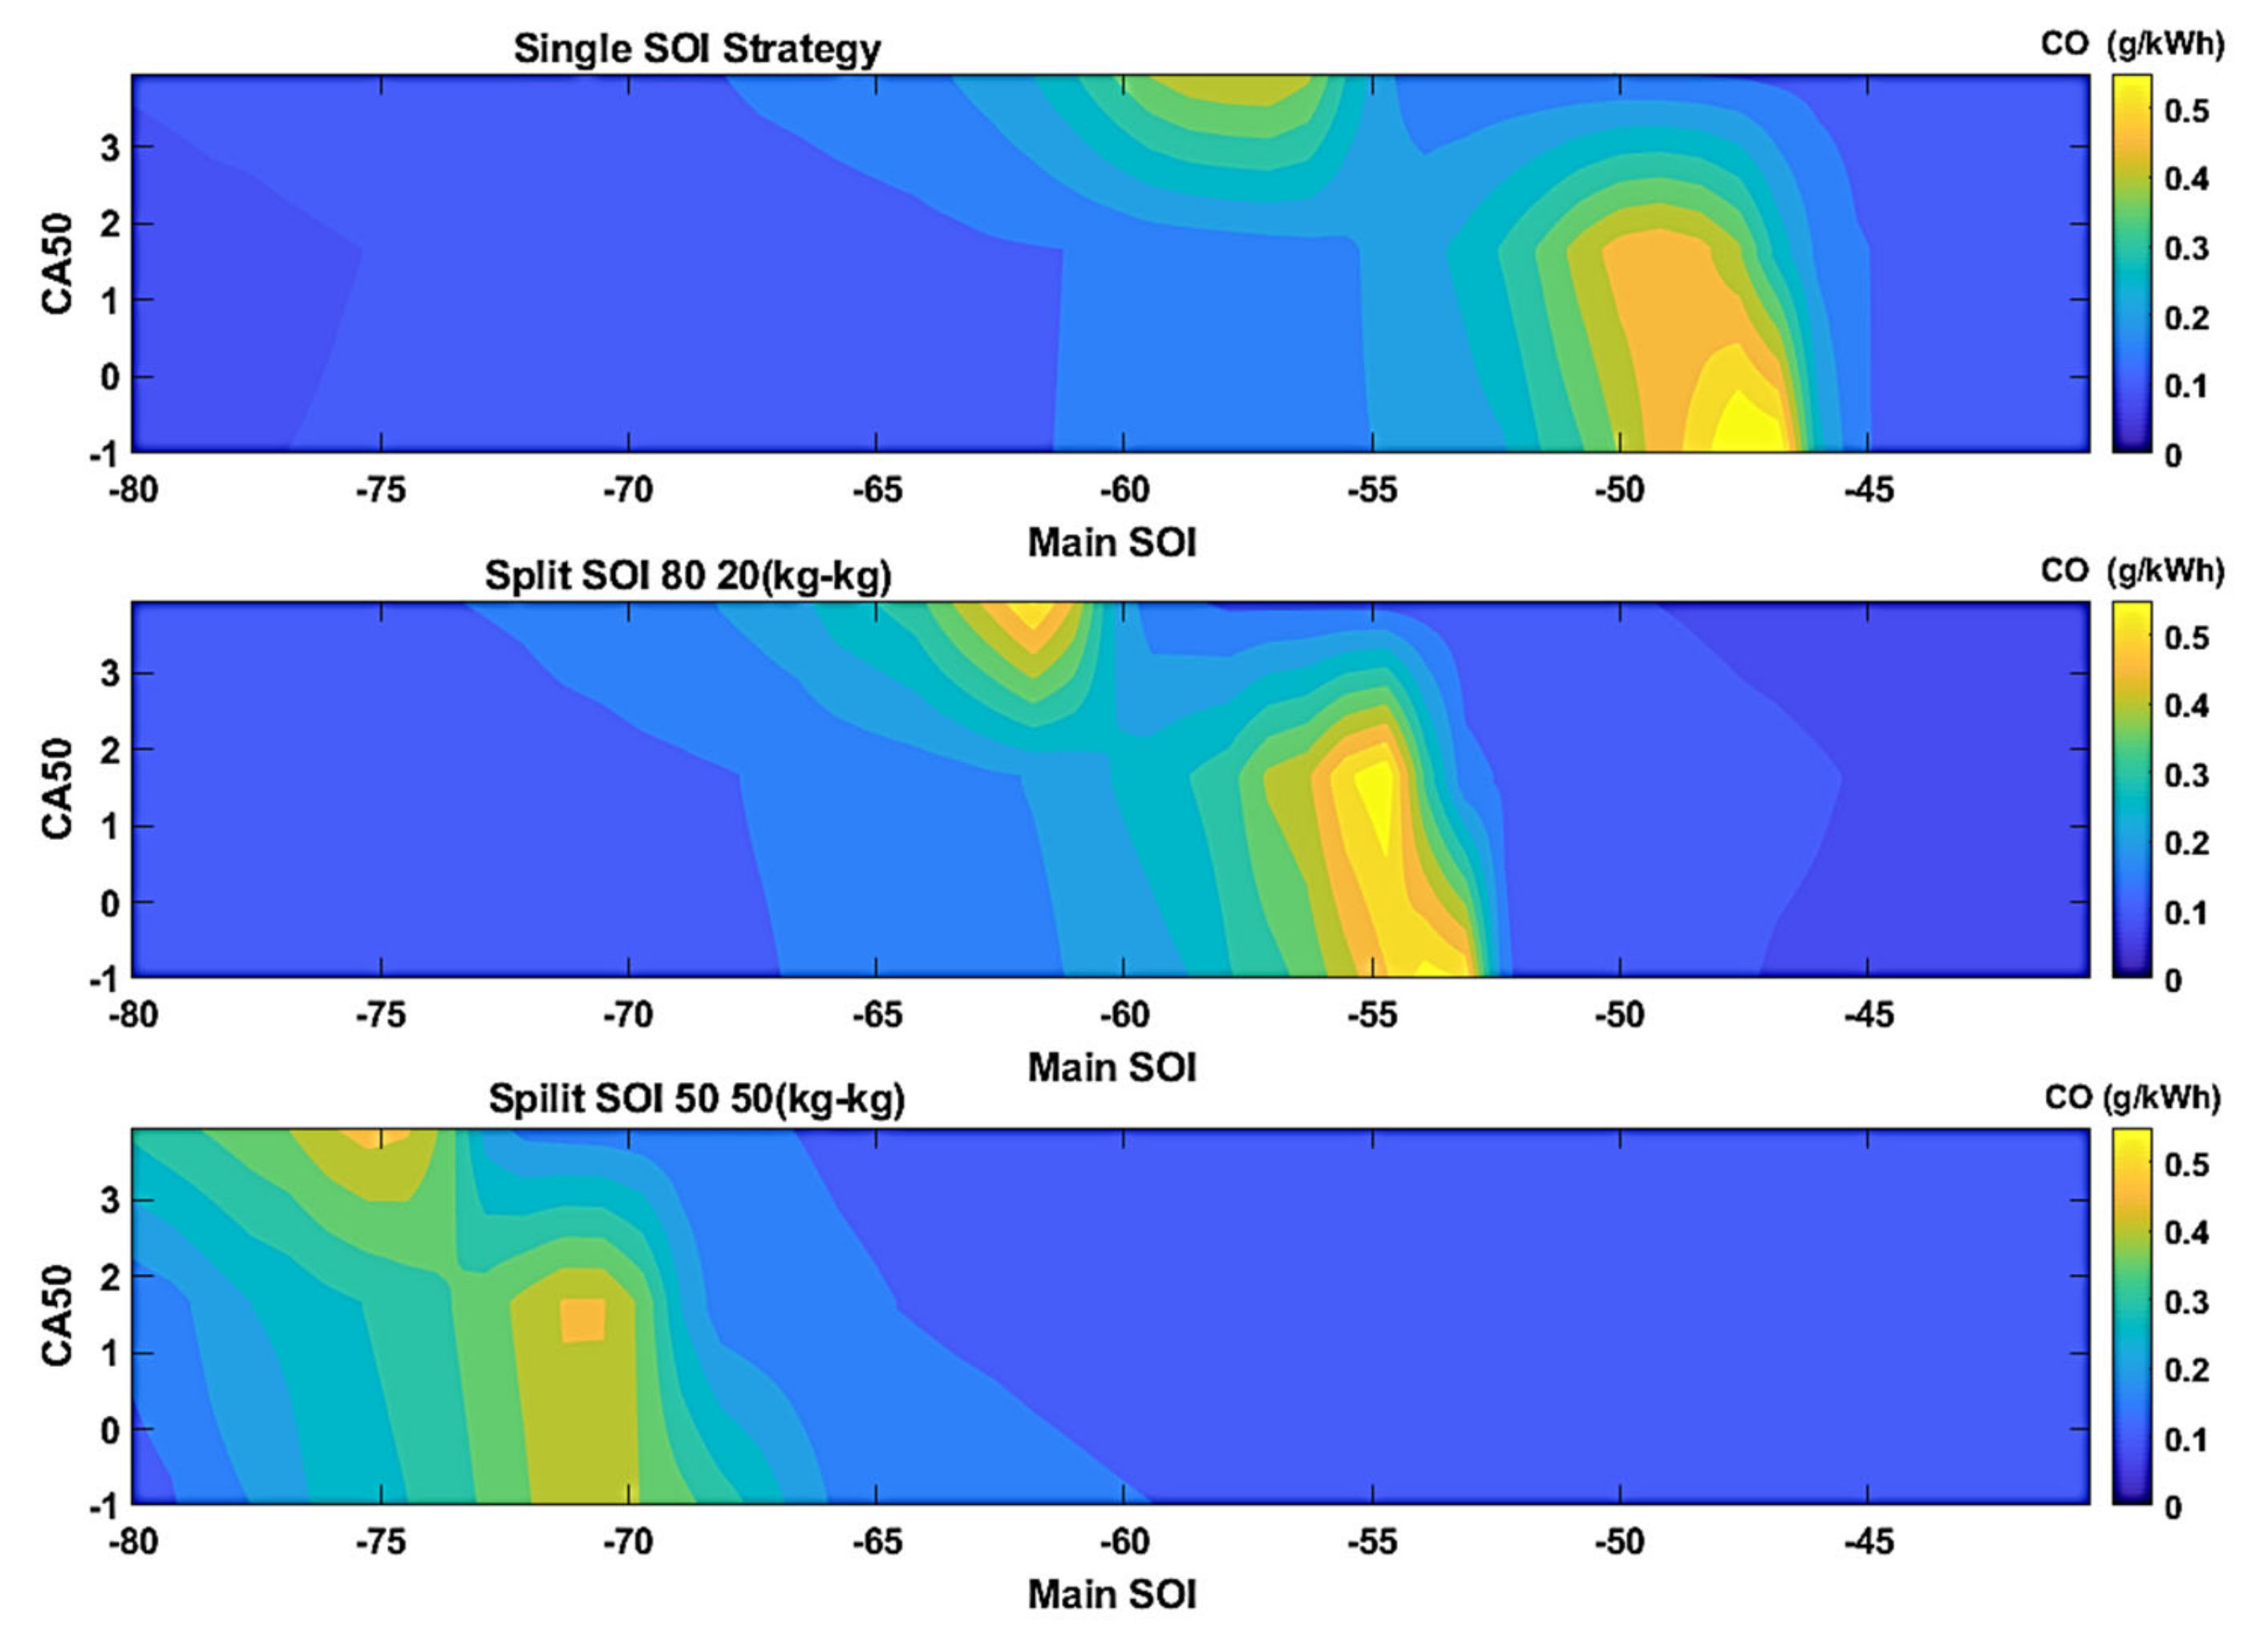
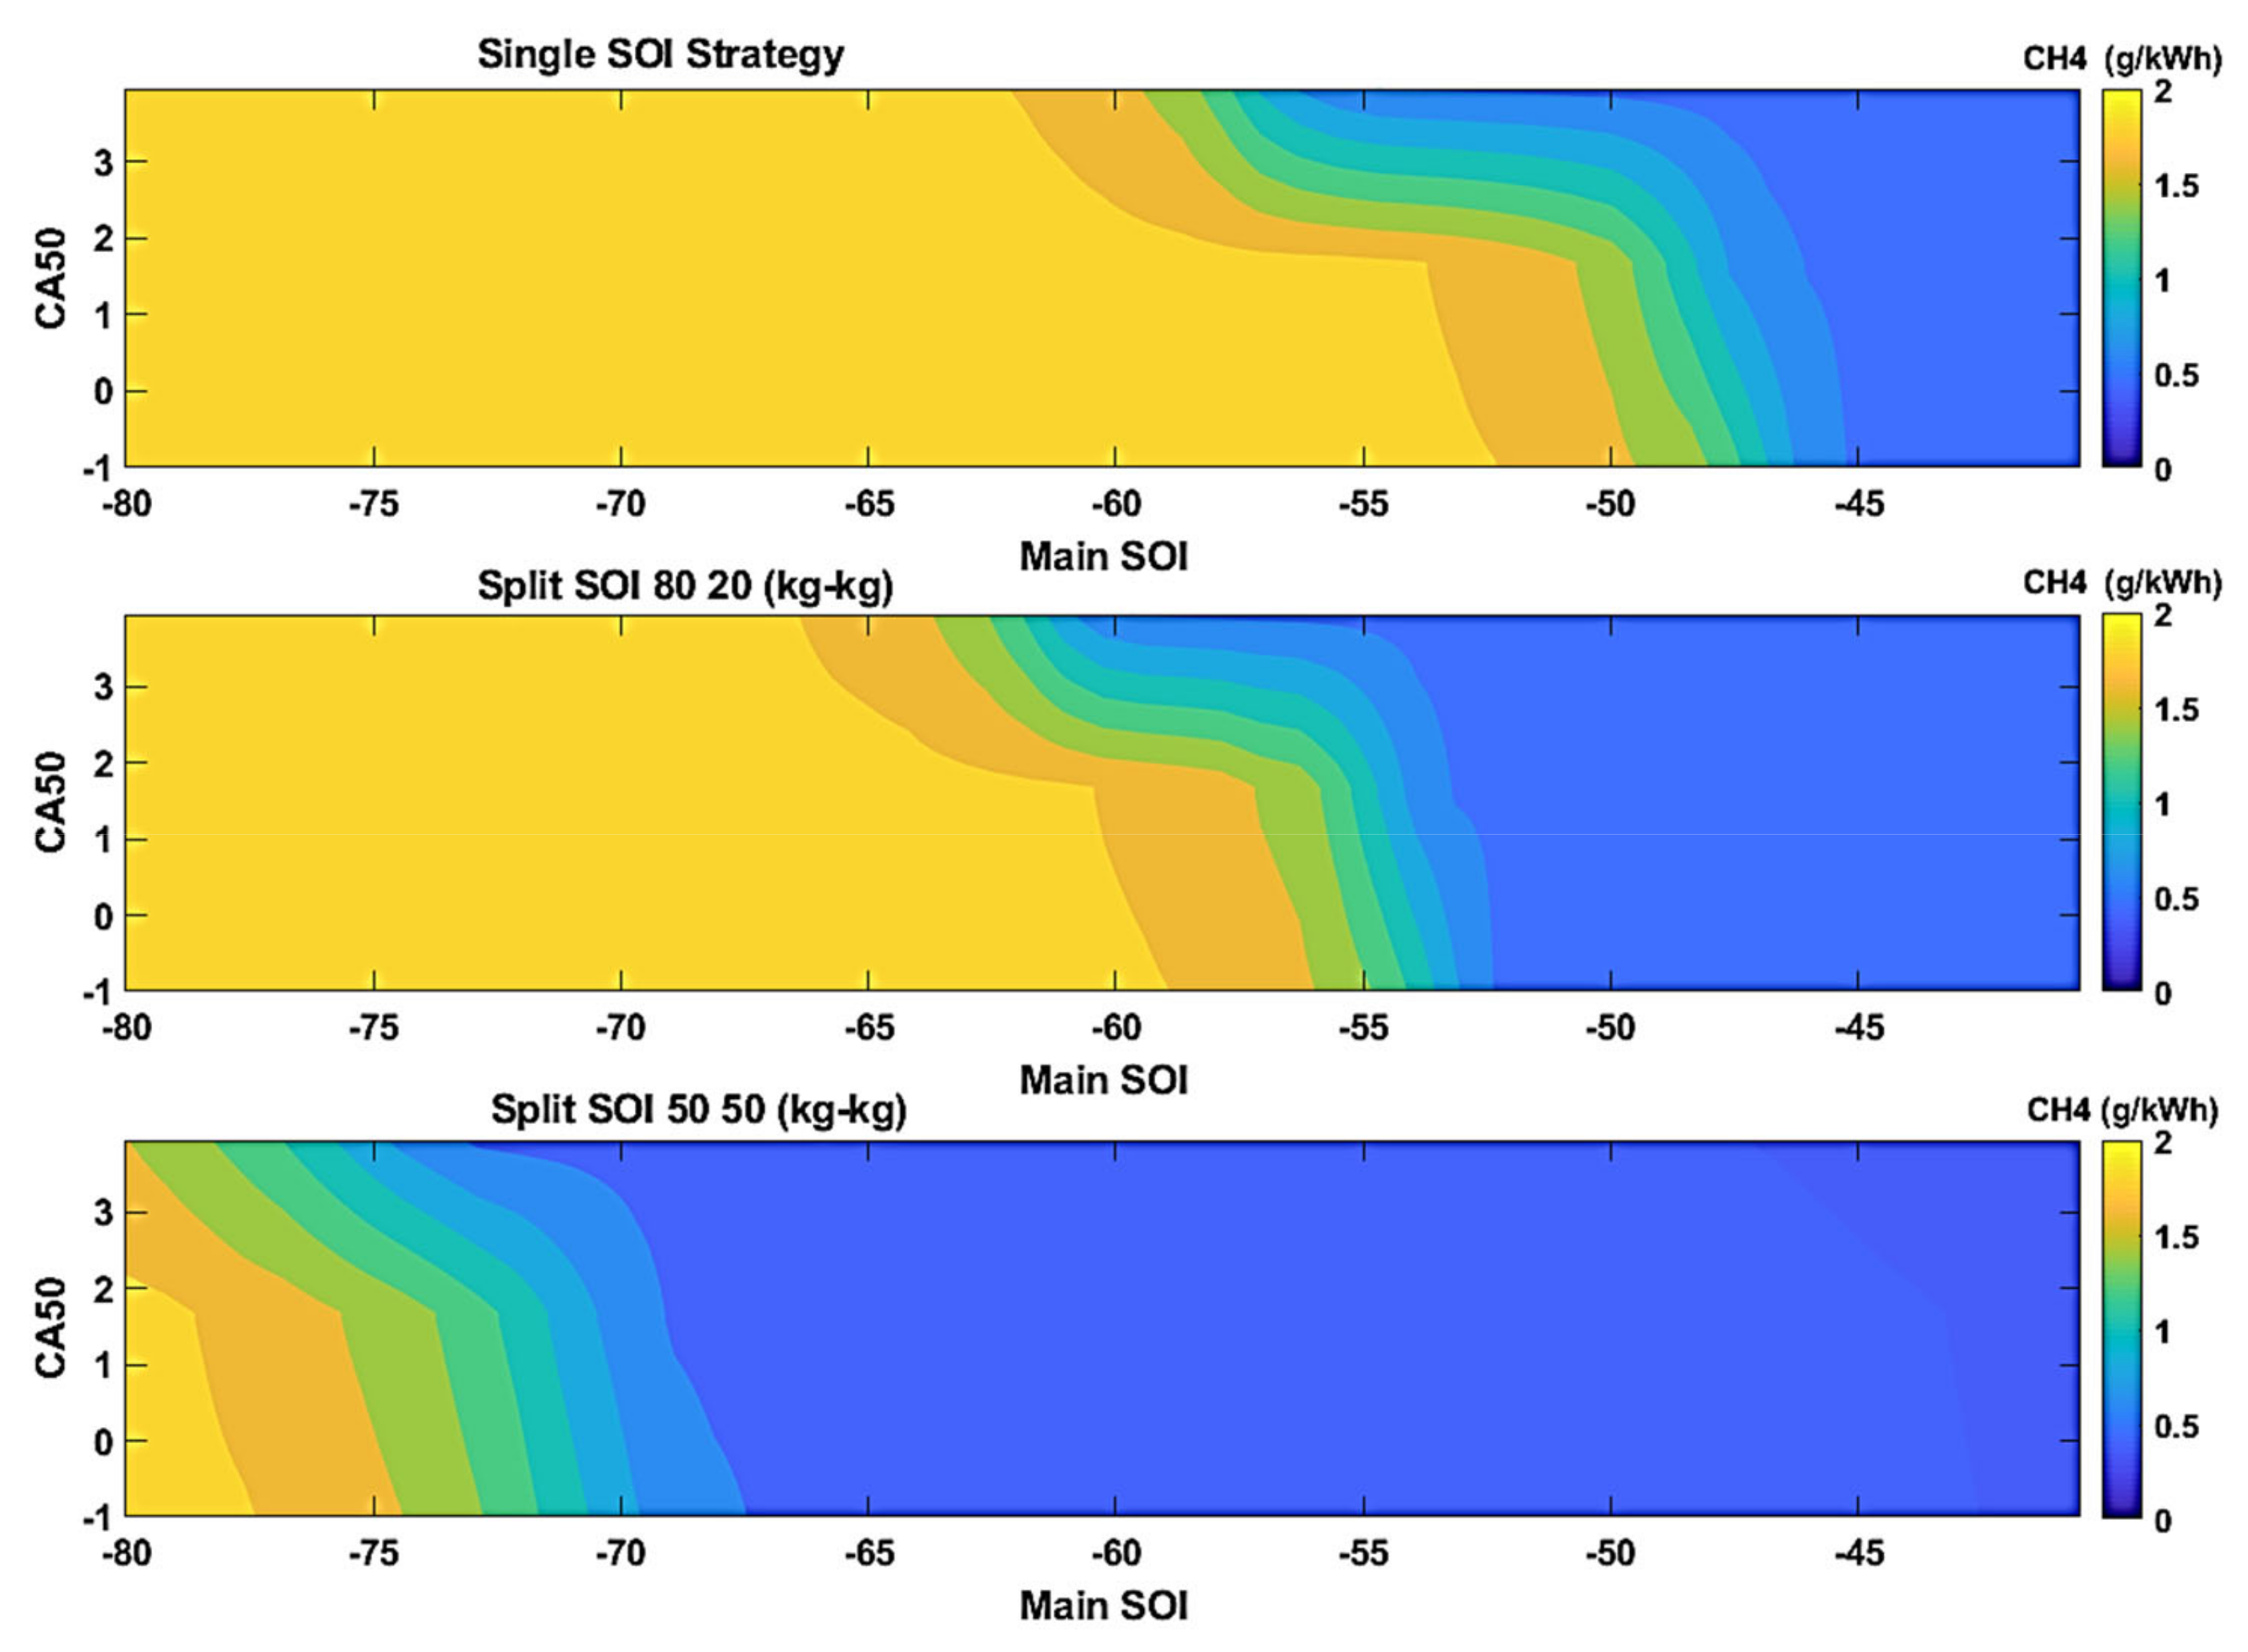
In the current study, effects of injection of HRF (dimethyl-ether) were investigated numerically on the performance of NG/DME RCCI engine. Combustion characteristics and emissions output besides engine efficiency have been studied in various start of injection (SOI) in single and split injection strategy. In all studied cases, total input energy kept constant at 485 J. A computational fluid dynamics (CFD) model of engine was used in CONVERGE (Convergent Science, Madison, WI, USA) with coupling in Chemkin Solver to investigate the effects of SOI on emissions, efficiency and combustion characteristics. In this research modeling, chemical kinetic reactions of fuels were modeled with a set of 893 reactions and 130 species mechanism where DME decomposition was also considered in this mechanism. Equivalence ratio is about 0.3 and ratio of HRF and LRF is 1.4 (kg-kg). Numerical results were validated with an experimental setup of a Ricardo E6/MS one-cylinder research engine equipped with a Commet MK.V pre-chamber. In three various strategies of injection, one stage, 50%-50% split strategy and 80%-20% split strategy, an optimum SOI was obtained based on numerically optimum output emission. Investigation on injection strategies based on emission performances for each applied strategy and optimum injection angle were obtained in this research.

2. Numerical Model

As mentioned, CFD model in CONVERGE Studio was used to simulate engine combustion and emissions. Providing a computational fluid dynamic model in converge needs to apply various setting on this software based on experimental model properties such as initial conditions and input variables. Tools and methods, computational grids and solver setting were described in this section.

2.1. Computational Model, Tools and Methods

Experimental setup of this study consists of a one-cylinder research engine, Ricardo E6/MS which is equipped with a Commet MK. V pre-chamber (Ricardo plc, Shoreham-by-Sea, UK); based on this experimental setup, the numerical model of this engine was used during CFD modeling. Specifications of this engine are presented in Table 1; according to this table compression ratio of this engine is 17.2, considering pre-chamber. The ratio of pre-chamber volume to total volume is about 0.54. Other properties of the engine such as inlet valve close (IVC) and exhaust valve open (EVO) are also shown in Table 1.
Geometry of this engine was created as Figure 1; according to this figure, close cycle modeling was used to simulate combustion, where modeling was performed from IVC to EVO and are from 144 before top dead center (bTDC) to 144 aTDC. CONVERGE Studio as a CFD solver was used with coupling with its internal Chemkin solver to simulate combustion and emissions. It was assumed that low reactivity fuel with air spread in all volume of cylinder and pre-chamber before injection of HR fuel, which is DME in this research. Start of injection (SOI), injection duration (ID) as well as injection strategies are variables in numerical simulations. Table 2 shows injector specification of the engine and this injector’s embedded areas are also shown in Figure 1.
As illustrated in Figure 1, to reduce the calculation time of simulation, half geometry of cylinder considered with three holes of injector (Nozzles).
Conversion of mass, momentum and energy besides species and passive transport equations were solved during modeling with CONVERGE Studio. Combustion was modeled with SAGE model, whereas a set of CHEMKIN-formatted input files was used to model detailed chemical kinetics. CVODES solver (solves initial value problems for ordinary differential equation (ODE) systems) were used in the SAGE solver modules [23]. To have higher calculation speed, to this model were applied above 600 Kelvin and HC mole fraction above 10−8. Temperature and equivalence ratio bin size for solving SAGE equations between neighbor cells were adjusted to 5 K and 0.05, respectively. Chemical resolve process was also limited in temperature changing more than 2 K. Emission simulations such as soot has been done by Hiroyasu and Kadota (1976) [31] and Zeldovich NO model introduced in Heywood (1988) [32]. Kelvin-Helmholtz model in conjunction with the Riley-Taylor model (KH-RT) were used to model fuel spray droplets atomization. The KH model is based on the wave model and, in fact, is used to predict the first break-up of droplets, and for predicting the future breakup of the droplets the RT model is examined along with the KH model [33]. DME is injected from a 6-hole injector in different strategies, which are presented in Table 3.
The fuel droplets and their evaporation phenomenon were extremely influenced by in-cylinder temperature, so temperature effects should be considered in this process. To do so, Frossling correlation model was used. This model worked based on droplet size during changing from liquid to vapor, as researched by Amsden 1989 [34]. Drop wall interaction was modeled with rebound/slide model, which was modified by Manuel et al., (1991); this model includes two impingement regimes, rebound and slide, based on the Weber number [35].
A No Time Counter (NTC) collision model was used to model droplet collision ad coalescence in spray modeling. This method is an alternative to O’Rourke’s numerical collision scheme, which is the No Time Counter (NTC) method of Schmidt and Rutland (2000). A direct Simulation Monte Carlo (DSMC) calculation is fundamental to the NTC method, which is used in gas dynamics. The NTC method involves stochastic (randomly determined) sub-sampling of the parcels within each cell. This potentially results in much faster collision calculations [36].
Combustion quality and thermodynamic properties were affected with heat transfer between chamber and pre-chamber contents and also walls heat transfer influences. According to this phenomenon, different effective factors were modeled such as flow turbulence, wall heat transfer and gas density change. Considering density and Prandtl number in each step of solving was used to model heat transfer between wall and turbulent flow [36].
Figure 2 shows the diagram of in-cylinder chemical-kinetic solver setting that was explained above.
With CONVERGE Studio’s ability of autonomous mesh generation, mesh creation was done in each time step of solution according to embedded sections, which are pre-chamber, head, throat and pistons as boundaries and nozzle as in flow embedded area in this modeling.

2.2. Solver Setting

Turbulence modeling was done with standard k-epsilon model. All settings for this modeling were done in CONVERGE Studio solver setting. Engine speed was kept constant at 1200 rpm, water cooling system temperature was assumed to be 360 K and temperature of cylinder wall was set equal to 430 K, which is 70 K higher than coolant water temperature. Piston surface and cylinder temperature head was considered at 530 K.
Natural gas and dimethyl ether as low reactivity and high reactivity fuels were considered with CH4 and CH3OCH3 chemical formula, respectively. Presence of in-cylinder reactions and species is required to import a set of chemical reactions and species to CONVERGE solver setting. In previous research conducted in 2012, various mechanisms of DME and NG were used, and a set of 350 reactions and 73 species were used to model combustion in an RCCI NG/DME engine [17]. Flame modeling of DME and NG burning was done using a mechanism of 893 reactions and 130 species by Reuter et al., in 2018 [31], where they also used this mechanism for their counter flow flame modeling of natural gas and DME burning [32]. In the current research, this mechanism, i.e., 893 reactions and 130 species, was used in modeling combustion of DME and CH4. This mechanism is also related to GRI 3.0 where some heavy hydrocarbon burning was used in this mechanism. Nitrogen oxides (NOx) and soot modeling were performed from CONVERGE Studio solver setting.
In all studied cases total input energy was kept constant and total in-cylinder mass was 0.223 g of fuel air mixture. As stated, equivalence ratio for all cases was0.3 and ratio of HRF to low reactivity flow was 1.4. Moreover, in addition to Table 1, which illustrated engine operational condition and specification during experimental setup, Table 4 also shows more detail of the experimental engine’s operational condition during data collection, which was also used for numerical solver setting.

2.3. Validation of Numerical Model

Ricardo engine with its tabulated specifications in Table 1 has been used to perform validation of numerical results. Validation of numerical data was done with a test case of specific operational conditions; in this experimental case start of injection occurred at 40 bTDC, where HRF injected into the pre-chamber. Natural gas was imported to the cylinder from air intake manifold. The angle of injected DME is advanced enough to have more homogenous mixture before SOC. The pre-chamber also has some effects on fluid flow to have more turbulence and, as a result, more homogenous mixture.
A 22 kW and 420-volt dynamometer mounted at the engine power output was used to measure engine output power. In-cylinder pressure data collection with less than 0.1 CAD errors was determined with a piezo-electric QC43D-AVL.
Crankshaft angles were determined using a magnetic rotary encoder (MES-2500D-T, Fotek) with a resolution of 3600 ppr (pulses per revolution) that was mounted on the crankshaft. To have a specific intake temperature and pressure, a heater and turbocharger were used to adjust intake temperature and pressure.
LRF pressure at the time of entry to intake manifold is 2 bar. A YAMTAKE flow meter was used to determine the mass flow of LRF and a λ sensor mounted on the exhaust manifold use to measure the air to fuel ratio (AFR) of the engine. A k-type thermocouple with less than 1% of error was applied to determine gas temperature.
The AVL-735 mass flow meter that is also compatible with the fuel temperature was used to measure the consumption of HRF. Figure 3 illustrates the schematic of the experimental setup and Table 5 shows the uncertainty values for experimental data.
In-cylinder pressure was used as a factor for checking validation of the numerical results. Figure 4 shows comparison between experimental data and numerical results of explained test case with acceptable diagrams trend and error. According to this figure, the maximum error for heat release rate (HRR) between experimental and numerical case occurred at peak point with about 10% error, where in other point errors is mostly near 6%. This error for pressure rise rate is about 6% in highest condition. Although these errors appear relatively high in some points, the trend of HRR and pressure rise rate (PRR) are in acceptable mode.
Engine exhaust emissions as pollutant also were investigated in this research; these emissions are NOx, CO2 and unburned hydrocarbons (UHC). In this way an AVL DiGas 400 was used to determine CO2, NO, UHC, O2 and CO. The specifications and resolution of AVL DiGas 4000 gas analyzer (AVL, Graz, Austria) are listed in Table 6, while Table 7 shows measured and numerical quantity of engine emissions in ppm unit.
According to Table 7, data order of measured and calculated exhaust emissions are the same and shows enough accuracy for emission modeling.

2.4. Error Analysis and Uncertainty

During experimental measurements and data collection there will be three possible errors in obtained and calibrated data. These main three errors can be categorized to errors related to devices and operators (humans), error produced with nonlinear device operations and data calibration errors. Existence of these error accuracy of the data is far from the reality, so in this study some statistical and mathematical methods were used to minimize error influences. The following three methods were used to minimize each categorized error.
(A)
Primary parameters error: pressure, temperature, mass flow of air, fuel mass flow and the species in the exhaust gases are categorized as the first groups of parameters that are measured directly. Strategy of test repeating strategy has been used with internal error analysis for them.
(B)
Secondary parameters error estimation: lambda and specific emissions or those that are obtained using the primary parameters considered as secondary parameters. The external error analysis strategy is used for secondary parameters.
(C)
Estimation of the error caused by cyclic variations: in measurement duration some parameters change in each cycle, in which these changes are due to a small deviation of the mean value that is generated due to cyclic variations. A repeating strategy of measurement was used to minimize this type of errors. To perform this minimization, the average of that parameter is taken as the value using 200 measure for each parameter. IMEP is one of the parameters of the third group.
Figure 5 shows diagram of error analysis of experimental setup data collection. Besides this diagram, Table 8 illustrates the accuracy and uncertainty of various equipment used in the experimental setup.

3. Results and Discussions

The results and discussion section of the current research has been categorized into four sub-sections: engine power output, thermodynamic properties, combustion characteristics and exhaust emissions.

3.1. Heat Release and Efficiency

IMEP was used as a factor for investigations on efficiency; according to this factor tabulated in Table 7 for each of the studied cases, there is better condition in single SOI strategies where maximum of it is allocated to 60 bTDC single SOI with 5.39 bar. In split SOI there is also different behavior according to mass of fuel injected in SOI main; homogeneity of fuel mixture also affects engine IMEP as an efficiency factor. Although homogeneity is effective, it seems that higher time between two SOI decreased IMEP, which was shown in Figure 6 with 50%-50% split strategy, has lower IMEP than the two other strategies.
Data about engine outputs such as gross work and total in-cylinder heat release are shown in Table 9. Decreasing of gross work and total heat release from single strategies to second strategies can be concluded from these data. In these characteristic there is also a peak in 60 bTDC SOI main. Minimum gross work is observed in 50%-50% case studies. Small changes of gross work and IMEP in variation of SOI changes in split strategies is due to fuel injection in the pre-chamber; in fact, using pre-chamber extremely damped the injection process effects that caused small effects of injection strategies.
Figure 6 shows results for injection timing strategy on gross work (J), total heat release (J) and IMEP. According to this, in single-strategy, higher performance, IMEP was considered as a criterion for efficiency, and it occurred that SOI started at 60 CAD bTDC. Further, lower total heat release was observed in this point, but higher gross work was allocated to this case test. IMEP diagram also shows that, among three various strategies, 60 CAD bTDC of SOI has better condition efficiency in comparison with 40 and 80 CAD bTDCof main SOI; single strategy also shows higher performance in comparison to the other two split strategies in all cases. Although lower total heat release was observed in 80%-20% mass fraction injection strategies, according to gross work and IMEP, lower IMEPs are for 50%-50% mass fraction injection strategies. The 60 CAD bTDC IMEP of single strategy is higher by about 1.8 and 2 percent than similar cases in the two other strategies. IMEP also was investigated in previous research. Jesús Benajes et al., in 2015, studied various fuel injection timing strategy in an experimental study on an RCCI engine. They found same trend as the trends of IMEP in Figure 6 in three various fuels in changing SOI from 30 to 20CAD bTDC. They also showed that this parameter is fuel-dependent against SOI change [19]. Poorghasemi et al., illustrated that advancing in SOI led to more gross work indicating efficiency in a numerical study of a natural gas/diesel RCCI engine [22]. Increase in indicated efficiency against advancing SOI was also reported in experimental investigation of Lifeng Zhu et al., where SOI was changed from 5 to 25 CAD bTDC. They studied various port injected fuels with n-heptane as high reactivity fuel RCCI engine [24]. Mobasheri et al., reported that various injection pressure led to different changes in efficiency but the trend of all cases is the same where advancing SOI increased IMEP [26]. This effect was also observed in Saxena M.R. et al.’s experimental research on a gasoline/methanol RCCI engine [27].

3.2. Thermodynamic Properties

In-cylinder thermodynamic properties such as temperature and pressure are described in this section. As mentioned before, in all case studies there was equal input of energy obtained from heating value of fuel mixture. Table 8 shows the in-cylinder thermodynamics properties for various case studies. According to this table, more advanced injection produced more temperature in single case studies at exhaust valve open (EVO); this increase is 8.3 k from 40 to 80 bTDC injection. The higher temperature is because of the homogeneity of mixture in advanced injection; in more delayed injection there is less homogeneity of mixture in the cylinder, and as a result, it produces lower temperature in some region of the cylinder. Figure 7 illustrates cumulative heat release (CHR) for various case studies in CAD. Advancing start of combustion occurred with advancing in SOI for all strategies where 50-50 percent strategy (Figure 7c) shows more advanced SOC.
In two-stage strategies there are different behaviors in comparison with single strategy injection; in 80%-20% strategy, highest temperature accrued in 60&20 bTDC injection strategy, as shown in Figure 8. EVO temperature shows different behavior against injection timing from single strategy to split strategies; more advanced SOI produces higher temperature in single strategy (80 CAD bTDC) where this point of main SOI injections in split strategies produces lower temperature at EVO. M. Nazemi et al., showed that in-cylinder pressure was increased against advancing SOI in single injection strategy of SOI timing in a gasoline/biodiesel RCCI engine; these results were observed also in this research [22]. In a gas/diesel RCCI numerical model of an RCCI that was investigated by Poorghasemi et al., it was reported more in-cylinder pressure in more advanced main SOI in 2017. This is similar to split SOI in another study [23], where Lifeng Zhu et al., reported more in-cylinder pressure during advancing SOI in an n-heptane/gasoline experimental RCCI work in single strategy, as reported in Figure 8 [25]. In Mobasheri et al., a numerical research done on an Iso-Butanol/Diesel RCCI engine, pressure increased against SOI advancing to a peak point and decreased after this point in three cases of various injection pressure; this study was on single strategy SOI timing [27].
Table 10 shows also maximum and minimum in-cylinder pressure and temperature; in all cases maximum pressure and its CAD of occurrence are the same and is 97 bar, which occurred at approximately zero CAD. Maximum temperature also occurred in this CAD. Single stage strategies produced higher temperature than the two-stage strategy; in all cases minimum in-cylinder temperature was observed at 50%-50% split injection with 80&20 bTDC case, which is 1916 k.

3.3. Combustion Characteristics

Start of combustion (SOC), second SOC considered as start of combustion, crank angle degree where 50 percent of fuel burned (CA50) and burn duration (BD) were investigated as combustion characteristics in this section. Advancing in start of injection led to advance in SOC but this advancement was not too high and was about 1.3 CAD from 40 to 80 bTDC injection change. Two-stage injections have advanced SOC in comparison with same main SOI in single-stage strategies; in 80-20 (%) 40&20 CAD of injection bTDC case, SOC occurred at 1.16 CAD bTDC, where this characteristic is about 2.1CAD bTDC in 80&20 injection case study. The ranges of SOC in 50-50 (kg-kg) cases is around 3.7 CAD bTDC, and those are 3.5, 3.7 and 4.1 CAD bTDC for three cases in this strategy. This is similar to SOC changes behavior in burn duration and also CA50. Table 10 shows combustion characteristics of each case study that examined start of injection strategies. It should be noted that burn duration was calculated from the difference between CA90 (crank angle degree where 90 percent of fuel burns) and CA10 (angle where 10 percent fuels burn). Approximate quantities of burn duration are presented in Figure 7.
Figure 9 illustrates combustion characteristics of each case, which represents the effects of start of injection on combustion characteristics. In fact, the data in Table 11 were depicted as diagrams in this figure; according to this figure 80%-20% split strategy allocated lower burn durations among two other strategies.
Comparing with previous research, Jesus Benajes et al., showed that in five various LR fuels advancing SOI from 20 to 35 CAD bTDC led to delay SOC from about 3 CAD to 21 CAD aTDC in low load, approximately from 2 CAD bTDC to 6 CAD aTDC in a change from 5 to 25 CAD bTDC of SOI in medium load and in high load [20]. Changing SOI from 7 CAD to 35 CAD bTDC in J.li et al.’s research on a gasoline/biodiesel fueled RCCI engine led to an advance of 10 CAD in SOI; trend of CA50 variation is incremental during this change of SOI [21]. In a numerical model of gasoline/diesel RCCI engine done by Nazemi et al., SOI advancing delayed start of combustion [22]. Poorghasemi showed that in medium load of a RCCI NG/diesel engine, advancing main SOI delayed start of combustion in a split strategy of injection [23]. An RCCI N-heptane/gasoline-like fuels engine was investigated experimentally by Lifeng Zhu et al. In their research, more advanced SOI led to advancing in the start of combustion [25]. Mobasheri et al., observed similar results in a numerical study of an iso-butanol/diesel engine [27].

3.4. Exhaust Emissions

Investigation on contours of in-cylinder emissions shows effects of SOI on produced exhaust emissions; Figure 10 shows in-cylinder exhaust NO emissions. According to this figure, in three strategy cases, a case with 80 CAD bTDC of SOI main produced lower amounts of NO at EVO, comparing various strategies that show lower amount of NO released in 50-50 (%-%) SOI strategy, also observed in Table 10 data. It seems that lower amount of NO is due to lower heat release that causes lower temperature (Figure 7). The 80%-20% strategy shows higher amounts of NO due to its higher level of combustion quality and, as a result, higher heat release that produces higher amounts of NO. Iso-surfaces in this figure specify various concentration of NO in volume of cylinder. Jesus Benajes et al.’s experimental research shows various behavior of NOx emissions in different engine loads; in low load condition there is lower NOx during advancing SOI; in all five different fuel blends, NOx production slope is incremental in medium and high load against advancing start of injection. In their research, HR was used for injection timing [20]. Decreasing NOx against SOI also was observed in J. Li et al., in a gasoline/biodiesel RCCI engine [21]. These results were also obtained in Nazemi et al.’s numerical study of a gasoline/diesel RCCI engine and results in Poorghasemi et al., in 2017 [22,23]. Lifeng Zhu et al.’s experimental research showed increasing NOx against SOI advancing in three various LR fuels [25]. Mobasheri’s research showed different slopes of NOx production during SOI advancement, in which before 50 CAD bTDC it was decrement and after that it was incremental [27]
CO produced mass distribution is illustrated in Figure 11. According to this figure and Table 11, among three strategies, 80%-20% shows lower amounts of CO at EVO. In this strategy, 80 CAD bTDC case produced more CO and lower amount of CO allocated to the 40 CAD bTDC case studies; this same trend was also observed in the two other strategies. It seems that single strategies’ condition is better than 50-50 (kg-kg) strategy in this specific emission. CO and HC emissions increased against start of injection advancing in various direct injection fuel in low engine load; this trend is decreasing in medium and high load of engine operation [20]. Nazemi et al., also showed in a numerical research that CO and HC produced higher emissions in more advanced SOI, and there is also a point with inverse slope in their results [22]. Increase of HC and CO was also observed in Poorghasemi et al.’s numerical study [23]. In Lifeng Zhu et al., which was an experimental work on various port injection fuels, HC and CO decreased against advancing SOI [25], while in Mobasher’s numerical study, the two pollutant production slope against SOI advancing decreased to a minimum point and were incremental after this point [27].
Mixture of in-cylinder fuel before injection consisted of CH4 and air, DME were injected into this mixture from pre-chamber in a specific SOI, and combustion occurred in various CAD according to the operational condition of engine. Concentration of CH4 can be used as a factor of combustion quality. Figure 12 shows the concentration of CH4 mass in various regions of cylinder at EVO; low concentration of CH4 shows more complete combustion. The 50-50 (%) case study shows lower amounts of CH4 which is because of higher temperature in this case, as shown in Figure 6, and it can be concluded also from Figure 6 and Figure 12 the higher amounts of CH4 produced in 80-20 (%).

3.5. Injection Timing

Nitrogen oxides (NOx), carbon monoxide and unburned hydrocarbons were considered as emissions in this research. NOx was obtained from CONVERGE related model besides considering methane (CH4) as UHC. According to various CA50 explained in the previous section, start of injection effects produced in-cylinder NOx. Figure 13 shows counters of released NOx in different SOI, considering CA50 a factor of comparison. According to this figure, which shows in-cylinder NOx with variation of CA50 and SOI, there is higher safety area of NOx in single strategy; higher percentages of fuel injection in SOI main also shows better condition in comparison with equal mass injection in two stages. EVO NOx production is presented in Table 11, which shows that all cases have emissions below euro six diesel pollutant standard. Range of NOx emission is from 0.21 g/kWh (for single injection strategy at 80 CAD bTDC) to 0.24 g/kWh (which occurred in split injection cases).
As mentioned before, CO is also considered one of output emissions and is also illustrated in Figure 14. Delay in injection effects on CO emission lead to its increase in single strategy. According to this figure, there are two critical points for CO emissions in single SOI strategies, which are 48 CAD bTDC and 58 CAD bTDC. These critical points are around 55 and 63 CAD bTDC for 80-20 (%) strategies, and it has been obtained that critical main point of SOI in 50-50 (kg-kg) is between 72 and 78 CAD bTDC. Carbon monoxides at exhaust valve open is shown in Table 10, in which all of them are below 0.04 g/kWh, which is below Euro VI standard, similar to NOx emissions described in the previous paragraph.
Besides these two exhaust emissions, unburned hydrocarbon (UHC) counters are shown in Figure 15. In single strategy SOI, injecting below 50 bTDC produced lower UHC, where there is more acceptable range for 80-20 (kg-kg), which is below 56 bTDC CAD, and 50-50 (kg-kg) critical area is lower than other strategies. Table 12 also shows exhausted UHC at EVO, in which all of them are below euro six standards.
Another phenomenon observed in production of in-cylinder UHC was the increasing of UHC approximately before start of combustion where, during combustion, it should be a decrease of UHC. This phenomenon, also illustrated in Kakoee et al. [2,3], is because of DME breaking up due to specific temperature and pressure. In 50-50 (kg-kg) cases there is more UHC release before start of combustion.

4. Conclusions

In this research, different characteristics of SOI strategies were studied such as in-cylinder pressure and temperature, combustion characteristics and emissions beside engine efficiency. Single SOI strategy was investigated with three different crank angle start of injection, which are 40, 60 and 80 bTDC. In split injection, injected mass changes in two different strategies: 50-50 (%) mass injection in pilot SOI of 20 bTDC with main injections of 80, 60 and 40 CAD bTDC, which are same as single strategy SOI crank angle; and 80-20 (%) is another split injection strategy investigated in this research. Effects of SOI on different properties of engine were listed as below:
Among three strategies, single strategy shows more efficiency than other two split injection strategies. In single SOI strategy, 60 bTDC injections shows better condition in IMEP, which is 5.39 bar in comparison with 5.34 and 5.36 bar for 80 bTDC and 40 bTDC, respectively. It seems that 60 bTDC produced more IMEP; although homogeneity is important, very advanced injection provides more time for DME decomposition, which also affects Cetane number of fuel mixture directly [2,3], which decreases combustion quality. In single strategy there are also higher gross work and heat release, and variation of them is similar to variation of IMEP. The 60-20 (%) SOI strategies efficiency are higher than other cases in all case studies. Minimum IMEPs occurred in 50-50 (%) cases.
Temperature and pressure variation during SOI changes are not too high where EVO temperature variation from maximum, which is for 80 bTDC crank angle, to minimum that occurred in 80-20 (%) 80&20 bTDC injections, is about 17 K; this difference is about 0.1 bar for EVO pressure.
Combustion characteristics such as start of combustion, burn duration and CA50 were affected with SOI changes. In single strategy, start of combustion was advanced with advancing SOI from40 to 80 bTDC crank angle degree; this change is about 1.3 CAD. In all cases, more advanced SOI led to more advanced start of combustion. Split strategies have earlier start of combustion in comparison with single strategy in same main SOI. Comparing two split SOI strategy shows that 50-50 (%) strategy of injection has more advancing SOC, where the difference between each case is about 2 CAD. There is also a similar trend of CA50 changes during SOI variation. Variation of BD for all cases was observed equal and was about 4.5 CAD.
NOx, CO and UHC were investigated as pollution in this research. According to various start of injections, there is different amount of them at EVO. Higher amounts of NOx were observed in 80-20 (%) cases and with advancing in SOI this amount decreased. This trend is also correct for two other strategies, which shows effects of homogeneity of fuel mixture on NOx emission. The 50-50 (%) shows better condition in NOx emission. CO emission in 80-20 (%) was lower than two other cases where, after this strategy, single strategy shows lower amount of CO in comparison with 50-50 (%) case study. Higher in-cylinder temperature led to lower UHC at EVO for 50-50 (%) cases, whereas maximum of UHC at EVO occurred in 80-20 (kg-kg) cases, which have lower temperature at EVO. Homogeny also affects UHC concentration, where in three strategies minimum of UHC was allocated to 80 CAD bTDC SOI main.
According to contours of each studied emission, there are some critical points for each case. In single strategy, the produced NOx at CA50 shows there is high range of using SOI from 45 to 80 CAD bTDC, but critical points appeared in CO produced contours which are between −45 to −60.In UHC emissions there is a limitation from 80 to 48 bTDC CAD; as a result, in single strategy 45 CAD bTDC can be an optimum SOI, and this point also has acceptable performance and EVO temperature.
In split strategy of 80% injected fuel in first stage, limitations for NOx, CO and UHCs are (45, 40), (65, 48) and (80, 48) bTDC, respectively. According to these limitations, optimum range related to emissions is (48, 45) bTDC. So as a result, 45 CAD bTDC can be a suitable SOI for this strategy.
The 50% fuel injected in main SOI also shows limitation of (70, 40), (80, 65) and (80, 70) bTDC for NOx, CO and UHC, respectively, which gives 70 CAD bTDC of appropriate SOI.

Author Contributions

Conceptualization, A.G.; software, A.K.; investigation, A.G.; resources, A.K.; data curation, A.G.; writing—original draft preparation, A.K.; writing—review and editing, A.M.A., T.M., A.P.; supervision, A.G. All authors have read and agreed to the published version of the manuscript.

Funding

This research received no external funding.

Institutional Review Board Statement

Not applicable.

Informed Consent Statement

Not applicable.

Data Availability Statement

Data available on request due to privacy.

Conflicts of Interest

The authors declare no conflict of interest.

Nomenclature

RCCIReactivity control compression ignition
SOCStart of combustion
CADCrank angle degree
CA50crank angle degree where 50 percent of heat released
BDBurn duration
HCCIHomogeneous charge compression ignition
PCCIpremixed charge compression ignition
LTCLow temperature combustion
LRFlow reactivity fuel
HRFHigh reactivity fuel
CIcompression ignition
SIspark ignition
EGRexhaust gas recirculation
IVCInlet valve close
EOCend of combustion
IMEP Indicated mean effective pressure
HVHeating Value
CNCetane number
pprPixel per revolution
HRRHeat release rate
V d Displacement volume
x Mole fraction
LTHRlow temperature heat release
HTHRHigh temperature heat release
CHRCumulative heat release
LHVLower heating value
LTHRlow temperature heat release
HTHRHigh temperature heat release
CHRCumulative heat release
LHVLower heating value
UHCUnburned hydrocarbons
DMEDi-methyl ether
EVOexhaust Valve Open
LHVLower heating value
LTCLow temperature combustion
NGNatural Gas
CFDComputational fluid dynamics
BDCBottom dead center
TDCTop dead center
aTDCAfter Top dead center
RPMRevelation per minute
CN mix Fuel mixture cetane number
SOI Start of injection

References

  1. Moradi, J.; Gharehghani, A.; Mirsalim, M. Numerical investigation on the effect of oxygen in combustion characteristics and to extend low load operating range of a natural-gas HCCI engine. Appl. Energy 2020, 276, 115516. [Google Scholar] [CrossRef]
  2. Kakoee, A.; Gharehghani, A. Comparative study of hydrogen addition effects on the natural-gas/diesel and natural-gas/dimethyl-ether reactivity controlled compression ignition mode of operation. Energy Convers. Manag. 2019, 196, 92–104. [Google Scholar] [CrossRef]
  3. Kakoee, A.; Bakhshan, Y.; Aval, S.M.; Gharehghani, A. An improvement of a lean burning condition of natural gas/diesel RCCI engine with a pre-chamber by using hydrogen. Energy Convers. Manag. 2018, 166, 489–499. [Google Scholar] [CrossRef]
  4. Kakoee, A.; Bakhshan, Y.; Gharehghani, A.; Salahi, M. Numerical comparative study of hydrogen addition on combustion and emission characteristics of a natural-gas/dimethyl-ether RCCI engine with pre-chamber. Energy 2019, 186, 115878. [Google Scholar] [CrossRef]
  5. Taghavi, M.; Gharehghani, A.; Nejad, F.B.; Mirsalim, M. Developing a model to predict the start of combustion in HCCI engine using ANN-GA approach. Energy Convers. Manag. 2019, 195, 57–69. [Google Scholar] [CrossRef]
  6. Gharehghani, A. Load limits of an HCCI engine fueled with natural gas, ethanol, and methanol. Fuel 2019, 239, 1001–1014. [Google Scholar] [CrossRef]
  7. Bae, C.; Kim, J. Alternative fuels for internal combustion engines. Proc. Combust. Inst. 2017, 36, 3389–3413. [Google Scholar] [CrossRef]
  8. Higashino, A.; Sasaki, H.; Kishishita, K.; Sekiyama, S.; Kawamura, H.; Iwamoto, H. Compression Ignition Combustion in a Rechambered and Heat Insulated Engine Using a Homogeneous Natural Gas Mixture. SAE Tech. Pap. 2000. [Google Scholar] [CrossRef]
  9. Roethlisberger, R.P.; Favrat, D. Investigation of the pre-chamber geometrical configuration of a natural gas spark ignition engine for cogeneration: Part I. Numerical simulation. Int. J. Therm. Sci. 2003, 42, 223–237. [Google Scholar] [CrossRef]
  10. Szwaja, S.; Jamrozik, A.; Tutak, W. A two-stage combustion system for burning lean gasoline mixtures in a stationary spark ignited engine. Appl. Energy 2013, 105, 271–281. [Google Scholar] [CrossRef]
  11. Zheng, Q.P.; Zhang, H.M.; Zhang, D.F. A computational study of combustion in compression ignition natural gas engine with separated chamber. Fuel 2005, 84, 1515–1523. [Google Scholar] [CrossRef]
  12. Salahi, M.M.; Esfahanian, V.; Gharehghani, A.; Mirsalim, M. Investigating the reactivity controlled compression ignition (RCCI) combustion strategy in a natural gas/diesel fueled engine with a pre-chamber. Energy Convers. Manag. 2017, 132, 40–53. [Google Scholar] [CrossRef]
  13. Balasubramanian, D.; Arumugam, S.R.S.; Subramani, L.; Chellakumar, I.J.L.J.S.; Mani, A. A numerical study on the effect of various combustion bowl parameters on the performance, combustion, and emission behavior on a single cylinder diesel engine. Environ. Sci. Pollut. Res. 2018, 25, 2273–2284. [Google Scholar] [CrossRef]
  14. Moradi, J.; Gharehghani, A.; Mirsalim, M. Numerical comparison of combustion characteristics and cost between hydrogen, oxygen and their combinations addition on natural gas fueled HCCI engine. Energy Convers. Manag. 2020, 222, 113254. [Google Scholar] [CrossRef]
  15. Olsen, J.; Crookes, R.J.; Bob-Manuel, K.D.H. Experiments in Dual Fuelling a Compression Ignition Engine by Injecting Di-Methyl Ether as a Pilot Fuel to Ignite Varying Quantities of Natural Gas. SAE Tech. Pap. 2007. [Google Scholar] [CrossRef]
  16. Gharehghani, A.; Hosseini, R.; Mirsalim, M.; Jazayeri, S.A.; Yusaf, T. An experimental study on reactivity controlled compression ignition engine fueled with biodiesel/natural gas. Energy 2015, 89, 558–567. [Google Scholar] [CrossRef]
  17. Pan, S.; Li, X.; Han, W.; Huang, Y. An experimental investigation on multi-cylinder RCCI engine fueled with 2-butanol/diesel. Energy Convers. Manag. 2017, 154, 92–101. [Google Scholar] [CrossRef]
  18. Han, W.; Li, B.; Pan, S.; Lu, Y.; Li, X. Combined effect of inlet pressure, total cycle energy, and start of injection on low load reactivity controlled compression ignition combustion and emission characteristics in a multi-cylinder heavy-duty engine fueled with gasoline/diesel. Energy 2018, 165, 846–858. [Google Scholar] [CrossRef]
  19. Soloiu, V.; Duggan, M.; Harp, S.; Vlcek, B.; Williams, D. PFI (port fuel injection) of n-butanol and direct injection of biodiesel to attain LTC (low-temperature combustion) for low-emissions idling in a compression engine. Energy 2013, 52, 143–154. [Google Scholar] [CrossRef]
  20. Benajes, J.; Molina, S.; García, A.; Monsalve-Serrano, J. Effects of direct injection timing and blending ratio on RCCI combustion with different low reactivity fuels. Energy Convers. Manag. 2015, 99, 193–209. [Google Scholar] [CrossRef]
  21. Li, J.; Yang, W.M.; An, H.; Zhao, D. Effects of fuel ratio and injection timing on gasoline/biodiesel fueled RCCI engine: A modeling study. Appl. Energy 2015, 155, 59–67. [Google Scholar] [CrossRef]
  22. Nazemi, M.; Shahbakhti, M. Modeling and analysis of fuel injection parameters for combustion and performance of an RCCI engine. Appl. Energy 2016, 165, 135–150. [Google Scholar] [CrossRef]
  23. Poorghasemi, K.; Saray, R.K.; Ansari, E.; Irdmousa, B.K.; Shahbakhti, M.; Naber, J.D. Effect of diesel injection strategies on natural gas/diesel RCCI combustion characteristics in a light duty diesel engine. Appl. Energy 2017, 199, 430–446. [Google Scholar] [CrossRef]
  24. Li, J.; Ling, X.; Liu, D.; Yang, W.; Zhou, D. Numerical study on double injection techniques in a gasoline and biodiesel fueled RCCI (reactivity controlled compression ignition) engine. Appl. Energy 2018, 211, 382–392. [Google Scholar] [CrossRef]
  25. Zhu, L.; Qian, Y.; Wang, X.; Lu, X. Effects of direct injection timing and premixed ratio on combustion and emissions characteristics of RCCI (Reactivity Controlled Compression Ignition) with N-heptane/gasoline-like fuels. Energy 2015, 93, 383–392. [Google Scholar] [CrossRef]
  26. Liu, J.; Wang, J.; Zhao, H. Optimization of the injection parameters and combustion chamber geometries of a diesel/natural gas RCCI engine. Energy 2018, 164, 837–852. [Google Scholar] [CrossRef]
  27. Mobasheri, R.; Seddiq, M. Effects of Diesel Injection Parameters in a Heavy Duty Iso-Butanol/Diesel Reactivity Controlled Compression Ignition (RCCI) Engine. SAE Tech. Pap. 2018. [Google Scholar] [CrossRef]
  28. Saxena, M.R.; Maurya, R.K. Effect of Diesel Injection Timing on Peak Pressure Rise Rate and Combustion Stability in RCCI Engine. SAE Tech. Pap. 2018. [Google Scholar] [CrossRef]
  29. Kong, S.-C. A study of natural gas/DME combustion in HCCI engines using CFD with detailed chemical kinetics. Fuel 2007, 86, 1483–1489. [Google Scholar] [CrossRef]
  30. Arcoumanis, C.; Bae, C.; Crookes, R.; Kinoshita, E. The potential of di-methyl ether (DME) as an alternative fuel for compression-ignition engines: A review. Fuel 2008, 87, 1014–1030. [Google Scholar] [CrossRef]
  31. Hiroyasu, H.; Kadota, T. Models for Combustion and Formation of Nitric Oxide and Soot in Direct Injection Diesel Engines. SAE Trans. 1976, 85, 513–526. [Google Scholar] [CrossRef]
  32. Heywood, J.B. Internal Combustion Engine Fundamentals; McGraw-Hill, Inc.: New York, NY, USA, 1988. [Google Scholar]
  33. Beale, J.C.; Reitz, R.D. Modeling spray atomization with the Kelvin- Helmholtz/Rayleigh-Taylor hybrid model. At. Sprays 1999, 9, 623–650. [Google Scholar]
  34. Amsden, A.A.; O’Rourke, P.J.; Butler, T.D. KIVA-II: A Computer Program for Chemically Reactive Flows with Sprays; Technical Report LA-11560-MS; Los Alamos National Laboratory: Los Alamos, NM, USA, 1989.
  35. Manuel, A.; Gonzalez, D.; Borman, G.; Reitz, R. A Study of Diesel Cold Starting using both Cycle Analysis and Multidimensional Calculations. SAE Tech. Pap. 1991. [Google Scholar] [CrossRef]
  36. Schmidt, D.P.; Rutland, C.J. A New Droplet Collision Algorithm. J. Comput. Phys. 2000, 164, 62–80. [Google Scholar] [CrossRef]
Figure 1. Modeled geometry imported to CONVERGE Studio.
Energies 14 01638 g001
Figure 2. Chemical-kinetic solver diagram.
Energies 14 01638 g002
Figure 3. Schematic of experimental setup.
Energies 14 01638 g003
Figure 4. Validation of pressure.
Energies 14 01638 g004
Figure 5. Error analysis and uncertainty.
Energies 14 01638 g005
Figure 6. Gross Work, total heat release and IMEP for nine various case studies.
Energies 14 01638 g006
Figure 7. Cumulative heat release (CHR) diagrams for various case studies. (a) Single strategy; (b) Split strategy 80-20; (c) Split strategy 50-50.
Energies 14 01638 g007
Figure 8. EVO temperature in nine case studies.
Energies 14 01638 g008
Figure 9. Combustion characteristics of each case study, sequence of the cases follows the sequence in Table 10.
Energies 14 01638 g009
Figure 10. NO emission in various crank angle degrees.
Energies 14 01638 g010
Figure 11. CO emissions in different crank angle degree.
Energies 14 01638 g011
Figure 12. In-cylinder CH4 concentration at various CAD for each case study.
Energies 14 01638 g012
Figure 13. In-cylinder NOx emissions contours in various SOI and CA50 in g/kWh.
Energies 14 01638 g013
Figure 14. In-cylinder CO emissions contours in various SOI and CA50 in g/kWh.
Energies 14 01638 g014
Figure 15. In-cylinder CH4 emissions contours in various SOI and CA50 in g/kWh.
Energies 14 01638 g015
Table 1. Geometry and operational specifications of the engine.
ParameterSpecifications
Engine typeSinge cylinder E6/MS
Bore (mm)76.2
Connecting rod length (mm)240
Stroke(mm)110
Displacement (cc)507
Compression ratio17.2:1
IVC (CAD)144 bTDC
IVO (CAD)7 bTDC
EVC (CAD)7 aTDC
EVO (CAD)144 aTDC
Table 2. Injector specifications.
ParameterSpecification
Number of holes6
Hole diameter (mm)0.15
Included spray angle (deg)150
Table 3. Different injection strategies as case studies.
Case StudyInjection AngleInjection DurationInjection Strategy
Case 1SOI = 80 bTDCID: 15 CADSingle Injection
Case 2SOI = 60 bTDCID: 15 CADSingle Injection
Case 3SOI = 40 bTDCID: 15 CADSingle Injection
Case 4SOI_1 = 80 bTDC, SOI_2 = 20 bTDCID1: 12 CAD, ID2: 3 CAD80% mass injection in SOI_1
Case 5SOI_1 = 60 bTDC, SOI_2 = 20 bTDCID1: 12 CAD, ID2: 3 CAD80% mass injection in SOI_1
Case 6SOI_1 = 40 bTDC, SOI_2 = 20 bTDCID1: 12 CAD, ID2: 3 CAD80% mass injection in SOI_1
Case 7SOI_1 = 80 bTDC, SOI_2 = 20 bTDCID1: 6 CAD, ID2: 6 CAD50% mass injection in SOI_1
Case 8SOI_1 = 60 bTDC, SOI_2 = 20 bTDCID1: 6 CAD, ID2: 6 CAD50% mass injection in SOI_1
Case 9SOI_1 = 40 bTDC, SOI_2 = 20 bTDCID1: 6 CAD, ID2: 6 CAD50% mass injection in SOI_1
Table 4. Engine operational condition.
ParameterSpecification
Engine speed1200 rpm
Total in-cylinder mass0.223 g
Equivalence ratio0.3
Fraction of HRF/LRF1.4
Table 5. Experimental uncertainty values.
ParameterUncertainty (%)
Temperature<2
Pressure<2
Engine speed<1
Fuel flow rate<1
Air flow rate<1
Table 6. AVL DiGas 4000 emission analyzer’s specifications.
SpeciesMeasured UnitRangeResolutionAccuracy
CO%0–10% Vol.0.01% Vol.±1
CO2%0–20% Vol.0.1% Vol.±1
HCppm0–20.000 ppm Vol.1 ppm±1
NOxppm0–5.000 ppm Vol.1 ppm±1
O2%0–25% Vol.0.01% Vol.±1
Engine Speedrpm250–9.990 rpm/min10 rpm±1
λ-calculation-0–9.9990.001±1
Table 7. Measured and calculated emissions.
Case TypeEmission TypeUHCCONO
NG/DMEMeasured (volumetric ppm)192023405
Predicted (volumetric ppm)246518258
Table 8. Measured uncertainty and experimental data collection.
Measured QuantityEquipmentErrorResolutionMax. Uncertainty
Engine powerA 22 kW and 420-volt dynamometer 10 RPM***0.10%
In-cylinder pressureA piezo-electric QC43D-AVL 0.1 CAD***0.10%
Crank shaft anglesA magnetic rotary encoder (MES-2500D-T, Fotek)***3600 ppr0.10%
Mass flow rate of LRFA YAMTAKE flow meter 1%***0.10%
Air to fuel ratioA λ sensor mounted on the exhaust manifold <1%***0.10%
Gas temperatureA k-type thermocouple <1%***0.20%
Fuel consumptionThe AVL-735 mass flow meter<1%***0.10%
CO,NO,CH4AVL exhaust gas analyzer1 ppm***0.20%
Adjusting inlet temperatureA heater
Adjusting intake pressureA turbocharger
Top dead center sensorTop dead center sensor<1%***0.20%
Error analysisData acquisition analyzer
*** Not Applicable.
Table 9. Engine output characteristics of each case study.
StrategyCaseGross Work (J)Total Heat Release (J)IMEP(bar)
single strategySOI = 40 bTDC271.4511.95.36
SOI = 60 bTDC272.7512.65.39
SOI = 80 bTDC270.1514.15.34
Two-stage strategy: 80% injection in SOI1SOI_1 = 40 bTDC, SOI_2 = 20 bTDC264.7507.55.23
SOI_1 = 60 bTDC, SOI_2 = 20 bTDC264.8506.95.24
SOI_1 = 80 bTDC, SOI_2 = 20 bTDC261.2506.25.15
Two-stage strategy: 50% injection in SOI1SOI_1 = 40 bTDC, SOI_2 = 20 bTDC262.9513.95.18
SOI_1 = 60 bTDC, SOI_2 = 20 bTDC263.7514.75.2
SOI_1 = 80 bTDC, SOI_2 = 20 bTDC260.6512.35.15
Table 10. Maximum in-cylinder temperature.
StrategyCaseEVO.Pressure (bar)Max.Pressure(bar)/CAD aTDCEVO.Temp. (k)Max.Temp.(k)/CAD aTDC
single strategySOI = 40 bTDC30.7095.6/0.7797.31923.7/1
SOI = 60 bTDC30.7495.7/0.5798.31923.1/1
SOI = 80 bTDC30.8795.9/0.04800.91925/1
Two-stage strategy: 80% injection in SOI1SOI_1 = 40 bTDC, SOI_2 = 20 bTDC30.3295.7/0.15787.71924/0.15
SOI_1 = 60 bTDC, SOI_2 = 20 bTDC30.3195.6/0.06787.21921/0.06
SOI_1 = 80 bTDC, SOI_2 = 20 bTDC30.2895.7/−0.3786.31924/−0.68
Two-stage strategy: 50% injection in SOI2SOI_1 = 40 bTDC, SOI_2 = 20 bTDC30.9095.4/0.16802.61917/0.2
SOI_1 = 60 bTDC, SOI_2 = 20 bTDC30.9195.6/0.04802.91920/0.1
SOI_1 = 80 bTDC, SOI_2 = 20 bTDC30.8395.7/−0.08800.71922/−0.16
Table 11. Combustion characteristics of various case studies.
StrategyCaseSOC (bTDC)BD (CAD)CA50 (aTDC)
single strategySOI = 40 bTDC0.29.23.2
SOI = 60 bTDC0.459.73.1
SOI = 80 bTDC1.510.52
Two-stage strategy: 80% injection in SOI1SOI_1 = 40 bTDC, SOI_2 = 20 bTDC1.168.32.4
SOI_1 = 60 bTDC, SOI_2 = 20 bTDC1.38.52.2
SOI_1 = 80 bTDC, SOI_2 = 20 bTDC2.18.41.4
Two-stage strategy: 50% injection in SOI2SOI_1 = 40 bTDC, SOI_2 = 20 bTDC3.512.80.3
SOI_1 = 60 bTDC, SOI_2 = 20 bTDC3.712.60.2
SOI_1 = 80 bTDC, SOI_2 = 20 bTDC4.112.3−0.4
Table 12. Exhaust emissions at EVO.
StrategyCaseEVO.NOx (g/kWh)EVO.CO (g/kWh)EVO.UHC (g/kWh)
single strategySOI = 40 bTDC0.2560.0380.158
SOI = 60 bTDC0.2340.0390.155
SOI = 80 bTDC0.2330.0400.152
Two-stage strategy: 80% injection in SOI1SOI_1 = 40 bTDC, SOI_2 = 20 bTDC0.2700.0360.175
SOI_1 = 60 bTDC, SOI_2 = 20 bTDC0.2600.0360.176
SOI_1 = 80 bTDC, SOI_2 = 20 bTDC0.2590.0380.183
Two-stage strategy: 50% injection in SOI2SOI_1 = 40 bTDC, SOI_2 = 20 bTDC0.2410.0400.159
SOI_1 = 60 bTDC, SOI_2 = 20 bTDC0.2350.0390.156
SOI_1 = 80 bTDC, SOI_2 = 20 bTDC0.2290.0410.165
Publisher’s Note: MDPI stays neutral with regard to jurisdictional claims in published maps and institutional affiliations.

