Metadata Analysis Reveals Major Worldwide Trends in Industrial and Academic Geophysics


Ali I. Al-Naimi Petroleum Engineering Research Center, King Abdullah University of Science and Technology, 3220 Building 5 (Seaside), Thuwal 23955-6900, Saudi Arabia
*
Author to whom correspondence should be addressed.
†
Current address: Stepnaya 21, 633343 Bolotnoe, Russia.
Energies 2021, 14(1), 107; https://doi.org/10.3390/en14010107
Submission received: 23 October 2020
/
Revised: 11 December 2020
/
Accepted: 14 December 2020
/
Published: 28 December 2020
Abstract
:We summarize our metadata analysis of the last 38 well-attended annual conferences, organized by the Society of Exploration Geophysicists. In 2018, Schlumberger and Saudi Aramco had the highest number of publications among service and production companies. In 2019, BGP and PetroChina took the lead. Throughout history, US academics have had the highest number of publications, but in 2019 Chinese academia came close to taking the lead. Analysis of the publication activity of oil-producing and oilfield service companies provides insights into the state of geophysical research. The number of publications from industrial companies in the energy sector reflects their financial standing and aspirations for the near future. Publications from academia in different countries tell us about state and private funding of research in each country, and indirectly reflect the geopolitical situation in the world. The changing number of publications over time reflects the dynamics of the transformation of research in geophysics, and allows us to understand better what is happening and make forecasts.
1. Introduction
The amount of digital data has been erupting in the recent years. In 2018, the total estimated size of the datasphere (“The notional environment in which digital data is stored; especially the Internet viewed in this way.”, www.lexico.com/ (accessed 28 April 2020)) was zettabytes (ZB) with a prediction of 175 ZB in 2025 [1]. The electricity cost of storing and using one GB of information was estimated to be 5.12 kWh [2]. The cost of use of 5.12 kWh was about $0.51 in 2012. In 2012, information and communication technology (ICT)-related products and services accounted for 4.6% of worldwide electricity consumption [3]. Another estimate puts this cost at 10% of global electricity consumption in 2013 [4], and growing at 7%/year [5], to about 16% today. In 2012, the global electricity demand on data centers in 2018 was estimated to be 198 TWh, which is almost 1% of global electricity demand [6]. KTH (KTH is the Royal Institute of Technology in Stockholm) reports that about 10% of the world’s total electricity consumption is being used by the Internet alone [7]. Estimated increase in the datasphere size suggests an inevitable increase of power consumption over time. If linear scaling is assumed, we can say that a five-fold increase in the datasphere will require a five-fold increase in the burning of valuable hydrocarbons by 2025. BP, in its review of world energy, reports that in 2019, 84% of the total energy was produced by burning coal, natural gas, and oil [8]. The remaining 16% was produced by nuclear, hydro, and renewables. The five-fold increase in energy demand cannot be sustained.
The Society of Exploration Geophysicists (SEG) annual conferences are dominated by oil and gas companies, representing the customer, and oilfield service companies, representing the service provider. Therefore, the number of publications and company presence at an SEG conference reflects the company’s current and future activity in all these market relationships we refer to as the geophysical market (GeoMrt). It is essential for oilfield services and oil production companies to make good presentations at this conference. Service companies advertise their technology advancements in this way, and oil companies show their solvency in the market. Tracking the number of reports, we can talk about the dynamics of R&D investments of a particular company. To understand the changing Big Energy sector, the geophysical market is very important, because geophysicists find and explore the mineral deposits on which our civilization is based. After a time delay, changes in the geophysics sector trigger responses in the energy sector.
The SEG Annual Conference and Exhibition is one of the most significant gatherings of geophysicists in the world. A presentation at this conference raises the prestige of a company and demonstrates the scientific viability of an academic institution. These conferences have been held annually for 9 decades and they have provided online access of proceedings for the last 38 years [9], through 2019. The 2020 SEG Annual Conference was held online, but at the time of the manuscript submission, the affiliation data was not yet available on the OnePetro website and could not be included in the article. Researchers and engineers report on their cutting-edge achievements, and so we get an annual account of the most relevant technologies. The major keywords appearing in the SEG literature were analyzed recently by Eltsov et al. [10].
Vlad [11] performed an analysis of the Geophysics journal affiliations, and he focused on academic institutions and the change in the number of publications over time. He reviewed metadata of 11,658 publications made between 1936 and 2017 by various universities around the world. In journal articles, a severe decrease in the contributions from the industry is observed, while in conference articles, we do not observe such a decline. Vlad notes an increase in the number of co-authors per article and an increase in the number of publications of the Chinese academy and academy of other Asian countries. We agree with the conclusions of Vlad on the analysis of the geophysics article metadata. However, we do not consider publications by individual universities. Instead, we analyze the number of publications by various industrial companies. In our paper, we try to describe historical and market prerequisites for changing the number of publications. The main difference between our article and Vlad’s article is that we interpret the change in the number of publications over time and associate metadata with the events in oil market and the industry. To the best of our knowledge, the presented metadata analysis approach has not been applied yet to conference materials.
In this paper, we analyze the GeoMrt based on the proceedings of the SEG Annual Conferences. We see that the number of publications from oil and oilfield service companies reflects their stock market price, and the number of publications from academia in various countries speaks to the state funding of scientific work. The goal of our study is to give a general overview of the data set and provide several illustrative examples. The manuscript size limits the number of such examples. Therefore, we consider only the largest companies and countries most represented at the conference. Our results will interest young researchers, PhD students, postdocs, petroleum engineers, geophysicists, and specialists working in oilfield services and oil production market. We encourage researchers to use our database outside the scope of this paper [12].
2. Science as an Economic Activity
When modern science is regarded as an economic process in terms of inputs and outputs, two significant considerations arise, says Nicholas Rescher [13] in his monograph on the economics of research in natural sciences:
- As a sphere of human effort, science is a massive undertaking, and one which (throughout the recent history) has been rapidly accelerating in scale under the benefit of a vast input in terms of labor, expenditure, and information.
- As a productive enterprise, science has delivered a massive and (over the recent period) rapidly accelerating output in the strictly quantitative terms of the literature which reports its findings and all other forms of sharing activities (conferences, international colloquia, etc.)—as well as in an impressive and rapidly increasing menu of technological “spin-offs.”
Rescher’s seminal work leads to the following conclusions:
- In contrast to the numeric rate of generation of products of science (the number of papers, abstracts, patents, etc. per year), the knowledge content of science has increased at a much lower rate that may have been more linear than exponential. Also, the surprise or information content of many papers and patents is negligible.
- The rate of growth—exponential or not—of science has been quite uneven; for example, the number of papers in geosciences has been vastly smaller than in biochemistry and biology. However, it does not follow that the information content of a biochemistry paper is higher than that of a paper in geophysics or petroleum engineering.
- The usefulness, however defined, of new information generated in research and development (R&D) should be questioned. Such questioning helps in coming down from a rather ethereal plane of the seemingly boundless possibilities of a physical science to a more practical context of what is feasible and realistically impacts a society that bankrolls the science.
3. Materials and Methods
We used the OnePetro online library [14] to obtain metadata of the peer-reviewed papers. The OnePetro website offers ample opportunities for fetching and analyzing metadata. Along with OnePetro, CrossRef service can be used for metadata fetching. Different spelling versions and typos affected our study of affiliations. Moreover, many organizations have since ceased to exist (were acquired, went bankrupt, split, etc.), which also complicated the analysis. We use the open-source Python libraries to obtain and process metadata: Requests-HTML, sqlite3, and NumPy. For printing the graphs, we use Matplotlib, Plotly, PIL (Python Imaging Library), and Inkscape.
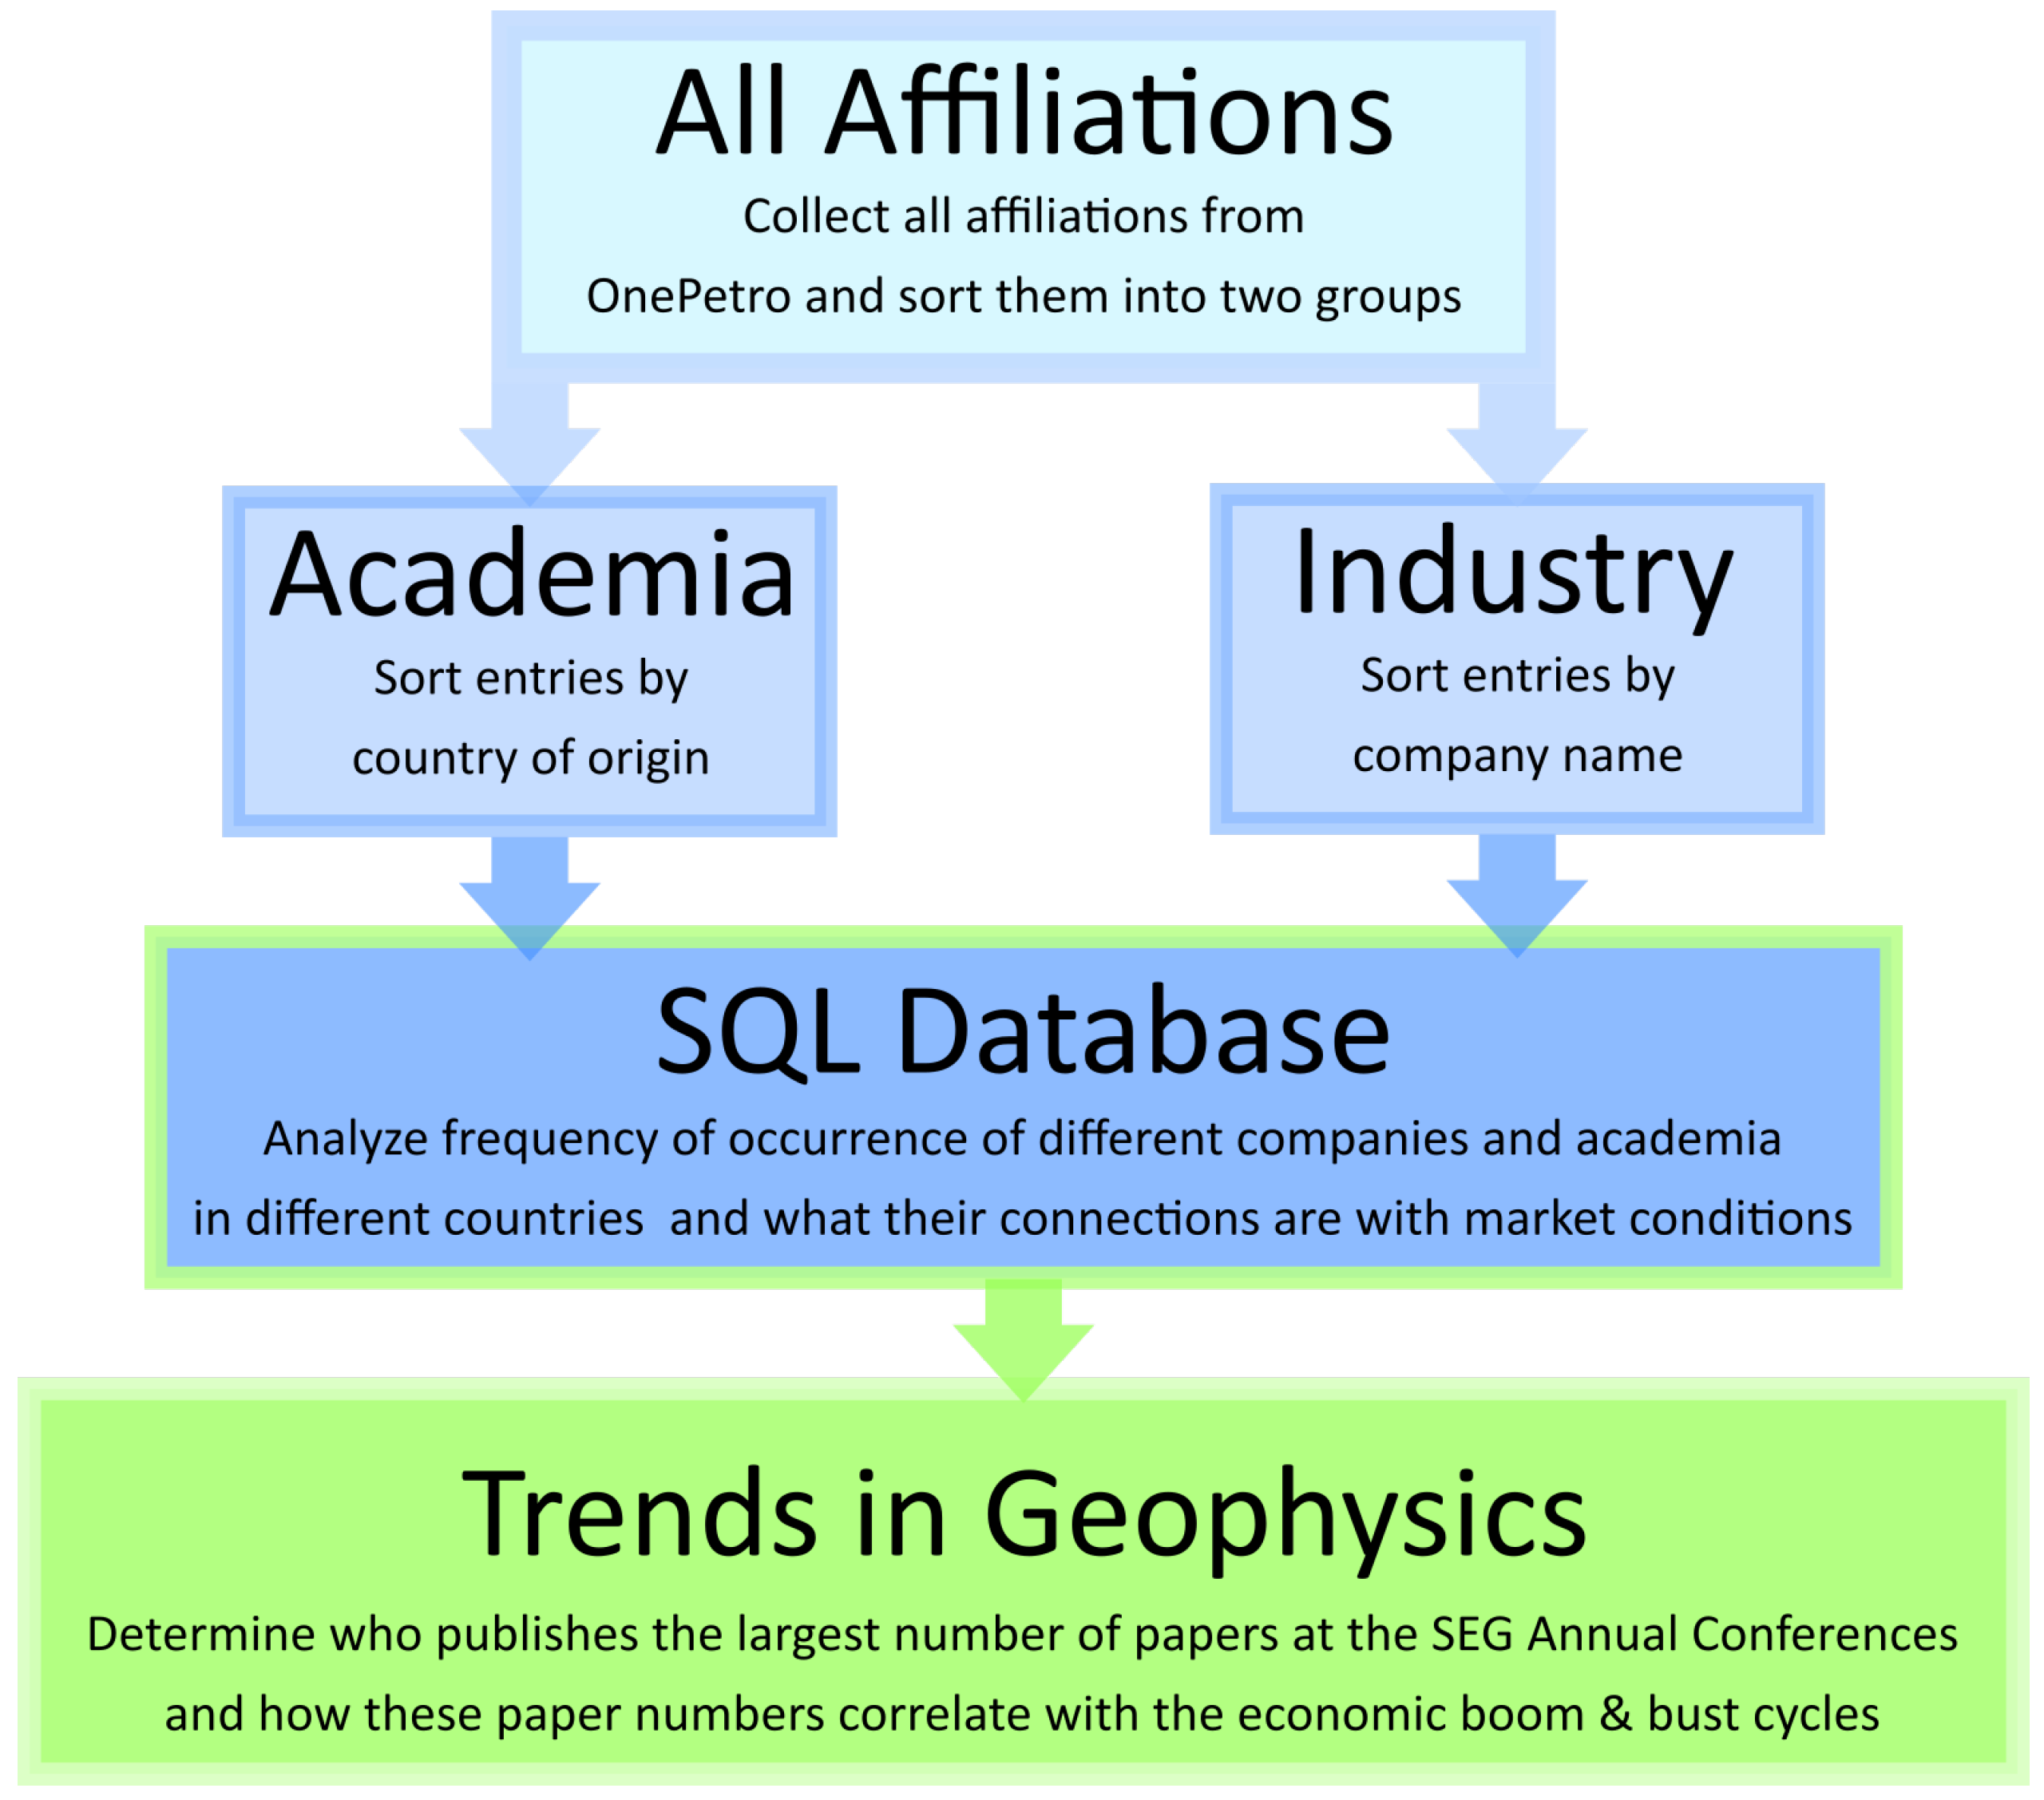
In total, we have analyzed 24,500 SEG conference papers over the 38 years period. The number of non-unique authors for the entire time span chosen in this work exceeds 75 thousand. Figure 1 shows the data processing workflow. We received metadata for all 38 conferences and sorted them into academia and industry. By “academia”, we mean the educational, scientific institutions, universities, colleges, national laboratories and scientific institutes sponsored by the state budget. By “industry”, we mean oil and gas production companies and oilfield services companies, as well as all private companies that provide services in the market for prospecting, exploration and mining. We sorted all affiliations from the industry by company name and academic affiliations by country. Not all affiliations were complete; sometimes they looked like “University of”, “Geological Institute”, “Unive”, “Faculty of Geology and Mining” etc. These mislabels did not allow us to determine the country of an implied academic institution. In this case, we have defined such an affiliation as an “unknown academic institution” and included it in a special list.
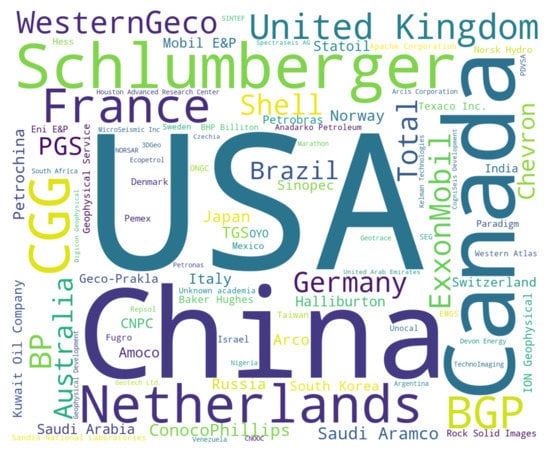
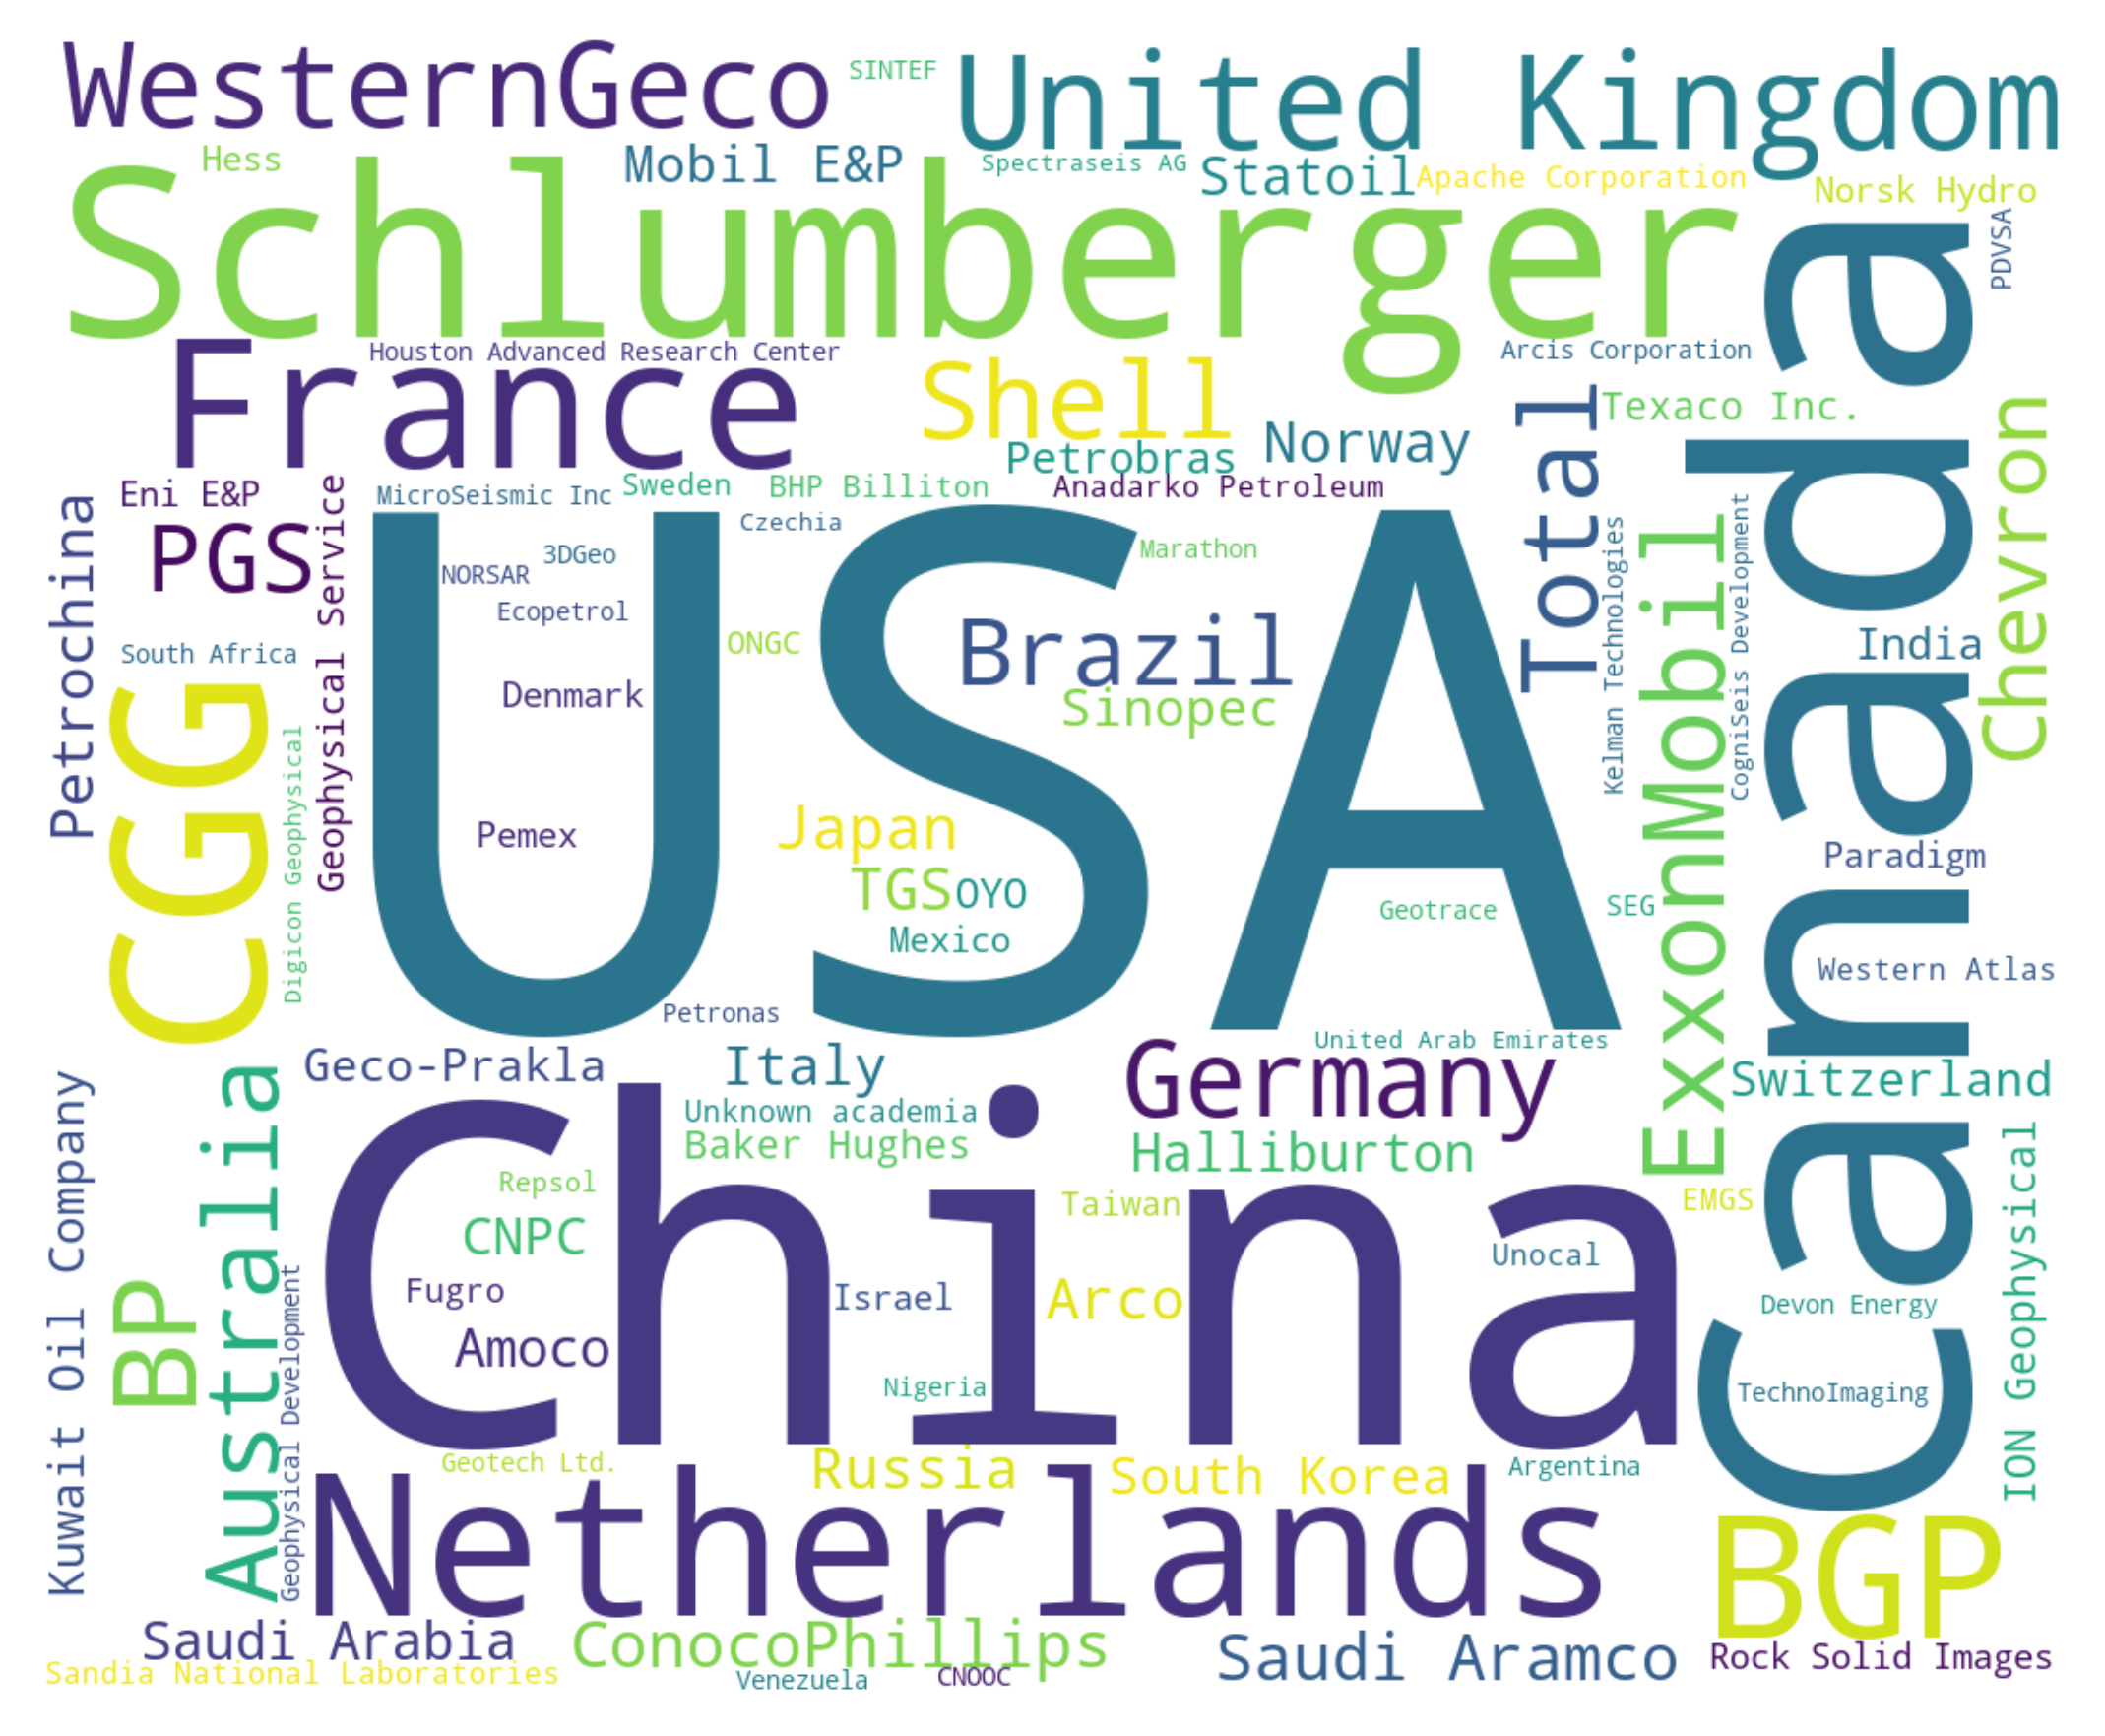
After initial filtering, we count the number of affiliations per year from each particular company or academic institution in a particular country and analyze their changes over time. The average number of authors per paper has been growing over the years. There are many articles written jointly by authors from different companies. We divided the total number of affiliations from all industrial companies and academia by the average number of co-authors for each year. If one author used multiple affiliations, we took into account only the first one mentioned. It is easy to identify the large company affiliations and typos in the spelling of their names, but it is more difficult to analyze industrial companies that published less than 10 papers. Since the authors of these publications often spelled the names of their companies differently, we distributed them into different groups. We take note of the number of typographical errors in the “Schlumberger” company name. Schlumberger truly ranks first among all other companies, but its name is sometimes misspelled as: “Schiumberger”, “Schulmberger”, “Shlumberger”, “Schlumbeger”, “Schlumbrrger” etc. These errors are due in part to the carelessness and faulty machine recognition, but it is worth paying a tribute to the Schlumberger company, which published the highest number of articles over the observed period.
4. Results
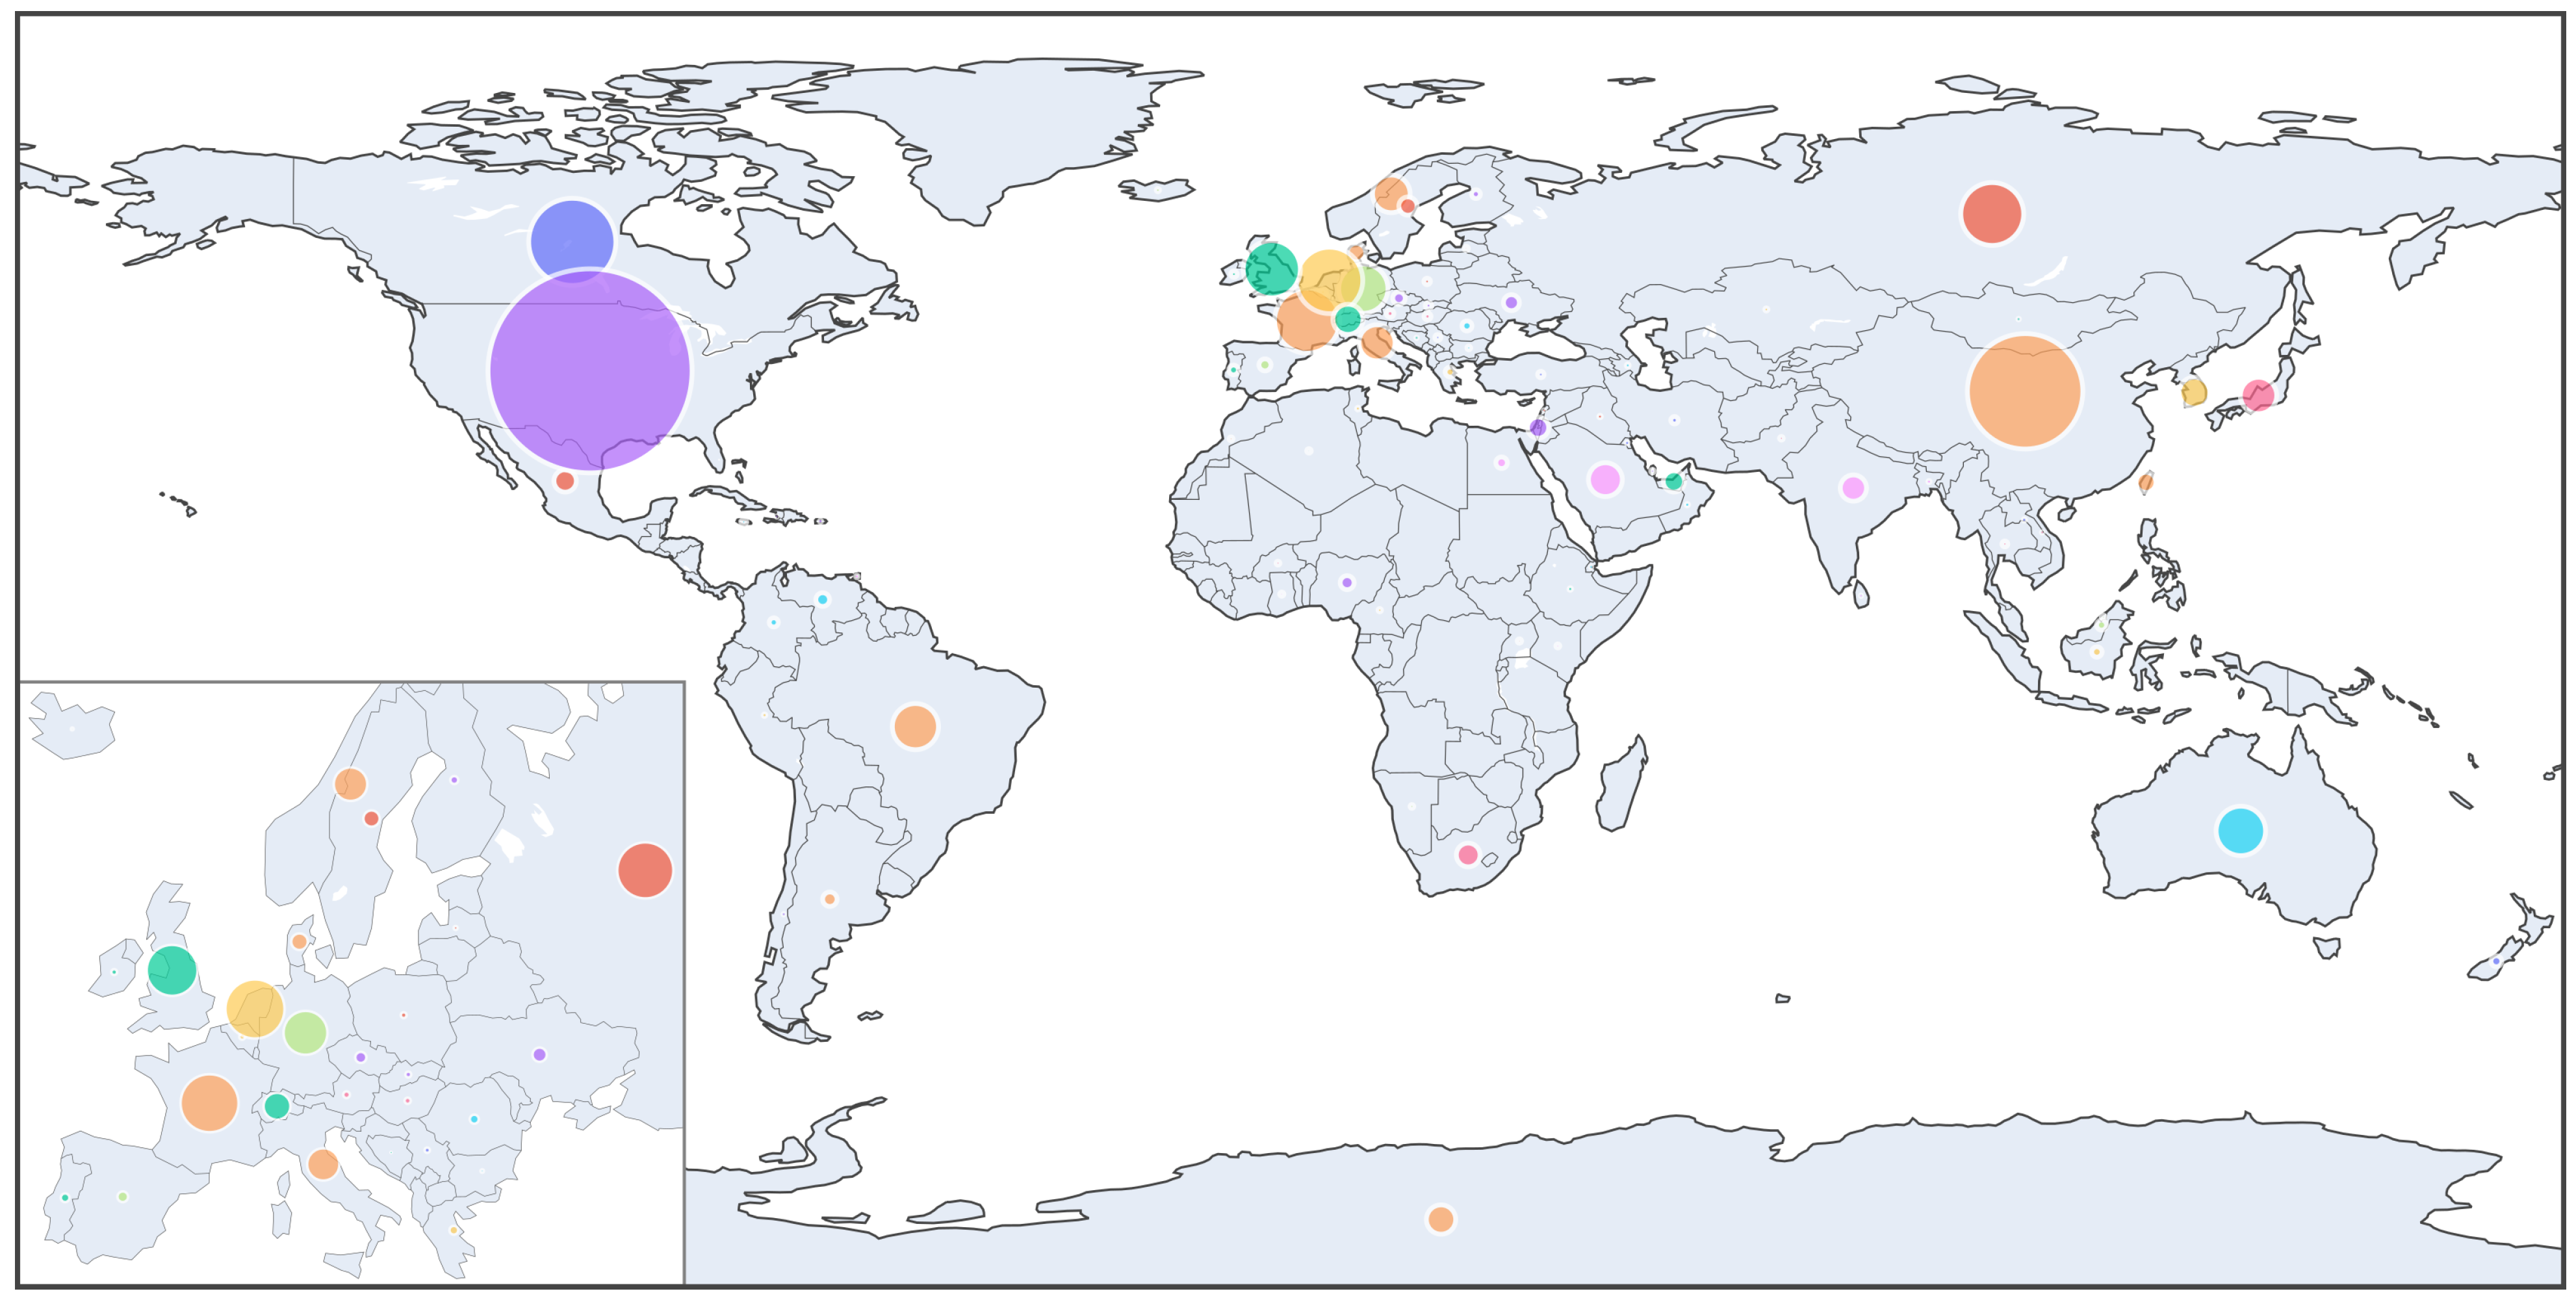
Figure 2 reveals the average number of academic papers by country. Each country is represented by a unique color. The circle sizes scale with the average number of publications per country. The inset in the lower-left corner shows a zoom-in of Europe. The most considerable contributions are from the universities in the United States of America (Colorado School of Mines, University of Houston, and Stanford University), followed by the universities in China (China University of Petroleum, Jilin University, and Tongji University), and Canada (University of British Columbia). Most of the remaining papers are shared among the Netherlands, France, the United Kingdom, Germany and the Russian Federation, followed by Norway, Italy and Switzerland.
China holds the leading position in Asia, followed by the smaller but notable contributions from South Korea, Japan, and India. In South America, academia in Brazil published the highest number of abstracts. In the Middle East, the most represented country at the SEG Annual Meetings over the past ten years has been the Kingdom of Saudi Arabia. In 2009, Saudi Arabia had only one publication, and in 2019, this number grew to 23, which was quite impressive. No academic institutions in other countries have shown such a rapid relative growth in recent years. The total number of publications from the top 50 countries is presented in the Appendix A, and the full list can be accessed here [12].
The circle in the Antarctica represents incomplete affiliations or affiliations with typos that were not correctly recognized; therefore, it was impossible to determine the paper location. The size of this circle provides an estimate of the total error of the analysis ±(0.3% of the total number of the publications).
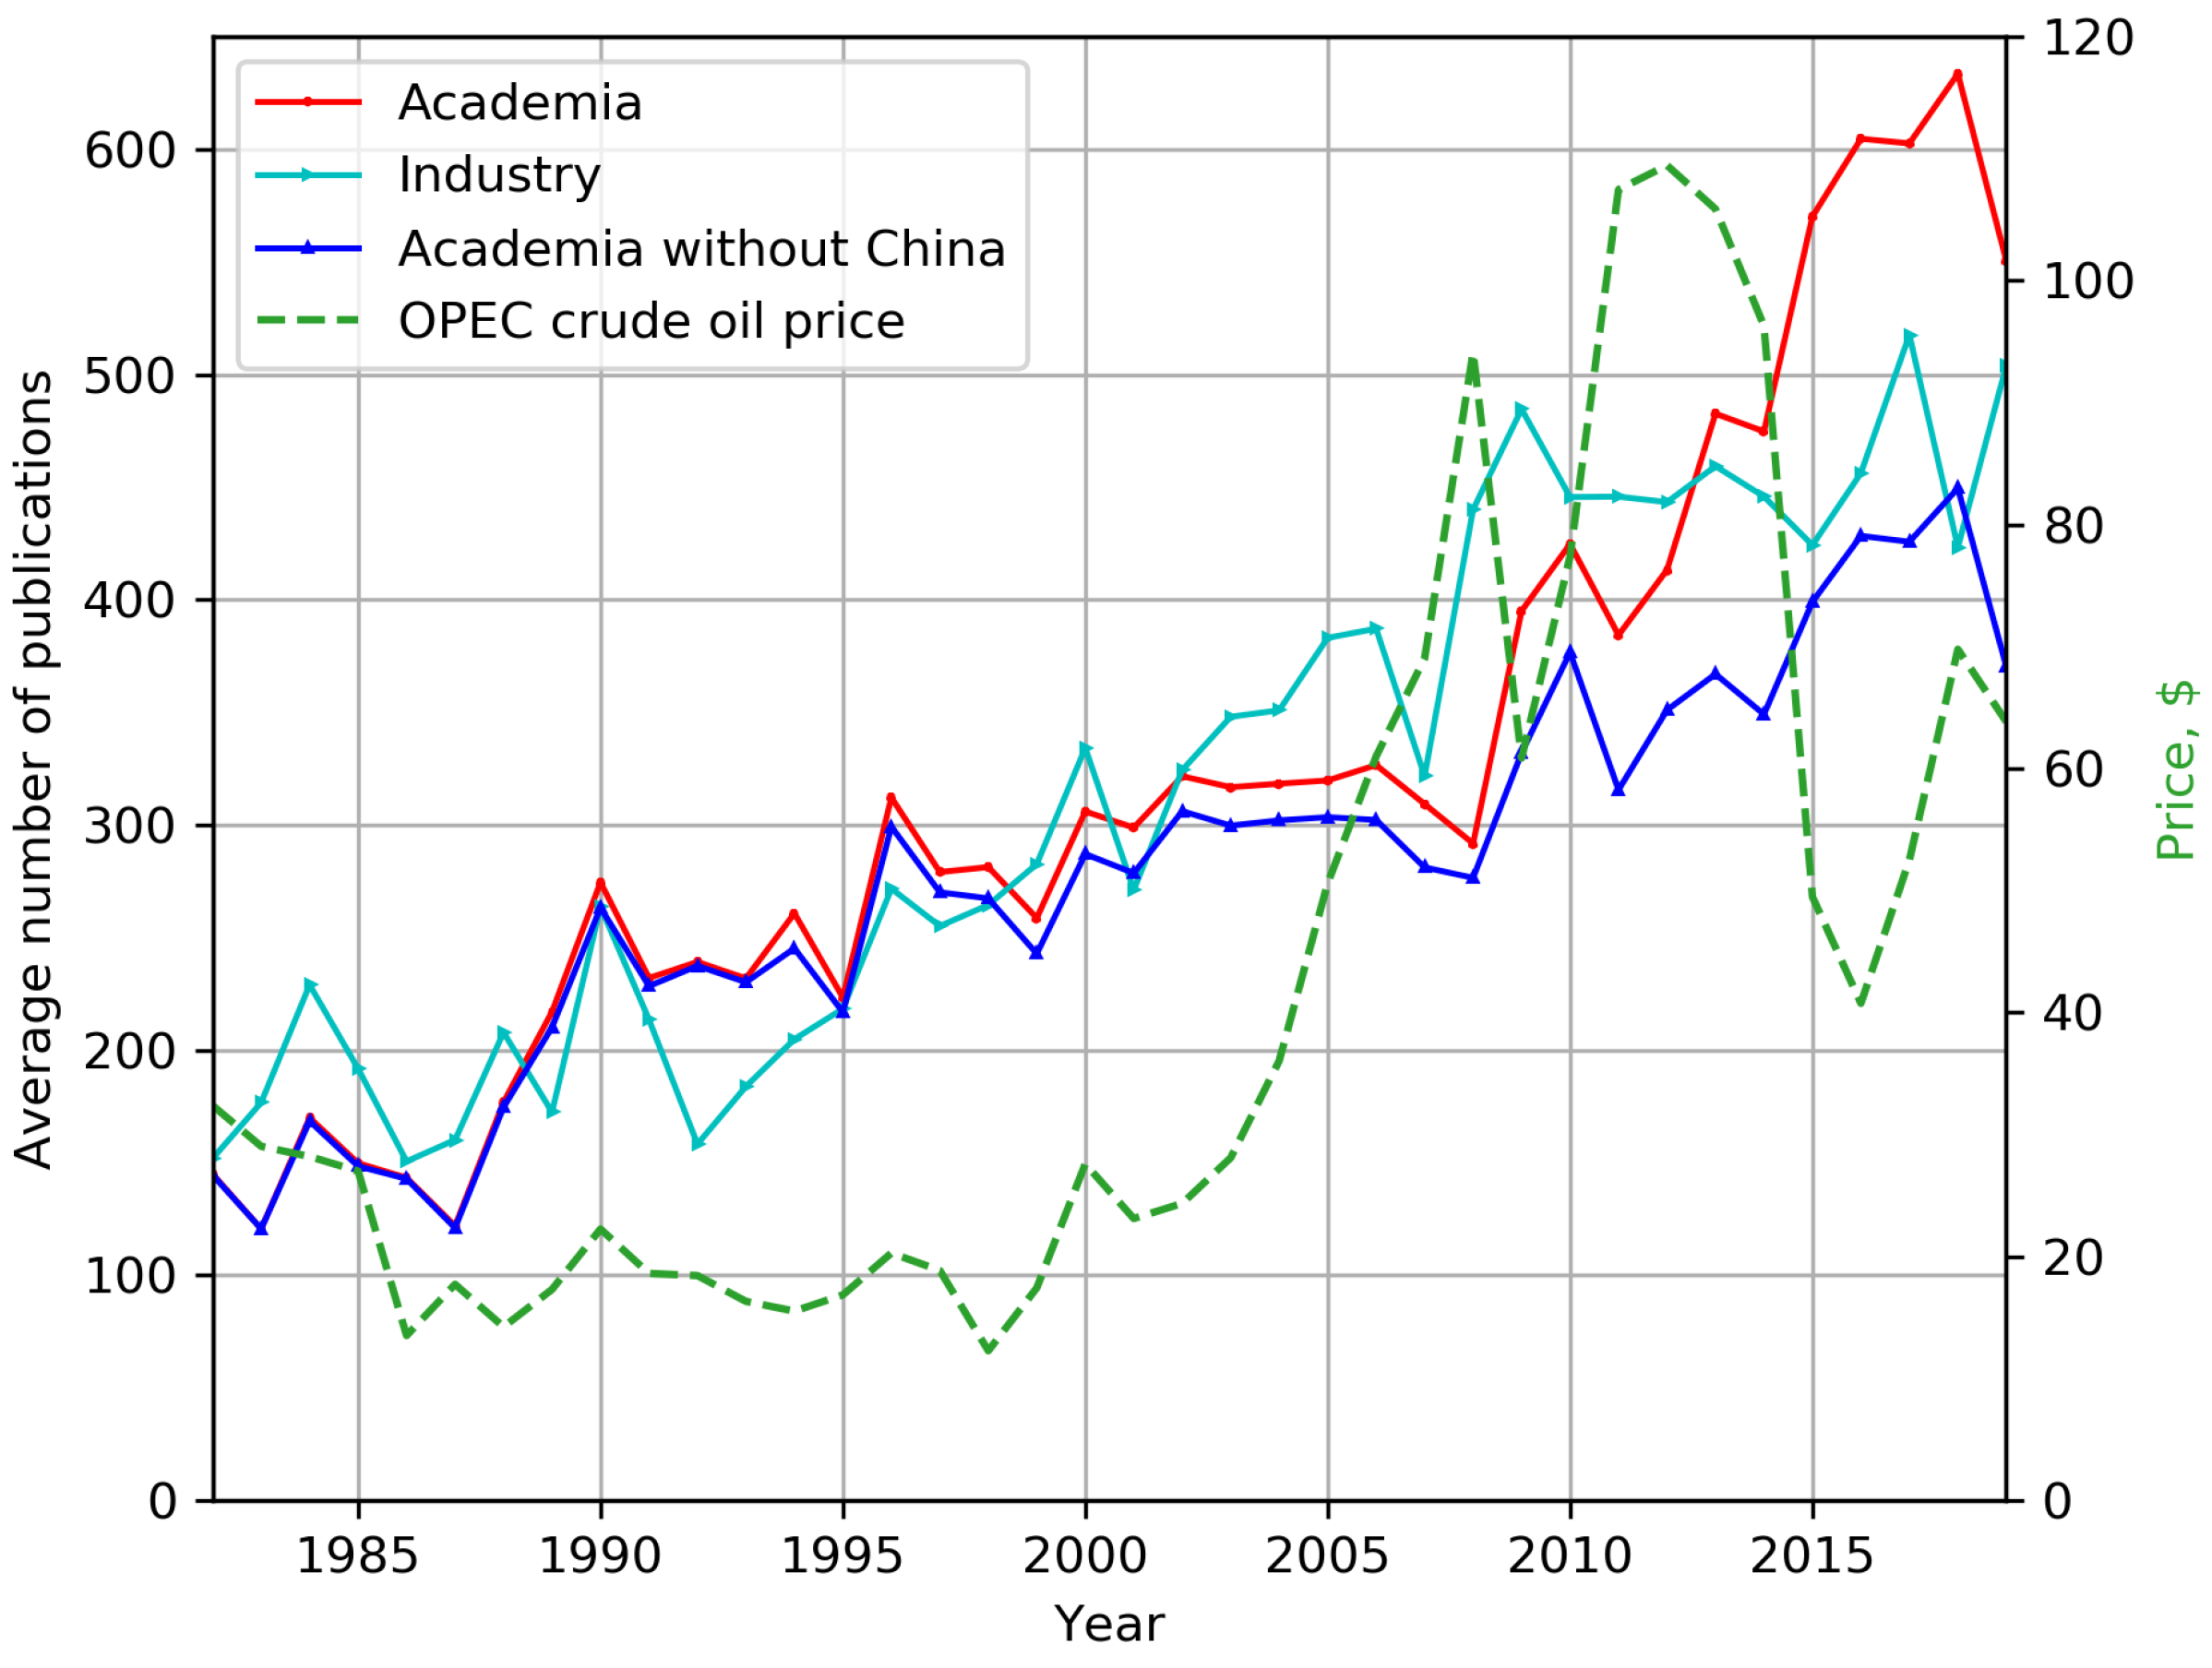
Figure 3 compares the annual number of publications from industry and academia. Both types of contributors have been producing more papers over the years, a trend associated with an increase of fossil fuel consumption, oil price, and the governing economic paradigm of eternal growth. In some cases, however, such a correlation is missing. For example, the number of academic publications was hardly affected by the two recent crises of 2008 and 2014. On average, the number of industrial publications has only been partially influenced by oil price dynamics, resulting in a slower growth rate in the last few years. With the global COVID-19 pandemic and the unprecedented contraction of the industry worldwide, the number of SEG publications will likely decrease sharply in 2021. Thus far, however, it appears that on average the industry has become more efficient in research expenditures, and managed to maintain a high number of publications, and even a slow but consistent growth, when faced the shrinking market.
Curiously, the number of publications from academia in 2019 fell significantly. Figure 3 indicates a decrease in the number of publications from US academia in 2019 compared with 2018. Perhaps this decrease was caused by a reduction in state funding of higher educational institutions [15] (also see blue curve drop in 2018–2019 in Figure 6). However, other factors could have affected this drop. For example, during this time, major oil companies started to prepare for a “lower for a longer” scenario. They shifted focus from resource replacement to value creation, alternatively it could be a signal from the European major oil producers of an energy transition.
In 2020, the SEG Annual Conference was held online and there were 777 technical papers [16]. Since 2009, there have always been more than 800 articles per conference proceedings, and now we see that the number of speakers has decreased compared with 1080 back in 2019. Considering the current situation, we assume that the number of participants in the 2021 conference is unlikely to reach the level of 2019 or 2012.
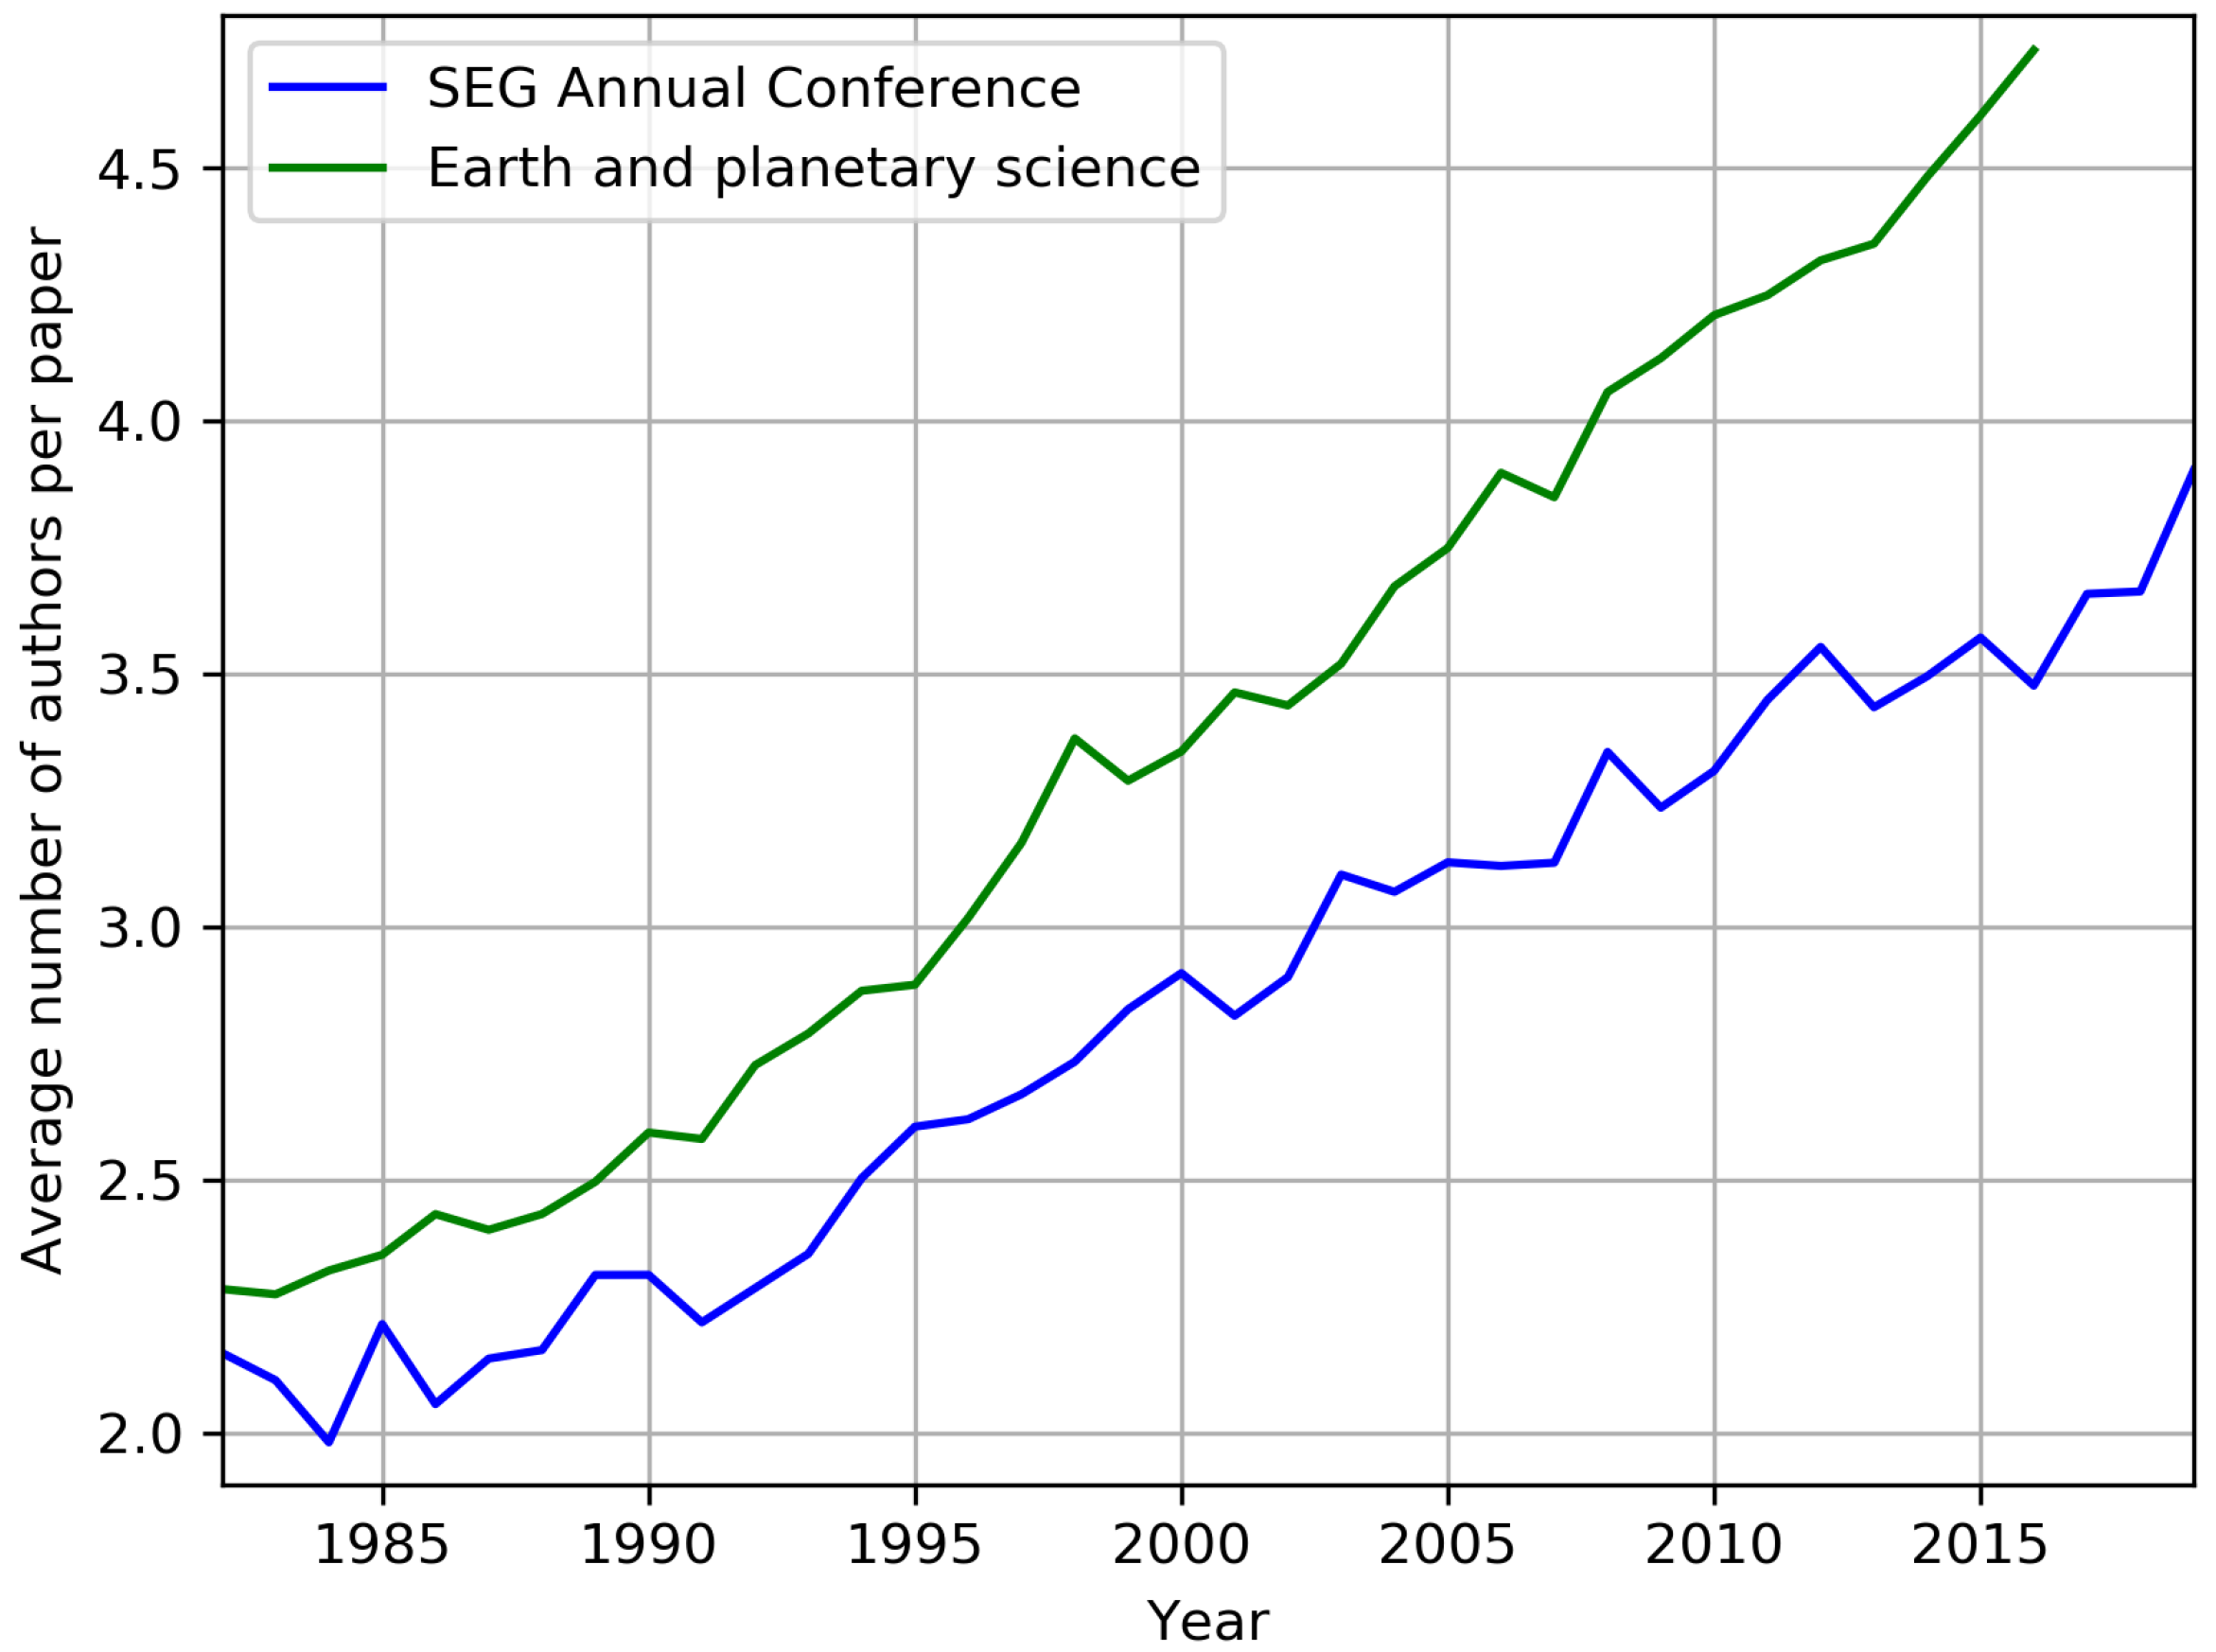
Figure 4 shows that the number of co-authors per paper has increased, and we observe a correlation with the world trend exemplified by a related field of the Earth and Planetary sciences. The increase in the number of authors per paper is a worldwide trend [17]. Scientific research is becoming more interdisciplinary and thus more collaborative. Starting around 2010, the average number of co-authors of SEG papers became almost constant at 3.6 co-authors per paper, but in 2019 it increased, reaching 3.9. With that, we see an increase in the number of organizations involved in the SEG Annual Conferences. Most likely, the number of authors per article will continue to grow but should eventually plateau.
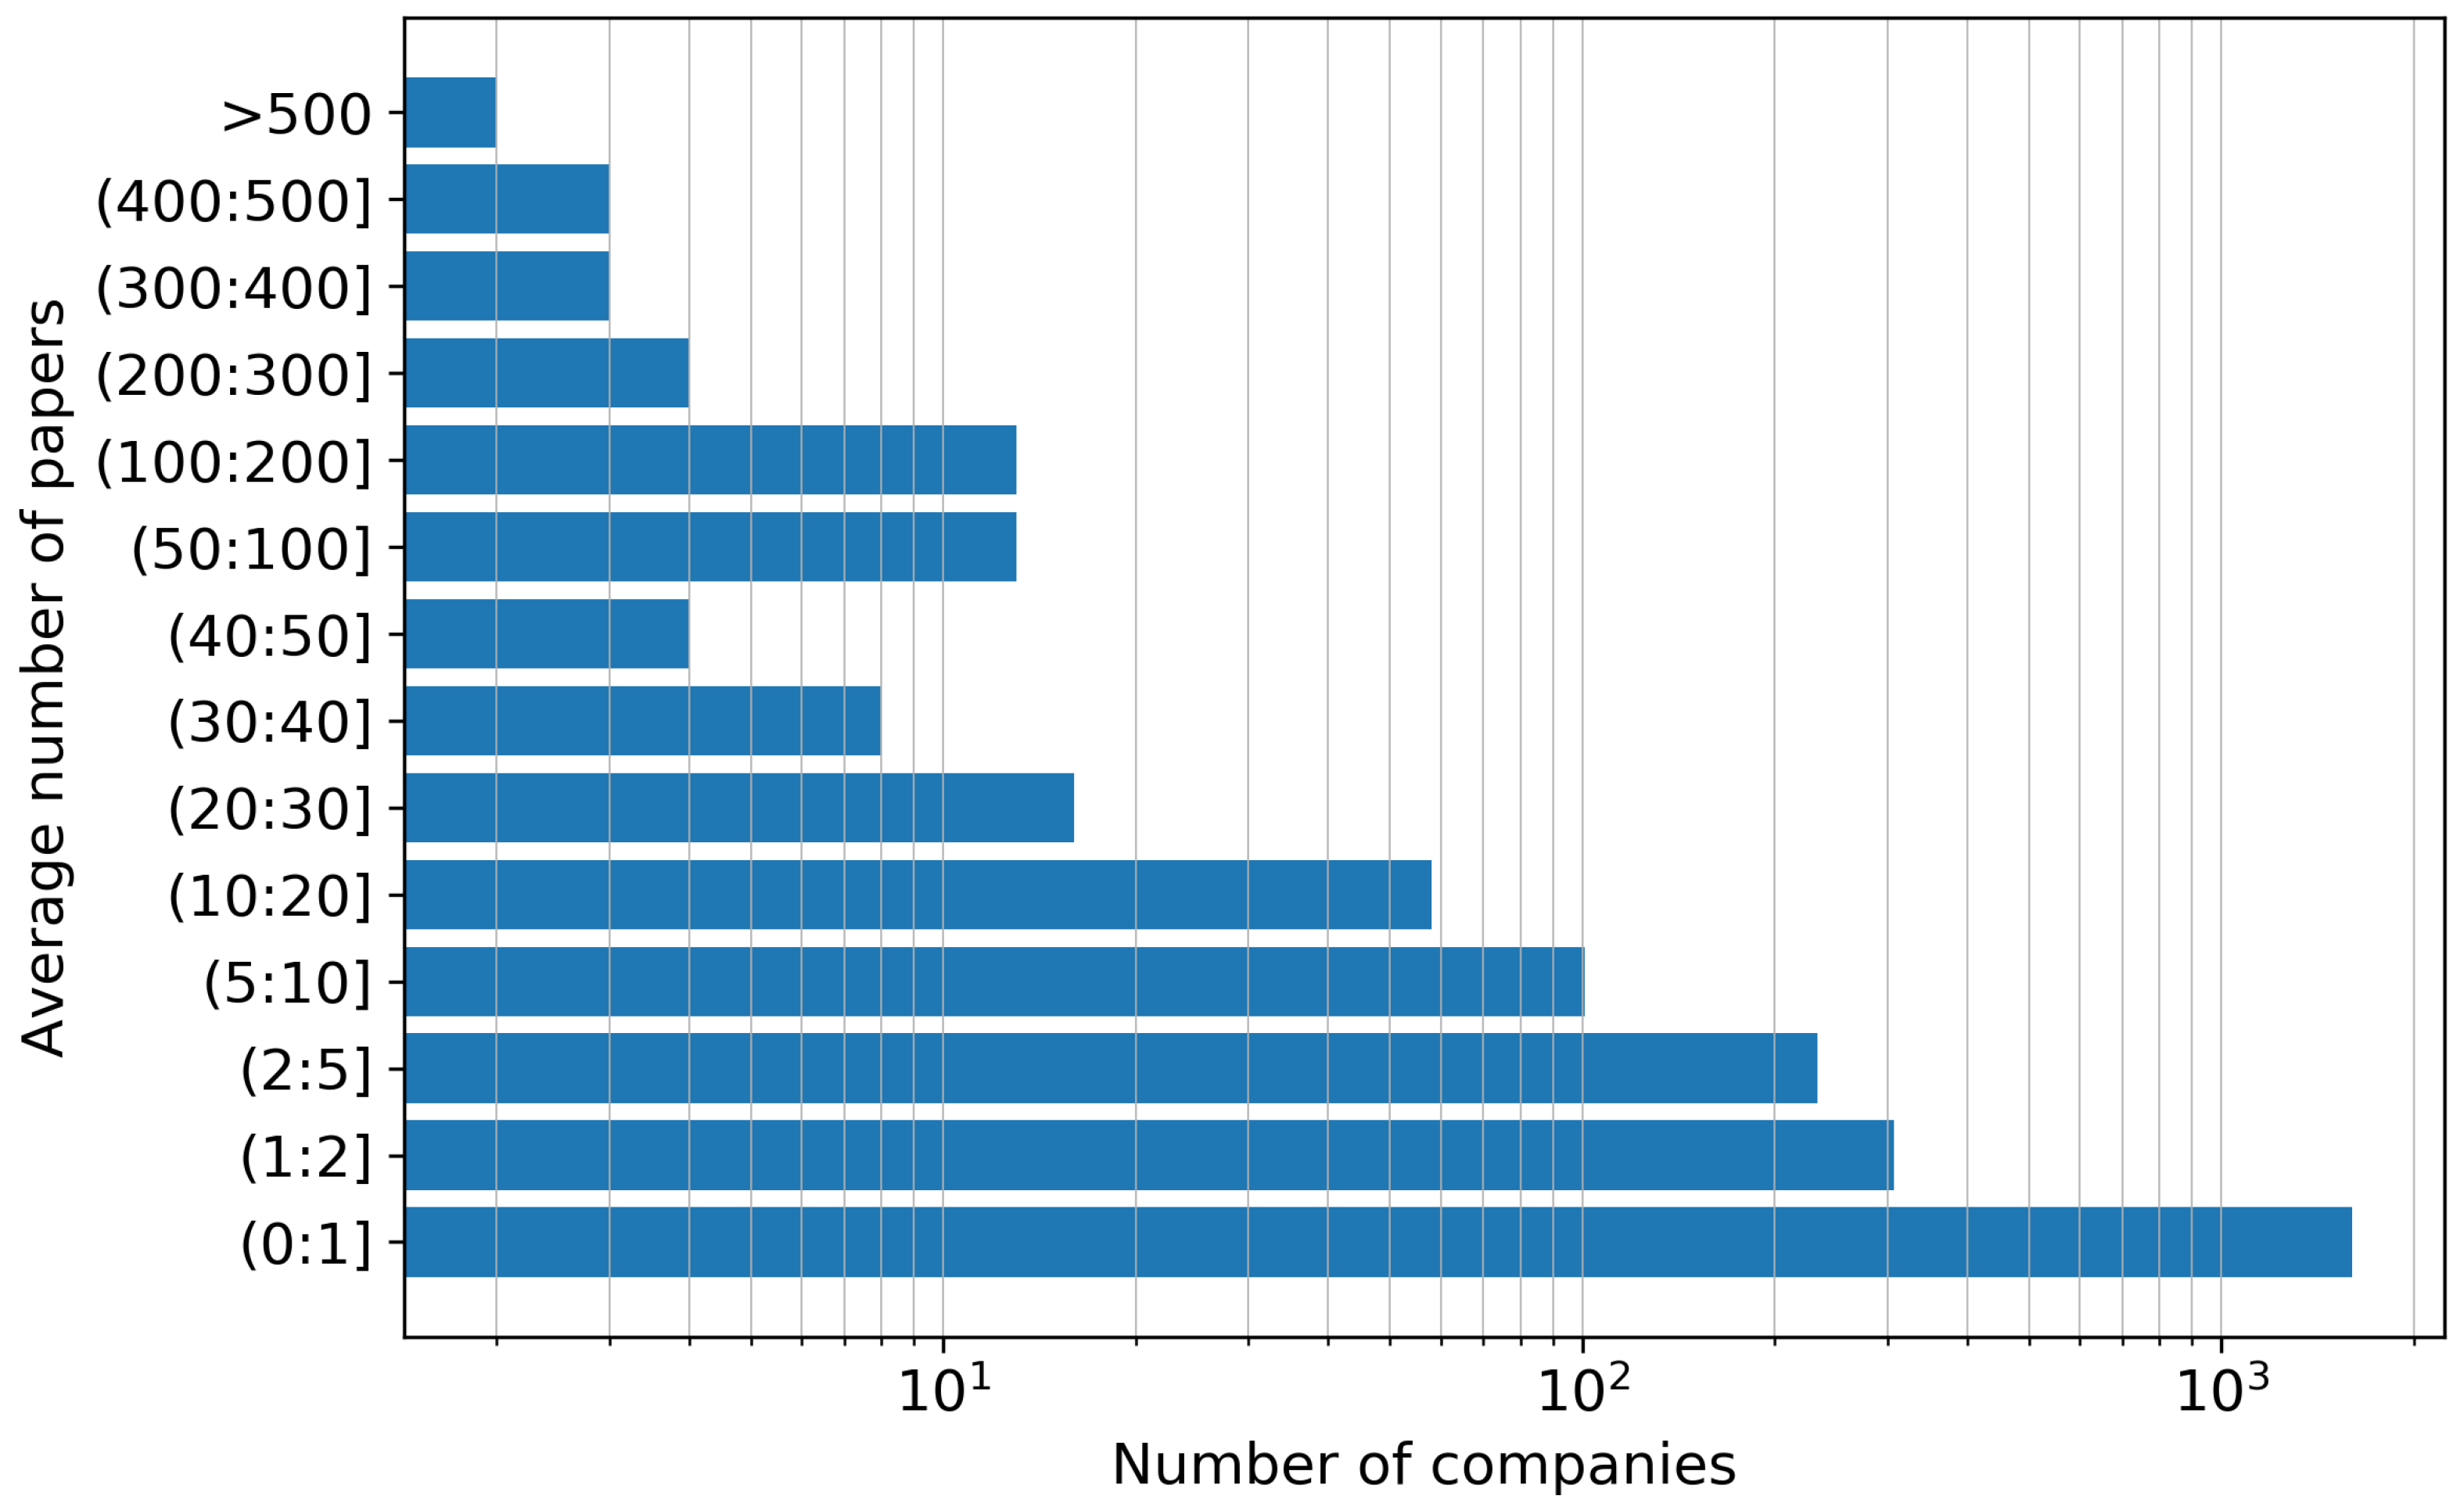
Figure 5 correlates the number of companies with the corresponding number of publications. More than 2400 industry companies and academic institutions from 86 countries have presented their research at the SEG annual conferences so far. There are only two companies that on average have published more than 500 publications (Schlumberger and CGG), and there are more than 2100 companies that published five papers or less. The five companies with the most significant number of publications in the SEG annual conferences are (1) Schlumberger (Houston, TX, USA), (2) WesternGeco (Crawley, UK), (3) CGG (Compagnie Générale de Géophysique, Paris, France), (4) BGP Inc., (BGP Inc., China National Petroleum Corporation, Beijing, China), and (5) BP plc (formerly The British Petroleum Company plc and BP Amoco plc, London, UK). These five companies accounted for about 30% of all paper affiliations over the last ten years. Schlumberger constitutes about 8% of all affiliations, with WesternGeco adding about 5% in the past ten years. The number of companies that have published less than five papers over the years has been growing gradually [12]. We suggest that increase in the number of companies with a small number of publications indicates digital technologies adoption. After all, it is cheaper to deal with data processing than exploration, which requires seismic equipment and a large staff. It is reasonable to assume that the presence of small companies at the SEG annual meetings will continue to grow.
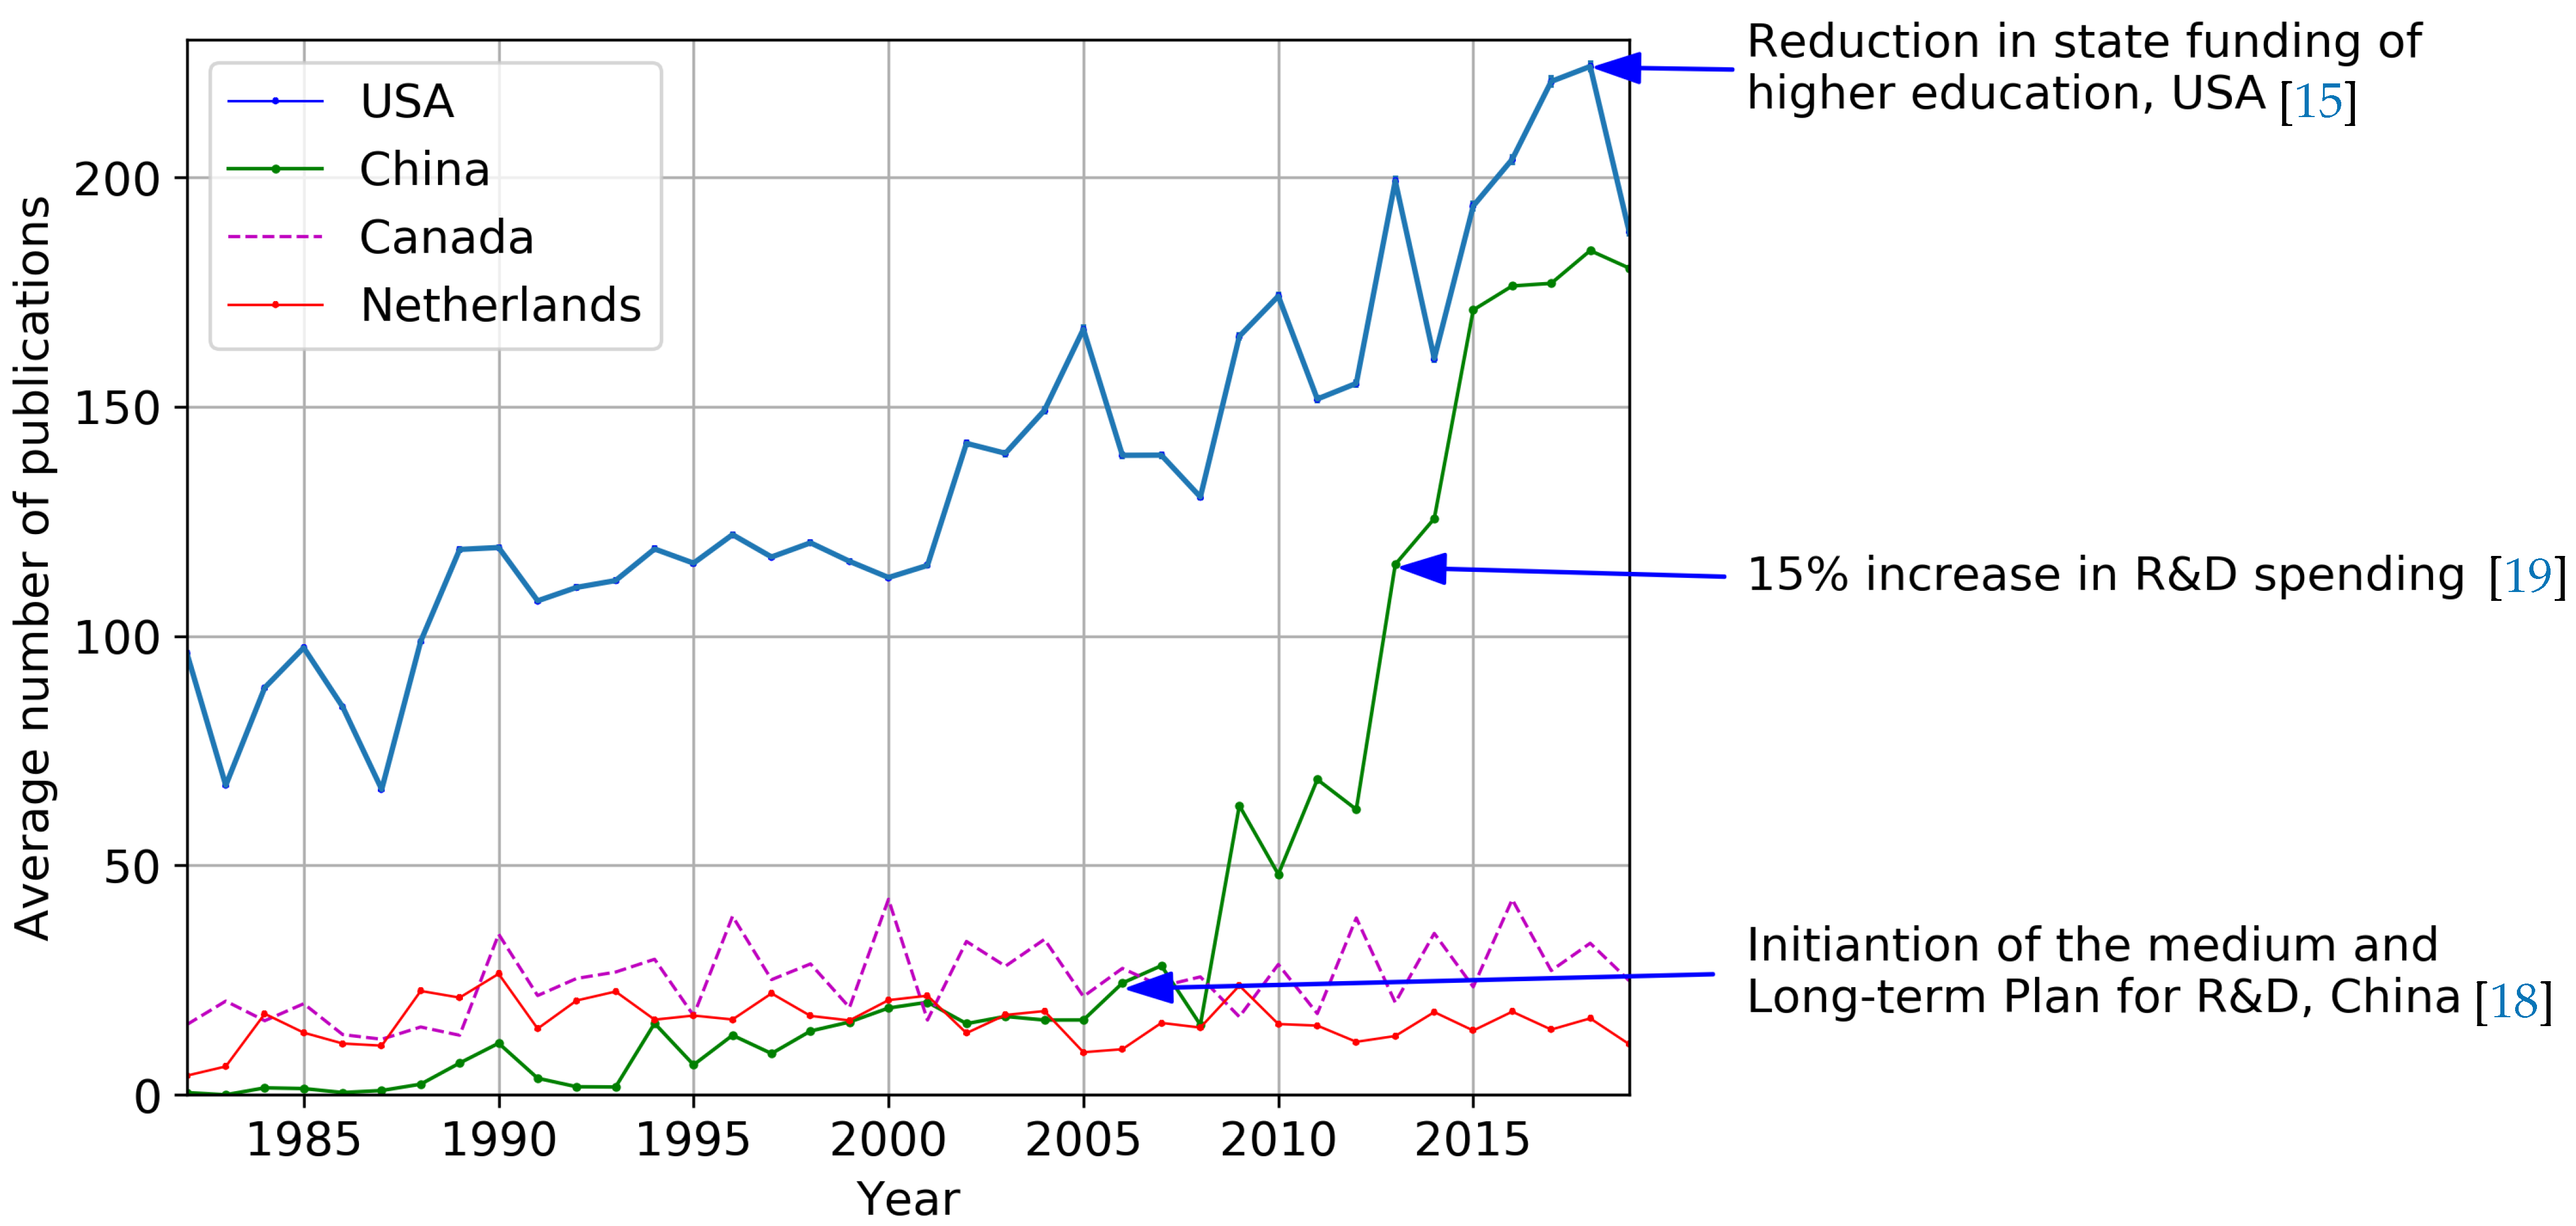
Figure 6 and Figure 7 shows a breakdown of academic publications by country for the eight most highly represented countries as reported in Appendix A. The error bar size is ±0.3% of the publication number, which is similar to the marker size in our plots. The five most highly represented universities in SEG Annual Conferences over the 38 years have been (1) the Colorado School of Mines, (2) the University of Houston, (3) China University of Petroleum, (4) Stanford University, and (5) Delft University of Technology. US academia is ahead of everyone in terms of the number of papers published annually, as well as the total articles published. The Netherlands and Canada have regular contributions, and their publication activity is constant over time. Other countries, such as France and Germany, seem to follow the crude oil price trend. In contrast, China maintains a steady growth rate. In 2006, the Chinese government initiated a powerful program of research development, “Medium and Long-term Plan for the Development of Science and Technology (2006–2020)” with a target of the 2.5% General Engineering R&D (GERD)/GDP ratio by 2020 [18]. The strong government support of geoscience, allowed Chinese academia to exhibit the record growth between 2008 and 2015. In 2013, we observed a 15% increase in R&D spending by China compared with 2012 [19]. The number of publications by Chinese academia is now almost equal to that in the USA. Figure 7 indicates that Europe has been reducing investment into exploration technology since the 1990s. Perhaps this is due to the maturity of many oilfields, and the low probability of discovery of new profitable oil fields. In short term, we do not expect a significant decrease in the number of USA academic publications. At the same time, we foresee fewer publications from the European and Chinese Academy due to travel restrictions.
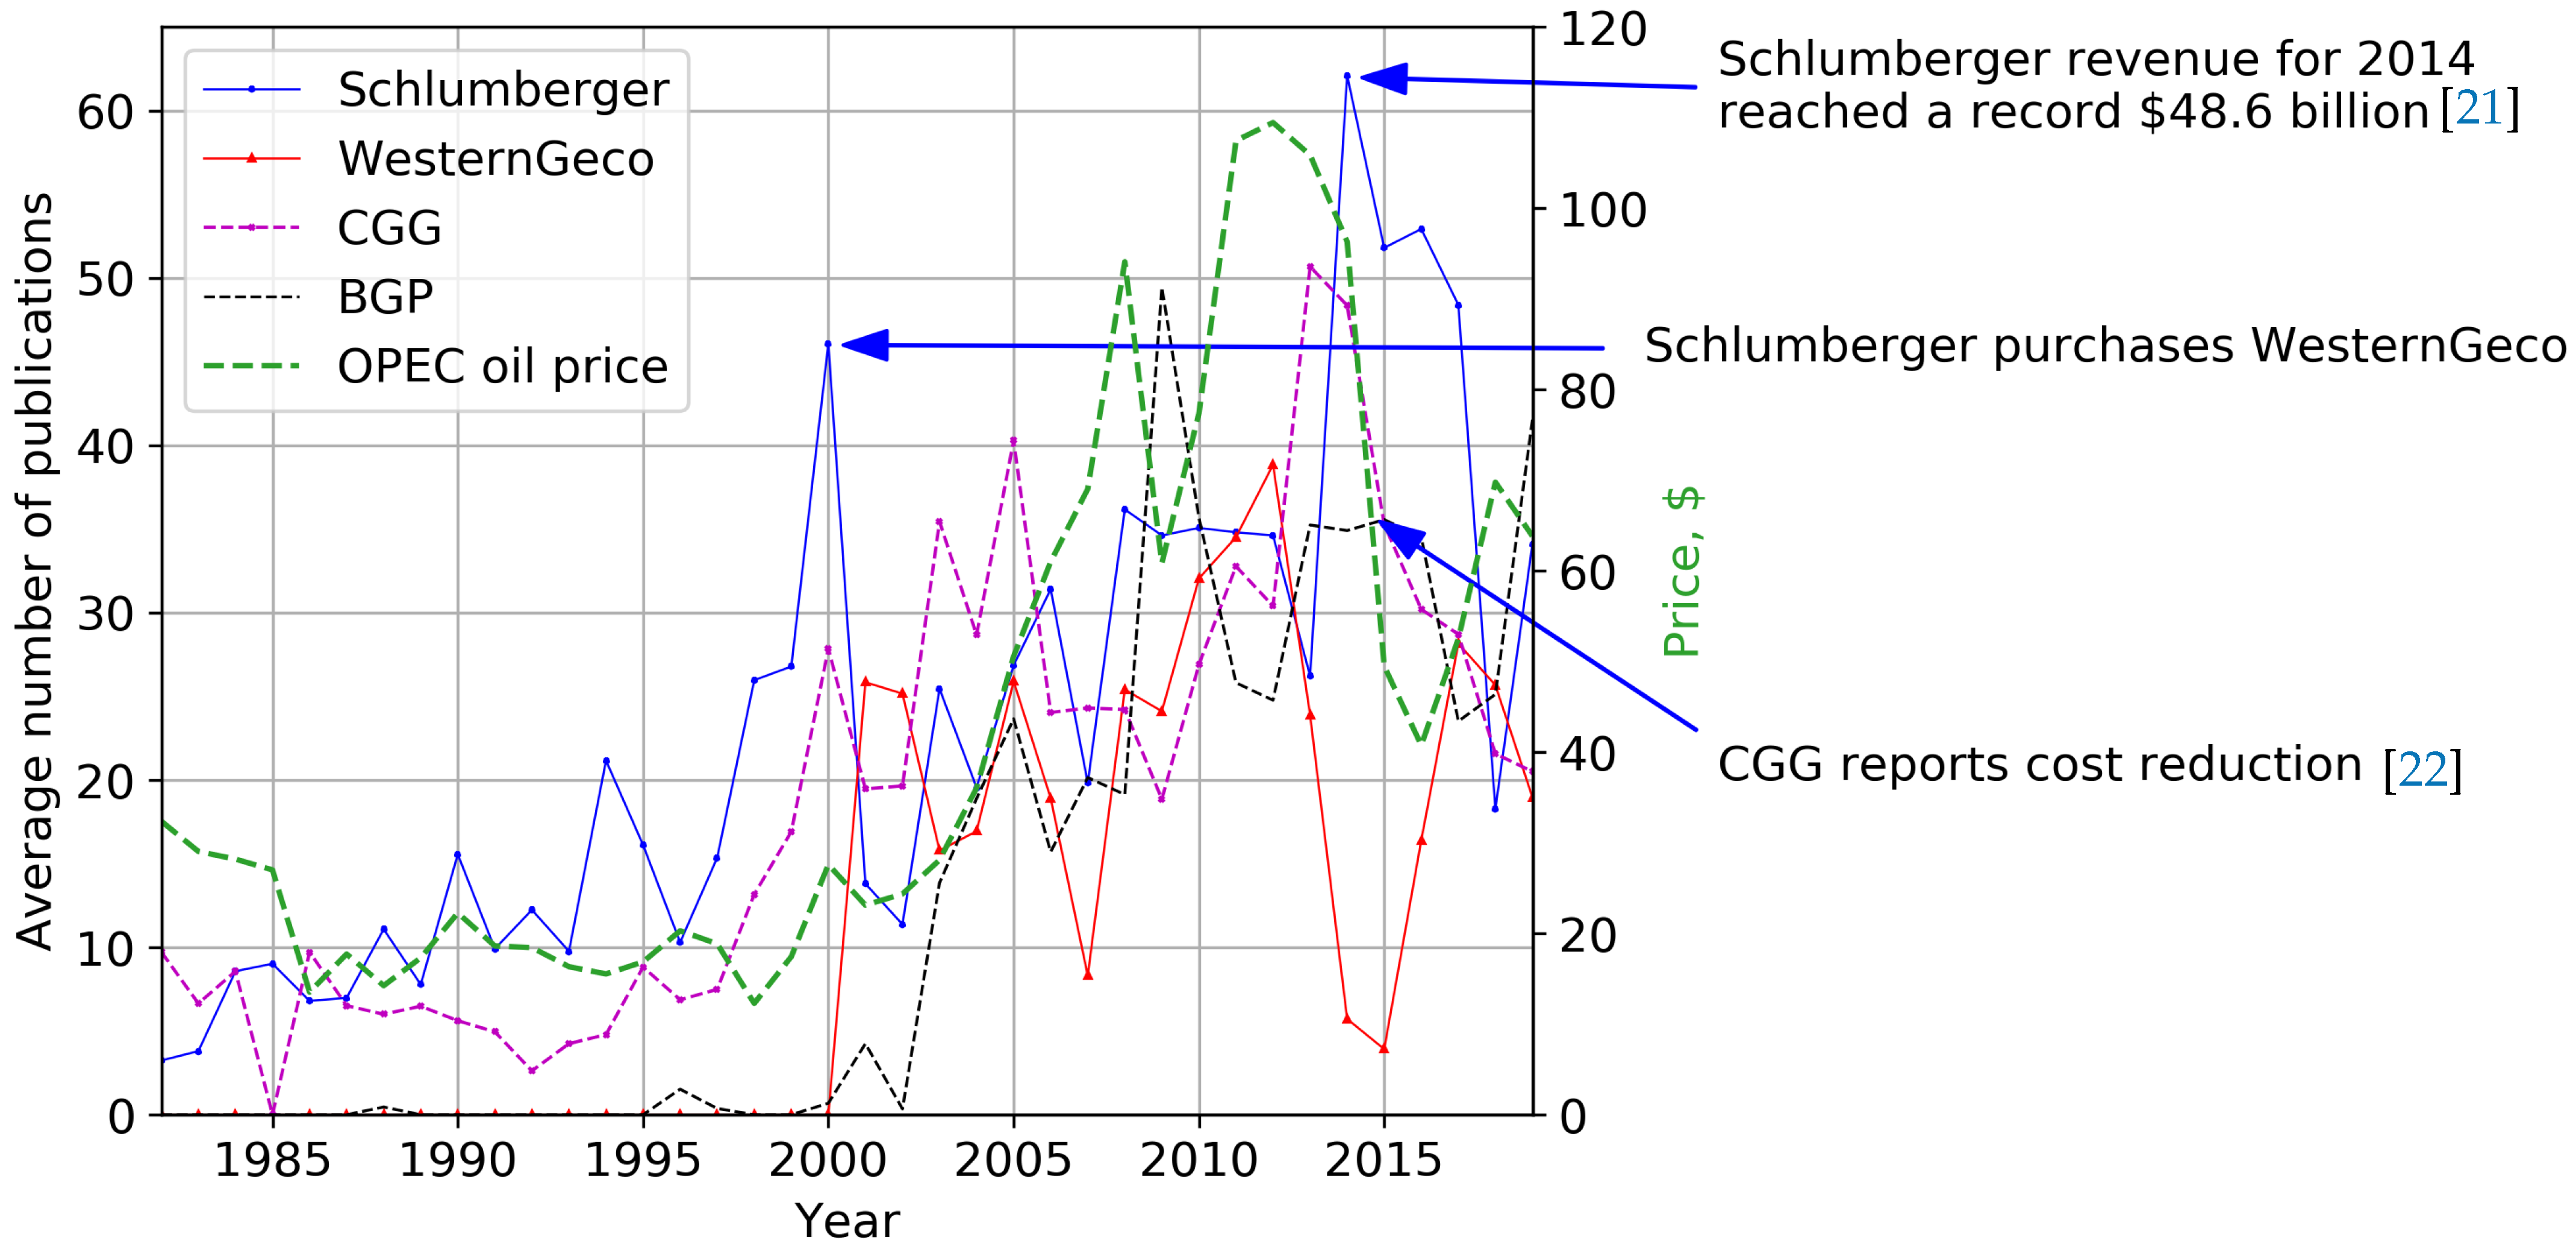
Figure 8 shows the average number of papers by oilfield service companies. The most frequent guests at the SEG annual conferences have been Schlumberger, WesternGeco, CGG, and BGP. Although WesternGeco is now a part of Schlumberger, we show them separately according to the affiliation. Schlumberger dominates industrial geophysics research, followed by CGG and BGP. In general, the number of publications by the major oilfield service companies grew steadily. Although oilfield service providers depended on oil prices, we surprisingly observe that after the 2014 crisis, the number of Schlumberger publications peaked for several consecutive years [21], followed by a decline in 2018. It should be noted that in 2014, Schlumberger reported an outstanding revenue of $48.6 billion. The dynamics of Schlumberger’s papers reflect the dynamics of oil prices with a delay of a few years. The number of CGG publications follows crude oil prices too, but since 2014, the number of publications from CGG has been declining. The 2015 Annual Report by CGG mentions the extremely difficult market environment [22], and the cost reduction measures: a reduction in the number of employees from 11,060 to 7353, the 55% general and administrative cost cuts, and a 64% cut of the cost of marine vessels (A comparison of the 2013 and 2015 indicators). In January 2020, CGG reported its exit from marine acquisition, and the sale of its ships and seismic equipment to Shearwater company [23]. It is, therefore, likely that we will see fewer publications from CGG in the coming years.
The change in the number of BGP publications shows a similar correlation with the crude oil prices, with one or two years of delay. In 2019, BGP became a leader by the number of publications among oil-service providers.
Many oil and gas companies that no longer exist made significant contributions to the SEG annual conferences in the 1980s, and early 1990s. They are Arco Oil and Gas Co., Mobil E&P, OYO Corporation, Statoil, and others. These companies either merged with others, changed their names, or were acquired.
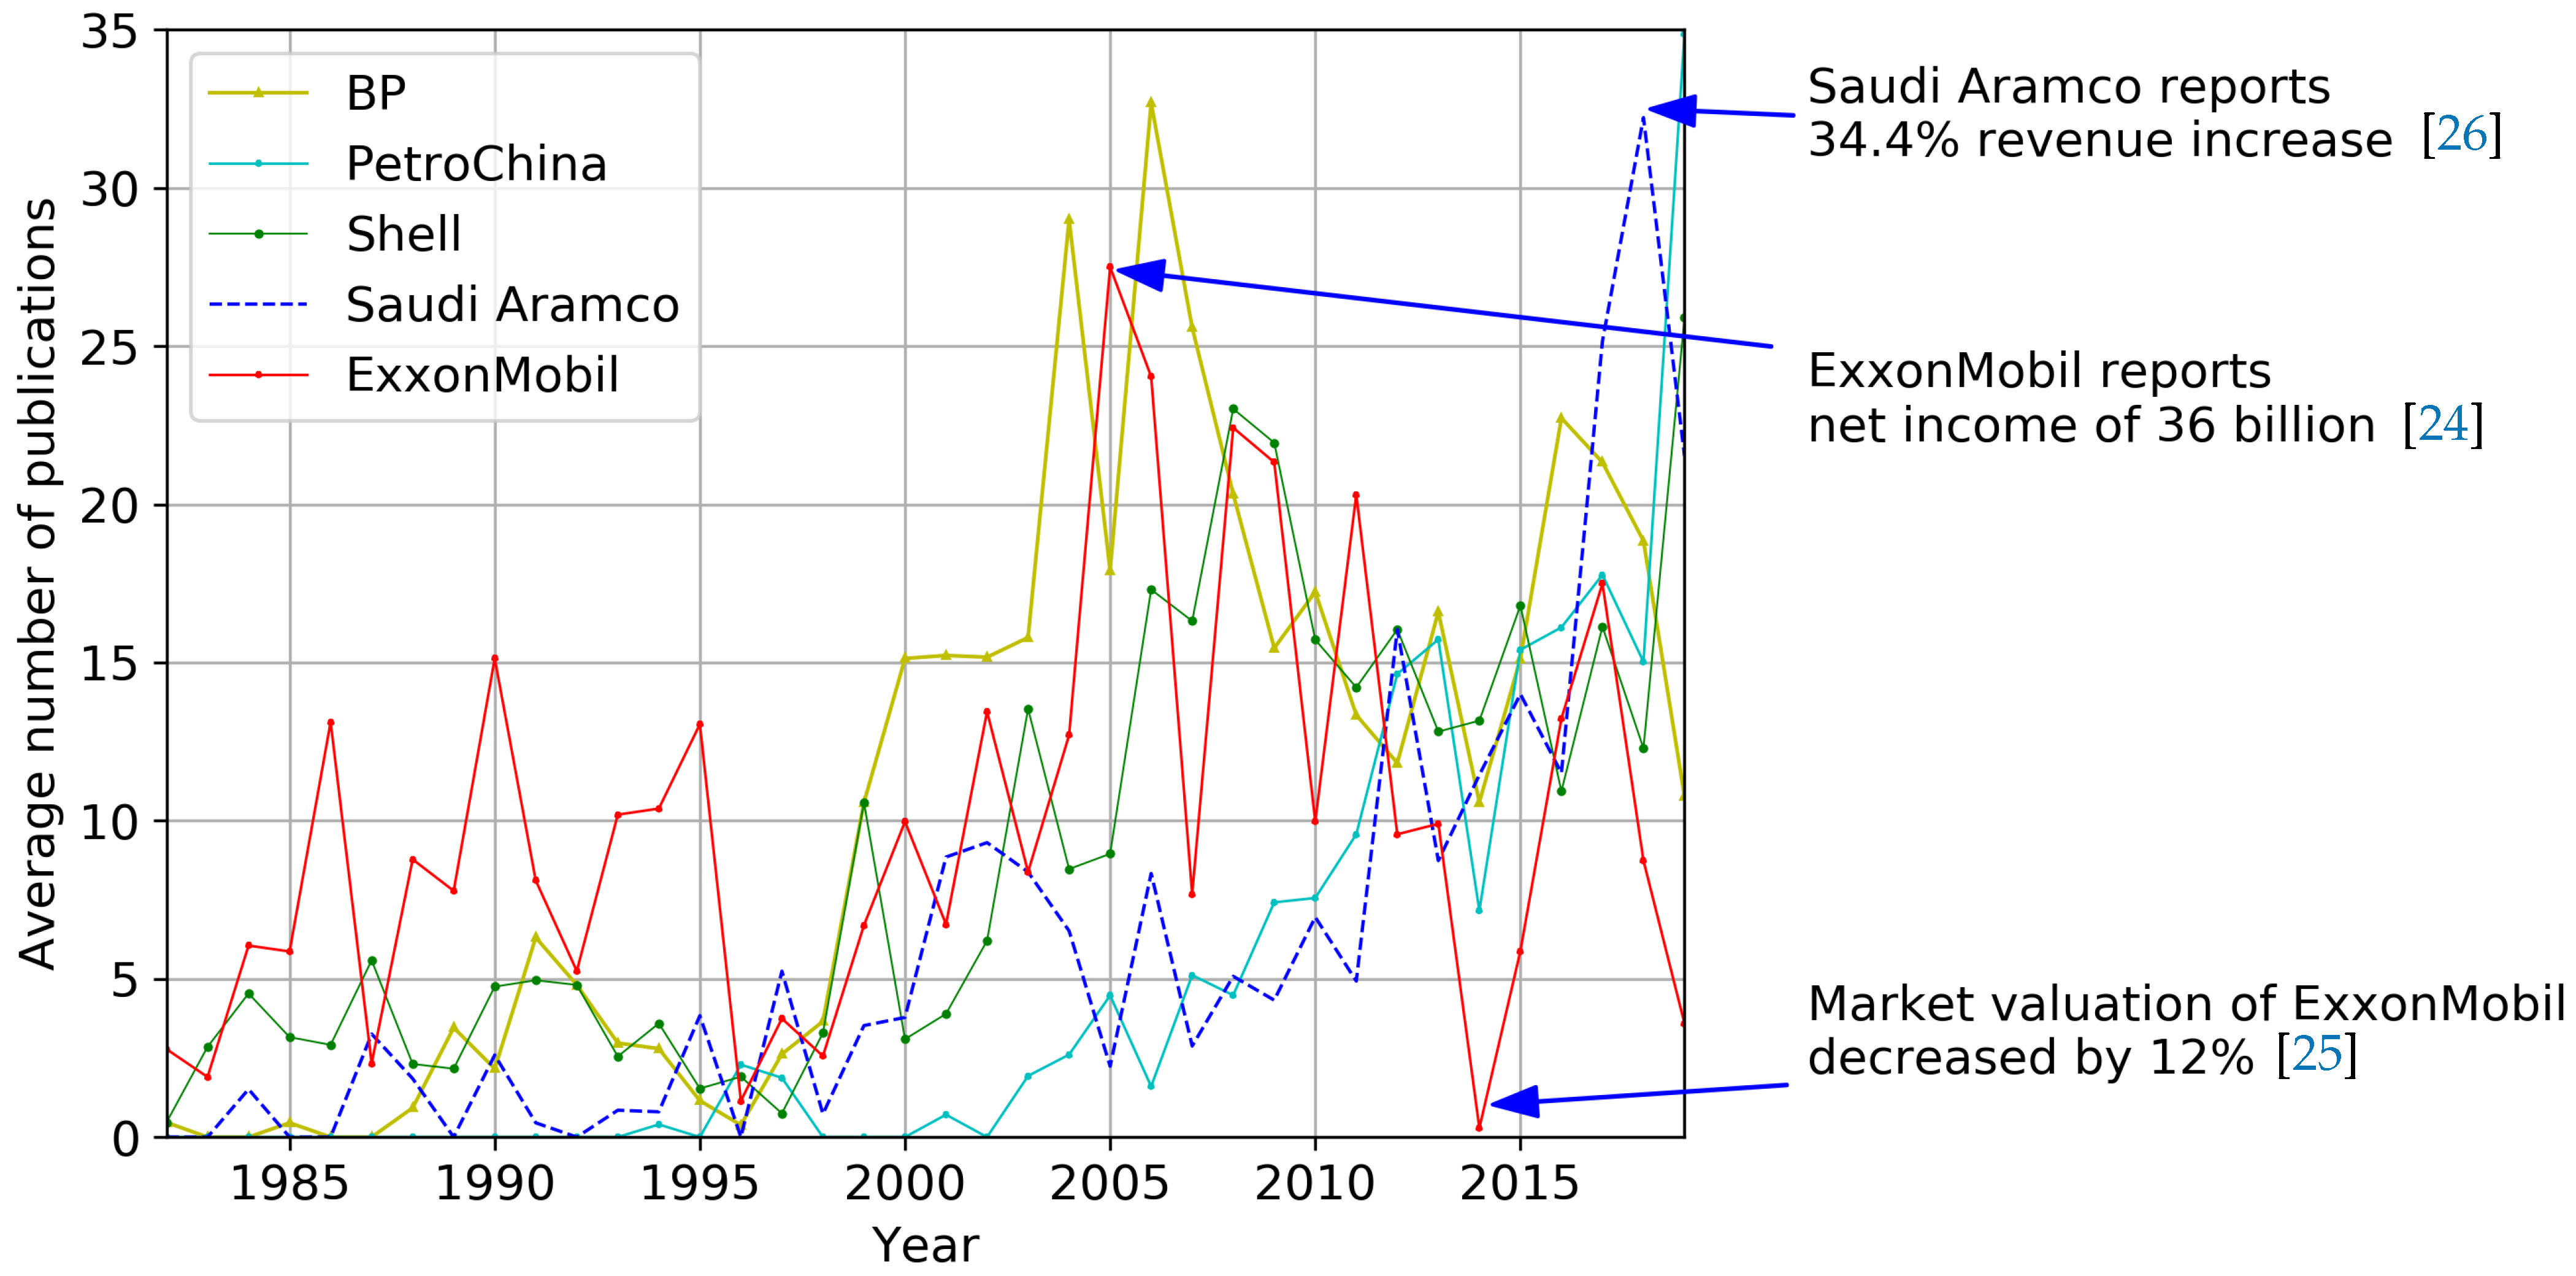
Figure 9 displays five oil production companies with the most significant numbers of publications. The picture is conceptually different from oil-service companies. For example, ExxonMobil’s and BP’s number of publications peaked in 2005 and 2006, respectively, and declined since then for both companies. At the same time, we notice a spike in BP’s publications in 2016. 2005 was outstanding for ExxonMobil, with a net income of 36 billion USD and a 31% increase in the number of employees [24]. We observe steady growth in several of the key economic indicators of the company since the beginning of 2000. At the same time, a decrease in the number of publications indicates a difficult period for the company. For instance, in 2014, we found only one paper from ExxonMobil, which had not happened over the past 15 years. The 2014 ExxonMobil Summary Annual Report [25] shows that compared with 2013, market valuation at the end of the year decreased by 12%, and we observe further erosion of the stock market price of ExxonMobil in 2015. A decrease in profit immediately affects research financing. Saudi Aramco demonstrates steady growth; it had the biggest number of publications of all production companies in 2017 and 2018. Interestingly enough, the leadership was taken by PetroChina in 2019, followed by Shell and Saudi Aramco. In 2021 BGP and PetroChina will have the largest number of publications among oilfield service and oil companies. They have gained a significant momentum in the number of publications and will keep releasing new results for the next few years, including 2021, and the annual conference in 2021. Schlumberger and WesternGeco advance more slowly. We presume they will maintain number of publications in 2021, but will soon go on decline along with CGG, because they have stopped marine seismic research. We do not expect an increase in publications from BP or Exxon Mobil. In contrast, the biggest players, such as Saudi Aramco and/or Shell, will compete with BGP and PetroChina in the coming years.
We see how hard it is for the companies to endure the recurring market crises. In this case, the number of publications decreases, but behind these graphs there is usually a decrease in research budgets, and once in a while it means a reduction in staff. The oil industry is experiencing likely the biggest crisis ever [27]. For example, the prices of future contracts on oil went negative briefly [28]. The authors understand that the growing crisis in the industry has been exacerbated by the effects of the COVID-19 pandemic. At the same time, it is also obvious that we will need hydrocarbons to ensure a decent life for all, and we will need specialists who know how to find and extract the hard-to-reach resources. It is not easy to make predictions for the future after the pandemic, and beyond 2021, but we dare to assume that the GeoMrt will face significant changes in the direction of reducing the amount of exploration and increasing computer data processing.
5. Conclusions
We presented metadata analysis of 24,500 SEG papers published by more than 75,000 authors over 38 years. Academic institutions from 86 countries and more than 2400 industrial companies contributed to the SEG annual conferences between 1982 and 2019. US academia has had the most significant impact on the proceedings of the SEG annual conferences during the entire observation period. We observe that the number of papers from Chinese academia is growing, and it is almost equal to that from the US. Although highly uncertain in the COVID-19 world, our 2021 forecast is that the USA academy will hold first place followed by China and Canada. The level of research activity of companies that participate in the SEG annual conferences correlates with their economic well-being. Annual reports by CGG and ExxonMobil and other companies confirm this statement. Depending on the strength of the market and the price of oil, the relative publication contributions by academia and industry change. The number of companies that publish only a small number of papers has been growing. In 2018, we observed more abstracts from academia, but in 2019 the number of publications from academia and industry was almost even. In 2019, the most published companies were BGP and PetroChina. In 2021, we expect to see most of the publications from BGP and PetroChina followed by Schlumberger, Saudi Aramco, and Shell. It is very likely that CGG publications will plummet. The average number of authors per paper continues to grow over time in agreement with the global trend of Earth and Planetary science, but at a slower rate. The average number of authors per geophysical publication will keep on growing following the global trend.
Author Contributions
Data mining and processing, software development, original draft preparation—T.E.; software development and analysis, review and editing of the draft—M.Y.; supervision, project administration, historical analysis, review, and editing of the paper—T.W.P. All authors have read and agreed to the published version of the manuscript.
Funding
Eltsov was supported by the KAUST Magnetic Sensor project, REP-2708.
Acknowledgments
The authors are grateful to their colleagues, especially to Thomas Finkbeiner, for their valuable research recommendations. The authors are grateful to Ilya Kolganov for the useful advice on the design of the graphs. We also would like to acknowledge Charles Russell Severance for an informative Python course.
Conflicts of Interest
The authors declare no conflict of interest.
Abbreviations
The following abbreviations are used in this manuscript:
| BGP | Bureau of Geophysical Prospecting Ltd., owned by China Petroleum Corporation |
| BP | BP plc., formerly The British Petroleum Company and BP Amoco |
| CGG | Compagnie Générale de Géophysique |
| EAGE | European Association of Geoscientists and Engineers |
| GB | Giga Byte |
| GDP | Gross Domestic Product |
| GERD | Gross domestic Expenditure on Research and Development |
| HTML | HyperText Markup Language |
| ICT | Information and Communication Technology |
| KTH | KTH Royal Institute of Technology in Stockholm |
| OPEC | The Organization of the Petroleum Exporting Countries |
| PIL | Python Imaging Library |
| R&D | Research and Development |
| SEG | Society of Exploration Geophysicists |
| Wt | Watt |
| USA | The United States of America |
| ZB | Zetta Byte |
Appendix A

Table A1.
The Total Number of Academic Publications by Country.
| # | Country Name | Total Number of Publications |
|---|---|---|
| 1 | United States of America | 5151.69 |
| 2 | China | 1649.95 |
| 3 | Canada | 952.47 |
| 4 | Netherlands | 608.15 |
| 5 | France | 546.53 |
| 6 | United Kingdom of Great Britain and Northern Ireland | 462.14 |
| 7 | Germany | 330.39 |
| 8 | Australia | 302.54 |
| 9 | Brazil | 264.0 |
| 10 | Japan | 205.62 |
| 11 | Russian Federation | 178.75 |
| 12 | Norway | 176.36 |
| 13 | Italy | 164.11 |
| 14 | Saudi Arabia | 145.46 |
| 15 | Korea, Republic of | 138.62 |
| 16 | Switzerland | 113.01 |
| 17 | India | 99.08 |
| 18 | Mexico | 62.15 |
| 19 | Denmark | 57.58 |
| 20 | Israel | 55.69 |
| 21 | Taiwan | 49.44 |
| 22 | Sweden | 41.45 |
| 23 | Venezuela (Bolivarian Republic of) | 28.01 |
| 24 | Argentina | 25.78 |
| 25 | South Africa | 24.53 |
| 26 | Nigeria | 23.96 |
| 27 | United Arab Emirates | 19.75 |
| 28 | Czechia | 19.34 |
| 29 | Spain | 17.86 |
| 30 | Egypt | 16.78 |
| 31 | Singapore | 14.98 |
| 32 | New Zealand | 14.77 |
| 33 | Romania | 13.7 |
| 34 | Indonesia | 13.42 |
| 35 | Malaysia | 12.66 |
| 36 | Greece | 12.06 |
| 37 | Portugal | 11.74 |
| 38 | Ukraine | 11.08 |
| 39 | Colombia | 10.25 |
| 40 | Finland | 9.8 |
| 41 | Austria | 6.92 |
| 42 | Iran (Islamic Republic of) | 6.78 |
| 43 | Ireland | 5.62 |
| 44 | Belgium | 5.43 |
| 45 | Slovakia | 5.35 |
| 46 | Poland | 5.22 |
| 47 | Turkey | 5.2 |
| 48 | Serbia | 4.5 |
| 49 | Thailand | 4.34 |
| 50 | Jamaica | 4.32 |
The numbers are fractional because many articles were written jointly by authors from different institutions in different countries.
We divide the total number of affiliations in each country by the average number of co-authors for each year.
References
- Reinsel, D.; Gantz, J.; Rydning, J. The Digitization of the World From Edge to Core. Available online: www.seagate.com/files/www-content/our-story/trends/files/idc-seagate-dataage-whitepaper.pdf (accessed on 4 March 2020).
- Costenaro, D.; Duer, A. The Megawatts behind Your Megabytes: Going from Data-Center to Desktop. Available online: www.aceee.org/files/proceedings/2012/data/papers/0193-000409.pdf (accessed on 4 March 2020).
- Heddeghem, W.; Lambert, S.; Lannoo, B.; Colle, D.; Pickavet, M.; Demeester, P. Trends in worldwide ICT electricity consumption from 2007 to 2012. Comput. Commun. 2014, 50, 64–76. [Google Scholar] [CrossRef] [Green Version]
- Walsh, B. The Surprisingly Large Energy Footprint of the Digital Economy [UPDATE]. Science Time. 2013. Available online: science.time.com/2013/08/14/power-drain-the-digital-cloud-is-using-more-energy-than-you-think/ (accessed on 15 March 2020).
- Morley, J.; Widdicks, K.; Hazas, M. Digitalisation, energy and data demand: The impact of Internet traffic on overall and peak electricity consumption. Energy Res. Soc. Sci. 2018, 38, 128–137. [Google Scholar] [CrossRef]
- Dulac, J.; Abergel, T.; Delmastro, C. Data Centres and Data Transmission Networks. Available online: www.iea.org/reports/tracking-buildings/data-centres-and-data-transmission-networks (accessed on 4 March 2020).
- Internet Drar 10% av Världens Elanvändning—Och Andelen Stiger. Available online: cornucopia.cornubot.se/2019/02/internetdrar-10-av-varldens.html?m=1 (accessed on 4 March 2020).
- BP Statistical Review of World Energy, 68th ed.; Technical Report; BP: Uckfield, UK, 2019.
- SEG Technical Program Expanded Abstracts. Available online: library.seg.org/series/segeab (accessed on 2 December 2019).
- Eltsov, T.; Yutkin, M.; Patzek, T. Text Analysis Reveals Major Trends in Exploration Geophysics. Energies 2020, 13, 4550. [Google Scholar] [CrossRef]
- Vlad, I. Exploratory analysis of affiliation information in Geophysics articles from 1936 to 2017. Lead. Edge 2018, 37, 682–686. [Google Scholar] [CrossRef]
- Eltsov, T.; Patzek, T. The Database of Words and Affiliations of the SEG Annual Conferences (1982–2019). Available online: zenodo.org/record/3870702#.XtTYbjozbZQ (accessed on 31 May 2020). [CrossRef]
- Rescher, N. Scientific Progress—A Philosophical Essay on the Economics of Research in Natural Science; University of Pittsburgh Press: Pittsburgh, PA, USA, 1978. [Google Scholar]
- OnePetro Online Library. Available online: www.onepetro.org (accessed on 2 December 2019).
- Brownstein, R. American Higher Education Hits a Dangerous Milestone. Available online: www.theatlantic.com/politics/archive/2018/05/american-higher-education-hits-a-dangerous-milestone/559457/ (accessed on 13 April 2020).
- Nedorub, O.; Swinford, B. SEG TECHNICAL PROGRAM EXPANDED ABSTRACTS 2020. SEG. 2020. Available online: https://library.seg.org/doi/book/10.1190/segeab.39 (accessed on 23 November 2020).
- Mallapaty, S. Paper Authorship Goes Hyper, 2018. Available online: natureindex.com/news-blog/paper-authorship-goes-hyper (accessed on 17 October 2019).
- UNESCO SCIENCE REPORT, Towards 2030; Technical Report; UNESCO: Paris, France, 2015.
- Ni, X. China’s research & development spend. Nature 2015, 520, S8–S9. [Google Scholar] [CrossRef] [PubMed] [Green Version]
- Global Economic Data, Indicators, Charts& Forecasts, CEIC. Available online: www.ceicdata.com (accessed on 10 February 2020).
- Schlumberger. 2014 Annual Report; Technical Report; Schlumberger: Paris, France, 2015. [Google Scholar]
- CGG. Annual Report 2015; Technical Report; CGG: Chicago, IL, USA, 2015. [Google Scholar]
- CGG Completes Its Exit from Marine Acquisition. Available online: www.cgg.com/en/Investors-/Press-Releases/2020/01/CGG-Completes-its-Exit-from-Marine-Acquisition (accessed on 2 February 2020).
- ExxonMobil. Summary Annual Report 2005; Technical Report; ExxonMobil: Irving, TX, USA, 2005. [Google Scholar]
- ExxonMobil. Summary Annual Report 2014; Technical Report; ExxonMobil: Irving, TX, USA, 2014. [Google Scholar]
- Saudi Arabian Oil Company. Consolidated Financial Statements for the Year Ended 31 December 2018. Available online: www.saudiaramco.com/-/media/publications-/corporate-reports/saudi-aramco-results-2017-2018-full-financials.pdf (accessed on 11 February 2020).
- Sheppard, D. Oil Industry Faces Biggest Crisis in 100 Years. Available online: www.ft.com/content/7afb4c04-6d58-11ea-89df-41bea055720b (accessed on 6 May 2020).
- US Oil Prices Turn Negative as Demand Dries up. Available online: www.bbc.com/news/business-52350082 (accessed on 6 May 2020).
Figure 1.
Data processing workflow.

Figure 2.
The last 38-years of academic publications by country. Europe is in the zoomed inset in the lower-left corner. The circle on Antarctica represents erroneous affiliations and serves as an error indicator.
Figure 2.
The last 38-years of academic publications by country. Europe is in the zoomed inset in the lower-left corner. The circle on Antarctica represents erroneous affiliations and serves as an error indicator.

Figure 3.
The annual publication contributions by industry and academia.

Figure 4.
Growth rate of the number of co-authors for the SEG Annual Conferences and the Earth and Planetary science [17].
Figure 4.
Growth rate of the number of co-authors for the SEG Annual Conferences and the Earth and Planetary science [17].

Figure 5.
Average number of papers vs. the number of companies that published these papers.

Figure 6.
Average number of publications by academia from the top four contributing countries. Data sources: [15,18,19].

Figure 7.
Average number of publications by France, UK, Germany, and Australia. Crude oil production data are from ref. [20].
Figure 7.
Average number of publications by France, UK, Germany, and Australia. Crude oil production data are from ref. [20].

Figure 8.
The average number of publications by oil-service companies and OPEC crude oil prices.


Publisher’s Note: MDPI stays neutral with regard to jurisdictional claims in published maps and institutional affiliations. |
© 2020 by the authors. Licensee MDPI, Basel, Switzerland. This article is an open access article distributed under the terms and conditions of the Creative Commons Attribution (CC BY) license (http://creativecommons.org/licenses/by/4.0/).
Share and Cite
MDPI and ACS Style
Eltsov, T.; Yutkin, M.; Patzek, T.W. Metadata Analysis Reveals Major Worldwide Trends in Industrial and Academic Geophysics. Energies 2021, 14, 107. https://doi.org/10.3390/en14010107
AMA Style
Eltsov T, Yutkin M, Patzek TW. Metadata Analysis Reveals Major Worldwide Trends in Industrial and Academic Geophysics. Energies. 2021; 14(1):107. https://doi.org/10.3390/en14010107
Chicago/Turabian StyleEltsov, Timofey, Maxim Yutkin, and Tadeusz W. Patzek. 2021. "Metadata Analysis Reveals Major Worldwide Trends in Industrial and Academic Geophysics" Energies 14, no. 1: 107. https://doi.org/10.3390/en14010107
Note that from the first issue of 2016, this journal uses article numbers instead of page numbers. See further details here.