Article

An Assessment of Different Integration Strategies of Hydrothermal Carbonisation and Anaerobic Digestion of Water Hyacinth

by
Aaron E. Brown
1,
Jessica M. M. Adams
2,
Oliver R. Grasham
1,
Miller Alonso Camargo-Valero
3,4 and
Andrew B. Ross
1,*
1
School of Chemical and Process Engineering, University of Leeds, Leeds LS2 9JT, UK
2
Institute of Biological, Environmental and Rural Sciences (IBERS), Aberystwyth University, Gogerddan, Aberystwyth SY23 3EB, UK
3
BioResource Systems Research Group, School of Civil Engineering, University of Leeds, Leeds LS2 9JT, UK
4
Departamento de Ingeniería Química, Universidad Nacional de Colombia, Campus La Nubia, Manizales, Colombia
*
Author to whom correspondence should be addressed.
Energies 2020, 13(22), 5983; https://doi.org/10.3390/en13225983
Submission received: 9 October 2020 / Revised: 6 November 2020 / Accepted: 14 November 2020 / Published: 16 November 2020
(This article belongs to the Section A4: Bio-Energy)

Abstract

:
Water hyacinth (WH) is an invasive aquatic macrophyte that dominates freshwater bodies across the world. However, due to its rapid growth rate and wide-spread global presence, WH could offer great potential as a biomass feedstock, including for bioenergy generation. This study compares different integration strategies of hydrothermal carbonisation (HTC) and anaerobic digestion (AD) using WH, across a range of temperatures. These include (i) hydrochar combustion and process water digestion, (ii) hydrochar digestion, (iii) slurry digestion. HTC reactions were conducted at 150 °C, 200 °C, and 250 °C. Separation of hydrochars for combustion and process waters for digestion offers the most energetically-feasible valorisation route. However, hydrochars produced from WH display slagging and fouling tendencies; limiting their use in large-scale combustion. AD of WH slurry produced at 150 °C appears to be energetically-feasible and has the potential to also be a viable integration strategy between HTC and AD, using WH.

1. Introduction

Water hyacinth (WH) (Eichhornia crassipes (Mart.) Solms) is widely regarded as one of the most prolific invasive macrophyte species, being placed as one of the top 10 most troubling weeds in the world [1,2]. Originally native to South America, WH now dominates freshwater bodies across Asia, Africa, Australia, and North America [1]. WH was introduced into Lake Victoria in East Africa in the 1980s and has been problematic ever since [3,4,5]. A surge in WH growth can have devastating effects on the natural ecosystem and local communities. Such effects include deoxygenation of the water [5] leading to a reduction in aquatic species present and prevention of local fishing practices [5,6]. However, rapid, wide-spread growth of WH offers an opportunity for utilizing the biomass to generate bioenergy.
The generation of biomethane from WH through anaerobic digestion (AD) is a well explored area of research. However, many studies recommend a form of pre-treatment to disrupt the lignocellulosic structure of WH to enhance biomethane yields. A wide variety of pre-treatment techniques have been applied to WH in an attempt to improve its biodegradability; including thermochemical [7], drying [6,8], alkali [6], ionic liquid [9], and microwave-heated alkali pre-treatment with enzymatic hydrolysis [10]. Additionally, there has also been a focus on the hydrothermal pre-treatment of WH [11,12,13,14,15]; where heated water is used as a reactant media. Ferrer et al. [11] reported that hydrothermal treatment at 80 °C had no significant improvement on biomethane production, despite an increased solubilisation of organic matter extracted from WH. The authors suggest either an increased treatment temperature or extended retention time may improve the AD of WH [11]. An increased pre-treatment temperature of 121 °C exhibited improved biomethane yields by 33% [13] compared to untreated WH. Pre-treatment at a temperature of 170 °C is reported to improve biomethane yields further by 51% compared to untreated WH [14]. It is important to state that these are separate studies and utilize different samples of WH. The biochemical composition of WH is highly varied across studies; the analysis of samples reported in review papers [16,17] show a wide range in biochemical composition, including; cellulose (17.3–31.0%), hemicellulose (20.3–43.4%), and lignin (1.1–26.4%). Therefore, the composition of WH is expected to vary across sampling sites; likely due to the influence of differing environmental conditions on plant growth. It has also been shown that the composition of WH varies seasonally— i.e., in the River Nile [18]. Therefore, a direct comparison of the digestion behaviour between WH samples from different studies should be treated with caution. Hydrothermal pre-treatment of WH has been previously investigated and, most studies have focused on the effect of a single hydrothermal pre-treatment temperature, rather than exploring the effect of a range of temperatures on biomethane generation. Limited studies exist, which compare different steam pre-treatments of WH across a range of treatment conditions [12,15].
Hydrothermal carbonisation (HTC) is an example of hydrothermal treatment. HTC involves the processing of biomass in an aqueous environment, under elevated temperatures (160–250 °C) [19] and pressures; which at higher temperatures generates a solid hydrochar and is thought to simulate the natural coalification process [20]. Alongside hydrochar, a process water is generated; rich in solubilised organic and inorganic species from the original biomass. Hydrochar is typically used as a solid combustion fuel [19], but has a multitude of alternative applications, including soil amendment, energy storage and as an absorbent [19,21]. Recent studies have been reported on the HTC of WH [22,23,24]; these being largely focused on the generation and characteristics of the hydrochar; with applications as a combustion fuel or for CO2 sequestration. The combustion properties of fresh WH are not ideal; due to a high moisture content, high inorganic content and low calorific value. The moisture content of WH is generally >90% [16,25,26,27]. HTC is suited towards high moisture feedstocks, due to the use of water as a reactant media. Typically, the calorific value of dried WH ranges from between 13.78–14.68 MJ/kg [22,23,24]. Previous studies have investigated the production of biomass pellets [26] and briquettes [28] from WH for combustion. This includes blending WH with other biomass; such as empty fruit bunch fibers [27]. However, WH pellets and briquettes offer little in the way of energy densification; with the calorific value of WH pellets between 14.24–14.69 MJ/kg [26] and WH briquettes in a range from 14.55–14.58 MJ/kg [27,28]. Whereas hydrochar produced from WH can show increased energy densification [22,23,24]; up to a calorific value around 21 MJ/kg [23]. An additional issue identified from WH pellet production is the high ash concentration and chloride content [26]. High inorganic content can cause slagging, fouling and corrosion issues during combustion [29]. HTC has been shown to selectively remove problematic inorganics from hydrochar, reducing the slagging and fouling propensity of the fuel [29,30]. Therefore, HTC has the potential to be a suitable technology for the conversion of water hyacinth into a solid combustion fuel.
Recently, there has been increased interest in the integration of HTC and AD to increase the energy recovered from a feedstock. However, a number of integration strategies are present, with limited information on the most energetically feasible valorisation route. One HTC and AD integration strategy is the use of lower-temperature HTC as a hydrothermal pre-treatment to enhance the biodegradation of biomass; including macroalgae [31,32], food waste [33], and rice straw [34,35]; through digestion of the residual mixed slurry (hydrochar and process water). Alternatively, another integration strategy is the digestion of hydrochars alone [36]. Finally, a further integration strategy is to separate the hydrochar and process water for alternative applications; such as combustion and AD, respectively. During HTC, the structure of the biomass is broken apart and organic and inorganic components solubilised into an aqueous fraction [20,37,38]. The solubilised organic fraction contains readily-digestible material that can bypass the hydrolysis stage of AD, often a difficult step for lignocellulosic biomass, due to its recalcitrant structure [39]. AD of HTC process waters have been studied for a range of feedstocks [20,38,40,41,42,43], including lignocellulosic biomasses [44]. However, this has not yet been conducted for water hyacinth.
Few studies have compared the different integration strategies between HTC and AD [41,45]. For both macroalgae [41] and the organic fraction of municipal solid waste [45], separation of hydrochar for combustion and process waters for AD was the most energetically feasible integration strategy. However, information for comparison of HTC and AD integration strategies for lignocellulosic biomass has not yet been reported, neither has the anaerobic digestion of process waters from the hydrothermal carbonization of water hyacinth. The novelty of this study, therefore, is investigating the performance and energetics of the different integration strategies for water hyacinth.
The aim of this research is to compare the feasibility of different HTC and AD integration strategies to improve the energetic recovery from water hyacinth. The different integration strategies investigated in this study include (i) hydrochar combustion and process water digestion, (ii) hydrochar digestion alone, and (iii) slurry digestion alone. This includes an initial characterisation of the hydrochars and process waters from HTC reactions across a range of temperatures. Secondly, an assessment of the biomethane yields from the hydrothermal products from WH; process waters, hydrochars, and slurries. Finally, an assessment of the suitability of each of the different integration strategies is discussed, in terms of the overall energetic balance.

2. Materials and Methods

2.1. Sample Collection and Preparation

2.1.1. Water Hyacinth

WH samples were collected from Lake Victoria, Uganda in December 2018 (0°17′21.6″ N 32°39′ 16.6″ E) and dried to a moisture content of approximately 7% by the Centre for Research in Energy and Energy Conservation (CREEC, Makerere University Kampala, Uganda). The sample collection site was accessed using a boat. A randomly selected composite sample was obtained from a 10 m2 grid. Approximately 50 kg of wet biomass was collected by hand and subsequently dried. The drying procedure involved sun-drying for approximately 3 weeks and subsequent oven drying (70 °C). The plants were kept whole; not separated into morphological constituents. A 4 kg representative subsample of dried WH was taken for further milling and analysis. Particle size was reduced to <1 mm using a cutting mill (Retsch, Germany, SM300) for HTC reactions as well as determining biomethane potential of untreated WH. Particle size was further reduced to <100 µm for proximate and ultimate analysis using a Cryomill (Retsch, Germany).

2.1.2. Inoculum

Inoculum samples were collected from the outlet of the AD reactor at Esholt wastewater treatment plant (WWTP) located in West Yorkshire, UK. Esholt is a municipal WWTP; treating sewage from an urban population of 750,000 people [46]. The AD reactor is used to treat sewage sludge and is maintained at a mesophilic temperature (37 °C). The inoculum was collected fresh, passed through a 1 mm sieve to remove large particulates and stored at 4 °C until required; no longer than 2 months.

2.2. Hydrothermal Carbonisation

HTC reactions were conducted using a 2 L non-stirred Parr reactor adding 96 g of dried WH sample to 880 mL of distilled water, achieving an approximate solid loading ratio of 10%. Reactions were conducted within a custom quartz reactor liner to facilitate easier transition of material out of the reactor. The holding temperatures of reactions were controlled at 150 °C, 200 °C, and 250 °C for a 60 min retention time. Resulting gauge pressures for these reactions were approximately 0 bar, 14 bar, and 43 bar, respectively. Heating was ramped at approximately 5 °C/min using a proportional–integral–derivative (PID) controller. After 60 min, the heating jacket was switched off and the reactor was allowed to cool to ambient temperature; approximately 20 °C. Once cooled, the reactor was de-pressurised and the solid and liquid products were separated by Büchner filtration through a Whatman Grade 4 filter paper for subsequent characterisation. WH treated at 150 °C could not be separated by Büchner filtration, due to the sponge-like, fibrous properties of the remaining solid; therefore solids and liquid fractions were separated using a Sigma 4–5 L centrifuge set at 4643× g for 10 min and the supernatant filtered through Büchner filtration. Solid residues, hereby referred to as hydrochars, were dried overnight in a Memmert drying oven at 60 °C, with aqueous losses recorded gravimetrically. Hydrochar yield (%) was determined according to Equation (1) [47]. Where Mh is the dried mass of hydrochar (g) and Mb is the dried mass of WH biomass added to the HTC reactor (g). The mass of the process water was calculated by subtracting the mass of hydrochar and the mass of gaseous products from the total mass of water and feedstock added to the reactor. The gas yield was calculated using the difference between total input and output masses. Reactions were conducted in duplicate and the products blended across reactions with the same conditions. Hydrochars were labelled ‘Char-150’, ‘Char-200’, and ‘Char-250’ for treatment temperatures of 150 °C, 200 °C, and 250 °C, respectively. Process waters were labelled ‘PW-150’, ‘PW-200’, and ‘PW-250’ for treatment temperatures of 150 °C, 200 °C, and 250 °C, respectively. The severity factor (SF) of the HTC reactions were calculated according to Equation (2) [48], where T is the temperature (°C) and t is time (min).
Hydrochar   Yield   % = M h M b   × 100
SF = log   [   t   × exp ( T 100 14.75 ) ]

2.3. Biochemical Methane Potential

2.3.1. Theoretical Biochemical Methane Potential

Theoretical biomethane potential (BMPth) of untreated WH, hydrochars and slurries were calculated stoichiometrically by applying the elemental composition to the Boyle’s equation; Equation (3) [42], where n, a, b, and c represent the molar fraction of C, H, O, and N, respectively. The Boyle’s equation assumes complete stoichiometric conversion of a substrate [49] with no differentiation between biodegradable and non-biodegradable fractions [50]. BMPth was assumed to be the maximal biomethane potential across all untreated and pre-treated WH samples. The elemental composition of HTC slurries was assumed to be the same as untreated WH; therefore, BMPth was also assumed to be the same. The Boyle’s equation was favoured over the Buswell equation due to the consideration to the contribution of nitrogen-containing compounds [49]. BMPth of process waters was based on the assumption 1 g COD = 350 NmL CH4 [49].
BMP th =   22400 n 2   +   a 8     b 4       3 c 8 12 n + a + 16 b + 14 c

2.3.2. Experimental Biochemical Methane Potential

The experimental biomethane potential (BMPex) of all samples were determined in duplicate using an AMPTS II (Bioprocess Control, Lund, Sweden) maintained at 37 °C for 30 day. A 2:1 inoculum-to-substrate ratio was used on a VS basis for solid samples (untreated WH, hydrochars and slurries). Solid samples were diluted to 10 g VS/L and inoculum to 20 g VS/L, using distilled water, before adding 200 mL of each of the sample and inoculum to the 500 mL reactors, leaving 100 mL headspace. A 2:1 inoculum-to-substrate ratio was used on a COD basis for process waters. Process waters were diluted to 10 g COD/L and inoculum to 20 g COD/L, using distilled water, before adding 200 mL of each of the sample and inoculum to the 500 mL reactors, leaving 100 mL headspace.
Inoculum was incubated in a water bath at 37 °C for approximately two days prior to setting up BMPex experiments, to reduce residual methane emissions. The headspace of each reactor was flushed with nitrogen gas to ensure anaerobic conditions. Reactors were automatically agitated for 60 s every 10 min. Blank reactors; containing only inoculum (200 mL at 20 g VS/L for solid samples and 200 mL at 20 g COD/L for process waters) and distilled water (200 mL) were run in parallel to account for residual biomethane emissions. The AMPTS II automatically normalises the volume of methane produced from each reactor (0 °C, 1.0 atm, and zero moisture content). The volumes of methane produced by the solid samples were calculated according to the units mL CH4/gVS using Equation (4). Where VCH4 sample is the volume of biomethane originating from the sample, VCH4 blank is the volume of biomethane originating from the blanks, CVS is the concentration of volatile solids added (10 g VS/L) and Vsample is the volume of sample added to the reactors (0.2 L). The volumes of methane produced by the process waters were calculated according to the units mL CH4/g COD using Equation (5). Where VCH4 sample is the volume of biomethane originating from the sample, VCH4 blank is the volume of biomethane originating from the blanks, CVS is the concentration of COD added (10 g COD/L) and Vsample is the volume of sample added to the reactors (0.2 L).
BMP ex =   V CH 4   Sample   V CH 4   Blank C VS   × V sample  
BMP ex =   V CH 4   Sample   V CH 4   Blank C COD   × V sample  

2.3.3. Biodegradability and Kinetic Modelling

The biodegradability of solid samples was calculated using the biodegradability index (BI), shown in Equation (6) [51] where BMPex is experimental biomethane potential (mL CH4/g VS), and BMPth is theoretical biomethane potential (mL CH4/g VS).
BI   % =   BMP ex BMP th   × 100
The modified Gompertz model; Equation (7) [52], was used to fit the BMPex curves to describe the process kinetics. Where Hm is the maximum biomethane yield (mL CH4/g VS), Rm is the peak biomethane production rate (mL CH4/g VS/d), λ is the lag-phase time (d), t is time (d), and e = 2.71828. Parameters; Hm, Rm, and λ were estimated by the least squares method using the Solver Function in Microsoft Excel [53]. The accuracy of the model fit was determined through a squared correlation coefficient (R2) between the experimental data and the model data. Where R2 > 0.95 is assumed to be a suitable fit.
H =   H m exp [   exp (   R m e H m   ( λ t ) + 1 ) ]
Parameters from the modified Gompertz model can be used to predict the peak time of fermentation (Tm); Equation (8), [52]. Additionally, the technical digestion time (T80), the time duration for the digestion system to generate 80% of the total cumulative biomethane yield, from the BMPex, was reported [54].
T m = H m R m e + λ  

2.4. Analytical Methods

2.4.1. Solid Sample Characterisation

Total solids (TS) and volatile solids (VS) were determined by drying the samples at 105 °C and subsequently ashing at 550 °C [55]. The VS of HTC slurries were calculated by determining the VS of the hydrochar and process water separately, before re-introducing the products as a mixed slurry, based on the yield data described in Section 2.2. The slurries were labelled ‘Slurry-150’, ‘Slurry-200’, and ‘Slurry-250’ for treatment temperatures of 150 °C, 200 °C, and 250 °C, respectively. The TS of HTC process waters were determined by drying at 60 °C to reduce losses of volatile components. Proximate analysis was conducted using a thermo-gravimetric analyser (TGA/DSC 1, Mettler Toledo). Ultimate analysis was conducted using a Flash 2000 (Thermo Scientific) CHNS analyser. Hydrogen data was corrected for moisture content and oxygen calculated through difference. Inorganic analysis was conducted using X-ray fluorescence spectrophotometry (XRF, ARL PER- FORM’X, Thermo Scientific). Samples were ashed at 550 °C for 2 h, removed and mixed before further ashing at 850 °C for 2 h. Fused glass discs were formed at 1100 °C, using an electric fluxer (K1 Prime Electric Fluxer, Katanax), containing 0.7 g of ash and 6.3 g of flux [43]. Fused beads were used during XRF analysis.

2.4.2. Solid Sample Combustion Properties

Higher heating value (HHV) of samples was calculated using Dulong’s equation; Equation (9) [24,29]; based on the ultimate analysis of the samples. The Dulong’s equation calculates the HHV (MJ/kg) based on the ultimate analysis of a sample, assuming the heat of combustion of a sample is equal to the heat of combustion of its elements. The energy density (ED) and energy yield (EY) of the hydrochars were calculated using Equations (10) and (11), respectively; according to [47].
HHV = ( 0.3383   × % Carbon ) + ( 1.422   × ( % Hydrogen ( % Oxygen 8 ) )
ED = HHV   hydrochar HHV   water   hyacinth
EY = ED   × Hydrochar   Yield   %
The likelihood of untreated WH and resultant hydrochars to cause slagging and fouling issues during combustion was determined though a number of slagging and fouling indices shown in Table 1; detailed in [29,43]. Indices include: Alkali index (AI), bed agglomeration index (BAI), acid base ratio (Rb/a), slagging index (SI), fouling index (FI), and slag viscosity index (SVI). These indices are based on the chemical composition of the fuel. Ash fusion testing (AFT) was conducted according to DD CEN/TS 15370-1:2006, using a Carbolite digital ash fusion furnace, as described by [29]. The ash melting behaviours; shrinkage, deformation, hemisphere, and flow were recorded to the nearest 10 °C.

2.4.3. Aqueous Sample Characterisation

Chemical oxygen demand (COD) and total phenol (TP) content was determined using HACH-Lange cuvettes LCK014 and LCK346, respectively (HACH, Manchester, UK). Total organic carbon (TOC) was measured by difference using a HACH IL 500 TOC-TN analyser. A HACH pH meter was used to measure the pH of samples. Volatile fatty acid (VFA) content was determined according to [54]. Total VFA was calculated through the summation of the concentrations of; acetic, propionic, isobutyric, butryric, isovaleric, valeric, isocaproic, caproic, and heptanoic acids. To determine sugar, furfural and HMF concentrations, aqueous samples were passed through a 0.45-µm syringe filter. Total sugar concentrations were determined using a high-performance liquid chromatography (HPLC) system (UltiMate 3000, Thermoscientific) equipped with a refractive index detector. A 10-µL aliquot of sample was injected onto a Supelcogel C610H column (30 cm × 7.8 mm), maintained at 30 °C. A 0.1% H3PO4 mobile phase was used, set at a flow rate of 0.5 mL/min. Total sugar was calculated through the summation of the concentrations of: glucose, maltose, lactose, fructose, and arabinose. Furfural and HMF concentrations were determined though gas chromatography-mass spectrometry (GC-MS) using a Shimadzu 2010QE GC-MS (Shimadzu Corporation, Kyoto, Japan). A 1-µL aliquot of sample was injected onto a Restex wax capillary column (Rtx®-Wax; 30 m, 0.25 mm ID and 0.25-µm) using Helium as the carrier gas. The programme conditions started at 40 °C, ramped to 220 °C at 20 °C/min, with a final hold time of 5 min.

2.5. Energy Balance

The energy balance of the different HTC and AD integration strategies were determined based on a starting material of 1 kg air-dried WH (approx. 7% moisture content); described in Section 2.1.1. Energy input was calculated as the energy required to heat the contents of a HTC reactor containing 1 kg WH and approximately 9.2 kg of water. These values were extrapolated from the solid loading ratio described in Section 2.2. The energy output was calculated according to the calorific value of the different energy vectors produced. Therefore, the units for both the energy input and output are MJ/kg-dried WH added.
Energy input for HTC was calculated using Equation (12); modified from [31] and based on a starting material of 1 kg of dried WH. Where Vw is the volume of water in the reactor (9.2 L), Cw and Cb is the specific heat capacity (MJ/kg/K) of the water and biomass, respectively, Mb is the mass of biomass (1 kg), Treac is the final temperature of the reaction (°C) and Tamb is the ambient temperature; assumed to be 25 °C. Water had an assumed specific heat capacity of 4200 J/kg/K [31] and WH had an assumed specific heat capacity of 1455 J/kg/K [56]. Additionally, 1 mL of water has an assumed mass of 1 g.
Energy   Input   HTC   MJ / kg = V w C w + M b C b × T reac T amb / M b
Energy output from the digestion of untreated WH was calculated according to Equation (13). Where Mb is the starting mass of WH biomass (1 kg), VS is the volatile solid content of the WH (%), BMPex is the experimental biomethane potential (L CH4/kg VS) and 1000 denotes the conversion of biomethane yield from L to m3 39.8 denotes the assumed HHV of methane (MJ/m3).
Untreated   WH   Digestion   MJ = M b × VS 100 × BMP ex 1000   × 39.8
Energy output was calculated from the combined energy outputs from the combustion of hydrochar and digestion of the process water. The energy output from the combustion of hydrochar was determined using Equation (14). Where Mh is the remaining mass of the hydrochar fraction (kg) after HTC of 1 kg of WH and HHV is the calorific value of the hydrochar on an as received basis (MJ/kg). The energy output from the digestion of the process water is based on the calorific value of the biomethane produced from the residual process water after the HTC of 1 kg of WH, Equation (15). Where Mpw is the predicted mass of residual process water (kg), following the HTC of 1 kg of WH, COD is the chemical oxygen demand of the process water (g/L), BMPex is the experimental biomethane potential (mL CH4/g COD) and 39.8 denotes the assumed HHV of methane (MJ/m3). Additionally, 1 mL of process water has an assumed mass of 1 g.
Hydrochar   Combustion   MJ = M h × HHV
Process   Water   Digestion   MJ = M p w × C O D × BMP ex 1 , 000 , 000   × 39.8
The energy output from the digestion of hydrochars alone was calculated according to Equation (16). Where Mh is the predicted residual mass of hydrochar (kg), following the HTC of 1 kg of WH, VS is the volatile solid content of the hydrochar (%), BMPex is the experimental biomethane potential (L CH4/kg VS) and 39.8 denotes the assumed HHV of methane (MJ/m3).
Hydrochar   Digestion   MJ = M h × VS 100 × BMP ex 1000   × 39.8
The energy output from the digestion of HTC slurries was calculated according to Equation (17). Where Ms is the predicted residual mass of slurry (kg), following the HTC of 1 kg of WH, VS is the volatile solid content of the slurry (%), BMPex is the experimental biomethane potential (L CH4/kg VS) and 39.8 denotes the assumed HHV of methane (MJ/m3).
Slurry   Digestion   MJ = M s × VS 100 × BM 1000   × 39.8
A net energy balance was calculated as the difference between energy output and energy input. An energy return on energy invested (EROI) calculation was determined according to Equation (18). Previous studies have assumed a 85% energy recovery efficiency for HTC processes [57]. However, in this study a more conservative assumption of 55% heat recovery efficiency was assumed for HTC.
EROI = Energy   Output Energy   Input   ×   0.45  

2.6. Error and Data Reporting

HTC reactions, BMPex tests and analytical methods were all conducted in duplicate except TGA, XRF, HPLC, and GC/MS. TOC analysis was based upon multiple injections until a maximum standard deviation of ±2% was achieved. Average values for analyses are reported alongside standard deviation values. Final biomethane yields are reported at the point of maximum cumulative generation.

3. Results and Discussion

HTC reactions were conducted on WH samples from Lake Victoria (Uganda) at 150 °C, 200 °C, and 250 °C. Following these treatments, solid and aqueous product streams; hydrochars and process waters were separated and characterised, with the results shown in Section 3.1 and Section 3.2, respectively.

3.1. Characteristics of Untreated WH and Hydrochars

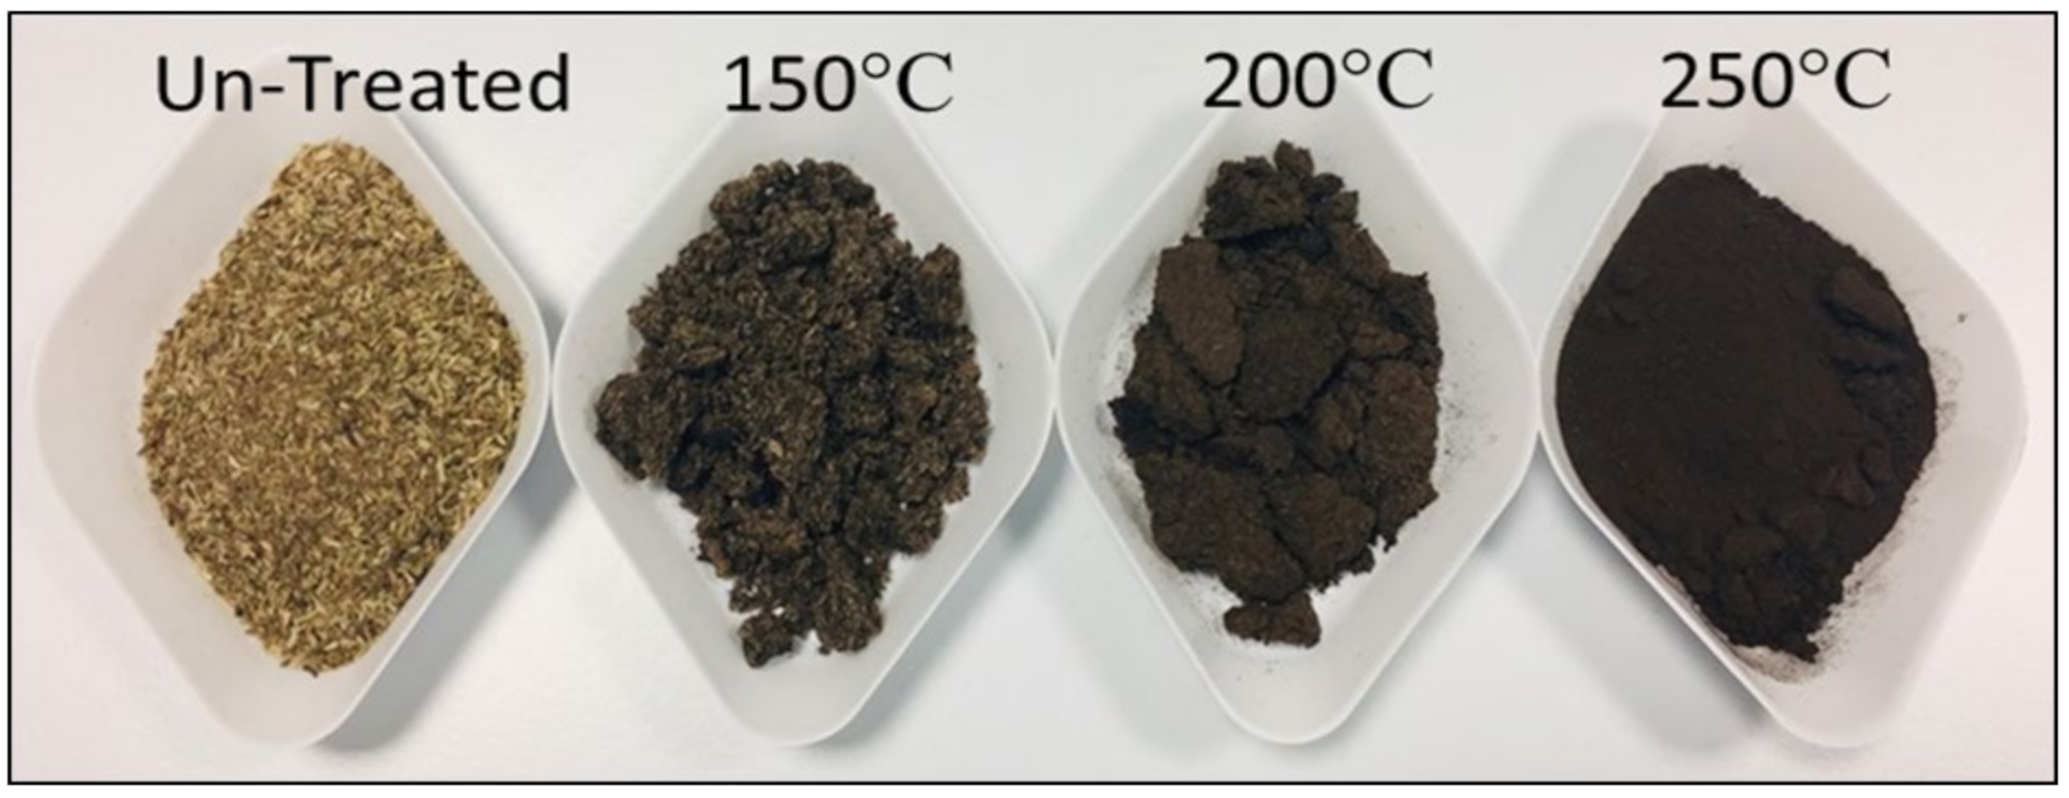
3.1.1. Composition of Untreated WH and Hydrochars

Table 2 displays the proximate and ultimate composition of the untreated WH and hydrochars across the different HTC treatment temperatures. The untreated WH had an ash content of 14.6%; typically higher than other lignocellulosic biomasses, such as willow, miscanthus, and oak wood [29]. The increased ash content is likely due to linked to the phytoaccumulation properties of WH [58]. The VS content of Char-150 and Char-200 increased slightly compared to the feedstock; as shown in Table 2, on both a dry and as received basis, despite the ash being higher in the hydrochars. The ash content presented from the proximate analysis was performed using TGA (900 °C). It is possible the ash content of the feedstock may be underestimated, due to loss of volatile inorganics, this is less likely in the hydrochars, due to solubilisation of the alkali metals into the process water [29]. The VS was determined separately, at a lower ashing temperature (550 °C), it is also possible this could be underestimated due to unburnt carbon in the ash. There are often anomalies with the determination of VS associated with devolatilisation of inorganics and carbon burnout, during determination, this behaviour is feedstock dependent. Char-250 shows a reduced VS content, compared to the untreated WH; which, in this case, is consistent with the ash content determined by TGA. The anomalies are likely due to the materials behaving differently during thermal treatment, this creates a small differences in the loading concentrations in subsequent BMP tests, however, these effects are minor and are difficult to avoid. Hydrochars also showed an increased carbon and fixed carbon content, compared to the untreated WH. The carbon content of the hydrochars increased with increasing HTC temperature. Oxygen content decreased with increasing HTC temperature. The decreased oxygen content is linked to dehydration and decarboxylation reactions during HTC; which remove carboxyl, carbonyl, and hydroxyl functional groups from the biomass [29].
The nitrogen and sulphur concentrations are crucial to the application of hydrochars as a solid combustion fuel, due to the formation of NOx and SOx emissions. The release of NOx and SOx emissions during combustion can result in severe environmental and human health impacts [59]. Sulphur was not detected in any of the hydrochar samples; suggesting SOx emissions would be negligible. Zhang et al. [22] showed low levels of SO2 from the combustion of WH, with WH hydrochars showing further reduced SO2 emissions, especially hydrochars produced at higher temperatures (210–270 °C). The nitrogen content of untreated WH; 2.7%, is relatively high compared to other lignocellulosic biomasses such as; willow, miscanthus, oak wood, and greenhouse waste [29]. Gao et al. [24] also report a high N-content of WH hydrochars of around 3%. Table 2 shows hydrochars produced at 150 °C and 200 °C had a similar N-content to the untreated WH. However, N-content of Char-250 increased to 3.4%, suggesting higher NOx emissions, if used as a solid combustion fuel. A linear increase between fuel-N content and NOx emissions has been reported for wood, coal, and processed fuels [60]. However, as only wood and coal samples were studied, this linear trend was only investigated for samples with a maximum N-content of approximately 2%. Therefore, the emissions from higher N-containing fuels; such as those in Table 2, would be expected to produced even higher NOx emissions. Sommersacher et al. [61] also found an increasing correlation between fuel-N and NOx emissions, including high-N feedstocks; waste wood and cereals with a fuel-N of 1–10%. Despite this, Sommersacher et al. [61] also found as fuel-N content increased, the conversion rate of N to NOx decreased. An alternative study of NOx emissions from the combustion of microalgae species [62] found no correlation between N-content and NOx emissions. Therefore, NOx emissions are likely to be feedstock dependent, with the mechanisms of NOx emissions from alternative feedstocks; such as WH and hydrochars, requiring further investigation. Despite this, Zhang et al. [22] suggest WH hydrochars show reduced NOx emissions compared to untreated WH.
The C:N ratio of untreated WH was 14:1; below the optimal ratio for AD 25–30:1 [63]. Again, highlighting the presence of high levels of nitrogen in the feedstock. The hydrochars showed a slight improvement in the C:N ratio, with Char-200 displaying a C:N ratio of 18. Although, that is still not within the optimal range for AD; indicating potential inhibition through nitrogenous species [64].
All hydrochars contained a higher proportion of ash compared to the untreated WH (Table 2); suggesting an ash-concentration effect as organic matter is solubilised into the HTC process water. High inorganic content affects the HHV, but could also lead to problems during combustion; such as slagging, fouling, and corrosion [51]. HTC is known to selectively extract some inorganics found in biomass; including alkali salts; such as sodium and potassium [29,65]. Sodium and potassium are particularly influential in the slagging and fouling behaviour of a fuel [29]. Table 3 shows the inorganic composition of untreated WH and WH hydrochars. Increasing HTC temperature showed removal of sodium and potassium. An exception to this is Char-250; which showed an increase in potassium content compared to Char-200. Smith et al. [29] found calcium, magnesium and phosphorus undergo more limited removal compared to sodium and potassium. This trend is observed with WH as calcium concentration of the hydrochars is higher than the original WH. Both magnesium and phosphorus showed the greatest removal at Char-200, but Char-250 showed higher magnesium and phosphorus concentrations than the original biomass. Iron and silicon were both present in higher concentrations in the hydrochars, compared to the original biomass. This has been previously observed with other feedstocks; such as food waste and sewage sludge [29]. The ash chemistry of biomass is complex under HTC conditions [29] with different biomasses contributing different matrix affecting the fate of inorganics. Limited removal of some inorganics; Ca, P, Mg, and Fe have been reported [29]; meaning these elements become concentrated in the hydrochars, as organic matter is solubilised into the process water. The results are consistent with P accumulating in the hydrochar, possibly due to the presence of Ca. Re-adsorption of metals from the process water onto the hydrochar surface, at higher temperature HTC has also been reported [66].

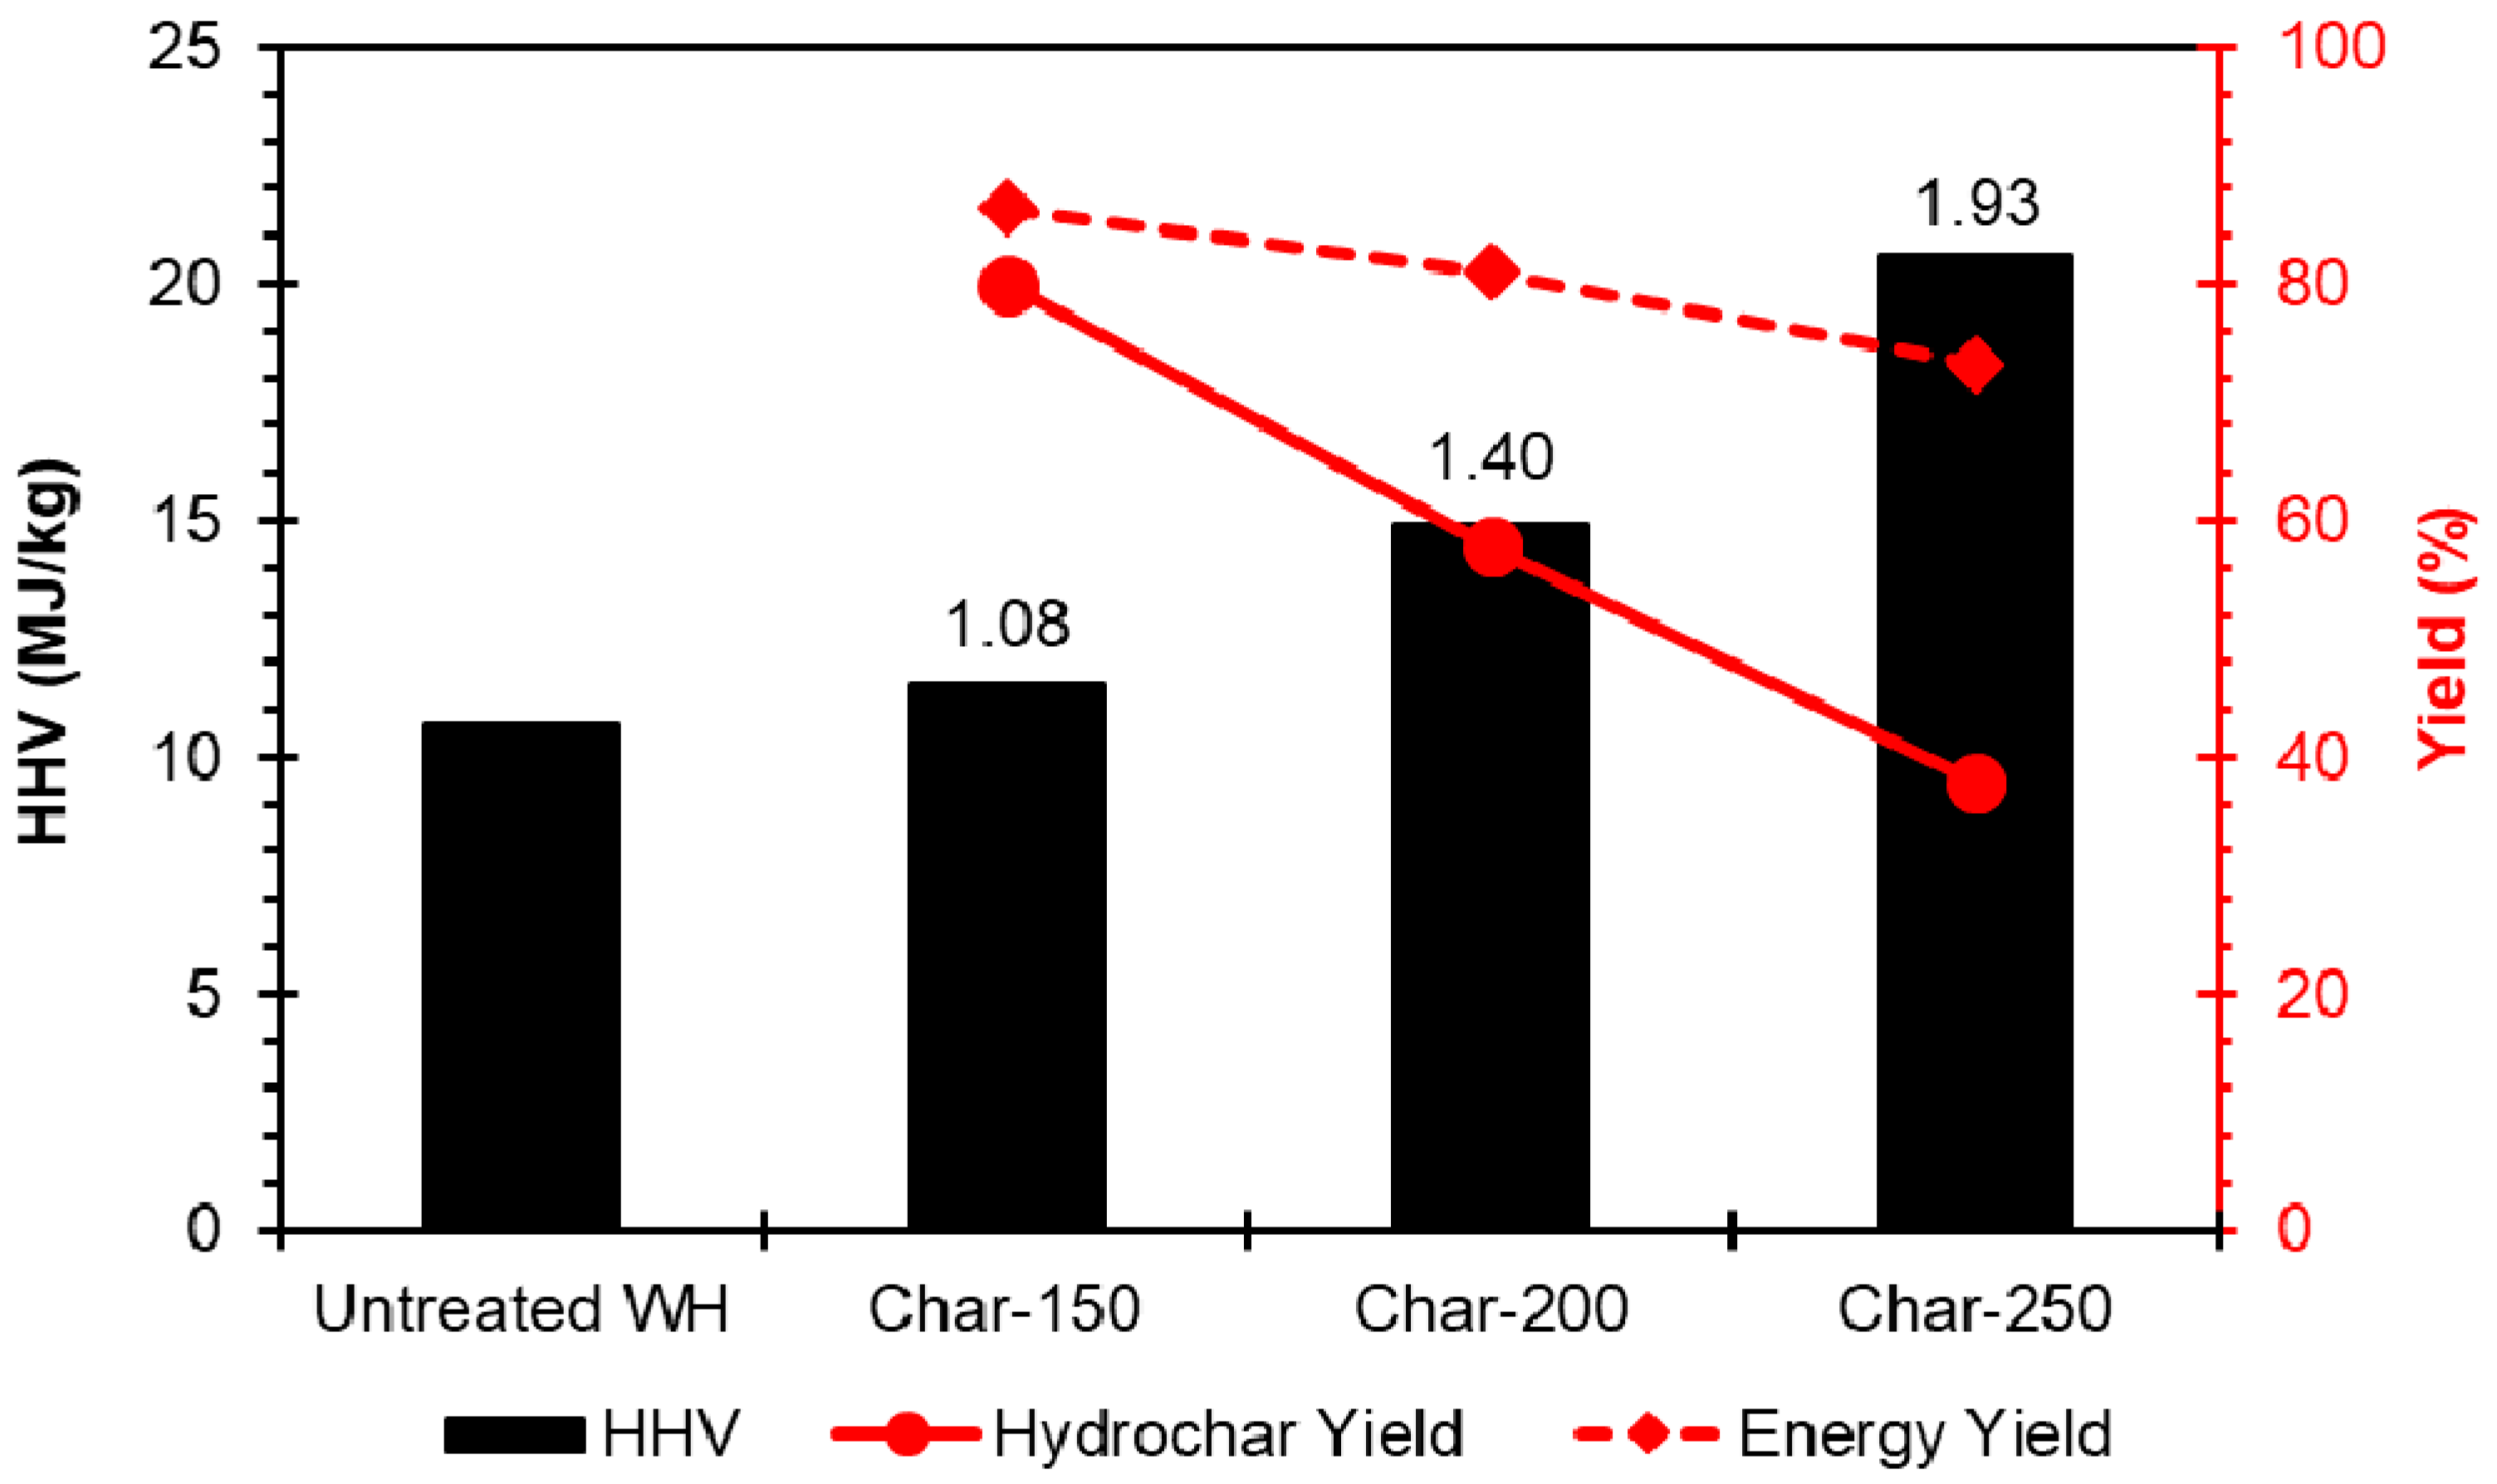
3.1.2. Energetic Properties of Untreated WH and Hydrochars

Figure 1 shows the HHV of the untreated WH was 10.7 MJ/kg. WH is typically an unsuitable feedstock for direct combustion, due to its low calorific value, high inorganic content, and high moisture content. HTC is often considered to simulate the natural coalification process [67]; generating an energy densified solid, hydrochar [19]. The HHV of all hydrochars was higher than the untreated WH and increased with increasing HTC temperature. The HHV of Char-150, Char-200, and Char-250 was 11.5 MJ/kg, 14.9 MJ/kg, and 20.6 MJ/kg, respectively. This corresponds to an energy densification of 1.08, 1.40, and 1.93, respectively. Figure 2 displays the changing appearances of the hydrochars under the different HTC conditions. A darker, more coal-like hydrochar was observed at HTC temperature increased. In a related study, WH hydrochar produced at 232 °C had a HHV of 21.2–21.8 MJ/kg [23], similar to Char-250, shown in this study. This increase in HHV is due to the increase in the carbon content; including fixed carbon and a reduction in the oxygen content of the hydrochars; Table 2. Hydrochar yield is widely reported to decrease with increasing HTC temperature across a range of biomass types [29,38,41,65,68,69], typically in a sigmoidal fashion [69]. Figure 1 shows hydrochar yield of Char-150, Char-200, and Char-250 was 79.9%, 57.8%, and 37.8%, respectively. Zhang et al. [22] found HTC of WH at 180 °C, 210 °C, 240 °C, and 270 °C gave hydrochar yields of 47.9%, 48.0%, 33.1%, and 28.8%; slightly lower than found in this study; highlighting differences between different samples of WH. The reduction in hydrochar yield with increased HTC temperature means the energy yield also decreases with increasing HTC temperature. Figure 1 shows the energy yield from the hydrochars was 86.3%, 80.9%, and 73.2% for Char-150, Char-200, and Char-250 respectively. Therefore, despite the greater energy densification that occurs at higher HTC temperatures, the reduced hydrochar yield causes a reduction in the overall energy yield.

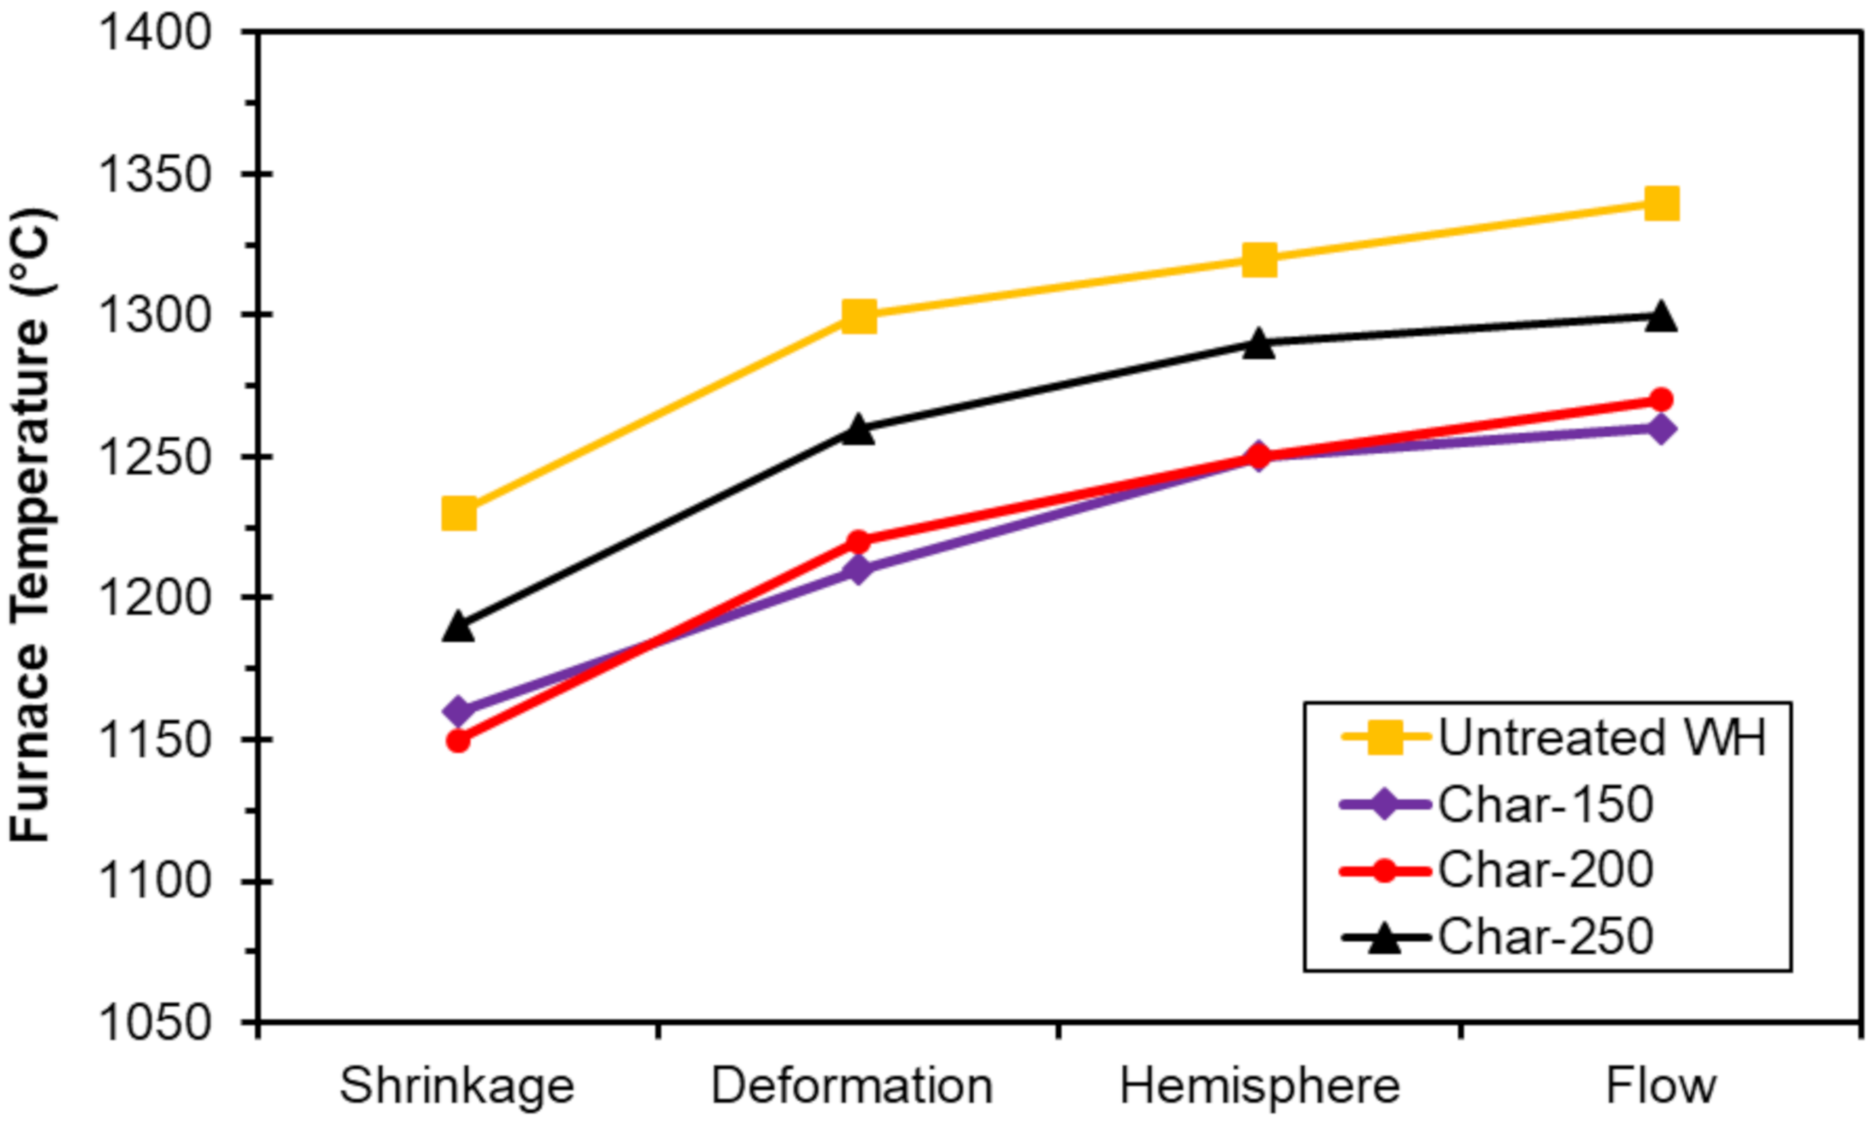
3.1.3. Ash Behaviour Properties of Untreated WH and Hydrochars During Combustion

Table 4 displays the calculated slagging and fouling indices for untreated WH and WH hydrochars. All predictive indices suggested no significant improvement to the ash behaviour. The alkali index (AI) was >0.34 for all samples; suggesting almost certain slagging and fouling for untreated WH and hydrochars. Bed agglomeration ratio (BAI) was >0.15 for all samples; indicating bed agglomeration was not likely. Slagging index (SI) was <0.6 for all samples; suggesting a low slagging inclination. The fouling index (FI) indicated a medium risk of fouling for untreated WH and WH hydrochars. The acid base ratio (Rb/a) and slag viscosity index (SVI) both indicated a high risk of slagging for untreated WH and WH hydrochars. Although hydrochars showed slight improvements in the AI, Rb/a, FI, and SVI values compared to the untreated WH, a risk of slagging and fouling was still predicted. However, the results given from these predictive indices must be interpreted with caution as they are originally based on coal samples [30], rather than biomasses, and assume biomass ash will show similar slagging and fouling behaviours to coal ash; with alumino-silicate compositions [29]. Therefore, in order to better understand the ash behaviour of untreated WH and WH hydrochars, an ash fusion test was conducted; shown in Figure 3. The ‘deformation’ temperature is the point where ash becomes sticky and the ‘flow’ temperature is the melting temperature of the ash [29]. Higher temperatures for the ash transition stages indicates a reduced slagging potential of the sample [29]. Figure 3 shows the temperatures for the deformation and flow stages were higher with untreated WH, compared to the WH hydrochars. This indicates that hydrochars showed no improvement in ash behaviour compared to the untreated WH; suggesting slagging and fouling may still pose a potential risk. Deformation and flow temperatures for Char-250 were slightly higher than Char-150 and Char-250; suggesting reduced slagging and fouling risk with Char-250. However, the deformation and flow temperatures were lower than untreated WH. Previously, Smith et al. [29] found hydrochars from a range of biomasses showed an increased deformation and flow temperature during ash fusion tests, compared to the parent material. This was linked to the significant removal of potassium and sodium from the biomass during HTC [29]. Smith et al. [29] found on average 84–97% of the potassium was removed from a range of feedstocks (excluding sewage sludge) during HTC at 250 °C; this was reduced to 60–93% at 200 °C. Using the values in Table 3 and hydrochar yields [65]; calculated potassium removal for Char-150, Char-200, and Char-250 was 29%, 69%, and 66%, respectively; suggesting limited potassium removal, compared to other feedstocks. Sodium removal for Char-150, Char-200, and Char-250 was 36%, 60%, and 79%, respectively. The reduced removal of sodium and potassium compared to other biomasses could explain the limited effectiveness of HTC to reduce slagging and fouling propensity for WH.
Therefore, the application of hydrochars from WH in large-scale combustion could be problematic due to slagging and fouling issues. Therefore, using WH hydrochar as a combustion fuel on a smaller scale; for example, as a cooking fuel, could be a potential application route; as slagging and fouling issues are not a significant issue in these systems. Previous work has shown HTC does not improve the slagging and fouling potential from AD digestate [43] and these hydrochars undergo limited energy densification. The authors recommend these hydrochars not be used as a solid fuel; but used for alternative applications [43]. These include: energy storage, batteries and super capacitors, soil amendment, a low cost sorbent for phytoremediation applications and carbon sequestration [21,67]. WH hydrochar could also be used for these alternative purposes, if large-scale combustion appears problematic.

3.2. Characteristics of Process Waters

Table 5 displays the composition of the process waters across HTC reactions. The concentrations of both COD and TOC increased with increasing HTC temperature; suggesting more organic matter is being solubilised into the aqueous phase at more severe reaction conditions. Hudakorn and Sritrakul [26] found the aqueous phase squeezed from untreated WH to have a COD of 6 g/L. Table 5 shows higher COD results compared to [26]; exhibiting the effectiveness of HTC to solubilise organic matter. The reduced hydrochar yield at increased HTC temperature (Figure 1) also suggests a mass balance shift towards the process water at higher temperatures. TOC represents between 37–40% of the COD concentration, across all process waters. The VS content of the process waters increased between PW-150 and PW-200, again suggesting an increase in the solubilisation of organic matter. However, the VS concentration decreased between PW-200 and PW-250. Oven drying of process waters is likely to result in evaporative losses of volatile components [65]. Losses are expected to be greater with higher-temperature process waters; due to the greater concentration of lower molecular-weight species. PW-200 contained the highest concentrations of HMF (5-hydroxymethylfurfural) and furfural. HMF and furfural are formed from the dehydration of solubilised sugar derivatives [10,19,70], typically forming around 200 °C [71] where cellulose begins to degrade to monomeric sugars and subsequent furanic compounds [38,69]. Table 5 also shows a reduction in total sugar concentration with increasing HTC temperature, suggesting these compounds are degraded into furanic compounds. HTC-250 shows a reduced concentration of HMF and furfural compared to HTC-200, a similar finding to other studies [69], suggesting the higher pre-treatment temperature of 250 °C degrades furanic compounds.

3.3. Biochemical Methane Potential

The cumulative biomethane generation of untreated WH and each of the WH HTC products; process waters, hydrochars, and slurries is displayed in Figure 4a–c, with the digestion kinetics described in Table 6.
The experimental biomethane yield of the untreated WH was 103 mL CH4/g VS. The biogas and biomethane yields of untreated WH samples have been determined across many literature studies; with samples sourced from a variety of countries, including; Australia [72], India [6,73,74,75], China [9], and Egypt [13]. However, striking differences can be seen in the biomethane yields of WH across studies; ranging from negligible biomethane yields [6] to much higher values than the one reported here: 113 mL CH4/gVS [13], 140 mL CH4/g VS [72], 143 mL CH4/gVS [75], 174 mL CH4/g VS [15], 189 mL CH4/g VS [11], and 252 mL CH4/g VS [12]. Alternatively, studies describe the biogas generation from WH sourced from China; 86 mL biogas/g VS [9] and India; 143 mL biogas/g VS [25] and 185 mL biogas/g VS [73]. This suggests harvesting location can affect biomethane yields from WH. However, the variations in WH biomethane potentials could also be linked to a number of additional variables, including; seasonal variation in biochemical composition [18], biomass maturity and variations in the methodology of determining biomethane potential. This creates difficulties in comparing biomethane yields across literature. In this study, untreated WH had a similar biomethane yield (103 mL CH4/g VS) to that reported by [13] (113 mL CH4/g VS). The theoretical biomethane potential (BMPth) of the untreated WH sample was 349 mL CH4/g VS; shown in Table 6. Therefore, the biodegradability index (BI) for the untreated WH was 30%; highlighting the low anaerobic biodegradability of the lignocellulosic matrix of WH. The untreated WH sample used by [15] has a BMPth and a BI of 37%; a similar value found in this study. However, the difference in BMPth found in this study and [15] again highlights the differences in the composition of WH samples and the complexity of cross-study comparisons.
The biochemical methane potential of the WH hydrothermal products; process waters, hydrochars, and slurries are described across Section 3.3.1, Section 3.3.2 and Section 3.3.3.

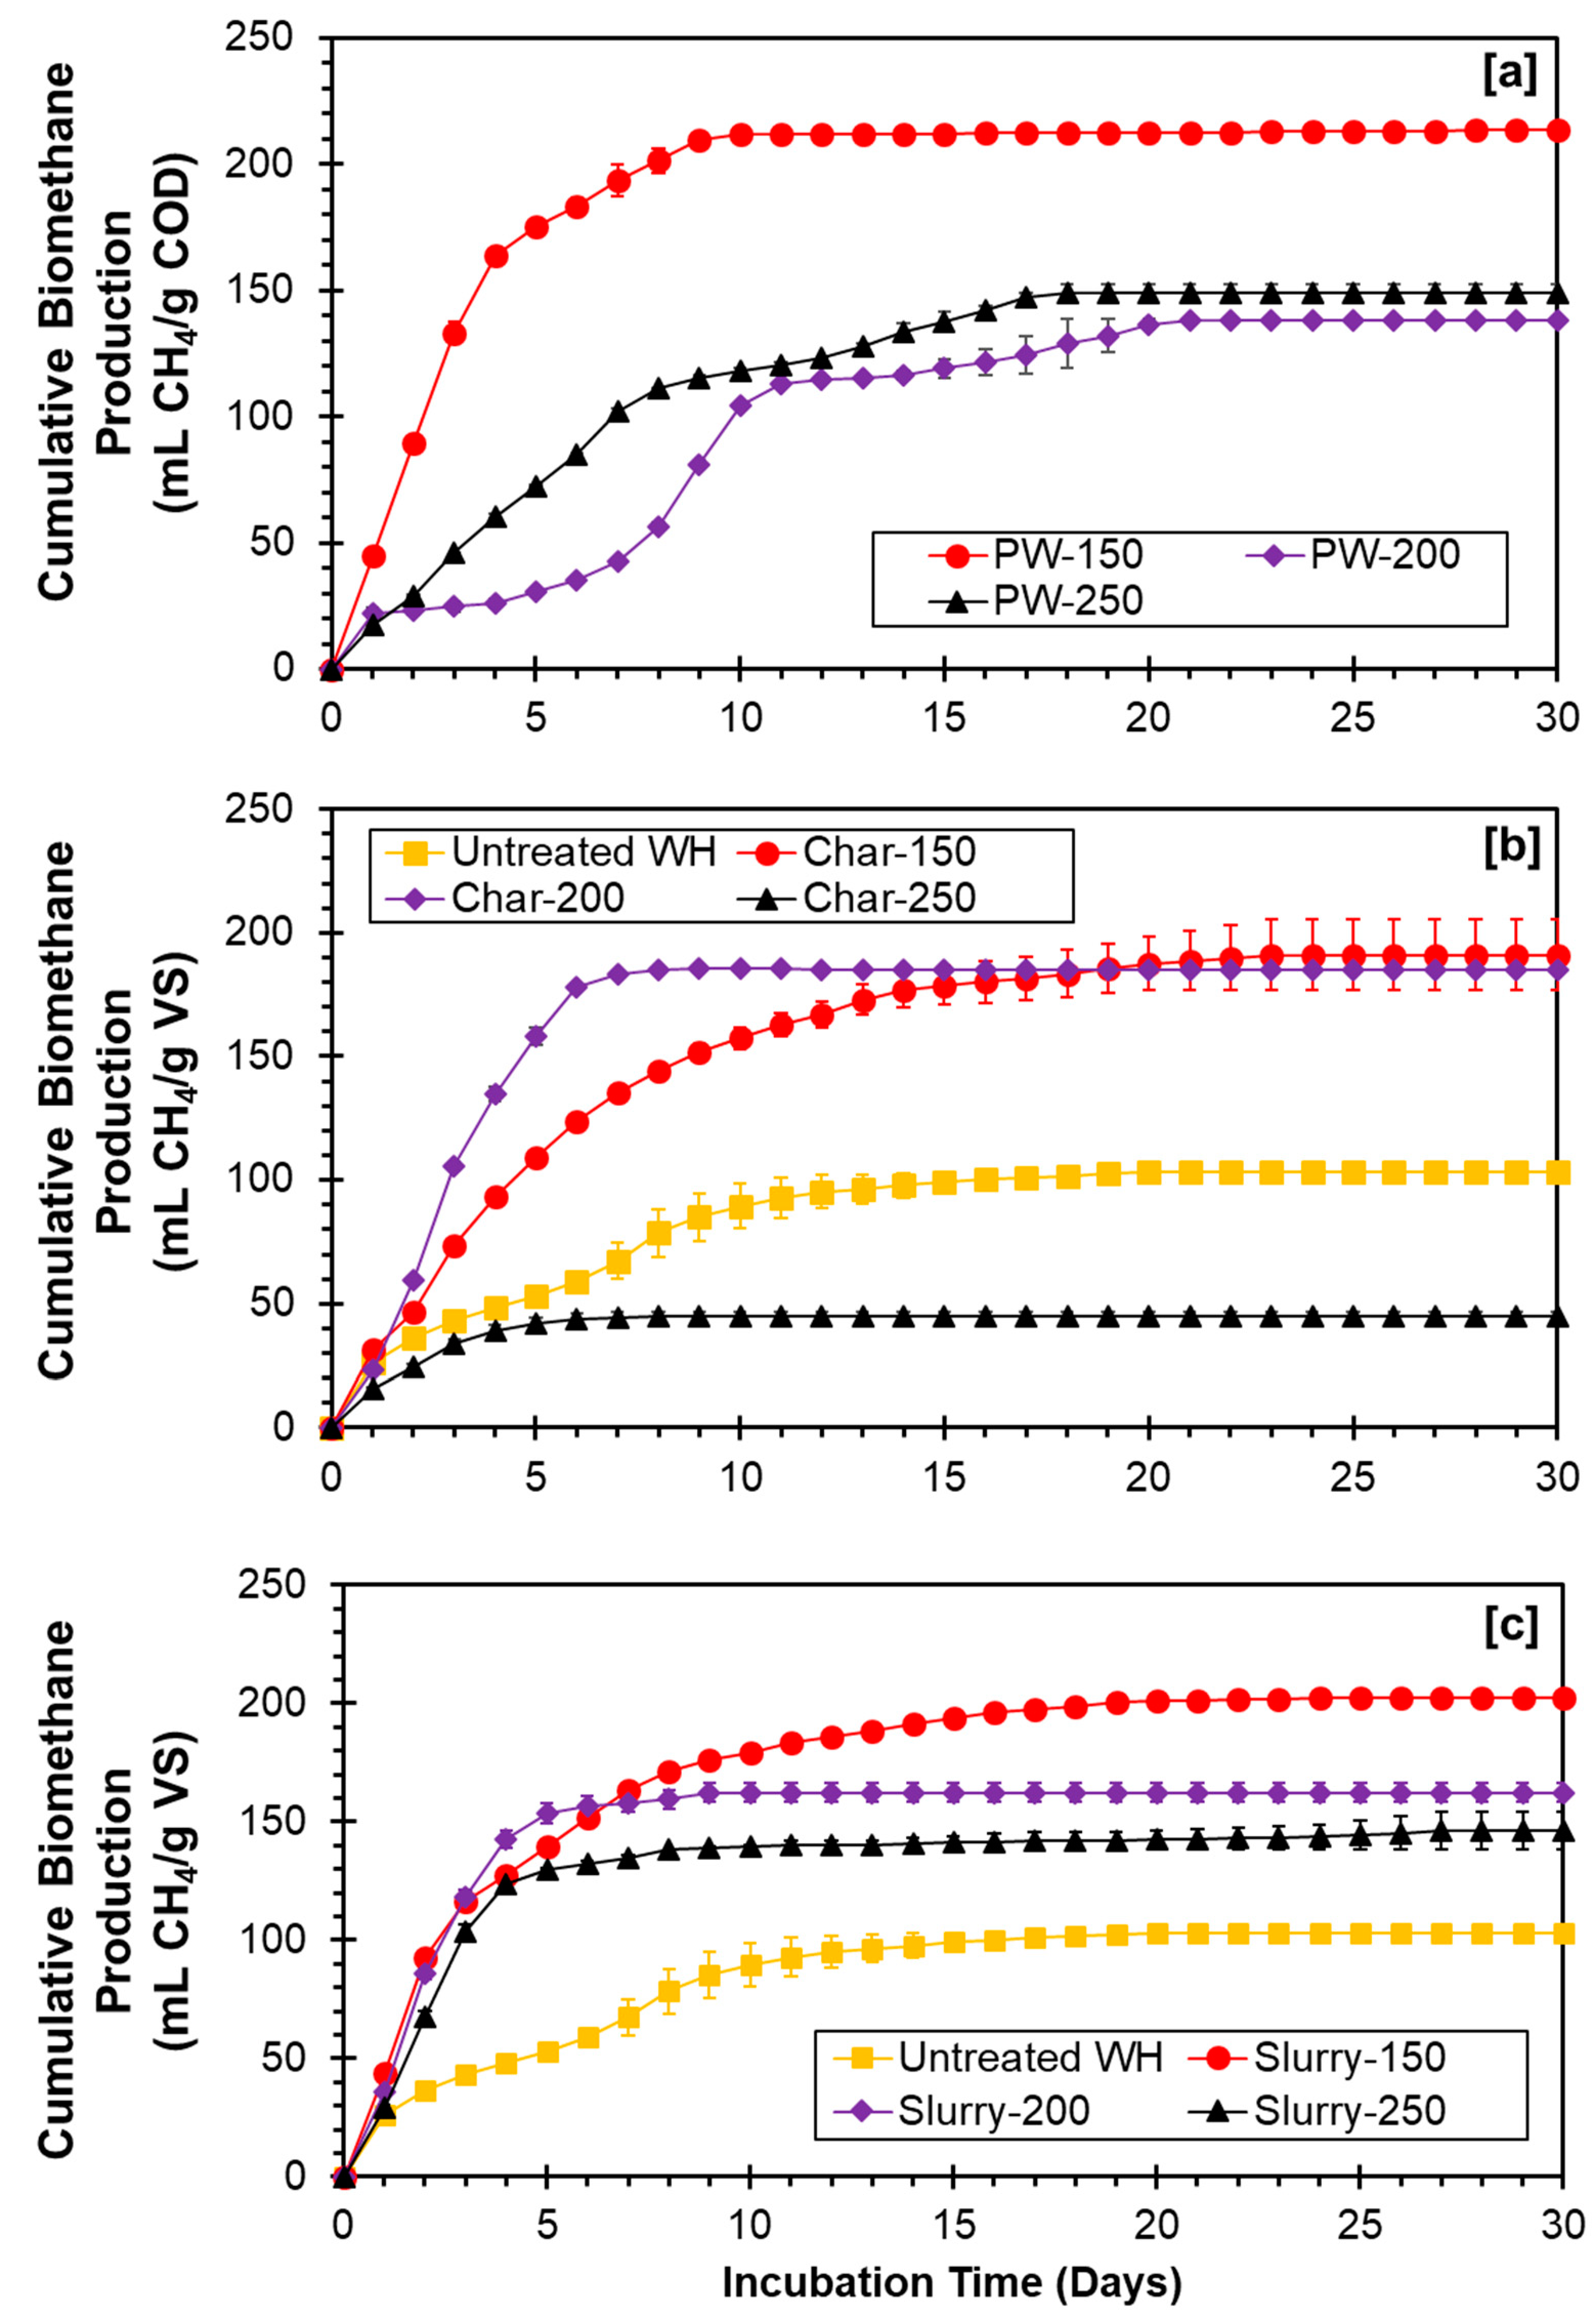
3.3.1. Process Waters

Figure 4a shows the BMPex of the HTC process waters from WH. PW-150 generated the highest level of biomethane; 213 mL CH4/g COD. PW-200 and PW-250 generated similar yields of biomethane; 138 mL CH4/g COD and 149 mL CH4/g COD, respectively; 35% and 30% less than PW-150. Table 5 shows PW-150 had a greater concentration of total sugars, which would be readily digestible during AD. Table 6 shows the biodegradability of PW-150 (61%) was higher than PW-200 (39%) and PW-250 (43%). PW-150 also had the lowest concentration of phenols and no-detectable HMF or furfural; known inhibitors of anaerobic micro-consortia [70,76]. Table 5 showed increased HMF and furfural concentrations between the process waters produced at 150 °C and 200 °C, but a reduction between process waters produced at 200 °C and 250 °C. However, total phenol concentration increased with increasing HTC temperature. Inhibitory compounds formed from lignocellulosic biomass include HMF, furfural, and phenols; derived from cellulose, hemicellulose, and lignin, respectively [77]. The experimental biomethane potential of HTC process waters from water hyacinth has not been previously reported in literature. However, using values from Hudakorn and Sritrakul (2020) [26] the biomethane potential of the aqueous phase squeezed from untreated WH was approximately 138 mL CH4/g COD. This suggests HTC treatment at a temperature of 150 °C (PW-150) improves the biodegradability of the aqueous phase. However, this must be interpreted with caution, as Hudakorn and Sritrakul (2020) [26] used a different source of WH; introducing biochemical variance between studies. Table 6 shows PW-150 has a higher peak biomethane production rate (Rm) and a lower peak time of fermentation (Tm) compared to PW-200 and PW-250; suggesting faster digestion kinetics of PW-150. Additionally, the technical digestion time (T80) of PW-150 (5 day) is lower than PW-200 and PW-250 (11 day).

3.3.2. Hydrochars

Figure 4b shows Char-150 and Char-200 generated similar yields of biomethane; 191 mL CH4/g VS and 185 mL CH4/g VS; 85% and 80% higher than untreated WH. However, Table 6 shows the digestion kinetics between Char-150 and Char-200 were different. Char-200 showed more rapid digestion in terms of the peak methane production rate (Rm), time of peak fermentation (Tm) and technical digestion time (T80). However, Char-200 would be less energetically feasible than Char-150; due to the greater energy input for the HTC reaction. Char-250 had a BMPex of 45 mL CH4/g VS; generating 56% less biomethane than untreated WH. The solid component of HTC; hydrochar, is known to become more recalcitrant during anaerobic digestion as HTC temperature increases [36,41]. Despite an increase in the carbon content of hydrochar with increasing temperature (Table 2), the carbon available for biomethane generation becomes limited. Mumme et al. [78] found only 10.4% of the carbon of wheat straw digestate hydrochar, produced at 230 °C, contributed towards biomethane production. This trend was also seen with the WH hydrochars; with Table 2 showing the carbon-content of the hydrochars increased with increasing HTC temperature and Table 6 showing a reduced BI with increasing HTC temperature. The biodegradability of Char-150, Char-200, and Char-250 was 50%, 39%, and 7%, respectively; suggesting an increasingly recalcitrant structure with increased HTC temperature. Therefore, recent work has identified the use of hydrochar as an additive to AD, to facilitate and enhance the digestion properties of feedstocks such as fish processing waste [79] and pig carcass [80]; rather than the use of hydrochar directly as an AD feedstock. However, this has not yet been explored for WH.

3.3.3. HTC Slurries

Figure 4c shows the biomethane yield generated from Slurry-150; 202 mL CH4/gVS was higher than Slurry-200; 162 mL CH4/g VS and Slurry-250; 146 mL CH4/g VS. HTC slurries improved biomethane yields by 96%, 57%, and 42%, compared to untreated WH, for Slurry-150, Slurry-200, and Slurry-250, respectively. Table 6 shows Slurry-150 had the highest biodegradability of any sample; excluding process waters. However, both Slurry-200 and Slurry-250 showed a higher peak biomethane production rate (Rm) and a lower peak fermentation time (Tm) compared to Slurry-150. Despite this, Table 6 shows all slurries improved digestion kinetics compared to untreated WH. The reduced biodegradability of WH slurries produced at higher HTC temperatures could be due to the dual synergy of factors, including formation of inhibitory compounds and an increasing recalcitrance of the solid fraction. Therefore, higher temperature HTC is not recommended as a pre-treatment for biomethane generation. However, work conducted by Zhao et al. [81] suggest HTC process water digestion can be enhanced by hydrochar addition; where hydrochar acts as a supporting structure for microbial growth and direct interspecies electron transfer. This could potentially explain why Slurry-250 only generates 10% less biomethane than Slurry-200, despite Figure 4b showing the solid fraction of Slurry-250 generated relatively small amounts of biomethane. However, Zhao et al. [81] used a food waste feedstock and HTC conditions of 260 °C, 4 h. The behaviour of hydrochar during AD is likely to vary, depending on the biomass used in HTC and the conditions of the HTC reaction.
In previous studies, a hydrothermal pre-treatment of WH at 121 °C, 30 min [13] improved biomethane yields by 33% (150 mL CH4/g VS) and 170 °C, 30 min [14] improved WH biomethane yields by 51%. The hydrothermal pre-treatments; Slurry-150 and Slurry-200 used in this study, showed a greater biomethane yield improvement compared to other hydrothermal pre-treatments studied [13,14]. The greater enhancement in biomethane yield from hydrothermal pre-treatment found in this study could be linked to the low BI of the untreated WH. Pre-treatment of a recalcitrant, low biomethane yielding biomass is likely to show a greater improvement in BI compared to a more readily-digestible feedstock. Alternatively, Ferrer et al. [11] found a less-severe hydrothermal treatment temperature of 80 °C showed no significant improvement on biomethane yields from WH, despite an 8% enhancement in the solubilisation of WH. This suggests more severe pre-treatments could further increase the soluble COD concentration to allow enhanced digestion. Severity factor (SF) is a measure of the intensity of a hydrothermal process, defined by two key parameters; temperature and residence time [41]. The SFs of the HTC reactions used in this study were 3.3, 4.7, and 6.2 for reaction temperatures of 150 °C, 200 °C, and 250 °C, respectively. Table 6 shows the biodegradability of the WH HTC slurries decreased with increasing HTC temperature; and therefore, increasing SF of the hydrothermal pre-treatment. Therefore, findings of this study and by Ferrer et al. (2010) [11] suggests there is an optimal SF, to provide ideal pre-treatment conditions; to balance the hydrolysis and solubilisation of organic matter, whilst limiting inhibitory compound formation. Alfageme et al. (2019) [12] investigated the effect of steam explosion (SE); an alternative form of hydrothermal pre-treatment, on the biomethane yields of WH across a wide range of SFs. A SF of 2.4 (120 °C, 60 min) showed lower biomethane yields than untreated WH [12]. An increased SF; 4.2 (210 °C, 10 min) improved biomethane yields by 21% [12]. Whereas, an intermediate SF of 3.8 showed the greatest improvement of biomethane yields (38%), despite a reduced concentration of soluble COD [12]. Slurry-150 has the most similar SF to the optimal conditions found by Alfageme et al. (2019) [12] and showed the greatest improvement in biodegradability (Table 6); suggesting a SF between 3.3–3.8 could be optimal for WH hydrothermal pre-treatment. Kist et al. (2018) [15] found an optimal SF of 3.5 (170 °C, 30 min) to enhance biomethane production from WH using sequential thermal hydrolysis and SE; whilst maintaining the residue as a slurry. Again, this falls within the ideal SF range of 3.3–3.8. Optimal pre-treatment allows for sufficient degradation of the lignocellulosic matrix, whilst limiting formation of inhibitory compounds.
Alternative pre-treatments have been applied across the literature, including; ionic liquid pre-treatment (120 °C, 120 min), which improved biogas yields by 98% compared to untreated WH [9], however biomethane values were not reported. A sequential microwave-heated alkali pre-treatment and enzymatic hydrolysis of WH yielded 237.4 mL CH4/g VS [10]. This is higher than the BMPex of untreated WH in this study, however the biomethane yields of the untreated WH were not stated by [10], therefore pre-treatment effectiveness cannot be determined.
Although, Slurry-150 showed the highest biomethane yields, it only had a BI of 58%, suggesting the digestion is still not optimised for maximised biomethane generation. Table 2 shows the original WH sample has a C:N of 14:1; below the optimal range of 25–30:1 [63], which can be overcome through co-digestion. WH co-digestion with sheep waste [73] and food waste [25] have been found to enhance biomethane yields. Additionally, thermophilic digestions have been found to improve biomethane yields in some cases [63]. However, a previous study [11] has compared mesophilic (35 °C) and thermophilic (55 °C) digestion of WH; finding that the initial rate of biomethane production was higher in thermophilic digestions, however, final biomethane yields were similar. Therefore, co-digestion of WH with a carbon-rich feedstock could potentially improve the BI to >58%.

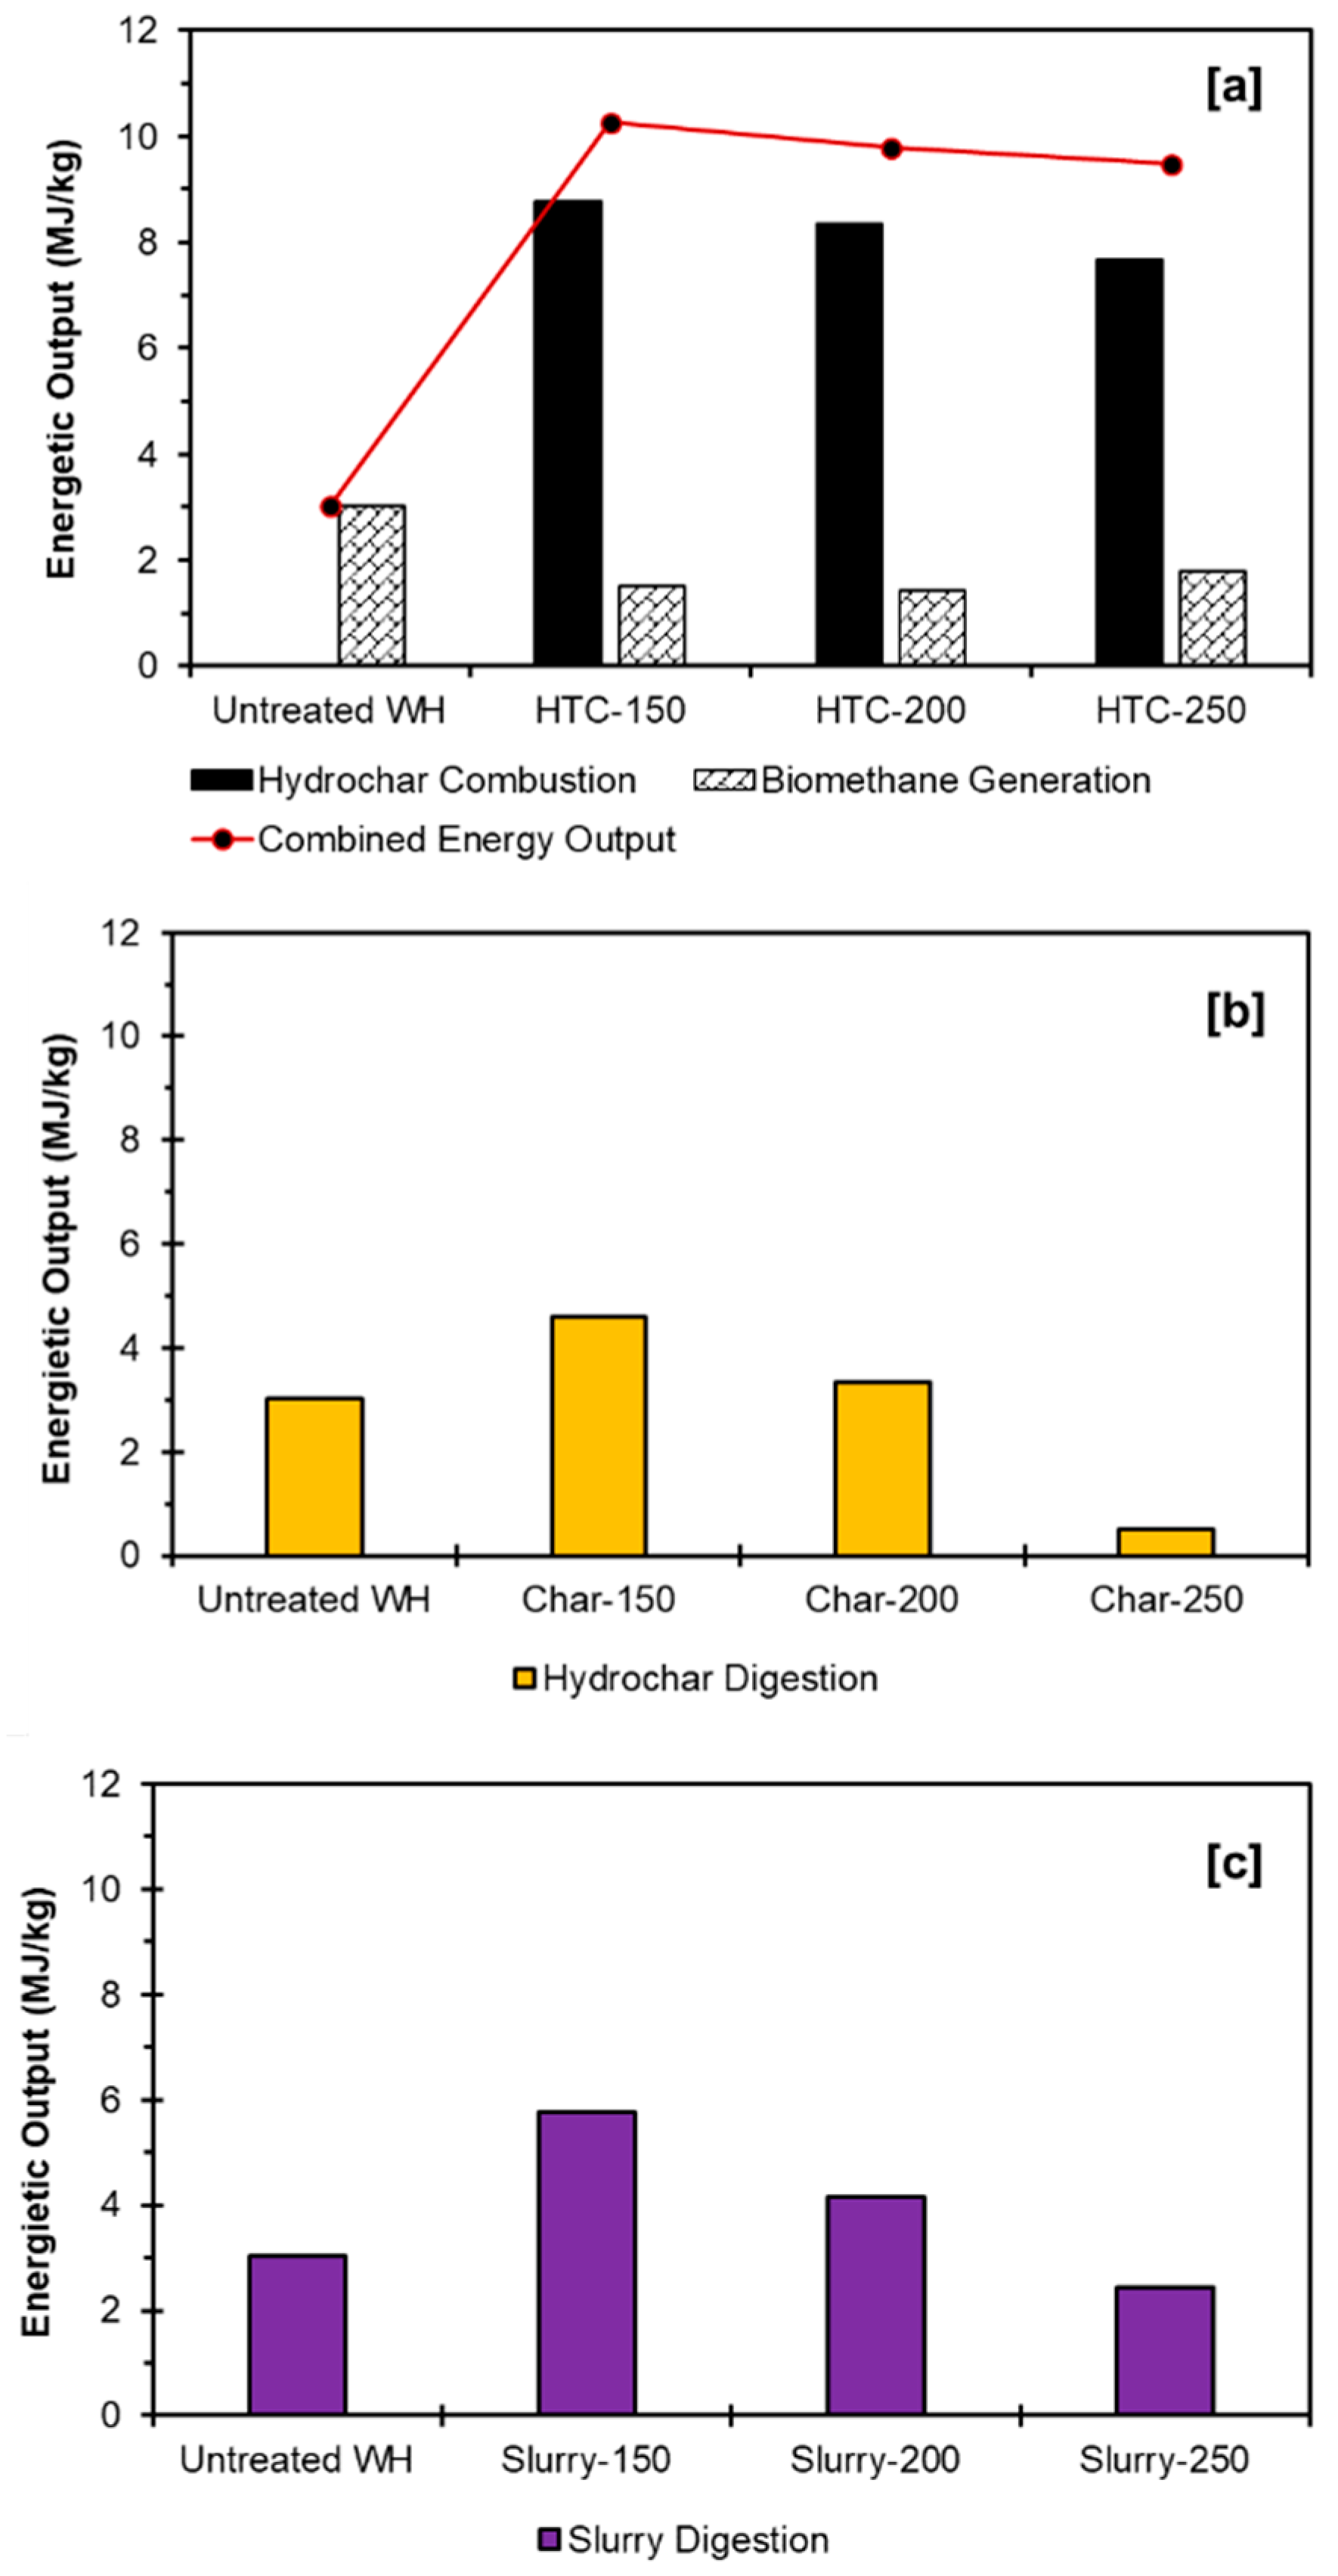
3.4. Energetic Balance

Figure 5a–c displays the energetic output for each of the integration options for HTC and AD using a starting material of 1 kg of dried WH. All values are compared to the energetic output from the HHV of the biomethane produced during the AD of 1 kg of untreated air-dried WH; 3.02 MJ/kg.
The energetic output for integration strategy (i); separation of the hydrochar for combustion and process water for AD, is shown in Figure 5a. Integrating HTC and AD using this strategy improved the energetic output from the WH, compared to untreated WH, across all HTC temperatures. The combined energy outputs were 10.27 MJ/kg, 9.79 MJ/kg, and 9.48 MJ/kg at HTC temperatures of 150 °C, 200 °C, and 250 °C, respectively. This represents a 240%, 224%, and 214% improvement in energetic output compared to the AD of the untreated WH. The hydrochar represented 85% of the combined energy output for HTC reactions conducted at 150 °C and 200 °C, and 81% of the combined energy output for HTC reactions conducted at 250 °C. Therefore, hydrochars are greater energy carriers, compared to process waters, across all HTC temperatures; highlighting the energy densification effects of hydrochar. However, the energy output from hydrochars decreased with increasing HTC temperature, despite the increase in HHV displayed in Figure 1. This was due to the reducing hydrochar yield at higher HTC temperatures; which subsequently reduced the energy yield of the hydrochars. The energy output of the process waters was 1.50 MJ/kg, 1.44 MJ/kg, and 1.80 MJ/kg for the process waters produced at 150 °C, 200 °C, and 250 °C, respectively. Figure 4a showed PW-150 had a BMPex of 213 mL CH4/g COD and PW-250 had a BMPex of 149 mL CH4/g COD, however, Table 5 shows the COD concentration of the process water increased with increasing HTC temperature; explaining the greater energy output of PW-250.
The energetic output for integration strategy (ii); AD of hydrochars alone is shown in Figure 5b. The energetic output from hydrochar digestion decreased with increasing HTC temperature, with values of 4.59 MJ/kg, 3.33 MJ/kg, and 0.51 MJ/kg for Char-150, Char-200, and Char-250, respectively. Char-150 and Char-200 showed a 52% and 10% improvement in energy output compared to untreated WH. Despite the similar biomethane yields generated from Char-150 and Char-200 (Figure 4b), the reduced hydrochar yield of Char-200 (Figure 1) resulted in a lower overall energetic output compared to Char-150. Alternatively, Char-250 showed an 83% decrease in energy output compared to untreated WH; due to the low biodegradability (Table 6) and reduced hydrochar yield (Figure 1), displayed by Char-250.
The energetic output for integration strategy [iii]; AD of slurries is shown in Figure 5c. Slurry-150, Slurry-200, and Slurry-250 showed energy outputs of 5.78 MJ/kg, 4.15 MJ/kg, and 2.44 MJ/kg, respectively. Slurry-150 and Slurry-200 improved energetic output compared to untreated WH by 91% and 37%, respectively. The AD of Slurry-250 caused a 19% reduction in energy output, compared to untreated WH. Energetic output from the AD of slurries was sensibly higher than the digestion of corresponding hydrochars; due to the combined digestion of hydrochars and process waters. However, this integration strategy yields a lower energetic output than separating the hydrochar for combustion and process water for AD; Figure 5a.
Figure 5 shows integrating HTC and AD can improve the energetic output from WH, with varying results; dependent on the integration strategy. However, the future use and scale-up of HTC and AD integration using WH is dependent on energetic feasibility of the process. Table 7 shows an energy balance calculation for each of the integration options for HTC and AD across each of the HTC temperatures; 150 °C, 200 °C, and 250 °C. Across each integration strategy, lower HTC treatment temperatures showed the greatest EROI (energy return on investment); due a reduced energy input and increased energy output. Separation of hydrochars for combustion and process waters for AD gave the greatest EROI across all HTC temperatures; suggesting this is the most energetically feasible integration option. Similar conclusions were found using this HTC and AD integration strategy for macroalgae [41] and the organic fraction of municipal solid waste [45]. Digestion of hydrochars or slurries generated at 250 °C appears energetically unfeasible (EROI < 1). Digestion of hydrochars alone gave the lowest EROI at each temperature, therefore this integration strategy is not recommended.
Table 7 shows AD of Slurry-150 yields a positive energy balance (EROI = 2.56), suggesting this may be a suitable HTC and AD integration strategy for WH. However, in order for this route to be energetically sustainable, the energy output must be higher than the combined energy input for the HTC reactor and energy output from untreated WH. Otherwise, it would be more energetically favourable to digest untreated WH. The calculated energy output from the AD of Slurry-150 was 5.78 MJ/kg. The calculated energy input for the HTC reaction at 150 °C was 2.25 MJ/kg, assuming 55% energy recovery, and the energy output from untreated WH was 3.02 MJ/kg. Therefore, the energy output from the AD of Slurry-150 (5.78 MJ/kg) is higher than the combined energy input for HTC and energy output from untreated WH (5.27 MJ/kg), suggesting an energetically feasible integration strategy.
Figure 5a suggests hydrochar has the potential to generate more energy as a solid combustion fuel, than as a feedstock for AD. However, hydrochar has a multitude of alternative applications, including; soil amendment, sorbent, carbon sequestration and use as a capacitor [21,67]. Alternative hydrochar application negates the energy associated with the hydrochar combustion. Therefore, any recovered energy from the HTC process would originate from the AD of the process waters. The energy input for HTC reactions would be; 2.25 MJ/kg, 3.15 MJ/kg, and 4.06 MJ/kg, for reactions at 150 °C, 200 °C, and 250 °C, respectively; assuming 55% energy recovery from the energy input values in Table 7. Figure 5a shows the energy output from the AD of the process waters was 1.50 MJ/kg, 1.44 MJ/kg, and 1.80 MJ/kg for PW-150, PW-200, and PW-250, respectively, lower than the required energy input. Therefore, an external source of energy input would be required to heat the HTC reactor, if the hydrochar was to be used for an alternative purpose other than combustion. However, these calculations are based using a HTC solid loading rate of 10%. Future work would focus on the optimisation of HTC solid loading ratio in order to find the most energetically viable option.
Overall, the most energetically feasible HTC and AD integration strategy, using WH, is to separate the hydrochar for combustion and process waters for AD (Table 7). However, the ashing behaviour of the hydrochars shown in Table 4 and Figure 3 suggest the potential risk of slagging and fouling remains. This would limit the applications of large-scale combustion of WH hydrochar. However, small-scale combustion of WH hydrochar could still be a feasible option; such as WH hydrochar briquettes as a cooking fuel. Therefore, a more viable large-scale integration strategy of HTC and AD using WH, could be digestion of the residual HTC slurry, generated at 150 °C. Slurry-150 appears energetically feasible; Table 7 and has the greatest BI; Table 6.
Furthermore, the integration of HTC and AD using WH is not only focused upon the energetic feasibility of the process but is also reliant on the infrastructure available in the countries applying this technology. In this study, WH was collected from Uganda, however Uganda has limited capacity for energy intensive pre-treatments, such as; HTC at 150 °C, due to limited energy infrastructure. Table 7 shows HTC and AD integration strategies are energetically feasible. However, the net energy balance can be further improved using an integrated solar-thermal biomass conversion technology. A recent study [56] found a low temperature HTC (150–250 °C) treatment is a suitable thermochemical conversion technology which can be heated by concentrated solar-thermal energy, for biomasses including WH in Uganda.
It is worth considering that the current conditions within our HTC reactor results in slow cooling rates, under pressure. Rapid decompression of the hydrothermally-treated biomass, in a similar manner to steam explosion, may result in significant benefits, in terms of improved biomethane potential and improved handling of the resulting slurry. Initial testing of this approach suggests that the WH can be almost completely liquefied under steam explosion conditions; this is likely to be possible following decompression of hot compressed water treatment. This research is ongoing in our laboratories and will be reported in future work.

4. Conclusions

Integrating hydrothermal carbonisation (HTC) and anaerobic digestion (AD) offers an opportunity to improve the energetic output recovered from water hyacinth (WH), compared to AD of untreated WH. Separation of the hydrochar for combustion and conversion of the process waters separately by AD was the most energetically feasible integration route identified in this study. The EROI for the utilisation of the separate HTC products was highest at the lowest HTC temperatures. Analysis of WH hydrochars indicates potential slagging and fouling tendencies, across all HTC temperatures; potentially limiting the use the hydrochars in large-scale combustion. Although, there is potential for use of hydrochar for the production of domestic fuels, such as briquettes. AD of HTC slurry generated at lower temperatures showed a positive energy balance and may offer an option as a large-scale HTC and AD integration strategy; where low temperature HTC is used as a pre-treatment for AD. Therefore, lower HTC processing temperatures offers a greater energetic return. Digestion of hydrochars alone yields the lowest energy output of all the integration strategies investigated, across all HTC temperatures. The possibilities of utilising hydrothermal pre-treatment for WH are dependent upon location, scale and economic viability of small-scale HTC units, as well as the practicalities of handling the feedstock and products. Hot compressed water explosion approaches may improve both energetics and product quality and is the subject of further work.

Author Contributions

Conceptualization, A.E.B., J.M.M.A., O.R.G., M.A.C.-V., and A.B.R.; Methodology, A.E.B., and O.R.G.; Validation, A.E.B., J.M.M.A., O.R.G., M.A.C.-V., and A.B.R.; Formal analysis, A.E.B.; Investigation, A.E.B.; Resources, J.M.M.A., M.A.C.-V., and A.B.R.; Data curation, A.E.B.; Writing—original draft preparation, A.E.B.; Writing—review and editing, A.E.B., J.M.M.A., O.R.G., M.A.C.-V., and A.B.R.; Visualization, A.E.B.; Supervision, J.A.A., M.A.C.-V., and A.B.R.; Project administration, M.A.C.-V. and A.B.R.; Funding acquisition, M.A.C.-V. and A.B.R. All authors have read and agreed to the published version of the manuscript.

Funding

This research was funded by the Engineering & Physical Sciences Research Council (EPSRC) (grant no. EP/L014912/1) and the Biotechnology and Biological Sciences Research Council (BBSRC) through the BEFWAM project (grant no. BB/S011439/1). JMMA’s time on this research was funded by WEFO/ERDF grant number 80851 (BEACON+).

Acknowledgments

The authors would like to thank CREEC (Centre for Research in Energy and Energy Conservation, Makerere University, Uganda) for providing water hyacinth samples and Esholt wastewater treatment plant for providing inoculum. Additionally, the authors would also like to thank Adrian Cunliffe, Karine Alves Thorne, Simon Lloyd, David Elliott, Jeanine Williams, and Iram Razaq for their technical assistance.

Conflicts of Interest

The authors declare no conflict of interest.

References

  1. Patel, S. Threats, management and envisaged utilizations of aquatic weed Eichhornia crassipes: An overview. Rev. Environ. Sci. Biotechnol. 2012, 11, 249–259. [Google Scholar] [CrossRef]
  2. Rakotoarisoa, T.F.; Richter, T.; Rakotondramanana, H.; Mantilla-Contreras, J. Turning a Problem Into Profit: Using Water Hyacinth (Eichhornia crassipes) for Making Handicrafts at Lake Alaotra, Madagascar. Econ. Bot. 2016, 70, 365–379. [Google Scholar] [CrossRef]
  3. Adwek, G.; Julius, G.; Shen, B.; Lan, M.; Cecilia, K.M.; Yabo, A.C. Water hyacinth as a possible bioenergy resource: A case of Lake Victoria, Kenya. IOP Conf. Ser. Earth Environ. Sci. 2019, 227, 022007. [Google Scholar] [CrossRef]
  4. Kateregga, E.; Sterner, T. Indicators for an invasive species: Water hyacinths in Lake Victoria. Ecol. Indic. 2007, 7, 362–370. [Google Scholar] [CrossRef]
  5. Güereña, D.; Neufeldt, H.; Berazneva, J.; Duby, S. Water hyacinth control in Lake Victoria: Transforming an ecological catastrophe into economic, social, and environmental benefits. Sustain. Prod. Consum. 2015, 3, 59–69. [Google Scholar] [CrossRef]
  6. Patil, J.H.; AntonyRaj, M.; Gavimath, C.C. Study on Effect of Pretreatment Methods on Biomethanation of Water Hyacinth. Int. J. Adv. Biotechnol. Res. 2011, 2, 143–147. [Google Scholar]
  7. Patel, V.; Desai, M.; Madamwar, D. Thermochemical pretreatment of water hyacinth for improved biomethanation. Appl. Biochem. Biotechnol. 1993, 42, 67–74. [Google Scholar] [CrossRef]
  8. Baura, V.B.; Kalamdhad, A.S. Effect of various types of thermal pretreatment techniques on the hydrolysis, compositional analysis and characterization of water hyacinth. Bioresour. Technol. 2017, 227, 147–154. [Google Scholar] [CrossRef]
  9. Gao, J.; Chen, L.; Yan, Z.; Wang, L. Effect of ionic liquid pretreatment on the composition, structure and biogas production of water hyacinth (Eichhornia crassipes). Bioresour. Technol. 2013, 132, 361–364. [Google Scholar] [CrossRef]
  10. Lin, R.; Cheng, J.; Song, W.; Ding, L.; Xie, B.; Zhou, J.; Cen, K. Characterisation of water hyacinth with microwave-heated alkali pretreatment for enhanced enzymatic digestibility and hydrogen/methane fermentation. Bioresour. Technol. 2015, 182, 1–7. [Google Scholar] [CrossRef]
  11. Ferrer, I.; Palatsi, J.; Campos, E.; Flotats, X. Mesophilic and thermophilic anaerobic biodegradability of water hyacinth pre-treated at 80 °C. Waste Manag. 2010, 30, 1763–1767. [Google Scholar] [CrossRef] [PubMed]
  12. Alfageme, E.R.; Fujiwara, M.; Toda, T. Steam explosion and thermal hydrolysis for pretreating Eichhornia crassipes to enhance anaerobic digestion. In Proceedings of the Annual Conference of Japan Society of Material Cycles and Waste Management, Sendai, Japan, 19–21 September 2019; Japan Society of Material Cycles and Waste Management: Tokyo, Japan, 2019; p. 551. [Google Scholar]
  13. Ali, S.S.; Sun, J. Effective thermal pretreatment of water hyacinth (Eichhornia crassipes) for the enhancement of biomethanation: VIT ® gene probe technology for microbial community analysis with special reference to methanogenic Archaea. J. Environ. Chem. Eng. 2019, 7, 102853. [Google Scholar] [CrossRef]
  14. Putra, Y.; Murni, D.; Kurniawan, T. Study of Biogas Production Rate from Water Hyacinth by Hydrothermal Pretreatment with Buffalo Dung as a Starter. Waste Technol. 2014, 2, 26–30. [Google Scholar] [CrossRef]
  15. Kist, D.L.; Pérez-Elvira, S.I.; Monteggia, L.O. Evaluation of the steam explosion pretreatment upon the anaerobic digestion of water hyacinth biomass: Influence on liquid and solid fractions. Am. Sci. Res. J. Eng. Technol. Sci. 2018, 40, 298–317. [Google Scholar]
  16. Gunnarsson, C.C.; Petersen, C.M. Water hyacinths as a resource in agriculture and energy production: A literature review. Waste Manag. 2007, 27, 117–129. [Google Scholar] [CrossRef]
  17. Rezania, S.; Din, M.F.M.; Taib, S.M.; Sohaili, J.; Chelliapan, S.; Kamyab, H.; Saha, B.B. Review on fermentative biohydrogen production from water hyacinth, wheat straw and rice straw with focus on recent perspectives. Int. J. Hydrogen Energy 2017, 42, 20955–20969. [Google Scholar] [CrossRef]
  18. Shafy, H.I.; Farid, M.R.; El-Din, A.M. Water-Hyacinth from Nile River: Chemical contents, nutrient elements and heavy metals. Egypt. J. Chem. 2016, 59, 131–143. [Google Scholar] [CrossRef] [Green Version]
  19. Kruse, A.; Funke, A.; Titirici, M.M. Hydrothermal conversion of biomass to fuels and energetic materials. Curr. Opin. Chem. Biol. 2013, 17, 515–521. [Google Scholar] [CrossRef]
  20. Wirth, B.; Mumme, J. Anaerobic Digestion of Waste Water from Hydrothermal Carbonization of Corn Silage. Appl. Bioenergy 2013, 1, 1–10. [Google Scholar] [CrossRef]
  21. Fang, J.; Zhan, L.; Ok, Y.S.; Gao, B. Minireview of potential applications of hydrochar derived from hydrothermal carbonization of biomass. J. Ind. Eng. Chem. 2018, 57, 15–21. [Google Scholar] [CrossRef]
  22. Zhang, C.; Ma, X.; Chen, X.; Tian, Y.; Zhou, Y.; Lu, X.; Huang, T. Conversion of water hyacinth to value-added fuel via hydrothermal carbonization. Energy 2020, 197, 117193. [Google Scholar] [CrossRef]
  23. Román, S.; Ledesma, B.; Alvarez, A.; Coronella, C.; Qaramaleki, S. V Suitability of hydrothermal carbonization to convert water hyacinth to added-value products. Renew. Energy 2020, 146, 1649–1658. [Google Scholar] [CrossRef]
  24. Gao, Y.; Wang, X.; Wang, J.; Li, X.; Cheng, J.; Yang, H.; Chen, H. Effect of residence time on chemical and structural properties of hydrochar obtained by hydrothermal carbonization of water hyacinth. Energy 2013, 58, 376–383. [Google Scholar] [CrossRef]
  25. Priya, P.; Nikhitha, S.O.; Anand, C.; Nath, R.D.; Krishnakumar, B. Biomethanation of water hyacinth biomass. Bioresour. Technol. 2018, 255, 288–292. [Google Scholar] [CrossRef]
  26. Hudakorn, T.; Sritrakul, N. Biogas and biomass pellet production from water hyacinth. Energy Rep. 2020, 6, 532–538. [Google Scholar] [CrossRef]
  27. Rezania, S.; Md Din, M.F.; Kamaruddin, S.F.; Taib, S.M.; Singh, L.; Yong, E.L.; Dahalan, F.A. Evaluation of water hyacinth (Eichhornia crassipes) as a potential raw material source for briquette production. Energy 2016, 111, 768–773. [Google Scholar] [CrossRef] [Green Version]
  28. Munjeri, K.; Ziuku, S.; Maganga, H.; Siachingoma, B.; Ndlovu, S. On the potential of water hyacinth as a biomass briquette for heating applications. Int. J. Energy Environ. Eng. 2016, 7, 37–43. [Google Scholar] [CrossRef] [Green Version]
  29. Smith, A.M.; Singh, S.; Ross, A.B. Fate of inorganic material during hydrothermal carbonisation of biomass: Influence of feedstock on combustion behaviour of hydrochar. FUEL 2016, 169, 135–145. [Google Scholar] [CrossRef]
  30. Reza, M.T.; Lynam, J.G.; Uddin, M.H.; Coronella, C.J. Hydrothermal carbonization: Fate of inorganics. Biomass and Bioenergy 2013, 49, 86–94. [Google Scholar] [CrossRef]
  31. Lin, R.; Deng, C.; Ding, L.; Bose, A.; Murphy, J.D. Improving gaseous biofuel production from seaweed Saccharina latissima: The effect of hydrothermal pretreatment on energy efficiency. Energy Convers. Manag. 2019, 196, 1385–1394. [Google Scholar] [CrossRef]
  32. Ding, L.; Cheng, J.; Lin, R.; Deng, C.; Zhou, J.; Murphy, J.D. Improving biohydrogen and biomethane co-production via two-stage dark fermentation and anaerobic digestion of the pretreated seaweed Laminaria digitata. J. Clean. Prod. 2020, 251, 119666. [Google Scholar] [CrossRef]
  33. Ding, L.; Cheng, J.; Qiao, D.; Yue, L.; Li, Y.Y.; Zhou, J.; Cen, K. Investigating hydrothermal pretreatment of food waste for two-stage fermentative hydrogen and methane co-production. Bioresour. Technol. 2017, 241, 491–499. [Google Scholar] [CrossRef] [PubMed]
  34. He, L.; Huang, H.; Lei, Z.; Liu, C.; Zhang, Z. Enhanced hydrogen production from anaerobic fermentation of rice straw pretreated by hydrothermal technology. Bioresour. Technol. 2014, 171, 145–151. [Google Scholar] [CrossRef] [PubMed]
  35. Chandra, R.; Takeuchi, H.; Hasegawa, T. Hydrothermal pretreatment of rice straw biomass: A potential and promising method for enhanced methane production. Appl. Energy 2012, 94, 129–140. [Google Scholar] [CrossRef]
  36. Luz, F.C.; Volpe, M.; Fiori, L.; Manni, A.; Cordiner, S.; Mulone, V.; Rocco, V. Spent coffee enhanced biomethane potential via an integrated hydrothermal carbonization-anaerobic digestion process. Bioresour. Technol. 2018, 256, 102–109. [Google Scholar] [CrossRef]
  37. Becker, R.; Dorgerloh, U.; Paulke, E.; Mumme, J.; Nehls, I. Hydrothermal carbonization of biomass: Major organic components of the aqueous phase. Chem. Eng. Technol. 2014, 37, 511–518. [Google Scholar] [CrossRef]
  38. Erdogan, E.; Atila, B.; Mumme, J.; Reza, M.T.; Toptas, A.; Elibol, M.; Yanik, J. Characterization of products from hydrothermal carbonization of orange pomace including anaerobic digestibility of process liquor. Bioresour. Technol. 2015, 196, 35–42. [Google Scholar] [CrossRef]
  39. Paul, S.; Dutta, A. Challenges and opportunities of lignocellulosic biomass for anaerobic digestion. Resour. Conserv. Recycl. 2018, 130, 164–174. [Google Scholar] [CrossRef]
  40. Marin-Batista, J.D.; Villamil, J.A.; Rodriguez, J.J.; Mohedano, A.F.; Rubia, M.A. De Valorization of microalgal biomass by hydrothermal carbonization and anaerobic digestion. Bioresour. Technol. 2019, 274, 395–402. [Google Scholar] [CrossRef]
  41. Brown, A.E.; Finnerty, G.L.; Camargo-Valero, M.A.; Ross, A.B. Valorisation of Macroalgae via the Integration of Hydrothermal Carbonisation and Anaerobic Digestion. Bioresour. Technol. 2020, 312, 123539. [Google Scholar] [CrossRef]
  42. Aragón-Briceño, C.; Ross, A.B.; Camargo-Valero, M.A. Evaluation and comparison of product yields and bio-methane potential in sewage digestate following hydrothermal treatment. Appl. Energy 2017, 208, 1357–1369. [Google Scholar] [CrossRef]
  43. Parmar, K.R.; Ross, A.B. Integration of Hydrothermal Carbonisation with Anaerobic Digestion; Opportunities for Valorisation of Digestate. Energies 2019, 12, 1586. [Google Scholar] [CrossRef] [Green Version]
  44. Pagés-Díaz, J.; Alvarado, A.O.C.; Montalvo, S.; Diaz-Robles, L.; Curio, C.H. Anaerobic bio-methane potential of the liquors from hydrothermal carbonization of different lignocellulose biomasses. Renew. Energy 2020, 157, 182–189. [Google Scholar] [CrossRef]
  45. Lucian, M.; Volpe, M.; Merzari, F.; Wüst, D.; Kruse, A.; Andreottola, G.; Fiori, L. Hydrothermal carbonization coupled with anaerobic digestion for the valorization of the organic fraction of municipal solid waste. Bioresour. Technol. 2020, 314, 123734. [Google Scholar] [CrossRef]
  46. Grasham, O.; Dupont, V.; Camargo-Valero, M.A.; García-Gutiérrez, P.; Cockerill, T. Combined ammonia recovery and solid oxide fuel cell use at wastewater treatment plants for energy and greenhouse gas emission improvements. Appl. Energy 2019, 240, 698–708. [Google Scholar] [CrossRef]
  47. Aragón-Briceño, C.I.; Grasham, O.; Ross, A.B.; Dupont, V.; Camargo-Valero, M.A. Hydrothermal carbonization of sewage digestate at wastewater treatment works: Influence of solid loading on characteristics of hydrochar, process water and plant energetics. Renew. Energy 2020, 157, 959–973. [Google Scholar] [CrossRef]
  48. Heidari, M.; Norouzi, O.; Salaudeen, S.; Acharya, B.; Dutta, A. Prediction of Hydrothermal Carbonization with Respect to the Biomass Components and Severity Factor. Energy Fuels 2019, 33, 9916–9924. [Google Scholar] [CrossRef]
  49. Raposo, F.; Fernández-Cegrí, V.; de la Rubia, M.A.; Borja, R.; Béline, F.; Cavinato, C.; Demirer, G.; Fernández, B.; Fernández-Polanco, M.; Frigon, J.C.; et al. Biochemical methane potential (BMP) of solid organic substrates: Evaluation of anaerobic biodegradability using data from an international interlaboratory study. J. Chem. Technol. Biotechnol. 2011, 86, 1088–1098. [Google Scholar] [CrossRef]
  50. Nielfa, A.; Cano, R.; Fdz-Polanco, M. Theoretical methane production generated by the co-digestion of organic fraction municipal solid waste and biological sludge. Biotechnol. Rep. 2015, 5, 14–21. [Google Scholar] [CrossRef] [Green Version]
  51. Wall, D.M.; O’Kiely, P.; Murphy, J.D. The potential for biomethane from grass and slurry to satisfy renewable energy targets. Bioresour. Technol. 2013, 149, 425–431. [Google Scholar] [CrossRef]
  52. Deng, C.; Lin, R.; Kang, X.; Wu, B.; O’Shea, R.; Murphy, J.D. Improving gaseous biofuel yield from seaweed through a cascading circular bioenergy system integrating anaerobic digestion and pyrolysis. Renew. Sustain. Energy Rev. 2020, 128, 109895. [Google Scholar] [CrossRef]
  53. Andriamanohiarisoamanana, F.J.; Matsunami, N.; Yamashiro, T.; Iwasaki, M.; Ihara, I.; Umetsu, K. High-solids anaerobic mono-digestion of riverbank grass under thermophilic conditions. J. Environ. Sci. 2017, 52, 29–38. [Google Scholar] [CrossRef]
  54. Okoro-Shekwaga, C.K.; Suruagy, M.V.T.; Ross, A.; Camargo-Valero, M.A. Particle size, inoculum-to-substrate ratio and nutrient media effects on biomethane yield from food waste. Renew. Energy 2020, 151, 311–321. [Google Scholar] [CrossRef]
  55. APHA. Standard Methods for the Examination of Water and Wastewater; American Public Health Association: Washington, DC, USA, 2005. [Google Scholar]
  56. Green, T.; Miria, O.I.; Crook, R.; Ross, A. Energy Calculator for Solar Processing of Biomass with Application to Uganda. Energies 2020, 13, 1485. [Google Scholar] [CrossRef] [Green Version]
  57. Yuan, T.; Cheng, Y.; Zhang, Z.; Lei, Z.; Shimizu, K. Comparative study on hydrothermal treatment as pre- and post-treatment of anaerobic digestion of primary sludge: Focus on energy balance, resources transformation and sludge dewaterability. Appl. Energy 2019, 239, 171–180. [Google Scholar] [CrossRef]
  58. Mishra, S.; Maiti, A. The efficiency of Eichhornia crassipes in the removal of organic and inorganic pollutants from wastewater: A review. Environ. Sci. Pollut. Res. 2017, 24, 7921–7937. [Google Scholar] [CrossRef] [PubMed]
  59. Munawer, M.E. Human health and environmental impacts of coal combustion and post-combustion wastes. J. Sustain. Min. 2018, 17, 87–96. [Google Scholar] [CrossRef]
  60. Mitchell, E.J.S.; Lea-Langton, A.R.; Jones, J.M.; Williams, A.; Layden, P.; Johnson, R. The impact of fuel properties on the emissions from the combustion of biomass and other solid fuels in a fixed bed domestic stove. Fuel Process. Technol. 2016, 142, 115–123. [Google Scholar] [CrossRef]
  61. Sommersacher, P.; Brunner, T.; Obernberger, I. Fuel indexes: A novel method for the evaluation of relevant combustion properties of new biomass fuels. Energy Fuels 2012, 26, 380–390. [Google Scholar] [CrossRef]
  62. Zhao, B.; Su, Y.; Liu, D.; Zhang, H.; Liu, W.; Cui, G. SO2/NOx emissions and ash formation from algae biomass combustion: Process characteristics and mechanisms. Energy 2016, 113, 821–830. [Google Scholar] [CrossRef]
  63. Ward, A.J.; Hobbs, P.J.; Holliman, P.J.; Jones, D.L. Optimisation of the anaerobic digestion of agricultural resources. Bioresour. Technol. 2008, 99, 7928–7940. [Google Scholar] [CrossRef] [PubMed]
  64. Chen, Y.; Cheng, J.J.; Creamer, K.S. Inhibition of anaerobic digestion process: A review. Bioresour. Technol. 2008, 99, 4044–4064. [Google Scholar] [CrossRef] [PubMed]
  65. Smith, A.M.; Ross, A.B. Production of bio-coal, bio-methane and fertilizer from seaweed via hydrothermal carbonisation. Algal Res. 2016, 16, 1–11. [Google Scholar] [CrossRef] [Green Version]
  66. Smith, A.M.; Ross, A.B. The influence of residence time during hydrothermal carbonisation of miscanthus on bio-coal combustion chemistry. Energies 2019, 12, 523. [Google Scholar] [CrossRef] [Green Version]
  67. Reza, M.T.; Andert, J.; Wirth, B.; Busch, D.; Pielert, J.; Lynam, J.G.; Mumme, J. Hydrothermal Carbonization of Biomass for Energy and Crop Production. Appl. Bioenergy 2014, 1, 11–29. [Google Scholar] [CrossRef]
  68. Smith, A.M.; Ekpo, U.; Ross, A.B. The Influence of pH on the Combustion Properties of Bio-Coal Following Hydrothermal Treatment of Swine Manure. Energies 2020, 13, 331. [Google Scholar] [CrossRef] [Green Version]
  69. Machado, N.T.; de Castro, D.A.R.; Santos, M.C.; Araújo, M.E.; Lüder, U.; Herklotz, L.; Werner, M.; Mumme, J.; Hoffmann, T. Process analysis of hydrothermal carbonization of corn Stover with subcritical H2O. J. Supercrit. Fluids 2018, 136, 110–122. [Google Scholar] [CrossRef]
  70. Monlau, F.; Sambusiti, C.; Barakat, A.; Quéméneur, M.; Trably, E.; Steyer, J.-P.; Carrère, H. Do furanic and phenolic compounds of lignocellulosic and algae biomass hydrolyzate inhibit anaerobic mixed cultures? A comprehensive review. Biotechnol. Adv. 2014, 32, 934–951. [Google Scholar] [CrossRef]
  71. Wijngaard, H.; Brunton, N. The Optimization of Extraction of Antioxidants from Apple Pomace by Pressurized Liquids. J. Agric. Food Chem. 2009, 57, 10625–10631. [Google Scholar] [CrossRef]
  72. O’Sullivan, C.; Rounsefell, B.; Grinham, A.; Clarke, W.; Udy, J. Anaerobic digestion of harvested aquatic weeds: Water hyacinth (Eichhornia crassipes), cabomba (Cabomba Caroliniana) and salvinia (Salvinia molesta). Ecol. Eng. 2010, 36, 1459–1468. [Google Scholar] [CrossRef]
  73. Patil, J.H.; AntonyRaj, M.; Shankar, B.B.; Shetty, M.K.; Kumar, B.P. Anaerobic co-digestion of Water Hyacinth and Sheep Waste. Energy Procedia 2014, 52, 572–578. [Google Scholar] [CrossRef] [Green Version]
  74. Varanasi, J.L.; Kumari, S.; Das, D. Improvement of energy recovery from water hyacinth by using integrated system. Int. J. Hydrogen Energy 2018, 43, 1303–1318. [Google Scholar] [CrossRef]
  75. Barua, V.B.; Kalamdhad, A.S. Biochemical methane potential test of untreated and hot air oven pretreated water hyacinth: A comparative study. J. Clean. Prod. 2017, 166, 273–284. [Google Scholar] [CrossRef]
  76. Elbeshbishy, E.; Dhar, B.R.; Nakhla, G.; Lee, H.S. A critical review on inhibition of dark biohydrogen fermentation. Renew. Sustain. Energy Rev. 2017, 79, 656–668. [Google Scholar] [CrossRef]
  77. Ahmed, B.; Aboudi, K.; Tyagi, V.K.; Álvarez-Gallego, C.J.; Fernández-Güelfo, L.A.; Romero-García, L.I.; Kazmi, A.A. Improvement of Anaerobic Digestion of Lignocellulosic Biomass by Hydrothermal Pretreatment. Appl. Sci. 2019, 9, 3853. [Google Scholar] [CrossRef] [Green Version]
  78. Mumme, J.; Srocke, F.; Heeg, K.; Werner, M. Use of biochars in anaerobic digestion. Bioresour. Technol. 2014, 164, 189–197. [Google Scholar] [CrossRef] [PubMed]
  79. Choe, U.; Mustafa, A.M.; Lin, H.; Xu, J.; Sheng, K. Effect of bamboo hydrochar on anaerobic digestion of fish processing waste for biogas production. Bioresour. Technol. 2019. [Google Scholar] [CrossRef]
  80. Xu, J.; Mustafa, A.M.; Lin, H.; Choe, U.Y.; Sheng, K. Effect of hydrochar on anaerobic digestion of dead pig carcass after hydrothermal pretreatment. Waste Manag. 2018, 78, 849–856. [Google Scholar] [CrossRef]
  81. Zhao, K.; Li, Y.; Zhou, Y.; Guo, W.; Jiang, H.; Xu, Q. Characterization of hydrothermal carbonization products (hydrochars and spent liquor) and their biomethane production performance. Bioresour. Technol. 2018, 267, 9–16. [Google Scholar] [CrossRef]
Figure 1. Untreated water hyacinth (WH) and hydrochar characteristics, including HHV (black bars), hydrochar yield (red circles), and energy yield (red diamonds). The numbers above the bars represent the energy densification of the hydrochar compared to the untreated WH. HHV is reported on a dry basis. Char-150 = WH hydrochar produced at 150 °C. Char-200 = WH hydrochar produced at 200 °C. Char-250 = WH hydrochar produced at 250 °C.
Energies 13 05983 g001
Figure 2. Images of untreated water hyacinth (WH) and hydrochars produced from WH during hydrothermal carbonisation at 150 °C, 200 °C, and 250 °C.
Energies 13 05983 g002
Figure 3. Ash fusion transition temperatures for untreated water hyacinth (WH) and water hyacinth hydrochars). Char-150 = WH hydrochar produced at 150 °C. Char-200 = WH hydrochar produced at 200 °C. Char-250 = WH hydrochar produced at 250 °C.
Energies 13 05983 g003
Figure 4. Experimental biochemical methane potential (BMPex) of untreated water hyacinth (WH) and WH hydrothermal carbonisation (HTC) products. The BMPex is shown for (a) process waters, (b) hydrochars, and (c) HTC slurries. Data is presented as average values. Error bars represent the minimum and maximum values (n = 2). PW-150 = HTC process water produced from WH at 150 °C. PW-200 = HTC process water produced from WH at 200 °C. PW-250 = HTC process water produced from WH at 250 °C. Slurry-150 = HTC slurry produced from WH at 150 °C. Slurry-200 = HTC slurry produced from WH at 200 °C. Slurry-250 = HTC slurry produced from WH at 250 °C.
Energies 13 05983 g004
Figure 5. Energetic output from each hydrothermal carbonisation (HTC) and anaerobic digestion (AD) integration strategy, using a starting material of 1 kg of dried water hyacinth (WH). Integration strategies include (a) combustion of hydrochar and digestion of process waters (b) digestion of hydrochars only (c) digestion of slurries. HTC-150 = HTC of WH at 150 °C and separation of hydrochar and process water. HTC-200 = HTC of WH at 200 °C and separation of hydrochar and process water. PW-250 = HTC of WH at 250 °C and separation of hydrochar and process water. Char-150 = hydrochar produced from WH at 150 °C. Char-200 = hydrochar produced from WH at 200 °C. Char-250 = hydrochar produced from WH at 250 °C. Slurry-150 = HTC slurry produced from WH at 150 °C. Slurry-200 = HTC slurry produced from WH at 200 °C. Slurry-250 = HTC slurry produced from WH at 250 °C.
Energies 13 05983 g005
Table 1. Predictive slagging and fouling indices.
Slagging/Fouling IndexEquationAnalysis
Alkali indexAI = k g   K 2 O + N a 2 O G J AI < 0.17 safe combustion
AI > 0.17 < 0.34 probable slagging and fouling
AI > 0.34 almost certain slagging and fouling
Bed agglomeration indexBAI = % F e 2 O 3 % K 2 O + N a 2 O BAI < 0.15 bed agglomeration likely
Acid base ratioR b a = % F e 2 O 3 + C a O + M g O + K 2 O +   N a 2 O % S i O 2 +   T i O 2 + A l 2 O 3 R b a < 0.5 low slagging risk
Slagging index SI = % F e 2 O 3 + C a O + M g O + K 2 O +   N a 2 O % S i O 2 +   T i O 2 + A l 2 O 3 × %S (dry)SI < 0.6 low slagging inclination
SI > 0.6 < 2.0 medium slagging inclination
SI > 2.0 high slagging inclination
Fouling indexFI =   % F e 2 O 3 + C a O + M g O + K 2 O +   N a 2 O % S i O 2 +   T i O 2 + A l 2 O 3 × %( K 2 O + N a 2 O )FI < 0.6 low fouling
FI > 0.6 < 40.0 medium fouling
FI > 40.0 high fouling
Slag viscosity indexSVI = % S i O 2 100 % S i O 2 + M g O + C a O +   F e 2 O 3   SVI > 72 low slagging inclination
SVI > 63 < 72 medium slagging inclination
SVI < 65 high slagging inclination
Table 2. Proximate and ultimate composition of untreated water hyacinth (WH) and hydrochars from hydrothermal carbonisation reactions.
Untreated (Dry) WHChar-150Char-200Char-250
%Moisture (ar)6.74.82.91.7
%Volatile Matter (db)85.476.970.655.8
%Fixed Carbon (db)ND6.513.621.9
%Ash (db)14.616.615.922.3
%C (db)38.7 ± 0.039.3 ± 0.245.5 ± 0.153.0 ± 0.7
%H (db)3.4 ± 0.03.5 ± 0.03.7 ± 0.04.0 ± 0.5
%N (db)2.7 ± 0.12.5 ± 0.02.6 ± 0.03.4 ± 0.0
%S (db)0.1 ± 0.1NDNDND
%O a (db)40.6 ± 0.238.1 ± 0.232.4 ± 0.117.2 ± 0.3
C:N b (db)14161816
O:C c (daf)0.790.730.530.24
H:C c (daf)1.041.080.990.91
%VS (ar)73.7 ± 0.075.6 ± 0.378.4 ± 0.274.9 ± 0.0
VS (%TS)79.1 ± 0.081.4 ± 0.682.0 ± 0.277.1 ± 0.1
a Oxygen measured by difference. b Mass ratio. c Molar ratio. SF = severity factor. ar = as received basis. db = dry basis. daf = dry ash-free basis. VS = volatile solids. TS = total solids. ND = not detected. Data is presented as average values ± one standard deviation (n = 2), where applicable. Char-150 = WH hydrochar produced at 150 °C. Char-200 = WH hydrochar produced at 200 °C. Char-250 = WH hydrochar produced at 250 °C.
Table 3. Major inorganic elemental composition of untreated water hyacinth (WH) and hydrochars.
SampleInorganic Composition (wt % Biomass)
NaMgPKCaFeSi
Untreated WH0.400.600.581.762.040.781.24
Char-1500.320.550.601.562.601.081.66
Char-2000.280.300.480.962.690.981.95
Char-2500.220.661.061.572.751.792.61
Char-150 = WH hydrochar produced at 150 °C. Char-200 = WH hydrochar produced at 200 °C. Char-250 = WH hydrochar produced at 250 °C.
Table 4. Slagging and fouling indices for untreated water hyacinth (WH) and hydrochars.
SampleSlagging and Fouling Index
AIBAI R b a SIFISVI
Untreated WH2.00.42.00.25.234.9
Char-1501.60.71.60.03.736.8
Char-2000.80.91.10.01.742.4
Char-2500.91.21.10.02.442.6
AI = alkali index. BAI = bed agglomeration index. Rb/a = acid base ratio. SI = slagging index. FI = fouling index. SVI = slag viscosity index. Green indicates low risk. Yellow indicates medium risk. Red indicates a high risk. Char-150 = WH hydrochar produced at 150 °C. Char-200 = WH hydrochar produced at 200 °C. Char-250 = WH hydrochar produced at 250 °C.
Table 5. Characterisation of process water fraction from water hyacinth hydrothermal carbonisation reactions.
PW-150PW-200PW-250
COD (g/L)19.0 ± 0.227.5 ± 0.231.4 ± 0.1
TOC (g/L)7.1 ± 0.011.1 ± 0.012.1 ± 0.0
VS (g/L)11.9 ± 0.219.2 ± 0.113.6 ± 0.0
Total Sugars (g/L)2.51.20.9
Total VFA (mg/L)403.31356.41552.2
Acetic Acid (mg/L)365.2 ± 109.61259.5 a1380.5 ± 36.6
Propionic Acid (mg/L)6.5 ± 1.345.4 ± 1.290.8 ± 0.2
Butyric Acid (mg/L)ND11.0 ± 2.826.3 ± 6.2
Total Phenol (mg/L)79.7 ± 0.8342.3 ± 23.0424.8 ± 15.9
HMF (mg/L)ND587.3264.6
Furfural (mg/L)ND382.0ND
pH5.64.45.1
a VFA result based on singlet analysis. COD = chemical oxygen demand. TOC = total organic carbon. VS = volatile solids. VFA = volatile fatty acids. HMF = 5-hydroxymethylfurfual. ND = not detected. Data is presented as average values ± standard deviation, where applicable. PW-150 = HTC process water produced from WH at 150 °C. PW-200 = HTC process water produced from WH at 200 °C. PW-250 = HTC process water produced from WH at 250 °C.
Table 6. Digestion kinetics from the anaerobic digestion of untreated water hyacinth (WH) and hydrothermal products.
SampleExperimental DataModified Gompertz ModelTmT80
BMPexBMPthBIHmRmλR2
(mL CH4/g VS)(mL CH4/g VS)(%)(mL CH4/g VS)(mL CH4/g VS/d)(d)(d)(mL CH4/g VS)(d)
Untreated WH103.1349.030103.111.20.00.9853.482.59
Char-150191.1379.450187.620.60.00.9933.3152.910
Char-200185.0474.239185.646.10.70.9992.2148.05
Char-25044.9678.9744.912.60.00.9971.335.94
Slurry-150202.1349.058196.632.40.00.9712.2161.67
Slurry-200162.4349.047162.247.60.20.9991.5129.94
Slurry-250146.3349.042142.239.40.30.9951.6117.04
SampleExperimental DataModified Gompertz ModelTmT80
BMPexBMPth aBIHmRmλR2
(mL CH4/g COD)(mL CH4/g COD)(%)(mL CH4/g COD)(mL CH4/g COD/d)(d)(d)(mL CH4/g COD)(d)
PW-150213.4350.061212.143.60.00.9971.8170.75
PW-200137.9350.039140.711.62.00.9766.4110.311
PW-250148.8350.043148.714.20.00.9943.9119.011
a based on the assumption 1 g COD = 350 NmL CH4 [49]. BMPex = experimental biochemical methane potential. BMPth = theoretical biochemical methane potential; based on the Boyle’s equation. BI = biodegradability index. Hm = maximum biomethane yield. Rm = peak biomethane production rate. λ = lag phase. Tm = peak time of fermentation. T80 = technical digestion time. PW-150 = HTC process water produced from WH at 150 °C. PW-200 = HTC process water produced from WH at 200 °C. PW-250 = HTC process water produced from WH at 250 °C. Char-150 = hydrochar produced from WH at 150 °C. Char-200 = hydrochar produced from WH at 200 °C. Char-250 = hydrochar produced from WH at 250 °C. Slurry-150 = HTC slurry produced from WH at 150 °C. Slurry-200 = HTC slurry produced from WH at 200 °C. Slurry-250 = HTC slurry produced from WH at 250 °C.
Table 7. Energy balance for the integration strategies for hydrothermal carbonisation and anaerobic digestion using a starting material of 1 kg of dried water hyacinth.
Integration
Strategy
Temperature (°C)Energy Input (MJ/kg WH)Energy Output (MJ/kg WH)EROI a
[i] Hydrochar combustion and process water digestion1505.0110.274.56
2007.029.793.10
2509.029.482.34
[ii] Digestion of hydrochar alone1505.014.592.04
2007.023.331.05
2509.020.510.13
[iii] Digestion of HTC slurry1505.015.782.56
2007.024.151.31
2509.022.440.60
a Assumed 55% energy recovery efficiency. EROI = energy return on investment.
Publisher’s Note: MDPI stays neutral with regard to jurisdictional claims in published maps and institutional affiliations.

