1. Introduction
The constantly growing world population and social and economic growth are increasing energy demand [
1]. Currently, the energy system is still based on non-renewable energy sources such as coal, oil, and natural gas, and their use for this purpose is associated with a negative impact on the environment [
2]. Moreover, these resources are limited and exhaustible. Both care for the natural environment and concerns about limited resources of fossil fuels resulted in an intensive search for other energy sources—e.g., environmentally friendly renewable energy [
3].
Biogas technology is considered to be one of the most promising solutions in the waste management sector and alternative renewable energy production [
4,
5]. There are currently 108 biogas plants operating in Poland on municipal waste landfills [
6]. In European countries, there are up to about 15 biogas plants per 1 million capita (e.g., 15 in Norway, 5 in Germany, and 2 in Poland) [
7]. It is expected that these numbers will be systematically increasing both because of the need to increase the share of renewable energy, need to reduce the use of fossil fuels, and because of the intensification of agri-food processing [
8]. The process of methane fermentation in biogas plants leads to the formation of products such as biogas and digestate. They can be used as a source of heat and electricity (biogas), fuel (pellets and briquettes), an excellent fertilizer for plants and animal bedding or process water [
9]. Additionally, the economic aspect resulting from the sale of electricity and heat, as well as the social aspect, is realized by creating new jobs [
10].
The post-fermentation mass (also known as the digestate, the digestate biomass, or the digestate pulp) formed in the anaerobic process is a mixture of unfermented organic compounds, methane bacteria and mineral components [
11]. Its amount depends on the size of a biogas plant and may reach even several dozen thousand tons per year [
12]. However, the chemical composition is related to the type of substrates used in a biogas plant. In the process of biogasification, there are numerous changes in the substrates—e.g., a decrease in the content of organic substances, an increase in the content of mineral compounds per dry mass, fragmentation of solids, total or partial hygienization, as well as decomposition of odorants [
13]. Additionally, the quality of the digestate is influenced by the duration of fermentation. Longer process time results in a lower content of organic substances in the fermentation mass, due to more effective methanogenesis [
14]. Quality and chemical composition of the digestate has a decisive influence on its subsequent utilization.
A conventional solution for the management and processing of the digestate consists of separating it into solid and liquid fractions before final disposal [
15]. The solid fraction is most often subjected to drying or thermal combustion, while the liquid fraction, if it does not contain hazardous components, can be directly used for field irrigation or treated as a process liquid and recirculated in a system to dilute substrates in a digestion reactor [
16,
17]. In order to meet the quality requirements by the components separated from the digestate, especially when digestate treatment aims to recover water, it becomes necessary to subject it to advanced physico-chemical processes preceded by pre-treatment with e.g., coagulation and chemical precipitation. In the coagulation process, various reagents can be used, which in dissociated form adsorb in the Stern layer of colloidal or suspended particles [
18]. In this way, they reduce their electrokinetic potential to a value at which there is no significant electrostatic repulsion causing particle agglomeration [
19]. The resulting agglomerates, especially at high fragmentation of particles, can still be very small and slowly settling. Therefore, the occurrence of accompanying processes such as precipitation of hydroxides or other sediments is important in the coagulation process. For this reason, coagulants that can easily be hydrolyzed are used. These are usually inorganic substances that reduce the
ζ potential of the particles [
20]. The sediment has a large surface charge, adsorbs the counter-ions, and coagulates. Both the type of adsorbed ions and the electrokinetic potential depend on the products obtained and the type of reagents dosed. The most commonly used coagulants include aluminum and iron salts: Al
2(SO
4)
3·18 H
2O, FeSO
4·7 H
2O, Fe
2(SO
4)
3·9 H
2O, FeCl
3·6 H
2O [
21]. In addition to Al and Fe salts, lime (CaO) is used for cleaning solutions heavily contaminated by organic compounds. Coagulation/chemical precipitation processes may allow the removal of mechanical and colloidal impurities, microorganisms as well as carbonate hardness (when CaO is dosed) as a result of precipitation of hardly soluble calcium and partly magnesium compounds. Moreover, when lime is used as a reagent, the ammonia is removed and disinfection of the solution is achieved. From a practical point of view, the process of coagulation/chemical precipitation is relatively uncomplicated and, above all, effective [
18]. Easy separation of the produced sludge is an additional advantage. Moreover, the content of biogenic and organic substances is reduced without having to subject the wastewater to biological treatment. However, it should be considered that the effectiveness of this process (defined as the effectiveness of removing selected fractions of pollutants from the solution) may depend on many factors—e.g., the properties of the applied reagent, its dosage and reaction time. In addition, coagulation/chemical precipitation, by removing some of the impurities and as a result of the chemical reactions taking place in the solution, has a significant effect on the properties of the particles remaining in the solution, such as particle size and
ζ potential. This is particularly important for subsequent digestate cleaning processes, such as membrane processes, as it can determine the intensity of membrane blockages and thus their separation and transport properties.
The digestate is a mixture of particles with different electrophoretic potential. The
ζ potential represents an electrical potential of a charged particle immersed in an aqueous solution at the boundary of a slip separating a stationary layer of ions and counter-ions absorbed at the surface of the particle from the ions and counter-ions in another mobile diffusion layer directed into the solution. It may take positive or negative values depending on the pH of the solution and an absolute value also depends on the ionic strength. The pH value at which the
ζ potential equals zero is called an IEP and is determined as pH
iep. In the vicinity of the IEP, there is a noticeable lack of electrostatic repulsion between the particles, and if there are no other forces ensuring repulsion, the particles merge into aggregates, coagulate, and settle. The suspension of particles is unstable. It is assumed that a
ζ potential greater than ±30 mV guarantees stability of the dispersion of fine particles [
21].
While numerous studies have been conducted on the liquid fraction of digestate from agricultural biogas plants (i.e., [
22,
23,
24,
25,
26,
27]), there are very few literature reports on the municipal waste biogas plant digestate liquid fraction treatment. Moreover, to our knowledge, there are no literature reports on the use of PIX 112 and FeCl
3 coagulants for pre-treatment of the digestate from municipal biogas plants, as well as concerning changes in the properties of substances remaining in solution after coagulation using different reagents. They were mainly limited to the assessment of the removal effectiveness of the contaminants.
The previous study [
28] determined the effectiveness of different reagents in the pretreatment of the liquid fraction of digestate from municipal waste biogas plants. The influence of contact time and reagent dose on the separation of organic compounds and ammonium nitrogen reduction was studied. In order to better understand the phenomena occurring during the pre-treatment of the liquid fraction of the digestate in the physico-chemical process, it seemed to be advisable to analyze changes in the particle size distribution and the ζ potential values of the particles present in the liquid fraction of the digestate coming from municipal waste biogas plants and in solutions after its treatment using the coagulation/chemical precipitation process.
2. Materials and Methods
The research was conducted for a liquid fraction of the digestate coming from a biogas plant (ZGO Gać Sp. z o. o., Oława, Poland) processing the organic fraction of municipal waste. Its properties can be found in
Table 1.
Pre-treatment of the digestate liquid fraction by coagulation/chemical precipitation was carried out using three different chemical reagents, characteristics of which are shown in
Table 2. Doses of the reagents used in the experiments were 10 or 20 g/dm³. A respective amount of reagent was dosed to a reactor with a capacity of 1 dm³ located on a test stand equipped with a Velp Scientifica JLT4 mechanical stirrer. Rapid mixing (150 rpm) was carried out for 2 min followed by slow mixing (20 rpm) for 20 min. After that time, the stirrers were switched off and samples were sedimented for 30 min. Each experiment was duplicated. The selection of operational parameters of the process resulted from the authors’ experience in performing the coagulation/chemical precipitation process.
The efficiency of the process was determined by measuring the concentration of organic compounds expressed as chemical oxygen demand (COD), 5-day biochemical oxygen demand (BOD
5), and dissolved organic carbon (DOC). Determination of COD and BOD
5 was performed using standard methods: dichromate and dilution, respectively [
32]. The concentration of dissolved organic carbon was measured using the HACH IL550 TOC-TN analyzer. Each time before the analysis, the supernatant was filtered using medium paper filters (10–15 µm). Based on the measured factor in raw digestate (
c0) and digestate after treatment (
c), removal efficiency (
R) for each factor was calculated according to the following equation:
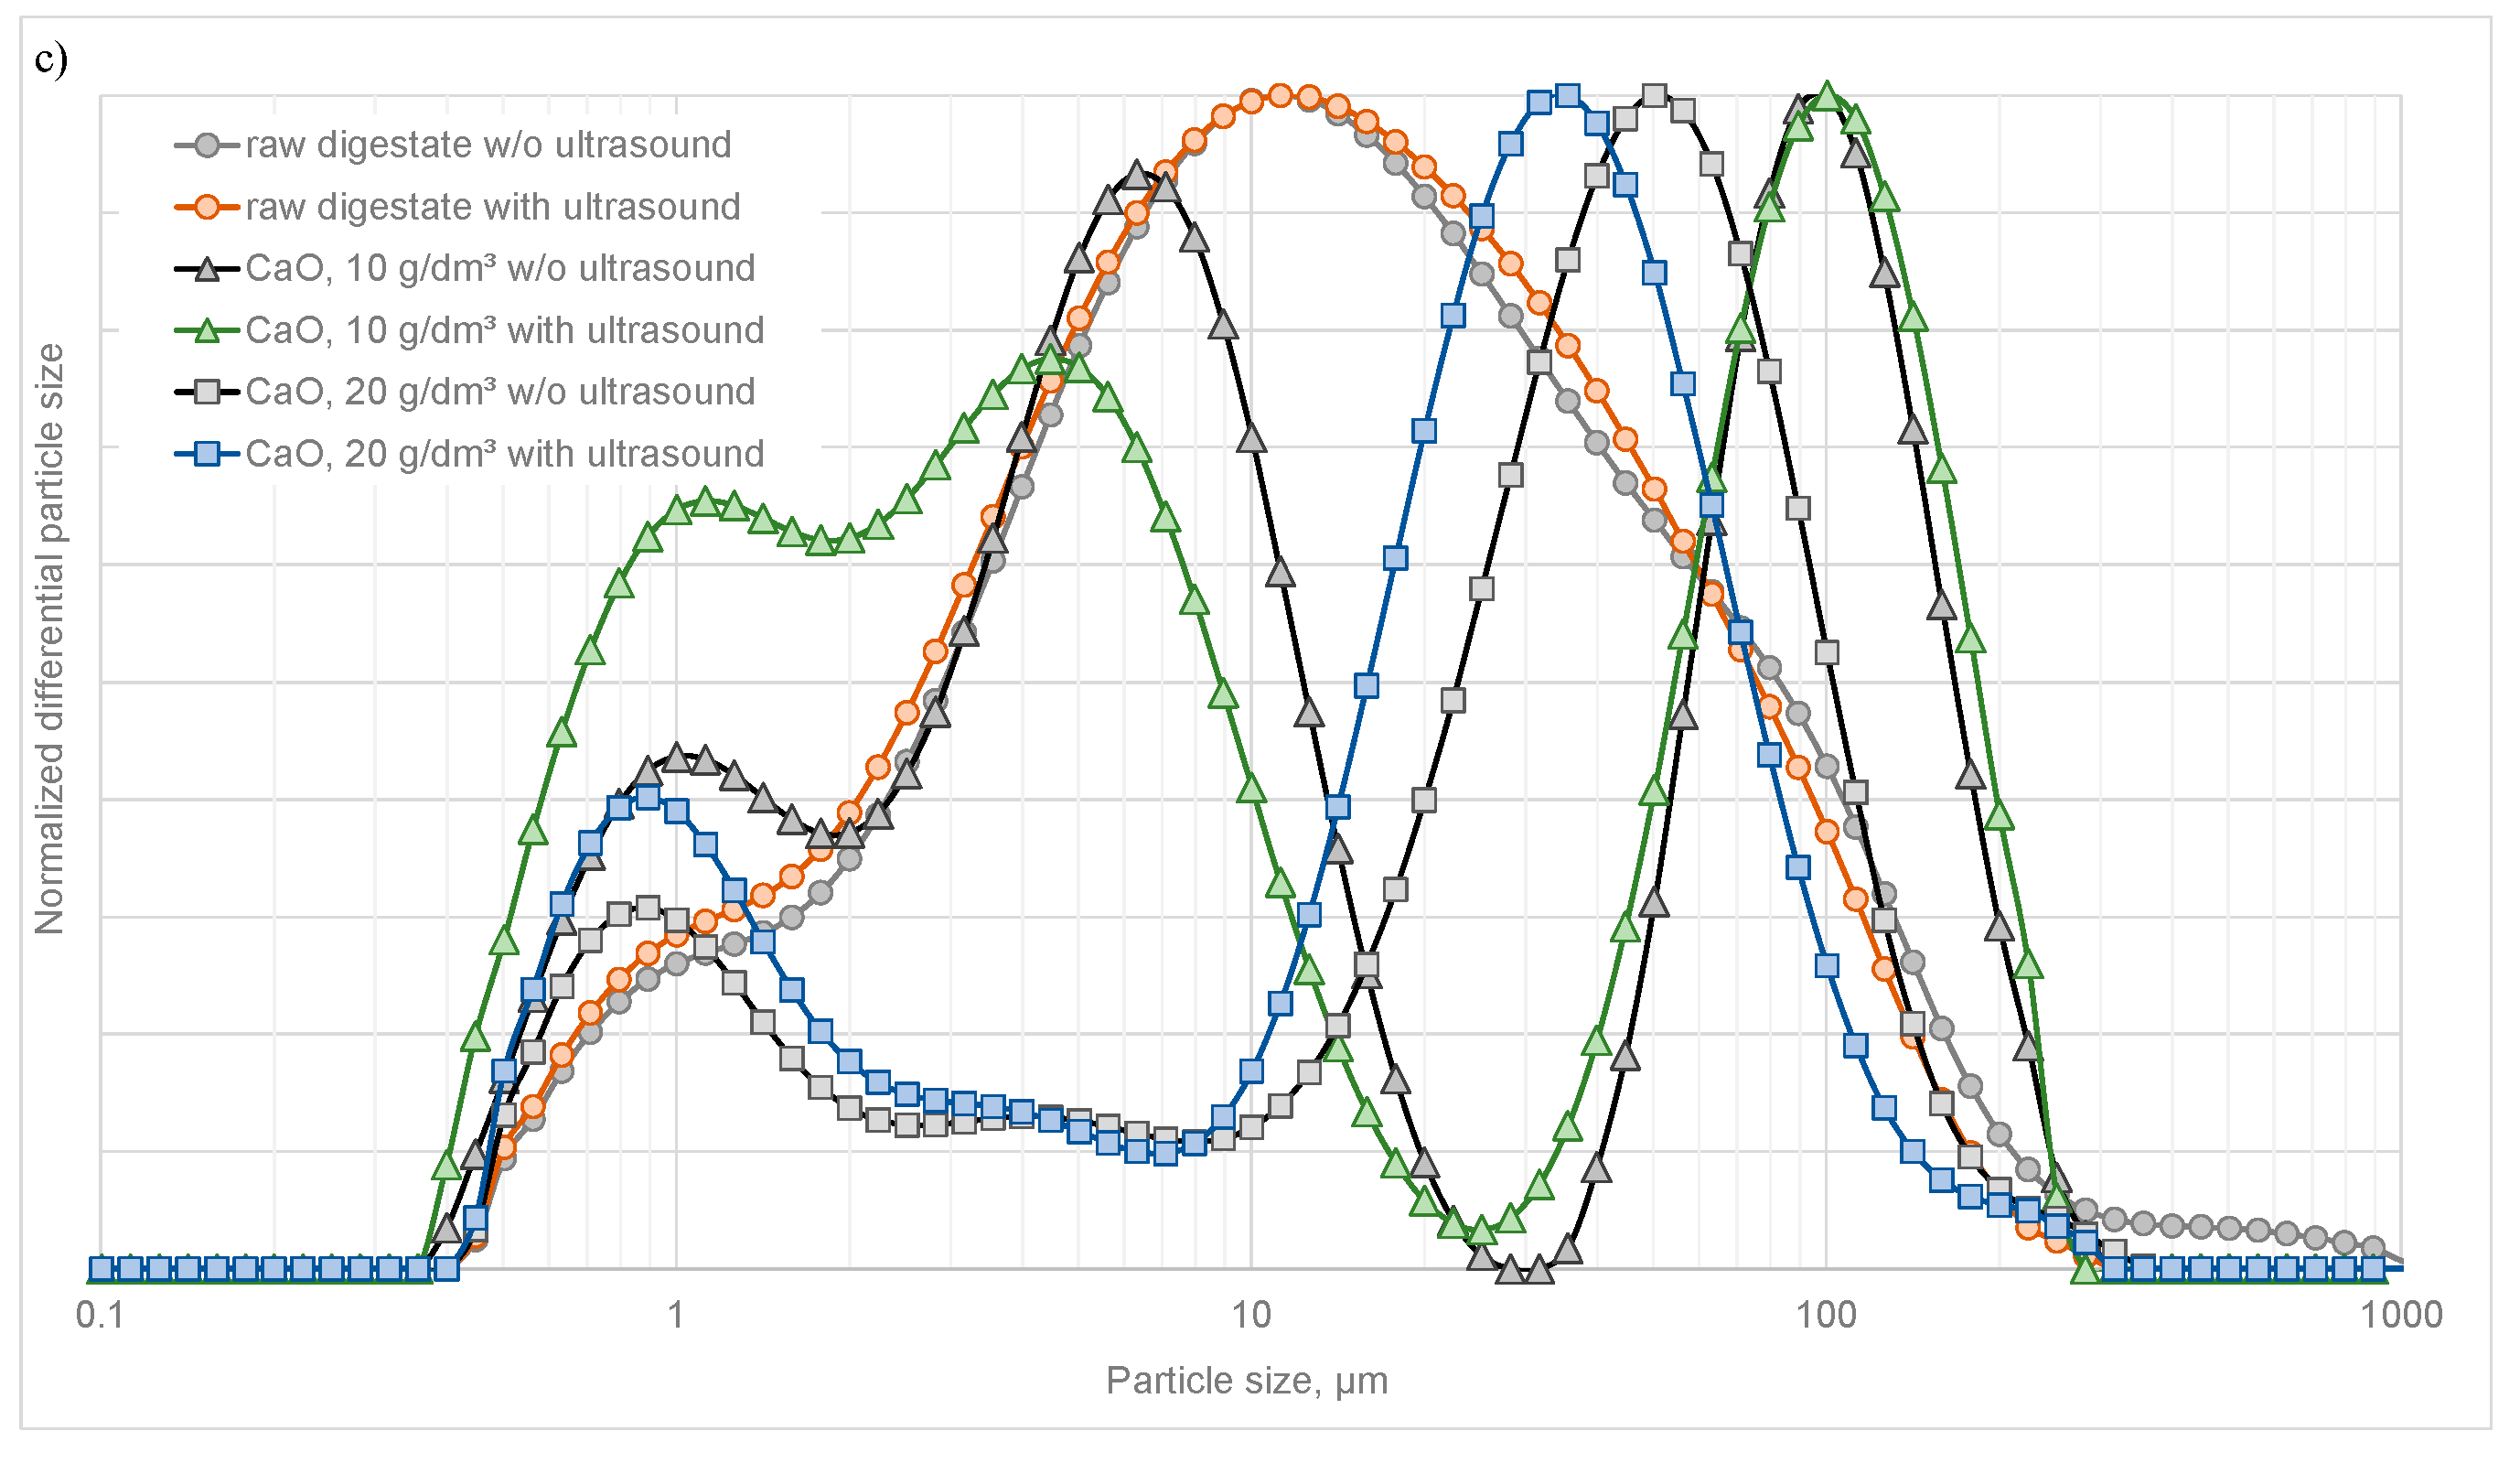
Particle size distribution was carried out using a Mastersizer 2000 laser diffractometer (Malvern), equipped with a HydroMu dispersion unit (Malvern). Measuring range of the apparatus is a particle size from 0.1 to 2000 µm (particle RI 1.52, absorption 0.1). In the measuring procedure, depending on the concentration of solid particles, around 3 cm3 of suspension was poured into 700 cm3 beaker filled with water circulated through a measuring cell. Measurement of particle size distribution was carried out without ultrasounds (the suspension was circulated through the measuring cell, but no ultrasound was generated) and then during ultrasonication of suspension (sonification took place in a beaker from which the suspension is pumped and circulated through the measuring cell) until the particle size distribution was stabilized (the breakdown of possible agglomerates).
Particle size distribution was also performed with the use of a Nicomp 380 DLS apparatus (Nicomp Particle Sizing Systems). This submicron particle size analyzer uses the dynamic light scattering (DLS) method to obtain particle size distributions for samples with particles ranging from 1 nm to 5 µm. The measurement was carried out by placing around 3.5 cm3 of diluted suspension in a measuring cell. Through the use of Nicomp analysis algorithm, the 380 is able to analyze complex multi-modal distributions with the highest resolution and reproducibility.
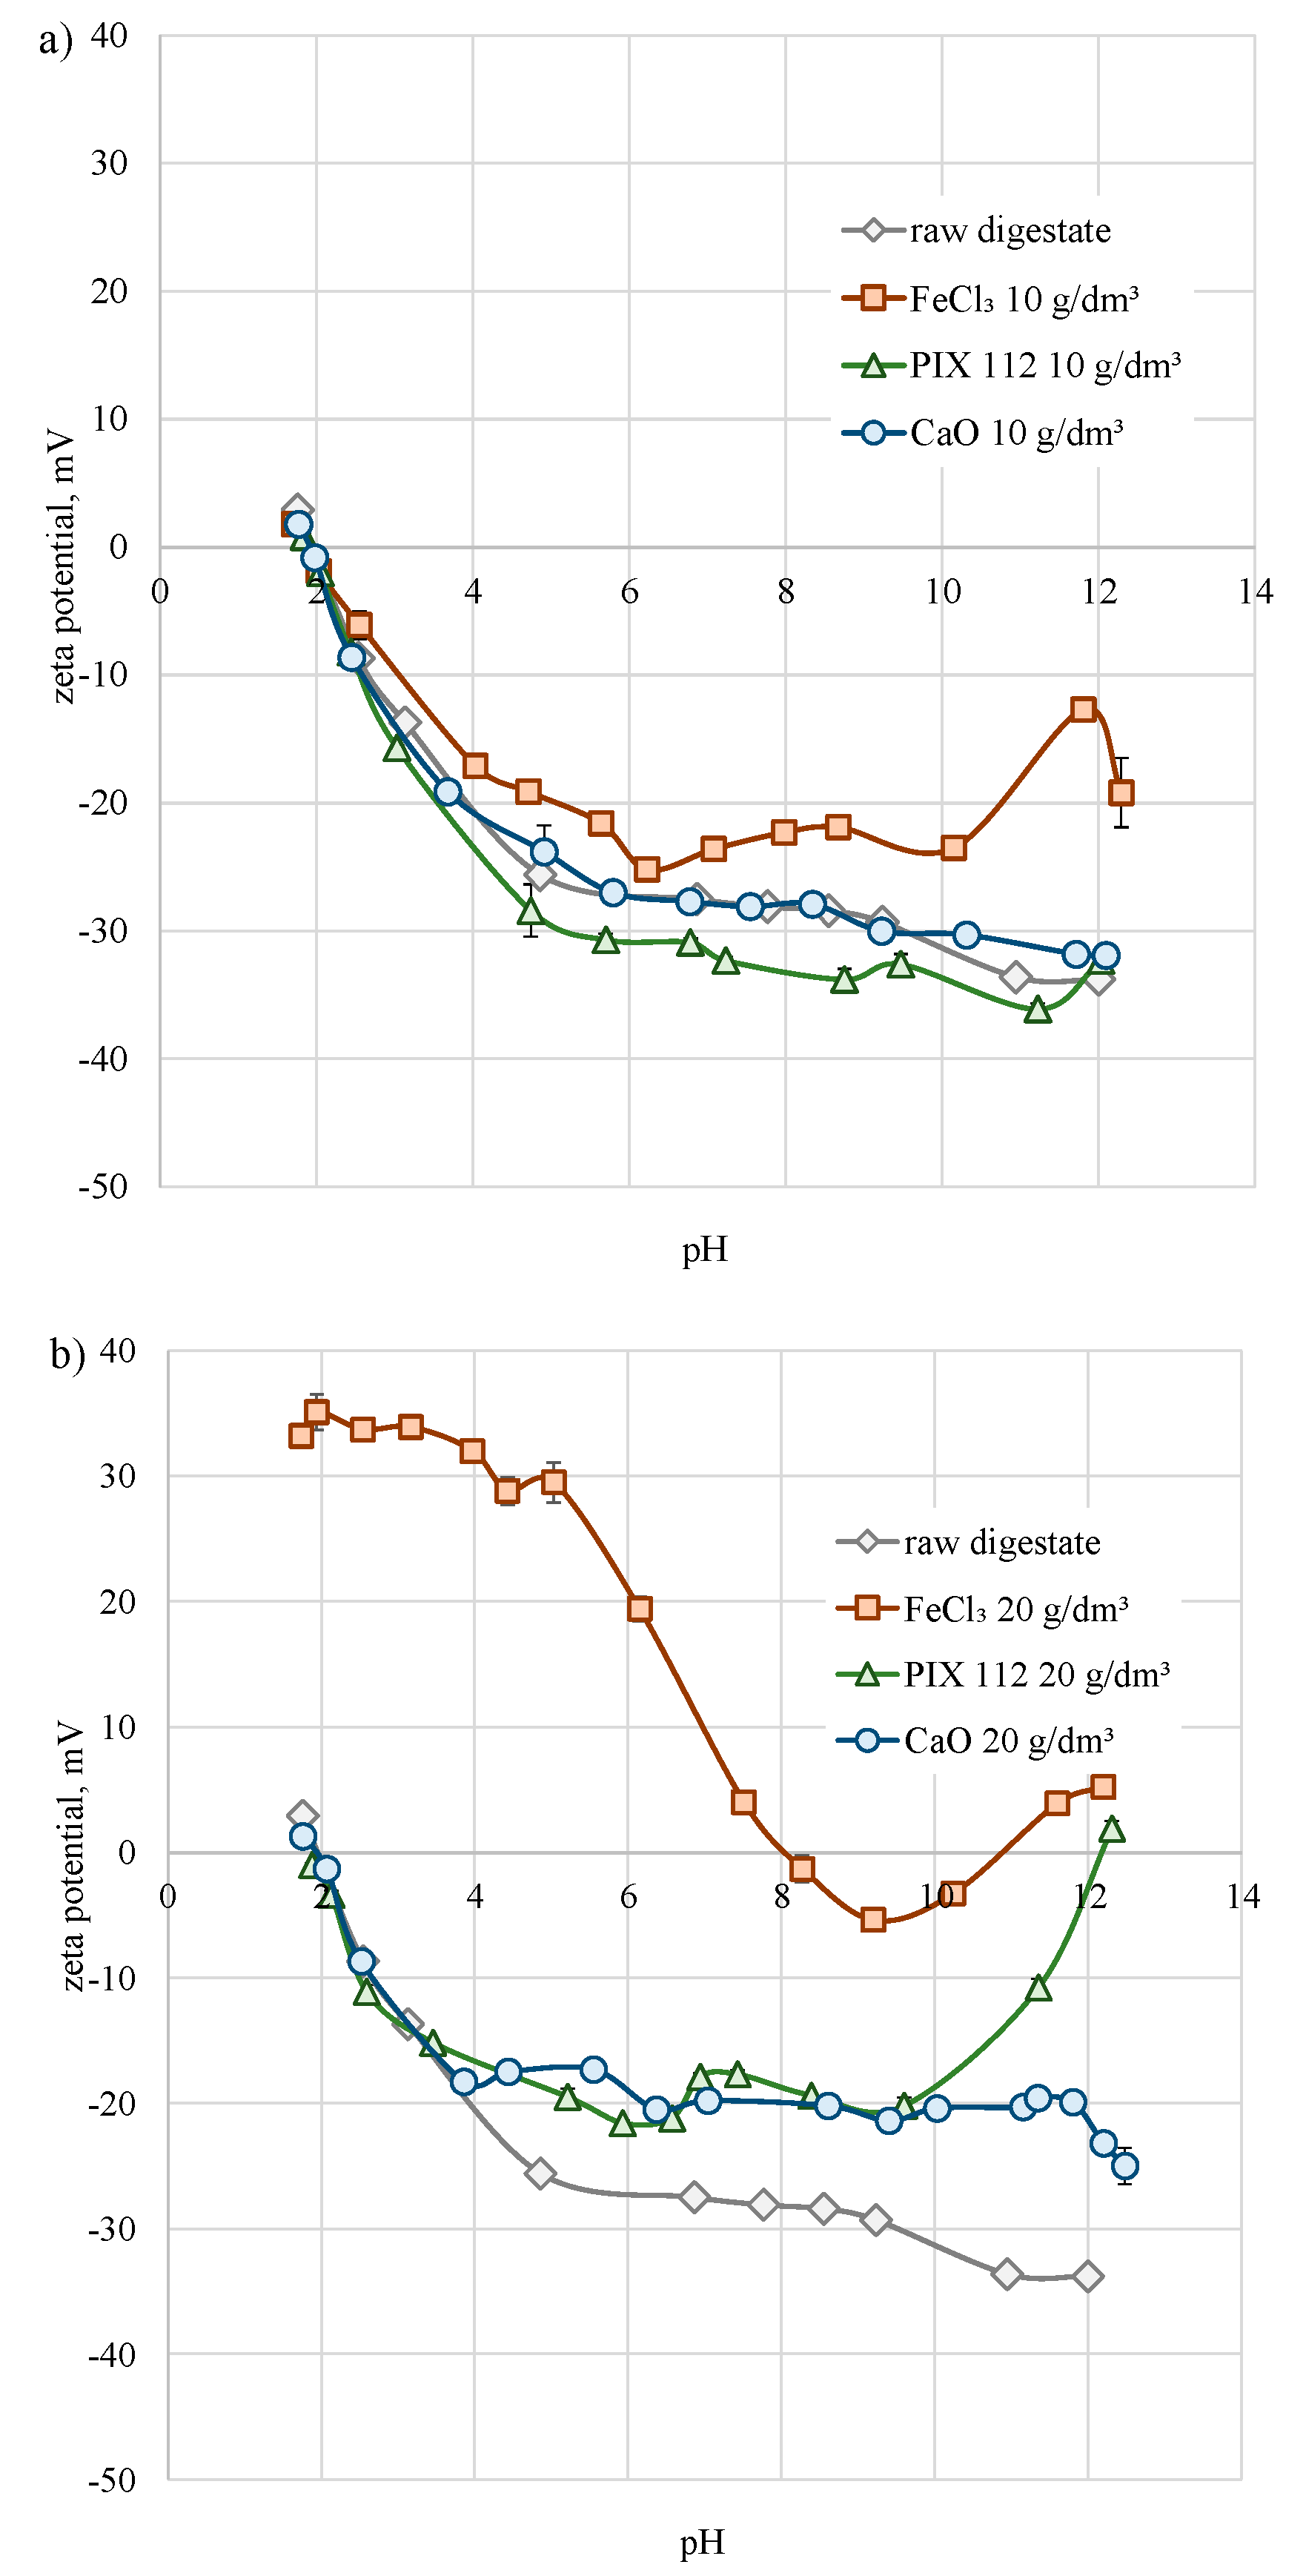
ζ potential measurements were conducted at 25 °C using a ζ potential analyzer (Malvern Zetasizer 2000). The diluted suspension was conditioned in a beaker for 10 min at a given pH. The pH was adjusted using sodium hydroxide or hydrochloric acid. Then, the suspension was placed in the electrophoresis cell with the use of a syringe. The value of ζ potential was determined as an average of five successive measurements.
3. Results
The coagulation/chemical precipitation process is used primarily to remove organic impurities from a solution. Its effectiveness depends on many factors, the most important of which seem to be the type of reagent used, its dose, and flocculation time, which will influence the effectiveness of the next process, which is sedimentation. In the study, the efficacy of 3 reagents—i.e., FeCl3, PIX 112, and CaO—for a liquid fraction of digestate from municipal waste plant treatment was compared. The selection of iron-based coagulants (FeCl3∙6H₂O, PIX 112) for testing was due to their lower sensitivity to temperature changes and the fact that they produce larger and faster sedimentary lobes when coagulating with them. In addition, the possible secondary contamination of the solution with residual Fe is far less dangerous than when using aluminum reagents. Lime (CaO) was used for research because of its low price and, above all, due to its universality. Not only does it allow for coagulation and chemical precipitation of pollutants, but it is also a disinfectant. Moreover, the generated sludge may have useful properties.
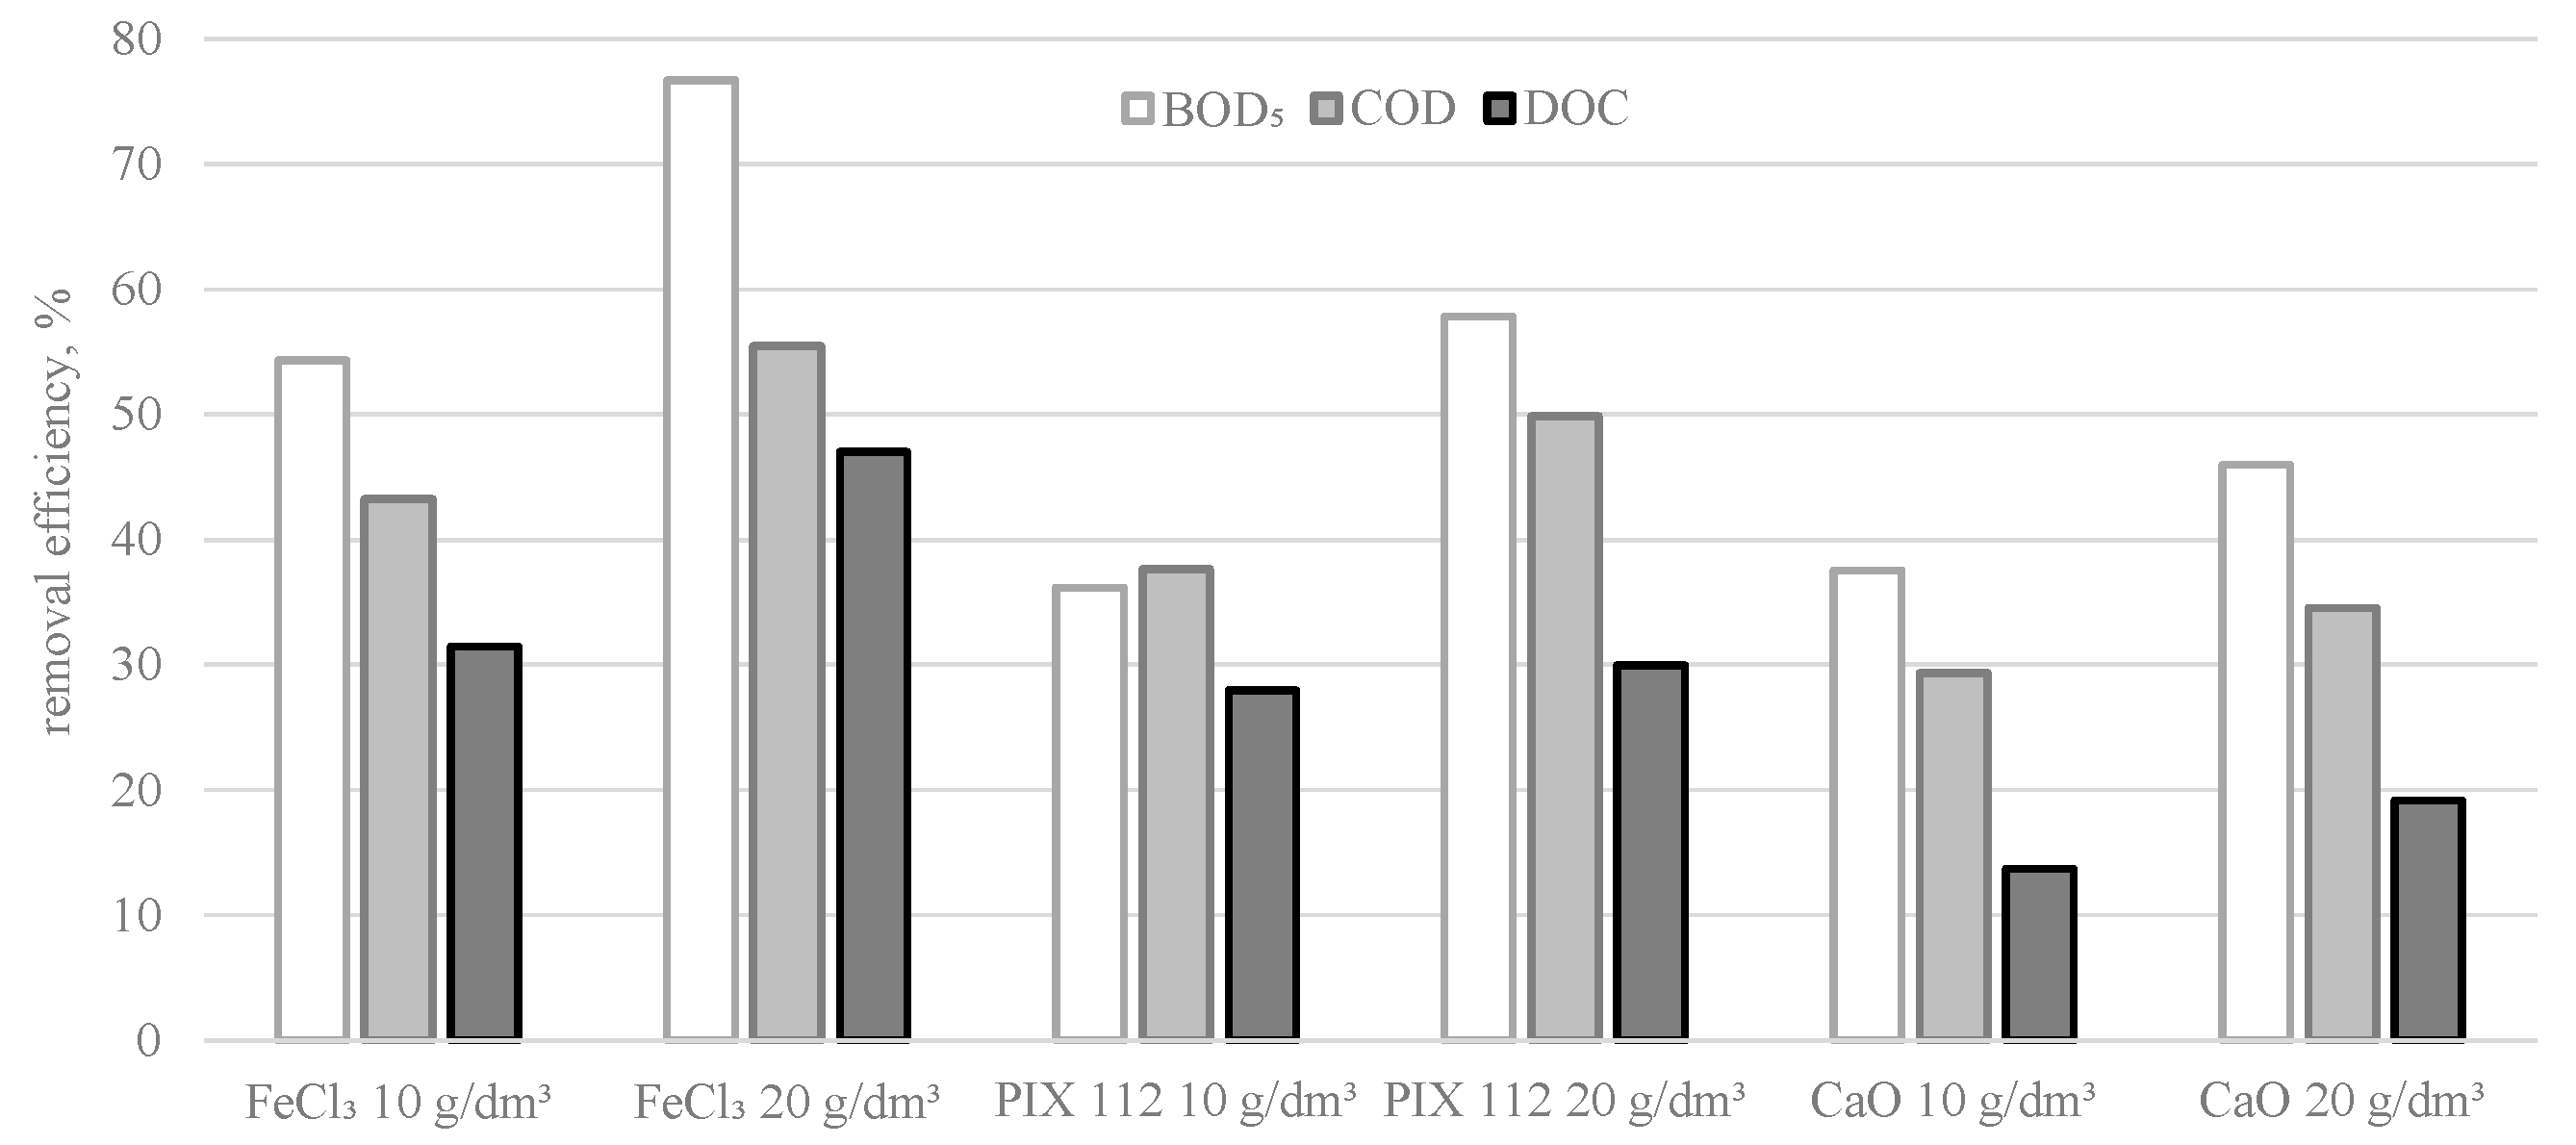
The results of the studies presented in
Figure 1 clearly show that an increase in the doses of all tested reagents resulted in a decrease in BOD
5, COD, and DOC. Moreover, it was observed that FeCl₃∙6H₂O was the most effective of the tested reagents. It allowed reductions in BOD
5, COD, and DOC values by 54%, 43%, and 31%, respectively, at a reagent dose 10 g/dm
3. The best effects of organic contaminant removal, observed for FeCl
3∙6H₂O, resulted probably from the fact that larger and heavier flocs were formed than in the case of other reagents. It was also found that the biodegradable fraction of organic compounds (expressed as BOD
5) was removed to the highest degree during coagulation/chemical precipitation. However, in case of removing all fractions of organic compounds (expressed as DOC), the elimination efficiency was much lower and did not exceed 50% (for FeCl₃∙6H₂O at a dose of 20 g/dm³).
The analysis of the obtained results made it possible to rank the examined reagents according to their treatment effectiveness as follows:
The study also assessed the effect of flocculation duration on the treatment effect. The analysis of the obtained results (
Figure 2) shows that regardless of the type of the applied reagent, extending the flocculation time beyond 30 min did not improve the efficiency of the process. The best effects could be seen in the initial stage of the process (20–30 min); therefore, a slow mixing time (flocculation) of 20 min was considered optimal. In all the cases, the following slight increase in organic compound content could be observed with the prolongation of flocculation time. For example, for a PIX 112 coagulant dose of 10 g/dm³ and slow mixing times of 20, 30, 40, and 60 min, the COD value was 3760, 4550, 4630, and 4675 g O
2/m³. However, when the reagent dose was increased to 20 g/dm³, the COD value in the purified samples of the digestate was 3370, 3470, 3925, and 4590 g O
2/m³. This effect is likely to be explained by the phenomenon of pollutants’ desorption due to excessive mixing time. This may have caused a partial breakdown of the flocs as well as desorption of compounds previously adsorbed during the flocculation stage.
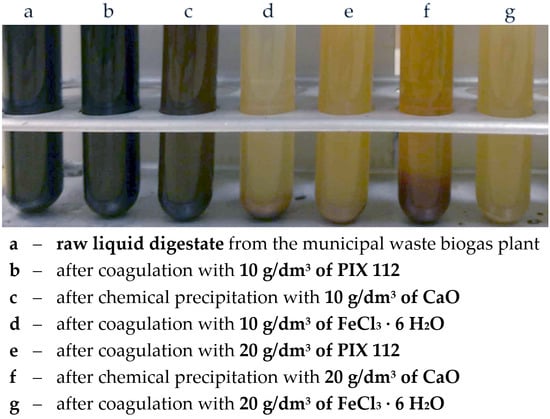
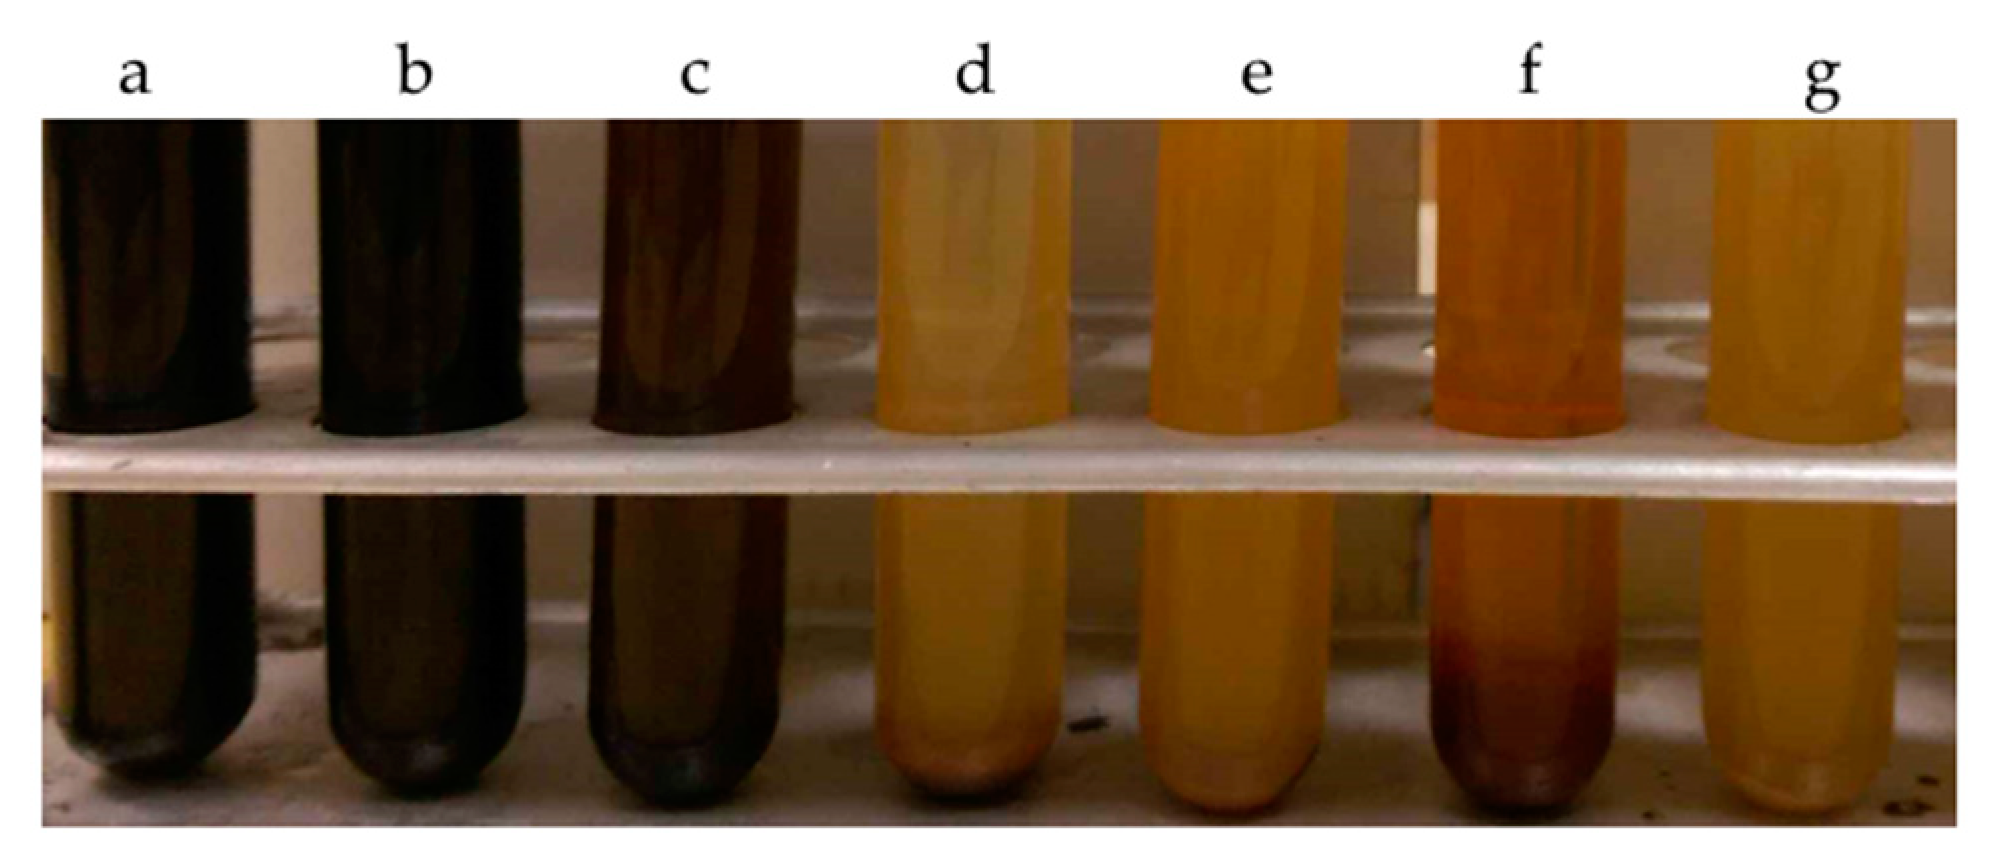
The visual effect of the treatment can be observed in
Figure 3.
The application of chemical treatment processes of the digestate liquid fraction, chemical coagulation/precipitation, in this case, results in chemical reactions in the solution after the addition of chemical reagents, which, among others, change the
ζ potential. Additionally, the use of coagulation alters the proportion of particle size fractions. The knowledge of the changes that occur in the solution as a result of coagulation/chemical precipitation of the digestate is particularly important for the selection of further treatment processes for this medium. For example, if you wish to use one of the pressure-driven membrane processes as a cleaning process, this can determine a pore size of the membrane to be used as well as a material of the membrane. Therefore, raw digestate and purified samples in the coagulation/chemical precipitation process were analyzed for the size distribution of the suspended particles and their
ζ potential in the pH 2–12 range (
Figure 4 and
Figure 5).
It was found that the suspension of raw digestate from the municipal waste biogas plant was characterized by a pH of about 7.2 (
Table 1), high turbidity, and black color (
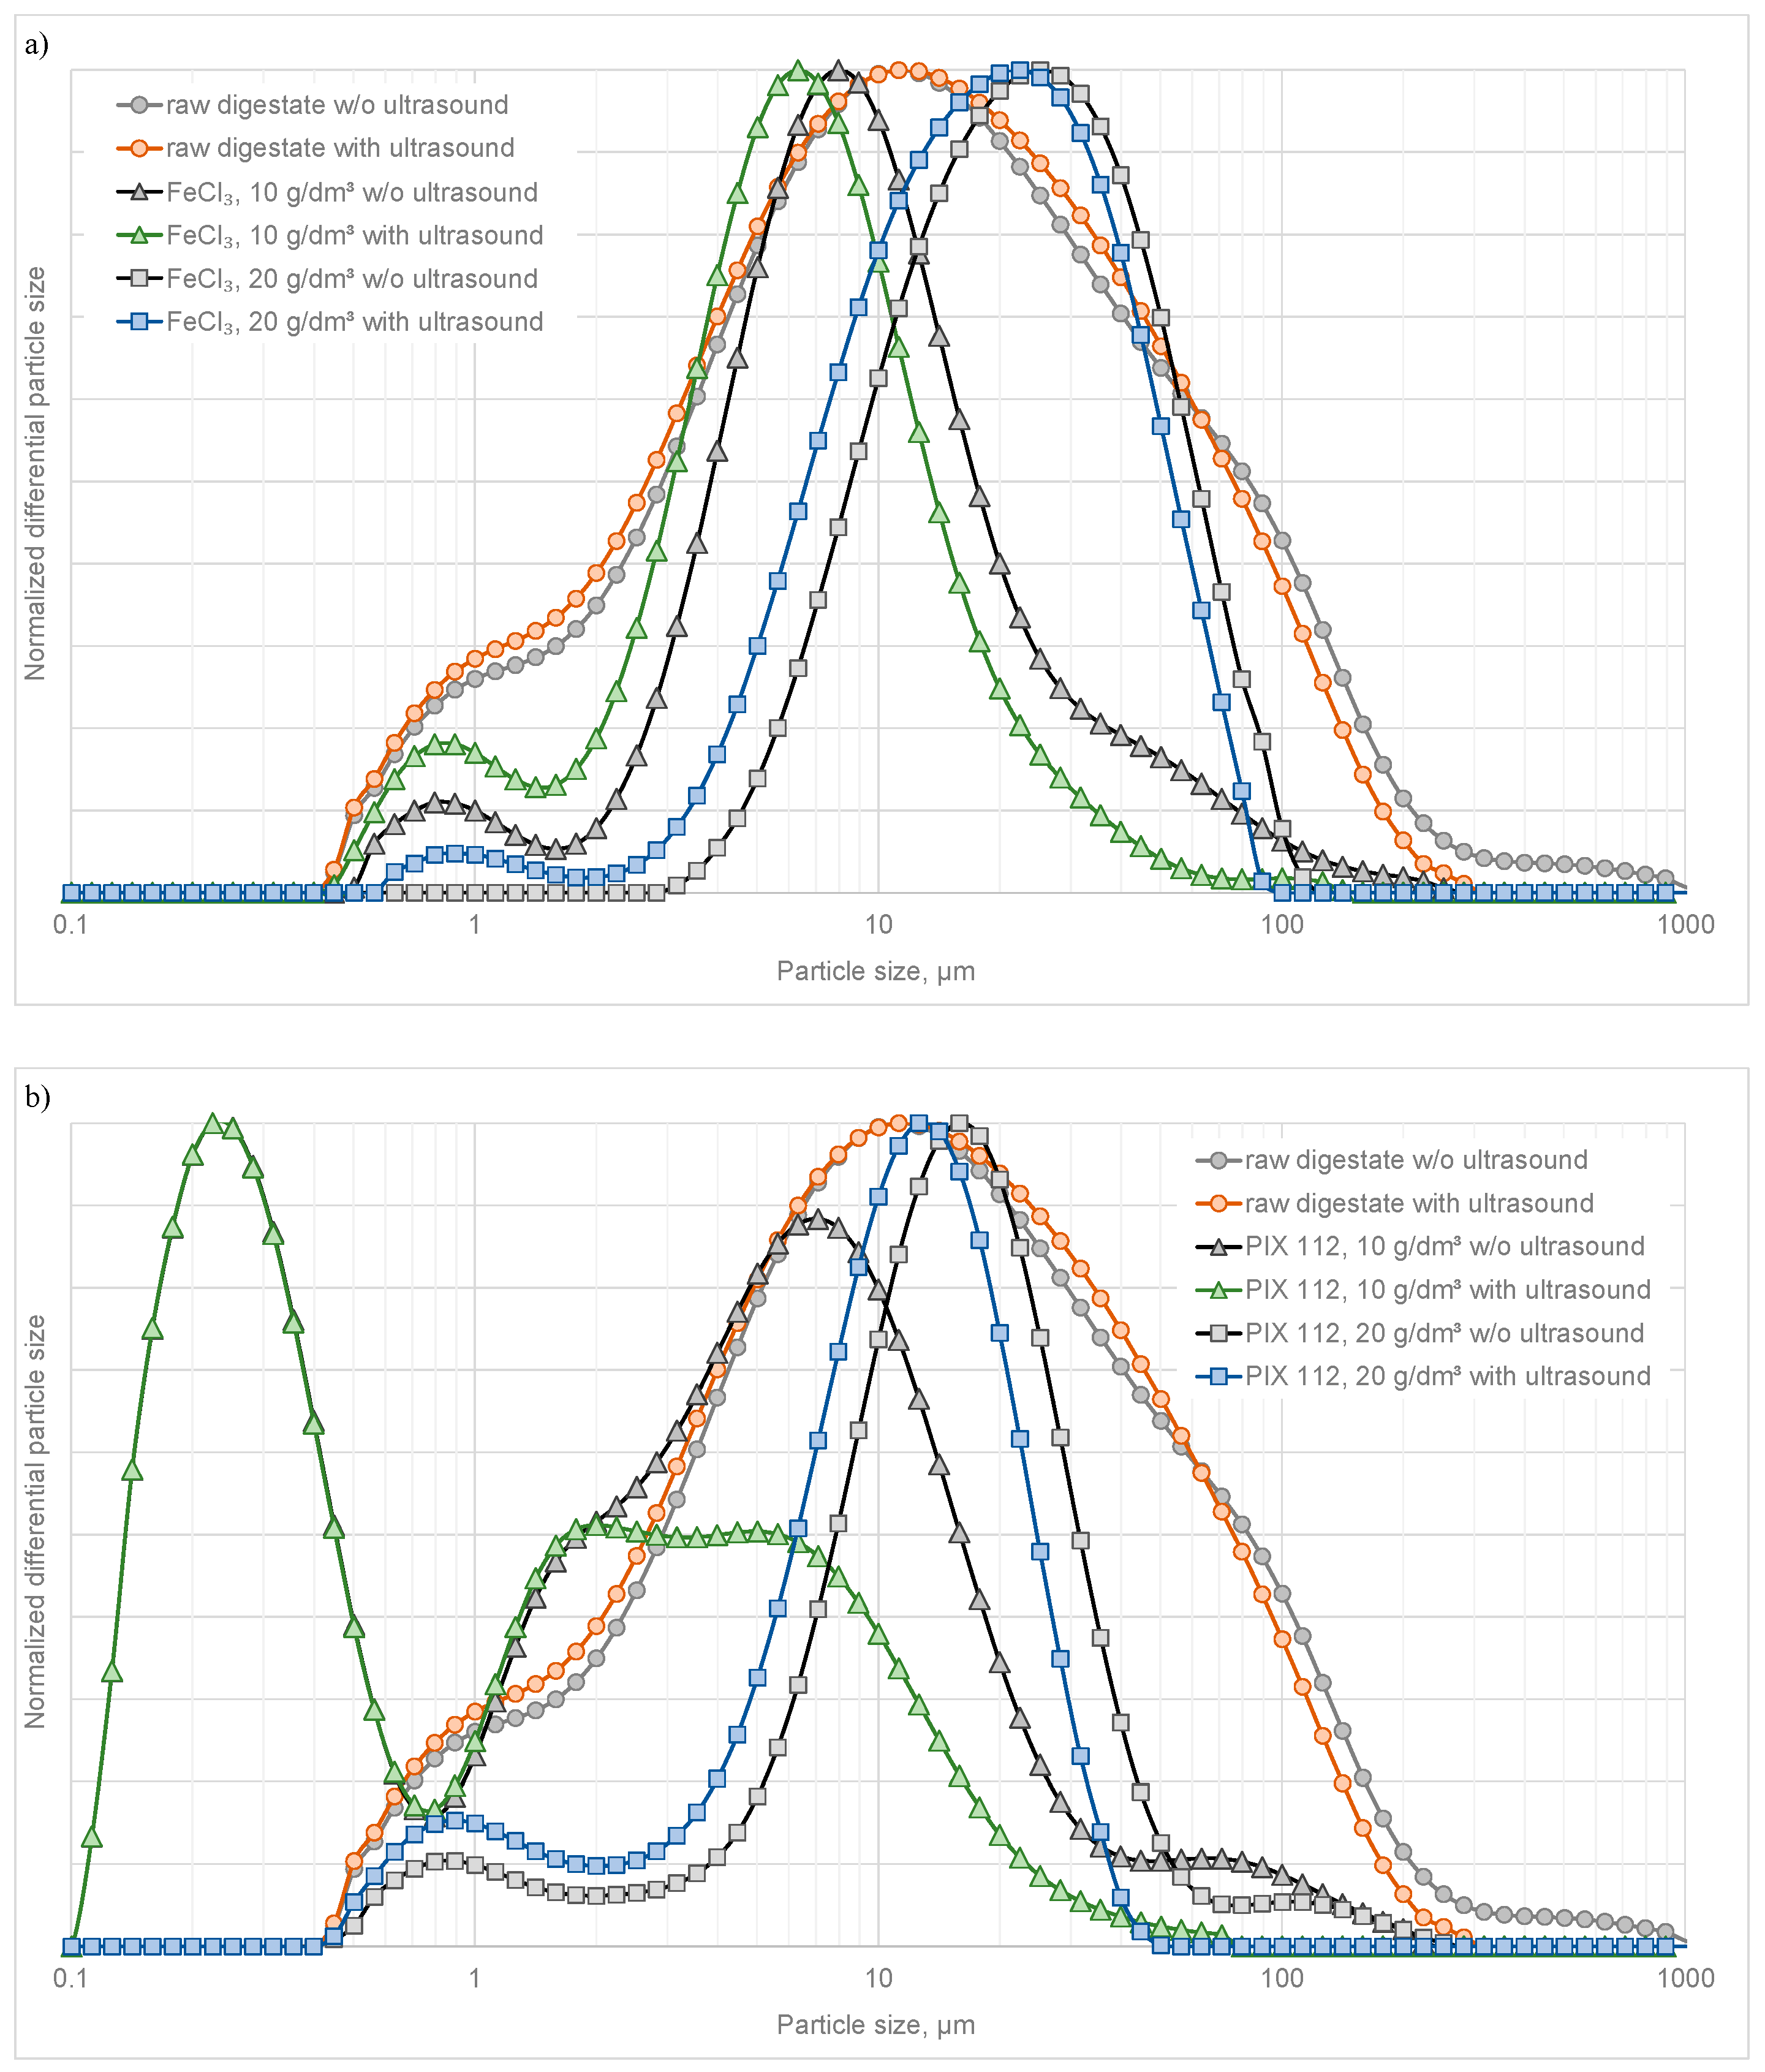
Figure 3) from small and stable particles present in the suspension. Larger particles settled to the bottom, but the suspension was cloudy due to small suspended particles. The particle size distribution was wide and ranged from about 0.4 to 300 µm, and without the use of ultrasound, aggregates of up to 900 µm appeared (
Figure 4). The
d50,
d10,
d90 of the raw sample can be found in
Table 1. After the use of ultrasounds,
d10 decreased to 1.8 µm,
d50 to 11.5 µm, and
d90 to 62 µm.
In the case of the raw liquid fraction of the digestate, which is a mixture of different types of particles, the values of the measured
ζ potential were influenced by a wide range of particles. This sample was characterized by high negative values of the
ζ potential in the pH range 5–12 (
ζ potential in the range −25 to −35 mV). The IEP was at pH
iep about 2 (
Figure 5).
The application of FeCl₃∙6H₂O as a coagulant in the amount of 10 g/dm³ caused very few black particles of the digestate to remain in the solution, which settled down after some time. On the other hand, small, yellow particles appeared, which mostly remained in a suspended state. In a slightly alkaline aqueous solution of FeCl₃∙6H₂O reacts with the hydroxide ion to form iron(III) hydroxide flocs, more precisely FeO(OH)
−. In this case, the pH of the suspension decreased slightly to about 7. The size distribution of residual pollutants in the supernatant shifted slightly towards finer particles (
Figure 4a). The median diameter was about 8 and 6 µm, respectively, before and after ultrasound use. d
10 and d
90 were equal: 3 and 31 µm, and after ultrasonication: 1.6 and 16 µm. The dose of 10 g/dm³ FeCl₃∙6H₂O lowered the negative value of
ζ potential by about 5–10 mV in the pH range 2.5–12. However, no IEP shift was observed (
Figure 5a).
Increasing the dose of FeCl₃∙6H₂O to 20 g/dm³ resulted in the formation of more sediment and significantly increased turbidity and orange coloration of the suspension. Iron(III) chloride hydrolyzes in water, as a result of which the solution becomes reddish-brown and the environment becomes acidic (in this case pH decreased to about 4.1). Compared to the raw fraction of the digestate, the disappearance of the finest and largest fraction is clearly noticeable on the particle size distribution (
Figure 4).
d50 was about 21.5 µm and decreased to 17.3 µm after ultrasound application. The
d10 and
d90 were equal: 8.2 and 52.7 µm and 5.8 and 44 µm, respectively (
Figure 4a). An amount of 20 g/dm³ FeCl₃∙6H₂O generated a positive high electrokinetic potential in the pH range 1.8–5. The IEP appeared at pH 8 and, after reaching about −5 mV, again reached a positive value at pH about 11 (
Figure 5b).
When another of the tested reagents, 10 g/dm³ iron(III) sulfate in the form of a commercial product called PIX 112, which is its 35–45% aqueous solution, was used, the macroscopic image of the suspension remained practically unchanged. Due to the acidic nature of the coagulant, pH slightly decreased to 7.1. The suspension remained cloudy and black colored (
Figure 3b), which made it possible to conclude that the dose of reagent 10 g/dm³ proved to be insufficient, which was also visible in
Figure 1. The application of ferric coagulant resulted in the removal of the thickest fraction of digestate particles and formation of a fraction finer than in the raw digestate (
Figure 4b). The median diameter shifted towards 2.5 µm,
d10 was 0.2 µm, and
d90 was 15.8 µm. After ultrasonication, d
50 was about 1 µm and d
90 dropped to 9 µm. It was observed that the use of this coagulant did not shift the IEP of the digestate. An amount of 10 g/dm³ of PIX 112 did not alter the pH dependence of the
ζ potential but increased the negative potential value by about 5 mV (
Figure 5a).
The increase to 20 g/dm³ of Fe₂(SO₄)₃ (in a form of PIX 112) resulted in a change in the macroscopic image of the suspension. The observed suspension was stable, cloudy, but changed its color to rusty (
Figure 3e). Iron(III) sulfate dissolves in water strongly hydrolyzing giving a yellow-brown color (due to the formation of, among others [Fe(OH)(H₂O)₅]²
+). The pH of the solution, as a result of chemical reactions taking place in the solution, decreased to 6.3. The particle size distribution shows almost complete disappearance of particles above 50 µm in the sounded sample (
Figure 4b).
d50 was 14 µm and moved to 10 µm after ultrasonication.
d10 was about 4 and 2 µm, respectively, while
d90 slightly exceeded 32 or 21 µm, respectively. At the dose of PIX 112 equal to 20 g/dm³ the
ζ potential changes significantly, but only in the pH range above 3. The IEP was created at pH of about 12.2. In the pH range 5–10, the ζ potential oscillated around −20 mV (
Figure 5b).
The use of lime in the form of CaO or Ca(OH)
2 in wastewater treatment technology is quite common practice [
18]. It is used in various mechanical, chemical, and biological processes to give wastewater a high alkaline pH. Quicklime (CaO) has a high affinity for water and when added to water becomes a hydrate (calcium hydroxide, Ca(OH)
2) releasing thermal energy. The smaller amount of CaO (10 g/dm
3) visually changed very little in the sample of the raw digestate (
Figure 3c). The color of the suspension remained black, but turbidity slightly decreased and some particles settled. Nevertheless, a change in particle size distribution could be observed (
Figure 4c)—there was a clear peak for large particles and a wide peak, flattening, and moving towards finer particles after ultrasonication for particles in the 2–20 µm range. An amount of 20 g/dm³ CaO caused the disappearance of this fraction and a decrease in the share of particles above 100 µm. The d
10 remained practically unchanged (about 1 µm), even after ultrasound, whereas the
d90 decreased from 120 to 90 µm and decreased further after sample ultrasonication. The median diameter increased from 7.8 to 34.3 µm and after ultrasound, from 6 to 24 µm, respectively. The lower dose of CaO did not change the dependence of
ζ potential on pH, which is consistent with the low cleaning efficiency of the digestate at this dose observed in
Figure 1. On the other hand, increasing the dose of CaO to 20 g/dm³ resulted in a decrease in the negative value of
ζ potential by about 10 mV above pH 4 (
Figure 5b). However, no shift in pH
iep was observed.
The observed changes in the ζ potential (
Figure 4) as well as particle size distribution (
Figure 5) of the molecules remaining in the solution, together with a change in the dose of the reagent, show the importance of this factor in the selection of the digestate treatment system. Too small doses of reagents cause the colloidal fraction not to be destabilized and thus not to be eliminated (or it is, but with limited efficacy) from the solution. Additionally, the molecules remaining in the solution have different properties than those found for contaminants in the raw solution, and thus may affect the subsequent technological processes for cleaning the solution in a completely different way. Knowing the change in particle size distribution as well as the
ζ potential is particularly important if the next processes in the technological system of digestate polishing are membrane processes. The presence of smaller size impurities in a solution after coagulation may intensify the internal fouling of porous membranes, while a sign of colloid charge will determine direction and strength of electrostatic interactions between the particles and the membrane.

 ,
, 


