Swing Suppliers and International Natural Gas Market Integration


1
SK E&S Co., Ltd., Seoul 03188, Korea
2
Department of Economics, Soongsil University, Seoul 06978, Korea
3
Department of Applied Economics, Utah State University, Logan, UT 84322-4835, USA
*
Author to whom correspondence should be addressed.
Energies 2020, 13(18), 4661; https://doi.org/10.3390/en13184661
Submission received: 14 July 2020
/
Revised: 1 September 2020
/
Accepted: 4 September 2020
/
Published: 8 September 2020
(This article belongs to the Section C: Energy Economics and Policy)
Abstract
:This study explores the international natural gas market integration using the Engle–Granger cointegration and error correction model. Previous studies have suggested that liquefied natural gas (LNG) and oil-linked pricing with a long-term contract have played key roles in gas market integration, especially between European and Asian markets. There is, however, little discussion of the role of the emergence of a swing supplier. A swing supplier, e.g., Qatar or Russia, is flexible to unexpected changes in supply and demand in both European and Asian markets and adapts the gas production/exports swiftly to meet the changes in the markets. Qatar has been a swing supplier since 2005 in the global natural gas market. In 2009, Qatar’s global LNG export share reached above 30% and has remained around 25% since then. Empirical results indirectly support that the emergence of a swing supplier may tighten market integration between Europe and Asia. The swing supplier may have accelerated the degree of market integration as well, particularly after 2009.
JEL codes:
C32; Q411. Introduction
Global natural gas markets have been believed to be regionally isolated as transporting natural gas is more expensive over long distances than either oil or coal [1]. As a result, natural gas does not have a global market [2,3]. The global natural gas market has been divided to three major trading regions—Europe, North America and Asia. Major suppliers in European market are Algeria, Norway, and Russia. The U.S. exports natural gas using pipeline a to neighboring countries in North America. The Middle East, Indonesia, Malaysia and Australia are the primary natural gas exporters in Asian markets. Reference [3] indicated that the gas market in Europe is oligopolistic, while the North American market is relatively competitive, and the Asian market is evolving from monopsony (Japan was a dominant importer) to more diverse market (Japan, Korea and China are major importers). Naturally, natural gas prices, pricing mechanisms, and market features vary across the regions and thus these markets are not fully integrated. Natural gas prices are determined regionally based on regional supply-and-demand and they do not move together, e.g., [4,5,6,7,8]. Reference [9] examined spillovers among the North American, European and Asia-Pacific natural gas markets and found no progressing integration of the global natural gas markets, although there is the strong spillover effect between European markets.
In recent years, liquefied natural gas (LNG) has reduced transportation costs, and trading LNG has increased substantially [10,11]. Research has demonstrated that international natural gas markets are becoming increasingly integrated [11,12,13]. Studies [12,13] indicated LNG as a major contributor to integrate international natural gas markets. Reference [11] also found evidence that global natural gas markets have become more integrated due to LNG. Reference [14], however, insisted that oil prices may intermediate the prices in different natural gas markets, while LNG plays a smaller role. Reference [3] showed that natural gas markets has not fully integrated yet and provide evidence of convergence between Japanese and UK prices; the gas price in North America moves without being influenced by prices in other markets. They concluded that the integration between European and Asian (Japan) markets is due to the underlying contractual mechanism, that is, the oil-linked pricing mechanism. Likewise, reference [15] showed that the European and Japanese gas prices are conitegrated with Brent crude oil price.
In spite of the important roles that LNG and oil-linked pricing mechanisms with a long-term contract have played in the integration of the markets, there is little discussion of swing suppliers and their role in the market integration. A swing supplier, by definition, is a supplier or oligopolistic group of suppliers who is flexible to changes in gas market environments. The swing supplier is able to adjust its gas production and exports to meet the demand fluctuations quickly [16]. Countries in the Middle East—for example, the State of Qatar (Qatar hereafter)—and Russia have comparative advantages in geographical locations with substantial gas reserves; the Middle East especially became the ideal swing supplier with LNG intended to access either European or Asian markets. Qatar, among others, emerged as a swing supplier in the natural gas market in 2005 and emerged as the leading LNG exporter over the last decade with the world’s third largest gas reserve. Qatar’s LNG exports in 2005 were 27 billion cubic meters (bcm), which was increased to 76 bcm in 2010. In 2013, Qatar ranked third in gas production after the U.S. and Russia and second in exports [17]. In 2016, Qatar’s global LNG market share was above 30% (103 bcm). Note that 22% of Qatar’s LNG exports headed to the European market and 66% to Asian countries (mostly Japan, Korea and India) [18]. In 2019, Qatar was the top LNG exporter, even if its LNG export share decreased to 22% (107 bcm), and 30% of exports headed to Europe and 70% to Asia.
We believe that the emergence of swing suppliers in the market, i.e., Qatar and Russia, has accelerated integration of natural gas markets, especially between European and Asian markets; this is because Qatar and Russia produce LNG and exports to both European and Asian markets (LNG to Korea/Japan from Qatar and pipeline to China from Russia in recent years). We aimed to examine whether the emergence of Qatar and Russia as swing suppliers actually augmented natural gas market integration. A cointegration test and error correction model were utilized to monthly natural gas spot prices from January 2000 to December 2016. We divided data into four sub-periods following the expansion of Qatar’s LNG exports (explained in detail below) to test the hypothesis that the swing supplier increases the market integration. Note that [19] investigated the impact of the structural break in the natural gas market, the 2011 Great East Japan Earthquake. They found that the Asian market was leading the natural gas market, but after 2011, the European market became the leader.
The contributions of the paper are two fold. First, this paper attempts to investigate whether the emergence of a swing supplier has augmented the natural gas market integration. Results show that European and Asian markets have been integrated since 2009; the North American market is not integrated with either European or Asian markets. We believe, as discussed in [3], that European and Asian markets are integrated partly because of underlying contractual mechanisms, i.e., linking natural gas prices to oil prices, rather than the result of market supply and demand. Second, we found indirect evidence that the emergence of the swing supplier may accelerate the gas market’s integration, especially between markets in Europe and Asia. It implies that international gas market will be integrated more with the incoming swing suppliers such as Australia.
2. Overview of Global Natural Gas Market
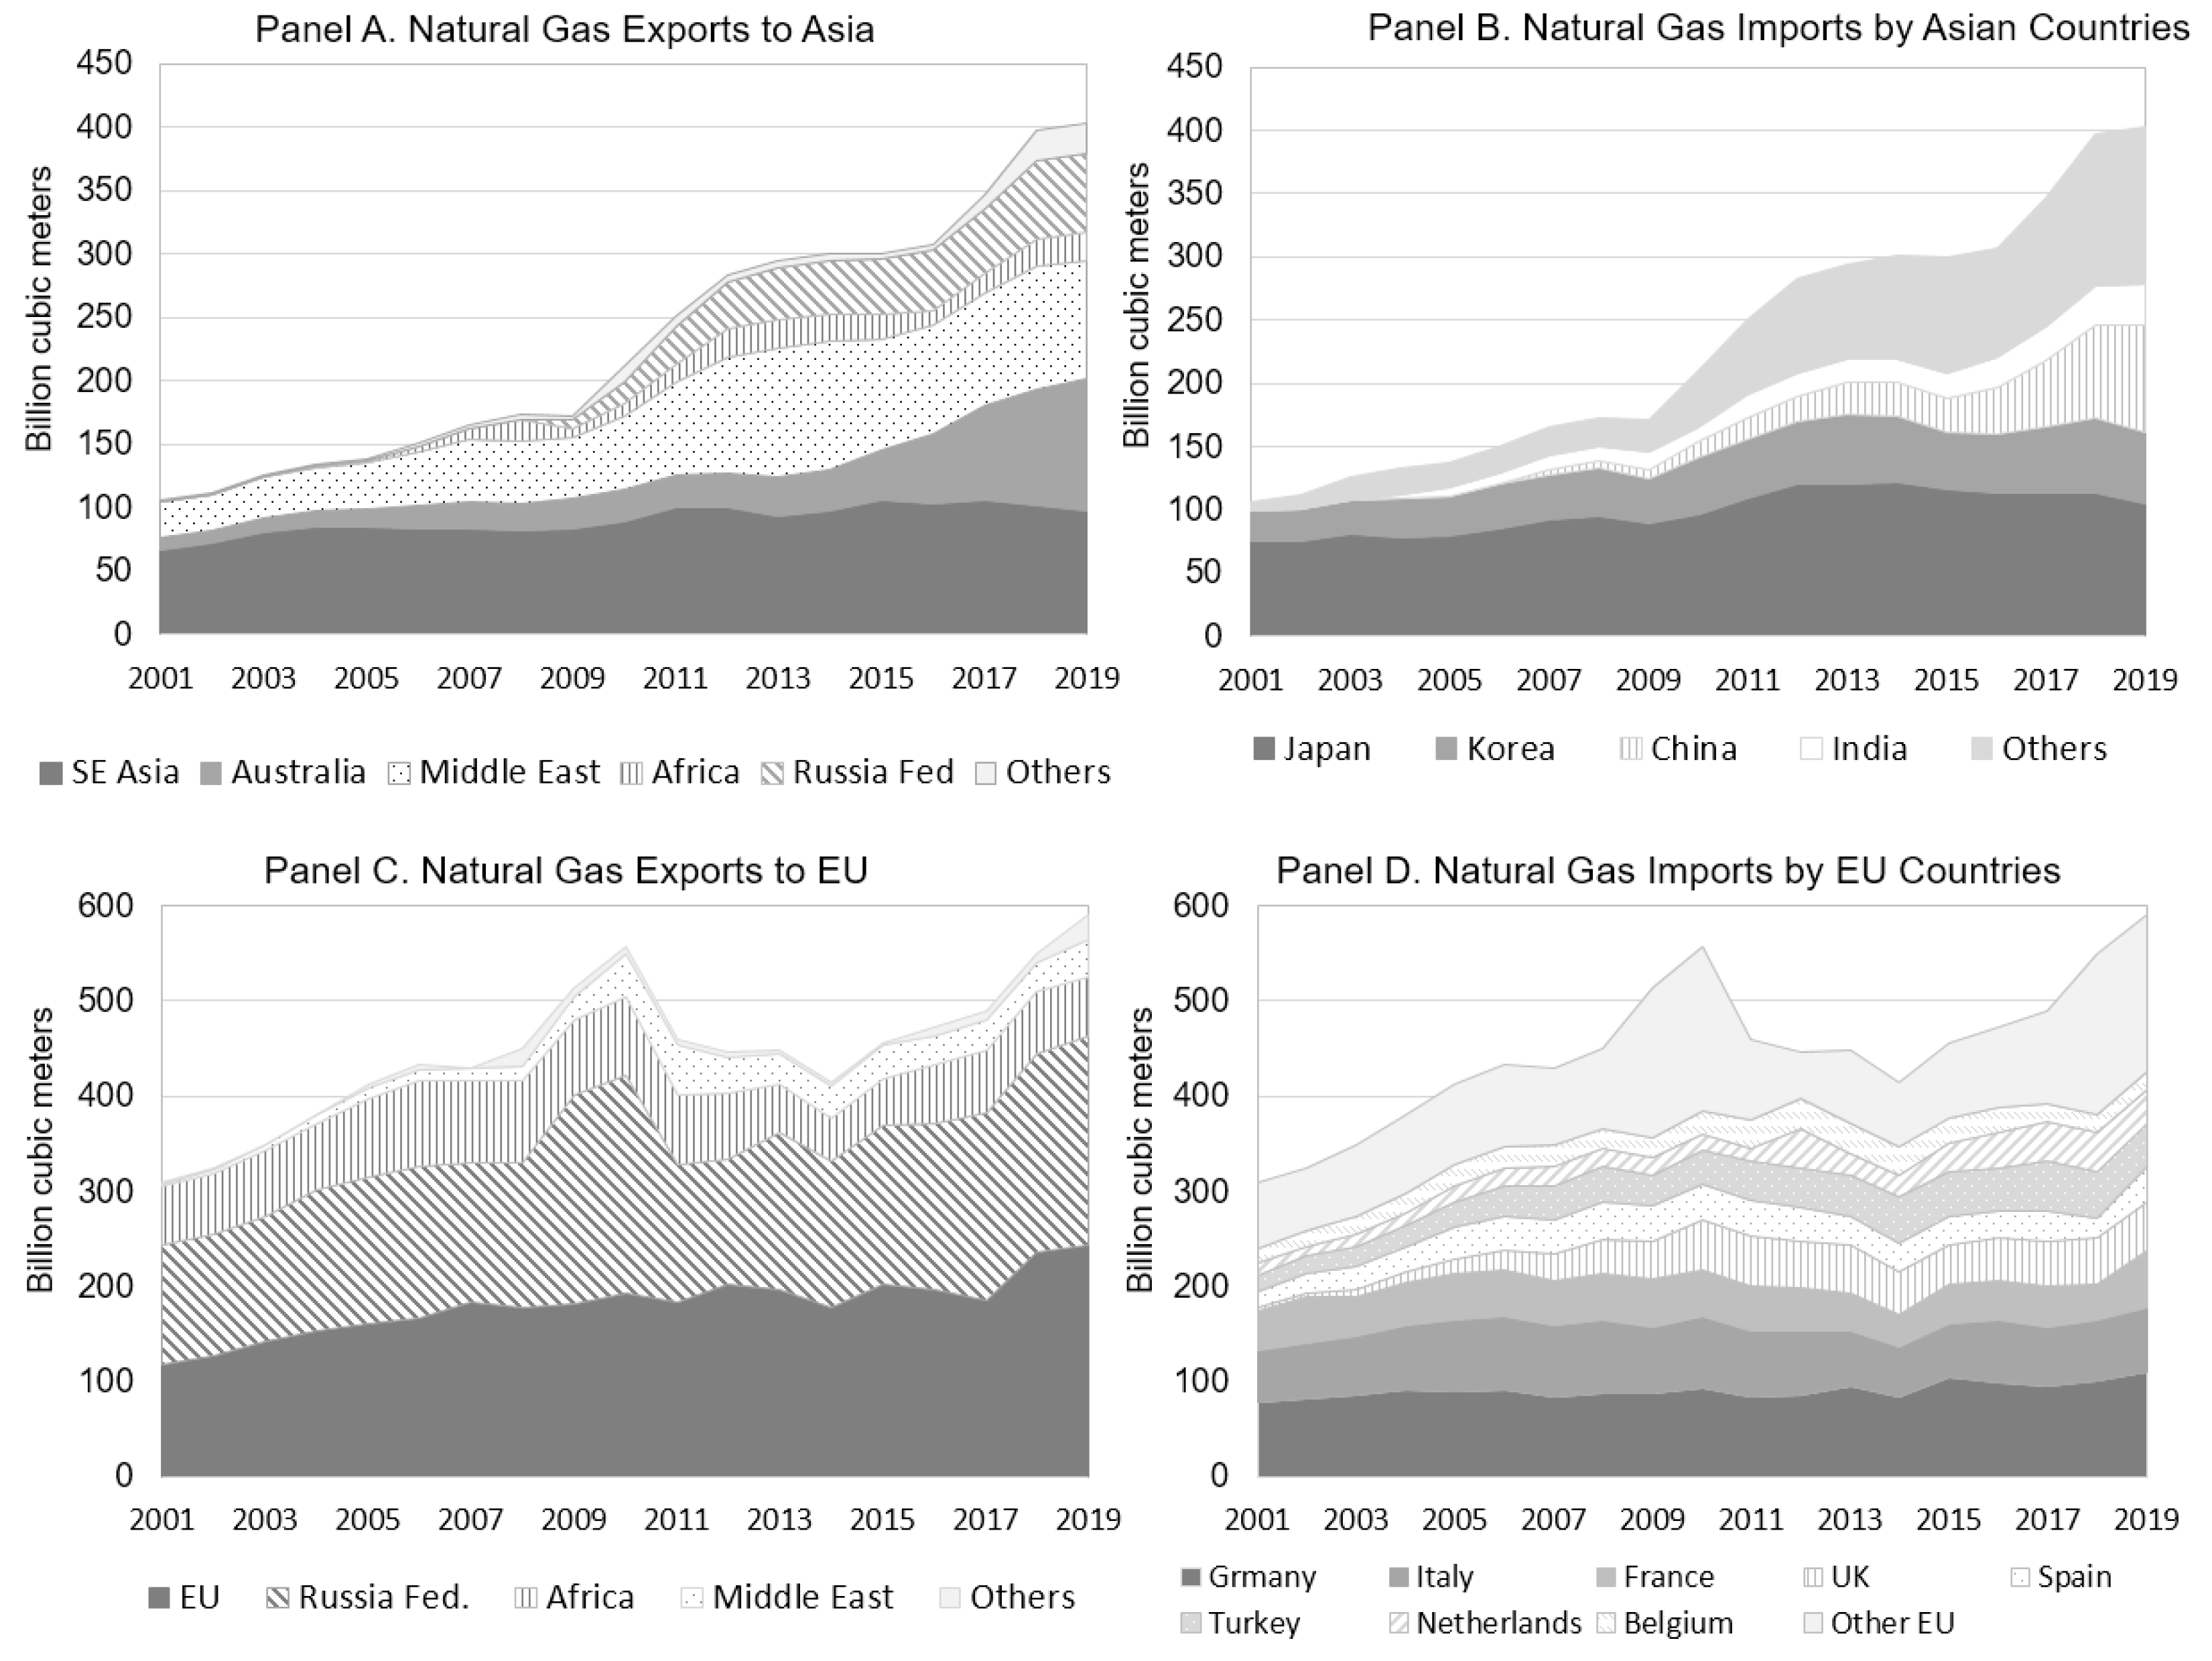
Note that this section is heavily dependent upon the second part of Section 2 in [19], which discusses the structure of natural gas markets in Asia and Europe. In Asian market, Korea and Japan have been the primary LNG importers. China has begun importing natural gas from Russia by pipeline since 2009. Korea, Japan and China imported more than 70% of their natural gas from Australia and Southeast Asia including Malaysia and Indonesia. Imports from North Africa and the Middle East were about 25% of the total natural gas imports (panel A in Figure 1). Natural gas imports from Middle Eastern to Asian markets increased after 2009 following the emergence of a swing supplier, Qatar. Natural gas imports from the Middle East increased substantially in 2011 which accounted for 35–40% of the total imports. China had begun importing natural gas from Russia by pipeline since 2009, and its imports increased significantly in 2011 (see panel A, Figure 1). About 15% of total natural gas imports in the Asian market came from Russia recently. Japan’s LNG imports were more than 50% of total imports in Asian market until 2009. Recently, Japan imports made up one third of natural gas imports in the market and China accounted for another one third. Korea was the second largest natural gas importer and the Chinese gas imports surpassed Korean gas imports in 2013 (panel B, Figure 1).
In the European natural gas market, UK, the Netherlands and Norway are primary exporters. These countries supply more than 40% of the natural gas to the market. Russia accounts for another 40% of natural gas to the market. North African countries, such as Algeria, and the Middle East, export about 20% of the natural gas to the European market. Their market shares have been relatively stable since 2013 (panel C in Figure 1). Panel C in Figure 1 also shows that North African countries shared about 20% of the market in the early 2000s; the market share has dropped to around 10–13% since 2013. Note that market share for the Middle East was around 1–3% of the market in the early 2000s. The market share for the Middle East increased to 7–8% after 2010. Major natural gas importers are Germany, Italy, France, UK, Spain and Turkey. Their import shares have been fairly stable (panel D, Figure 1).
3. Methodology and Analyses
3.1. Data
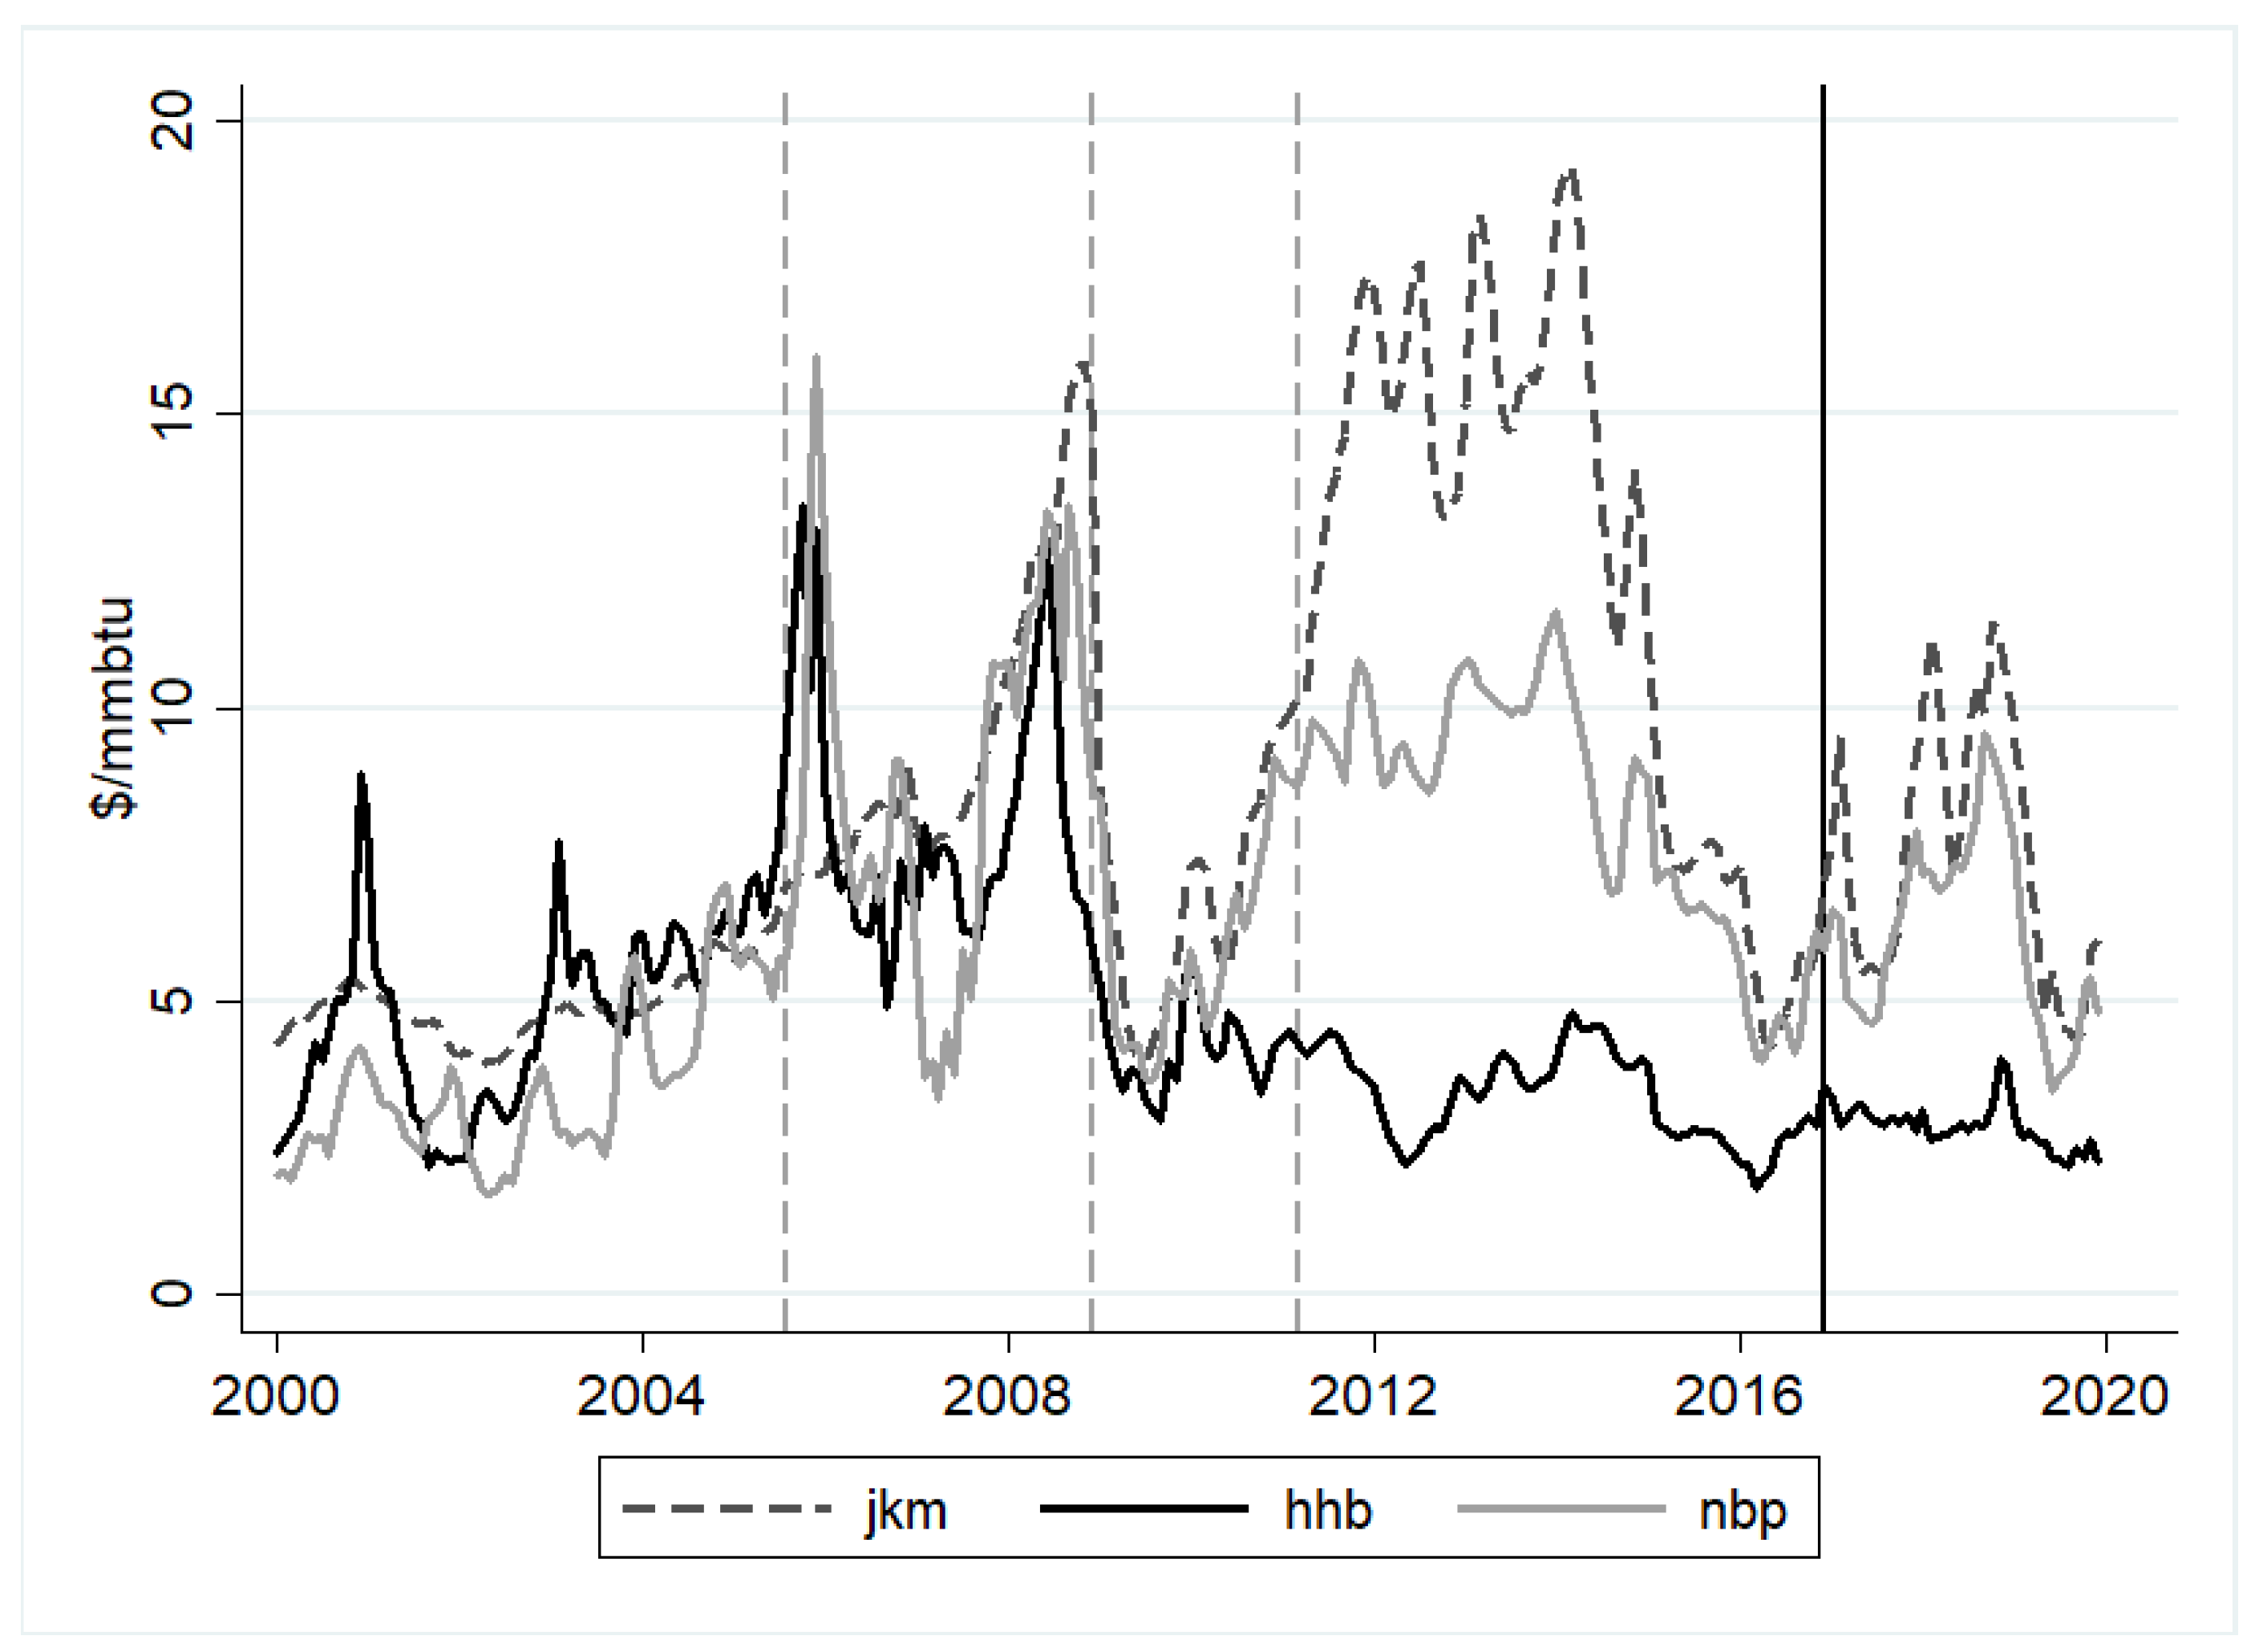
Monthly natural gas spot prices are compiled from S&P Global Inc. (https://www.spglobal.com/en/). The sample period is from January 2000 to December 2019. US gas prices are set through gas-on-gas competition in the Henry Hub, whereas European gas prices are mixed-hub prices from the UK’s National Balancing Point and the Dutch Title Transfer Facility as well as indexation to oil prices. Natural gas prices in Asia are usually indexed to the Japanese Customs-Cleared (JCC) oil price, the Brent oil price or the official Indonesian Crude Price. Thus, for the North American market, Henry Hub natural gas price (HHB) is compiled, which is the price of the natural gas future contracts traded in the New York Mercantile Exchange (NYMEX); the Henry Hub is the distribution hub on the natural gas pipeline system in Louisiana, U.S. (S&P Global Inc.). We chose the National Balancing Point natural gas price (NBP) for the European market. S&P Global Inc., NBP is a trading location for U.K. natural gas in the ICE Futures Europe. NBP has been widely used to represent the European wholesale gas market (S&P Global Inc.). For the Asian market, the Japan Korea Marker (JKM) LNG price was selected, which is the LNG benchmark assessment for physical cargoes delivered into Japan, Korea, China and Taiwan (S&P Global Inc.). JKM would be a reference price in the market since Korea and Japan are the major LNG importers in the region. Prior to 2009, S&P Global Inc. provided monthly data only for JKM (bi-weekly afterwards) and thus we utilized monthly data. Figure 2 contains the movements of prices and Table 1 presents basic statistics over the sample period. Note that in Figure 2, dotted vertical lines indicate the potential structural break points and a solid vertical line represents the end of sample period analyzed which is discussed in the following section.
As shown in Figure 2 and Table 1, the mean of gas price in Asian market (JKM) is $8.46/mmbtu with the standard deviation of $4.07/mmbtu, which is much larger than other prices in European and North American markets. In 2011, LNG imports to Japan increased substantially due to the disruption in nuclear-power generation following the 2011 Great East Japan Earthquake [20]. Natural gas price in the Asian market (JKM) began soaring above $15/mmbtu. Henry Hub price (HHB) has the lowest mean of $4.59/mmbtu with the standard deviation of $2.16/mmbtu during a sample period. Henry Hub price has been stable and remained low since 2008 as the U.S. began producing shale gas, and it seems to be moving away from both JKM and NBP since then. The mean of gas price in European market (NBP) is $6.49/mmbtu. JKM and NBP began rising early 2010 together but deviated from each other after early 2011. JKM and NBP moved closely from late 2017 again. As seen in Figure 2, there might be at least three structural changes in the global natural gas market indicated by dotted vertical lines, such as somewhere in 2005 (first peak in Figure 2), 2008 and 2011 (JKM rose rapidly and HHB moved away), and after 2016 (JKM and NBP converged). Note that, for the analysis, level price data were used without any transformation.
3.2. Dividing Sample Period
Sample period (January 2000–December 2019) is divided into five sub-periods primarily based on Qatar and Russia’s natural gas exports and their production capacities to see if there exist any systematic changes in the market with the emergence of the swing suppliers:
- Period 1: The period between January 2000 and August 2005 which represents the classic natural gas market; i.e., there is no swing supplier in the market. Qatar’s global market share is around 10–14%.
- Period 2: The period between September 2005 and December 2008; Qatar’s global LNG market share increased by close to 20% and begun exporting LNG to both European and Asian markets. Qatar is considered as a swing supplier in this period.
- Period 3: The period between January 2009 and March 2011; Qatargas (world’s largest LNG company in Qatar) and RasGas (second-largest LNG producer in Qatar, which merged with Qatargas in 2018) inaugurated two mega LNG trains; Qatar’s global share increased to above 30%. In addition, China began importing natural gas from Russia by pipeline (6 bcm in 2009 which increased to 17 bcm in 2010 and 29 bcm in 2011, respectively) (BP Statistical Review of World Energy).
- Period 4: The period between April 2011 and December 2016; Qatar’s LNG exports to the Asian market increased substantially following the 2011 Great East Japan earthquake; the price parity between European and Asian markets started expanding (Figure 2) in this period. In period 4, Qatar increased short-term contracts up to 24% to satisfy LNG gas import by Japan [19]. Quart’s gas exports averaged around 96 bcm per year in this period. Russia exported more than 40 bcm of natural gas per year during this period (BP Statistical Review of World Energy). Qatar’s global share remained around 30%.
- Period 5: The period between January 2017 and December 2019; the global gas market was stabilized during the period. Price parity between JKM and NBP was narrowed. Qatar’s LNG exports to the Asian market decreased by 5% (91 bcm per year) compared to the period 4, but the market share remained around 30%. Natural gas from Russia to the Asian market kept increasing to more than 60 bcm in 2018 and 2019. In this period, U.S. shale gas production and exports increased substantially. According to the U.S. Energy Information Administration (EIA), U.S. LNG exports to the Asian market were expanded to 9 bcm in 2017, 15 bcm in 2018, and 18 bcm in 2019 from around 0.5 bcm during 2012–2015. Total U.S. exports were less than 1 bcm till 2015, but they increased to 5 bcm in 2016, 20 bcm in 2017, 31 bcm in 2018 and 52 bcm in 2019. U.S. shale gas production and exports in this period might change the fundamentals of the global natural gas market.
This paper aims to investigate the market integration and the role of the emergence of swing supplier. Note that, to answer the research question, we utilize the gas price data up to December 2016 (204 months) with four sub-periods of the sample. In other words, the period 5 listed above is not included in the analysis because the market fundamentals might have changed due to the shale gas production and export from the U.S. Investigating the role of the U.S. and the natural gas market integration is the another avenue for further exploration.
3.3. Unit Root Test
We believe that there were structural breaks in the global natural gas market, as discussed (see dividing sample). The conventional unit root tests such as augmented Dickey–Fuller (ADF) [21] for non-stationarity and the KPSS test [22] for stationarity are not appropriate when the existence of structural changes is apparent [23,24,25]. The unit root test of [25] is applied to consider the potential structural breaks. The unit root test in [25] utilizes the algorithm discussed in [26] to identify structural breaks with a quasi-GLS method. Similarly to the Bai-Perron [26,27], it minimizes the residual sum of squares through a dynamic programming process. Let be a stochastic process (i.e., natural gas price) generated according to where for . The deterministic component, , is given by
where and [25]. The residual sum of squares is, thus, given by
Following [28], reference [25] use the M-class of tests analyzed in [29] allowing for multiple structural breaks, defined by:
with , where minimizes Equation (2) and where and obtained from the ordinary least squares regression
The asymptotic critical values are generated using a bootstrapping and rejection of the null hypothesis indicates that the series is stationary. Table 2 reports the test results for the variables under consideration from January 2000 to December 2016. As shown in Table 2, JKM, HHB and NBP are nonstationary.
3.4. Cointegration Test
Two (regionally isolated) markets are integrated when two prices follow similar patterns over a long period (long-run equilibrium) where two markets trade similar or inter-related commodities. When price series and are both nonstationary and have a long-running relationship, there must be some force which pulls the equilibrium error back to zero, which means that the linear combination of two series is stationary. Reference [30] formulated the first test of cointegration. The long-run equilibrium between two prices can be written as follows:
where is the co-integrating parameter. The term explains differences in two markets and the term is the long-run error. It equals zero in equilibrium. The residuals from Equation (7), , are a measure of disequilibrium, and thus a test of cointegration is a test of whether is stationary. The regression of on was estimated and we compared the t-statistics on the desired critical values.
Note that the Johansen test is another test of cointegration [31]. The Johansen test is superior and has been adopted numerous empirical analyses for more than two decades. Several studies, however, point out that the Johansen test should be used with caution when finite (limited) samples with non-normal distributions are used [32,33,34], which is our concern. We have a small sample size with a few dozen observations for each sub-sample period; we used the Engle–Granger approach for the analysis. We did so because the Engle–Granger approach uses the residuals from a single equation so that the degrees of freedom are more than those of the Johansen trace test which uses ML test with a system of equations. Note that the Johansen trace test was performed for the data of entire period for the reference. The pair of JKM-NBP was cointegrated but pairs of NBP-HHB and JKM-HHB are not cointegrated at 5% significance level. Note that NBP-HHB pair was cointegrated at 10% significance level (p-value = 8%). As we supposed there were structural breaks, there was a need to test cointegration with considering the breaks. Reference [35] test was used which has the null hypothesis of no cointegration against the alternative of cointegration with a single shift at an unknown point in time.
Table 3 presents the cointegration tests results for the pair of gas prices over sub-sample periods and the entire sample period (E-G column in Table 3) and [35] test results (G-H column in Table 3). It confirms that cointegration exists between the European market (NBP) and the Asian market (JKM). Interestingly, there was no cointegrating relationship in periods 1 and 2 between these two markets, which implies that the emergence of the swing supplier may have played a role in integrating both markets on top of the contractual mechanisms (oil-linked pricing). Note that the principle model for long-term LNG contracts in European and Asian markets is oil-linked pricing, but not in the North American market. It suggests further that JKM and NBP may have a cointegrating relationship with crude oil prices such as Dubai and Brent crude oil prices. To see this, cointegration tests for natural gas prices and crude oil prices were conducted using the Engle–Granger cointegration test. As expected, Dubai and Brent crude oil prices have cointegrating relationships with JKM and NBP, but not with HHB.
The European market and the North American market were integrated in the second period but the convergence disappeared in the later periods when Qatar expanded its global market share up to 30%. We believe that liberalization of the market and the shale gas boom in the U.S. might have an impact on this relationship. As shown in Figure 1, the natural gas price in the North American market (HHB) started deviating from both JKM and NBP since 2009. All told, we conclude that (1) European and Asian markets are cointegrated; (2) the emergence of the swing supplier, Qatar, has accelerated gas market integration between those two; and (3) the North American market was integrated with the European market in the early 2000s but it has disappeared with the shale gas boom in the U.S. since 2009, which may prevent market integration. In addition, because the pipeline system remains as the primary natural gas trade within the North American market, the swing supplier may not enter the North American market.
3.5. Error Correction Model
If cointegration holds, the Engle–Granger error correction model can be constructed following [2], an energy market integration study;
where is the error-correction term in Equation (7) and is the speed of adjustment parameter. Note that the parameter measures the contemporaneous adjustment between two prices, i.e., Stigler-Sherwin simple correlation [37]; a value of being close to one indicates very rapid adjustment [2] between gas prices. As said, the mean of the error-correction term, , is zero in the long run; however, if and/or deviate from the long run equilibrium, i.e., is nonzero, and each price adjusts to restore the equilibrium relation at the speed of , then the value of should be negative. Reference [2] points out that a value of implies a very slow adjustment back to the long run equilibrium with severe market frictions.
The parameter in Equation (8) is the co-integrating parameter. It indicates that the long-run effect of a $1/mmbtu increase in is an increase of in . Thus, the fraction of (contemporaneous adjustment) to (long-run adjustment) is the way to measure the degree of market integration, the so-called instant %, as defined in [2];
The European market (NBP) and Asian market (JKM) are cointegrated in the later periods with the emergence of the swing supplier (see Table 3, cointegration test), and thus an error correction model in Equation (8) between JKM and NBP was constructed. A total of five error correction models were estimated for four sub-periods and for the entire sample period to see if there exist any systematic changes in model parameters. Table 4 presents the estimation results. Note that first two models for periods 1 and 2 in Table 4 should not be interpreted because there is no cointegrating relationship between the European and Asian markets (see Table 3, cointegration tests).
As shown in Table 4, both European and Asian markets were integrated when the swing supplier expanded its global market share in 2009 (models 3 and 4). Instant % indicates that the degree of market integration increased substantially along with expansion of LNG exports from the swing supplier (from statistically insignificant instant % to above 35%). Instant % values for the first two periods are not statistically significant, as expected, which again confirms that both markets are not integrated. The value of , the long-run effect, increases along with the sub-sample periods as well. It increases substantially between model 3 and model 4 (from 1.00 to 1.97). Model 4 is the period between April 2011 and December 2016 when Qatar’s LNG exports to the Asian market increased significantly following the 2011 Tohoku earthquake in Japan, which destroyed Japan’s nuclear power plants; Japan had to import more natural gas [20]; gas price parity between European and Asian markets started increasing in this period ($15/mmbtu in Asian market vs. $10/mmbtu in Europe). Note that Qatar increased spot basis short-term contracts in this period up to 24% to meet the increased LNG imports by Japan [19].
4. Conclusions and Implications
This study explores the natural gas market integration after 2000 using the Engle–Granger cointegration and error correction model. Global natural gas markets have been believed to be regionally isolated with three major trading regions; Europe, North America and Asia partly due to the high transportation cost. Previous literature have suggested that the development of the LNG technology and the pricing mechanism (oil-linked pricing) of long-term LNG contracts have played important roles in market integration, especially between the European and Asian markets. This study confirms that as well.
In spite of the key roles of LNG and the pricing mechanism with a long-term contract, there has been little discussion of the impact of the emergence of the swing supplier on the market integration. A swing supplier is a supplier who is flexible to the changes in market environments and adjusts natural gas production and exports to meet fluctuations in market demand quickly. Qatar emerged as the swing supplier in 2005 with a global LNG market share above 30% since 2009. We found that (1) European and Asian markets are integrated; (2) econometric results indirectly support that the emergence of the swing supplier, Qatar, may accelerate gas market integration between these two (note that econometric results do not show a direct causal relationship); and (3) the North American market was integrated with the European market in the early 2000s, but it has disappeared. In addition, because the pipeline system remains the primary means of natural gas trading within the North American market, a swing supplier may not enter the North American market.
Implications of the study are straightforward. The emergence of the swing supplier in addition to the oil-linked pricing contracts has increased global natural gas market integration, especially between the European and Asian markets. The integration between these two markets will be accelerated with the incoming or potential swing suppliers in the near future, such as Australia and Russia. Competition with Qatar and the new swing suppliers may increases the degree of market integration. Australia has developed large-scale LNG projects and its export capacity will be tripled [17]. By 2020, Australia is expected to account for 17% of the global LNG capacity, ahead of Qatar’s projected 15% [17]. Russia also has a plan to double its LNG market share by 2020 (around 4.5% in 2015) [17]. It is quite plausible that the North American market might be integrated if the U.S. increases its LNG exports to the global market. According to [38], estimates of the U.S. LNG export capacity vary considerably, but the U.S. might be the largest LNG producer after Australia and Qatar.
Author Contributions
Conceptualization, S.-H.K. and D.-W.K.; methodology, S.-H.K., Y.-Y.L., D.-W.K., and M.-K.K.; formal analysis, S.-H.K., Y.-Y.L., D.-W.K., and M.-K.K.; data curation, S.-H.K. and Y.-Y.K.; writing—original draft preparation, S.-H.K., Y.-Y.L., D.-W.K., and M.-K.K.; writing—review and editing, D.-W.K., and M.-K.K. All authors have read and agreed to the published version of the manuscript.
Funding
This research received no external funding.
Conflicts of Interest
The authors declare no conflict of interest.
References
- Jensen, J. The Development of a Global LNG Markets—Is It Likely? If So, When? Oxford Institute for Energy Studies, Alden Press: Oxford, UK, 2004. [Google Scholar]
- Bachmeier, L.; Griffin, J. Testing for Market Integration Crude Oil, Coal, and Natural Gas. Energy J. 2006, 27, 55–71. [Google Scholar] [CrossRef]
- Li, R.; Joyeux, R.; Ripple, R. International Natural Gas Market Integration. Energy J. 2014, 35, 159–179. [Google Scholar] [CrossRef]
- Park, H.; Mjelde, J.; Bessler, D. Time-varying Threshold Cointegration and the Law of One Price. Appl. Econ. 2007, 39, 117–142. [Google Scholar] [CrossRef]
- Mohammadi, H. Market Integration and Price Transmission in the US Natural Gas Market: From the Wellhead to End Use Markets. Energy Econ. 2011, 33, 227–235. [Google Scholar] [CrossRef]
- Renou-Maissant, P. Toward the Integration of European Natural Gas Markets: A Time Varying Approach. Energy Policy 2012, 51, 779–790. [Google Scholar] [CrossRef]
- Olsen, K.; Mjelde, J.; Bessler, D. Price Formulation and the Law of One Price in Internationally Linked Markets: An Examination of the Natural Gas Markets in the USA and Canada. Ann. Reg. Sci. 2015, 54, 117–142. [Google Scholar] [CrossRef]
- Wiggins, S.; Etienne, X. Turbulent Times: Uncovering the Origins of US Natural Gas Price Fluctuations since Deregulation. Energy Econ. 2017, 64, 196–205. [Google Scholar] [CrossRef]
- Nakajima, T.; Toyoshima, Y. Measurement of Connectedness and Frequency Dynamics in Global Natural Gas Markets. Energies 2019, 12, 3927. [Google Scholar] [CrossRef] [Green Version]
- Ruester, S. Recent Dynamics in the Global Liquefied Natural Gas Industry. Resource Markets Working Paper No. RM-19. 2010. Available online: https://ssrn.com/abstract=1535905 (accessed on 7 September 2020).
- Barnes, R.; Bosworth, R. LNG is Linking Regional Natural Gas Markets: Evidence from the Gravity Model. Energy Econ. 2015, 47, 11–17. [Google Scholar] [CrossRef]
- Siliverstovs, B.; L’Hegaret, G.; Neumann, A.; von Hirshhausen, C. International Market Integration for Natural Gas? A Cointegration Analysis of Prices in Europe, North America, and Japan. Energy Econ. 2005, 27, 603–615. [Google Scholar] [CrossRef] [Green Version]
- Neumann, A. Linking Natural Gas Markets—Is LNG Doing Its Job? Energy J. 2009, 30, 187–199. [Google Scholar] [CrossRef] [Green Version]
- Brown, S.; Yücel, M. Market Arbitrage: European and North American Natural Gas Prices. Energy J. 2009, 30, 167–186. [Google Scholar] [CrossRef]
- Lin, B.; Li, J. The Spillover Effects across Natural Gas and Oil Markets based on the VEC-MGARCH Framework. Appl. Energy 2015, 155, 229–241. [Google Scholar] [CrossRef]
- Morecroft, J.; van der Heijden, K. Modeling the Oil Producers. Syst. Dyn. Soc. 1990, 90, 783–797. [Google Scholar]
- Al Tamimi, N. Navigating Uncertainty: Qatar’s Response to the Global Gas Boom. No. 15, Brookings Doha Center Analysis Paper, Foreign Policy at Brookings. 2015. Available online: https://www.brookings.edu/research/navigating-uncertainty-qatars-response-to-the-global-gas-boom/ (accessed on 7 September 2020).
- Rogers, H. Qatar LNG: New Trading Patterns but No Cause for Alarm; Oxford Energy Comment; The Oxford Institute for Energy Studies, University of Oxford: Oxford, UK, 2017. [Google Scholar]
- Kim, M.K.; Kim, D.W. Leading and Lagging Natural Gas Markets between Asia and Europe. OPEC Energy Rev. 2019, 43, 383–395. [Google Scholar] [CrossRef]
- Hosoe, T. Asia’s Post-Fukushima Market for Liquefied Natural Gas—A Special Focus on Japan. NBR Special Report No. 41; The National Bureau of Asian Research: 2012. Available online: https://www.nbr.org/publication/asias-post-fukushima-market-for-liquefied-natural-gas-a-special-focus-on-japan/ (accessed on 7 September 2020).
- Dickey, D.; Fuller, W. Likelihood Ratio Statistics for Autoregressive Time Series with a Unit Root. Econometrica 1981, 49, 1057–1072. [Google Scholar] [CrossRef]
- Kwiatkowski, D.; Phillips, P.; Schmidt, P.; Shin, Y. Testing the Null Hypothesis of Stationarity against the Alternative of a Unit Root. J. Econom. 1992, 54, 159–178. [Google Scholar] [CrossRef]
- Zivot, E.; Andrews, D. Further Evidence on the Great Crash, the Oil Price Shock and the Unit Root Hypothesis. J. Bus. Econ. Stat. 1992, 10, 251–270. [Google Scholar]
- Kim, D.; Perron, P. Unit Root Tests Allowing for a Break in the Trend Function under Both the Null and Alternative Hypotheses. J. Econom. 2009, 148, 1–13. [Google Scholar] [CrossRef]
- Carrion-i Silvestre, J.; Kim, D.; Perron, P. GLS-based Unit Root Tests with Multiple Structural Breaks under Both the Null and the Alternative Hypotheses. Econom. Theory 2009, 25, 1754–1792. [Google Scholar] [CrossRef]
- Bai, J.; Perron, P. Computation and Analysis of Multiple Structural Change Models. J. Appl. Econom. 2003, 18, 1–18. [Google Scholar] [CrossRef] [Green Version]
- Bai, J.; Perron, P. Estimating and Testing Linear Models with Multiple Structural Changes. Econometrica 1998, 66, 47–78. [Google Scholar] [CrossRef]
- Perron, P.; Rodríguez, G. GLS Detrending, Efficient Unit Root Tests and Structural Change. J. Econom. 2003, 115, 1–27. [Google Scholar] [CrossRef] [Green Version]
- Ng, S.; Perron, P. Lag Length Selection and the Construction of Unit Root Tests with Good Size and Power. Econometrica 2001, 69, 1519–1554. [Google Scholar] [CrossRef] [Green Version]
- Engle, R.; Granger, C. Co-Integration and Error Correction: Representation, Estimation, and Testing. Econometrica 1987, 55, 251–276. [Google Scholar] [CrossRef]
- Johansen, S. Estimation and Hypothesis Testing of Cointegration Vectors in Gaussian Vector Autoregressive Models. Econometrica 1991, 59, 1551–1580. [Google Scholar] [CrossRef]
- Cheung, Y.W.; Lai, K. Finite-Sample Sizes of Johansen’s Likelihood Ratio Tests for Cointegration. Oxf. Bull. Econom. Stat. 1993, 55, 313–328. [Google Scholar] [CrossRef]
- Toda, H. Finite Sample Performance of Likelihood Ratio Tests for Coitegrating Ranks in Vector Autoregressons. Econom. Theory 1995, 11, 1015–1032. [Google Scholar] [CrossRef]
- Silvapulle, P.; Podivinsky, J. The Effect of Non-normal Disturbances and Conditional Heteroskedasticity on Multiple Cointegration Tests. J. Stat. Comput. Simul. 2000, 65, 173–189. [Google Scholar] [CrossRef]
- Gregory, A.; Hansen, B. Residual-Based Tests for Cointegration in Models with Regime Shifts. J. Econom. 1996, 70, 99–126. [Google Scholar] [CrossRef] [Green Version]
- Wooldridge, J. Introductory Econometrics—A Modern Approach; South-Western: Mason, OH, USA, 2013. [Google Scholar]
- Stigler, G.; Sherwin, R. The Extent of the Market. J. Law Econ. 1985, 28, 555–582. [Google Scholar] [CrossRef]
- Yermakov, V. Russia’s Evolving LNG Strategy. In Proceedings of the Oil and Gas Dialogue Forum, IHS Energy, Geneva, Switzerland, 14–15 May 2014. [Google Scholar]
Figure 1.
Exports and imports (pipeline + LNG) in Asian and European Markets. Source: BP Statistical Review of World Energy, Trade Movements, each year.
Figure 1.
Exports and imports (pipeline + LNG) in Asian and European Markets. Source: BP Statistical Review of World Energy, Trade Movements, each year.

Figure 2.
Plot of JKM (Asia), HHB (North America) and NBP (Europe) natural gas prices. Note: HHB = Henry Hub natural gas price (North America), NBP = National Balancing Point natural gas price (Europe) and JKM = Japan Korea Marker (Asian). Dotted vertical lines indicate the potential structural break points and a solid vertical line indicates the end of sample period analyzed.


Table 1.
Basic statistics (monthly between January 2000 and December 2019 in $/mmbtu).
| Price | Obs | Mean | Std. Dev. | Min | Max |
|---|---|---|---|---|---|
| JKM | 240 | 8.46 | 4.08 | 3.95 | 19.22 |
| HHB | 240 | 4.59 | 2.16 | 1.81 | 13.42 |
| NBP | 240 | 6.49 | 2.90 | 1.75 | 15.98 |
Note: HHB = Henry Hub natural gas price (North America), NBP = National Balancing Point natural gas price (Europe) and JKM = Japan Korea Marker (Asian).
Table 2.
Unit root test using [25] from January 2000 to December 2016.
Table 2.
Unit root test using [25] from January 2000 to December 2016.
| MZα | MSB | MZt | t stat | |
|---|---|---|---|---|
| JKM | −11.360 | 0.202 | −2.298 | −2.174 |
| (−24.079) | (0.142) | (−3.440) | (−3.147) | |
| [NS] a | [NS] | [NS] | [NS] | |
| HHB | −26.523 | 0.136 | −3.618 | −3.729 |
| (−28.793) | (0.132) | (−3.792) | (−4.074) | |
| [NS] | [NS] | [NS] | [NS] | |
| NBP | −24.314 | 0.142 | −3.452 | −3.005 |
| (−25.486) | (0.139) | (−3.515) | (−3.362) | |
| [NS] | [NS] | [NS] | [NS] |
Note: JKM = Japan Korea Marker (Asian), HHB = Henry Hub natural gas price (North America) and NBP = National Balancing Point natural gas price (Europe); numbers in parentheses are critical values at 5% derived from the bootstrapping; a decision, NS = nonstationary, S = stationary at 5%.
Table 3.
Engle–Granger cointegration tests.
| Price Pairs | Period 1 | Period 2 | Period 3 | Period 4 | Entire Period | |
|---|---|---|---|---|---|---|
| 2000 M1 | 2005 M9 | 2009 M1 | 2011 M4 | 2000 M1–2016 M12 | ||
| –2005 M8 | –2008 M12 | –2011 M3 | –2016 M12 | E–G | G–H | |
| JKM-NBP | ||||||
| JKM-HHB | ||||||
| NBP-HHB | ||||||
Note: HHB = Henry Hub natural gas price (North America), NBP = National Balancing Point natural gas price (Europe) and JKM = Japan Korea Marker (Asian); ADF with one lag for the Engle–Granger test was performed and the asymptotic critical values were taken from [36] Table 18.4, which were −3.90 (1%), −3.34 (5%) and −3.04 (10%), respectively; ** and *** indicate the significance at 10%, 5% and 1%, respectively. Asymptotic critical values for the Gregory–Hansen test were −5.47 (1%), −4.95 (5%) and −4.68 (10%), respectively.
Table 4.
Engle–Granger error correction models for and .
| Parameters | Period 1 | Period 2 | Period 3 | Period 4 | Entire Period |
|---|---|---|---|---|---|
| 2000 M1 | 2005 M9 | 2009 M1 | 2011 M4 | 2000 M1 | |
| –2005 M8 | –2008 M12 | –2011 M3 | –2016 M12 | –2016 M12 | |
| (0.037) | (0.049) | (0.142) | (0.170) | (0.065) | |
| (0.051) | (0.040) | (0.139) | (0.186) | (0.029) | |
| (0.141) | (1.144) | (0.588) | (0.648) | (0.482) | |
| (0.036) | (0.122) | (0.094) | (0.082) | (0.092) | |
| Instant % | 8.6% | 7.9% | |||
| (10.0%) | (12.9%) | (11.7%) | (8.9%) | (5.4%) | |
| Adj R2 | 0.03 | −0.04 | 0.34 | 0.37 | 0.09 |
| F-stat | 2.15 | 0.22 | 7.67 | 21.22 | 11.06 |
Note: standard errors are reported in parentheses; **, *** indicate the significance at 10%, 5% and 1%, respectively; NBP = National Balancing Point natural gas price (European market) and JKM = Japan Korea Marker (Asian market).
© 2020 by the authors. Licensee MDPI, Basel, Switzerland. This article is an open access article distributed under the terms and conditions of the Creative Commons Attribution (CC BY) license (http://creativecommons.org/licenses/by/4.0/).
Share and Cite
MDPI and ACS Style
Kim, S.-H.; Lim, Y.-Y.; Kim, D.-W.; Kim, M.-K. Swing Suppliers and International Natural Gas Market Integration. Energies 2020, 13, 4661. https://doi.org/10.3390/en13184661
AMA Style
Kim S-H, Lim Y-Y, Kim D-W, Kim M-K. Swing Suppliers and International Natural Gas Market Integration. Energies. 2020; 13(18):4661. https://doi.org/10.3390/en13184661
Chicago/Turabian StyleKim, Sang-Hyun, Yeon-Yi Lim, Dae-Wook Kim, and Man-Keun Kim. 2020. "Swing Suppliers and International Natural Gas Market Integration" Energies 13, no. 18: 4661. https://doi.org/10.3390/en13184661
Note that from the first issue of 2016, this journal uses article numbers instead of page numbers. See further details here.