Article

EU Emission Targets of 2050: Costs and CO2 Emissions Comparison of Three Different Solar and Heat Pump-Based Community-Level District Heating Systems in Nordic Conditions

1
VTT Technical Research Centre of Finland Ltd., Vuorimiehentie 3, 02150 Espoo, Finland
2
Department of Mechanical Engineering, School of Engineering, Aalto University, 02150 Espoo, Finland
3
College of Urban Construction, Nanjing Tech University, Nanjing 211816, China
*
Author to whom correspondence should be addressed.
Energies 2020, 13(16), 4167; https://doi.org/10.3390/en13164167
Submission received: 20 July 2020 / Revised: 6 August 2020 / Accepted: 10 August 2020 / Published: 12 August 2020
(This article belongs to the Special Issue Energy Performance and Indoor Climate in Buildings)

Abstract

:
In Finland, old apartments (1980s) contribute toward emissions. The objective is to reduce CO2 emissions to reach Europe’s targets of 2050. Three different centralized solar-based district heating systems integrated either with non-renovated or renovated old buildings in the community were simulated and compared against the reference city-level district heating system. The three proposed centralized systems were: Case 1: photovoltaic (PV) with a ground source heat pump (GSHP); Case 2: PV with an air-water heat pump (A2WHP); and Case 3: PV with A2WHPs, seasonal storage, and GSHPs. TRNSYS simulation software was used for dynamic simulation of the systems. Life cycle cost (LCC), CO2 emissions and purchased electricity were calculated and compared. The results show that the community-level district heating system (Case 3) outperformed Case 1, Case 2, and the city-level district heating. With non-renovated buildings, the relative emissions reduction was 83% when the reference energy system was replaced with Case 3 and the emissions reduction cost was 3.74 €/kg.CO2/yr. The relative emissions reduction was 91% when the buildings were deep renovated and integrated with Case 3 when compared to the reference system with non-renovated buildings and the emission reduction cost was 11.9 €/kg.CO2/yr. Such district heating systems could help in meeting Europe’s emissions target for 2050.

Graphical Abstract

1. Introduction

Climate change is the greatest challenge that the world is facing in the present times. The world at large and European Union (EU) in particular have goals to reduce emissions and its effect on climate change. The EU has set two targets to achieve emission reduction goals: the first target is to reduce emissions by 40% compared to the 1990 level by 2030 [1], and the second target is to reduce emissions by 80% by 2050 [2]. Around 36% of the carbon dioxide (CO2) emissions in the EU are caused by buildings due to their energy consumption [3]. Therefore, emissions caused by the consumption of energy in buildings can be reduced in order to reach the EU emissions targets. According to the EU Commission’s Energy Performance of Buildings Directive (EPBD) [4], all new buildings have to be nearly zero energy buildings by 2020. According to Article 2 of the EPBD [4], the nearly zero energy buildings are energy efficient buildings that have nearly zero or low energy demand and most of the demand is provided by renewable sources. However, a large portion of the building stock consists of old and low energy efficient buildings. These buildings consume a large amount of energy, resulting in large emissions. Therefore, the target of the EU could be toward zero emission buildings [5]. In Finland, a large part of district heating is provided using fossil-based or emission-based fuels [6] and the Finnish national target is to reduce the emissions from the district heating network by 80% by 2050 [7]. Therefore, the challenge is to increase the integration of renewable sources in the district heating to reduce emissions as well as reduce the dependence on fossil fuels, especially in the case of old buildings.
The reduction of emissions from the heating grid is an important target to reach the national and EU goals. Therefore, to reduce the emissions from the heating grid, energy efficiency is one of the main aims of clean energy for all Europeans [8]. Since different building types have different usage patterns, this requires specific solutions depending on the type and age of the building. The current buildings in Europe are old and aging and these buildings need to be renovated to improve the energy efficiency of the building stock [9]. In Greece, 70% of the buildings were built before the EU directives [10], while in Finland, around 43% of the buildings were built before the 1980s [11]. Moreover, old buildings in the Mediterranean climatic area [12] require different solutions than buildings in the Nordic region and such solutions cannot be imported from different climatic conditions. Each building is unique and each building has to be renovated differently. Several studies have been carried out showing the importance of treating each case separately, as each case study leads to different results, for instance, in day-care centers [13], schools, and education facilities [14] and other old buildings like museums [15].
The emissions from old buildings can be reduced by energy renovations. The technical, societal, and environmental issues of such renovations in different countries are presented in [11]. In the last ten years, only 0.4–1.2% [16] of old buildings have been renovated and this rate has to be increased by 2–3% [17] to reach the 2050 EU goals. It is argued that energy renovations can be costly even if they also improve the life of the building, the indoor living conditions, and property value [11]. Apartment buildings and single-family houses are a large segment of the building sector in Finland. Studies have been made on different methods and ways to improve the energy efficiency of such buildings [18]. Earlier studies have found that old buildings have the largest potential to increase the energy efficiency and reduce emissions [19] in Finnish conditions. In Estonia, a neighboring country, it was found that energy renovations of buildings could be carried out to the current standards in a cost efficient manner [20]. In Russia, it was found that the energy demand of apartments in Moscow could be reduced by 68% through renovation [21]. The present study focuses on old residential buildings in Finland that were built before the 1980s and cover almost 62% of the total gross floor area of Finland up to 2018 [22]. Reduction in the emissions and decarbonization of energy systems are one of the goals in the EU [2]. Therefore, the EU is driving efforts to further reduce the consumption of such fuels and utilize cleaner and renewable energy sources. Germany has planned to increase renewable utilization by more than 90% to meet its energy demand [23]. In Finland, most of the electricity is provided via carbon free sources such as hydro, nuclear, and imported energy sources [24]. However, the challenge is to decarbonize the district heating systems of Finland, which account for 44% of the total CO2 emissions caused by energy consumption [25]. Moreover, 46% of heating in residential buildings are provided via a district heating system [26]. In 2018, around 37 TWh of the district heat was provided, out of which 20% was from coal, 13% from gas, and 16% from peat [27]. Due to the high utilization of fossil-based fuels, the average CO2 emissions of district heating production in Finland is 176 g CO2/kWh [28]. The national policy of Finland is to reduce the country’s emissions by 80% compared to the level in the 1990s [7]. In order to reduce the emissions at the national level in Finland, the district heating systems in Finland have to be renovated and modified in a way that can support the emissions reduction decision. Therefore, the focus in the present study was to reduce the emissions from the district heating systems, especially in the context of old buildings in the community instead of new buildings that are rather energy efficient. Moreover, the impact of the old building’s energy renovations on the emissions were also analyzed, along with the integration of renewable-based centralized community-level heating systems.
Solar energy utilization can provide a much-needed pathway to reduce the CO2 emissions from district heating systems in general and in Finland [29]. There are also various other energy generation technologies that could be used to provide clean energy such as wind turbines [30], biomass [31], waste to energy [32], hydro [33] or gas [34,35]. However, solar energy has a large potential and market in the European Union [36]. In addition to this [37,38], southern Finland receives around 900–1170 kWh/m2 solar radiation per year; therefore, this solar energy can be used to provide energy to the buildings and communities. In contrast, the challenges in the utilization of solar energy in Finland are: (1) the annual mismatch between the demand and supply, and (2) the economic performance [3].
The issue of the seasonal mismatch and economic performance of solar energy can be addressed by the utilization of solar energy at a community or district level and by the utilization of storage in the community. Research shows that renewable and storage integration with a single building has less benefit compared to a community-sized solution. Storage integration with a community-sized solution can provide a cost effective [39] solution for renewable energy utilization and mismatch issues [40], in contrast to a single building solution [39]. Moreover, in a community-sized solution, the demand profile has lower variations compared to a single building heating system, therefore community-based solutions are needed. This would allow lowering the costs [41] and the payback periods [42].
Several solar-based district heating systems for a community at a pilot and experimental scale have been built in Germany [43], Sweden [44], Denmark [45], Australia [46], and Canada [47]. The study found that a solar-based district heating system could provide energy with better efficiency and with reduced costs compared to electric heaters and boilers. Another study showed that the solar energy used with district heating could provide 80–90% of the heat energy demand in summer and 50% during winter [48]. In cold climatic conditions of China, 60% of the heat demand can be met via solar energy [49] for multiple buildings. Pilot projects in Central Europe have demonstrated that 30–60% of the heat demand can be covered by solar thermal energy and storage integration [40]. Another pilot project in Canada showed that 98% of the space heating demand could be provided by the utilization of solar energy and seasonal storage. In southern Finland, experimental-based solar district heating projects were built in Kerava [50] during the 1980s and Eko-Viikki [51] in the 2000s. However, the two projects were not able to meet the expectations due to technical issues. Another study showed that a solar heating district network integrated with a heat pump could perform better when compared to a heating network without solar energy [52]. Therefore, a holistic approach is needed where community- or district-sized solutions are studied instead of a single building to make the solar energy application cost effective, and at the same time, high performing.
The issue in Nordic conditions is the seasonal mismatch (i.e., solar energy is available in large quantity during summer, when the demand is low and vice versa). This issue makes the utilization of solar energy at high latitude quite uncompetitive compared to fossil-based energy. Another challenge in the district heating system is high losses due to the high operating temperature of the district heating network during an extreme winter season [53]. Both of these issues can be resolved by the utilization of seasonal storage and a low temperature district heating system coupled with heat pumps [54]. Usually, heat pumps are used as ground source heat pumps integrated with the buildings [55]. These heat pumps can be integrated with solar charged seasonal storage and connected with low temperature district heating networks so that they can provide high temperatures to the buildings to meet the heating demands [39]. This would improve the coefficient of performance (COP) of the heat pump and reduce the losses from the district heating network. A study carried out showed that a heat pump integrated with a solar thermal collector could have a solar fraction of up to 67.5% [56]. In addition, the solar energy could be utilized throughout the year by storing excess heat energy in the seasonal storage to be used during winters, when no solar energy is available in Nordic countries. Different novel ways and methods to integrate the heat pumps are studied and proposed in the present study to evaluate the performance of the district heating networks in the community of old buildings.
Seasonal storage is an important component of a solar-based district heating system. There are different types of storage that can be used to store solar energy for longer, or for a seasonal time [57,58]. Sensible-based thermal energy storage is cheap compared to other types of storage like electrochemical or phase change materials [3]. There are different storage technologies that can be used for sensible heat storage, for instance, hot water tanks, pit thermal energy storage, aquifer thermal energy storage, and borehole thermal energy storage [3]. The study showed that solar energy could provide up to 91% of heat energy to the community in USA (Virginia) when integrated with seasonal storage [59]. Another study found that seasonal storage integrated with solar energy could provide 68% of the energy to the district in China, compared to the present state-of-the-art solution. Drake Landing Solar Community, Canada has borehole thermal energy storage integrated with a solar thermal collector that provides around 98% of the space heating demand via solar energy [60]. This pilot project in Canada showed the benefits of utilizing seasonal storage in cold climatic conditions. A simulation-based study showed that 90% of the space heating and domestic hot water could be provided via solar energy, if seasonal storage was integrated in a cold climate [61]. Similarly, other studies have shown the benefits of borehole thermal energy storage in solar based district heating systems, which can provide seasonal flexibility to the district heating systems [62,63,64]. Borehole thermal energy storage (BTES) was studied in the present study due to its flexibility, simple design, and good ground conditions in Finland [3].
In solar technology, the most common technologies used to utilize solar energy are photovoltaic (PV) panels and solar thermal (ST) collectors [65]. ST collectors are used to provide heating to the building and PV panels are widely used to provide electricity [66]. However, PVs can be used to provide heating to a building along with electricity. PVs can be integrated with heat pumps to generate heat energy for the building [67]. Several studies have shown that such integrated energy systems can provide low cost solutions to meet the heating demand of the building and can assist in lowering the emissions from heating systems [68,69]. Another study showed that the utilization of PVs could provide a cheaper solution for the district heating systems compared to the ST-based district heating systems in Nordic countries [54]. An initial study showed that PVs could be used to generate heat using heat pumps, the generated heat could be used to meet the heating demand of the community, and excess energy could be stored in the seasonal storage. There is a lack of studies on such concepts, where PVs are used to produce heat energy and is integrated with seasonal storage in cold climatic conditions. In addition, there is a lack of studies and evaluations of such concepts for community scale applications with old buildings in Nordic conditions [70] and its benefits in terms of emissions reduction. The concept where PVs and heat pumps are integrated with the seasonal storage at the community-level that contains old buildings was studied in the present study in the Finnish conditions. Therefore, PV and heat pump-based district heating systems were designed and analyzed from the perspectives of technical, economical, and emissions reduction.
In many studies [19,71,72], focus has been separately made either on the building efficiency or on the energy system design and modeling. Moreover, most studies have been undertaken to estimate the impact in terms of economics and technical performance. The novelty in the present study is a multi-dimensional approach where old buildings in the community are integrated with novel centralized community-level energy systems in cold climatic conditions. Centralized community-level energy systems consist of PV and heat pump-based district heating with or without seasonal storage. The objective of the study was to analyze the potential of CO2 emissions reduction and energy savings from the district heating network at the community-level for old buildings with or without renovation and identify its effect on the life cycle costs, purchased electricity, and renewable energy fraction. In this study, detailed building renovation methodology was included and the focus was at the community-level instead of single building solutions. This was done because the carbon reduction measure is needed at a larger scale instead at a single building level to meet the EU and national CO2 emissions reduction targets. A reference city-level district heating system for the old buildings was compared against the three developed off-site centralized community-level energy systems. The research was carried out by designing and simulating the reference and proposed renewable-based district heating systems for the old building community.

2. Methodology

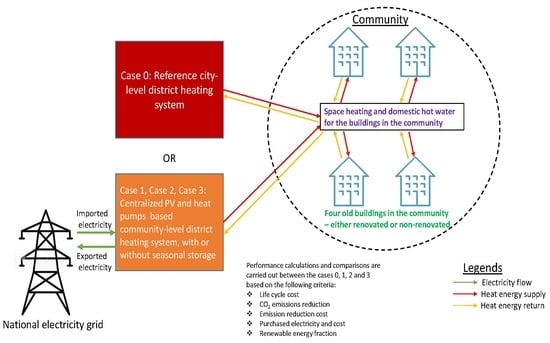
2.1. Simulation Method and Framework

The framework of the present study was designed in a way where different parameters such as CO2 emissions, economic, and technical performance were compared to evaluate different centralized community-level energy systems for old buildings. The CO2 emissions for each case and scenario were compared against the reference case to identify the benefits of renovating the old buildings and integrating old buildings with novel solar-based district heating systems. The scope was limited to the simulation study and to solar energy harvesting; no other technologies were considered for producing energy such as by using waste to energy plants, biomass, wind turbines, etc. This is done because solar PV is relatively cheaper [73] compared to other technologies such as wind turbines [74]. The old buildings and renovation measures in the buildings were simulated in an earlier study [19] using IDA Indoor Climate and Energy (IDA-ICE) simulation software [75] and are explained in Section 2.2; the energy system modeling and simulation for the buildings are described in Section 2.3 and Section 2.4, and finally, the parameters, input data, and calculations criteria are described in Section 2.5, Section 2.6 and Section 2.7.

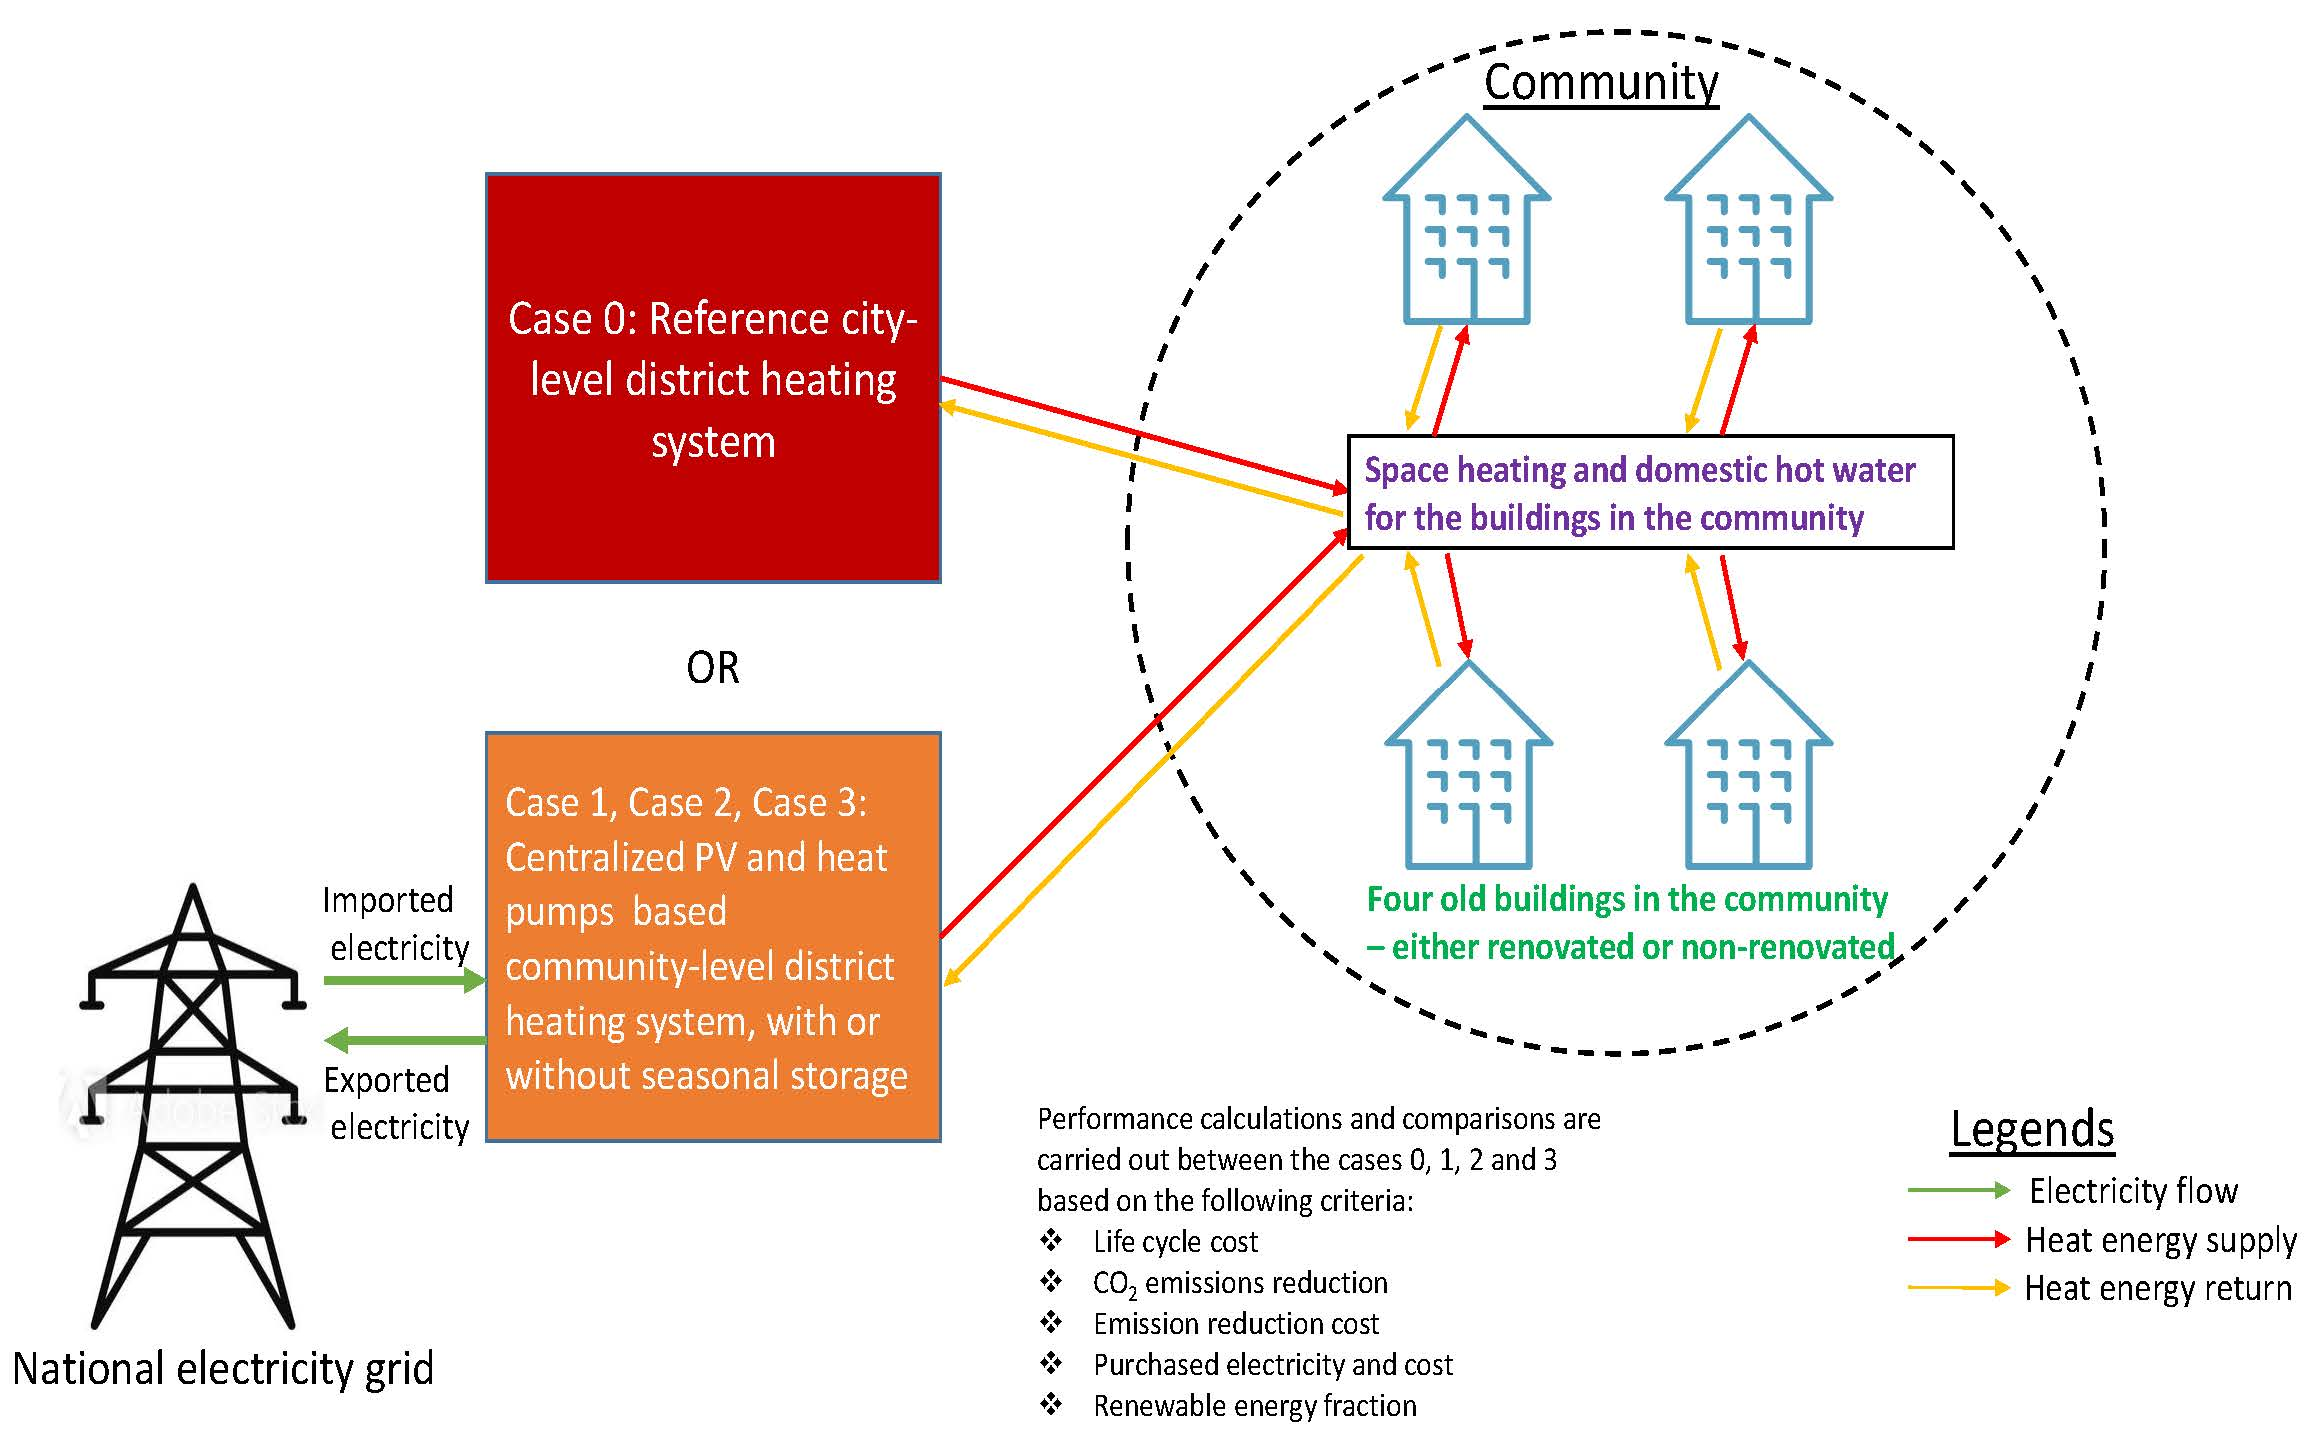
2.2. Building Description

The study was carried out in the Southern Finland area of Louhela, Vantaa [76]. As shown in Figure 1, the four buildings considered in the study were built during the 1970s. The heated floor area of each building is around 4000 m2.
The buildings were modeled, described, and simulated in an earlier study [19]. The present study assumed that all four buildings in the chosen district were similar and that their renovation levels complied with the following options. The four buildings built during the 1970s were either original non-renovated reference buildings (OR), original buildings that had been light renovated (LR), or deep renovated (DR). The building design parameters of the OR building are provided in Table 1 [19].
The building above-mentioned is an original-reference (OR) old building in the community. This building was then light renovated and later deep renovated at the building level (onsite) in the IDA-ICE software (as discussed in detail in [19]) with no changes in the offsite production plant. The buildings were renovated at the onsite building level to reduce the emissions from the reference city-level district heating network for old buildings. The old buildings are less energy efficient when compared to new buildings. Hence, these buildings have been renovated and changes made onsite to improve the energy efficiency of these buildings. Moreover, as discussed earlier, the district heating network contributes to large emissions in Finland. Therefore, the largest potential to reduce these emissions also exist in the district heating networks.
The renovation of the building onsite or at the building level would increase the life cycle cost (LCC) of the buildings due to investments in the material or technical systems that are needed to improve the energy efficiency. It is important to identify the emissions reduction potential relative to the increase in the LCC of the building. Table 2 shows the design variables and heating demand of the three types of simulated buildings (reference, light renovated, and deep renovated) considered in the study. It was assumed that the domestic hot water (DHW) demand was 35 kWh/m2/yr [81]. It is important to note that the components in Table 2 were installed on the buildings or onsite and the costs were regarded as building level costs. This is separate from the centralized community-level district heating energy system.

2.3. Energy System Description and Simulation Method

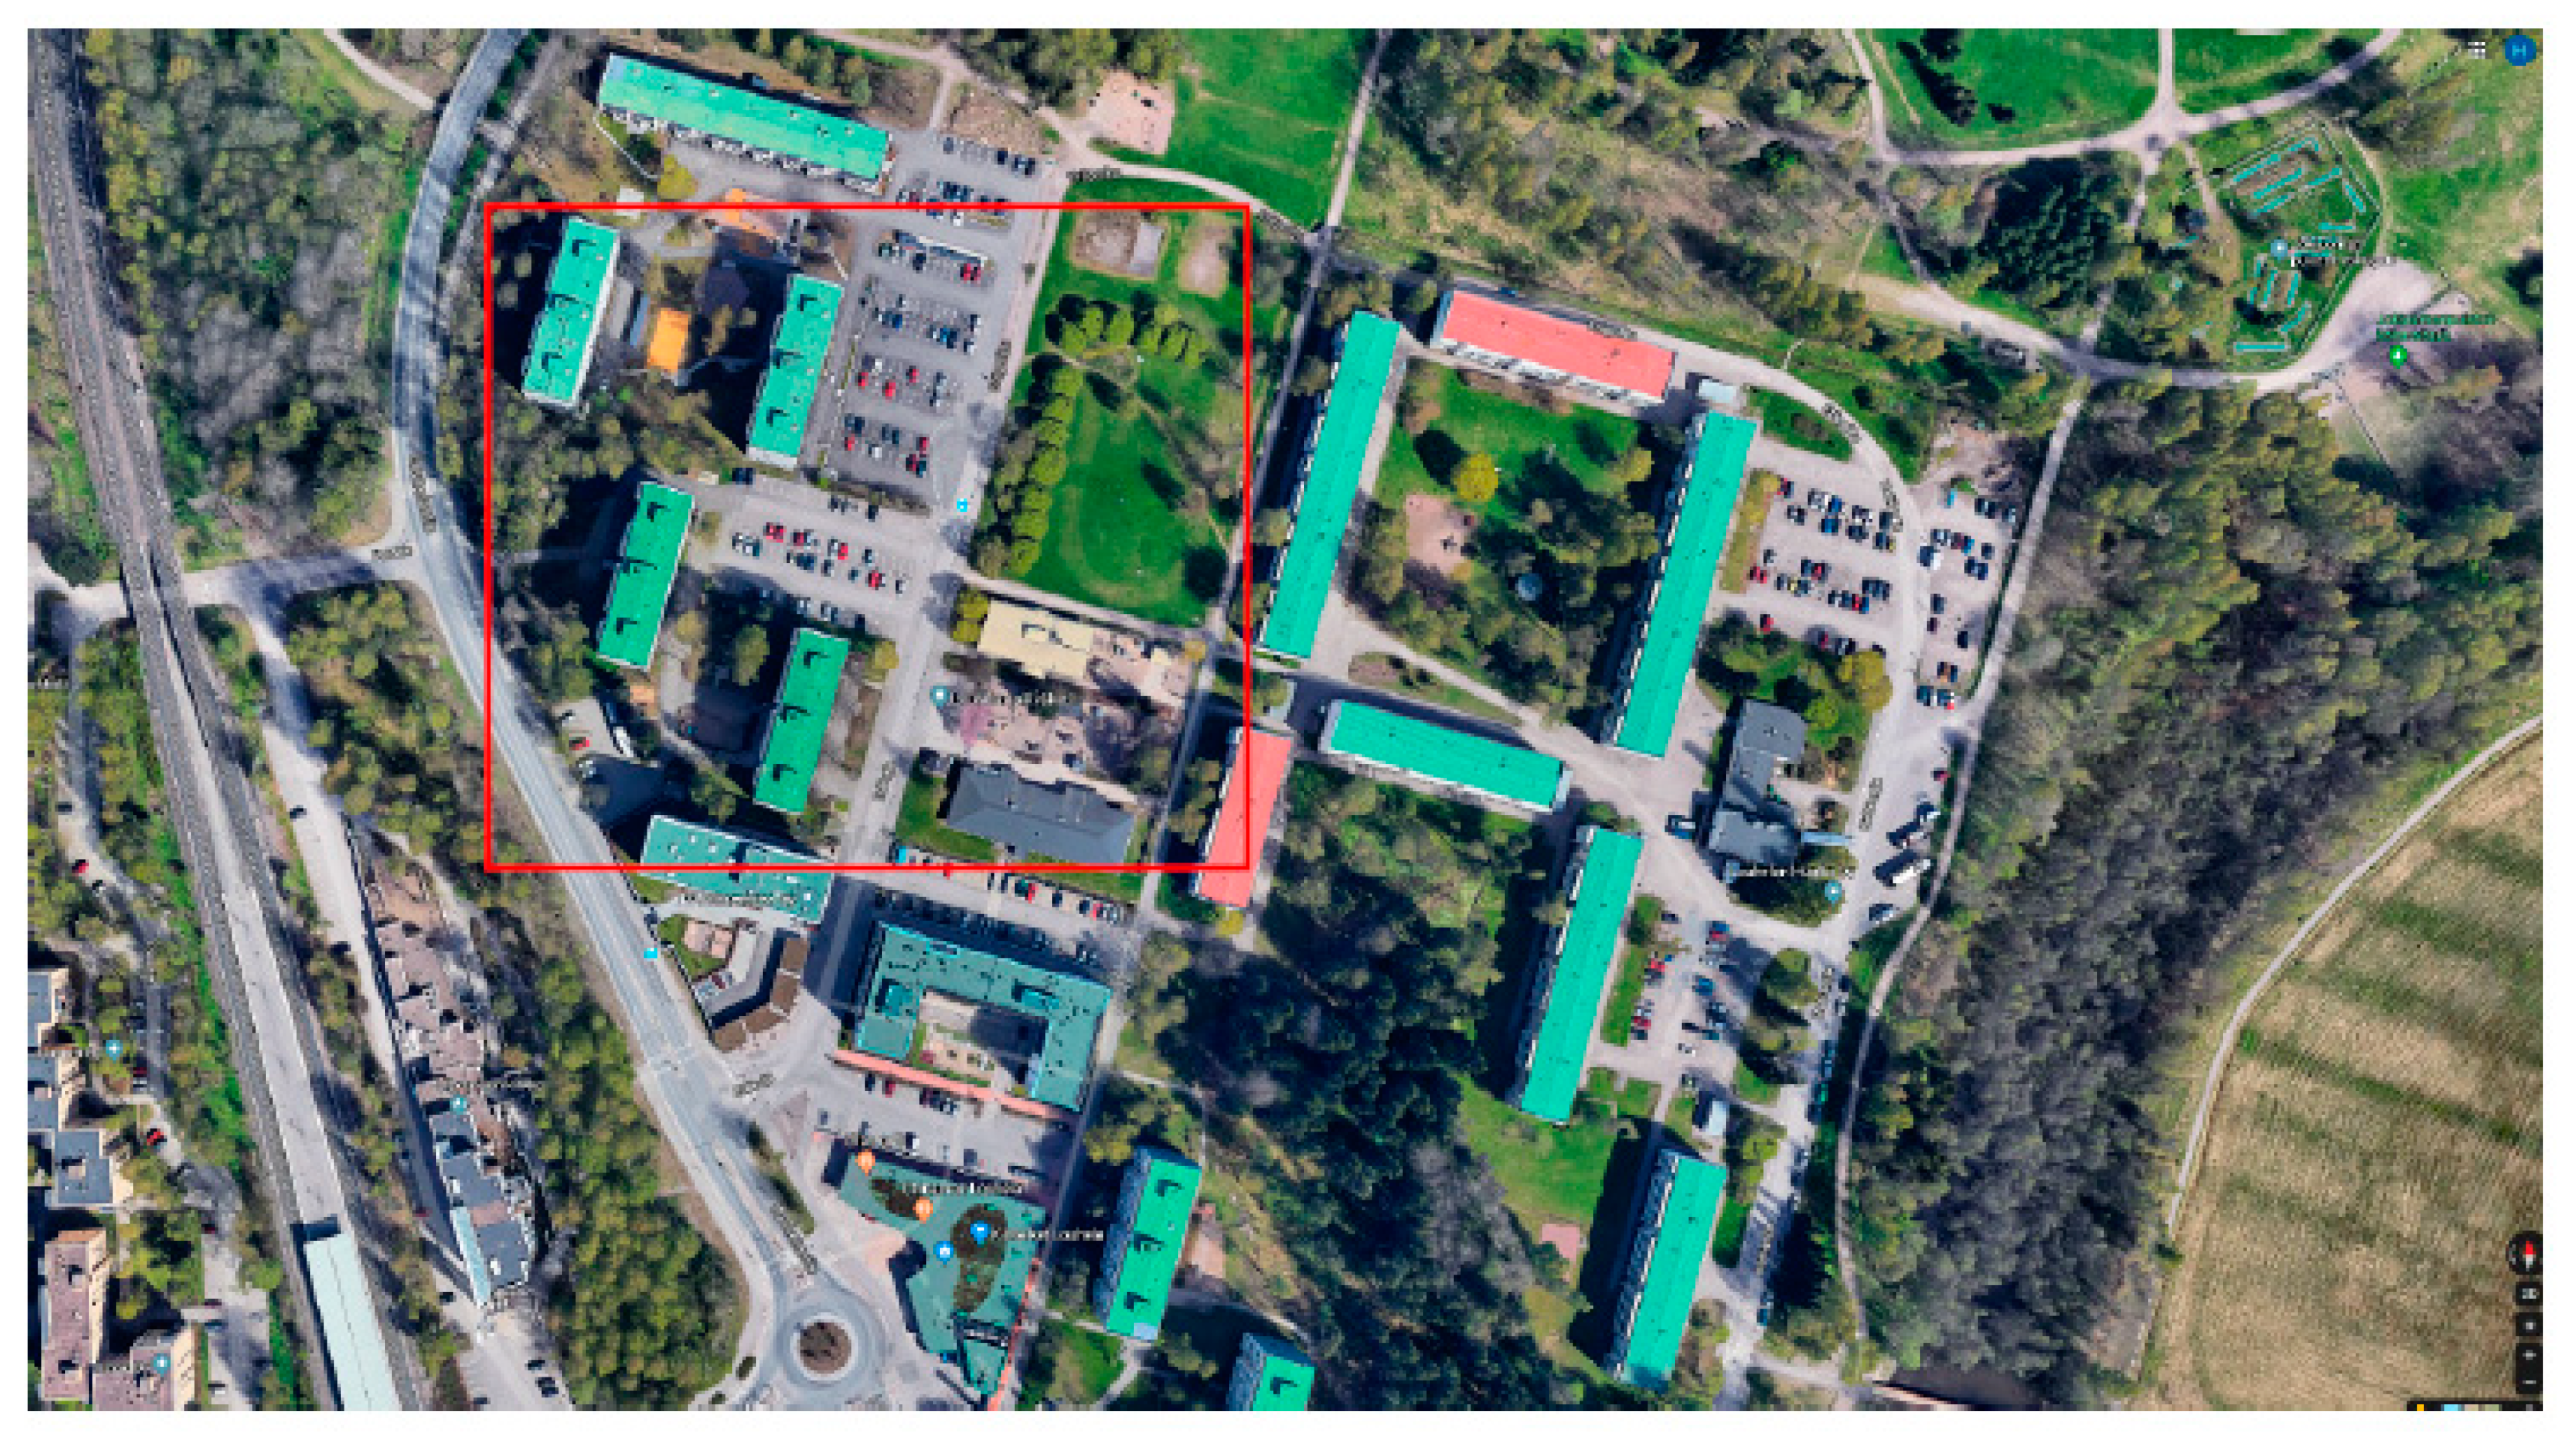
2.3.1. Reference Case: City-Level District Heating

The reference case consisted of four buildings with a heated floor area of 4000 m2 each. The covered ground area of each building was around 500 m2. The system is a reference case scenario as shown in Figure 2.
In this case, the buildings were integrated with a city-level district heating system. There were no localized or offsite renewable energy generation and storage systems available that could provide heating to the buildings. All the demand was met via the city-level district heating grid. Figure 2 shows the schematic diagram of the reference case. In this case, only the buildings were changed based on Table 2. This was done to observe the change in the energy demand due to changes in the building efficiency and its effect on the CO2 emissions and the life cycle cost. The changes were made in the building envelope and in addition, building integrated energy generation systems were added to further reduce the emissions from the grid, as shown in Table 2. In the scenarios where the buildings were light renovated (LR) or deep renovated (DR), the heat demand of the buildings was reduced due to the improvement in the building envelope, as shown in Table 2. Moreover, in the two building renovation scenarios (i.e., in LR and DR there were onsite decentralized and building integrated renewable energy generation components integrated within the buildings). This was carried out in order to meet the part of the heat demand via the onsite building integrated energy generation system and the remaining part via the district heating grid. The DHW is provided at 60 °C and the inlet water temperature of radiator network varies between 27 °C and 40 °C, depending on the outside ambient temperature [81]. The same temperature levels for DHW and SPH were used in all of the case studies mentioned further in Section 2.3.2, Section 2.3.3 and Section 2.3.4 in this paper.
This method would allow for a reduction in the CO2 emissions of the buildings by producing energy onsite via renewable energy sources, rather than importing energy from the city-level district heating grid, which has a large carbon footprint and CO2 emissions. In Finland, most of the CO2 emissions are caused by the heating of the buildings, which is provided through the district heating network [27]. In contrast, the electrical grid of Finland has low emissions as most of the energy is produced by hydro and nuclear and a large amount of electricity is imported via Sweden, who produces electricity through hydro and nuclear sources [82].

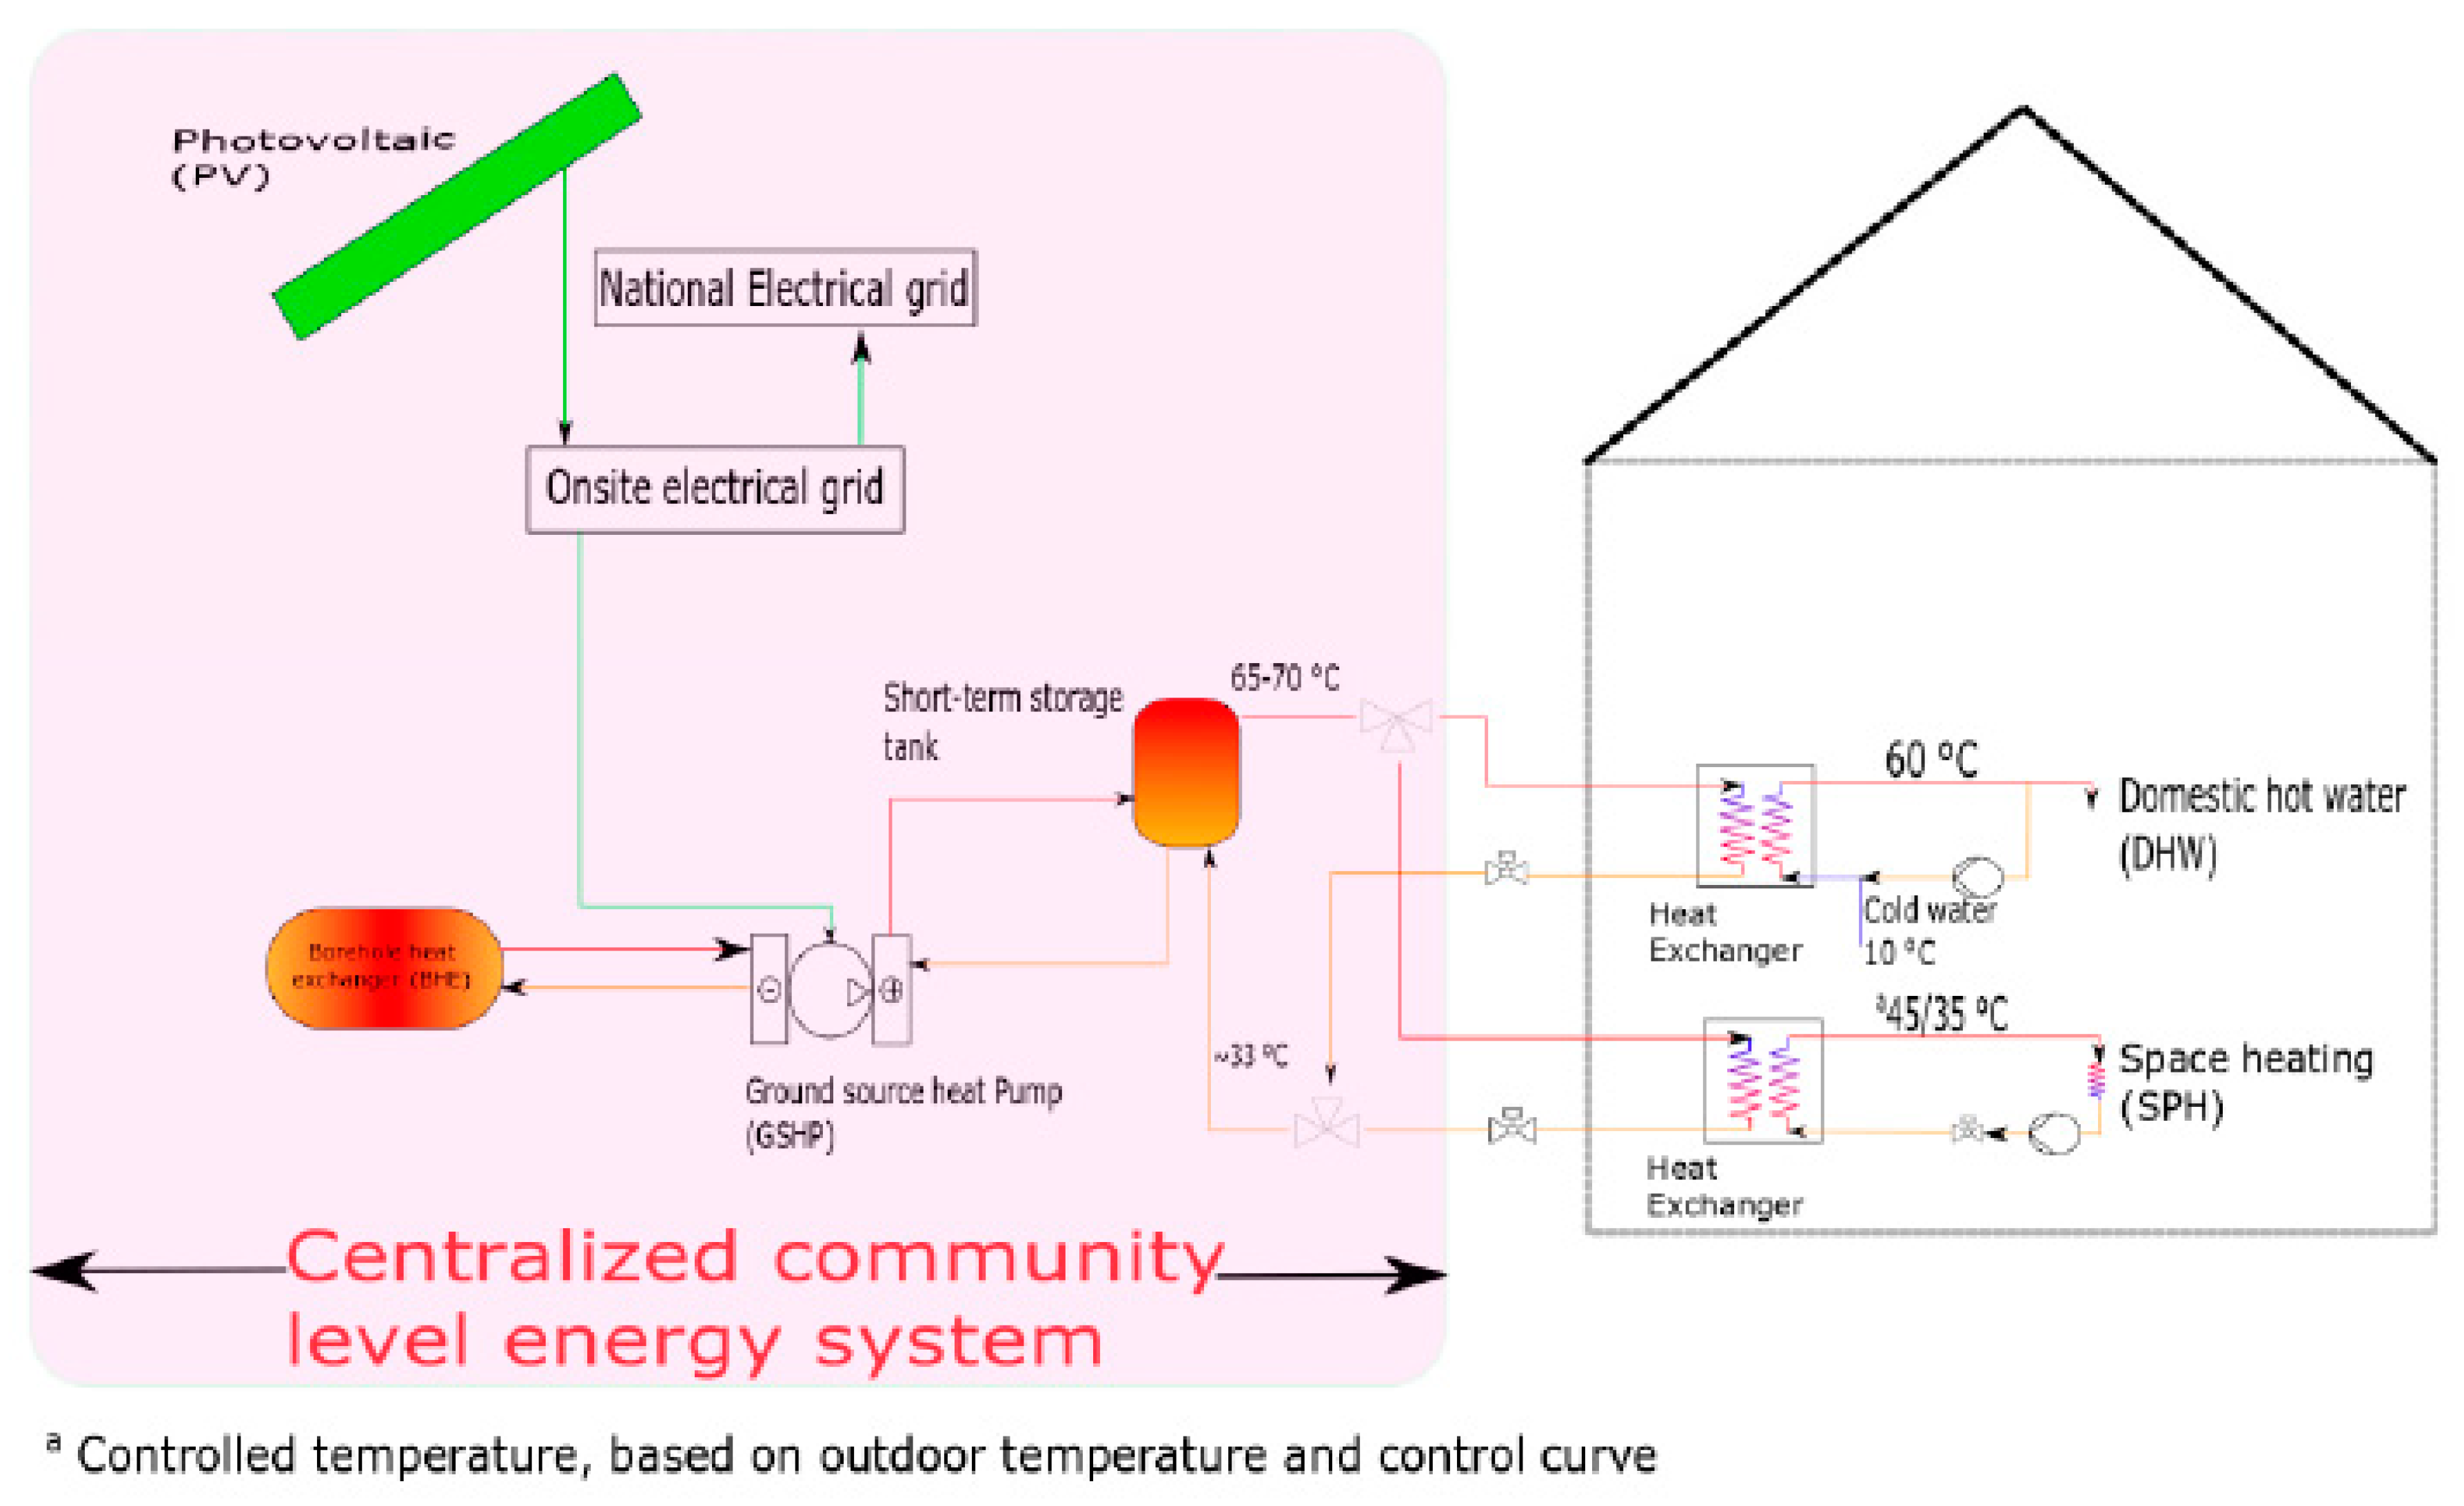
2.3.2. Centralized PV and GSHP-Based District Heating System

This system was designed with off-site centralized solar photovoltaic (PV) panels installed close to the buildings to provide heat energy to the localized community-level district system [39]. This concept was motivated by the previous study carried out, where solar thermal was used as the main generation source of heat energy [54]. The difference in this study was the utilization of a PV-based district heating system as the main source of energy generation. Moreover, in this study, the proposed energy system was integrated with multiple old residential buildings in the community, instead of new buildings or single building solution. A schematic representation of the centralized photovoltaic-ground source heat pump-based community-level energy system for the old buildings is shown in Figure 3.
In the energy system, the PVs are used to generate heat by using GSHP. This is one of the most popular solutions in Finland (i.e., to use GSHP to produce heat energy for a house by using cheap grid electricity [83]). However, the PV system can be used to run the heat pump, instead of grid electricity, which is a common solution [83]. In the present study, a PV, heat pump, and storage tank were used to provide heat energy to the district.
The heat pump is used to charge the tank to 62 °C if the short-term storage tank is lower than 58 °C. The heat pump takes energy from the borehole heat exchanger (BHE) from the evaporator side and charge the short-term storage tank. This centralized tank is used to provide space heating (SPH) and domestic hot water (DHW) to the buildings. The PVs were used to meet the electricity demand of the centralized energy system. Any short fall in the electricity is imported from the grid, while any excess electricity from the PV is exported to the grid after meeting the centralized energy system demand. The principle of using the PV is similar in all the case studies mentioned further in Section 2.3.3 and Section 2.3.4 in this paper.

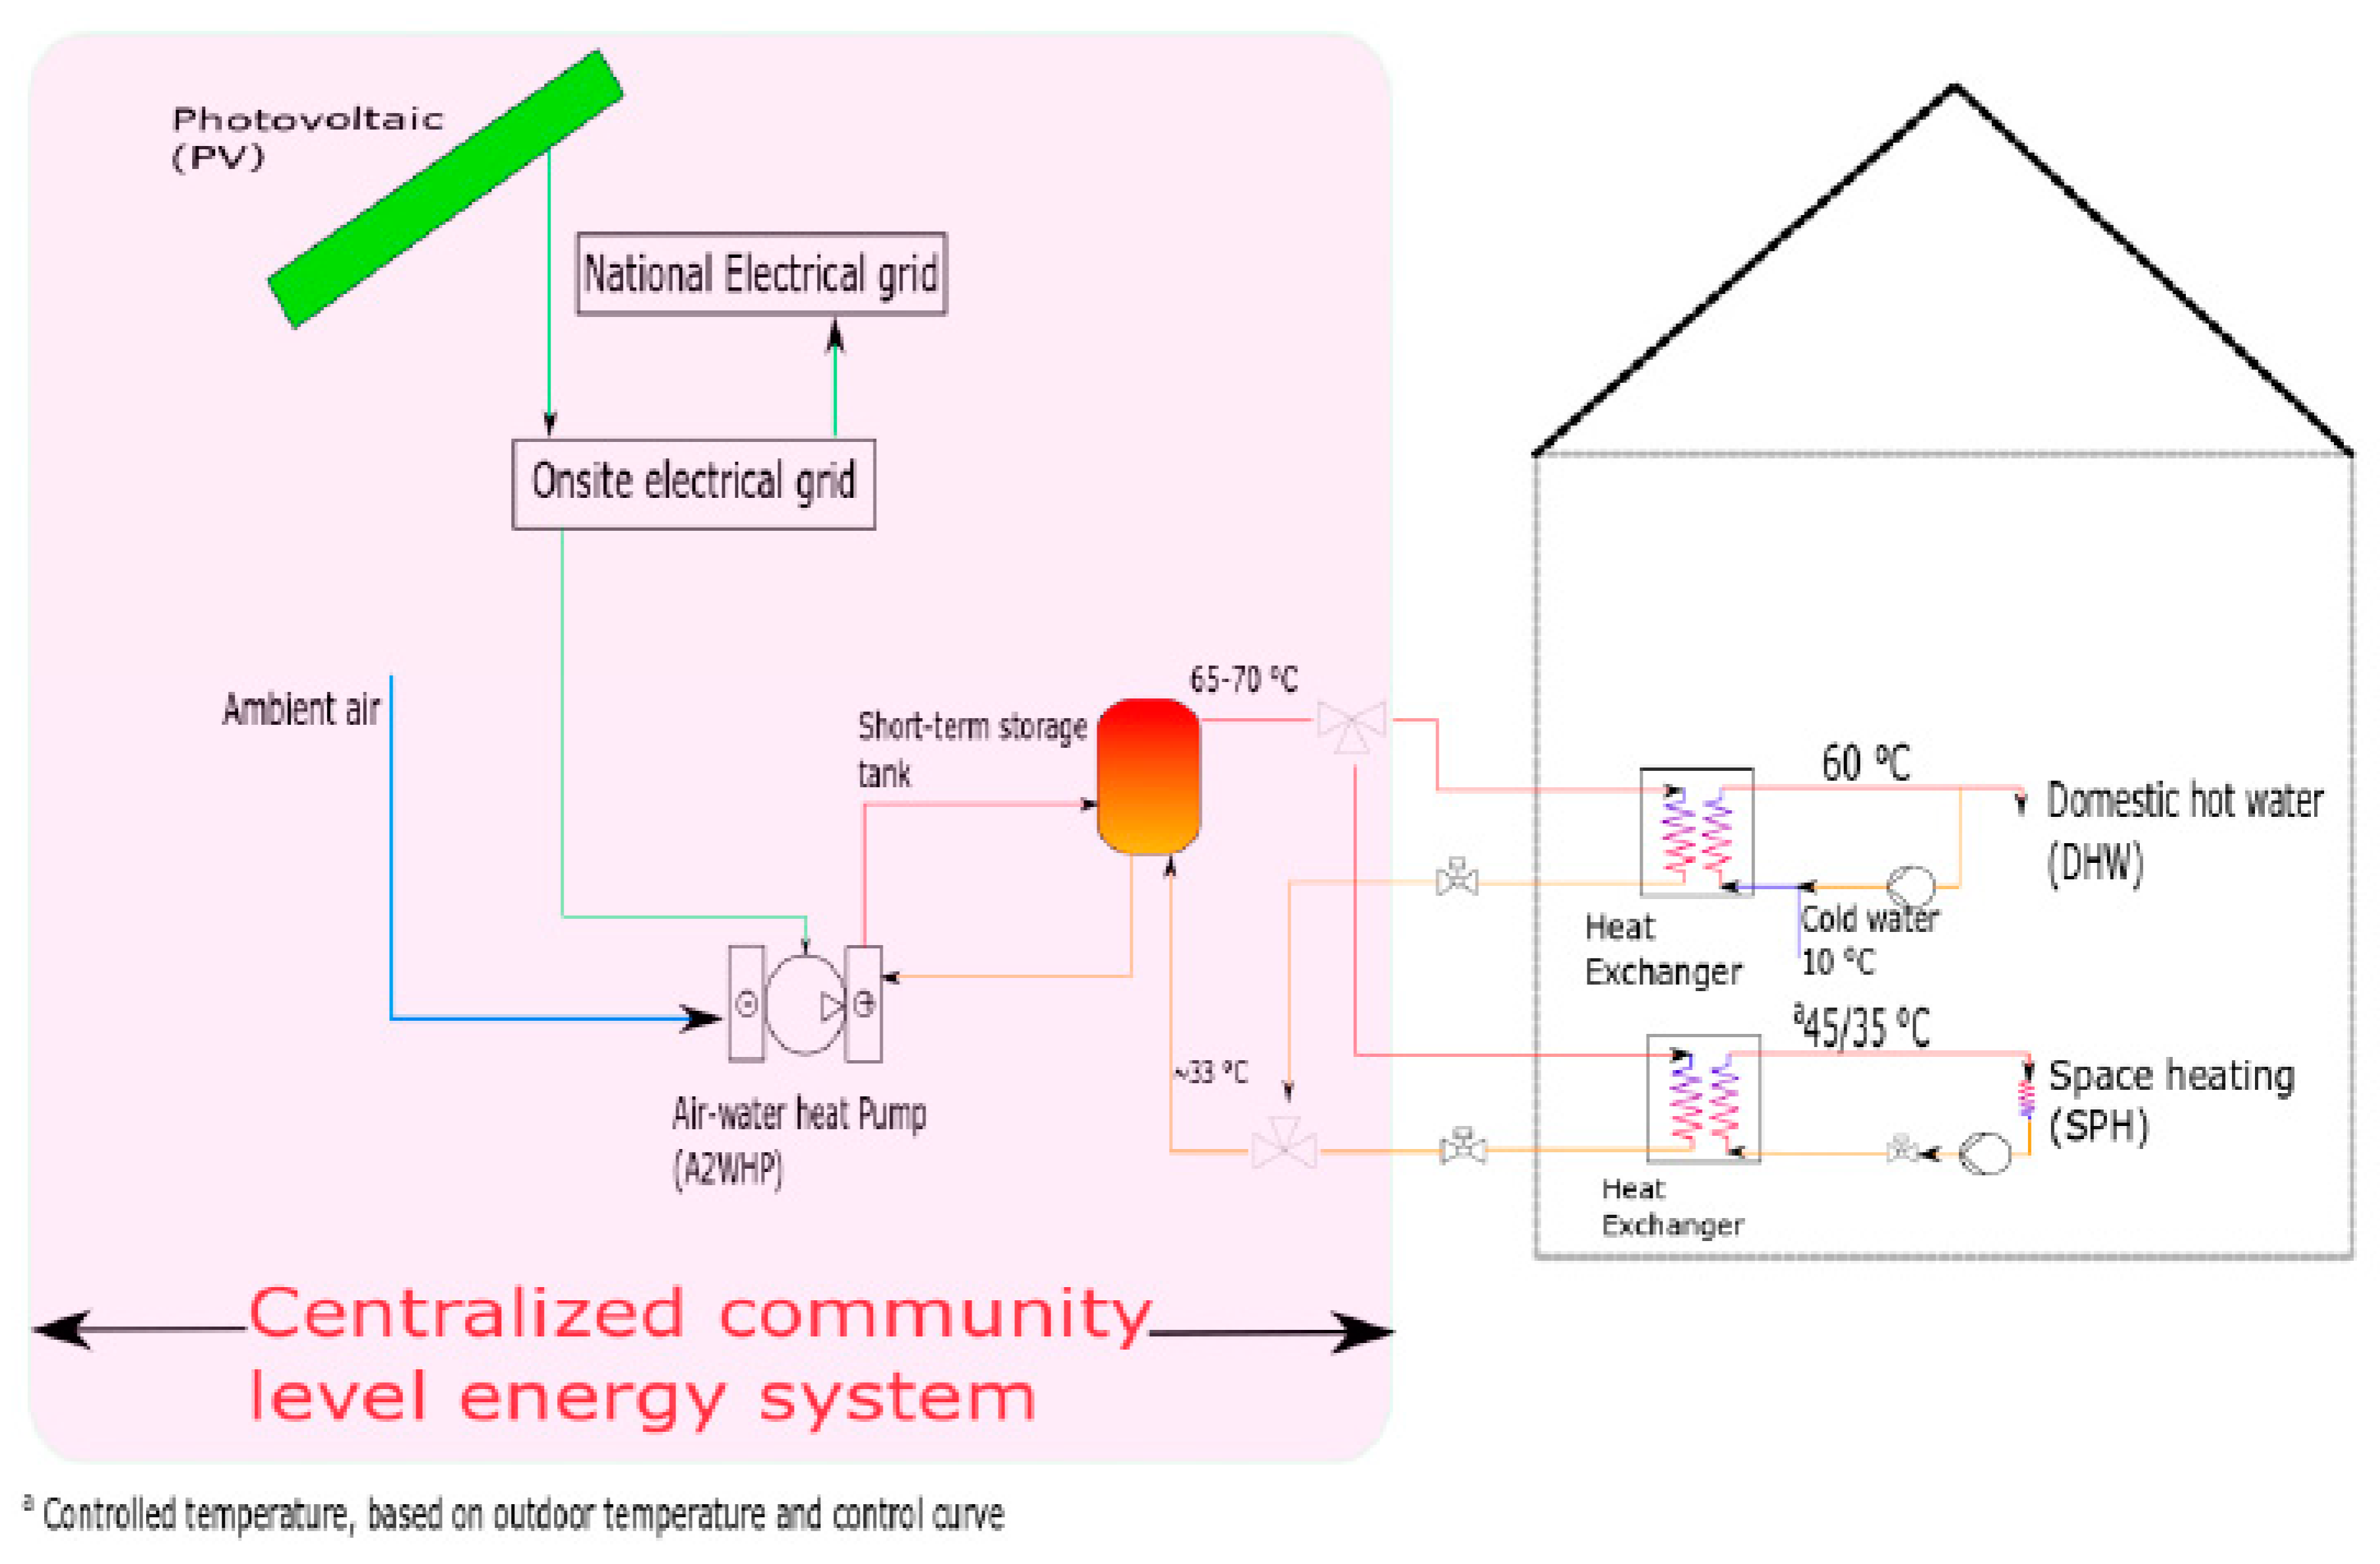
2.3.3. Centralized PV and Air-Water Heat Pump (A2WHP)-Based District Heating System

This system has similar concept as shown in Section 2.3.2; however, in this system the GSHP is replaced by the A2WHP that is integrated with the centralized PV system. This off-site centralized system is installed close to the buildings of the community to provide heat energy to the localized district system [39]. The schematic diagram of the energy system is shown in Figure 4.
The A2WHP is used to charge the tank to 62 °C, if the temperature of the short-term storage tank is lower than 58 °C. The heat pump takes energy from the ambient air from the evaporator side and charges the short-term storage tank from the condenser side. This centralized tank is used to provide space heating (SPH) and domestic hot water (DHW) to the buildings.

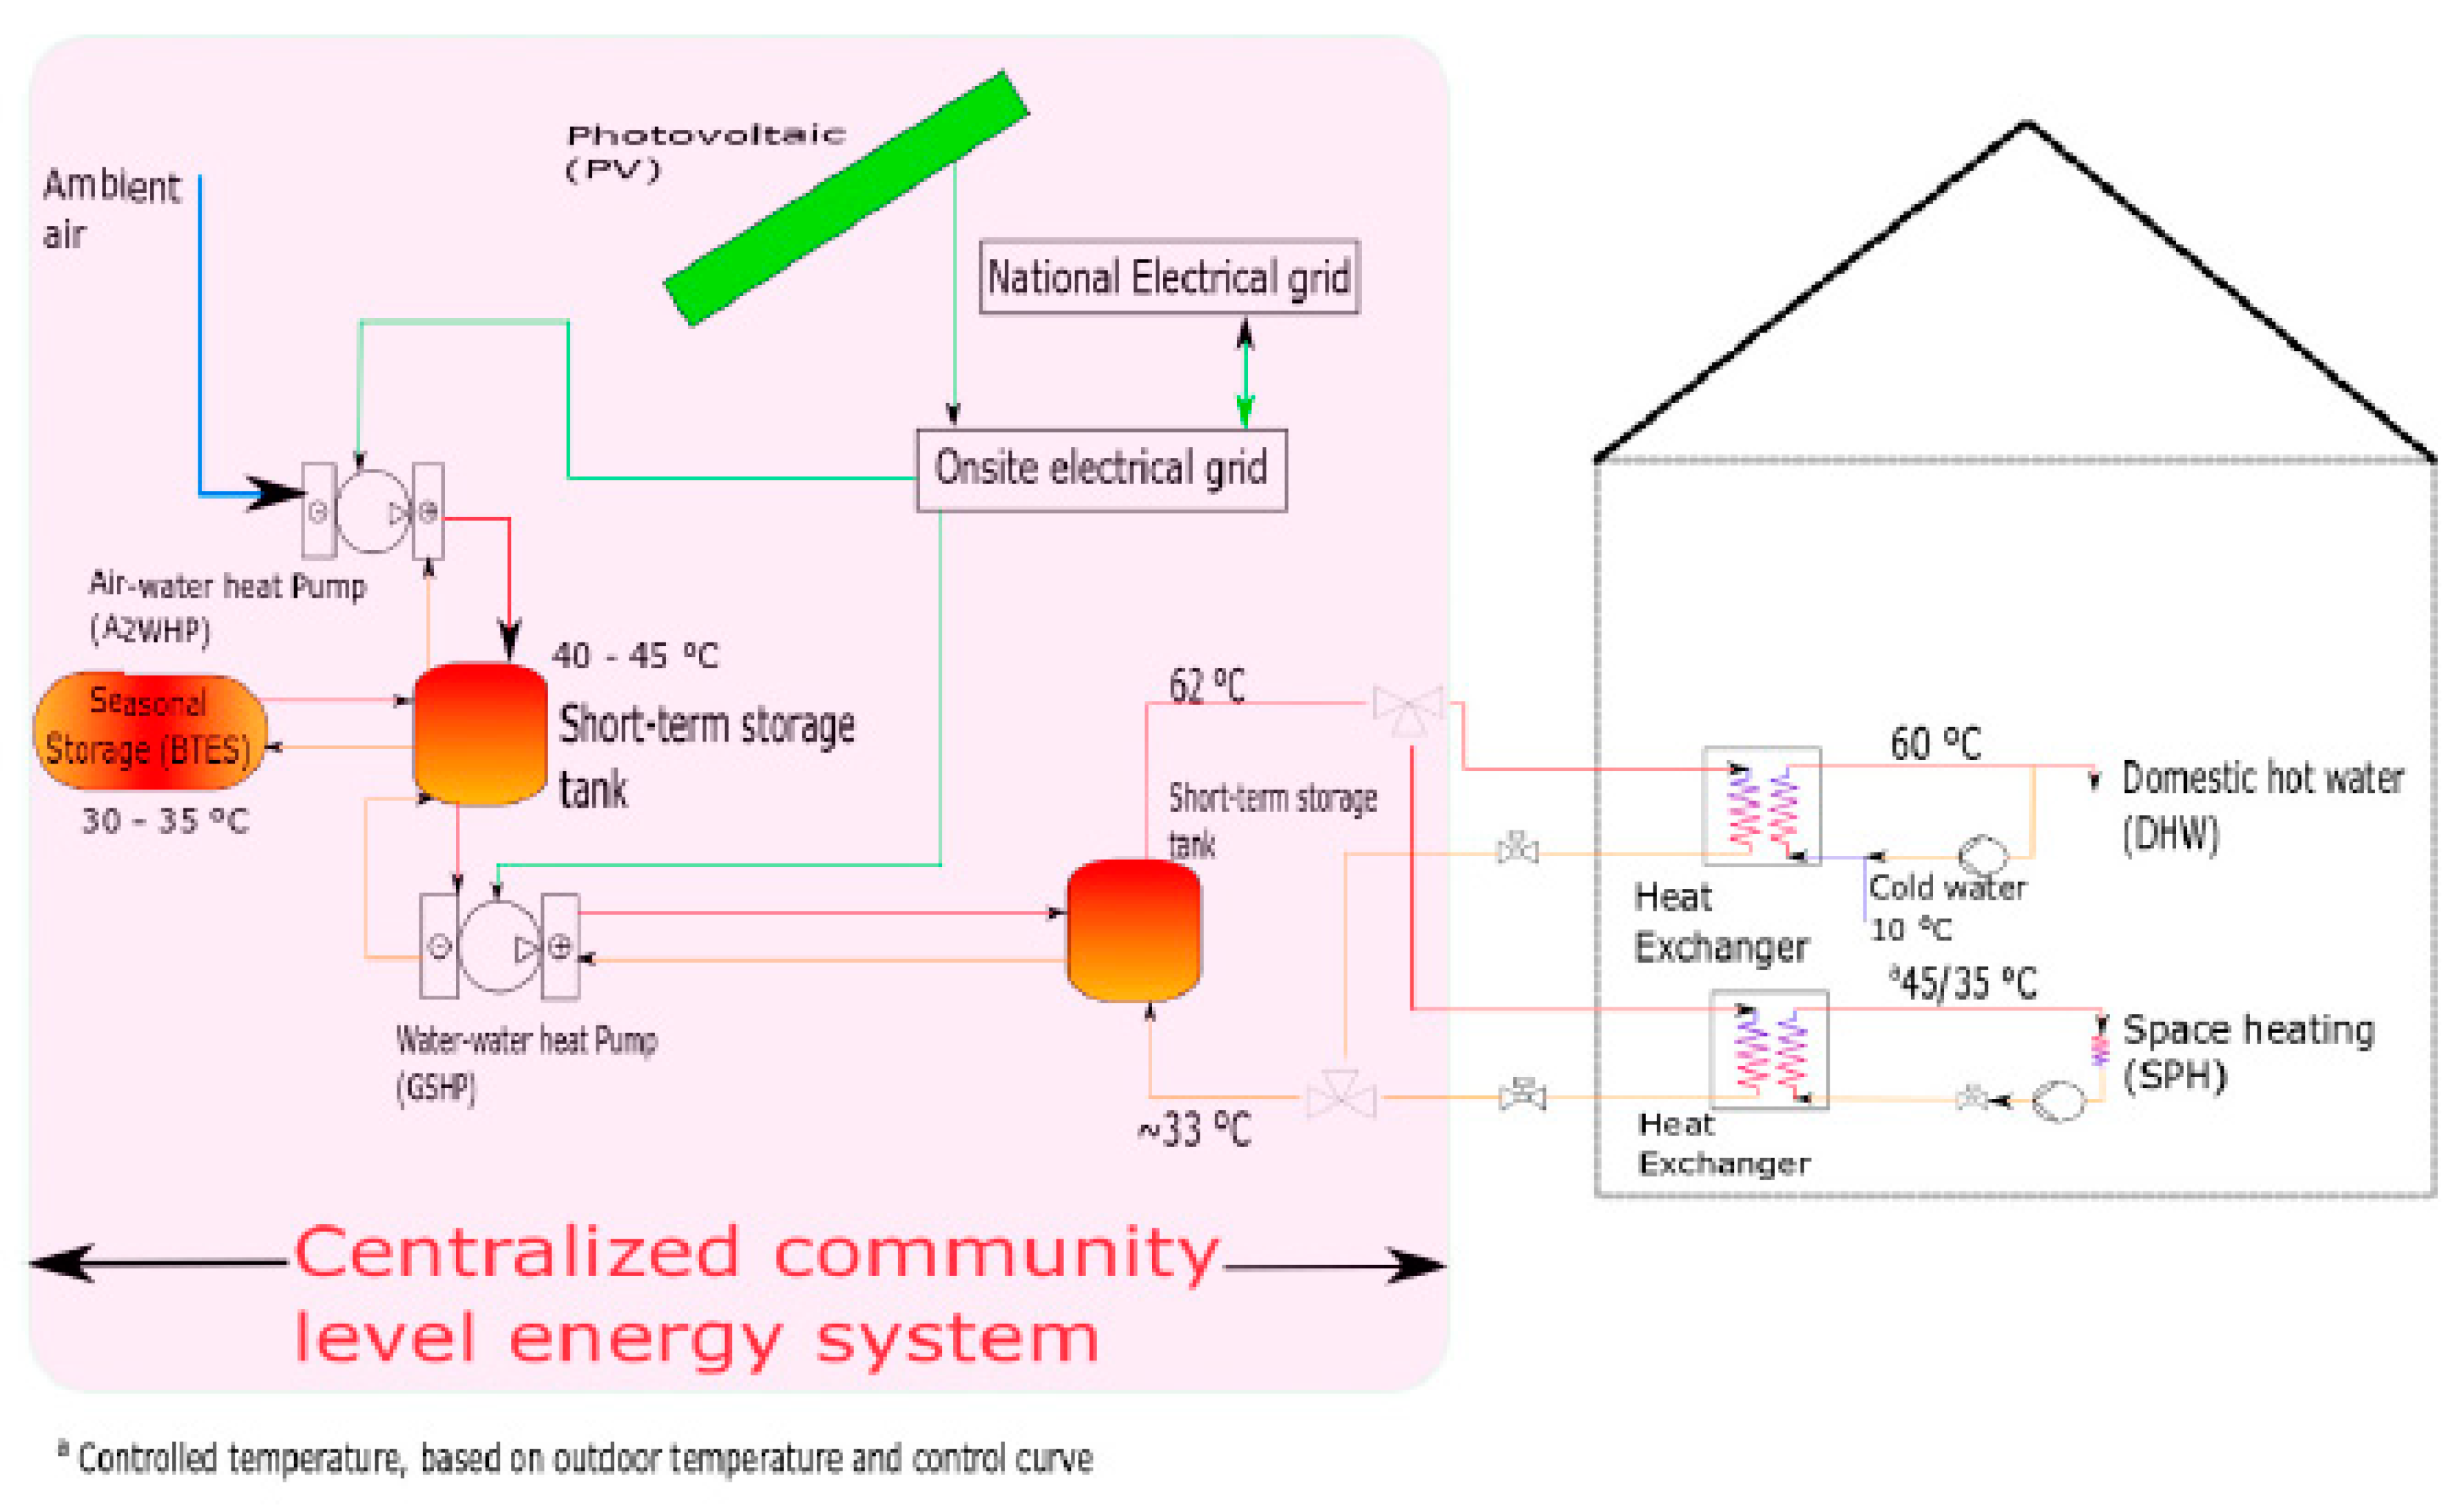
2.3.4. Centralized PV and Heat Pump (HP)-Based District Heating System with Seasonal Storage

Using a similar concept and taking inspiration from Cases 1 and 2, as shown in Section 2.3.2 and Section 2.3.3, this was further improved to propose a novel energy system and control strategy. In Case 3, the PV was integrated with the A2WHP and GSHP to provide both heat and energy to the building. In the proposed system, PV is used to provide energy first to the heat pumps, pump, and backup heater to improve the onsite consumption, and finally, any excess is exported to the grid. The modification in Case 3 was the integration of borehole thermal energy storage (BTES) as seasonal storage. Seasonal storage is used to store the excess energy from the PV during summer periods to be used during winter as heat. In addition, two short-term storages were used instead of one and one tank was charged at a lower temperature, while the second tank was charged at a higher temperature. The novelty is in the integration and control strategy of all the generation components, storage, and seasonal storage with the old buildings in the community. The schematic presentation of the proposed system is shown in Figure 5.
The control strategy is designed in a way that the centralized PV for the plant is used to produce electricity. This electricity is used to run the heat pumps to charge the short-term storage tanks. The priority is set in a way that the GSHP is used to charge the high temperature tank, and then extra electricity is used to run the A2WHP to charge the low temperature tank. After using the electricity to run these two heat pumps, excess electricity is sold to the grid. The A2WHP is used to charge the low temperature tank to 40 °C and any excess heat energy is used to charge the BTES. If the warm tank temperature is 5 °C higher than the BTES average temperature, the BTES is charged by the warm tank. The WWHP is used to charge the hot tank to a higher temperature of 62 °C by capturing energy from the space heating return network. The hot tank is used to provide domestic hot water (DHW) and space heating (SPH) after preheating the water in the warm tank.

2.4. Simulation of Energy Systems

Energy simulation software known as TRNSYS [84] was used to model and perform dynamic simulation of the energy systems. This simulation software is widely used by the scientific community, for instance, in [85,86] and validated by the Drake landing community, Canada [47]. In TRNSYS, the modules used were as follows: photovoltaic (TYPE 194), heat pump (TYPE 668), tank (TYPE 543), borehole thermal energy storage (TYPE 557a), control of set points (TYPE 2b), temperature control (TYPE 11f), and weather data (TYPE 15). The input parameters for the above-mentioned components are described in detail in [87]. In the present study, centralized community-level energy systems were designed for the district and compared against each other by studying the overall emissions, LCC, and technical feasibility of the energy systems.
In the present study, the hourly weather data measured at the weather station of Helsinki-Vantaa airport was used [88]. The daily average ambient temperature and solar radiation are shown in Figure 6. The A2WHP seasonal coefficient of performance (SCOP) was assumed to vary between two to five depending on the ambient temperature [89].

2.5. Energy and Life Cycle Cost (LCC) Calculations

The main parameters analyzed were the CO2 emissions, purchased/imported electricity, and LCC for each case study. The techno-economic factors are of interest to the investors, building owners, and project owners [72], while the emissions are of special interest to the policy makers, stakeholders, and building owners.
The purchased electricity or imported electricity is calculated using Equation (1) [39]:
ENE = PVE-(HPE + AUXE),
where ENE is the imported electricity (IME) when it is negative, and exported electricity (EXE) when it is positive; PVE is the electricity produced by the photovoltaic. It was assumed that the PV had an efficiency of 15.37% [90] and a degradation rate of 0.7% each year, which is higher than the average degradation rate of 0.5% [91]. The degradation of the PV is included in the calculation because it can affect the electricity production by the PV during the life cycle, the life cycle cost, and the CO2 emissions reduction potential, as discussed in [92]. HPE is the electricity used by the heat pumps, AUXE is the sum of the backup heater, and pump electricity demands.
The life cycle cost is calculated using Equation (2) [39]:
LCC = CPV + CHPA + CHPW + CBT + CT + CBL + ∑n = 25 ef. CI. IME − ∑n = 25 ef. CE. EXE,
where LCC is the life cycle cost of the centralized heating system. This is a simplified method of calculating the LCC as the LCC includes the initial investments and operational costs for the 25 years. The calculations in this study did not consider whole life cycle calculations (i.e., cradle to grave concept) and only considered the economic life cycle of the system. In Equation (2), the CPV is the cost of the PV, CHPA is the A2WHP cost, CHPW is the GSHP, CBT is the borehole heat exchanger or borehole seasonal storage cost depending on the energy system type, CT is the short-term storage tank cost, and CBL is the building level cost based on Table 3 as explained in Section 2.5.1. The energy cost is also included in the LCC [54]. The CI is the imported electricity cost and CE is the exported electricity price earned while exporting electricity to the grid. The import electricity price used was 11.10 c/kWh (the price included the taxes and distribution cost) and the export electricity price used was 4.04 c/kWh [93], based on Nord Pool data of 2016. The discounting factor was defined as ef, which takes into account the electricity price escalation rate of 1% [93] and the interest rate of 3% [94]. No disposal and maintenance costs were included in the calculation [54]. It is possible that the system is not disposed of and will continue to operate after 25 years (after the maintenance). A similar method has also been used in earlier publications such as in [54,95].

2.5.1. Design Variables and Costs

The design variables selected for the study were the generation components, storage, and demand as they are the main parameters that can affect the performance of the energy system. The size of the components and values of the design variables were included to study the impact of the variables. The values of the design variables shown in Table 3 are based on the optimization results carried out in the study in [54]. Moreover, the values of the design variables for each case were selected so that the energy system was able to provide the space heating and domestic hot water at the desired temperature level, as mentioned in the Section 2.3.1. The values were close to each other for each case study in order to provide a close comparison between different cases. However, the values changed due to the requirement for each case to meet the desired temperature level of the demand. In addition, the investment cost for the design variables are also shown in Table 3. Most prices were variables based on the size of the components while some prices were constant. The prices of the components are reduced when the size of the components increased due to the economy of scale [3]. The building level costs included the cost of the building insulation and other onsite installation for energy efficiency [19] and the centralized community-level district heating energy system costs are shown separately. The energy system components and buildings were used as the design variable and parameter in all of the energy systems and the costs of the buildings were kept separate from the centralized energy system costs.

2.6. Emissions

District heating in Finland is mostly generated by using fossil fuel-based sources. Therefore, the emissions caused by the combustion of fossil fuel to generate and provide district heating to the buildings is around 176 kg CO2/MWh [28] in Finland. At the city level, waste to energy plants could play a significant role in producing heat energy. These waste to energy plants could assist in reducing the emissions from the city level district heating network, which were analyzed in a city level study [100]. The emissions in the district heating were relatively high compared to the electrical grid. The emissions from the district heating was used in the reference city-level energy system case and did not vary during the season. The emissions were calculated for the electricity, as this is the only commodity that is purchased to meet the demand of the proposed community-level energy systems that are being studied. Generally, the electricity grid in Finland has low emissions, because most of the electricity is produced by hydro, nuclear, and wind [101]. However, due to the variation in the demand during the year, the emissions also change in the grid because the energy mix changes depending on the season. With more combined heat and power plants and biomass/coal-based power plants used to meet the demand in winter, the emissions from the grid also change. The average monthly emission of the electrical grid from 2011 to 2015 is shown in Figure 7 [19,26]. The emissions are minimum in summer and maximum in winter due to the demand of heating in the extreme cold weather of the Nordic region. In the present study, electricity import and emission import were considered, however, the export of solar energy to the grid was not considered as a mitigation technique or compensation of emissions for the imported electricity. Due to the seasonal mismatch in the demand and solar energy availability, this study was undertaken to highlight how renewable sources can be utilized to mitigate and reduce the CO2 emissions from the building’s heating network at the community-level.

2.7. Renewable Energy Fraction

Renewable energy fraction was calculated to find out how much of the onsite demand is met by renewable energy sources [102]. The renewable energy fraction (REF) for heating is defined in Equation (3). The equation is derived to show the ratio between the renewable energy part used to provide heating to the community and the total heat demand of the community. The renewable energy fraction for heating is defined as [39] in Equation (3):
REF   = 1 TE SPH   +   DHW ,
where REF is the renewable energy fraction in%; TE is the total energy consumption by components such as heat pumps, pumps, and backup heaters in kWh; SPH is the space heating; and DHW is the domestic hot water in kWh.

3. Results and Discussion

The emissions reduction, economic analysis, and technical performance of the proposed systems were compared and discussed against each other in the following arrangement:
  • Case 0: Reference city-level district heating system.
  • Case 1: Centralized PV and GSHP-based community-level district heating system (PV + GSHP).
  • Case 2: Centralized PV and A2WHP-based community-level district heating system (PV + A2WHP).
  • Case 3: Centralized PV and heat pump-based community-level district heating system with seasonal storage (PV + A2W + GSHP + STR).

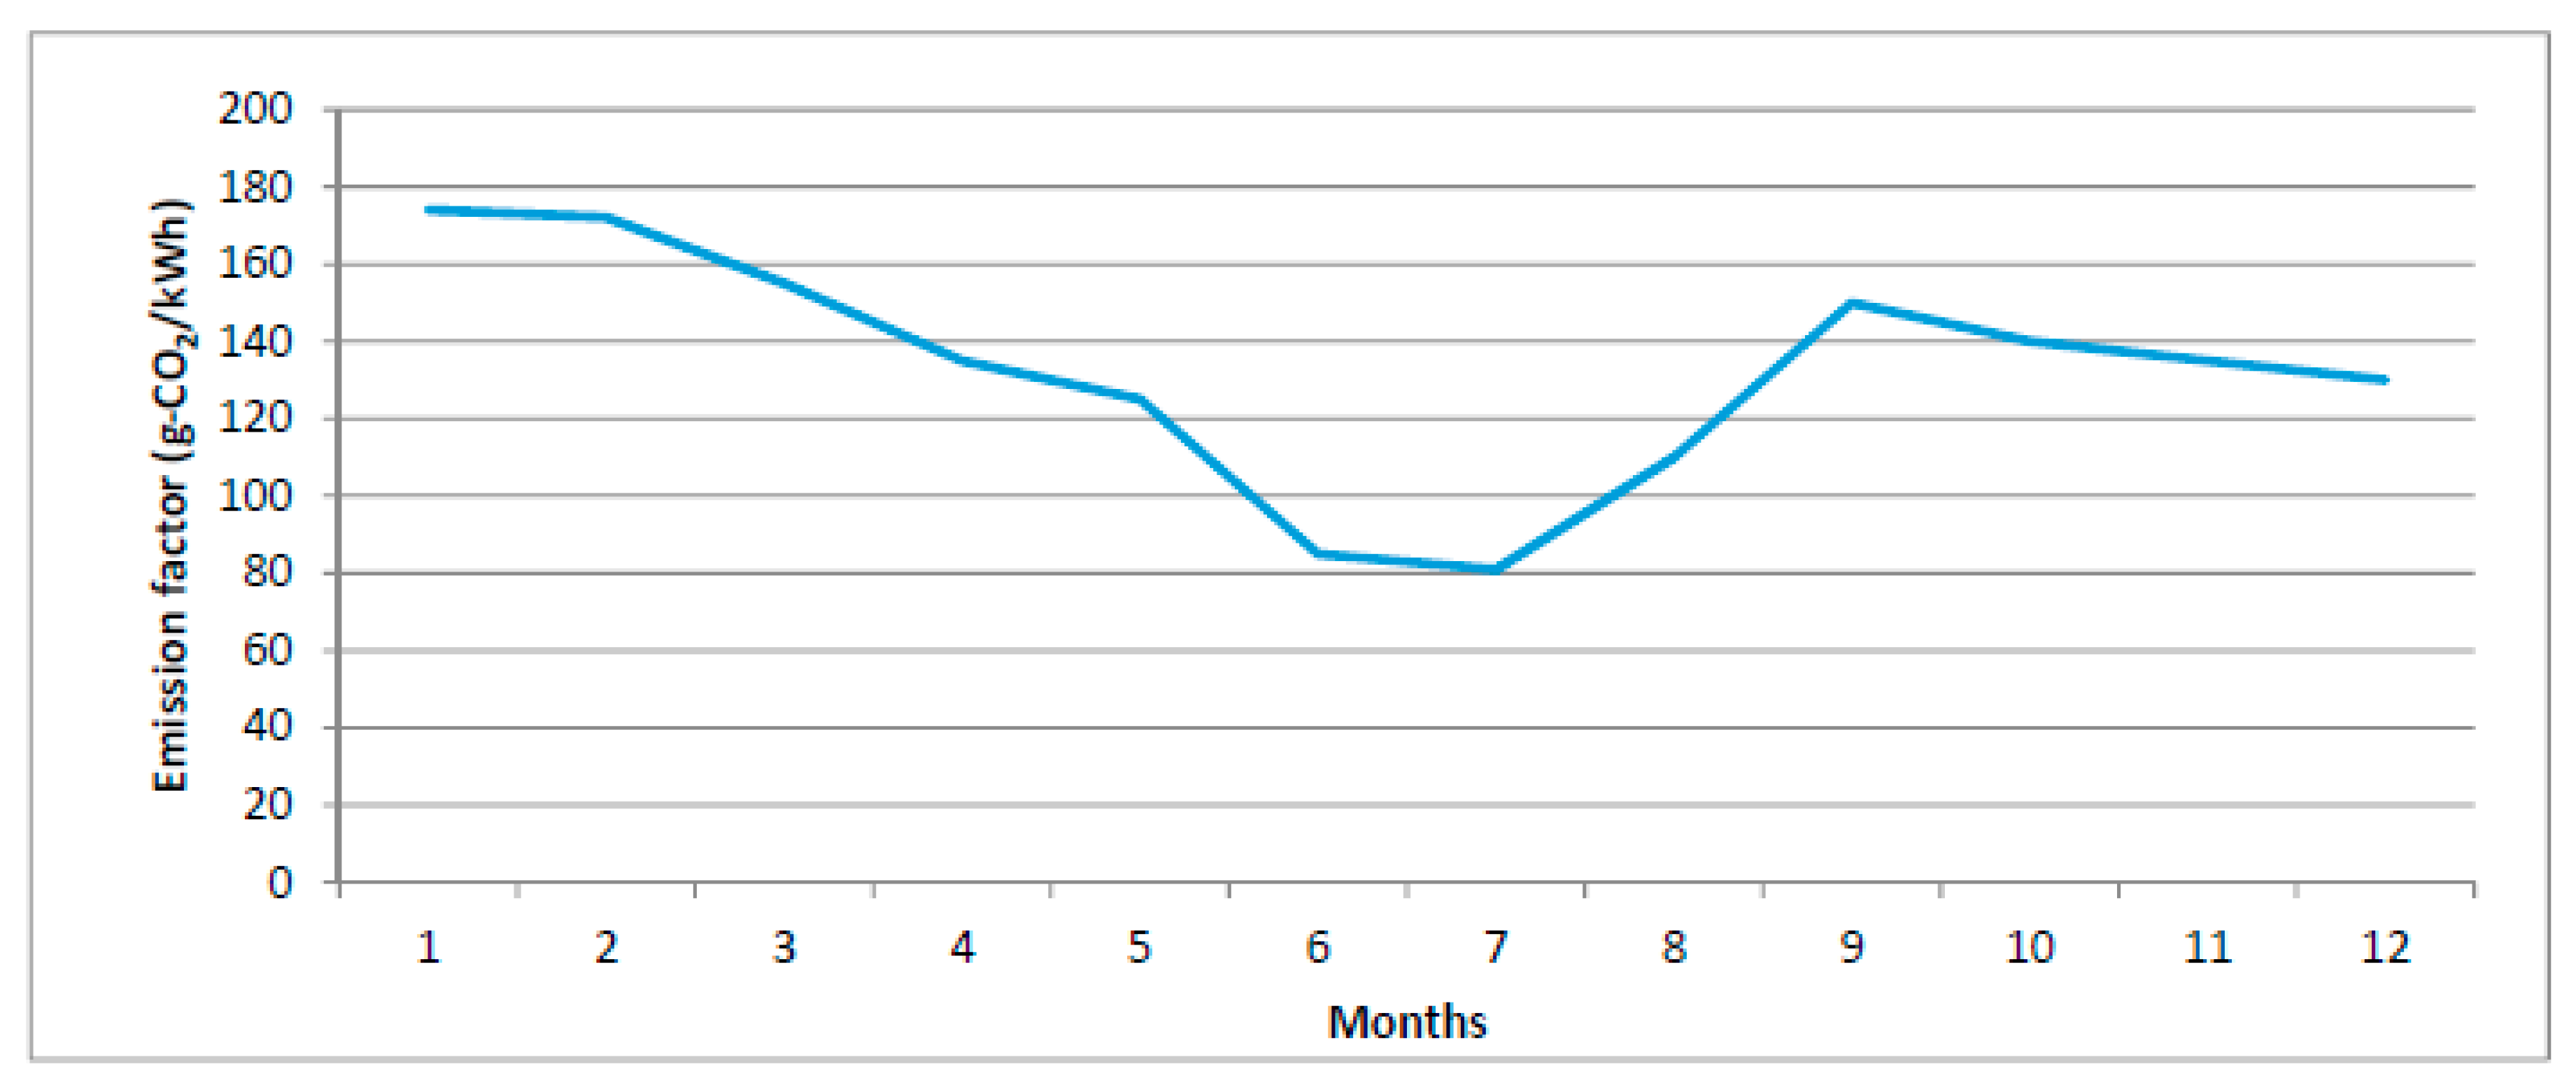
3.1. Reference Case 0: City-Level District Heating

The district heat demand, investments at building level, and emissions from the base case (case 0) scenario are shown in Figure 8. The x-axis of Figure 8 shows the type of building in each scenario. The OR is the original non-renovated reference case building, LR is the light renovated building, and DR is the deep renovated building. The y-axis shows the LCC, heating demand, and the emissions caused by the district heating network due to the demand by the buildings in the community. It can be observed in Figure 8 that the OR buildings in the community were cheap (blue bar in Figure 8) compared to the LR and DR buildings due to lower insulation levels, low ventilation heat recovery efficiency, and no onsite energy saving measures. Due to the low building energy efficiency, the heating demand (red bar in Figure 8) of the OR buildings in the community was high compared to the LR and DR buildings. Therefore, the emissions (green line in Figure 8) caused by the OR buildings in the community were large compared to the LR and DR buildings in the community. The results of the reference city-level district heating system were based on the earlier study carried out in [19].
In contrast, the DR buildings in the community were the most expensive compared to the LR and OR buildings, as shown in Figure 8 (blue bar). Although the DR buildings were expensive due to better insulation of the building, efficient heat recovery system, and onsite energy saving measures, the DR buildings had lower emissions and lower heat demand.
The reduction in the heat demand of the OR buildings was from 129 kWh/m2/yr to 52 kWh/m2/yr in the DR building scenario (red bar in Figure 8). The increase in the energy efficiency of the building and the reduction in the heat demand was around 60%. To achieve higher energy efficiency of the building, the investment cost of the OR increased from 77 €/m2 to 339 €/m2 in the DR scenario (blue bar in Figure 8) and the LCC increased from 339 €/m2 to 459 €/m2, respectively. The increase in the energy efficiency of the building caused a 77% increase in the onsite investments and 26% increase in the LCC at the building level. It can also be observed from Figure 8 (green bar) that by only improving the building efficiency and onsite energy performance improvement at the building level, the CO2 emissions caused by the buildings in the community, for instance, from the OR buildings, reduced from 34 kg CO2/m2/yr to 16 kg CO2/m2/yr in the DR scenario. The CO2 emissions were reduced from the OR building to the DR building by 53%, if investments were made at the building level to reduce the emissions caused by the heat demand. Figure 8 shows that through investments at the building level, the heat demand of the building could be reduced, which would ultimately reduce the emissions from the district heating.

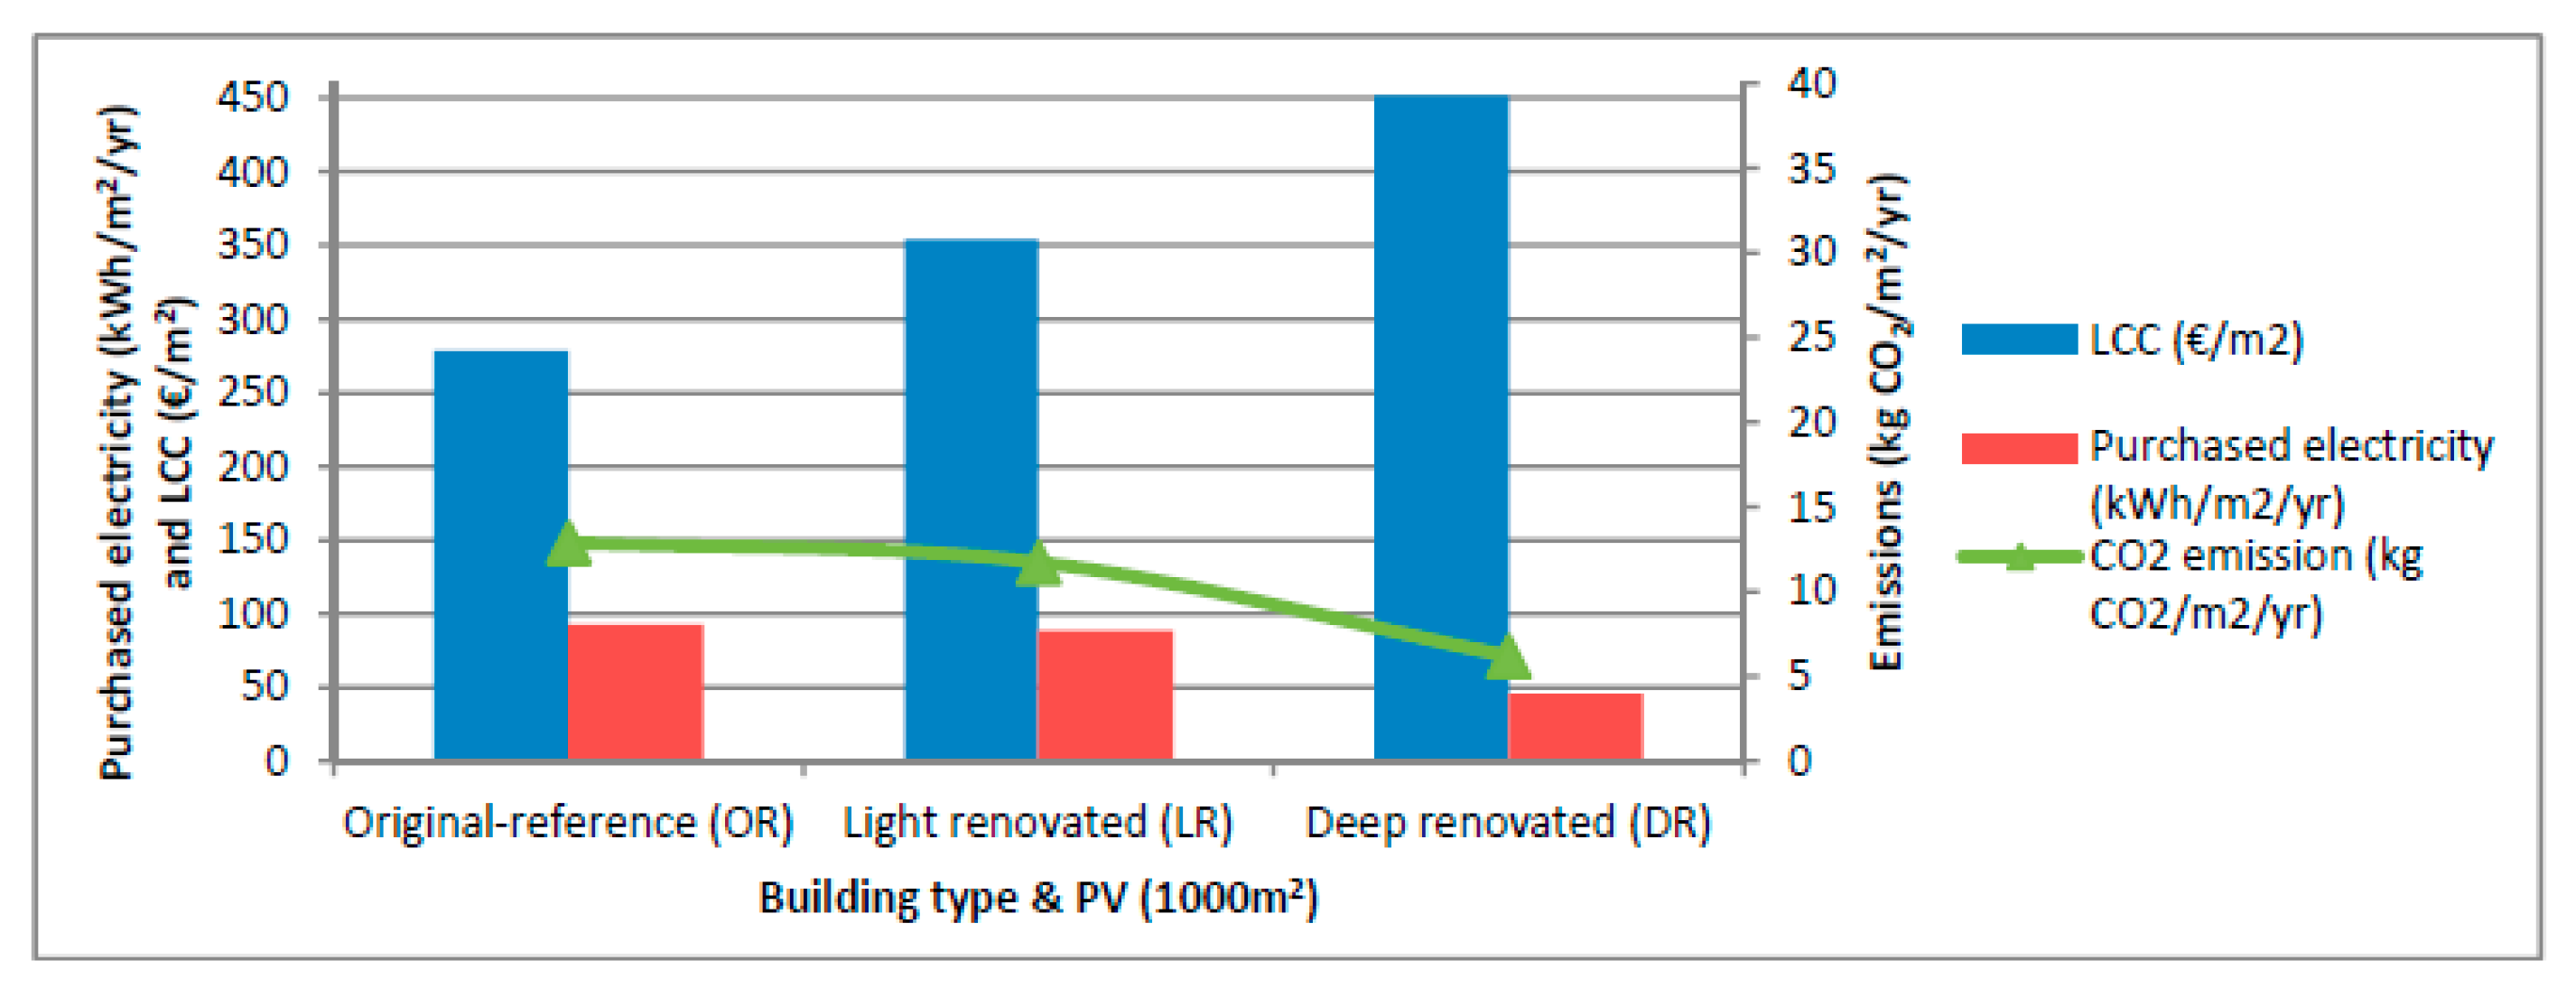
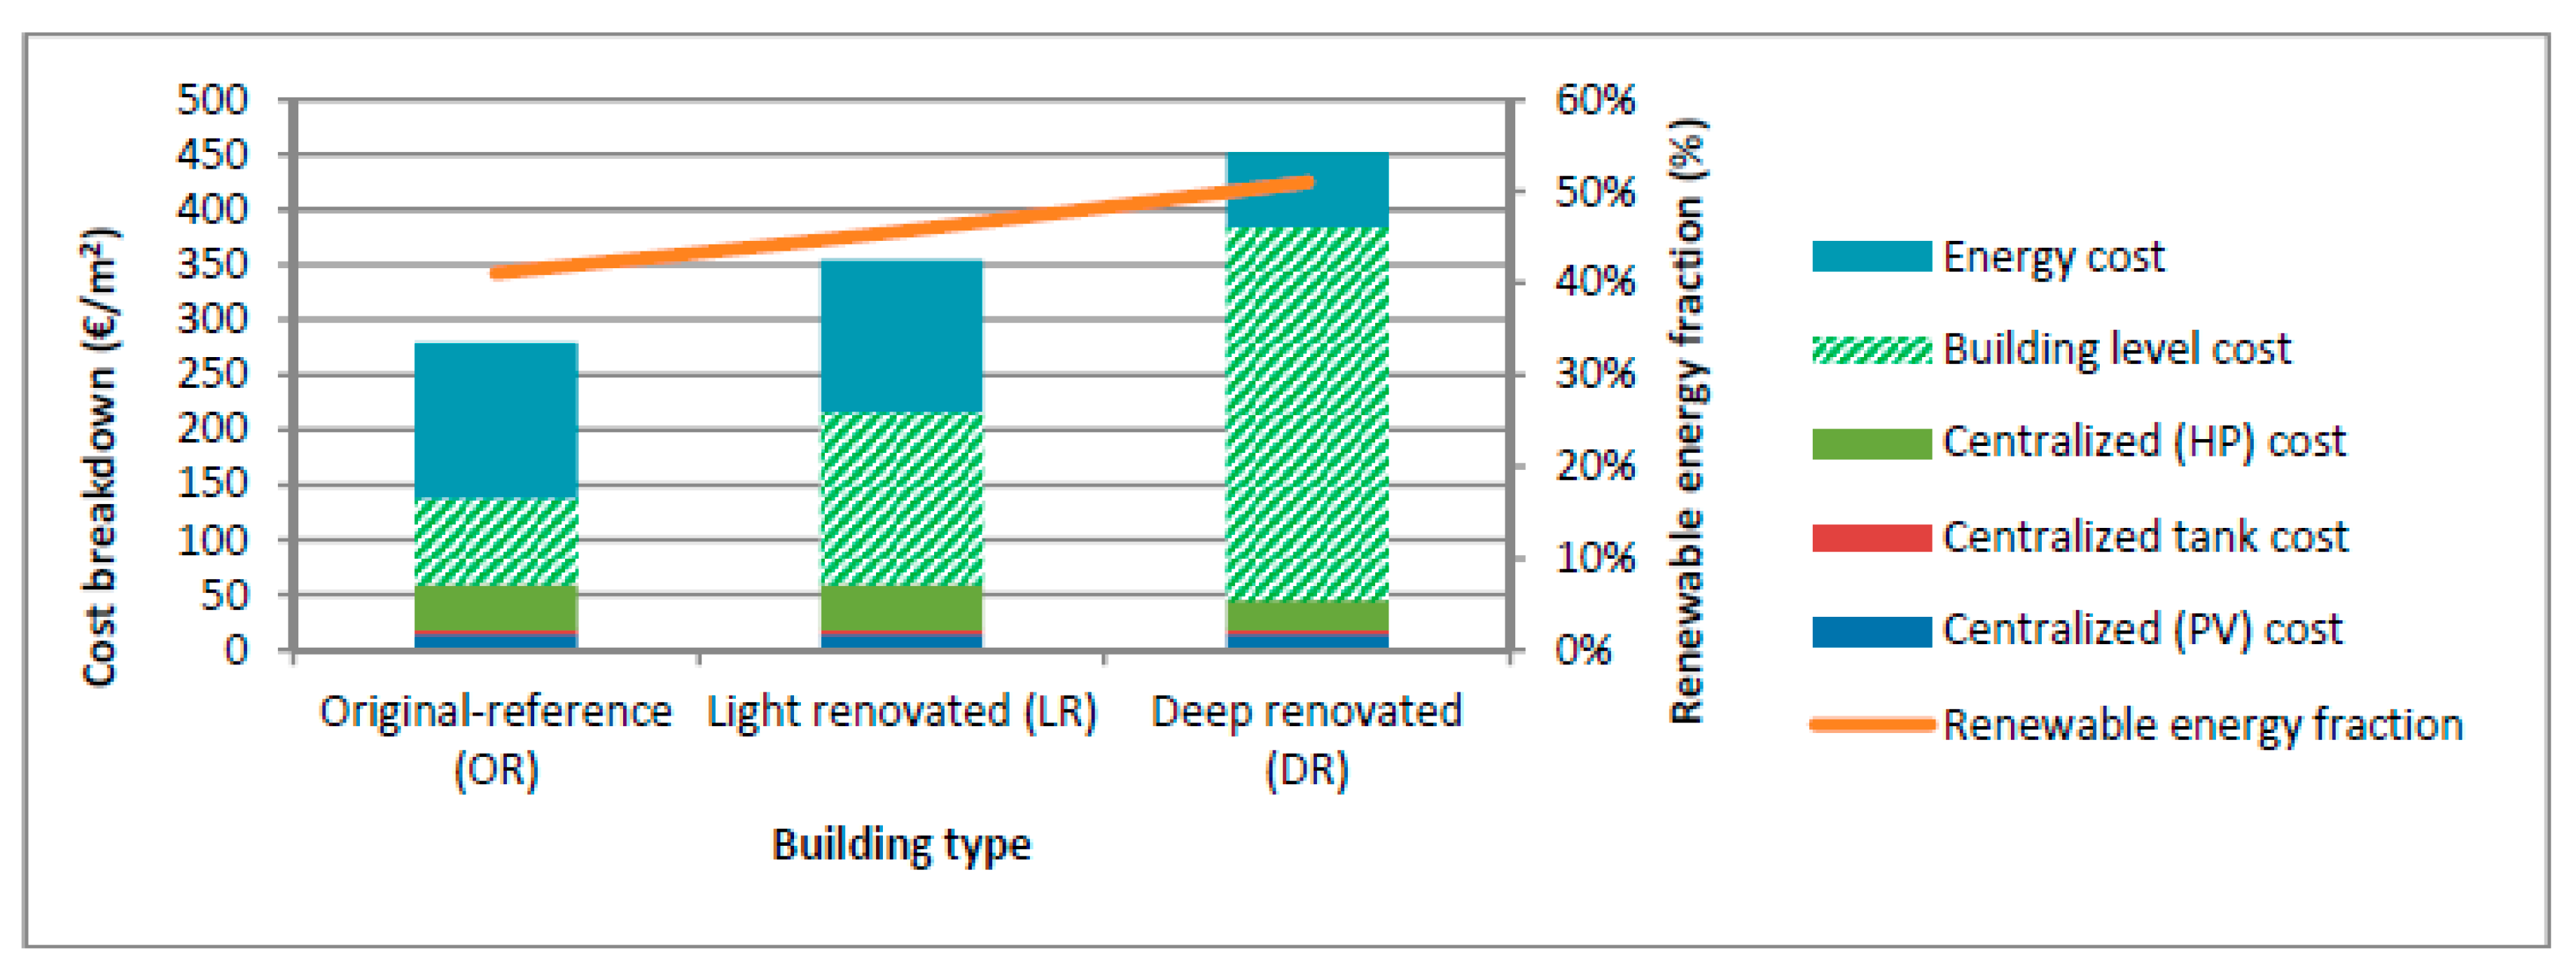
3.2. Case 1: Centralized PV and GSHP-Based District Heating System

The heat demand, LCC, and emissions from the centralized community-level energy system (Case 1) are shown in Figure 9. The x-axis of Figure 9 shows the type of building in each scenario. The y-axis shows the LCC, purchased electricity, and the emissions caused by the electricity import to meet the heat demand of the buildings in the community. In general, it can be observed that the centralized community-level district heating could meet the demand of the community at certain LCC and at certain emissions level.
It can be observed in Figure 9 that the LCC of the energy system with the OR building scenario in the community was low (blue bar in Figure 9) compared to the LR and DR buildings. The LCC of the energy system with the DR building scenario was high as the cost of the building was higher compared to the OR buildings, as shown in Figure 8. However, it was observed that the purchased electricity of the system (red bar in Figure 9) was low for the DR buildings compared to the OR buildings in the community. The purchased electricity was low for the DR buildings because the building energy efficiency was high compared to the OR buildings. Consequently, low energy is required to meet the energy demand of the DR buildings in the community. The CO2 emissions from the DR buildings were low compared to the OR buildings (green line in Figure 9) due to the low energy demand of the DR buildings and better energy efficiency, resulting in less purchased electricity.
The reduction in the purchased electricity from the grid by the centralized community-level energy system (Case 1) was around 50%, being from 94 kWh/m2/yr to 47 kWh/m2/yr if the OR buildings were renovated according to the DR scenario as shown in Figure 9. In Figure 9, the blue bar shows that the LCC of the energy system (Case 1) with OR buildings was 273 €/m2, which was lower compared to the DR buildings (i.e., around 452 €/m2). The increase in the LCC was around 65.5% when DR buildings were used instead of OR buildings. As a result, the emissions also varied as shown in Figure 9 as the green line. The emissions from the energy system (Case 1) with the OR buildings scenario were 13.1 kg CO2/m2/yr, which was reduced by 50% to 6.6 kg CO2/m2/yr if the buildings were renovated according to the DR scenario.
The breakdown of LCC and the renewable energy fraction of the energy system (Case 1) are shown in Figure 10. In general, it can be observed that the overall LCC of the centralized energy system and the building community was lower for the worst case scenario (OR buildings) and high for the best case (DR buildings) scenario.
Figure 10 shows that the major part of the LCC was on the buildings and the energy cost. However, the ratios of the costs were different for each scenario. In the OR building scenario, the building level cost was 28% of the total LCC, 19% of the LCC was the centralized energy system cost, and the energy cost of the LCC was around 53%. In the DR building scenario, the share of the building level cost, centralized energy system cost, and energy cost were 75%, 9%, and 16% of the total LCC, respectively. Moreover, it can be observed in Figure 10 that the OR buildings in the community could have a renewable energy fraction of around 40%, and increased to 50% if the buildings were renovated according to the DR scenario.

3.3. Case 2: Centralized PV and A2WHP-Based District Heating System

The heat demand, LCC, and emissions from the centralized community-level energy system (Case 2) scenario are shown in Figure 11. It can be observed in Figure 11 that the LCC of the energy system with the OR buildings in the community was low (blue bar in Figure 11) compared to the LR and DR buildings. The LCC of the energy system with the DR buildings in the community was high as the cost of the buildings was high compared to the OR buildings, as shown in Figure 8. However, it was observed that the purchased electricity of the system (red bar in Figure 11) was low for the DR buildings compared to the OR buildings. This phenomenon was also observed in Case 1 (see Figure 9). The reduction in the purchased electricity from the grid by the centralized community-level energy system (Case 2) when OR buildings are present in the community was around 51%, being from 93 kWh/m2/yr to 45 kWh/m2/yr if the buildings were renovated according to the DR scenario, as shown in Figure 11. Similar behavior was observed in Case 1 (Figure 9).
Figure 11 (blue bar) shows that the LCC of the energy system (Case 2) with OR buildings was 278 €/m2, which was lower compared to the DR buildings (i.e., around 451 €/m2). The increase in the LCC cost was around 62.2% when DR buildings were used in the centralized energy system (Case 2) instead of OR buildings in the community. As a result, the emissions also varied, as shown in Figure 11 (green line). The emissions from the energy system (Case 2) and OR building scenario were 12.9 kg CO2/m2/yr, which was reduced by around 51% to 6.2 kg CO2/m2/yr, if the buildings were renovated according to the DR scenario.
The breakdown of LCC and the renewable energy fraction of the centralized community-level energy system (Case 2) are shown in Figure 12. Figure 12 shows that the major part of the cost was on the buildings and the energy cost was similar to that of Case 1 (see Figure 10) and the difference in the cost ratio was small in Case 2 and Case 1. The building level cost was 28%, the centralized energy system cost was 21%, and the energy cost was 51% of the total LCC in the OR building scenario, as shown in Figure 12. On the other hand, the building level cost was 75%, the centralized energy system cost was 10%, and the energy cost was 15% of the total LCC, as shown in Figure 12. Moreover, the renewable energy fraction varied from 41% to 51%.

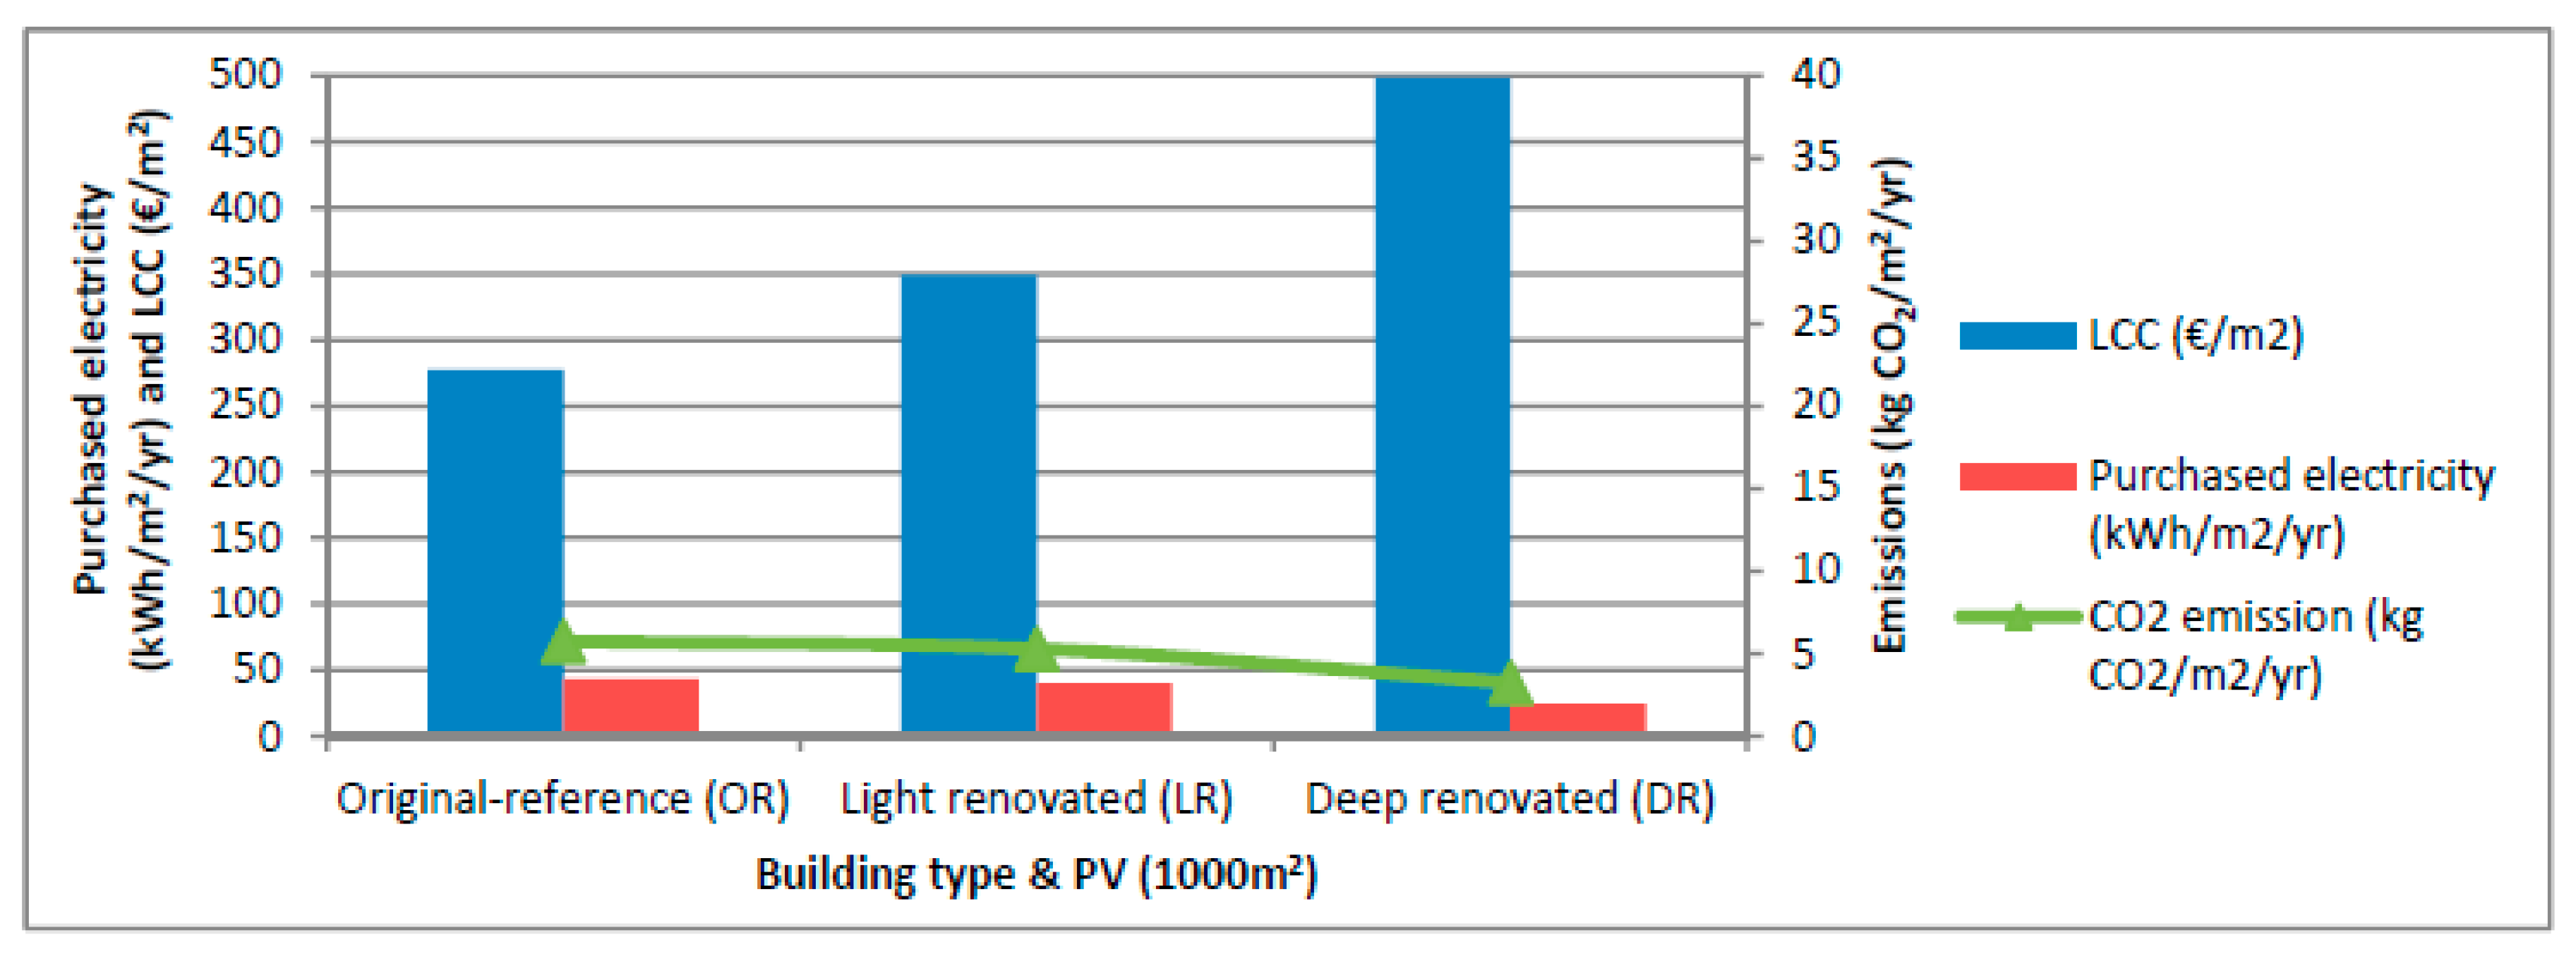
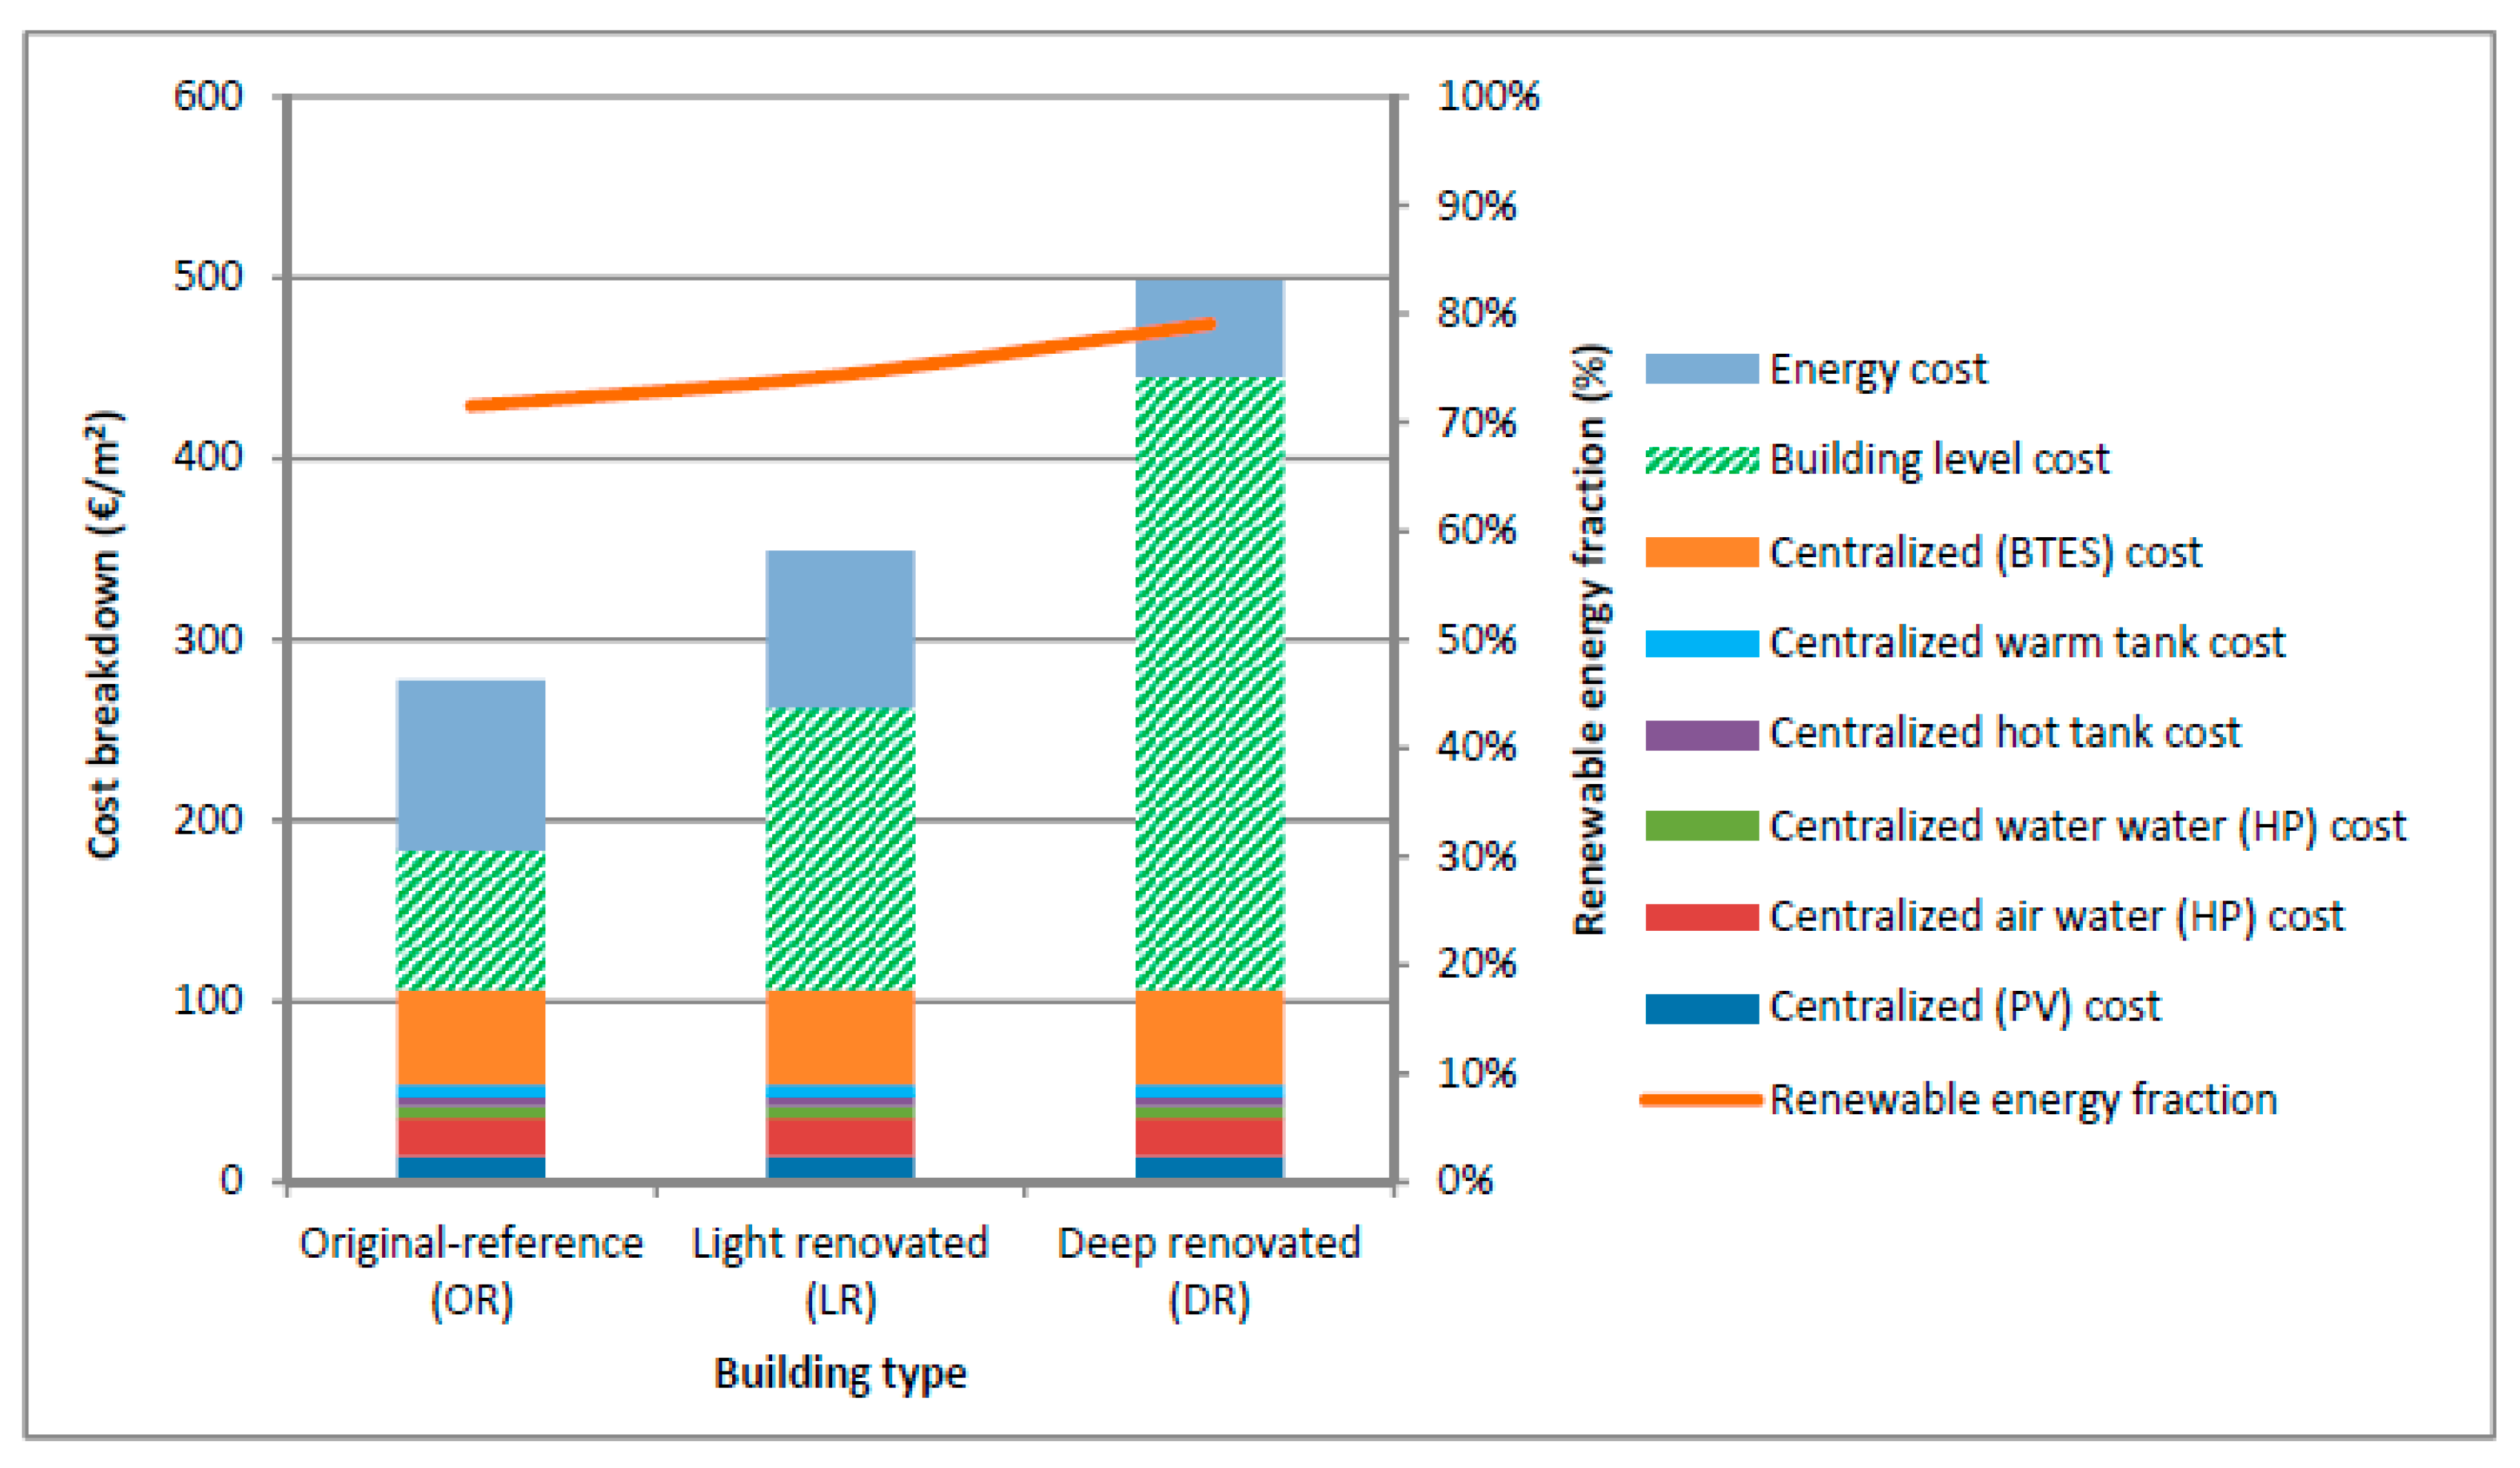
3.4. Case 3: Centralized PV and HP-Based District Heating System with Seasonal Storage

The heat demand, LCC, and emissions from the centralized community-level energy system (Case 3) scenario are shown in Figure 13. The reduction in the purchased electricity from the grid by the centralized community-level district heating energy system (Case 3) was around 46.5%, being from 43 kWh/m2/yr to 23 kWh/m2/yr, if the OR buildings were renovated according to the DR scenario. In addition, it was found that the centralized community-level energy system with seasonal storage (Case 3) performed better than the centralized community-level energy system without seasonal storage (Cases 1 and 2). For instance, it was found that the OR buildings in the community integrated with the centralized energy system with seasonal storage (Case 3, Figure 13) had 54% lower purchased electricity consumption compared to the same OR buildings in the community integrated with the centralized energy system without seasonal storage (Case 2, Figure 11). Similarly, it was observed that the DR buildings in the community integrated with the centralized energy system with seasonal storage (Case 3, Figure 13) had 51% lower purchased energy compared to the same DR buildings in the community integrated with the centralized energy system without seasonal storage (Case 2, Figure 11).
Figure 13 shows that the LCC of the community-level energy system (Case 3) was 277 €/m2 when integrated with the OR buildings, which was similar to that of Case 1 and Case 2 with similar non-renovated (OR) buildings. In the case with the DR building integrated with the energy system (Case 3), the LCC was 498 €/m2. The LCC was higher compared to Case 1 and Case 2 with the DR buildings in the community. It was also observed in Figure 13 that with the higher LCC of Case 3 compared to Case 1 and Case 2, the technical performance of Case 3 was better compared to that of Case 1 and Case 2 in terms of lower emissions and lower purchased electricity. The emissions reduced from 13.1 kg CO2/m2/yr in Case 1 to 5.7 kg CO2/m2/yr in Case 3 when non-renovated (OR) buildings were present in the community. When the buildings were deep renovated (DR), the emissions were reduced from 6.69 kg CO2/m2/yr in Case 1 to 3.22 kg CO2/m2/yr in Case 3. Similarly, compared to the city level district heating connected with the OR building, the emissions were reduced from 34 kg CO2/m2/yr to 3.22 kg CO2/m2/yr in Case 3 with DR buildings.
The breakdown of the LCC and the renewable energy fraction of the centralized community-level energy system (Case 3) are shown in Figure 14. When comparing Case 1 and Case 2, it was observed in Figure 14 that a large part of the cost was the seasonal storage cost, which was not so in Case 1 and Case 2. In Case 1 and Case 2, there was no seasonal storage, due to which the centralized energy system cost was lower in those cases, compared to Case 3. By integrating seasonal storage, the energy cost was reduced to 94 €/m2 in the community-level energy system (case 3) integrated with non-renovated buildings (as shown in Figure 14) compared to Case 1 and Case 2 where the energy cost was 144 €/m2 and 141 €/m2, respectively, with similar non-renovated buildings. The energy cost could be further reduced to 53 €/m2 in community-level energy system (case 3) when it was integrated with deep renovated buildings (as shown in Figure 14). The energy cost in Case 1 and Case 2 was 71 €/m2 and 67 €/m2, respectively, when DR buildings were integrated with these community-level energy systems. Moreover, it was observed in Figure 14 that the OR buildings in the community can have a renewable energy fraction of around 70% when integrated with the centralized energy system (Case 3). This renewable energy fraction can be increased to 80% in Case 3 for the scenario where renovation is done at the building level to reach DR buildings in the community. This fraction is also higher compared to Case 1 and Case 2 with similar deep renovated buildings in the community-level energy systems.

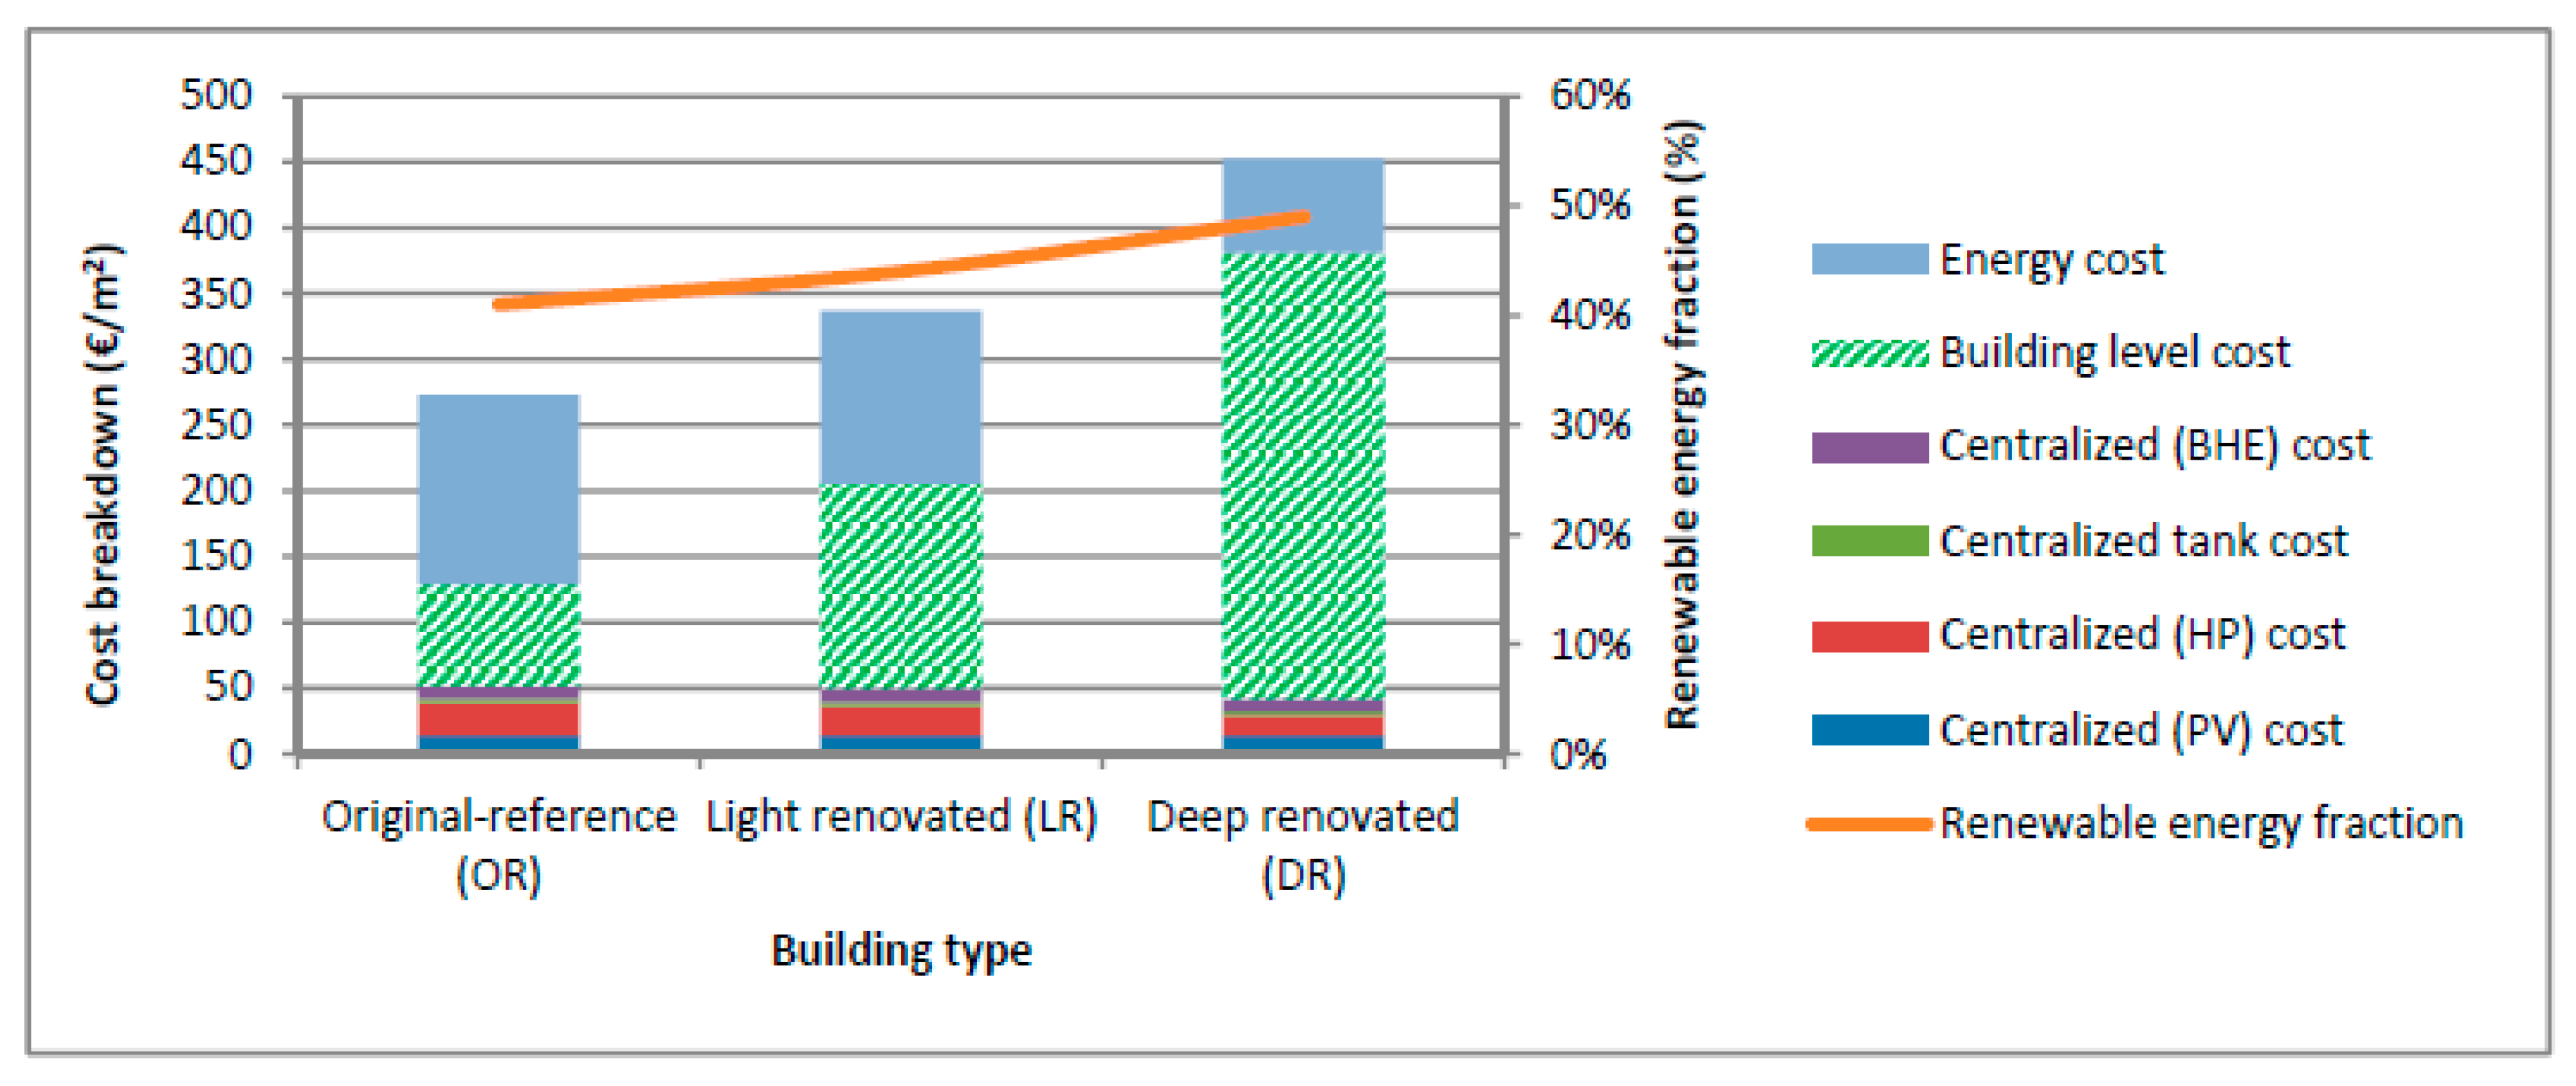
3.5. Comparison of the Emissions and Costs between the Energy Systems

Table 4 shows the comparison of the emissions and costs between the proposed centralized community-level district heating systems (Cases 1, 2, and 3) and reference city-level district heating system (Case 0) for the old residential buildings. It was found that when OR buildings in the community were integrated with the district heating system (Case 0), the emissions were high. The emissions could be significantly reduced by up to 60% when the OR buildings were integrated with either of the centralized PV + heat pump-based district heating systems (Cases 1 and 2). Furthermore, the emissions can be additionally reduced by up to 83% if the OR building community is integrated with the centralized PV + heat pump-based district heating with seasonal storage (Case 3). This shows that the emissions from the city-level district heating can be significantly reduced by using community-level renewable-based district heating systems and utilizing seasonal storage. Overall, it shows that to reach the EU Commission [103] and Finland’s national targets of 2050 [7], reducing the emissions from the energy systems, and in particular from the district heating networks, can be achieved by using novel energy systems for the community.
It was found in Table 4 that the maximum relative reduction in the non-renovated (OR) buildings in the community reached by the development of the renewable-based community-level energy system (Case 3) was 83% compared to the reference city-level district heating. This community-level energy system (Case 3) consists of PVs integrated with the A2WHP, GSHP and seasonal storage. The investment cost of the community-level energy system (Case 3) was 106 €/m2 and the total investment including the building level cost was 183 €/m2. The change in the energy system reduced the emissions compared to the reference Case 0, and the emissions reduction cost increased to 3.74 €/kg CO2/yr. However, the LCC was reduced by 18% when the city-level energy system (Case 0) was replaced by the proposed community-level energy system (Case 3) with the non-renovated (OR) buildings in the community. The maximum relative reduction in the deep renovated (DR) buildings in the community connected with the novel community-level energy system (Case 3) was 80%, as shown in Table 5, when compared to the similar type of the OR buildings connected with the reference city-level district heating (Case 0). The investment costs on this community-level energy system (Case 3) was around 106 €/m2 and the total investment cost including the building level cost was around 445 €/m2. When the DR buildings in the community connected with the reference city-level district heating (Case 0) were replaced by the proposed community-level energy system (Case 3), this increased the emissions reduction cost to 8.21 €/kg CO2/yr.
Compared to the city-level district heating connected with the non-renovated (OR) buildings in the community (in Table 4), the maximum emissions reduction in the deep renovated (DR) buildings connected with the community-level energy system (Case 3) was 91% (in Table 5). As the buildings in this situation were deep renovated, the building level cost increased from 77 €/m2 (OR) to 339 €/m2 (DR). In addition, the community-level energy system cost was 106 €/m2. The overall LCC increased from 339 €/m2 to 498 €/m2 when the buildings were DR and connected with the community-level energy system (Case 3) when compared to the OR buildings connected with the reference city-level district heating (Case 0). As a result, the emissions reduction costs increased to 11.9 €/kg CO2/yr.
Figure 15 also gives an overall comparison between Case 0 with the OR buildings and Case 3 with DR buildings in the community based on the emissions, emissions reduction cost, life cycle cost, purchased energy cost, and total investment cost. It was observed that Case 3 with DR buildings had higher investments compared to Case 0 with OR buildings. However, the purchased energy cost was significantly lower in Case 3 with DR buildings compared to Case 0 with the OR buildings. Moreover, the emissions were significantly lower in Case 3 with DR buildings compared to Case 0 with OR buildings. As a result, the emissions reduction cost of Case 3 with DR buildings was high. This shows that Case 3 with DR buildings can significantly reduce the emissions from the buildings in the community and the purchase of electricity, however, the emissions reduction cost would increase in this case.
However, when Table 4 and Table 5 were compared against each other, a few other outcomes were observed, which are as follows:
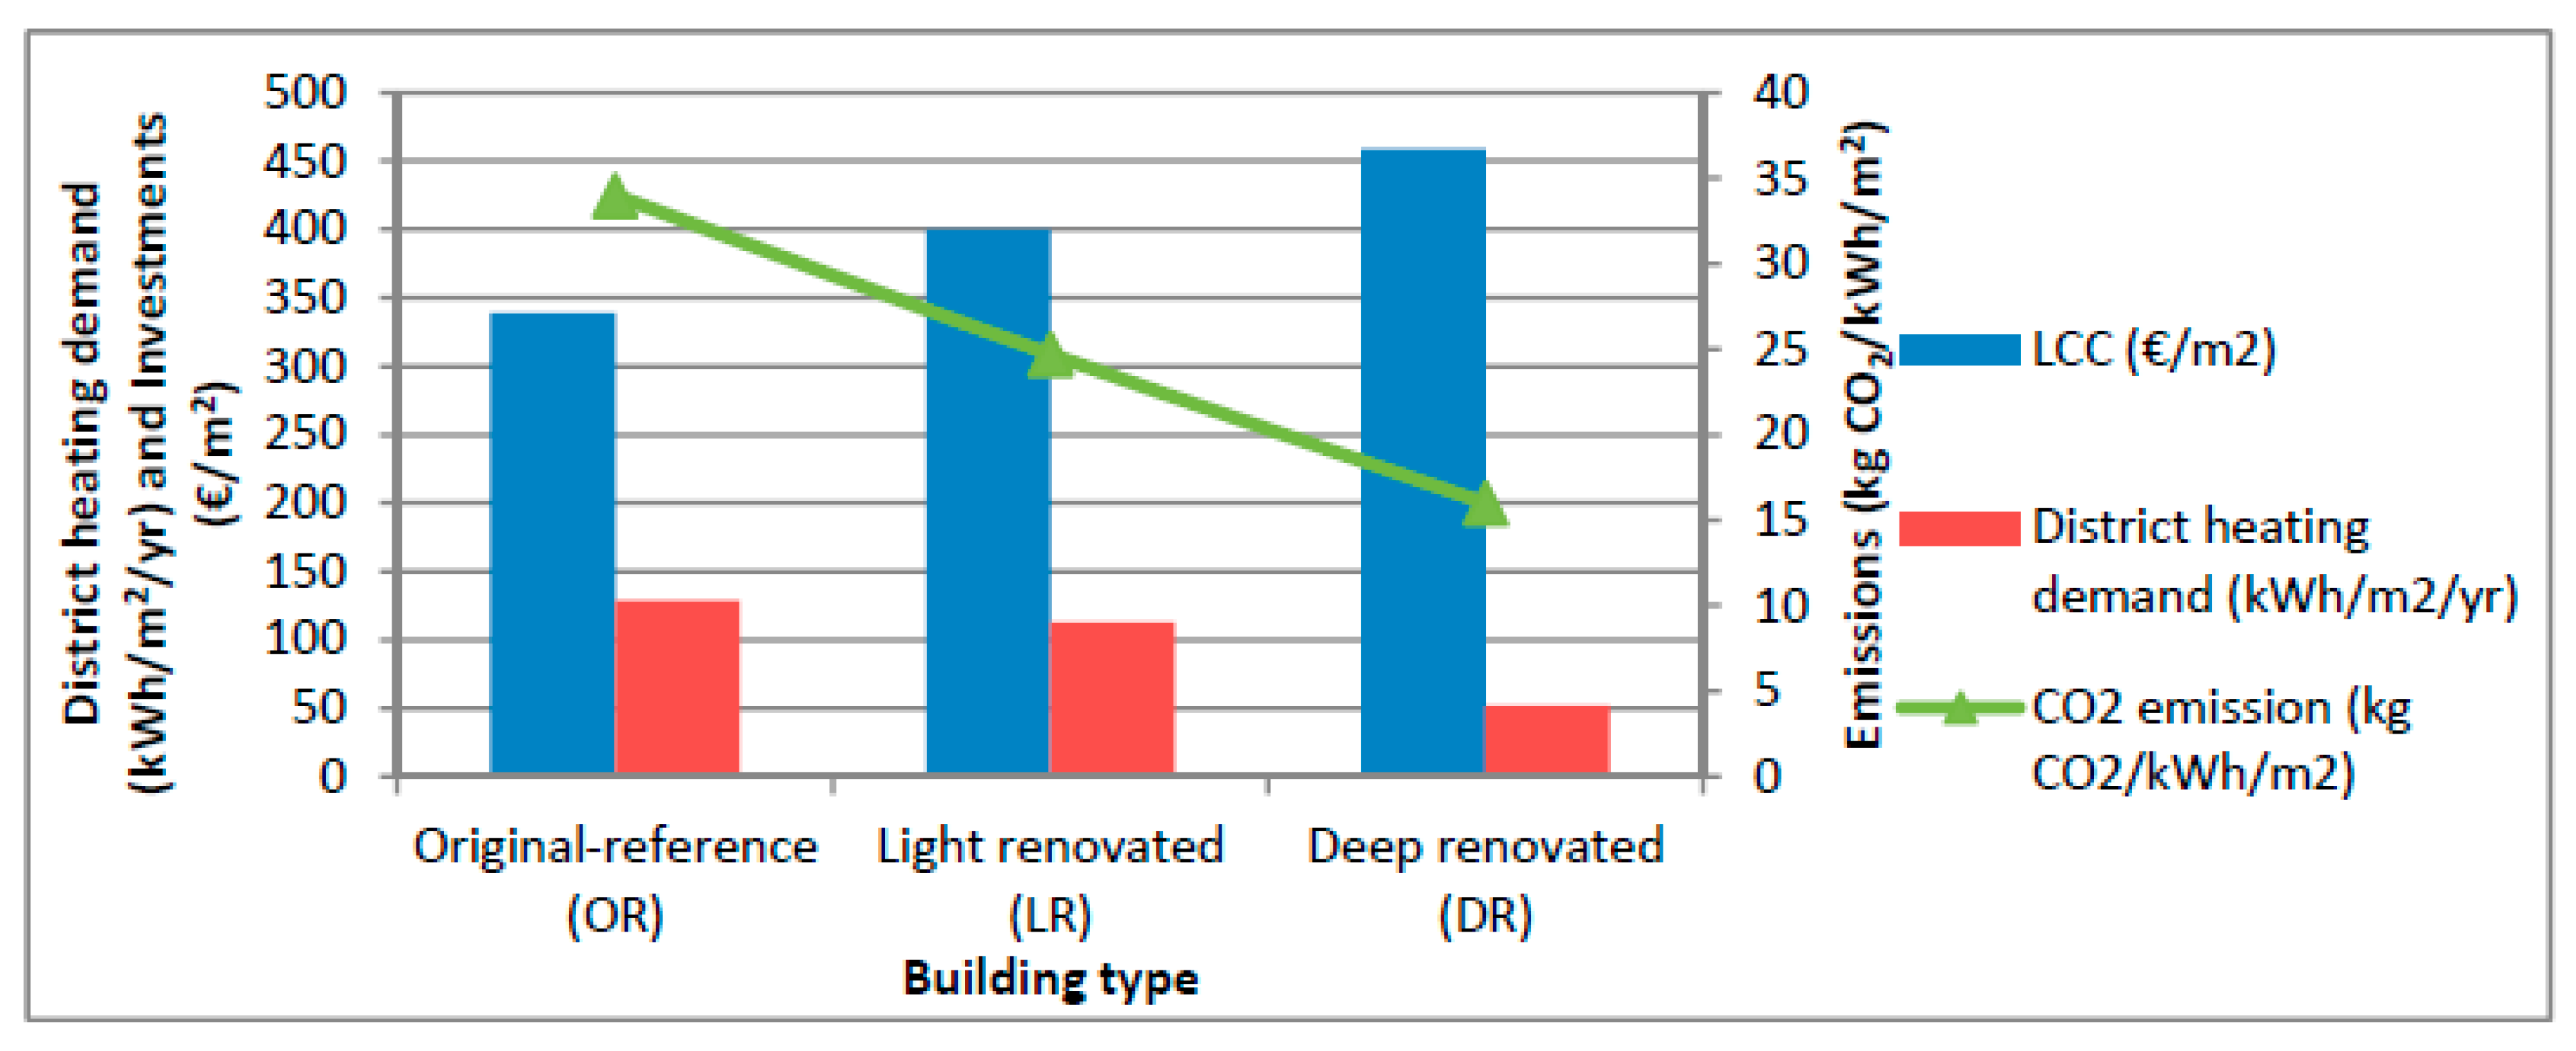
  • First, in the reference city-level district heating system (Case 0), by investing only in the renovation of the original reference building (OR) in order to reach the deep renovated (DR) building level, the CO2 emissions were reduced by 53%. These emissions can be reduced by only investing at the building level, with no investment on the centralized renewable-based district heating system for the community.
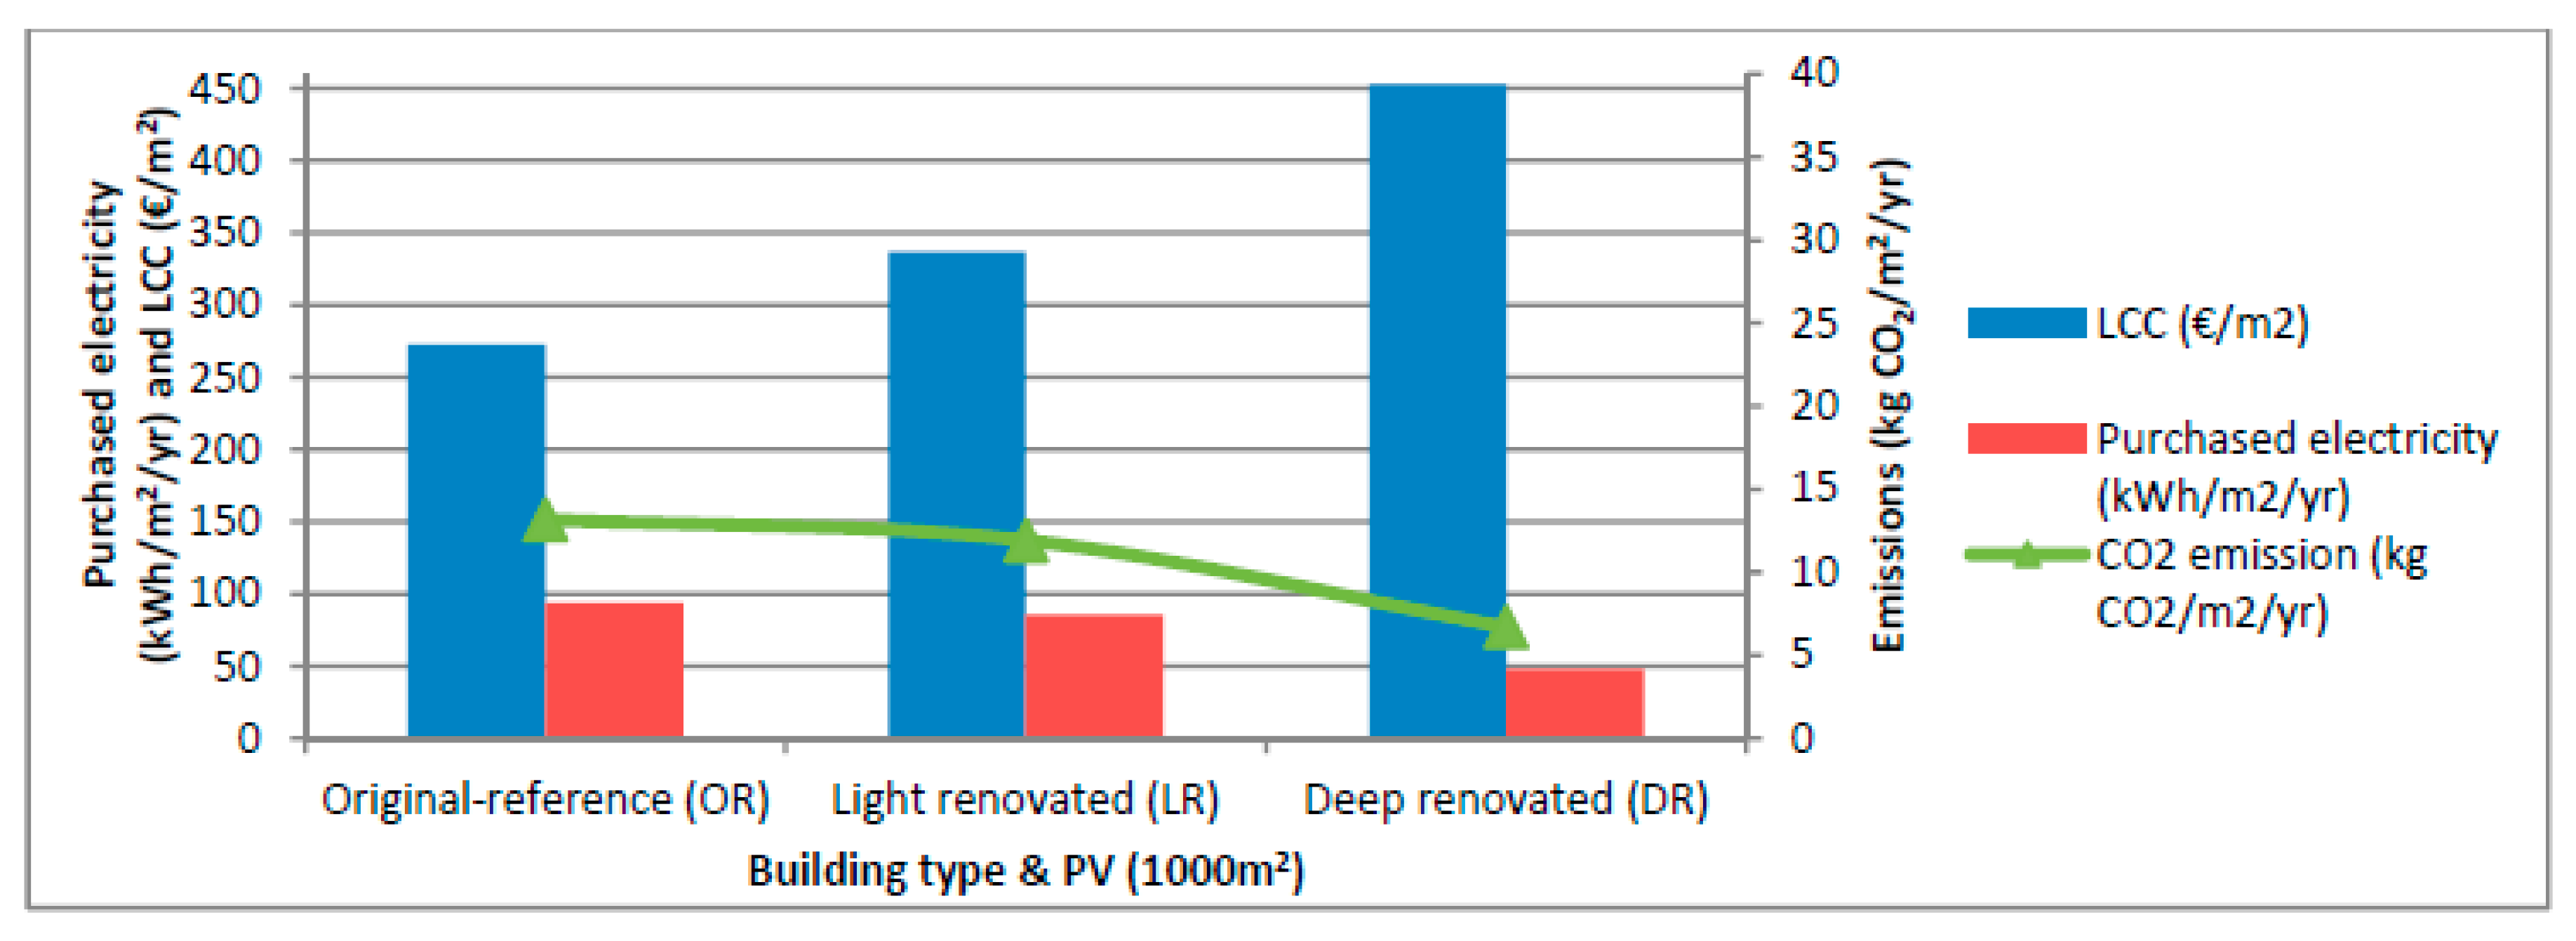
  • Second, in the reference district heating system (Case 0) in the OR building scenario, the purchased energy cost was significant, with an overall 77% of the life cycle cost. This can be reduced to 34% when the centralized solar PV + A2W + GSHP + STR-based district heating system (Case 3) is connected with similar OR buildings in the community. Moreover, the purchased energy cost can be further reduced to 11% when the centralized solar PV + A2W + GSHP + STR-based district heating system (case 3) is used with deep renovated (DR) buildings in the community.
  • Third, when the OR or DR types of old buildings are used in the district, the emissions can be reduced significantly by investing in the centralized renewable-based district heating systems (Cases 1, 2, and 3). However, the share in the investments are different depending on the building types (i.e., if the buildings are OR type, the investment share on the buildings is low, however, the imported energy costs are high. On the other hand, when the DR type of building forms the community with centralized renewable-based district heating systems (Cases 1, 2, and 3), the share of the building level costs are high, however, the imported energy costs are reduced significantly when compared to the OR type of the buildings in the community.
  • Fourth, the emissions reduction cost varied from 2.48 €/kg CO2/yr to 8.21 €/kg CO2/yr, depending on the centralized energy system case. Overall, the cost changed by 82% for the total investments in order to reduce a kilogram of CO2 emissions from the heating network of old buildings in the community.
  • Finally, compared to the reference district heating system (Case 0) integrated with OR old buildings in the community, the emissions can be reduced by 91% when the centralized PV + heat pump-based district heating system with seasonal storage (Case 3) is used along with the deep renovated (DR) old buildings in the community. This would change the share or percentage of investments at the building level and the centralized energy system.
It is also important to note that by investing in by adding additional material at the building level, for instance, in terms of insulation material for better energy efficiency, the embodied carbon footprint of the material also increases. A study carried out by Sudip et al. [104] showed that the embodied carbon footprint of the building can be large in energy efficient optimal solutions. A case study carried out in Finnish conditions showed that the embodied carbon footprint of the building material was only around 28% to 39% of the total life cycle footprint, while the rest of the carbon footprint was the operational or the emissions caused by the import of energy from the grid. However, in the present study, the scope was limited to the operational carbon footprint of the buildings in the community and the energy systems. Therefore, it is suggested to consider the embodied carbon footprint caused by the renovation of the proposed old apartment buildings in the community in future study. Another aspect that could be studied experimentally under Nordic conditions is the degradation of PVs during the life cycle as it can affect the performance of the PV. With the reduction in the performance of the PV, the operational cost could increase and the CO2 emissions reduction potential of the PV could decrease, as discussed by Pramod et al. [92]. In the present study, the economic and environmental performance comparisons were carried out between the city-level district heating network and the PV + heat pump-based community-level energy systems. Other technologies such as biomass, wind turbines, waste to energy, or gas-based energy systems [35] could be compared in future work to analyze the cost and environmental performance of the other energy systems for heating, in order to provide a broader analysis.

4. Conclusions

Three different PV and heat pump-based centralized community-level district heating systems for an old apartment building community were designed and simulated under Nordic climatic conditions. The three proposed energy systems were compared against the reference city-level district heating system. The criteria used for the comparisons were CO2 emissions, LCC, purchased electricity, and renewable energy fraction. The design variables used consist of the energy system components and the energy renovation level of the buildings. A summary of the important outcomes of the study are described below:
  • Generally, the three proposed centralized community-level district heating systems (Cases 1, 2, and 3) outperformed the reference city-level district heating system (Case 0) integrated with the old apartment buildings in terms of emissions, purchased energy, and renewable energy fraction in the Nordic climate.
  • The centralized PV-based district heating system with seasonal storage (Case 3) performed better in terms of emissions, technical performance, and renewable energy fraction compared to the centralized PV and GSHP-based district heating system (Case 1) and also compared to the centralized PV and A2WHP-based district heating system (Case 2). However, the LCC increased for Case 3 compared to Cases 1 and 2.
  • The centralized PV and HP-based district heating system with seasonal storage (Case 3) was able to reduce the emissions from the original reference (OR) buildings in the community from 34 kg CO2/m2/yr to 5.7 kg CO2/m2/yr when the reference city-level district heating system (Case 0) was changed. Moreover, this change reduced the relative emissions by 83% and the emissions reduction cost was 3.74 €/kg CO2/yr. The results show that the utilization of seasonal storage can have a positive impact in emissions reduction from the district heating.
  • The centralized PV and HPs-based district heating system with seasonal storage (Case 3) is able to reduce the emissions from the deep renovated (DR) buildings in the community from 16 kg CO2/m2/yr to 3.1 kg CO2/m2/yr when the reference city-level district heating system (Case 0) was changed. Moreover, this change reduced the relative emissions by 80% and the emissions reduction cost was 8.21 €/kg CO2/yr.
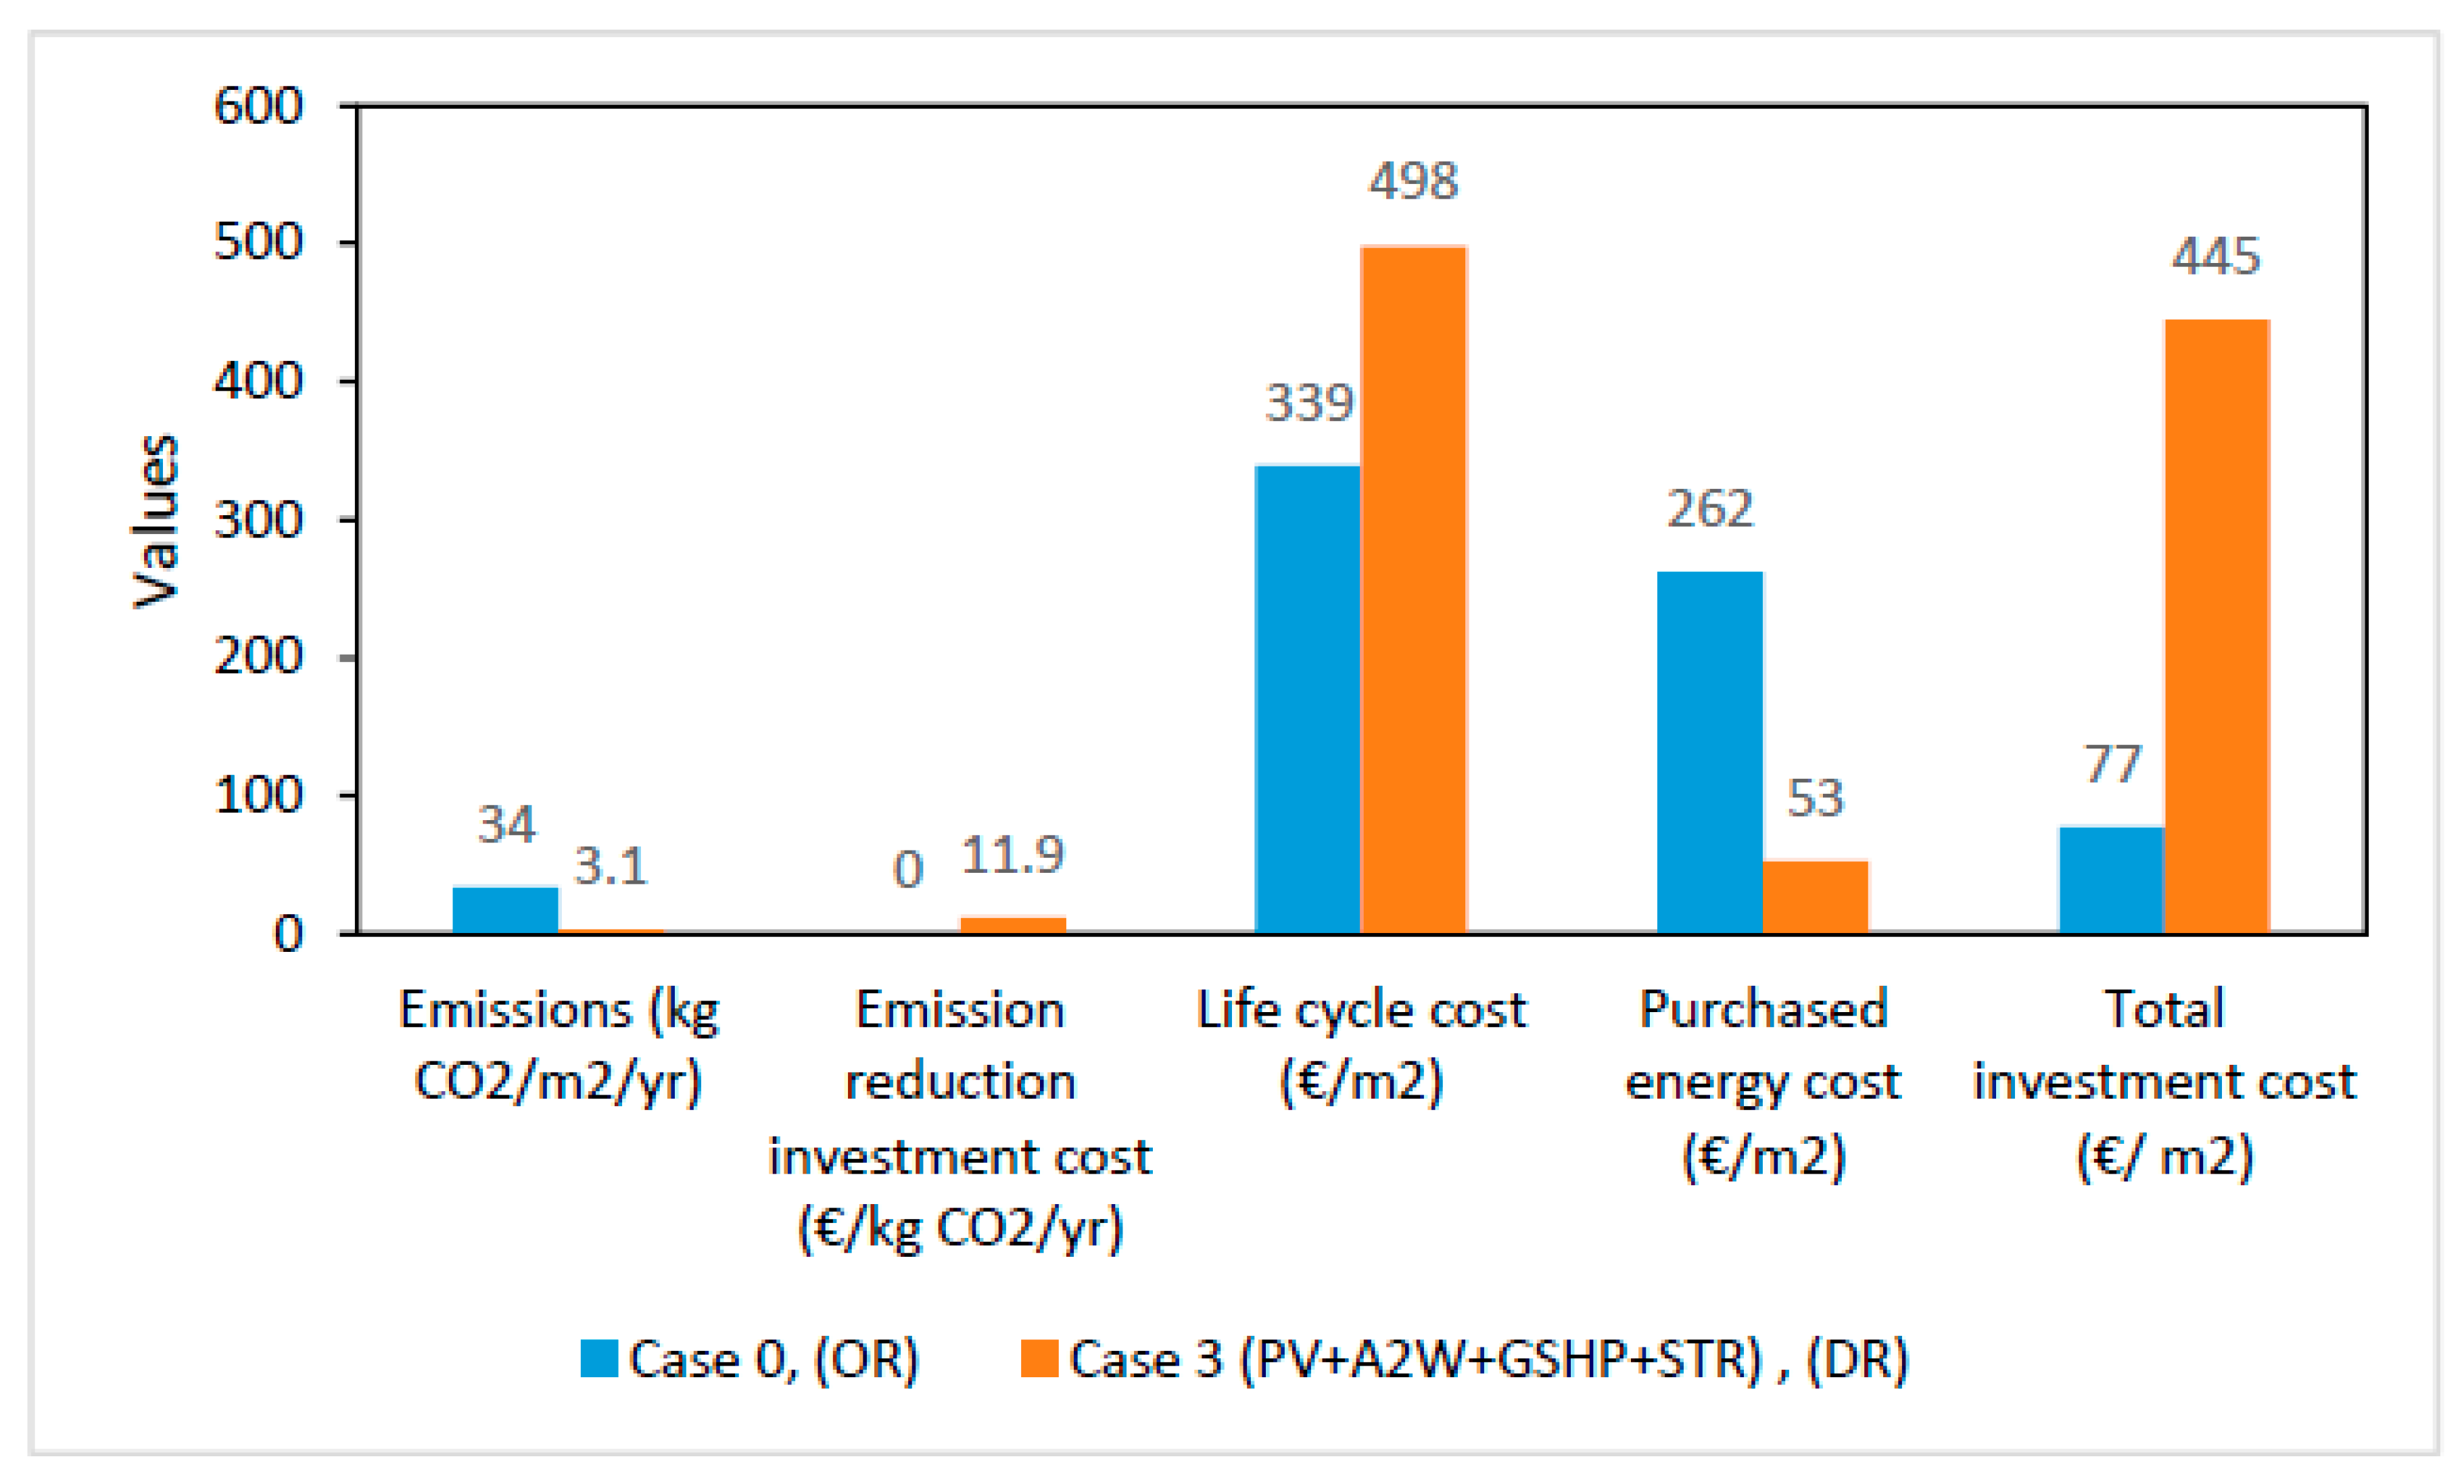
  • When original buildings (OR) connected with the city-level district heating system (Case 0) was deep renovated (DR) and the city-level district heating system (Case 0) was replaced by the best community-level energy system (Case 3), the emissions were reduced from 34 kg CO2/m2/yr to 3.1 kg CO2/m2/yr. As a result, the relative emissions were reduced by 91% and the emissions reduction cost was 11.9 €/kg CO2/yr. This shows that in some cases, it can be expensive to reduce a kilogram of CO2 emissions. Certainly, high investment cases resulted in better techno-economic performance (i.e., reduced purchase electricity, imported energy cost, and CO2 emissions).
  • In terms of the renewable energy fraction for heating, the centralized PV and HP-based district heating system with seasonal storage (Case 3) was able to reach 80% when integrated with the deep renovated (DR) building community. On the other hand, the renewable energy fraction for heating was around 50% with the other proposed community-level energy systems (Cases 1 and 2).
The simulation study showed that the emissions from the present state-of-the-art district heating network can be reduced in Finnish conditions by renovating the building and using building level solutions. However, the study also revealed that investing in the centralized PV and HP-based district heating system could assist in further reducing the emissions from the district heating network. This would ultimately assist in achieving the EU Commission’s emissions target and the national emissions targets. Moreover, with the integration of seasonal storage, the self-utilization of the renewable sources can be increased. Seasonal storage is needed in cold climatic conditions, for example, in Northern Europe and North America because of seasonal mis-match between the demand and generation. Seasonal storage would be able to reduce not only the purchased electricity from the grid, but could also help in reducing the carbon dioxide emissions from the district heating networks.
The proposed study can be applied in real world or at the demonstration site in Nordic or cold climatic conditions. Countries in Northern Europe and Northern America could benefit from such systems. The renovation at the building level is indeed beneficial in terms of emissions, however, the problem of emissions still exists at the district and energy system-level and the amount of purchased energy from the grid is large. The emissions can be reduced from the grid by investing at the building level. However, the emissions from the grids can further be reduced by investing in district-level or community-level renewable-based centralized energy systems. This approach would also allow for a reduction in the purchased energy from the grid in addition to the benefits in terms of emissions reduction. Nevertheless, this would challenge the present status quo because most of the energy systems are designed at the city-level with hierarchy control, which has to be disintegrated at the district-level, with more control at the district-level rather than at the city-level. This approach would introduce smart controls of the district energy systems and better management of the energy systems. Moreover, this would encourage integration of localized renewable energy generation sources, with better controls and integration of storage onsite, rather than virtual storage.
In order to design and market such energy systems and communities, new policies and business models are needed. The policies and business models should be designed to promote more liberal energy markets, where the communities can decide to use and integrate sustainable energy sources nearby and the excess energy can be stored and shared to neighboring communities. These policies would enable the production of carbon neutral districts with reduced energy cost and higher efficiency, which would ultimately tackle the climate change issue at large. Moreover, this would create new business models for the future energy market scenario. For instance, the EU’s emissions trading system could be used to build and finance such systems. However, the unit cost of the CO2 emission reduction was high for the proposed energy systems in this study, if compared against the current EU CO2 emission allowances, which is around 25 €/ton CO2 (in 2020). Additional financial support at the investment level would be needed if such systems are built to trade and compensate for the emissions. Nevertheless, this would need further study in terms of renewable and storage technologies, information technologies, policy, and market strategies.
With an increase in the interest and utilization of renewable energy sources, the costs of such technologies are decreasing with time. Therefore, in the future, the cost factor would also affect the decision-making, and the sensitivity of cost can be included in the study. The present study can be beneficial for the companies, policy builders, and stakeholders who would act as the enablers in designing future renewable-based energy systems in terms of policies, technologies, and businesses.

Author Contributions

Conceptualization, H.u.R., J.H., J.J., R.K., and K.S.; Data curation, H.u.R., J.H., J.J., and R.K.; Formal analysis, H.u.R., J.H., J.J., R.K., and K.S.; Funding acquisition, R.K.; Investigation, H.u.R. and J.J.; Methodology, H.u.R., J.H., and J.J.; Project administration, J.J. and R.K.; Resources, R.K.; Software, H.u.R.; Supervision, J.J., R.K., and K.S.; Validation, H.u.R., J.H., and J.J.; Visualization, H.u.R. and J.H.; Writing—original draft, H.u.R.; Writing—review & editing, H.u.R., J.H., J.J., and R.K. All authors have read and agreed to the published version of the manuscript.

Funding

This research was funded by the Academy of Finland under grant number: 309064, the ‘RenewFin’ and ‘FinEst Twins’ project co-funded by European Union (Horizon 2020 program, grant number 856602) and the Estonian government at Aalto University, and by the Academy of Finland, under grant number: 314325, ‘Smart Energy Transition (SET)—Realizing its potential for sustainable growth for Finland’s second century’ project at VTT Technical Research Center, Finland. The APC was funded by Aalto University, Finland.

Acknowledgments

The authors would like to thank the VTT Technical Research Center of Finland for providing the resources, technical, and administrative support.

Conflicts of Interest

The authors declare no conflicts of interest. The funders had no role in the design of the study; in the collection, analyses, or interpretation of data; in the writing of the manuscript, or in the decision to publish the results.

References

  1. European Commission. 2030 Climate & Energy Framework. 2018. Available online: https://ec.europa.eu/clima/policies/strategies/2030_en (accessed on 1 April 2020).
  2. European Commission. 2050 Long-Term Strategy. 2018. Available online: https://ec.europa.eu/clima/policies/strategies/2050_en (accessed on 2 December 2019).
  3. Rehman, H.U. Techno-Economic Performance of Community Sized Solar Heating Systems in Nordic Conditions; Aalto University; Aalto-yliopisto: Helsinki, Finland, 2018. [Google Scholar]
  4. European Parliament. “Directive 2010/31/EU of the European Parliament and of the Council on the Energy Performance of Buildings,” 2010. Available online: https://eur-lex.europa.eu/LexUriServ/LexUriServ.do?uri=OJ:L:2010:153:0013:0035:en:PDF (accessed on 2 July 2019).
  5. Moore, T.; Horne, R.; Morrissey, J. Zero emission housing: Policy development in Australia and comparisons with the EU, UK, USA and California. Environ. Innov. Soc. Transit. 2014, 11, 25–45. [Google Scholar] [CrossRef]
  6. Statistics Finland. “Energy Supply and Consumption,” 2018. Available online: http://tilastokeskus.fi/til/ehk/2018/04/ehk_2018_04_2019-03-28_tie_001_en.html (accessed on 10 July 2019).
  7. Ministry of the Environment. Finland, “National Climate Change Policy,” 19 March 2019. Available online: https://www.ym.fi/en-US/The_environment/Climate_and_air/Mitigation_of_climate_change/National_climate_policy (accessed on 2 June 2019).
  8. European Commission. “Clean Energy for All Europeans Package,” 27 January 2020. Available online: https://ec.europa.eu/energy/en/topics/energy-strategy-and-energy-union/clean-energy-all-europeans (accessed on 5 May 2020).
  9. Pohoryles, D.; Maduta, C.; Bournas, D.; Kouris, L. Energy performance of existing residential buildings in Europe: A novel approach combining energy with seismic retrofitting. Energy Build. 2020, 223, 110024. [Google Scholar] [CrossRef]
  10. Chadiarakou, S.; Santamouris, M. Field survey on multi-family buildings in order to depict their energy characteristics. Int. J. Sustain. Energy 2014, 34, 271–281. [Google Scholar] [CrossRef]
  11. Holopainen, R.; Milandru, A.; Ahvenniemi, H.; Häkkinen, T. Feasibility Studies of Energy Retrofits–Case Studies of Nearly Zero-energy Building Renovation. Energy Procedia 2016, 96, 146–157. [Google Scholar] [CrossRef] [Green Version]
  12. Gagliano, A.; Nocera, F.; Patania, F.; Moschella, A.; DeTommaso, M.; Evola, G. Synergic effects of thermal mass and natural ventilation on the thermal behaviour of traditional massive buildings. Int. J. Sustain. Energy 2014, 35, 411–428. [Google Scholar] [CrossRef]
  13. Jradi, M.; Veje, C.; Jorgensen, B.N. A dynamic energy performance-driven approach for assessment of buildings energy Renovation—Danish case studies. Energy Build. 2018, 158, 62–76. [Google Scholar] [CrossRef]
  14. Niemelä, T.; Kosonen, R.; Jokisalo, J. Cost-optimal energy performance renovation measures of educational buildings in cold climate. Appl. Energy 2016, 183, 1005–1020. [Google Scholar] [CrossRef]
  15. Zannis, G.; Santamouris, M.; Geros, V.; Karatasou, S.; Pavlou, K.; Assimakopoulos, M.N. Energy efficiency in retrofitted and new museum buildings in Europe. Int. J. Sustain. Energy 2006, 25, 199–213. [Google Scholar] [CrossRef]
  16. European Commission. “Energy Performance of Buildings,” 2014. Available online: https://ec.europa.eu/energy/en/topics/energy-efficiency/energy-performance-of-buildings/overview (accessed on 10 January 2020).
  17. Publications Office of the EU. “CORDIS Results Pack on Deep Renovation,” 2018. Available online: https://op.europa.eu/en/publication-detail/-/publication/7726dd32-f6b1-11e8-9982-01aa75ed71a1/language-en/format-PDF/ (accessed on 3 August 2020).
  18. Sekki, T.; Airaksinen, M.; Saari, A. Effect of energy measures on the values of energy efficiency indicators in Finnish daycare and school buildings. Energy Build. 2017, 139, 124–132. [Google Scholar] [CrossRef]
  19. Hirvonen, J.; Jokisalo, J.; Heljo, V.J.; Kosonen, R. Towards the EU emissions targets of 2050: Optimal energy renovation measures of Finnish apartment buildings. Int. J. Sustain. Energy 2018, 38, 649–672. [Google Scholar] [CrossRef] [Green Version]
  20. Kuusk, K.; Kalamees, T.; Maivel, M. Cost effectiveness of energy performance improvements in Estonian brick apartment buildings. Energy Build. 2014, 77, 313–322. [Google Scholar] [CrossRef]
  21. Paiho, S.; Hedman, Å.; Abdurafikov, R.; Hoang, H.; Sepponen, M.; Kouhia, I.; Meinander, M. Energy saving potentials of Moscow apartment buildings in residential districts. Energy Build. 2013, 66, 706–713. [Google Scholar] [CrossRef]
  22. Statistics of Finland (OSF). “Buildings and Free-Time Residences,” 2018. Available online: http://www.stat.fi/til/rakke/2018/rakke_2018_2019-05-21_kat_002_en.html. (accessed on 25 October 2019).
  23. Henning, H.-M.; Palzer, A. A comprehensive model for the German electricity and heat sector in a future energy system with a dominant contribution from renewable energy technologies—Part I: Methodology. Renew. Sustain. Energy Rev. 2014, 30, 1003–1018. [Google Scholar] [CrossRef]
  24. Nord Pool, A.S. Day-Ahead Market Prices. Available online: https://www.nordpoolgroup.com/Market-data1/#/nordic/map (accessed on 15 November 2019).
  25. Yle News. Surprise Rise in Helsinki Carbon Emissions, Coal Main Culprit, 2017. Available online: https://yle.fi/uutiset/osasto/news/surprise_rise_in_helsinki_carbon_emissions_coal_main_culprit/9996445 (accessed on 20 September 2019).
  26. Finnish Energy Industries. “District Heating 2017,” 2017. Available online: https://www.slideshare.net/energiateollisuus/district-heating-2017-118279094 (accessed on 12 August 2019).
  27. Finnish Energy. “Energy Year 2018-District Heating,” 2019. Available online: https://energia.fi/en/news_and_publications/publications/energy_year_2018_-_district_heating.html#material-view (accessed on 25 June 2019).
  28. Motiva. “CO2 Emissions Factors for District Heating,” 2017. Available online: https://www.motiva.fi/ratkaisut/energiankaytto_suomessa/co2-laskentaohje_energiankulutuksen_hiilidioksidipaastojen_laskentaan/co2-paastokertoimet (accessed on 23 June 2019).
  29. Stanford University: Global Climate and Energy Project (GCEP). “Exergy Flow Charts,” 2017. Available online: http://gcep.stanford.edu/research/exergycharts.html (accessed on 18 December 2018).
  30. Ryberg, D.S.; Caglayan, D.G.; Schmitt, S.; Linßen, J.; Stolten, D.; Robinius, M. The future of European onshore wind energy potential: Detailed distribution and simulation of advanced turbine designs. Energy 2019, 182, 1222–1238. [Google Scholar] [CrossRef]
  31. Malico, I.; Pereira, R.N.; Gonçalves, A.C.; Sousa, A.M.O. Current status and future perspectives for energy production from solid biomass in the European industry. Renew. Sustain. Energy Rev. 2019, 112, 960–977. [Google Scholar] [CrossRef]
  32. Dastjerdi, B.H.; Strezov, V.; Kumar, R.; Behnia, M. An evaluation of the potential of waste to energy technologies for residual solid waste in New South Wales, Australia. Renew. Sustain. Energy Rev. 2019, 115, 109398. [Google Scholar] [CrossRef]
  33. Martínez-Jaramillo, J.E.; Van Ackere, A.; Larsen, E.R. Towards a solar-hydro based generation: The case of Switzerland. Energy Policy 2020, 138, 111197. [Google Scholar] [CrossRef]
  34. Kozarcanin, S.; Hanna, R.; Staffell, I.; Gross, R.; Andersen, G.B. Impact of climate change on the cost-optimal mix of decentralised heat pump and gas boiler technologies in Europe. Energy Policy 2020, 140, 111386. [Google Scholar] [CrossRef] [Green Version]
  35. Kumar, N.M.; Mathew, M. Comparative life-cycle cost and GHG emission analysis of five different water heating systems for residential buildings in Australia. Beni-Suef Univ. J. Basic Appl. Sci. 2018, 7, 748–751. [Google Scholar] [CrossRef]
  36. Epp, B. “Denmark: New Solar District Heating World Record,” 26 January 2017. Available online: https://www.solarthermalworld.org/content/denmark-new-solar-district-heating-world-record (accessed on 10 October 2019).
  37. Pihlakivi, E. Potential of Solar Energy in Finland-Research for Solar Leap, 2015. Available online: https://www.theseus.fi/bitstream/handle/10024/104483/Emma_Pihlakivi.pdf?sequence=1 (accessed on 29 November 2019).
  38. Lindfors, A.; Riihelä, A.; Aarva, A.; Latikka, J.; Kotro, J. Auringonsäteily Helsingin Östersundomissa; Unigrafia: Helsinki, Finland, 2014. [Google Scholar]
  39. Rehman, H.U.; Hirvonen, J.; Sirén, K. Performance comparison between optimized design of a centralized and semi-decentralized community size solar district heating system. Appl. Energy 2018, 229, 1072–1094. [Google Scholar] [CrossRef]
  40. Schmidt, T.; Mangold, D.; Müller-Steinhagen, H. Central solar heating plants with seasonal storage in Germany. Sol. Energy 2004, 76, 165–174. [Google Scholar] [CrossRef]
  41. Dorotić, H.; Pukšec, T.; Duić, N. Multi-objective optimization of district heating and cooling systems for a one-year time horizon. Energy 2019, 169, 319–328. [Google Scholar] [CrossRef]
  42. Rämä, M.; Mohammadi, S. Comparison of distributed and centralised integration of solar heat in a district heating system. Energy 2017, 137, 649–660. [Google Scholar] [CrossRef]
  43. Dalenbäck, J.-O. European Large-Scale Solar Heating Network,” 2003. Available online: http://ptp.irb.hr/upload/mape/kuca/08_Jan-Olof_Dalenback_EUROPEAN_LARGE-SCALE_SOLAR_HEATING_NETW.pdf (accessed on 8 March 2017).
  44. Lundh, M.; Dalenbäck, J.-O. Swedish solar heated residential area with seasonal storage in rock: Initial evaluation. Renew. Energy 2008, 33, 703–711. [Google Scholar] [CrossRef]
  45. Dalenbäck, J.-O.; Werner, S. Market for Solar District Heating, WP2–European Market Study, CIT Energy Management AB, July 2012. Available online: http://solar-district-heating.eu/portals/0/sdh-wp2-d2-3-market-aug2012.pdf. (accessed on 15 September 2016).
  46. Halawa, E.; Chang, K.; Yoshinaga, M. Thermal performance evaluation of solar water heating systems in Australia, Taiwan and Japan–A comparative review. Renew. Energy 2015, 83, 1279–1286. [Google Scholar] [CrossRef]
  47. Sibbitt, B.; McClenahan, D.; Djebbar, R.; Thornton, J.; Wong, B.; Carriere, J.; Kokko, J. The Performance of a High Solar Fraction Seasonal Storage District Heating System – Five Years of Operation, Energy Procedia. In Proceedings of the 1st International Conference on Solar Heating and Cooling for Buildings and Industry (SHC 2012), San Francisco, CA, USA, 9–11 July 2012; Volume 30, pp. 856–865. [Google Scholar]
  48. Hobbi, A.; Siddiqui, K. Optimal design of a forced circulation solar water heating system for a residential unit in cold climate using TRNSYS. Sol. Energy 2009, 83, 700–714. [Google Scholar] [CrossRef]
  49. Luo, X.; Hou, Q.; Wang, Y.; Xin, D.; Gao, H.; Zhao, M.; Gu, Z. Experimental on a novel solar energy heating system for residential buildings in cold zone of China. Procedia Eng. 2017, 205, 3061–3066. [Google Scholar] [CrossRef]
  50. Oosterbaan, H.; Janiszewski, M.; Uotinen, L.; Siren, T.; Rinne, M. Numerical Thermal Back-calculation of the Kerava Solar Village Underground Thermal Energy Storage. Procedia Eng. 2017, 191, 352–360. [Google Scholar] [CrossRef]
  51. Hakaste, H.; Rinne, H.; Jalo, T. Eko-Viikki-Tavoitteiden ja Tulosten erot Energiankulutuksessa(Motiva Oy), 30 June 2008. Available online: http://www.motiva.fi/files/1576/Eko-Viikki_tavoitteiden_ja_tulosten_erot_energiankulutuksessa.pdf (accessed on 16 February 2017).
  52. Poppi, S.; Bales, C.; Haller, M.Y.; Heinz, A. Influence of boundary conditions and component size on electricity demand in solar thermal and heat pump combisystems. Appl. Energy 2016, 162, 1062–1073. [Google Scholar] [CrossRef]
  53. Nord, N.; Nielsen, E.K.L.; Kauko, H.; Tereshchenko, T. Challenges and potentials for low-temperature district heating implementation in Norway. Energy 2018, 151, 889–902. [Google Scholar] [CrossRef]
  54. Rehman, H.U.; Hirvonen, J.; Kosonen, R.; Sirén, K. Computational comparison of a novel decentralized photovoltaic district heating system against three optimized solar district systems. Energy Convers. Manag. 2019, 191, 39–54. [Google Scholar] [CrossRef]
  55. Lei, Y.; Tan, H.; Li, Y. Technical-economic evaluation of ground source heat pump for office buildings in China. Energy Procedia 2018, 152, 1069–1078. [Google Scholar] [CrossRef]
  56. Yao, J.; Liu, W.; Zhang, L.; Tian, B.; Dai, Y.; Huang, M. Performance analysis of a residential heating system using borehole heat exchanger coupled with solar assisted PV/T heat pump. Renew. Energy 2020, 160, 160–175. [Google Scholar] [CrossRef]
  57. Pardo, P.; Deydier, A.; Anxionnaz-Minvielle, Z.; Rougé, S.; Cabassud, M.; Cognet, P. A review on high temperature thermochemical heat energy storage. Renew. Sustain. Energy Rev. 2014, 32, 591–610. [Google Scholar] [CrossRef] [Green Version]
  58. Dinçer, İ.; Rosen, M.A. Thermal Energy Storage-Systems and Applications, 2nd ed.; John Wiley and Sons: Hoboken, NJ, USA, 2011. [Google Scholar]
  59. Terziotti, L.; Sweet, M.; McLeskey, J.T. Modeling seasonal solar thermal energy storage in a large urban residential building using TRNSYS 16. Energy Build. 2012, 45, 28–31. [Google Scholar] [CrossRef]
  60. McDowell, T.P.; Thornton, J.W. Simulation and model calibration of a large-scale solar seasonal storage system. In Proceedings of the Third National Conference of IBPSA-USA, Berkeley, CA, USA, 30 July–1 August 2008. [Google Scholar]
  61. Beausoleil-Morrison, I.; Kemery, B.; Wills, A.D.; Meister, C. Design and simulated performance of a solar-thermal system employing seasonal storage for providing the majority of space heating and domestic hot water heating needs to a single-family house in a cold climate. Sol. Energy 2019, 191, 57–69. [Google Scholar] [CrossRef]
  62. Renaldi, R.; Friedrich, D. Techno-economic analysis of a solar district heating system with seasonal thermal storage in the UK. Appl. Energy 2019, 236, 388–400. [Google Scholar] [CrossRef] [Green Version]
  63. Franco, A.; Versace, M. Multi-objective optimization for the maximization of the operating share of cogeneration system in District Heating Network. Energy Convers. Manag. 2017, 139, 33–44. [Google Scholar] [CrossRef]
  64. Balić, D.; Maljković, D.; Lončar, D. Multi-criteria analysis of district heating system operation strategy. Energy Convers. Manag. 2017, 144, 414–428. [Google Scholar] [CrossRef]
  65. Solar Power World. “What Components are in a Solar Power System?” WTWH Media, LLC, 2018. Available online: https://www.solarpowerworldonline.com/2018/08/what-components-are-in-a-solar-energy-system/ (accessed on 13 May 2018).
  66. Plytaria, M.T.; Tzivanidis, C.; Bellos, E.; Antonopoulos, K.A. Energetic investigation of solar assisted heat pump underfloor heating systems with and without phase change materials. Energy Convers. Manag. 2018, 173, 626–639. [Google Scholar] [CrossRef]
  67. Franco, A.; Fantozzi, F. Experimental analysis of a self consumption strategy for residential building: The integration of PV system and geothermal heat pump. Renew. Energy 2016, 86, 1075–1085. [Google Scholar] [CrossRef]
  68. García, N.P.; Zubi, G.; Pasaoglu, G.; Dufo-López, R. Photovoltaic thermal hybrid solar collector and district heating configurations for a Central European multi-family house. Energy Convers. Manag. 2017, 148, 915–924. [Google Scholar] [CrossRef]
  69. Soloha, R.; Pakere, I.; Blumberga, D. Solar energy use in district heating systems. A case study in Latvia. Energy 2017, 137, 586–594. [Google Scholar] [CrossRef]
  70. Zhang, R.; Shen, G.Q.; Ni, M.; Wong, J.K. Techno-economic feasibility of solar water heating system: Overview and meta-analysis. Sustain. Energy Technol. Assess. 2018, 30, 164–173. [Google Scholar] [CrossRef]
  71. Cao, S.; Hasan, A.; Siren, K. Analysis and solution for renewable energy load matching for a single-family house. Energy Build. 2013, 65, 398–411. [Google Scholar] [CrossRef]
  72. Hamdy, M.; Hasan, A.; Sirén, K. A multi-stage optimization method for cost-optimal and nearly-zero-energy building solutions in line with the EPBD-recast 2010. Energy Build. 2013, 56, 189–203. [Google Scholar] [CrossRef]
  73. Kost, C.; Shammugam, S.; Julch, V.; Nguyen, H.-T.; Schlegl, T. Levelized Cost of Electricity Renewable Energy Technologies, Fraunhofer Institute for Solar Energy Systems ISE, 2018. Available online: https://www.ise.fraunhofer.de/content/dam/ise/en/documents/publications/studies/EN2018_Fraunhofer-ISE_LCOE_Renewable_Energy_Technologies.pdf (accessed on 5 August 2020).
  74. International Renewable Energy Agency (IRENA). Renewable Power Generation Costs in 2018. 2019. Available online: https://www.irena.org/-/media/Files/IRENA/Agency/Publication/2019/May/IRENA_Renewable-Power-Generations-0Costs-in-2018.pdf (accessed on 4 August 2020).
  75. EQUA Simulation AB. “IDA Indoor Climate and Energy,” 2018. Available online: https://www.equa.se/en/ida-ice (accessed on 12 October 2019).
  76. Google, Maps. Available online: https://www.google.com/maps/@60.2717668,24.8555694,17.02z (accessed on 6 May 2019).
  77. Dyhr, R. Asuinrakennusten Ilmanvaihtoselvitys (Report on Residential Building Ventilation Systems); City of Helsinki: Helsinki, Finland, 1993. (In Finnish) [Google Scholar]
  78. Ministry of the Environment. Directive on Building Energy certificates, Attachment 1, 2017. (In Finnish). Available online: https://www.finlex.fi/data/sdliite/liite/6822.pdf (accessed on 24 November 2019).
  79. Saari, A.; Airaksinen, M.; Jokisalo, K.S.J.; Hasan, A.; Nissinen, K.; Vainio, T.; Möttönen, V.-J.; Pulakka, S.; Heljo, J.; Vihola, J.; et al. Energiatehokkuutta Koskevien Vähimmäisvaatimusten Kustannusoptimaalisten Tasojen Laskenta [Calculation of Cost-Optimal Energy Efficiency Levels] 2013. (In Finnish). Available online: https://cris.vtt.fi/en/publications/energiatehokkuutta-koskevien-v%C3%A4himm%C3%A4isvaatimusten-kustannusoptima (accessed on 20 November 2019).
  80. Niemelä, T.; Kosonen, R.; Jokisalo, J. Energy performance and environmental impact analysis of cost-optimal renovation solutions of large panel apartment buildings in Finland. Sustain. Cities Soc. 2017, 32, 9–30. [Google Scholar] [CrossRef] [Green Version]
  81. Ympäristöministeriö, D3 Finnish Building Directives-Energy Efficiency of Buildings 2011. (In Finnish). Available online: http://www.finlex.fi/data/normit/37188/D3-2012_Suomi.pdf (accessed on 9 April 2017).
  82. FINGRID OYJ, State of the Power System. Available online: https://www.fingrid.fi/en/ (accessed on 10 September 2019).
  83. European Heat Pump Association. Heat Pump Investments up to Half a Billion a Year in Finland, 2018. Available online: https://www.ehpa.org/about/news/article/heat-pump-investments-up-to-half-a-billion-a-year-in-finland/ (accessed on 15 July 2019).
  84. Solar Energy Laboratory, University of Wisconsin-Madison, TRNSYS—A Transient Systems Simulation Program, Version 17.1, Solar Energy Laboratory, University of Wisconsin-Madison; 2009–2012. 2012. Available online: http://sel.me.wisc.edu/trnsys (accessed on 18 January 2017).
  85. Jonas, D.; Lämmle, M.; Theis, D.; Schneider, S.; Frey, G. Performance modeling of PVT collectors: Implementation, validation and parameter identification approach using TRNSYS. Sol. Energy 2019, 193, 51–64. [Google Scholar] [CrossRef]
  86. Lamrani, B.; Khouya, A.; Draoui, A. Energy and environmental analysis of an indirect hybrid solar dryer of wood using TRNSYS software. Sol. Energy 2019, 183, 132–145. [Google Scholar] [CrossRef]
  87. Rehman, H.U.; Hirvonen, J.; Sirén, K. A long-term performance analysis of three different configurations for community-sized solar heating systems in high latitudes. Renew. Energy 2017, 113, 479–493. [Google Scholar] [CrossRef] [Green Version]
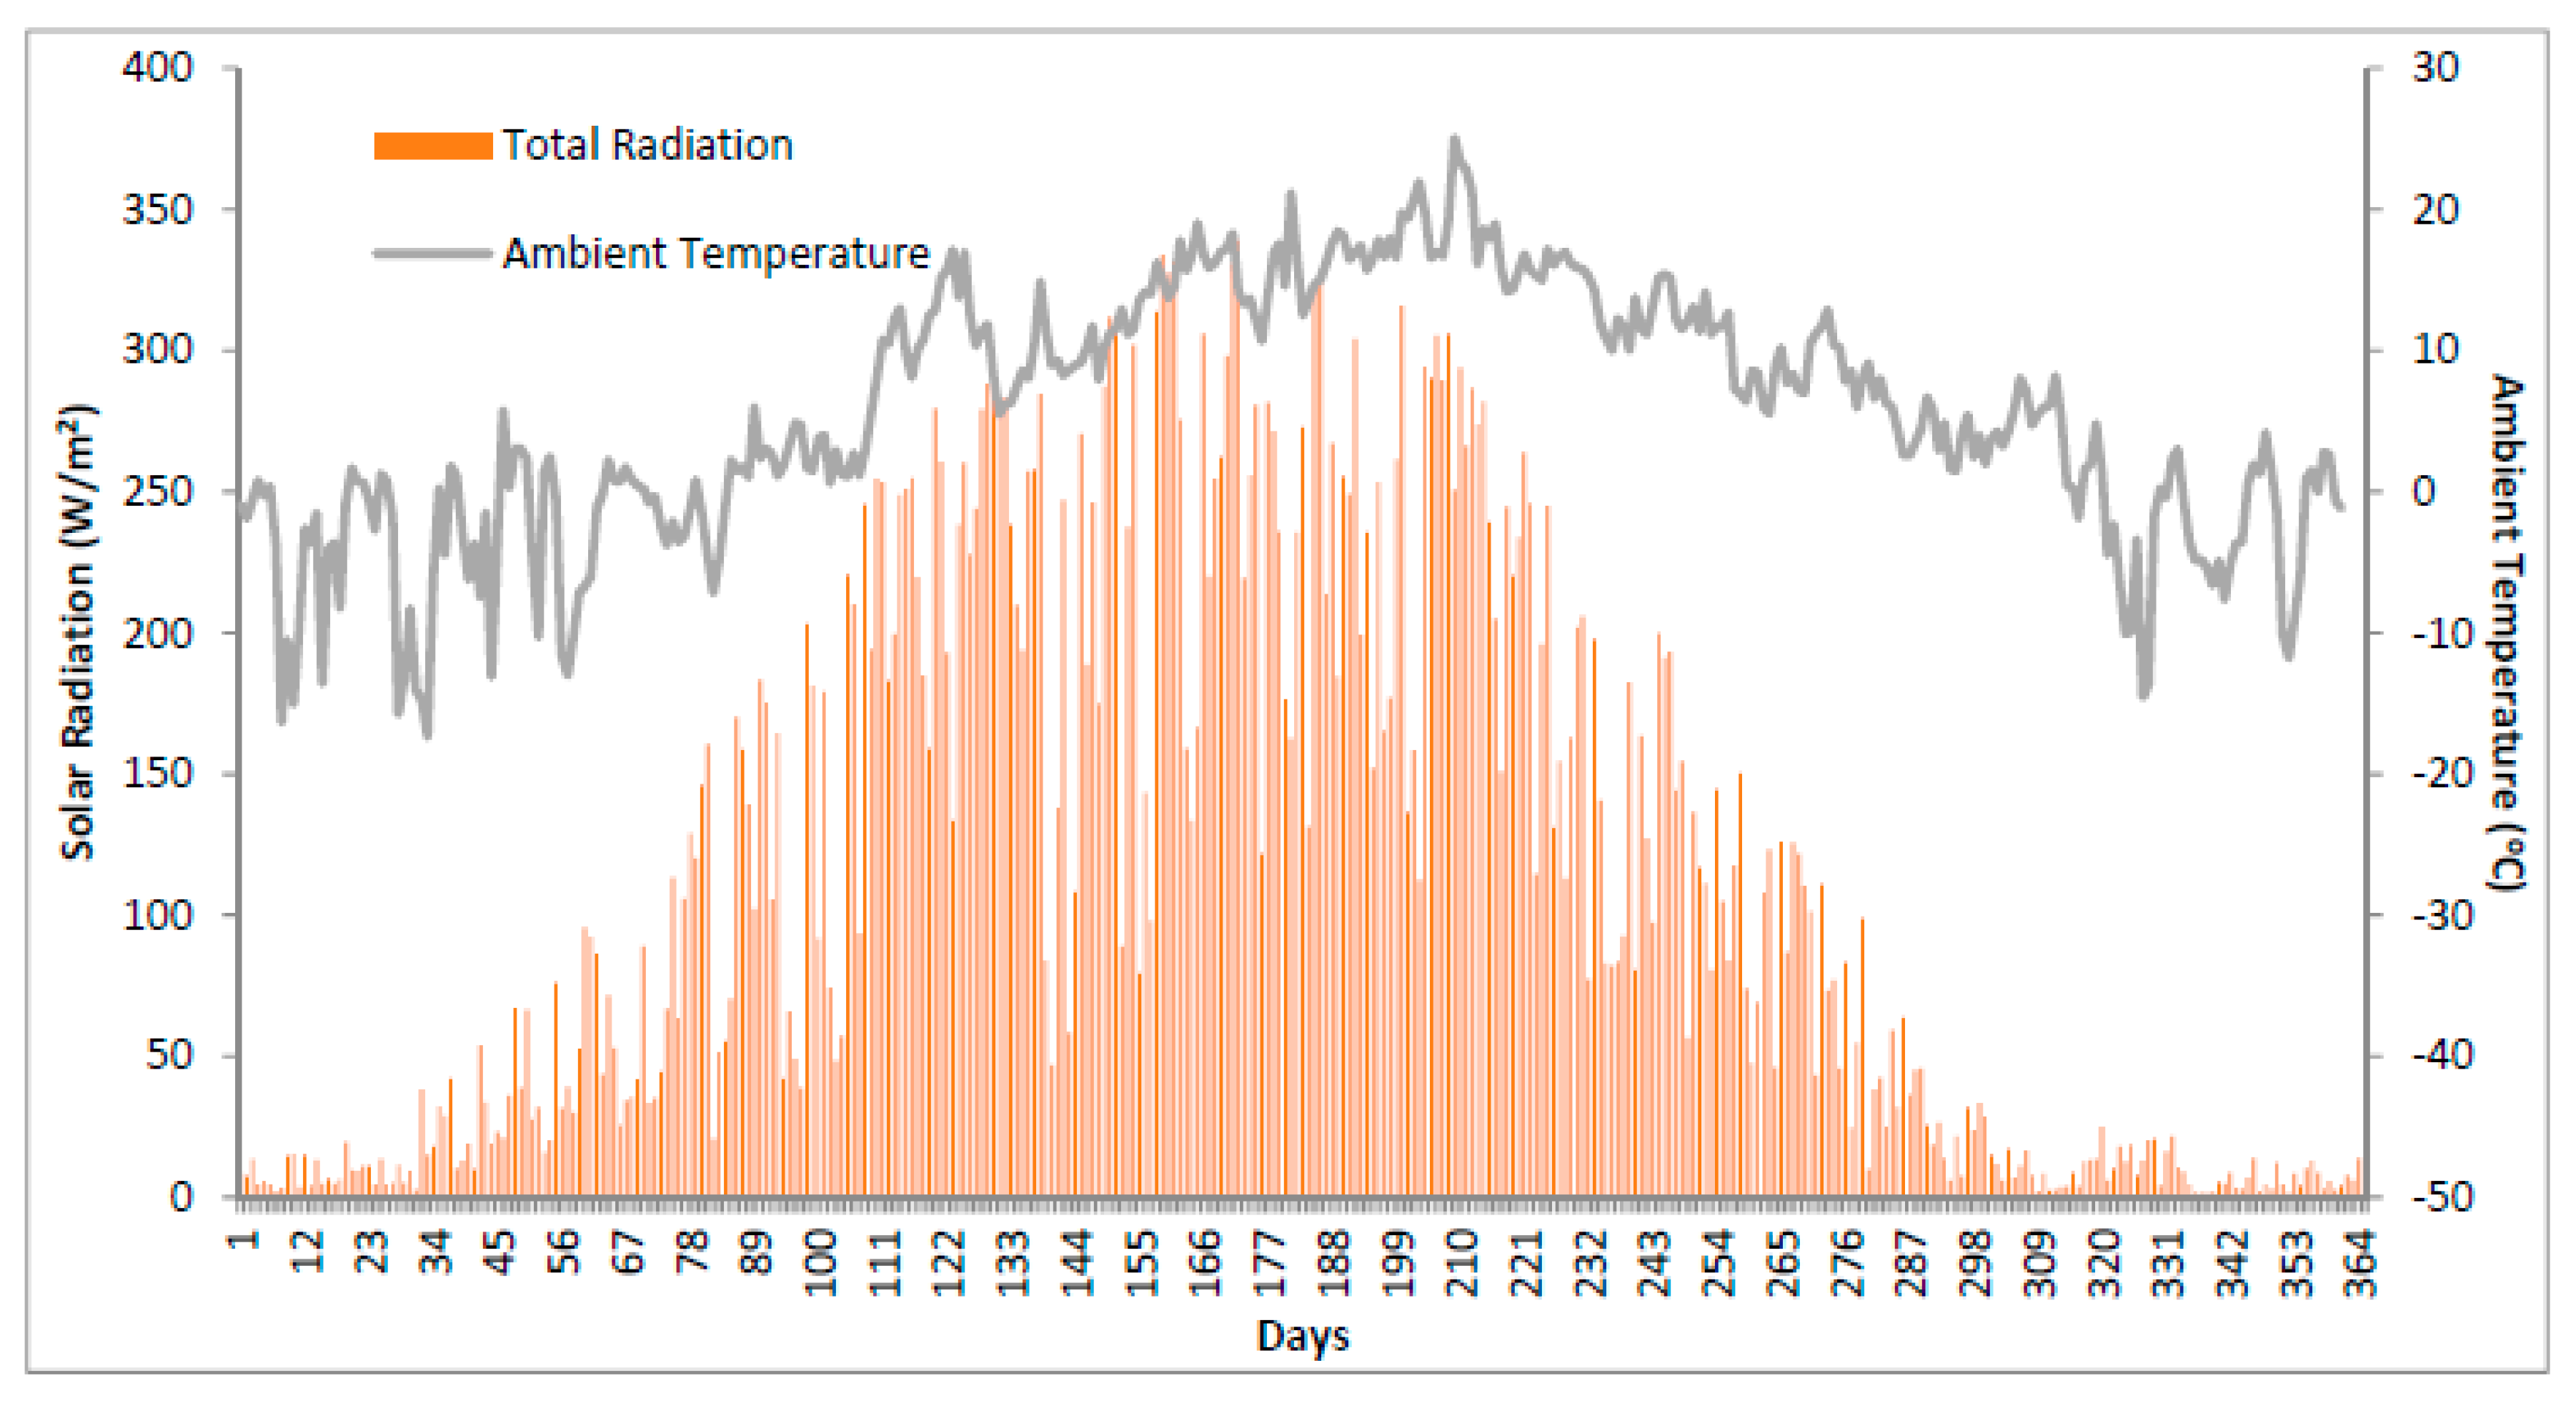
  88. Kalamees, T.; Jylhä, K.; Tietäväinen, H.; Jokisalo, J.; Ilomets, S.; Hyvönen, R.; Saku, S. Development of weighting factors for climate variables for selecting the energy reference year according to the EN ISO 15927-4 standard. Energy Build. 2012, 47, 53–60. [Google Scholar] [CrossRef]
  89. Maalämpötukku, NIBE F2120 16 kW, 2017. Available online: https://www.maalampotukku.fi/product/2596/nibe-f2120-16-kw (accessed on 3 August 2020).
  90. AXITEC ENERGY GMBH & CO. KG, “AXI Power, AC-250P/156-60S,” 2016. Available online: www.axitecsolar.com (accessed on 4 August 2020).
  91. Sendy, A. How Long Do Solar Panels Last? Solar Reviews, 2020. Available online: https://www.solarreviews.com/blog/how-long-do-solar-panels-last (accessed on 3 August 2020).
  92. Rajput, P.; Malvoni, M.; Kumar, N.M.; Sastry, O.S.; Jayakumar, A. Operational Performance and Degradation Influenced Life Cycle Environmental–Economic Metrics of mc-Si, a-Si and HIT Photovoltaic Arrays in Hot Semi-arid Climates. Sustainability 2020, 12, 1075. [Google Scholar] [CrossRef] [Green Version]
  93. Nord Pool. “FI-Elspot Prices,” 2016. Available online: https://www.nordpoolspot.com/Market-data1/Elspot/Area-Prices/ALL1/Hourly/?view=table (accessed on 20 April 2017).
  94. EU-Commission. “Commission Delegated Regulation c(2011) 10050,” 2012. Available online: http://ec.europa.eu/transparency/regdoc/rep/3/2011/EN/3-2011-10050-EN-F1-1.Pdf (accessed on 10 March 2020).
  95. Hirvonen, J.; Rehman, H.U.; Sirén, K. Techno-economic optimization and analysis of a high latitude solar district heating system with seasonal storage, considering different community sizes. Sol. Energy 2018, 162, 472–488. [Google Scholar] [CrossRef] [Green Version]
  96. Ahola, J. National Survey Report of PV Power Applications in Finland 2015; IEA-PVPS: Lappeenranta, Finland, 2016. [Google Scholar]
  97. Mauthner, F.; Herkel, S. SHC Task 52, Technology and Demonstrators: Technical Report Subtask C- Part C1: Classification and Benchmarking of Solar Thermal Systems in Urban Environments, 31 January 2016. Available online: http://www.solarthermalworld.org/sites/gstec/files/news/file/2016-05-28/iea-shc_task_52_stc1-classification_and_benchmarking_2016-03-31_report.pdf (accessed on 17 December 2017).
  98. Haahtela, Y.; Kiiras, J. Talonrakennuksen Kustannustieto 2013 (In Finnish) (Building Construction Cost Data 2013); Haahtela Kehitys: Helsinki, Finland, 2013. [Google Scholar]
  99. Rakennuslehti, Prices for Construction Work in Helsinki Region, 2016. (In Finnish). Available online: https://www.rakennuslehti.fi/ (accessed on 20 February 2016).
  100. Mohammadi, M.; Harjunkoski, I. Performance analysis of waste-to-energy technologies for sustainable energy generation in integrated supply chains. Comput. Chem. Eng. 2020, 140, 106905. [Google Scholar] [CrossRef]
  101. Fingrid, Electricity Market. Available online: https://www.fingrid.fi/en/ (accessed on 12 September 2019).
  102. Cao, S.; Hasan, A.; Sirén, K. On-site energy matching indices for buildings with energy conversion, storage and hybrid grid connections. Energy Build. 2013, 64, 423–438. [Google Scholar] [CrossRef]
  103. European Commission. Roadmap for a Competitive Low-Carbon Europe, 2018. Available online: https://ec.europa.eu/clima/policies/strategies/2050_en#tab-0-1 (accessed on 4 March 2020).
  104. Pal, S.K.; Takano, A.; Alanne, K.; Siren, K. A life cycle approach to optimizing carbon footprint and costs of a residential building. Build. Environ. 2017, 123, 146–162. [Google Scholar] [CrossRef]
Figure 1. Louhela area showing the four buildings built during the 1970s in Vantaa, Finland [76].
Energies 13 04167 g001
Figure 2. The schematic diagram of the reference old buildings integrated with city-level district heating (Case 0).
Energies 13 04167 g002
Figure 3. The schematic diagram of the centralized photovoltaic (PV) and ground source heat pump (GSHP)-based community-level district heating system integrated with old residential buildings in the district (Case 1, PV + GSHP).
Energies 13 04167 g003
Figure 4. The schematic diagram of the centralized PV and A2WHP-based community-level district heating system integrated with old residential buildings in the district (Case 2, PV + A2WHP).
Energies 13 04167 g004
Figure 5. The schematic diagram of the centralized community-level district heating system for the old residential buildings based on PV, A2WHP, GSHP, and seasonal storage. (Case 3, PV + AW + GSHP + STR.
Energies 13 04167 g005
Figure 6. The daily average ambient temperature and solar radiation in the Southern Finland region.
Energies 13 04167 g006
Figure 7. The average monthly emissions of the electrical grid of Finland [19,26].
Energies 13 04167 g007
Figure 8. The annual heating demand of the buildings in the community, investment cost at the building level, and CO2 emissions from the city-level district heating grid for the reference case (Case 0).
Energies 13 04167 g008
Figure 9. The annual purchased electricity, LCC, and CO2 emissions from the centralized community-level PV and GSHP-based energy system integrated with old residential buildings (Case 1, PV + GSHP).
Energies 13 04167 g009
Figure 10. The breakdown of LCC of the old residential building community and centralized energy system based on PV and GSHP (Case 1, PV + GSHP).
Energies 13 04167 g010
Figure 11. The annual purchased electricity, LCC, and CO2 emissions from the centralized community-level PV and A2WHP-based energy system integrated with old residential buildings (Case 2, PV + A2WHP).
Energies 13 04167 g011
Figure 12. The breakdown of LCC of the old residential building community and the centralized PV and A2WHP-based energy system (Case 2, PV + A2WHP).
Energies 13 04167 g012
Figure 13. The annual purchased electricity, LCC, and CO2 emissions from the centralized community-level PV, HP, and seasonal storage-based energy system integrated with old residential buildings (Case 3, PV + A2W + GSHP + STR).
Energies 13 04167 g013
Figure 14. The breakdown of LCC of the old residential building community and centralized PV, HP and seasonal storage-based energy system (Case 3, PV + A2W + GSHP + STR).
Energies 13 04167 g014
Figure 15. The emissions, emissions reduction cost, LCC, investment, and purchased energy cost comparison between Case 0 with OR buildings and Case 3 with DR buildings in the community.
Energies 13 04167 g015
Table 1. The design parameters of the original-reference (OR) building constructed in the 1970s [19,77,78,79,80].
Design ParameterValue
External wall insulation (U-value)0.81 W/m2 K
Floor insulation (U-value)0.47 W/m2 K
Roof insulation (U-value)0.47 W/m2 K
Doors (U-value)2.2 W/m2 K
Windows1.7 W/m2 K
Total solar heat transmittance (g)0.71
Direct solar transmittance (ST)0.64
Air leakage rate n503.2 1/h
Air leakage rate q509.7 m3/h m2
VentilationMechanical exhaust
Heat recovery efficiency0%
Air exchange rate0.5 1/h
SFP1.5 kW/m3/s
Heated floor area/building4000 m2
Window area464 m2
Table 2. Original non-renovated reference, light renovated, and deep renovated buildings studied in the community and the building level components [19].
Building ConfigurationSpace Heating Demand (SPH) (kWh/m2/yr)Walls U-Value (W/m2 K)Roof U-Value (W/m2 K)Windows U-Value (W/m2 K)Solar Thermal (m2)Photovoltaic (m2)
Original reference (OR)1290.810.471.700
Light renovated (LR)1130.810.080.75530
Deep renovated (DR)530.360.080.85530
Table 3. Design variables used for the simulations and the corresponding investment costs of the components.
Case NumberDesign VariablesRange of the ValuesInvestment CostReferences and Valuation Year
0 Building level costs:
Building type heating demandOriginal reference (OR) heat demand = 129 kWh/m2/yr77 €/m2[19], 2018
Light renovated (LR) heat demand = 113 kWh/m2/yr156 €/m2
Deep renovated (DR) heat demand = 53 kWh/m2/yr339 €/m2
1 Centralized level costs:
Monocrystalline PV capacity (m2)1000230 €/PV m2[96], 2016
Short-term storage tank volume (m3)60892 €/m3[97], 2016
Water-water heat pump (60 kWthermal/unit)12–20 (based on building type)325 €/kWthermal[98], 2013
BTES aspect ratio1.533.5 €/m (drilling)[54,98,99], 2016
BTES density (boreholes/m2)0.04
2 Centralized level costs:
Monocrystalline PV capacity (m2)1000230 €/PV m2[96], 2016
Short-term storage tank volume (m3)60892 €/m3[97], 2016
Air-water heat pump (16 kWthermal/unit each)65–100 (based on building type)425 €/kWthermal[89], 2017
3 Centralized level costs:
Monocrystalline PV capacity (m2)1000230 €/PV m2[96], 2016
Short-term warm storage tank volume (m3)100860 €/m3[97], 2016
Short-term hot storage tank volume (m3)100860 €/m3
Water-water heat pump (60 kWthermal/unit)5325 €/kWthermal[98], 2013
Air-water heat pump (16 kWthermal/unit each)50425 €/kWthermal[89], 2017
BTES aspect ratio1.533.5 €/m (drilling) + 3 €/m3(excavation for insulation) + 88 €/m3 (1.5 m insulation thickness)
BTES density (boreholes/m2)0.15 [98,99], 2016
BTES volume (m3)120,000
Table 4. Emissions and cost comparison of the proposed centralized community-level energy district heating systems (Cases 1, 2, and 3) integrated with the original reference (OR) old residential buildings in the district and reference city-level district heating system (Case 0).
Building ConfigurationEmissions (kg CO2/m2/yr)Emission Reduction (kg CO2/m2/yr)Relative Reduction in Emissions (%)LCC (€/m2)Building Level Investment Cost (€/m2)Centralized Energy System Investment Cost (€/m2)Purchased Energy Cost (€/m2)Total Investment Cost (€/m2)Emission Reduction Investment Cost (€/kg CO2/yr)Building Level Cost Ratio (%)Centralized System Cost Ratio (%)Purchased Energy Cost Ratio (%)
Case 0, (OR)34--33977026277-23-77
Case 1 (PV + GSHP), (OR)13.120.96127377521441292.48281953
Case 2 (PV + A2WHP-DH), (OR)12.921.16227877601411372.84282151
Case 3 (PV + A2W + GSHP + STR), (OR)5.728.38327777106941833.74283834
Table 5. Emissions and cost comparison of the proposed centralized community-level energy district heating systems (Cases 1, 2, and 3) integrated with deep renovated (DR) old residential buildings in the district and city-level reference district heating system (Case 0).
Building ConfigurationEmissions (kg CO2/m2/yr)Emission Reduction (kg CO2/m2/yr)Relative Reduction in Emissions (%)LCC (€/m2)Building Level Investment Cost (€/m2)Centralized Energy System Investment Cost (€/m2)Purchased Energy Cost (€/m2)Total Investment Cost (€/m2)Emission Reduction Investment Cost (€/kg CO2/yr)Building Level Cost Ratio (%)Centralized System Cost Ratio (%)Purchased Energy Cost Ratio (%)
Case 0, (OR)1618 (from Case 0 + OR building)52 (from Case 0 + OR building)4593390120339-73-27
Case 1 (PV + GSHP), (OR)6.79.3 (27.3)58 (80)45233942713814.5175916
Case 2 (PV + A2WHP-DH), (OR)6.29.8 (27.8)61 (82)45133945673844.59751015
Case 3 (PV + A2W + GSHP + STR), (OR)3.112.9 (30.9)80 (91)498339106534458.21682111

