Article

On the Comparison of 2- and 4-Wheel-Drive Electric Vehicle Layouts with Central Motors and Single- and 2-Speed Transmission Systems

by
Stefano De Pinto
1,2,
Pablo Camocardi
1,
Christoforos Chatzikomis
1,
Aldo Sorniotti
1,*,
Francesco Bottiglione
2,
Giacomo Mantriota
2 and
Pietro Perlo
3
1
Department of Mechanical Engineering Sciences, University of Surrey, Guildford GU2 7XH, UK
2
Dipartimento di Meccanica, Matematica e Management, Politecnico di Bari, 70126 Bari, Italy
3
Interactive Fully Electrical VehicleS (IFEVS), 10040 La Loggia, Torino, Italy
*
Author to whom correspondence should be addressed.
Energies 2020, 13(13), 3328; https://doi.org/10.3390/en13133328
Submission received: 5 June 2020 / Revised: 19 June 2020 / Accepted: 19 June 2020 / Published: 30 June 2020
(This article belongs to the Special Issue Electric Vehicle Efficient Power and Propulsion Systems)

Abstract

:
Electric vehicles (EVs) are characterized by a significant variety of possible powertrain configurations, ranging from one to four electric machines, which can have an on-board or in-wheel layout. Multiple models of production EVs have recently been introduced on the market, with 4-wheel-drive (4WD) architectures based on a central motor within each axle, connected to the wheels through a gearbox, a differential, and half-shafts. In parallel, an important body of research and industrial demonstrations have covered the topic of 2-speed transmission systems for EVs, with the target of enhancing longitudinal acceleration and gradeability performance, while increasing the operating efficiency of the electric powertrain. Although several recent studies compare different electric powertrain architectures, to the best of the authors’ knowledge the literature misses a comparison between 2-wheel-drive (2WD) and 4WD configurations for the same EV, from the viewpoint of drivability and energy consumption. This paper targets this gap, by assessing 2WD and 4WD powertrain layouts with central motors, for a case study light passenger car for urban mobility, including consideration of the effect of single- and 2-speed transmission systems. An optimization routine is used to calculate the energy-efficient gear state and/or torque distribution for each considered configuration. For the specific EV, the results highlight the favourable trade-off of the single-speed 4WD layout, capable of reducing the energy consumption during driving cycles by approximately 9% with respect to the conventional 2WD layout with single-speed transmission, while providing satisfactory drivability and good gradeability, especially in low tire–road friction conditions.

1. Introduction

Electric vehicles (EVs) are characterized by a variety of potential powertrain architectures, including one to four electric motors [1]. The electric machines can have on-board [2] or in-wheel [3] installations, depending on whether they are part of the sprung or unsprung mass of the EV. While the in-wheel configurations imply the adoption of two motors within the same axle, the on-board configurations can have either a single motor (central motor configuration) or two motors per axle. In the central motor configurations, the electric machine is connected to the wheels through a mechanical transmission, a mechanical differential and half-shafts. Production EVs usually have a 2-wheel-drive (2WD) architecture, with a central motor configuration including a single-speed transmission system [4]. The simplicity of such powertrain layout meets the performance requirements of most EVs, and results in low cost and weight. This solution is enabled by the favourable torque characteristics of electric machines, which, in a first approximation, have a constant torque region up to the base speed, and then a constant power region up to the top speed. However, the automotive industry is exploring alternative EV layouts, with a series of recent 4-wheel-drive (4WD) production EVs with one motor per axle, such as the Tesla Model S (built in Fremont, California, USA), Audi e-tron (built in Brussels, Belgium), and Jaguar I-PACE (built in Graz, Austria) [4]. Such 4WD architectures provide redundancy in case of powertrain failures, and permit the implementation of advanced vehicle dynamics and traction control concepts, through the variation of the front-to-total torque distribution [5,6]. Moreover, the 4WD layouts with one motor per axle do not require the complex—yet achievable through engineering efforts—functional safety analyses (see the relevant standard ISO-26262, [7]) of the configurations with two motors per axle, either on-board or in-wheel [8,9], which can generate undesired direct yaw moments in case of motor drive failures. Nevertheless, in medium to long term, a fair market share can be expected for the configurations with two motors per axle, which: (i) offer the possibility of implementing continuous direct yaw moment control, to enhance active safety [2] and energy efficiency in cornering [10]; and (ii) facilitate advanced individual wheel slip control [11], especially in case of in-wheel motors, which are not affected by the torsional dynamics of the half-shafts. These layouts, covered with a specific set of performance indicators for cornering conditions in the comparison in De Novellis et al. [12], will not be considered in this study, which is focused on central motor arrangements.
In parallel, in the last 10 years, the automotive industry and academia have been evaluating 2-speed transmission systems for electric powertrains with central motor configurations, with the purpose of enhancing the longitudinal acceleration, gradeability, top speed, and energy consumption performance, through the appropriate design and on-line selection of the gear ratios [13,14,15,16,17,18]. The first examples of electric powertrains with 2-speed transmissions are currently reaching the production phase [19]. The studies on 2-speed transmission systems include gearbox configurations and algorithms for reducing the wheel torque gap and longitudinal acceleration oscillations during gearshifts [17,18], as well as controllers for 4WD EV configurations [20,21], in which: (i) significant operational flexibility is available in terms of number of states and front-to-total wheel torque distributions to obtain, in an energy efficient way, a total wheel torque demand at a given speed; and (ii) the torque-fill effect [22] during the gearshift can be achieved through simplified 2-speed transmission system layouts, e.g., without controlled friction clutches, by modulating the torque profile on the axle not involved in the gearshift [21]. However, to the best of the authors’ knowledge, the production controllers for gear selection and/or management of the front-to-total wheel torque distribution in 4WD configurations tend to adopt relatively simple but robust algorithms, which are far from providing optimal performance, especially in terms of energy consumption.
The EV literature includes contributions analysing and optimizing powertrain efficiency, energy consumption along driving cycles, and operating costs, [13,23,24], as well as studies on novel central motor configurations, with comparisons with more conventional layouts. For example, Bottiglione et al. [25] discuss the increased operational flexibility, and thus efficiency, of the electric motor drive, allowed by infinitely variable transmission systems. Holdstock et al. [26] present a four-speed dual motor electric powertrain concept, in which two gears are available for each electric machine, and compare the energy consumption of the novel powertrain with that of single motor configurations coupled with single- and 2-speed transmissions. The dual motor layout is simplified in Kwon et al. [23] and Ruan et al. [27], which consider one gear ratio for each electric motor. Nguyen et al. [28] extend the four-speed dual motor powertrain concept to a case study plug-in parallel hybrid electric bus, i.e., including an internal combustion engine in the powertrain. De Carlo et al. [29] propose a dual motor electric powertrain layout based on an epicyclical gearset, which shows an average ~9% energy efficiency increase along an urban driving cycle, with respect to the corresponding single motor solution. However, the previous 2WD dual motor layouts, although requiring two electric machines, do not bring the traction capability benefits of a 4WD EV architecture, unless they are replicated on both vehicle axles, which would imply the installation of four motors.
Despite the availability of studies comparing different EV powertrain architectures [30], to the best of the authors’ knowledge, the literature misses a thorough performance comparison between 2WD and 4WD EV architectures with a single motor per axle, which are the focus of the current industrial interest. Moreover, although on-board electric powertrains are subject to important torsional oscillations [2], which have to be compensated by anti-jerk controllers [31], the available electric powertrain comparisons tend to overlook the drivability implications of the considered layouts. Hence, for a case study EV, this paper aims to address the identified gap through:
  • A drivability analysis based on the frequency and time response characteristics of 2WD and 4WD powertrain layouts, excluding and including the effect of the anti-jerk control action;
  • A unified optimization routine to find the energy-efficient transmission state and front-to-total torque distribution for each operating condition of the EV, to provide a fair comparison among the considered architectures;
  • A comparison of the resulting acceleration, gradeability and energy consumption performance.
The paper is organized as follows: Section 2 discusses the EV layouts and simulation models; Section 3 deals with the drivability assessment; Section 4 presents the unified optimization routine for energy-efficient gear selection and front-to-total wheel torque distribution; Section 5 includes the acceleration, gradeability and energy consumption results, which are followed by the conclusions.

2. Electric Vehicle Layouts and Simulation Models

2.1. Electric Vehicle Layouts

The case study EV platform (Figure 1) is a light urban passenger car prototype developed by IFEVS (Interactive Fully Electrical VehicleS) within the European project PLUS-MOBY, and enhanced during the follow-up project TELL [32]. The considered EV layouts, reported in Figure 2, are:
  • Layout L1: a 2WD configuration with a single front 28 kW (peak power value) electric motor coupled with a single-speed transmission. The gear ratio was chosen by the involved industrial companies as a trade-off between gradeability and top speed.
  • Layout L2: a 2WD configuration, which differs from L1 for the adoption of a 2-speed transmission. The design is a cost-driven simplification of the 2-speed transmission in [14,18], by excluding the friction and sprag clutches, which are replaced by a dog clutch. During the gearshifts, the synchronization is controlled through the electric motor drive [20,21], at the price, with respect to the more sophisticated original design, of a wheel torque gap. The first gear ratio provides the required longitudinal acceleration and gradeability performance, while the second gear ratio ensures the desired top speed.
  • Layout L3: a 4WD configuration with two 14 kW electric motors, connected to the respective axle through single-speed transmissions.
  • Layout L4: a 4WD configuration, which differs from L3 for the adoption, within each axle, of the same 2-speed transmission system as in L2. In this EV layout, a torque-fill controller provides seamless gearshifts at low-to-medium wheel torque demands, through the variation of the torque on the axle not involved in the gearshift [20,21].
The EV prototype was initially implemented and experimentally tested in the L4 configuration, see [21]. The efficiency maps of the individual single- and 2-speed powertrains used in the 4WD layouts, based on the data provided by the motor and transmission manufacturers, are in Figure 3, expressed as functions of the total wheel torque and vehicle speed. The maps consider the inverter, electric machine and transmission power losses. In addition to increasing the available torque-speed region, through appropriate gear selection the 2-speed layout significantly expands the operating region where the individual powertrain efficiency exceeds 90%. To provide a fair comparison between the 2WD and 4WD EV layouts, characterized by different sizes of the individual powertrains, the efficiency maps were scaled according to the maximum motor torque.
The main parameters of the four EV architectures are in Table 1, including indication of the EV mass variation associated with the powertrain configurations.

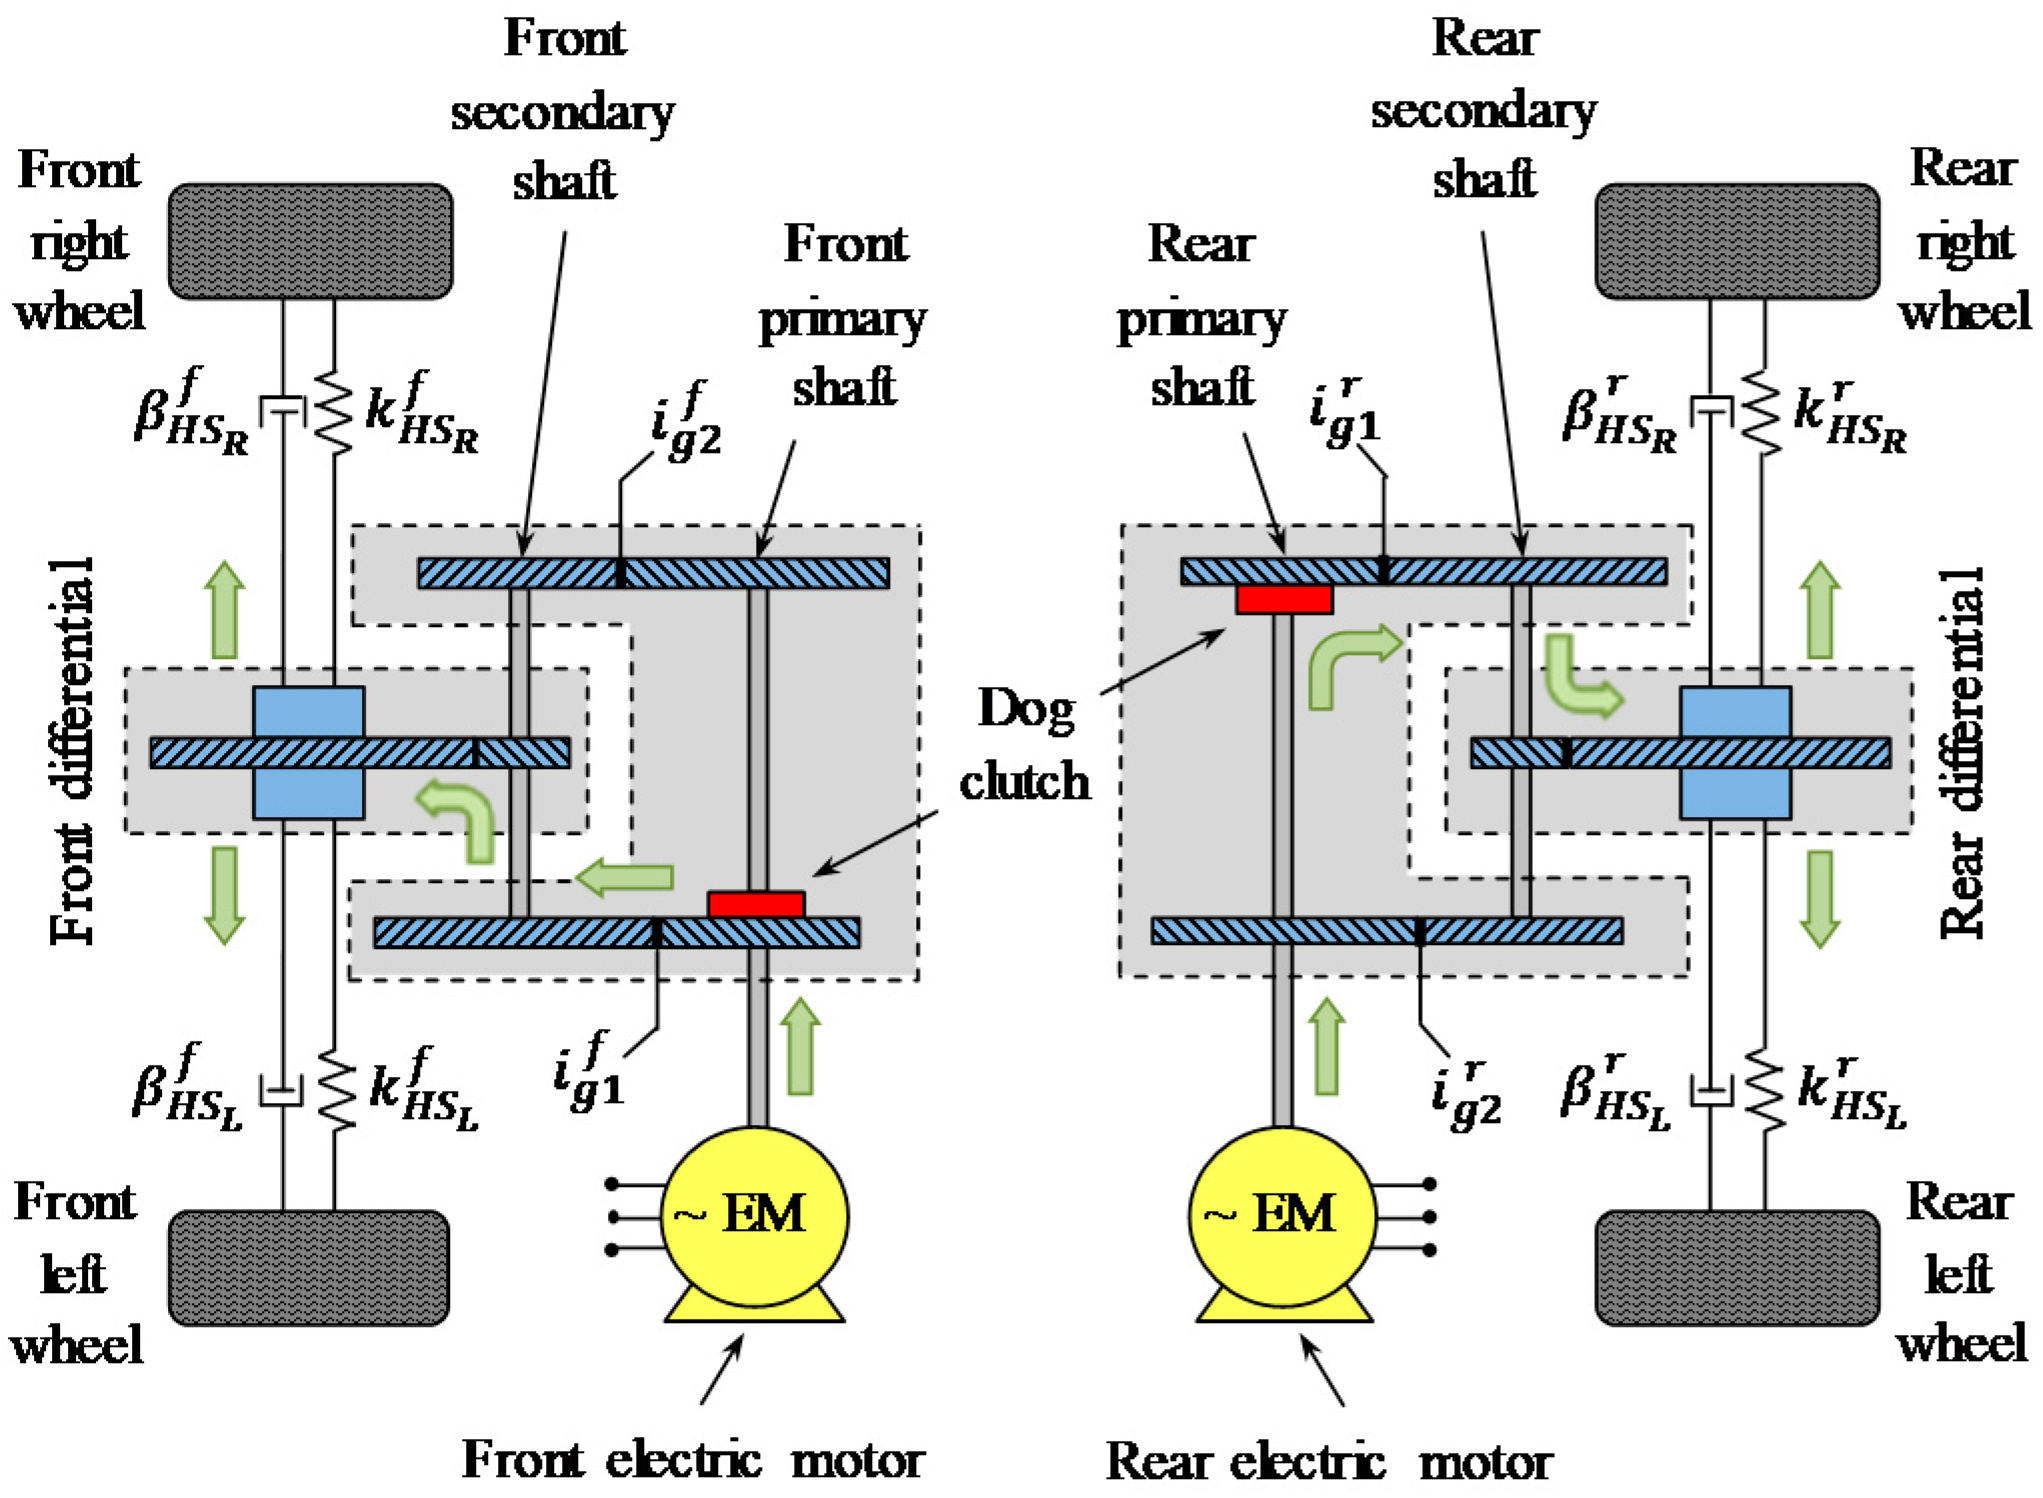
2.2. Nonlinear Model

A nonlinear forward facing Matlab-Simulink model of the longitudinal vehicle dynamics was implemented to assess the considered EV layouts. This Section presents the main Equations describing the dynamics of the 4WD EV configuration with 2-speed transmissions, i.e., L4 (see Figure 4), since L1-3 can be considered as its subcases. The front and rear axle models include the features responsible for the first order torsional drivetrain dynamics: (i) the half-shafts, modeled as a torsional spring and damper in parallel, and parametrized to include the torsional compliance of the whole driveline; and (ii) the tires, simulated through the Pacejka magic formula (version 5.2) with a relaxation length model [33].
Each 2-speed transmission can operate in three conditions, governed by different Equations:
  • Engaged first gear, i.e., with the dog clutch engaged such that the primary and secondary shafts rotate according to the first gear ratio;
  • Engaged second gear, i.e., with the dog clutch engaging the corresponding gear;
  • Disengaged gear: in this condition the drivetrain is characterized by two degrees of freedom, as the electric motor is decoupled from the secondary transmission shaft.
At the EV level, these conditions allow for a total number of eight states, as indicated in Table 2. The Equations are reported for the front axle only, as the front and rear drivetrains are identical. As the assessed scenarios do not include asymmetric tire-road friction conditions on the two EV sides, for simplicity the internal dynamics of the mechanical differential are neglected, and the model considers an equivalent half-shaft and an equivalent tire per axle.
The electric motor torque dynamics are described through the combination of a pure time delay and first order transfer function:
T E M f T E M , d e s f ( s ) = e τ d , E M f s 1 + τ E M f   s
The parametrization of Equation (1) considered the expected variation of the electrical system dynamics with the motor size, i.e., larger machines are usually characterized by larger values of their time constant. More specifically, in the following analyses, a time constant τ E M = 25 ms was selected for the larger motors of the 2WD EV configurations, and τ E M = 12.5 ms was chosen for the machines of the 4WD layouts.
In first gear, the torque balance of the powertrain is given by:
θ ¨ d i f f f = 1 J e q g 1 f     [ i g 1 f   i d i f f f η t r f   T E M f ( β H S L f + β H S R f ) ( θ ˙ d i f f f θ ˙ w f ) ( k H S L f + k H S R f ) ( θ d i f f f θ w f ) ]
In Equation (2), the transmission efficiency, η t r f , can be reversed depending on the direction of the power flow through the coupling, and is expressed through a look-up table, as a function of the input torque, speed, and operating temperature. The equivalent mass moment of inertia of the drivetrain in first gear is:
J e q g 1 f = J d i f f f + 0.5 ( J H S R f + J H S L f ) + ( J S S f + J g 2 f     i g 2 f 2 ) i d i f f f 2 + ( J E M f + J P S f + J g 1 f )   i g 1 f 2 i d i f f f 2
In second gear, the system dynamics are expressed by replacing the gear ratio in Equation (2), while the equivalent mass moment of inertia of the drivetrain is:
J e q g 2 f = J d i f f f + 0.5 ( J H S L f + J H S R f ) + ( J S S f + J g 1 f     i g 1 f 2 ) i d i f f f 2 + ( J E M f + J P S f + J g 2 f )   i g 2 f 2 i d i f f f 2
In conditions of disengaged gear, the primary and secondary shafts are decoupled, and the drivetrain has two degrees of freedom, i.e., the first one for the rotating parts of the electric motor and transmission system components rigidly connected to the primary shaft, and the second one for the transmission components rotating together with the differential:
{ θ ¨ E M f = T E M f T w & f f J E M f + J P S f θ ¨ d i f f f = 1 J e q d i s f     [ ( β H S L f + β H S R f ) ( θ ˙ d i f f f θ ˙ w f ) + ( k H S L f + k H S R f ) ( θ d i f f f θ w f ) ]
where:
J e q d i s f = J d i f f f + 0.5 ( J H S L f + J H S R f ) + ( J S S f + J g 1 f i g 1 f 2 + J g 2 f i g 2 f 2 ) i d i f f f 2
The axial position of the dog clutch for gear selection is controlled though an electro-mechanical actuator. The actuator position is modeled through a pure time delay, τ d f , and a first order transfer function with time constant τ a c t f :
x a c t f x d e s f ( s ) = e τ d f s 1 + τ a c t f   s
The simulation model of L4 includes the gearshift algorithm with torque-fill capability, discussed and experimentally evaluated in De Pinto et al. [21], which modifies the torque demand on the axle not involved in the gearshift to compensate for the torque gap on the other axle.
The wheel dynamics are described by:
θ ¨ w f = 1 2 J w + 0.5 ( J H S L f + J H S R f ) [ ( β H S L f + β H S R f ) ( θ ˙ d i f f f θ ˙ w f ) + ( k H S L f + k H S R f ) ( θ d i f f f θ w f ) 2 T d w f 2 T b r f 2 T r o l l f ]
where T b r f is the braking torque on each front corner, and T r o l l f is the rolling resistance torque of the front tires. The delayed tire torque, T d w f , i.e., the moment corresponding to the actual longitudinal tire forces, is calculated through a relaxation model:
T w f = L r e l θ ˙ w 0 f R w T ˙ d w f + T d w f
where T w f is the steady-state tire torque, corresponding to the longitudinal force output by the Pacejka magic formula model. The tire relaxation length is expressed as a function of the vertical tire load. Finally, the dynamics of the equivalent EV inertia are described by:
m R w 2 θ ¨ v = 2 T d w f + 2 T d w r T a e r o
where θ ¨ v is the angular acceleration of the equivalent EV inertia, and T a e r o is the equivalent torque corresponding to the aerodynamic drag.

2.3. Linearized Model

On-board electric powertrains are usually characterized by a rather low first natural frequency, because of the relatively large rotating inertias of the motor rotor and wheels, and low torsional stiffness of the half-shafts. Given the limited damping level of the system, torsional vibrations provoked by the electric motor torque transients are common issues that affect drivability and cause longitudinal acceleration oscillations [34]. In this context, 4WD EV configurations and 2-speed transmissions add complexity and can amplify the problem. Hence, a linearized version of the model in Section 2.2 was implemented to obtain the frequency response characteristics of the considered EV layouts in conditions of engaged gear, for torque demand inputs.
The main system nonlinearity is represented by the longitudinal tire force characteristics, which, in the linearized model, are approximated through the following linear function:
F F 0 + C 0 ( σ σ 0 ) = F 0 + C 0 / θ ˙ w 0 ( θ ˙ w θ ˙ v 0 / θ ˙ w 0 θ ˙ v ) = F 0 + C 0 / θ ˙ w 0 [ θ ˙ w ( 1 σ 0 ) θ ˙ v ]
where the longitudinal slip stiffness at the linearization point, C 0 , is calculated through the magic formula model. Equation (11) shows that the tire behaves like a nonlinear damper between the wheel and vehicle inertias, where the damping coefficient is a decreasing function of the wheel speed at the linearization point, θ ˙ w 0 , i.e., the torsional drivetrain dynamics change with speed.
From the linearized model, the Bode plot of the following transfer function is considered for each EV configuration:
H r e q ( j ω ) = θ ¨ v T r e q ( j ω )
which expresses the EV acceleration, θ ¨ v , resulting from a wheel torque demand input, T r e q . H r e q ( j ω ) characterizes the dynamic response to a driver torque request, and thus allows to evaluate the EV drivability properties. For the 2WD layouts, H r e q ( j ω ) and the respective Bode plot are directly derived from the linearized model formulation. In the 4WD layouts, H r e q ( j ω ) results from the superposition of the EV response to the front and rear torque demands, T r e q f and T r e q r :
T r e q = T r e q f + T r e q r  
From the definition of the front-to-total wheel torque distribution ratio p , it follows that:
T r e q f = p   T r e q T r e q r = ( 1 p )   T r e q
By assuming a constant value of p and the presence of a phase shift ϕ between the front and rear torque demands, H r e q ( j ω )   is calculated as:
H r e q ( j ω ) = θ ¨ v T r e q ( j ω ) = p θ ¨ v T r e q ( j ω ) | f + ( 1 p ) θ ¨ v T r e q ( j ω + ϕ ) | r

3. Drivability Analysis

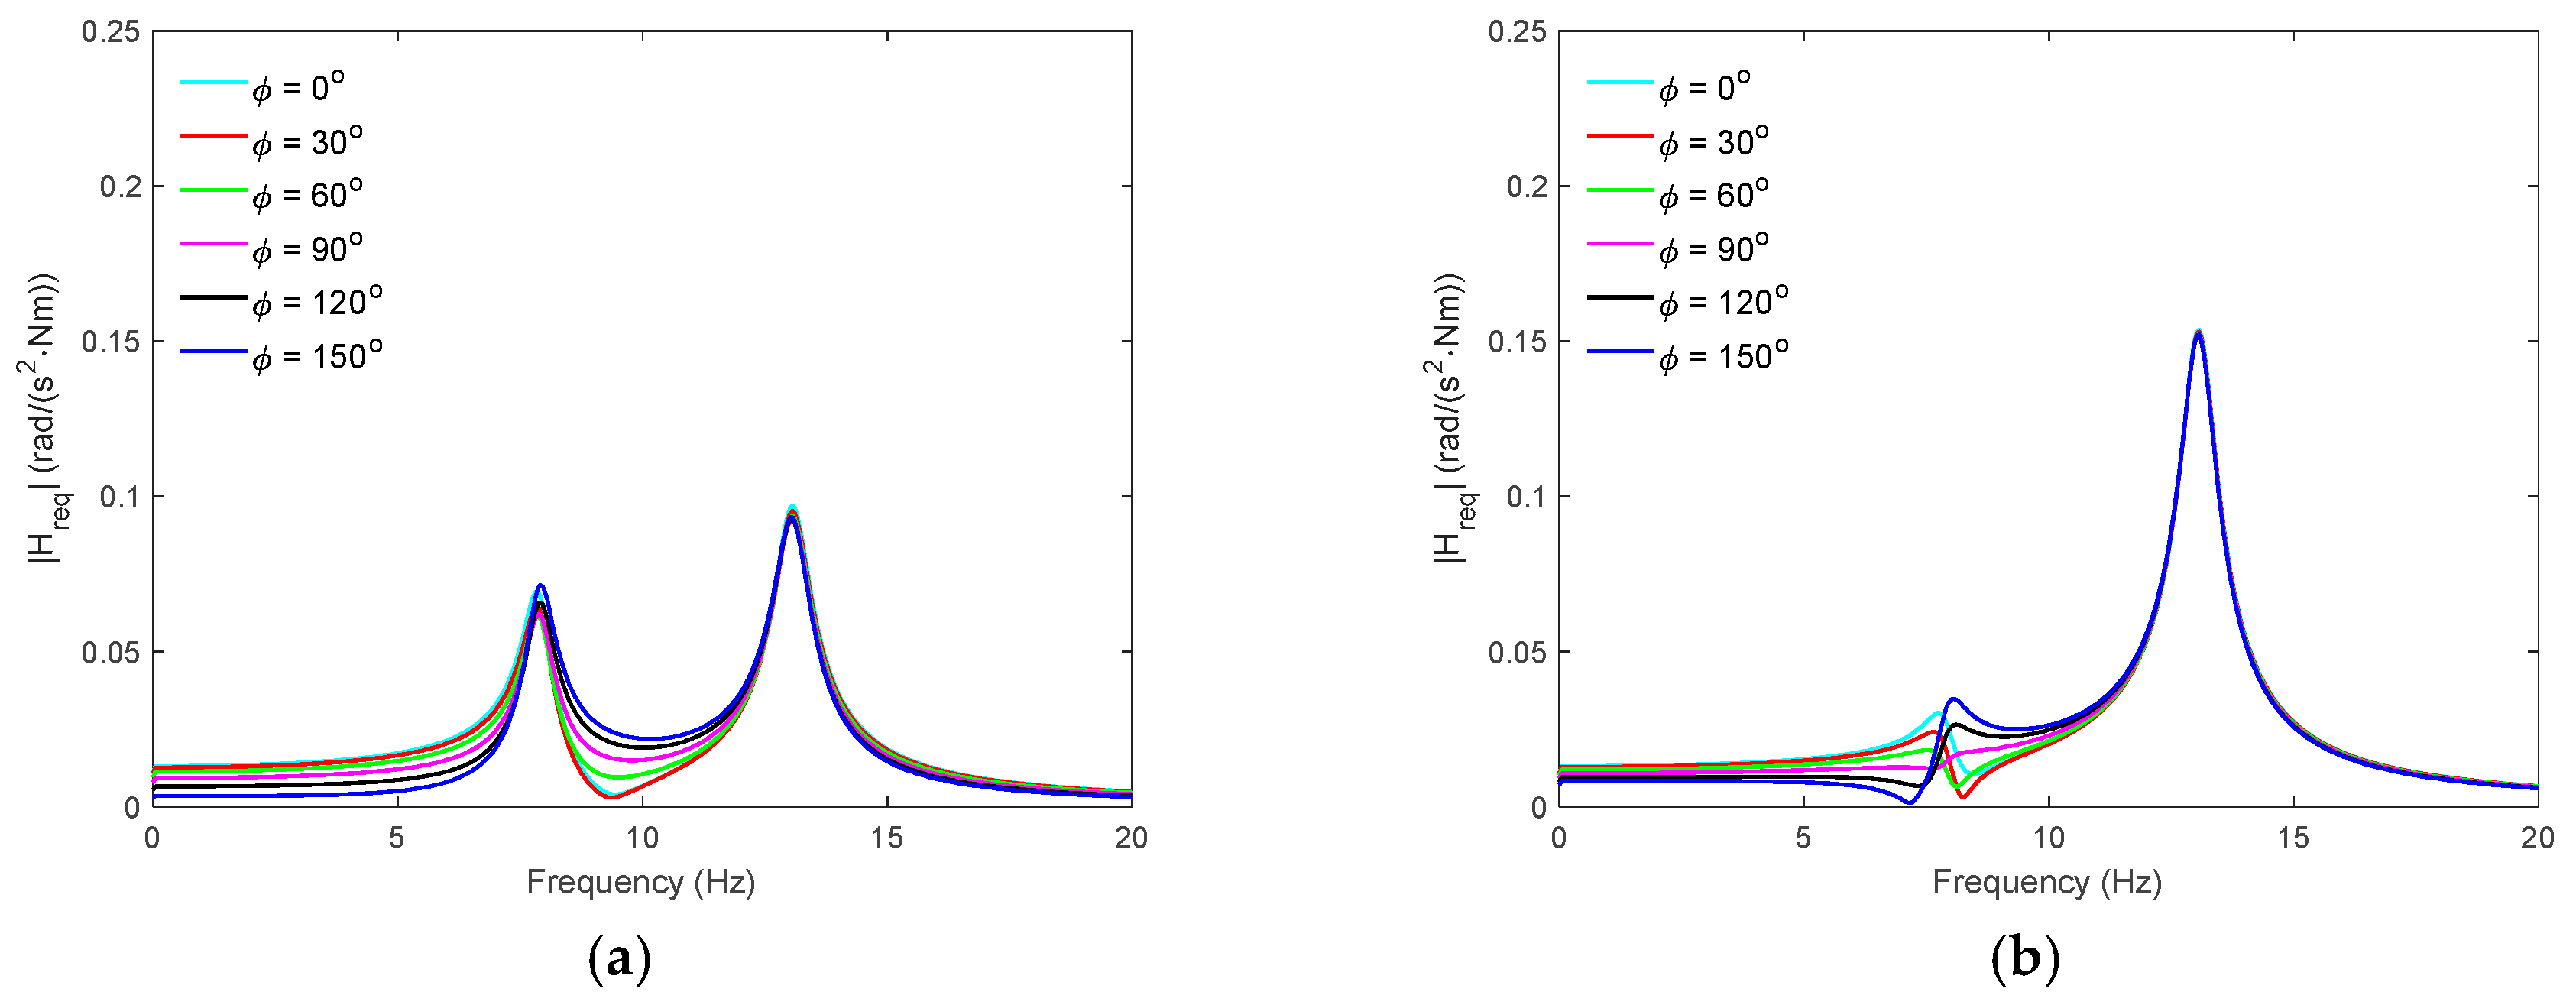
3.1. Frequency Response Characteristics

Figure 5 reports the magnitude plots of H r e q ( j ω ) for the considered EV configurations, for a selection of gear states (see Table 2) and front-to-total wheel torque distributions, under the assumption of using the same half-shafts for all EVs. All cases show an evident resonance peak, at a frequency that decreases when the gear ratio increases, i.e., the resonance frequency is lower in first gear in the 2-speed powertrains. The resonance frequency of the single-speed 4WD configuration is rather high because of the reduced mass moment of inertia of each downsized motor. The effect of the state selection on the resonance frequencies is significant, because of the different values of equivalent mass moment of inertia of the powertrain. In the 4WD layouts, the front-to-total torque distribution does not affect the frequency and magnitude of the resonance, if the two drivetrains are in the same gear ratio. If different gears ratios are selected, the system shows two resonance frequencies, i.e., one per drivetrain, and experiences an important variation of | H r e q ( j ω ) | as a function of p .
Figure 6 is a sensitivity analysis on the effect of the phase shift between the front and rear drivetrain torque demands. During real EV operation, input torque phase shifting is inevitable, and can be caused by the variation of the wheel torque distribution decided by the energy management system, the gearshift controller, as well as the interventions of the anti-jerk and traction controllers. The phase shifts affect | H r e q ( j ω ) | especially when different gear ratios are selected on the two axles, in the frequency region between the respective resonances.
The important conclusion is that the 2-speed 4WD configuration (L4) is characterized by a significantly increased complexity of its drivability response in constant gear condition, with respect to all the other layouts, and its frequency response is strongly dependent on the selected state, wheel torque distribution, and torque demand phase shift. Hence, such EV architecture needs a more careful parametrization of the anti-jerk controller, i.e., the controller compensating for the torsional drivetrain dynamics, which must be adaptable to the variety of operating conditions of the EV.

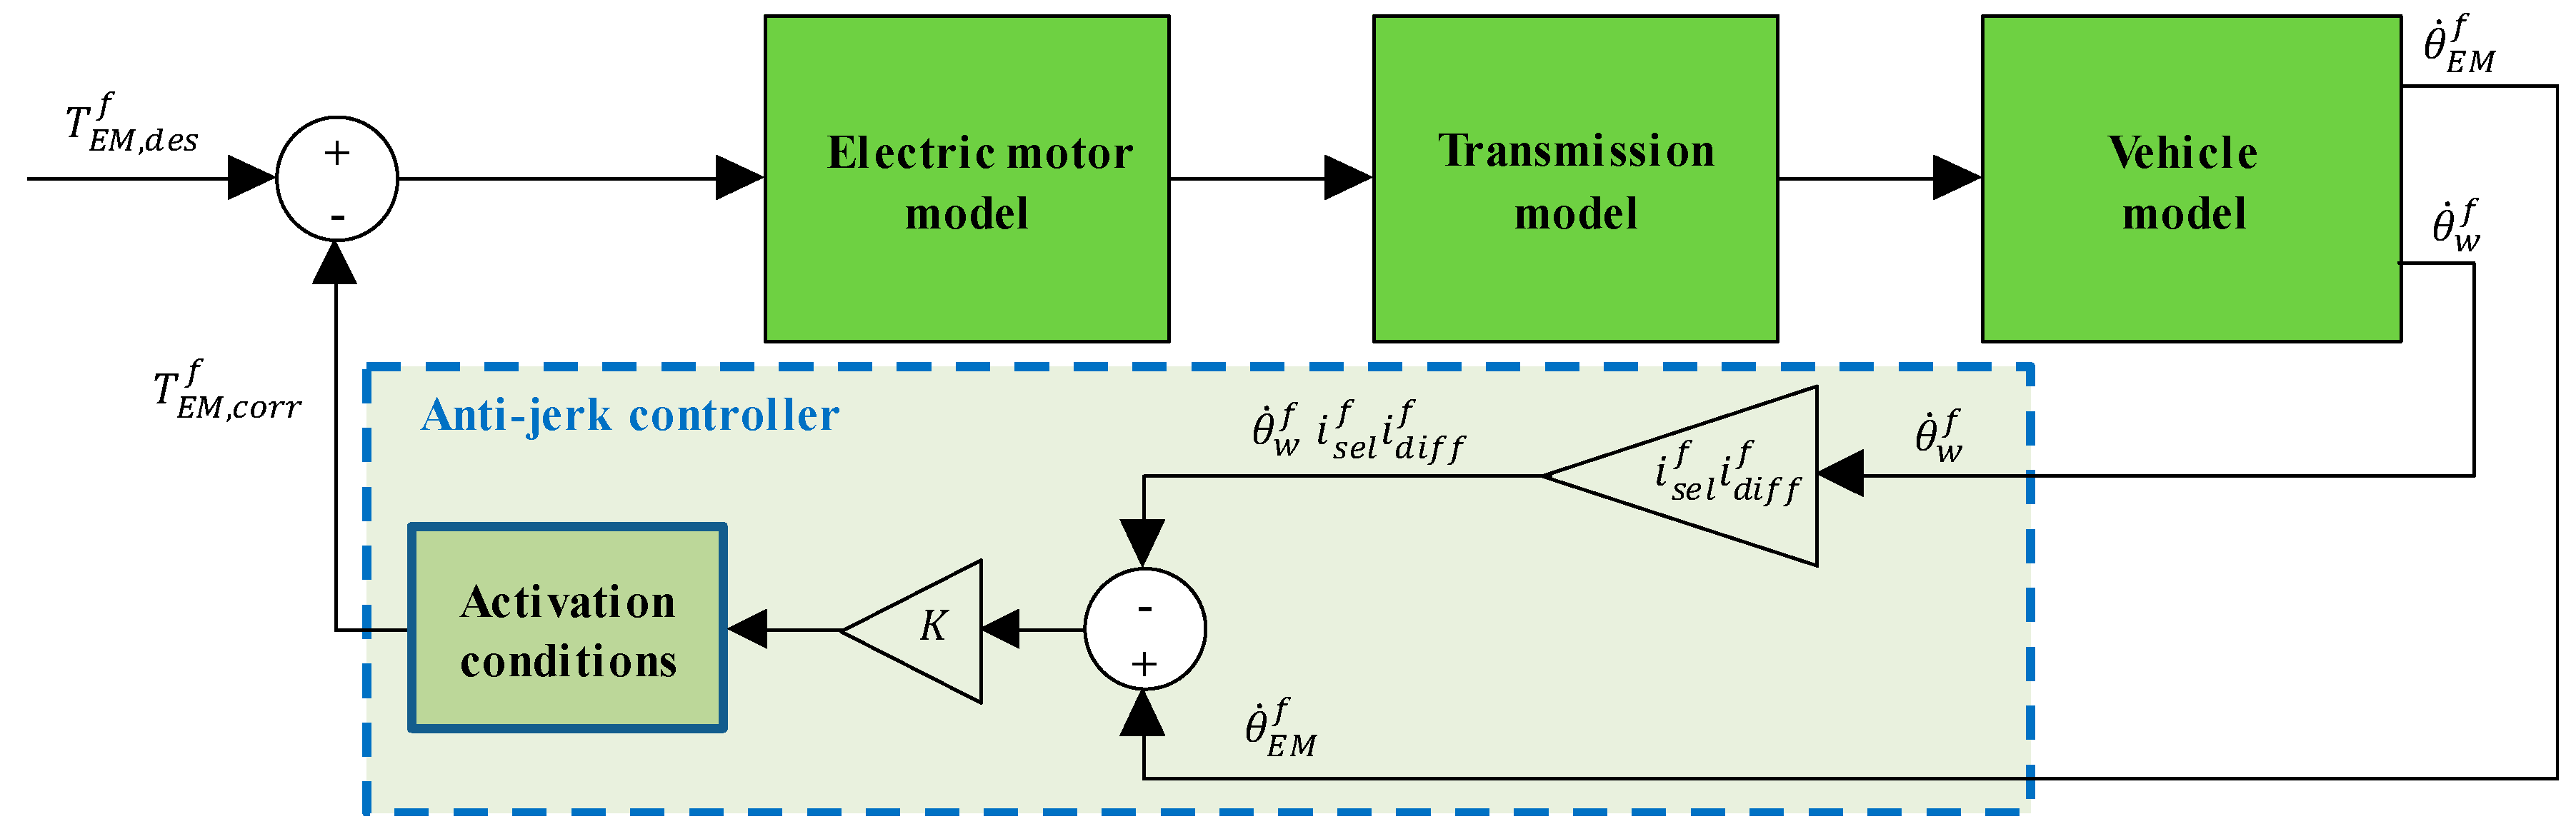
3.2. Anti-Jerk Controller

The implemented anti-jerk controller, i.e., the controller damping the torsional drivetrain oscillations, is based on a tachometric feedback architecture [2,35], in which, in a first approximation, the corrective anti-jerk torque, T E M , c o r r f , reported for the front powertrain, is proportional to the drivetrain torsion rate (see also Figure 7).
T E M , c o r r f = K ( θ ˙ E M f θ ˙ w f i s e l f i d i f f f )
A gain scheduling approach as a function of the vehicle speed and selected gear ratio was adopted to obtain rather uniform performance along the variety of possible operating scenarios. Appropriate activation and deactivation conditions were defined, e.g., the anti-jerk controller is not active during the interventions of the traction controller or during gearshift actuation.
The tuning of the anti-jerk controller was performed through simulation-based iterations, for a set of tip-in and tip-out tests, i.e., manoeuvres characterized by abrupt positive and negative variations of the powertrain torque. The tuning objective was to reduce the longitudinal acceleration oscillations, and in particular the first overshoot or undershoot following the torque demand variation, without excessive penalization of powertrain responsiveness.

3.3. Drivability Assessment

Figure 8 presents the effect of the anti-jerk controller on the longitudinal acceleration response of the four EV configurations, along a tip-in test from an initial torque level required to keep a constant EV speed of 10 km/h, to the maximum motor torque demand. No gearshift is actuated in the 2-speed configurations. The initial gear is the first one for the layouts with 2-speed transmission systems, which, given the larger gear ratio, show higher average values of the longitudinal vehicle acceleration. The lowest steady-state value of the longitudinal acceleration is associated with the single-speed 4WD layout, and is caused by the smaller gear ratio and marginal mass increase due to the second driven axle.
All configurations without anti-jerk control respond with major oscillations, which severely degrade drivability. The 4WD layouts are more responsive and prone to oscillations, because of the reduced time constant of their electric machines, which increases the excitation level of the torsional drivetrain dynamics. Without anti-jerk controller, in the 2-speed 2WD EV the oscillations are attenuated by the intervention of the traction controller, which reduces the wheel torque demand to prevent wheel spinning. A minor intervention of the traction controller also occurs in the single-speed 2WD case.
The proposed anti-jerk control scheme brings consistent performance improvements in all EV configurations, e.g., with a reduction of the first acceleration peak by more than 1.5 m/s2 for the 2-speed 4WD EV (L4), and a general compensation of the oscillations in less than 0.3 s after the application of the tip-in torque.
For the test in Figure 8, Table 3 reports the values of typical drivability performance indicators (see also the standards ISO 2631 [36] and ISO 8041 [37]):
  • The fourth-power vibration dose value of the longitudinal acceleration, V D V a ˜ , evaluating the vehicle comfort level:
    V D V a ˜ = t 1 t 2 a ˜ 4 d t 4
    where a ˜ ( t ) is the difference between the actual EV acceleration profile, a ( t ) , and the acceleration value, a s s = a ( t 2 ) , computed at the time t 2 = 1.5 s, in which the acceleration can be considered stabilized to its steady-state value in all controlled configurations:
    a ˜ ( t ) = a ( t ) a s s
    t 1 is the time in which a ˜ crosses zero for the first time during the tip-in.
  • The root-mean-square value of a ˜ , i.e., R M S a ˜ :
    R M S a ˜ = 1 t 2 t 1 t 1 t 2 a ˜ 2 d t  
  • The difference of the resulting EV speeds at t = t 2 , without and with anti-jerk controller, i.e., V A J o f f ( t 2 ) and V A J o n ( t 2 ) :
    Δ V = V A J o f f ( t 2 ) V A J o n ( t 2 )
    which evaluates the degradation of the acceleration performance induced by the controller.
  • The response time,   t r e s p , evaluated as the difference between the times in which the longitudinal acceleration profile crosses 90% and 10% of a s s for the first time after the variation of the torque demand request.
  • The settling time, t s e t t , i.e., the time that is required for a to remain within a given range of percentage (2.5%) of a s s , evaluated in the interval [ t 1 , t 2 ] .
  • The peak response time, t p e a k , evaluated as the difference between the time of the first acceleration peak, and the time corresponding to the first crossing of a s s after the variation of torque demand request.
  • The overshoot, O S , expressed in percentage, calculated from the difference between the peak acceleration value and a s s .
  • The integral (normalized with time) of the absolute value of the anti-jerk control actions, which evaluates the magnitude of the control effort:
    I A C A = 1 t 2 t 1 t 1 t 2 ( | T E M , c o r r f | + | T E M , c o r r r | ) d t
The indicators confirm the qualitative behaviors observed in Figure 8, with the 4WD layouts characterized by higher responsiveness and reduced comfort with respect to the 2WD layouts, and a major performance improvement provided by the anti-jerk controllers in all EV configurations.
In reality, when considering the operation of the EV beyond the specific tip-in test, the simplicity of the adopted 2-speed transmission layout, which is needed to limit the cost of the multiple-speed EV configurations, originates drivability limitations in maneuvers involving gearshifts at high torque demand. This is shown in the second tip-in test of Figure 9 (with a lower torque gradient than the one in Figure 8), in which: (i) the 2-speed 2WD EV performs an upshift; and (ii) the 2-speed 4WD EV is subject to a gearshift from the first to the second gear on the front axle, and then from the first to the second gear on the rear axle. Each gearshift has a duration of approximately 0.8 s. In these conditions, the gearshift torque-fill strategy of the 2-speed 4WD EV [21] is not effective, since the axle not involved in the gearshift is already operating at its torque limit and cannot be used for filling in the torque gap during the gearshift of the other axle. This can originate a decay of the drivability performance in real driving conditions, which shifts the balance of the comparison toward the single-speed solutions.

4. Routine for Selection of Optimal Gear State and Front-to-Total Wheel Torque Distribution

4.1. Structure of the Optimization Routine

With the exception of the single-speed 2WD layout (L1), the considered EV configurations are characterized by actuation redundancy in many operating conditions, i.e., a given wheel torque demand can be achieved through multiple transmission states and/or front-to-total wheel torque distributions. Obviously, the selection of the state and torque distribution has an impact on the EV energy consumption. Therefore, for fairness of comparison, an off-line optimization routine was implemented to calculate the commands that minimize the instantaneous powertrain power loss for each EV speed and wheel torque demand. The optimal actuations are compiled in look-up tables, which are used by the on-line controllers. Because of the relatively limited number of decision variables, a brute-force search algorithm was adopted for the generation of the look-up tables.
The optimization process is summarized in Figure 10. The routine, detailed in De Pinto et al. [21] for L4, defines a grid of operating points, ( V h , T w , j ) , in terms of EV speed and total wheel torque, each of them identified by the indices h and j (see Figure 11a). The limits of the grid depend on the gear ratios and motor torque characteristics of each EV architecture. In braking, the results of the optimization routine are generated up to the maximum regenerative capability of each EV configuration, see the ‘Maximum possible regen. torque’ curves in Figure 11b. However, in the on-line implementation, the regenerative torque area has been limited as indicated by the ‘Maximum actual regen. torque’ characteristics. In fact, after a progressive transition from regenerative braking to dissipative braking, at very low speed it is desirable to use only the friction brakes to stop the vehicle, in accordance with the current common practice on production EVs. Note that the case study EV is characterized by a conventional hydraulic braking system, which does not allow the implementation of the most advanced continuous brake blending algorithms.
After the definition of the grid, for the selected values of h and j , the optimization routine iterates the following steps:
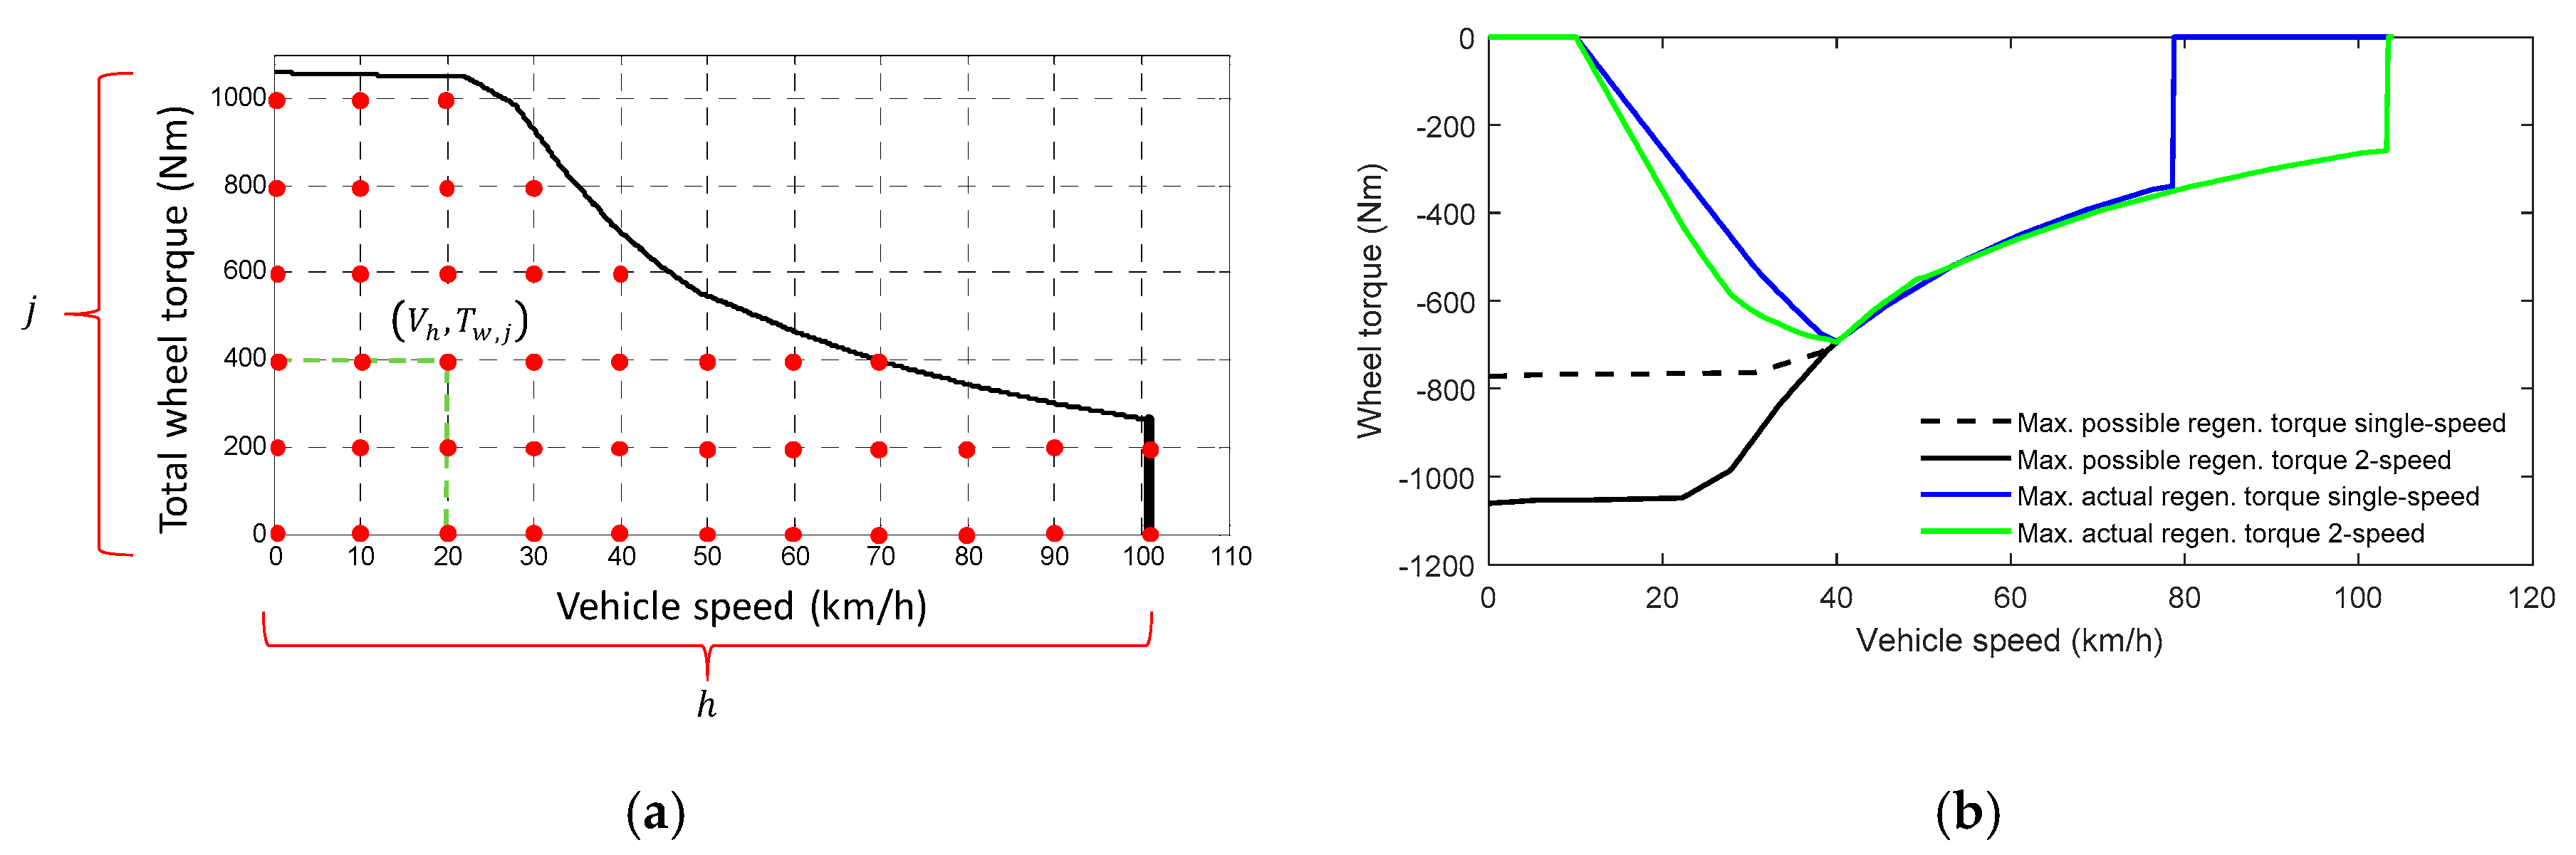
  • Step 1: Computation of the longitudinal vehicle acceleration, a h , j , n , for each feasible EV state, n , under the assumption of known road gradient:
    a h , j , n = T w , j F a e r o ( V h ) R w F r o l l ( V h ) R w m g R w s i n α m a p p , n R w
    where the apparent vehicle mass, m a p p , n , function of n , is:
    m a p p , n = m + 4 J w R w 2 + J e q g 1 / g 2 / d i s f R w 2 + J e q g 1 / g 2 / d i s r R w 2  
    J e q g 1 / g 2 / d i s f / r represents the equivalent mass moment of inertia of the rotating parts of the considered powertrain. The feasibility of a state corresponds to its capability of generating the required wheel torque at the assigned speed. An approximate option, available in the routine, is to neglect the inertial effects in Steps 1–2, which simplifies the problem without significant drawbacks, especially if the vehicle is not equipped with an on-line estimator of mass and road gradient.
  • Step 2: Computation of the sum, P l o s s , h , j , n , l , of the transmission, electric motor, inverter and rolling resistance power losses at the selected grid point ( V h , T w , j ) , for each of its feasible states and—where relevant depending on the state—along a further grid, defined by the index l , covering the feasible range of front-to-total wheel torque distributions. The front-to-total torque distribution corresponds to the inner loop of the routine. In the most general case, corresponding to L4, P l o s s , h , j , n , l is given by:
    P l o s s , h , j , n , l = P l o s s , E M + D f ( T E M , h , j , n , l f , θ ˙ E M , h , n f ) + P l o s s , E M + D r ( T E M , h , j , n , l r , θ ˙ E M , h , n r ) + P l o s s , t r f ( T t r , h , j , n , l f , θ ˙ E M , h , n f ) + P l o s s , t r r ( T t r , h , j , n , l r , θ ˙ E M , h , n r ) + P r o l l f ( V h , a h , j , n , n ) + P r o l l r ( V h , a h , j , n , n )
    where P l o s s , E M + D f / r , P l o s s , t r f / r and P r o l l f / r are provided in the form of maps. The motor drive and transmission power loss maps are functions of the respective input torque and angular speed, calculated for the specific grid point through a backward facing rigid drivetrain model. The tire slip power losses are neglected by the optimization routine.
  • Step 3: Selection of the state, n h , j * , and (where applicable) front-to-total torque distribution, l h , j * , which minimize the drivetrain power losses for the operating condition defined by h and j :
    { n h , j * , l h , j * } = arg min P l o s s , h , j , n , l
    n h , j * and l h , j * are stored in the look-up tables of the on-line implementation of the controller.
  • Step 4: Selection of new values of h and j on the defined grid and repetition the process from Step 1.

4.2. Optimal State Selection for the 2-Speed 2WD Layout (L2)

In this case, the whole required traction or regenerative torque is delivered by one drivetrain, and the undriven axle only produces a rolling resistance torque, unless the friction brakes are activated. Equation (24) is simplified into:
P l o s s , h , j , n = P l o s s , E M + D f ( T E M , h , j , n f , θ ˙ E M , h , n f ) + P l o s s , t r f ( T t r , h , j , n f , θ ˙ E M , h , n f ) + P r o l l f ( V h , a h , j , n ) + P r o l l r ( V h , a h , j , n )
The resulting optimal gearshift map for traction conditions is presented in Figure 12a.

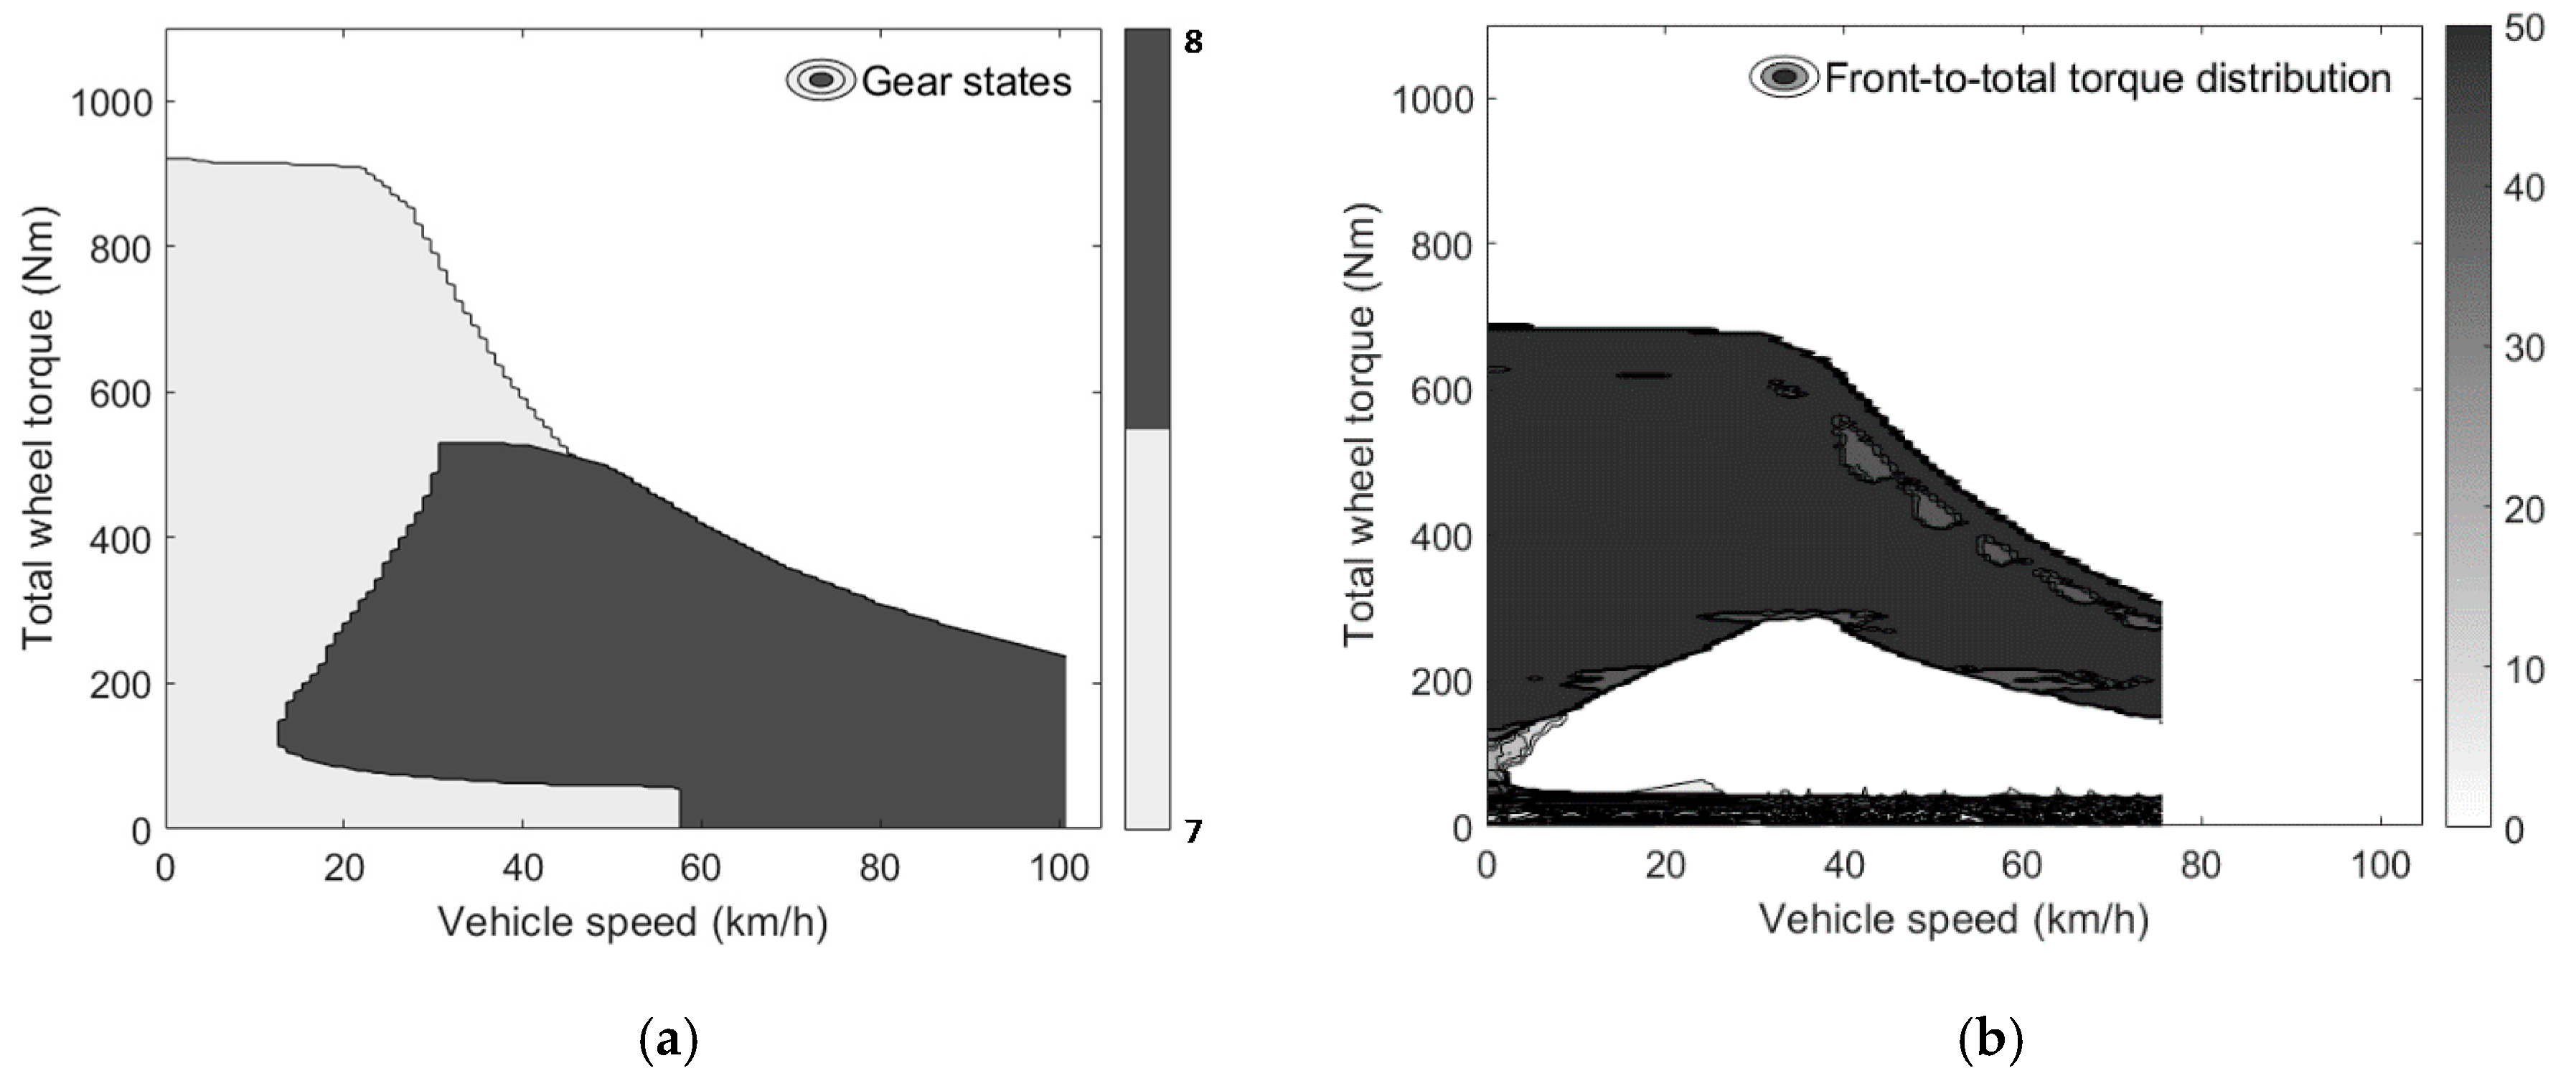
4.3. Single-Speed 4WD Layout (L3)

For the single-speed 4WD vehicle, the optimization variable is the front-to-total wheel torque distribution. For the operating condition defined by the indices h , j , and l , the resulting power loss function is:
P l o s s , h , j , l = P l o s s , E M + D f ( T E M , h , j , l f , θ ˙ E M , h f ) + P l o s s , E M + D r ( T E M , h , j , l r , θ ˙ E M , h r ) + P l o s s , t r f ( T t r , h , j , l f , θ ˙ E M , h f ) + P l o s s , t r r ( T t r , h , j , l r , θ ˙ E M , h r ) + P r o l l f ( V h , a h , j ) + P r o l l r ( V h , a h , j )
The optimal front-to-total torque distribution map in traction conditions is in Figure 12b, which shows: (i) an optimal even front-to-total wheel torque distribution region, i.e., with the same torque on the two axles, at low and high torque demands; and (ii) an optimal single axle region for medium values of torque demand. The rear axle was selected for single axle operation for the specific EV, given that the longitudinal load transfer in traction increases the longitudinal force capability of the rear axle. These results are consistent with the available literature, demonstrating that, under specific assumptions, for identical powertrains the energy-efficient torque distribution implies either single axle operation or even wheel torque distribution [38].

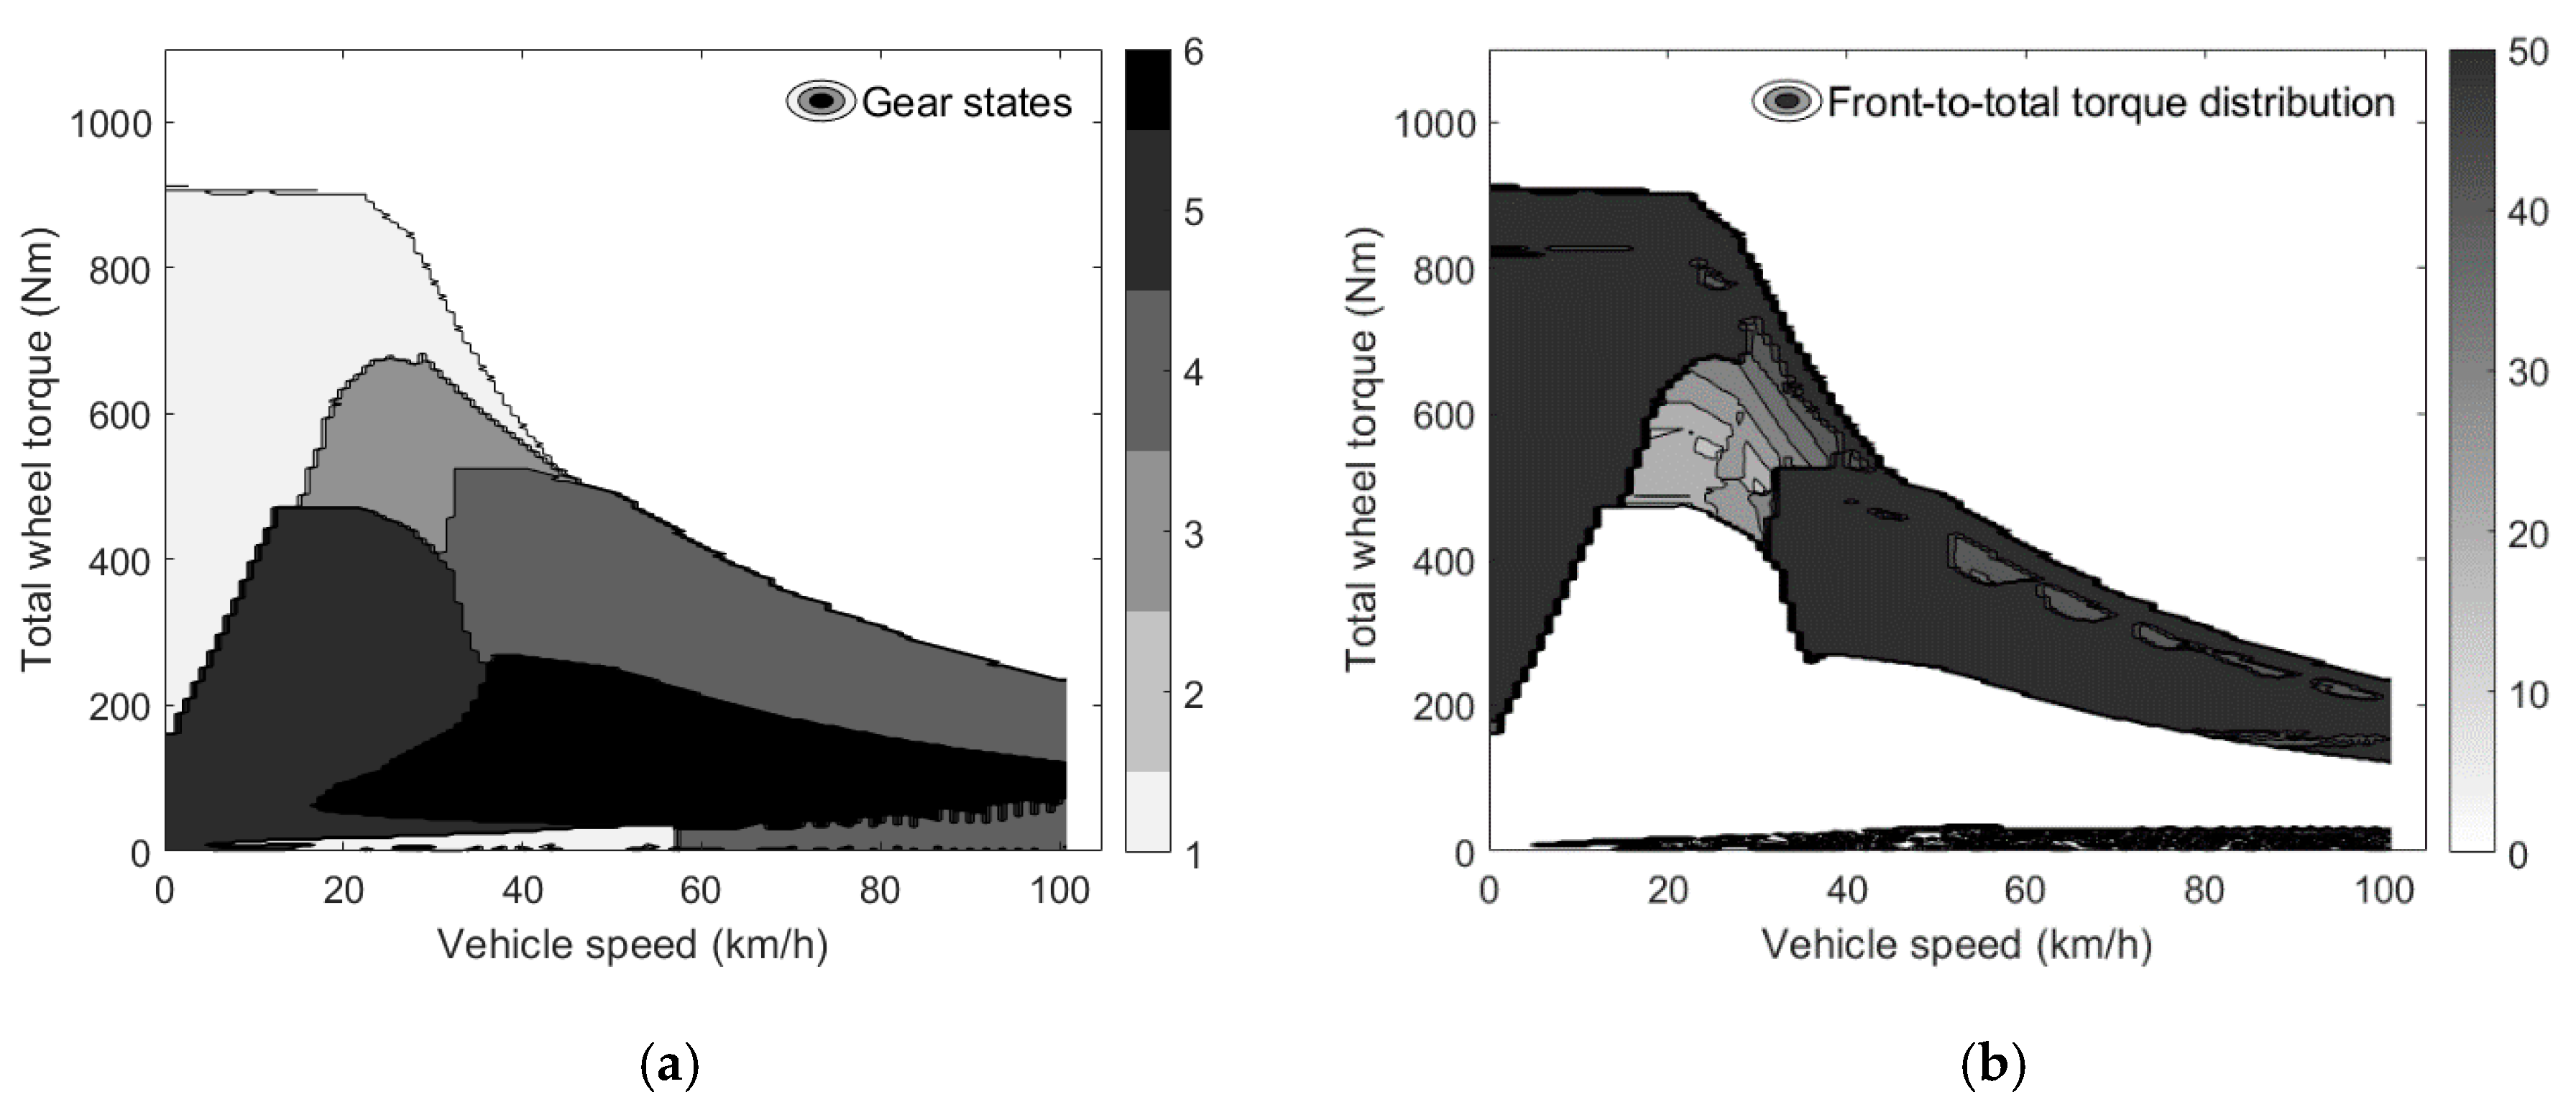
4.4. 2-Speed 4WD Layout (L4)

In the 2-speed 4WD vehicle, both relevant variables, i.e., the transmission state and front-to-total wheel torque distribution, are optimized. The optimal maps are presented in Figure 13. The results have been post-processed and filtered to avoid irregularities, since symmetric states on the front and rear drivetrains can provide the same optimal result while leading to frequent state switching.
The increased number of available gearbox states results in a more varied optimal state map. The front-to-total torque distribution map shows similar characteristics to the one of the single-speed 4WD vehicle (L3). Interestingly, a significant part of the operating region is characterized by single-axle operation, or even distribution operation. Different levels of front-to-total wheel torque distribution occur for the states with different gear ratios on the two axles.

5. Acceleration, Gradeability, and Consumption Results

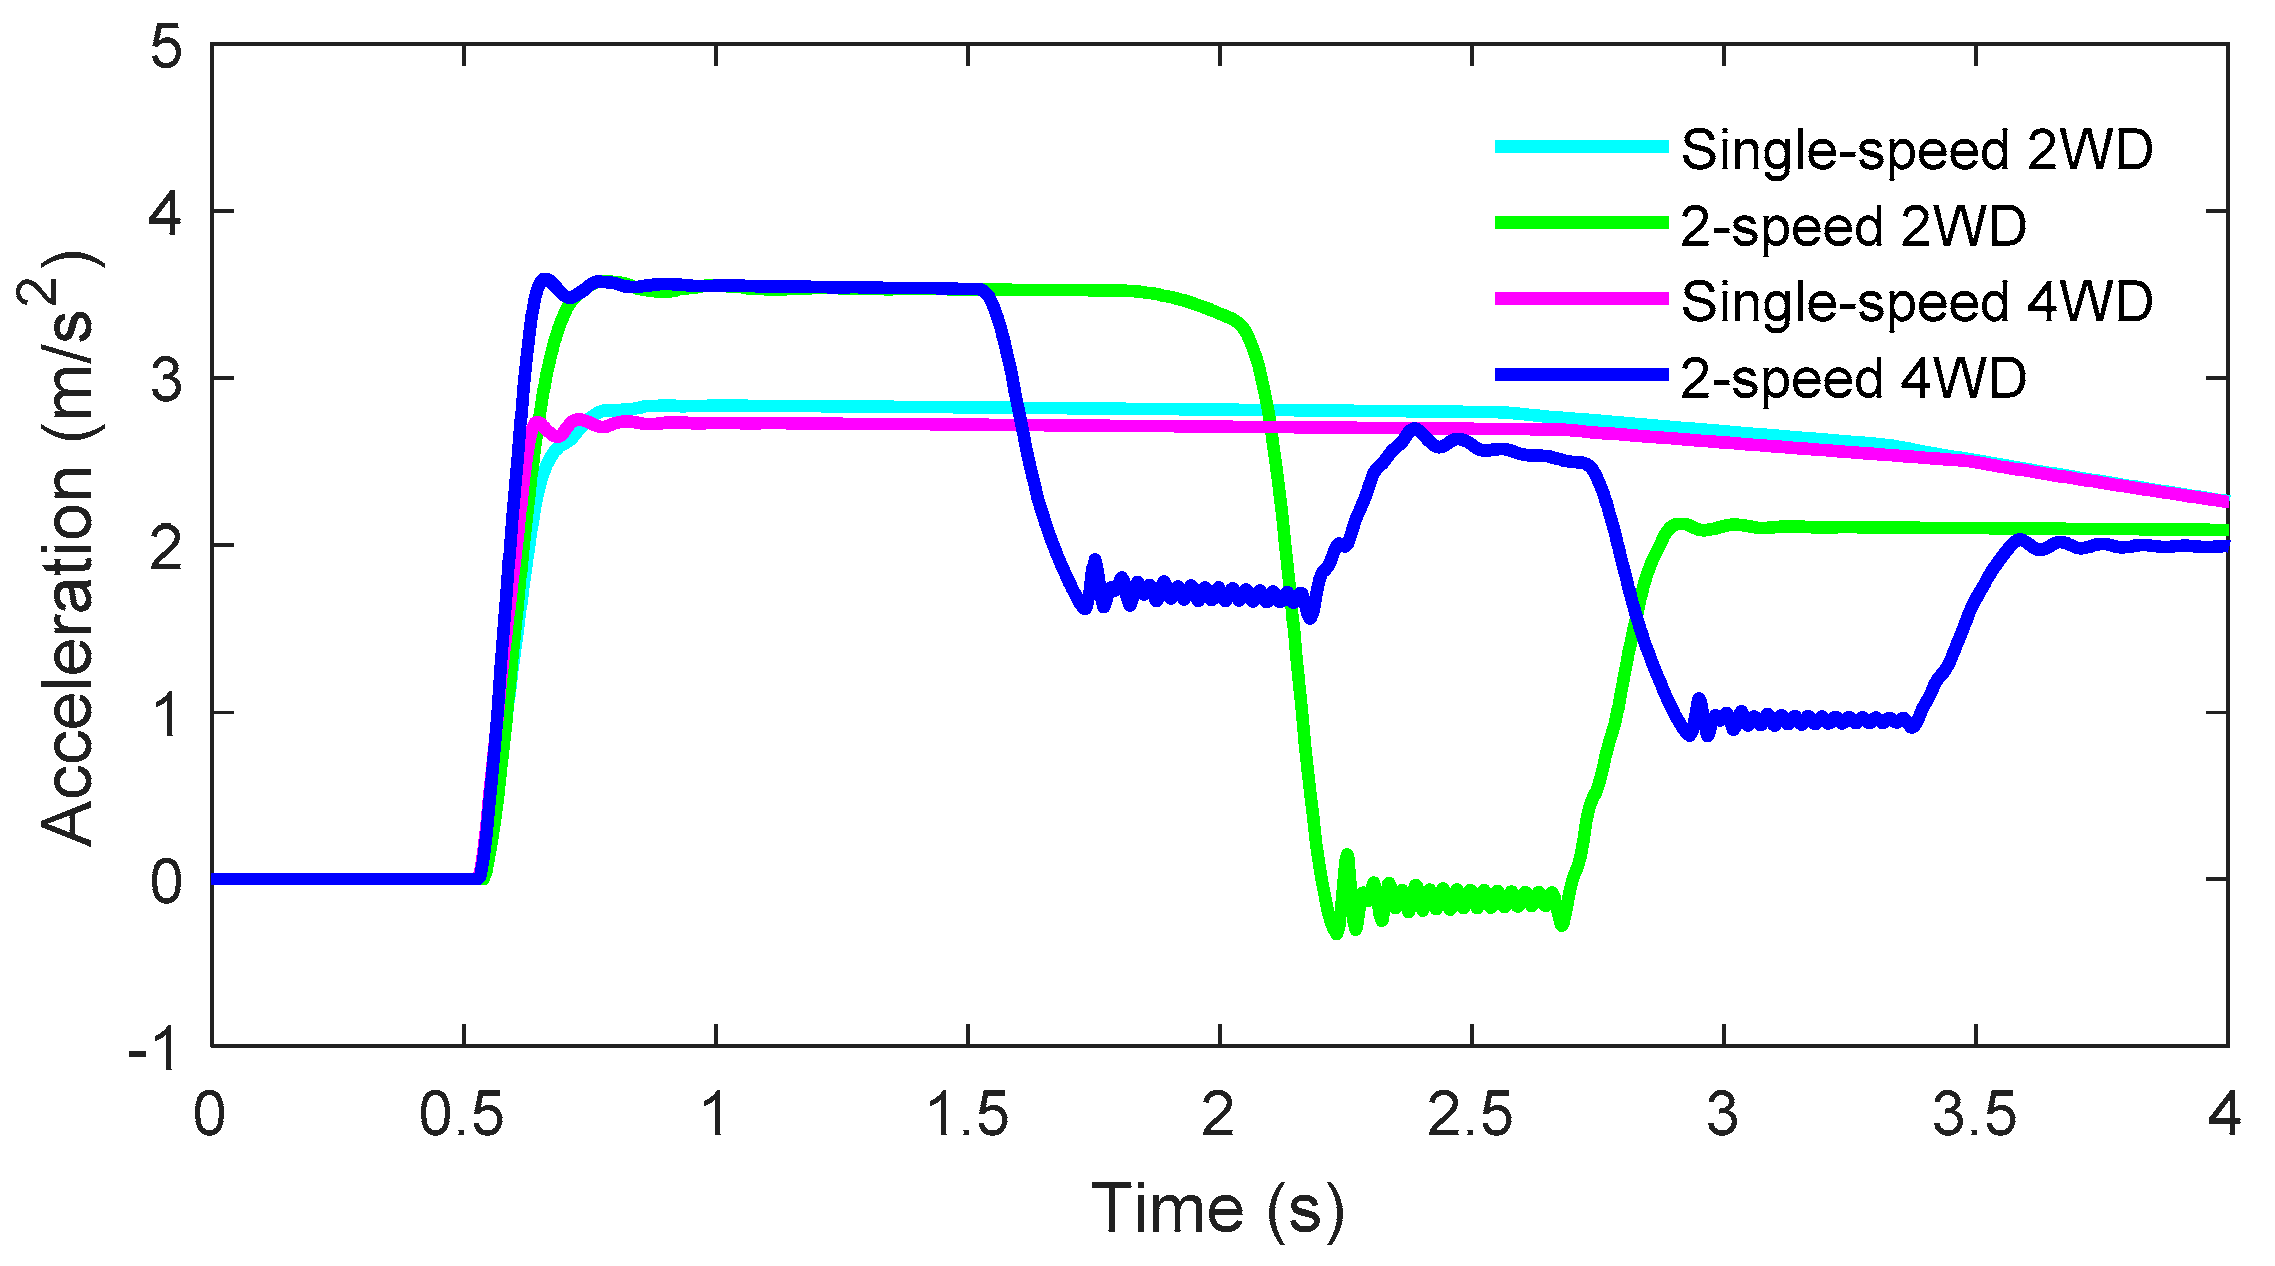
5.1. Acceleration and Gradeability Performance

The vehicle acceleration and top speed results for the considered EV configurations are presented in Table 4. The top speed is 78.7 km/h for the single-speed EVs, and 103.2 km/h for the 2-speed configurations; in all cases the top EV speed is limited by the maximum angular speed of the electric machines, rather than by the available motor power. Because of the higher gear ratio in first gear, the EV configurations with 2-speed transmissions show a significant improvement in the longitudinal acceleration performance below 30 km/h; on the other hand, they have higher 0–50 km/h and 0–70 km/h acceleration times, which are caused by the gearshifts and associated wheel torque gap, especially evident for the L2 case, see also Figure 9. The 0–30 km/h acceleration time is lower for L4 with respect to L2 because of the better traction capability of the 4WD layout, which does not require the intervention of the traction controller in high tire-road friction conditions. Another factor that affects the results, in particular in terms of 0–70 km/h acceleration time, is the mass of the different EV variants.
For each EV layout, Figure 14 reports the maximum achievable road gradient, as a function of: (a) the tire-road friction coefficient, from standstill conditions; and (b) vehicle speed, for high tire-road friction conditions. Although the performance of all cases is deemed adequate, the results show: (i) the improved traction capability in low friction conditions provided by the 4WD layouts, which can enhance active safety on critical terrains; and (ii) the enhanced gradeability in high tire-road friction conditions, offered by the layouts equipped with 2-speed transmission systems.

5.2. Energy Consumption

This Section presents two sets of energy consumption values for L2-4, corresponding to: (i) the normal mode, which, for the 2-speed layouts, performs the gearshifts according to a typical gear selection map provided by the transmission manufacturer, using the current EV speed and axle torque demand. The upshift is carried out at relatively low motor speed for low torque demands, and at the speed limit of the first gear during operation at the maximum torque demand. In the 4WD configuration, to provide torque-fill functionality, the gearshift maps are characterized by an offset with respect to the EV speed, to ensure that only one gearshift is carried at a time at the vehicle level. In normal mode, the 4WD layouts operate with a 50% front-to-total wheel torque distribution; and (ii) the optimal mode, using the optimal gear states and front-to-total wheel torque distributions, according to the maps obtained in Section 4. For the single-speed 2WD EV (L1), there is a single operating state, so no optimal mode is available.
Table 5 presents the energy consumption results at constant speed, and their percentage difference with respect to the single-speed 2WD EV; positive differences, implying higher consumption, are in red, while negative differences are in green. The important conclusion is that, in most constant speed conditions, the additional mass of the complex powertrain configurations, which increases the wheel torque level to keep constant speed, is not compensated by the more efficient operation of the EV. This is especially evident in normal mode, in which the consumption increases with the complexity of the EV layout at all speeds, e.g., from 3.3% to 7.2% at 30 km/h, and from 0.9% to 2.8% at 70 km/h. The optimized energy management system consistently reduces the energy consumption, especially for the L4 EV, which is characterized by the highest level of operational flexibility. In L4, the energy consumption reduction associated with the optimal energy management, with respect to the normal mode for the same EV layout, is in excess of 4% at all considered speeds. In any case, at 30 km/h and 50 km/h, the most efficient configuration is the single-speed 2WD layout (L1), also in comparison with the optimal mode of the more complex EV configurations. On the other hand, interestingly, at 70 km/h in the optimal mode, both 4WD layouts consume less than L1, i.e., by 2.6% for L3, and 5.6% for L4.
The energy consumption performance of the EV configurations in normal and optimal modes was assessed through the nonlinear simulation model in Section 2.2, along: (i) the urban part of the New European Drive Cycle (NEDC), i.e., for four repetitions of the so-called ECE-15 cycle, and (ii) the Japanese 10–15 mode test cycle (J10–15). For example, Figure 15 reports the time profiles of EV speed, front and rear motor torque as well as gear state, during a section of the J10–15, for the two modes of the 2-speed 4WD EV configuration. The torque-fill capability of L4 during gearshifts at low-to-medium torque demands is evident from: (a) the regularity of the speed profile, with seamless EV acceleration also during the gearshifts, and (b) the ripples in the electric motor torque profiles of the axle not involved in the gearshift, which compensate for the torque gap during the gearshifts on the other axle. The inclusion of the gearshift dynamics in the simulation model allows to realistically account for the motor drive power losses also during the state transition phases.
Table 6 includes the complete set of energy consumption results. Along the selected driving cycles, L2-4 show significant energy consumption reductions, compared to the single-speed 2WD vehicle (L1); in particular, the benefit ranges from 5.7% to 8.2% in normal mode, and from 8.0% to 9.8% in optimal mode, during the NEDC; and from 3.1% to 5.9% in normal mode, and from 5.7% to 9.0% in optimal mode, during the J10–15. The analysis of the powertrain efficiency profiles in the time domain highlighted that, for the specific EV parameters, the 2-speed and 4WD configurations allow a major enhancement of the powertrain efficiency, including motor drive and mechanical transmission, for the torque levels that are typical of the acceleration/deceleration phases of the cycles. Very interestingly, in both driving schedules, the best energy consumption performance is achieved by the single-speed 4WD EV (L3), which, with respect to L1, provides the most effective trade-off between the efficiency enhancement allowed by the increased operational flexibility of the electric machines, and the penalty associated with the mass increase.

6. Conclusions

The implementation of 4-wheel-drive electric vehicle configurations with a single central motor per axle, as well as the adoption of 2-speed transmission systems, could lead to acceleration, gradeability and energy consumption benefits, in comparison with the conventional single-speed 2-wheel-drive electric vehicle configuration. However, the existing literature lacks analyses objectively comparing 2WD and 4WD EV layouts. To cover the gap, for a case study light passenger car prototype for urban mobility, this study compared four powertrain layouts. An optimization routine for the energy-efficient selection of the gear state and front-to-total wheel torque distribution was implemented to ensure fairness of the results. Based on the analysis for the specific EV, the main conclusions are as follows:
  • The fast dynamics of typical traction motors, in conjunction with the low mechanical damping of electric drivetrains, can provoke significant resonances and torsional vibrations of the driveline. The electrical dynamics and mass moment of inertia of the electric machine/s, together with the transmission gear ratio and torsion stiffness of the half-shafts, are the key parameters affecting the magnitude and frequency of the resulting vibrations.
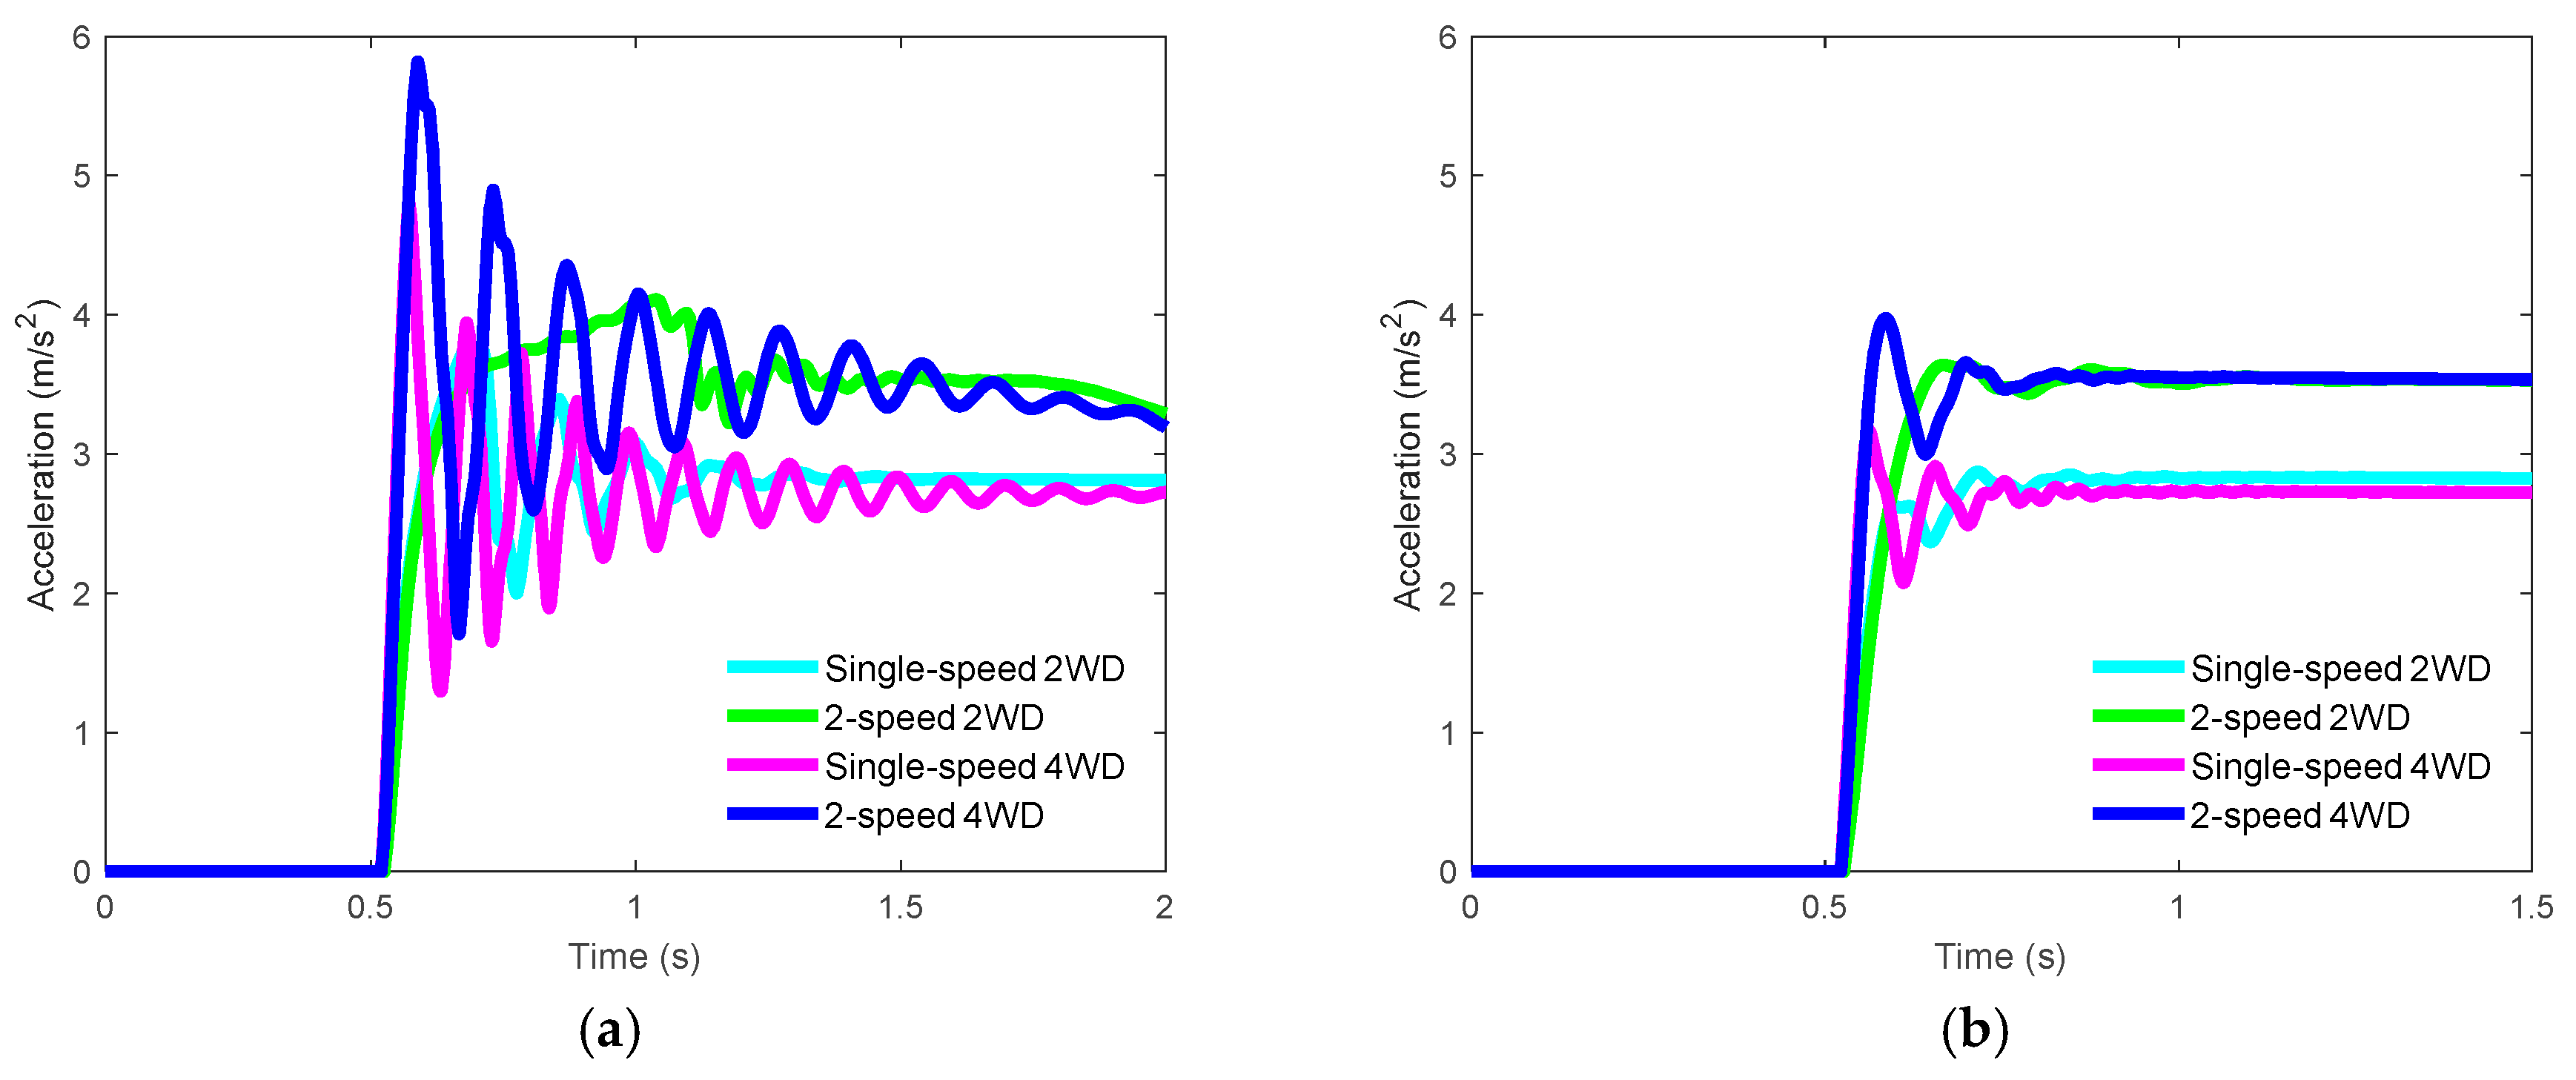
  • 2-speed transmission systems and 4WD layouts add complexity and criticalities to the drivability response of the EV, and thus to the tuning of the anti-jerk controller. Without anti-jerk control, typical electric powertrains with central motor excite significant oscillations of the longitudinal acceleration of the EV during tip-in tests. The vibrations are effectively compensated by the proposed anti-jerk control scheme in all considered EV configurations, with a more reactive response of the 4WD layouts.
  • At high torque demand, the gearshift dynamics significantly penalize the drivability and longitudinal acceleration performance of the EV layouts with the considered 2-speed transmission systems, as in these conditions the axle not involved in the gearshift cannot compensate for the wheel torque gap on the other axle. Despite this inconvenience, 2-speed transmissions expand the high efficiency operating region of the powertrain and increase top speed and gradeability.
  • In terms of energy consumption, for the case study EV, during constant speed operation, i.e., at low torque demands, the prevailing effect is the mass increase associated with the advanced powertrain configurations. Hence, the best energy consumption performance is provided by the conventional single-speed 2WD EV layout. On the contrary, the increased flexibility in the operating conditions of the electric powertrains, provided by the more advanced EV architectures, reduces the energy consumption along driving cycles, with the single-speed 4WD vehicle achieving the lowest consumption.
  • The single-speed 4WD layout does not require transmission controllers nor gearshift actuators, and, for the case study EV, can be considered an effective configuration, achieving a good compromise between predictable drivability, acceleration performance, gradeability for a variety of friction conditions, and energy consumption.
Future developments will extend the analysis of this paper to a wider range of case study EVs, with different electric motor technologies and performance characteristics of the powertrain components, to derive general conclusions and recommendations on the convenience of the analyzed layouts.

Author Contributions

Conceptualization and methodology, S.D.P., P.C., C.C., and A.S.; formal analysis, S.D.P., P.C., C.C., F.B., G.M., and A.S.; resources, P.P. and A.S.; writing—original draft preparation, S.D.P., P.C., C.C., F.B. and A.S.; writing—review and editing, A.S.; supervision, F.B., G.M. and A.S.; project administration and funding acquisition, P.P. and A.S. All authors have read and agreed to the published version of the manuscript.

Funding

The research leading to these results has received funding from the European Union’s Seventh Framework Programme FP7/2007-2013 (PLUS-MOBY) under grant agreement n° 605502.

Conflicts of Interest

The authors declare no conflict of interest.

Nomenclature

a Longitudinal vehicle acceleration.
a ˜ Longitudinal vehicle acceleration difference with respect to the steady-state value (see Section 3).
C Longitudinal slip stiffness.
F Force.
g Gravitational acceleration.
h Index corresponding to the vehicle speed value within the discrete grid (also used as a subscript).
H Transfer function from wheel torque demand to angular vehicle acceleration.
i Transmission gear ratio.
I A C A Integral (normalized with time) of the absolute value of the control action.
j Index corresponding to the wheel torque value within the discrete grid (also used as a subscript).
J Mass moment of inertia.
k Torsional stiffness.
K Anti-jerk controller gain.
l Index indicating the front-to-total wheel torque distribution within the discrete grid (also used as a subscript).
L Length.
m Vehicle mass.
n Index indicating the vehicle state number (also used as a subscript).
O S Overshoot.
p Torque distribution factor.
P Power.
R Radius.
R M S Root mean square.
s ,   j ω Laplace operator and its imaginary part.
t Time.
T Torque.
V Vehicle speed.
V D V Fourth-power vibration dose value.
x Gearbox actuator position.
α Angle defining the longitudinal road gradient.
β Torsional damping coefficient.
θ ,   θ ˙ ,   θ ¨ Angular position, speed, acceleration.
η Efficiency.
σ Slip ratio.
τ Time constant or pure time delay.
ϕ Phase angle difference between front and rear motor inputs.
The following subscripts and superscripts indices are used in this article:
a c t Gearbox actuator.
a e r o Aerodynamic drag.
a p p Apparent.
A J Anti-jerk controller.
A J o f f Deactivated anti-jerk controller.
A J o n Activated anti-jerk controller.
b r Brake.
c o r r Corrective.
d Delay.
d e m Demand.
d e s Desired (or reference) value.
d i f f Differential.
E M Electric motor.
E M + D Electric motor and drive.
e q Equivalent.
f Front.
g 1 , g 2 ,   d i s Gear 1, gear 2, disengaged gear.
H S Half-shaft.
L Left.
l o s s Loss (referred to a power).
p e a k Peak of the response.
P S ,   S S Primary shaft, secondary shaft.
r Rear.
r e l Tire relaxation.
r e q Requested.
R Right.
r e s p Response time.
r o l l Rolling resistance.
s s Steady-state.
s e l Selected gear ratio (first, second or neutral).
s e t t Settling time of the response.
t r Transmission.
v Vehicle.
w Wheel.
w & f Windage and friction.
* Optimal value.
0 Initial condition or linearization point.
1 Initial point of relevant interval.
2 Final point of relevant interval.

References

  1. Wu, G.; Zhang, X.; Dong, Z. Powertrain architectures of electrified vehicles: Review, classification and comparison. J. Frankl. Inst. 2015, 352, 425–448. [Google Scholar] [CrossRef]
  2. De Novellis, L.; Sorniotti, A.; Gruber, P.; Orus, J.; Rodriguez Fortun, J.M.; Theunissen, J.; De Smet, J. Direct yaw moment control actuated through electric drivetrains and friction brakes: Theoretical design and experimental assessment. Mechatronics 2015, 26, 1–15. [Google Scholar] [CrossRef] [Green Version]
  3. Murata, S. Innovation by in-wheel-motor drive unit. Veh. Syst. Dyn. 2012, 50, 807–830. [Google Scholar] [CrossRef]
  4. Shao, L.; Hartavi Karci, A.E.; Tavernini, D.; Sorniotti, A.; Cheng, M. Design approaches and control strategies for energy-efficient electric machines for electric vehicles—A review. IEEE Access 2020, in press. [Google Scholar] [CrossRef]
  5. Mutoh, N.; Kazama, T.; Takita, K. Driving characteristics of an electric vehicle system with independently driven front and rear wheels. IEEE Trans. Ind. Electron. 2006, 53, 803–813. [Google Scholar] [CrossRef]
  6. Sinha, P.; Agrawal, V. Evaluation of electric-vehicle architecture alternatives. In Proceedings of the IEEE Vehicle Power and Propulsion Conference (VPPC), Chicago, IL, USA, 6–9 September 2011. [Google Scholar]
  7. ISO. Road Vehicles—Functional Safety; ISO/FDIS Standard No. 26262:2018; ISO: Geneva, Switzerland.
  8. Available online: https://www.rimac-automobili.com/en/hypercars/c_two/ (accessed on 15 June 2020).
  9. Direct-Drive in-Wheel Motors. Available online: https://in-wheel.com/en/solutions/direct-drive-in-wheel-motors/ (accessed on 15 June 2020).
  10. De Filippis, G.; Lenzo, B.; Sorniotti, A.; Gruber, P.; De Nijs, W. Energy-efficient torque-vectoring control of electric vehicles with multiple drivetrains. IEEE Trans. Veh. Technol. 2018, 67, 4702–4715. [Google Scholar] [CrossRef]
  11. Tavernini, D.; Metzler, M.; Gruber, P.; Sorniotti, A. Explicit nonlinear model predictive control for electric vehicle traction control. IEEE Trans. Control Syst. Technol. 2019, 27, 1438–1451. [Google Scholar] [CrossRef]
  12. De Novellis, L.; Sorniotti, A.; Gruber, P. Design and comparison of the handling performance of different electric vehicle layouts. Proc. Inst. Mech. Eng. Part D J. Automob. Eng. 2014, 228, 218–232. [Google Scholar] [CrossRef] [Green Version]
  13. Ruan, J.; Walker, P.; Zhang, N. A comparative study energy consumption and costs of battery electric vehicle transmissions. Appl. Energy 2016, 165, 119–134. [Google Scholar] [CrossRef] [Green Version]
  14. Sorniotti, A.; Loro Pilone, G.; Viotto, F.; Bertolotto, S.; Everitt, M.; Barnes, R.; Morrish, I. A novel seamless 2-speed transmission system for electric vehicles: Principles and simulation results. SAE Int. J. Engines 2011, 4, 2671–2685. [Google Scholar] [CrossRef]
  15. Sorniotti, A.; Subramanyan, S.; Turner, A.; Cavallino, C.; Viotto, F.; Bertolotto, S. Selection of the optimal gearbox layout for an electric vehicle. SAE Int. J. Engines 2011, 4, 1267–1280. [Google Scholar] [CrossRef]
  16. Spanoudakis, P.; Tsourveloudis, N.; Koumartzakis, G.; Krahtoudis, A.; Karpouzis, T.; Tsinaris, I. Evaluation of a 2-speed transmission on electric vehicle’s energy consumption. In Proceedings of the IEEE International Electric Vehicle Conference (IEVC), Florence, Italy, 17–19 December 2014. [Google Scholar]
  17. Gao, B.; Liang, Q.; Xiang, Y.; Guo, L.; Chen, H. Gear ratio optimization and shift control of 2-speed I-AMT in electric vehicle. Mech. Syst. Signal Process. 2015, 50–51, 615–631. [Google Scholar] [CrossRef]
  18. Sorniotti, A.; Holdstock, T.; Loro Pilone, G.; Viotto, F.; Bertolotto, S.; Everitt, M.; Barnes, R.; Stubbs, B.; Westby, M. Analysis and simulation of the gearshift methodology for a novel two-speed transmission system for electric powertrains with a central motor. Proc. Inst. Mech. Eng. Part D J. Automob. Eng. 2012, 226, 915–929. [Google Scholar] [CrossRef] [Green Version]
  19. Available online: https://www.porsche.com/international/aboutporsche/e-performance/magazine/e-performance-advantages/ (accessed on 9 May 2020).
  20. De Pinto, S.; Sorniotti, A.; Gruber, P.; Camocardi, P.; Perlo, P.; Viotto, F. Gear shift control with torque-fill for a 4-wheel-drive fully electric vehicle. In Proceedings of the International Conference on Sustainable Mobility Applications, Renewables and Technology (SMART), Kuwait City, Kuwait, 23–25 November 2015. [Google Scholar]
  21. De Pinto, S.; Camocardi, P.; Sorniotti, A.; Gruber, P.; Perlo, P.; Viotto, F. Torque-fill control and energy management for a four-wheel-drive electric vehicle layout with two-speed transmissions. IEEE Trans. Ind. Appl. 2016, 53, 447–458. [Google Scholar] [CrossRef]
  22. Baraszu, R.; Cikanek, S. Torque fill-in for an automated shift manual transmission in a parallel hybrid electric vehicle. In Proceedings of the American Control Conference, Anchorage, AK, USA, 8–10 May 2002. [Google Scholar]
  23. Kwon, K.; Seo, M.; Min, S. Efficient multi-objective optimization of gear ratios and motor torque distribution for electric vehicles with two-motor and two-speed powertrain system. Appl. Energy 2020, 259, 114190. [Google Scholar] [CrossRef]
  24. Fiori, C.; Ahn, K.; Rakha, H.A. Power-based electric vehicle energy consumption model: Model development and validation. Appl. Energy 2016, 168, 257–268. [Google Scholar] [CrossRef]
  25. Bottiglione, F.; De Pinto, S.; Mantriota, G.; Sorniotti, A. Energy consumption of a battery electric vehicle with infinitely variable transmission. Energies 2014, 7, 8317–8337. [Google Scholar] [CrossRef] [Green Version]
  26. Holdstock, T.; Sorniotti, A.; Everitt, M.; Fracchia, M.; Bologna, S.; Bertolotto, S. Energy consumption analysis of a novel four-speed dual motor drivetrain for electric vehicles. In Proceedings of the IEEE Vehicle Power and Propulsion Conference (VPPC), Seoul, Korea, 9–12 October 2012; pp. 295–300. [Google Scholar]
  27. Ruan, J.; Song, Q. A novel dual-motor two-speed direct drive battery electric vehicle drivetrain. IEEE Access 2019, 7, 54330–54342. [Google Scholar] [CrossRef]
  28. Nguyen, C.T.; Walker, P.D.; Zhang, N.; Ruan, J. Efficiency improvement of a novel dual motor powertrain for plug-in hybrid electric buses. Proc. Inst. Mech. Eng. Part D J. Automob. Eng. 2020, 234, 1869–1882. [Google Scholar] [CrossRef]
  29. De Carlo, M.; Mantriota, G. Electric vehicles with two motors combined via planetary gear train. Mech. Mach. Theory 2020, 148, 103789. [Google Scholar] [CrossRef]
  30. Wu, J.; Liang, J.; Ruan, J.; Zhang, N.; Walker, P.D. Efficiency comparison of electric vehicles powertrains with dual motor and single motor input. Mech. Mach. Theory 2018, 128, 569–585. [Google Scholar] [CrossRef]
  31. Scamarcio, A.; Gruber, P.; De Pinto, S.; Sorniotti., A. Anti-jerk controllers for automotive applications: A review. Annu. Rev. Control 2020, in press. [Google Scholar]
  32. Towards a Fast Uptake of mEdium/Low-Voltage Electric Powertrains (TELL). 2019. Available online: https://horizon2020-tell.eu/ (accessed on 9 May 2020).
  33. Pacejka, H.B. Tyre and Vehicle Dynamics; Butterworth-Heinemann: Oxford, UK, 2005. [Google Scholar]
  34. Amann, N.; Böcker, J.; Prenner, F. Active damping of drive train oscillations for an electrically driven vehicle. IEEE/ASME Trans. Mechatron. 2004, 9, 697–700. [Google Scholar] [CrossRef]
  35. Rodriguez, J.; Meneses, R.; Orus, J. Active vibration control for electric vehicle compliant drivetrains. In Proceedings of the 39th Annual Conference of the IEEE Industrial Electronics Society (IECON), Vienna, Austria, 10–13 November 2013. [Google Scholar]
  36. ISO. Mechanical vibration and shock—Evaluation of human exposure to whole-body vibration—Part 1: General Requirements; BS ISO 2631-1:1997; ISO: Geneva, Switzerland, 1997. [Google Scholar]
  37. ISO. Human Response to Vibration—Measuring Instrumentation— Part 1: General Purpose Vibration Meters; BS EN ISO 8041-1:2017; ISO: Geneva, Switzerland, 2017. [Google Scholar]
  38. Pennycott, A.; De Novellis, L.; Sabbatini, A.; Gruber, P.; Sorniotti, A. Reducing the motor power losses of a four-wheel drive, fully electric vehicle via wheel torque allocation. Proc. Inst. Mech. Eng. Part D J. Automob. Eng. 2014, 228, 830–839. [Google Scholar] [CrossRef] [Green Version]
Figure 1. The case study 4-wheel-drive (4WD) electric vehicle platform prototype: (a) Exterior view; (b) The EV during testing on a rolling road facility; (c) The 2-speed electric powertrain.
Energies 13 03328 g001
Figure 2. The considered EV layouts, with one (L1 and L2) or two (L3 and L4) electric motors, coupled with single-speed (L1 and L3) or 2-speed (L2 and L4) transmissions.
Energies 13 03328 g002
Figure 3. Efficiency maps of the considered powertrains, including electric motor drive and transmission: (a) Single-speed powertrain; (b) 2-speed powertrain (with optimal gear selection).
Energies 13 03328 g003
Figure 4. Simplified conceptual schematic of the 2-speed 4WD EV (L4).
Energies 13 03328 g004
Figure 5. Examples of magnitude plots of H r e q ( j ω ) for the different EV layouts at 20 km/h: (a) L1: Single-speed 2WD; (b) L2: 2-speed 2WD; (c) L3: Single-speed 4WD; (d) L4: 2-speed 4WD (with states indicated according to Table 2); (e) L4: 2-speed 4WD (second gear on front axle, first gear on rear axle); (f) L4: 2-speed 4WD (second gear on front and rear axles).
Energies 13 03328 g005
Figure 6. Examples of magnitude plots of H r e q ( j ω ) with constant p (50% in the left subplot and 80% in the right subplot) and different phase shifts ϕ between the front and rear motor torque demands, at 20 km/h, for L4 (2-speed 4WD): (a) Second gear on front axle, first gear on rear axle; (b) Second gear on front and rear axles.
Energies 13 03328 g006
Figure 7. Simplified block diagram of the vehicle system with the implemented anti-jerk controller.
Energies 13 03328 g007
Figure 8. Longitudinal vehicle acceleration profiles for the four EV layouts, during a tip-in from an initial speed of 10 km/h: (a) Without anti-jerk controller; (b) With anti-jerk controller.
Energies 13 03328 g008
Figure 9. Longitudinal vehicle acceleration profiles for the four EV layouts, during a tip-in test including gearshift actuation for the layouts with 2-speed transmissions.
Energies 13 03328 g009
Figure 10. Simplified flow chart of the optimal state and front-to-total wheel torque distribution search routine.
Energies 13 03328 g010
Figure 11. Features of the implemented optimization routine: (a) Examples of grid points; (b) Regenerative braking torque limits.
Energies 13 03328 g011
Figure 12. Optimization results: (a) Gearshift map for traction for the 2-speed 2WD layout; (b) Front-to-total wheel torque distribution map for traction for the single-speed 4WD layout.
Energies 13 03328 g012
Figure 13. Optimization results: (a) State selection map for traction for the 2-speed 4WD layout; (b) Front-to-total wheel torque distribution map for traction for the 2-speed 4WD layout.
Energies 13 03328 g013
Figure 14. Gradeability performance characteristics: (a) Maximum achievable road gradient from standstill as a function of the available tire-road friction coefficient; (b) Maximum achievable road gradient as a function of vehicle speed, in high tire-road friction conditions.
Energies 13 03328 g014
Figure 15. Time profiles of EV speed, front and rear motor torque, and gear state, for the 2-speed 4WD EV layout (L4) during a section of the J10–15 cycle.
Energies 13 03328 g015
Table 1. Main parameters of the considered EV layouts.
Electric Vehicle LayoutsVehicle Mass
(kg)
Motor Rotor
Inertia
(kgm2)
Transmission
Mass
(kg)
Inverter
Mass
(kg)
1st Gear Ratio
(−)
2nd Gear Ratio
(−)
Max. Wheel Torque *
(Nm)
L1: single-speed 2WD820.60.033812.658.9772
L2: 2-speed 2WD831.50.033823.5512.26.761060
L3: single-speed 4WD 848.20.018112.6 × 25 × 28.9772
L4: 2-speed 4WD870.00.018123.5 × 25 × 212.26.761060
* The values reported in the table do not account for transmission efficiency.
Table 2. Available gear state combinations for the 2-speed 4WD EV (L4).
StateFront TransmissionRear TransmissionStateFront TransmissionRear Transmission
11st gear1st gear5Neutral1st gear
21st gear2nd gear6Neutral2nd gear
32nd gear1st gear71st gearNeutral
42nd gear2nd gear82nd gearNeutral
Table 3. Drivability performance indicators for the tip-in test of Figure 8.
LayoutAnti-jerk Controller V D V a x ˜ R M S a x ˜ Δ V t r e s p t s e t t t p e a k O S I A C A
(m/s1.75)(m/s2)(km/h)(s)(s)(s)(%)(Nm)
L1: Single-speed 2WDOff0.4910.34100.0550.6460.15033.220
On0.0350.020−0.3700.0560.2590.1841.672.588
L2: 2-speed 2WD Off0.3290.27900.0960.7890.50516.290
On0.0560.039−0.4230.0810.2580.1323.083.752
L3: Single-speed 4WDOff0.7990.5280.021NA0.04869.650
On0.2380.120−0.2320.0230.2520.03716.541.675
L4: 2-speed 4WDOff1.0460.7010.027NA0.06268.90
On0.2190.120−0.3720.0320.1800.05812.452.044
Table 4. Vehicle performance for the different layouts.
VehicleTop Speed
(km/h)
Acc. Time
0–30 km/h (s)
Acc. Time
0–50 km/h (s)
Acc. Time
0–70 km/h (s)
L1: single-speed 2WD78.73.15.49.1
L2: 2-speed 2WD103.22.76.09.6
L3: single-speed 4WD78.73.15.59.3
L4: 2-speed 4WD103.22.45.79.4
Table 5. Energy consumption results at constant speed, and their percentage difference with respect to those of the single-speed 2WD EV (L1); positive differences, implying higher consumption, are in red, while negative differences are in green.
Consumption30 km/h50 km/h70 km/h
(Wh/km)NormalOptimalNormalOptimalNormalOptimal
L1: single-speed 2WD36.20 50.53 72.61
L2: 2-speed 2WD37.413.3%37.182.7%51.562.0%50.920.8%73.230.9%73.230.9%
L3: single-speed 4WD37.162.7%37.162.7%51.562.0%51.471.9%73.711.5%70.70−2.6%
L4: 2-speed 4WD38.807.2%37.313.1%53.034.9%51.021.0%74.642.8%68.53−5.6%
Table 6. Energy consumption results along the selected driving cycles, and their percentage difference with respect to those of the single-speed 2WD EV (L1); negative differences, implying lower consumption, are in green.
ConsumptionNew European Drive Cycle (NEDC)—
Urban Section (4 x ECE-15)
Japanese 10–15 Mode (J10–15)
(Wh)NormalOptimalNormalOptimal
L1: single-speed 2WD240.1 418.2
L2: 2-speed 2WD220.4−8.2%219.1−8.7%393.4−5.9%394.3−5.7%
L3: single-speed 4WD223.2−7.0%216.5−9.8%402.5−3.8%380.4−9.0%
L4: 2-speed 4WD226.4−5.7%221.0−8.0%405.2−3.1%381.5−8.8%

