Economic Study of Solar Chimney Power-Water Distillation Plant (SCPWDP)


1
Electrical and Energy Engineering Department, Al Hussein Technical University, Amman 11831, Jordan
2
UWSP Paper Science & Engineering Department, University of Wisconsin, Stevens Point, WI 54481, USA
*
Author to whom correspondence should be addressed.
Energies 2020, 13(11), 2789; https://doi.org/10.3390/en13112789
Submission received: 5 May 2020
/
Revised: 23 May 2020
/
Accepted: 28 May 2020
/
Published: 1 June 2020
(This article belongs to the Special Issue Technologies for Biofuels and Energy)
Abstract
:This work provides technical and economic feasibility of installing a solar chimney power-water distillation plant (SCPWDP) in the port of Aqaba in Jordan. A mathematical model for the SCPWDP has been developed and validated. A full year of weather conditions data has been processed, where water and electricity productions have been estimated. The results show that the SCPWDP can produce 481,440 kWh of electricity and 123,753 ton of distilled water yearly simultaneously. The economic analysis shows that the levelized cost of energy (LCOE) for the SCPWDP is $1.86/kWh. The cost estimate seems reasonable once compared with other studies. However, from economical point of view the LCOE of SCPWDP requires a further decrease in order to make it economically feasible. The sensitivity analysis shows that increasing the chimney height of the SCPWDP would increase the production of electricity, and hence, decreases the LCOE. However, increasing the chimney height would have a marginal improvement since it increases both capital and operation expenditures.
1. Introduction
Shortage of energy and excessive harmful emissions from greenhouse gases (GHG) have brought a lot of attention of the scientific community in the recent years. Although there are alternate energy resources available in the universe, however, to address this problem, it seems that solar energy has emerged as a good potential solution. This is primarily due to the accessibility of solar sources and the flexibility of means to convert the solar energy into a different type of energy [1,2,3]. Jordan has recognized this problem and in order to address this, a renewable energy strategy [4] has been established. In addition to the energy problems, the world is also facing a freshwater shortage problem too. The scarcity of the freshwater resources, global weather changes and continuous increase in demand for water are the primary reasons for water shortage in the world. This issue has been particularly challenging in the last ten years or so, and it will continue to be challenging in the years ahead due to the continued growth of populations and economies. Although water shortage is a world-wide problem, it has been reported that the availability of water has been declining, particularly, in the Middle East [5]. Having said that, it has been reported that solar chimney power plant (SCPP) can be a viable solution to address future demands for water and the need for clean renewable energy as an alternative for fossil-fuel energy resources [6,7]. The early concept of SCPP has been proposed by Schlaich [8], followed by a construction of a SCPP in Spain in 1980s. The structure of the SCPP consists of a solar collector, turbine and chimney. The SCPP works on the principle of heating up the air underneath the collector due to solar radiation during the day. The heated air then gains energy and momentum to move towards the chimney. The SCPP utilizes the difference in the air densities at the top and bottom of the chimney. The air density difference creates a pressure difference that drives the hot air to move from the bottom of the chimney to the top and then escape out of the chimney. While the air flows up the chimney, it exchanges energy with the blades of a turbine—located at the bottom of the chimney—to generate electricity.
Several attempts [9,10,11,12,13,14,15] around the world have been made to introduce various modifications to the conventional solar chimney. The focus was to enhance its performance, expand its application, or develop a new simulation model as detailed in Table 1.
A number of researchers explored the performance and feasibility of SCPP across different countries and geographic places. Table 2 presents an overview of research contribution based on locations. Their focus was specifically on the plant evaluation and economic viability by performing computational and experimental studies.
A number of researchers have integrated a seawater desalination unit into a conventional solar chimney [57,58,59,60]. The idea is to install a layer of water stills on the base of the solar chimney to produce distilled water and improve the efficiency. Most of the studies focus on numerical simulations, evaluating several possibilities to increase the overall performance and the utilization efficiency of solar energy. No single hybrid chimney-desalination configuration has yet shown itself to be the obvious choice. Numerous cost models are available in the research field for large-scale solar chimney power plants. Nevertheless, the studies published vary significantly, even when input parameters and models are closely similar. Fluri et al. [61] compared the newly developed cost models of solar chimney power plants with the previous ones. They have introduced a reference plant to make the analyzed results comparable. The impact of carbon credits on the leveled electricity cost was investigated. Results have showed that previous models underestimated the initial cost and leveled electricity cost of a large-scale solar chimney power plant. The results also showed that carbon credits significantly reduce the leveled electricity cost for such a plant. Despite Jordan having a low carbon footprint compared to other industrial countries, with a growing economy the projection of GHG would increase. Jordan is committed to reduce GHG for the short-term strategy 2013–2020 and for the long term beyond 2020. The application of SCPP would reduce 215 Mt CO2 annually. This is based on US data that electrical production would contribute to 0.4483 kg CO2 per kWh. Despite that this reduction is very little, installation of several SCPP in the country would help to further reduce the GHG and support the high demand for electricity in the country.
In this work, and for the first time, we validate the economics of solar chimney performance in Jordan. More specifically, we ran a modified version of the SCPP to simultaneously generate electricity and produce distilled water. The performance analysis of the proposed system is conducted and presented.
2. Materials and Methods
2.1. SCPWDP Description
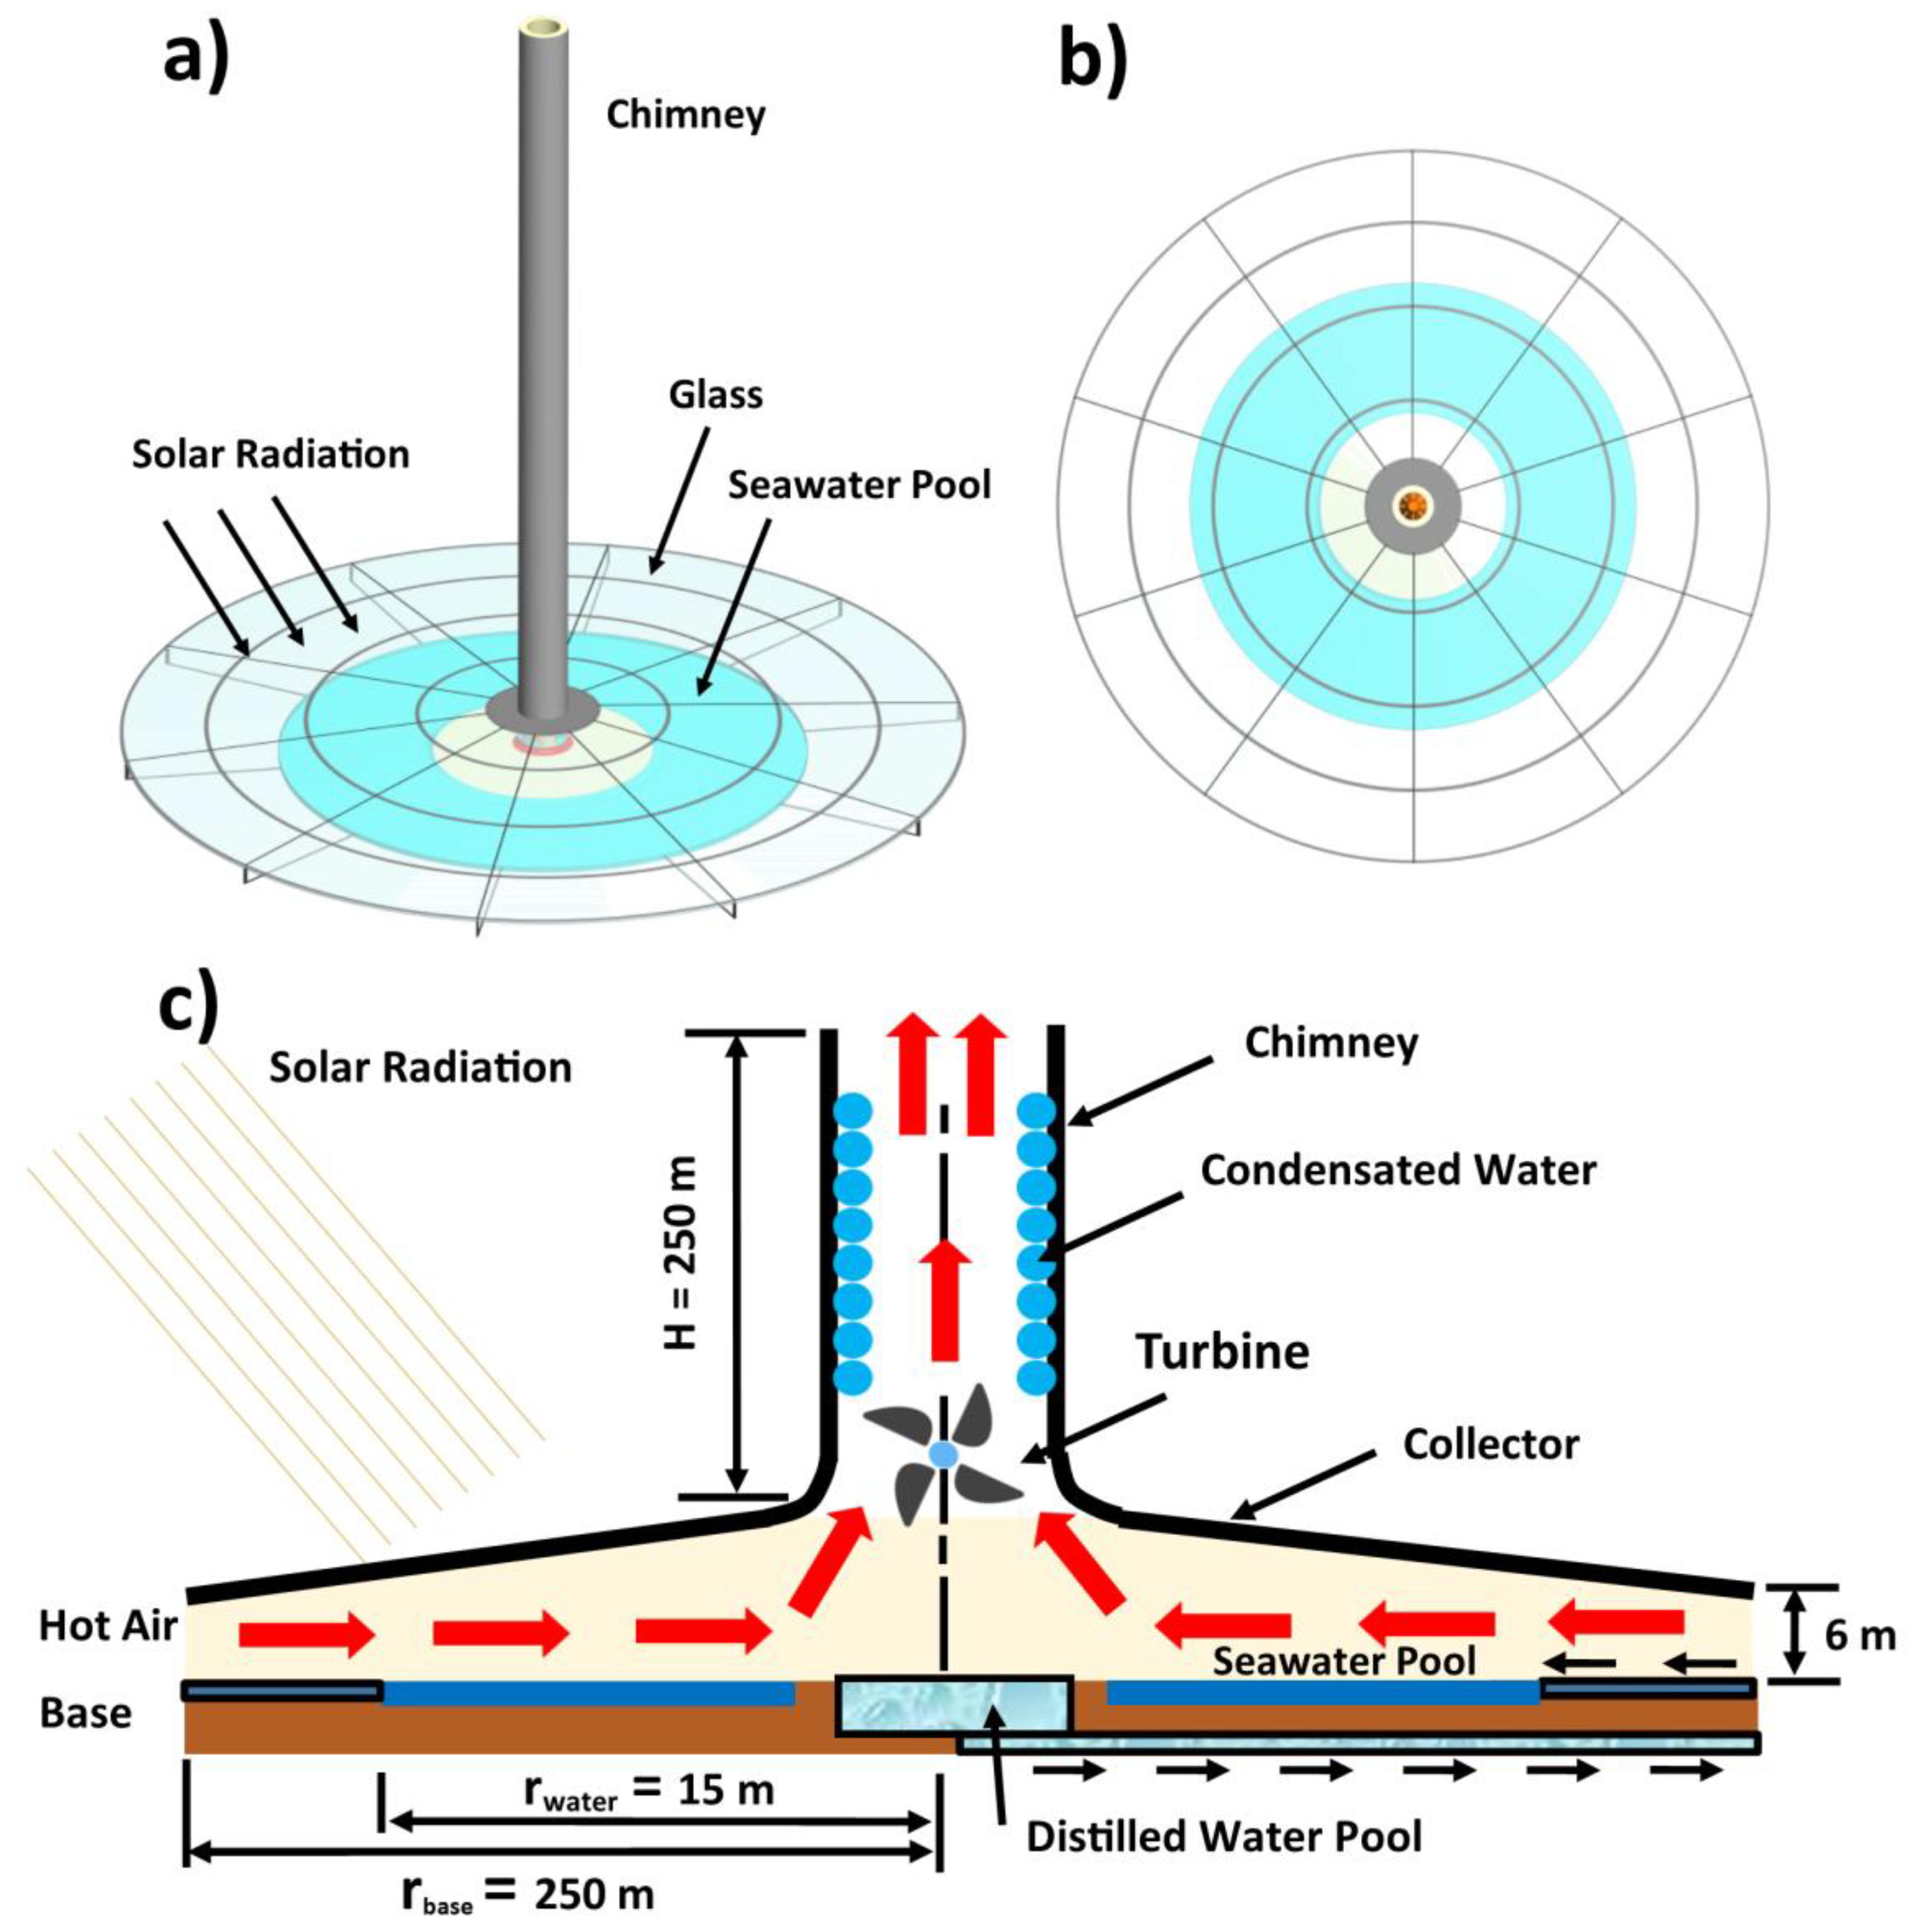
The structure of the solar chimney power-water distillation plant (SCPWDP) is shown in Figure 1. The SCPWDP is divided into three zones: air heating zone, water evaporation zone and chimney zone. The SCPWDP is similar to a conventional SCPP with the exception of adding a water pool at the base of the SCPWDP. The main components of the SCPWDP are the collector, base, water pool, turbine and chimney. The process in the SCPWDP is started when the air trapped between the collector and the base is heated due to solar radiation. As the air heats up it becomes lighter and start to move towards the chimney of the SCPWDP due to a slight elevation (tilting) of the collector. As the air moves towards the chimney, it passes over the water pool where it becomes moisturized. When the air reaches the base of the chimney—where the turbine is located—it hits the fans of the turbine transferring its energy to the turbine. Once, the turbine overcomes its initial cut-in speed, it starts to produce electricity. The amount of electricity produced is directly proportion to the velocity of the air at the inlet of the chimney. Once the air passes the turbine area, it continues to travel up the chimney to exit at the top of the chimney. However, as it travels the chimney up, the moist air condensates at the inner wall of the chimney. The condensated water then drops into the designated area (pool) at the bottom of the chimney where it gets collected. The collected water is then moved outside the SCPDWP for further processing, through water pipes located below the water pool. See Figure 1c. Having said that, the SCPDWP is expected to produce both electricity and distilled water. Water in the water pool is expected to be seawater drowned from the Aqaba seaport through water pipes as seen in Figure 1c. The remaining brine from the seawater can be transported back to the sea or to other destination for further processing.
2.2. Mathematical Model
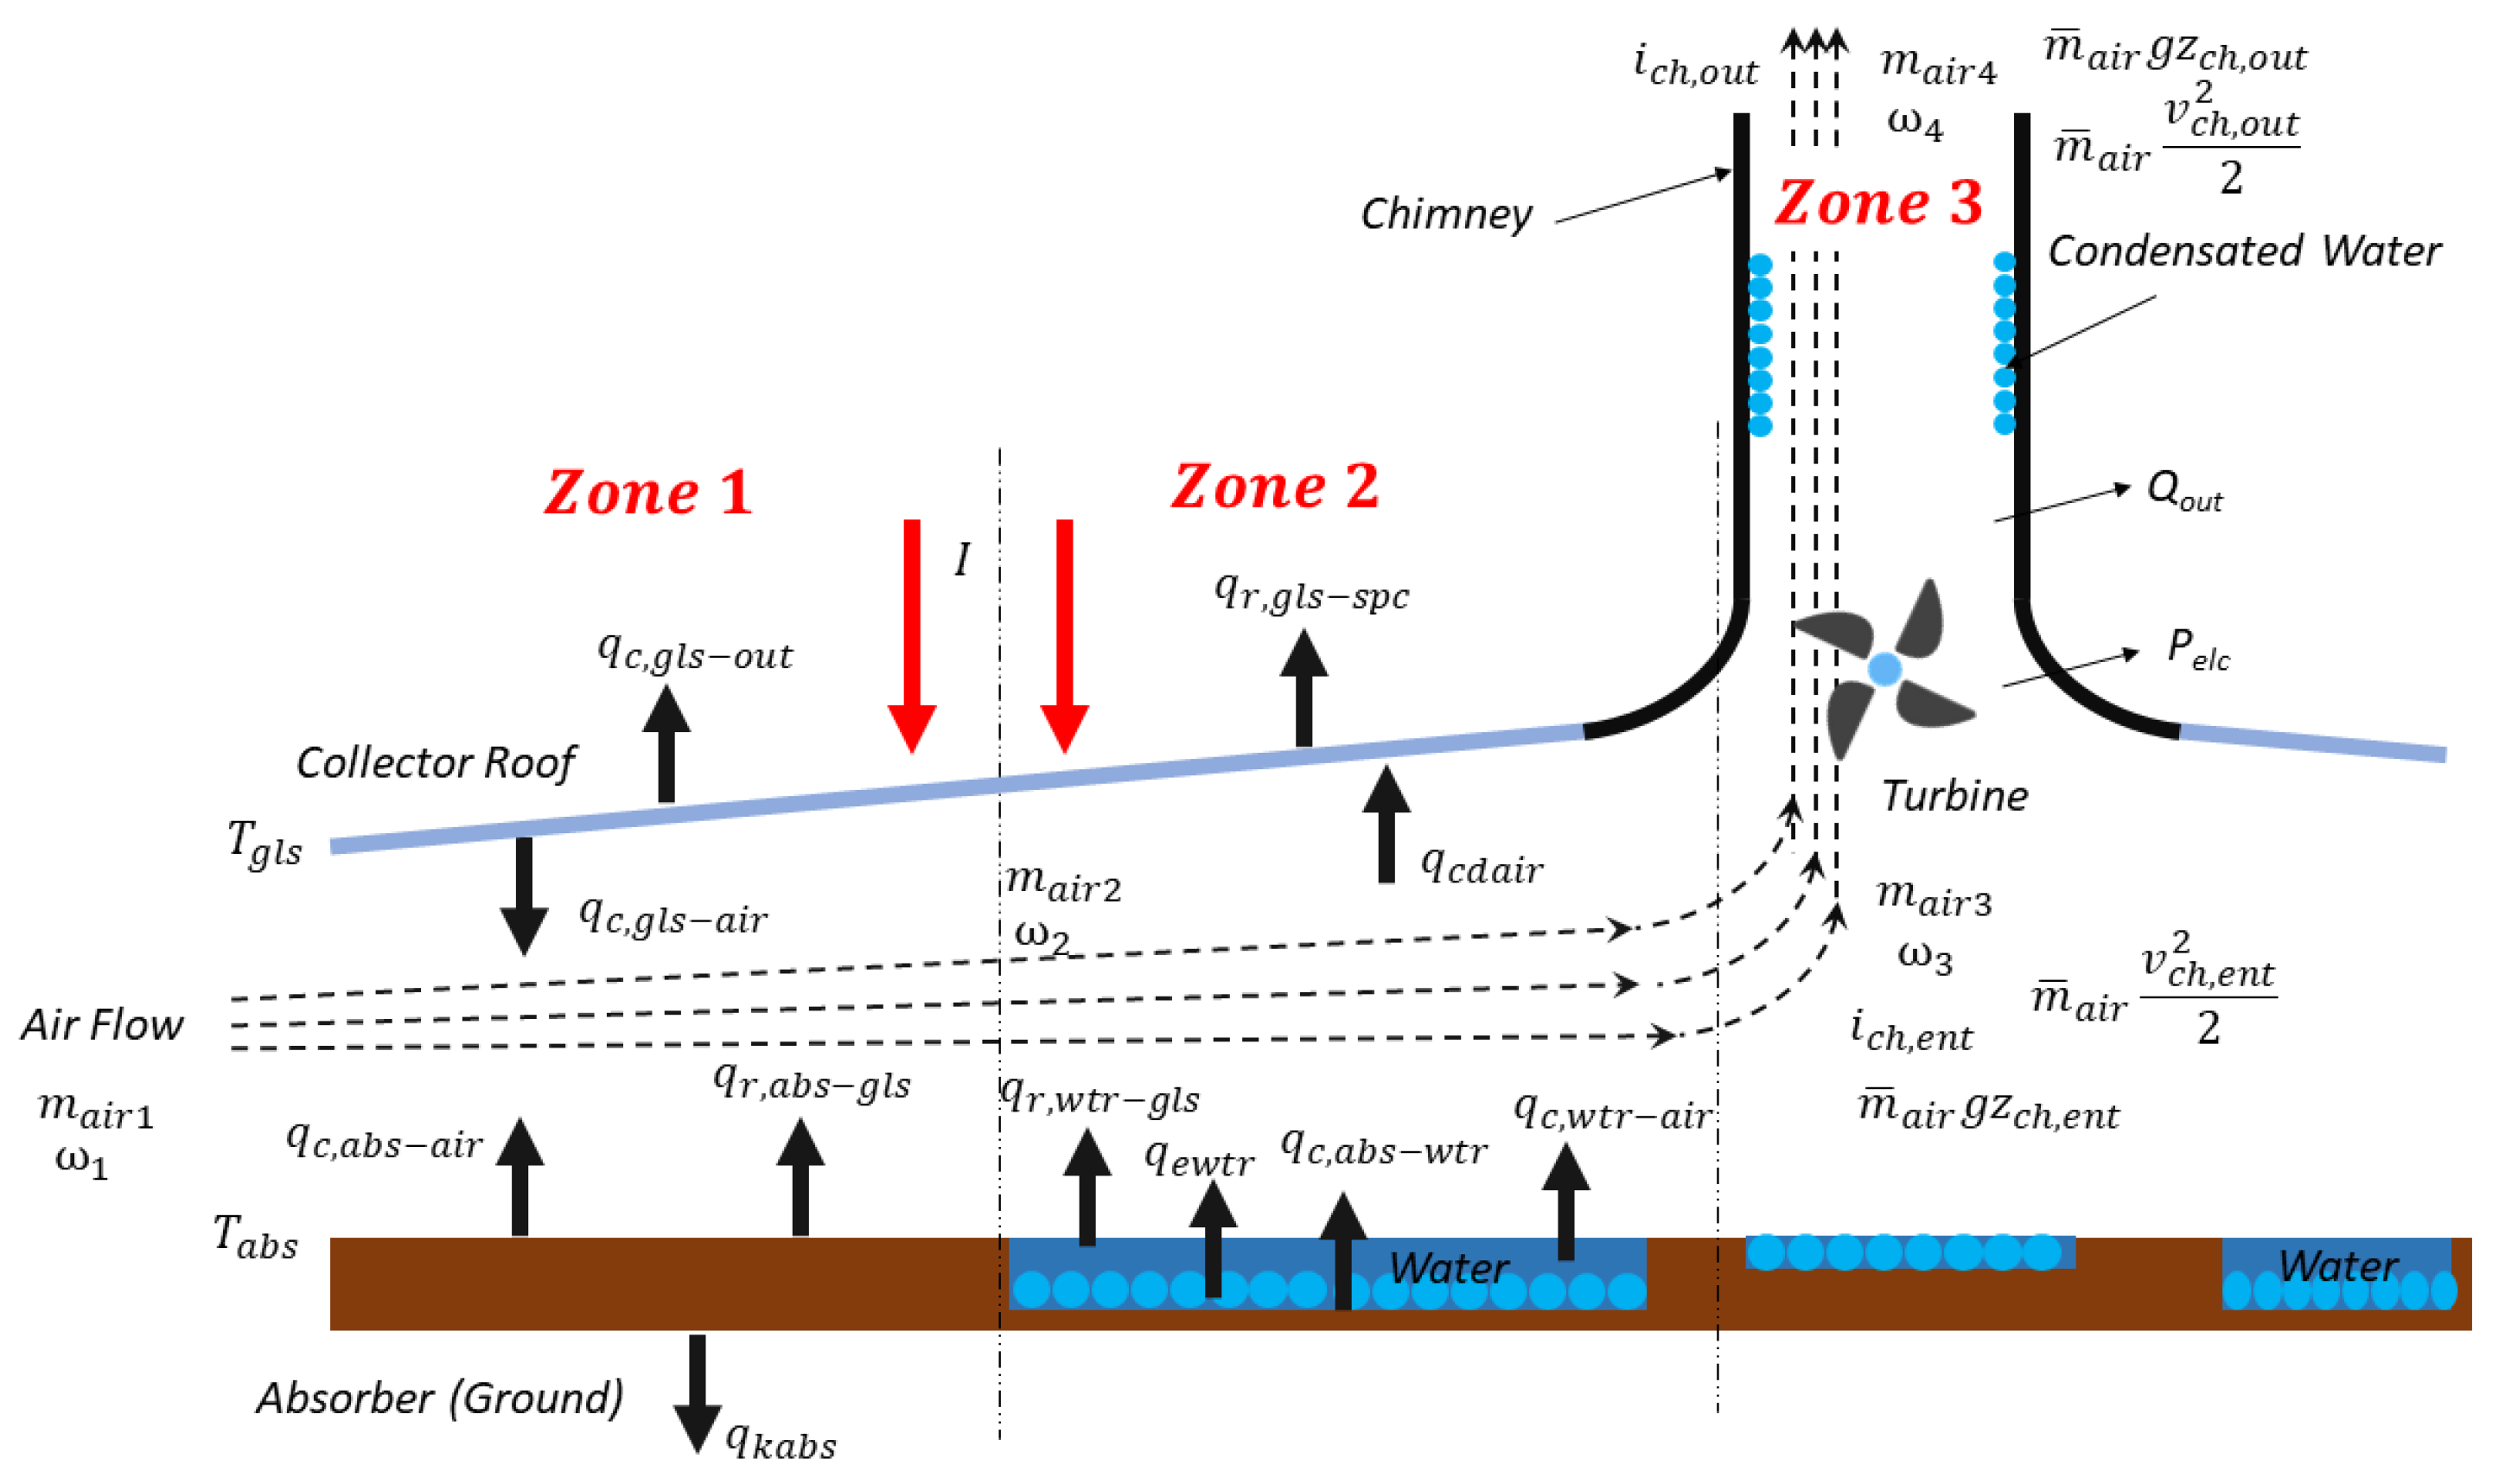
The mathematical model of the SCPWDP system was developed based on Equations (1)–(12), see Figure 2. The energy balance equations for all three zones of the SCPWDP are presented, while the detailed derivations can be found in [62]. The equations were resolved numerically using finite difference method using MATLAB program. The program runs iteratively and terminates when the solution results do not change more than 1 × 10⁻⁶ (the difference between two consecutive results). MATLAB R2013a was used running on windows 7, 64-bit operating system, i5 CPU @ 1.8 GHz with 4.00 GB RAM. The dimensions of the SCPWDP and collector properties used in the model are shown in Table 3 and Table 4 respectively.
Zone 1: Solar Air Heating
The energy balance equations for the absorber, collector roof and air flow in Zone 1 are as follows:
Absorber:
Collector:
Air flow:
The above mass balance equation for air gives that .
Zone 2: Water Evaporation
The energy balance equations for the absorber, collector, air flow and water in Zone 2 are as follows:
Absorber:
Collector roof:
Air flow:
The energy balance for water is as follows:
The output power [57] of the wind turbine is expressed as follows:
Zone 3: Chimney
As the hot air moves from the collector (Zone 2) through the chimney it creates enough force to move the turbine blades, hence producing electricity. The hot air will continue to elevate through the chimney towards the chimney exit. However, the hot water will condensate at the inner walls of the chimney due to the temperature difference between the chimney wall and the outside temperature. The condensated water will eventually fall and be collected at the basin area below the chimney.
The energy balance equation at the inlet and outlet of the chimney:
Furthermore, the energy balance for the air inside the chimney is given as:
The mass flow rate of water condensation is:
The enthalpy of the moist air entering the chimney () is calculated using [51]
where, is the temperature of the air entering the chimney in °C.
2.3. Model Validation
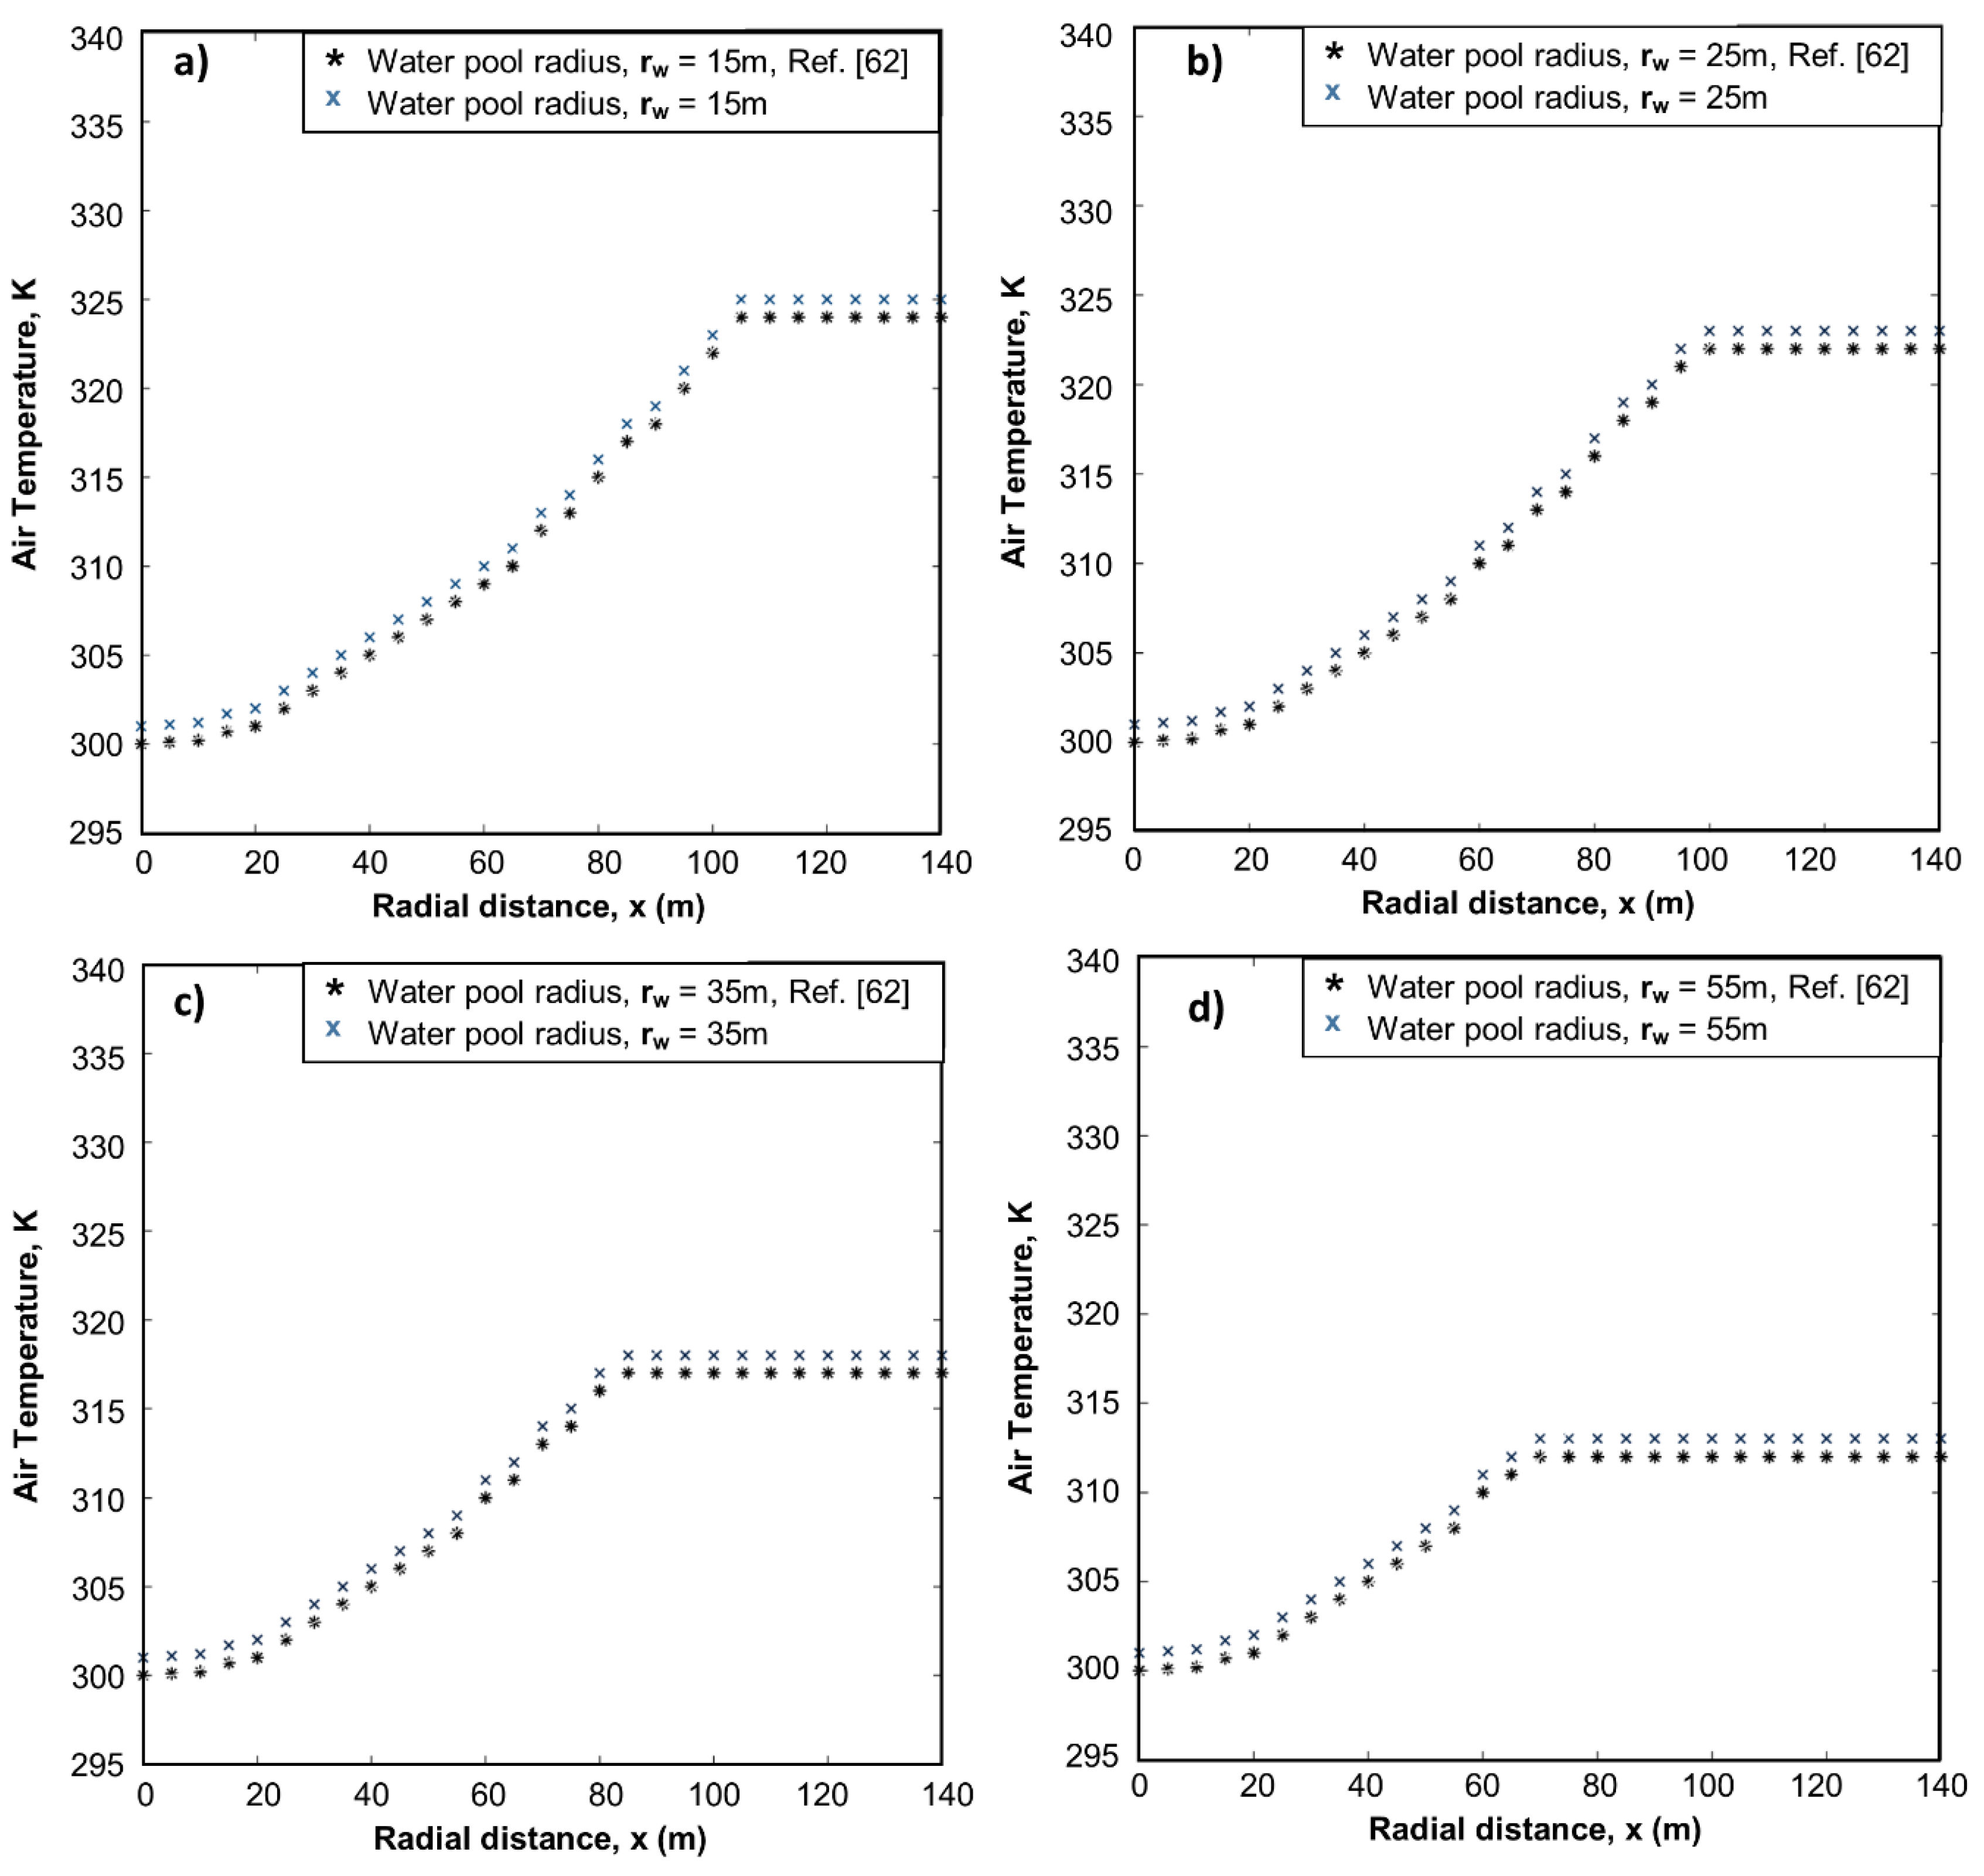
In order to validate our model we compared our results with the results presented by Kiwan et al. [62]. We selected two data sets to compare. First, we compared our results obtained by looking at the air temperature profile starting at the entrance of the SCPWDP and ending at the start of the chimney. This was repeated for different diameters of the water pool. The results for both models are shown in Figure 3 and Figure 4. We also studied and compared our data on the effect of the radius of the water pool on the produced amount of water and electrical power. As seen in the figures, the data trends from both models are almost identical proving that our model is accurate.
3. Results and Discussion
The data was collected from the Aqaba port weather station, site (29°31′36.01″ N/35°00′28.01″ E), where it was sampled at an hourly rate. Table 5 shows a full day of weather information on June 21st. The data shows that the maximum solar irradiation (1000.20 W/m2) occurs at about 11:00 AM. The data also shows that the minimum solar irradiations (0.71 W/m2 and 8.90 W/m2) occur at 4:00 AM and 18:00 respectively. A full year of weather data was processed using our optimized mathematical model. Hourly productions of water and electricity were added and totaled for each month. The results for the entire year are shown in Table 6. The table shows the production of electric power (kWh) and distilled water (ton) month-by-month starting from January and ending in December. The results show that the maximum production of electricity was 57,934.94 kWh and maximum production of distilled water was 14,975.27 ton.
3.1. Economic Analysis
SCPP is unmatured technology and the technical readiness level still beyond the commercial application. There are studies that investigated the economic aspect of SCPP revealing the current needs and future challenges. The main purpose of the economic analysis is to establish the current need, challenges and the main expectation of SCPP in Jordan.
The baseline for the economic assessment of SCPP is comparing cash payment for equipment fabrication and installation with the maximum power output [61]. Therefore, the decision of installing a SCPP must be economically feasible or solve electricity supply in remote areas that are far away from the electricity grid [8,63]. The cost contribution of a SCPP mainly comes from: the chimney, the collector and the turbine units. Our finding agrees with other economic analysis performed by [40,42,44,60]. SCPPs are not commercially available yet due to high capital cost versus the annual revenues. Despite the simplified design of the SCPP versus the other power production facility, the capital investment is one of the major issues due to its height as well as lower energy output. In this work, economic analysis of the developed design was conducted to calculate the capital expenditures (CAPEX) and the operation expenditures (OPEX). The main chimney tower component is specified in Table 7 with their corresponding cost. Several reports detailed the cost analysis of the SCPP [8,63,64]. The cost calculation was based on an assumption of the materials cost combined with fabrication cost using cost relative formulas. For calculating the CAPEX, each equipment cost was calculated individually based on correlation data for similar well-established equipment [65]. The cost of each component was calculated using a generic cost related algebraic Equation (13) presented by Gavin and Towler [65].
The Cost, i represents the individual component cost chimney column, glass bass and concrete basin. The total CAPEX cost presented in Table 7 is the sum of all individual component cost, Cost, i. The S represents the component sizing parameters, a represents a tabulated factor and n is the exponent factors for the equipment type. The collector is basically the combination of glass base with the concrete basin. The cost calculations were based on initial costs of construction that are specific for Jordan. The cost of glass base was based on vendor tabulated cost data retrieved from commercial site, while the cost of concert basin was based on local Jordanian average cost of construction per meter square.
The operating cost, Table 8, was estimated based on daily expenses that were associated with the operating of the chimney tower. The tower configuration works only on the water supply and requires no chemical additions, except the chemicals that are used to prevent the corrosion effect inside the pumping pipes. The OPEX is extremely low due to no fuel cost, no daily usage of chemicals and no labor work that are required for daily operation. The OPEX cost emerges from the power required for the water pumps, quarterly maintenances and minor labor work. This is greatly advantageous compared to the power plant and the other hybrid energy system, which were fuel that were required as part of their daily operation.
The levelized cost of energy (LCOE) is a critical performance parameter that determines the economic feasibility of the proposed design. The LCOE will be compared with other energy technology providers in the country, Table 9. The LCOE include capital costs, fuel costs, fixed and variable operations and maintenance (O&M) costs, financing costs and an assumed utilization rate for each plant type. The LCOE was calculated using the below Equation (14):
The LCOE for SCPWDP calculation using Equation (14) was found to be $1.86/kWh. The cost estimate seems reasonable once compared with other studies and power producing technologies. However, from an economical point of view the LCOE of SCPWDP requires a further decrease in order to improve the process economy. Schlaich [8], Schlaich et al. [63] and Bernardes [64] calculated the LCOE for SCPP to be 0.1045, 0.1000 and 0.0370 Euro/kWh respectively. Their values are lower than the value calculated in our present study. This is likely due to high CAPEX since this technology is not mature yet and the fabrication parts do not exist in the market and require a customized part that would cost more. However, utilization of water as an added value was not included in the LCOE calculation due to a lack of standardized information about water cost in Jordan. The proposed SCPP in Jordan does not compete with other energy production technologies rather it acts as a complementary energy supply system. Water generation from SCPP contributes to the energy mix strategy and reduces the burden of energy providers. In particular, underground water pumping from in Jordan consumes 10% of the total electricity supply. Jordan has a limited natural resource and suffers significant water shortages mainly during summertime. The SCPP system would be a future game player with respect to the c-water energy supply system once the process is economically justified.
The economic analysis proposed a further reduction in CAPEX and OPEX by adopting a new design configuration that maximizes both power water outputs. Improving the CAPEX could be achieved by exploring new materials that cost less but function the same. For example, replacing the main steel tower by enhanced plastic materials that provide thermal and chemical stability. This topic will be further investigated in a new study that will focus on the materials aspect of the SCPP. Another example, the glass surface could be replaced by Plexiglas materials that has the same physical and mechanical properties of the glass. The OPEX values already but could be further reduced by adopting a new automation system that regulates the power water production according to the demands of the market. In future work, we will simulate the technical and economic performance of SCPP as a hybrid system in specialized software such as HOMER [2] for further development.
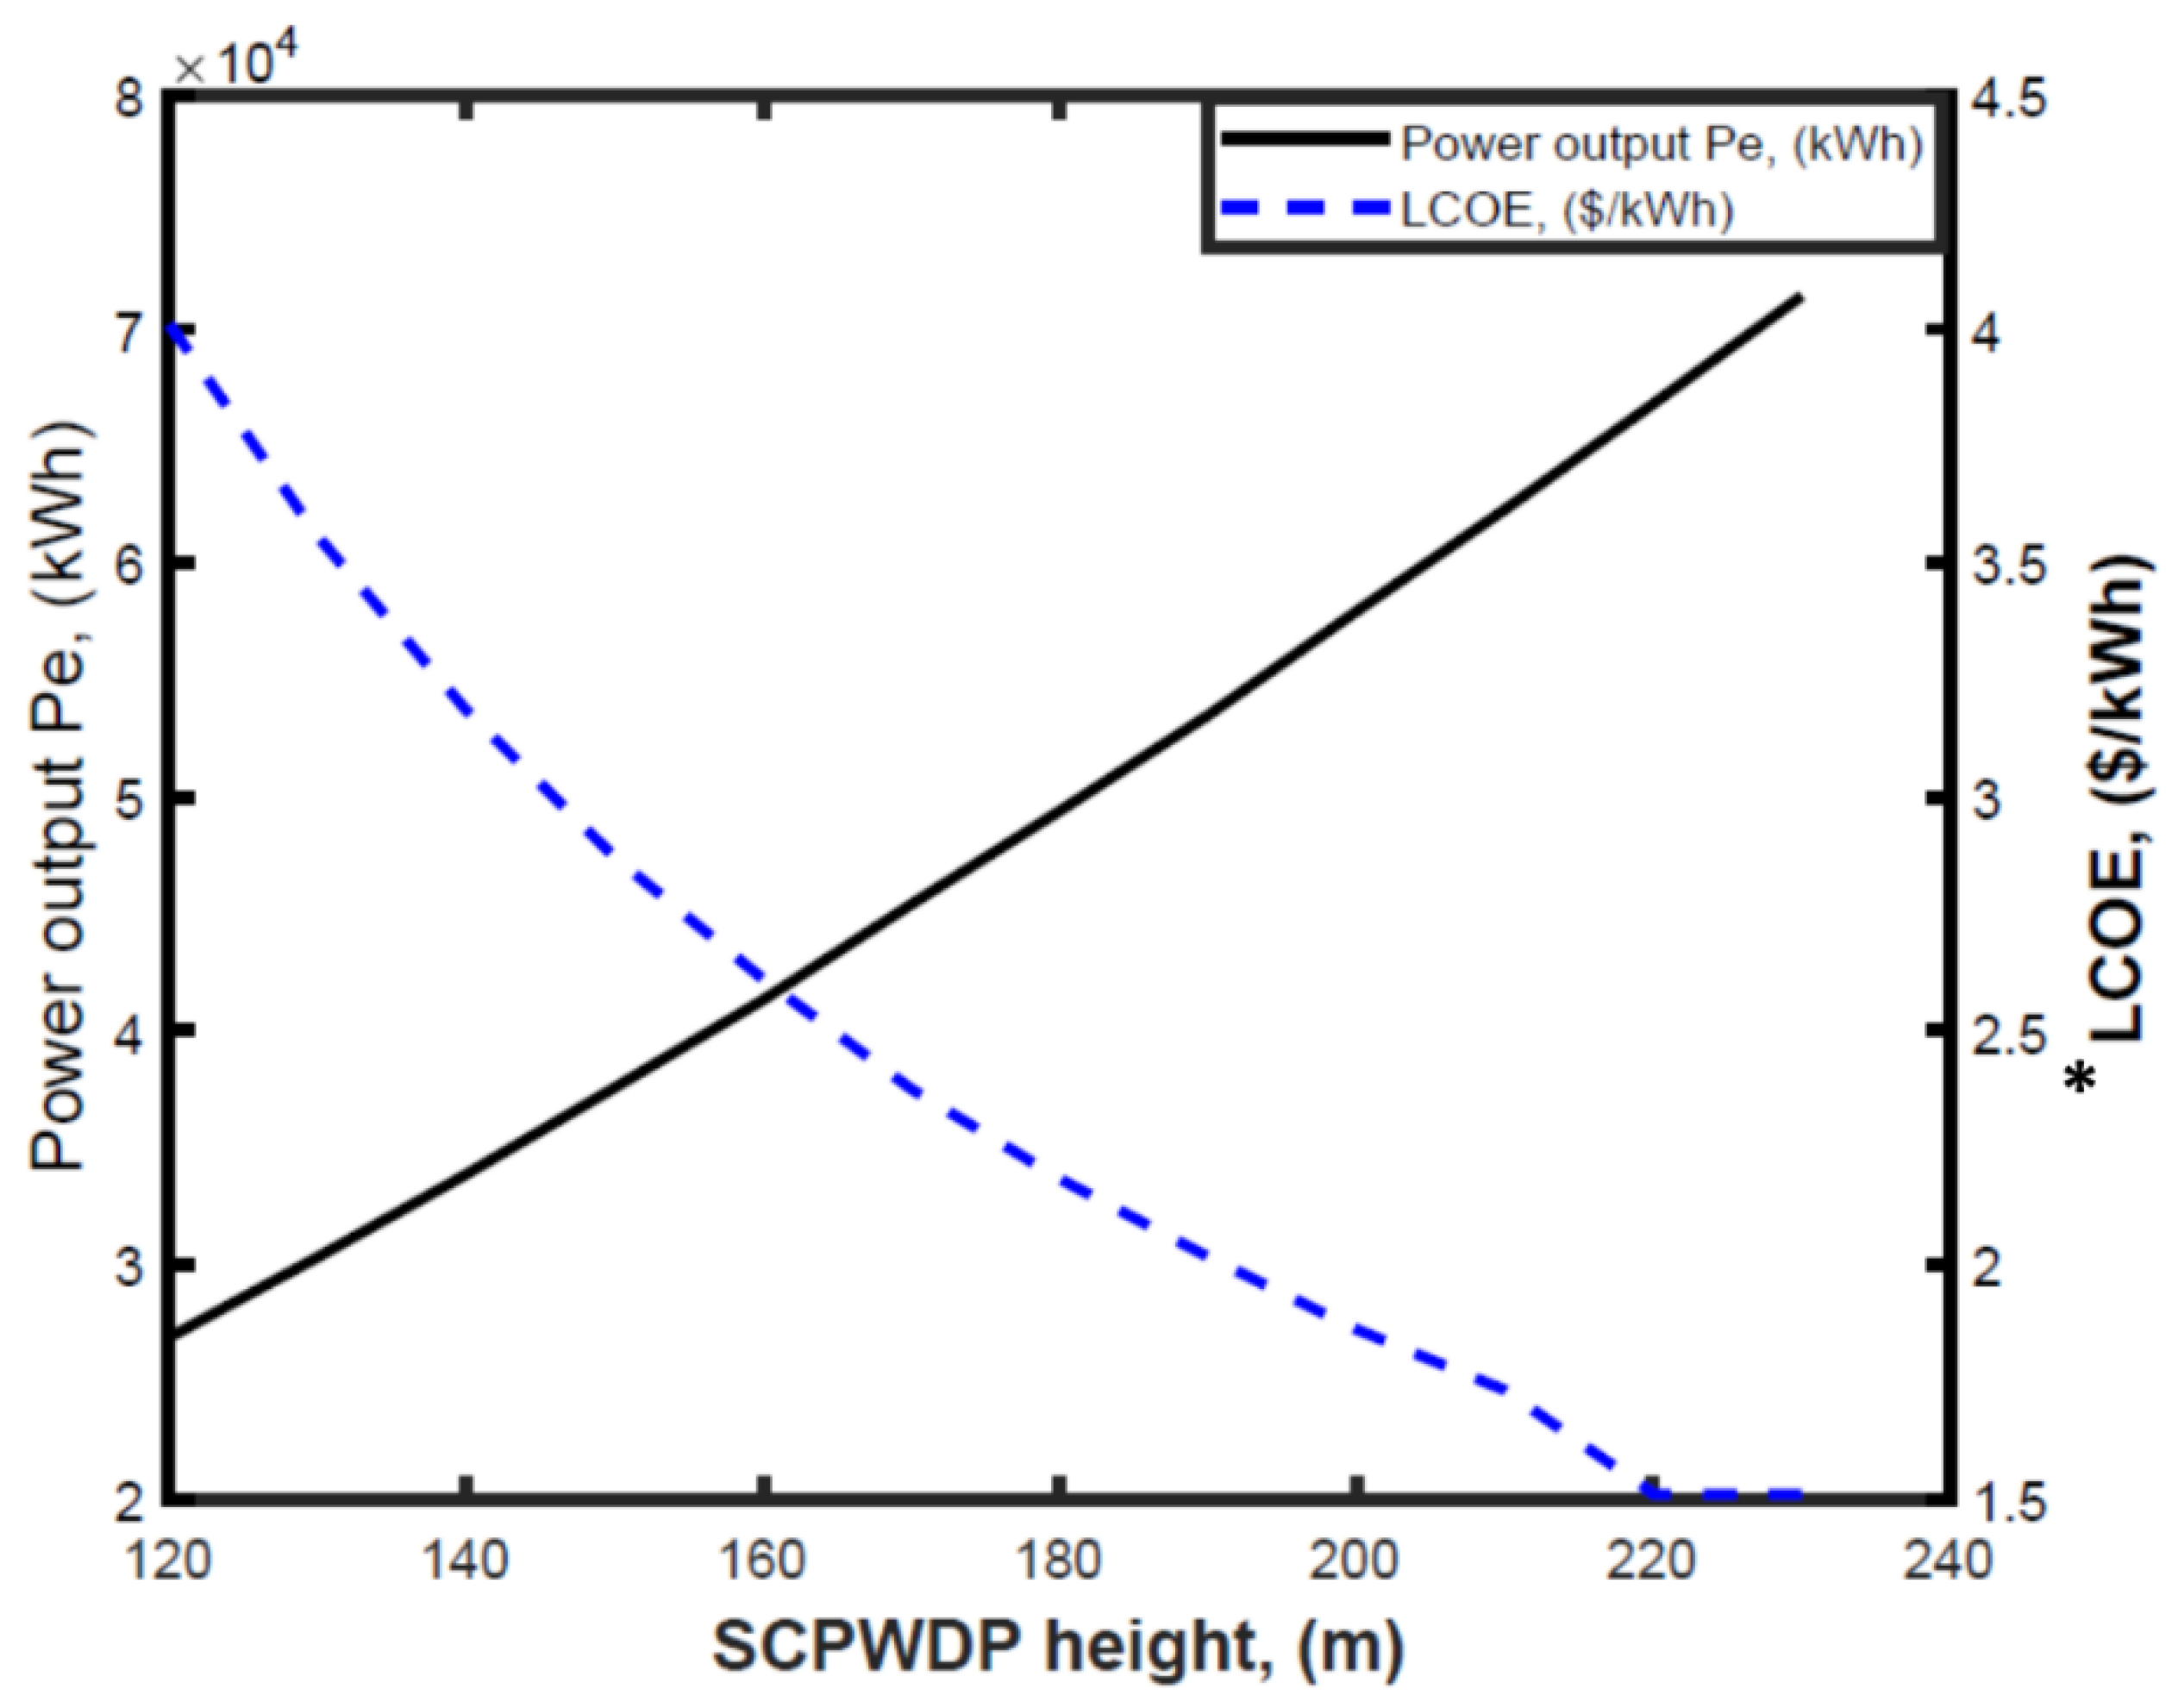
3.2. Sensitivity Analysis
The sensitivity analysis reveals the relation between the acceptable LCOE and the maximum power output. The LCOE is influenced by the main design parameters such as the chimney diameter and height. The diameter and height of the chimney influence the capital cost and thus change the LCOE value, Figure 5. However, increasing the chimney height would have a marginal improvement due to increasing the LCOE. Thus, reducing the capital investment and operating cost by 50% would reduce the LCOE from $1.86/kWh down to $1/kWh. Decreasing the LCOE further down by 0.038 could further increase the power out by 20%. However, this would increase the simplified monthly operating cost on the nutshell due to an increase in the tower height. This would increase the overall capital cost making the overall process economy a main challenge.
4. Conclusions
The results show that developing a SCPWDP in the port of Aqaba is feasible. The SCPWDP will be capable of producing about 481,440 kWh of electricity and 123,753 tons of distilled water yearly. The results also show the LCOE for SCPWDP was found to be $1.86/kWh. Which was within reasonable expectations when compared to other studies and other power generating technologies. However, from an economical point of view the LCOE of SCPWDP requires further decreases in order to make it economically more feasible. Installing SCPWDP would be feasible for the decentralized energy supply system. If SCPWDP was combined with a system for vegetation leading to a win–win situation of power production combined with water and vegetation production. The SCPWDP could be improved further by unique design, finding cheap fabrication materials, maximizing the power output, and combining SCPWDP with other renewable energy production technologies. For the future recommendation, studies should focus on a detailed economic study and find an optimal way to decrease the LCOE.
Author Contributions
Conceptualization, E.A., F.K., M.A., I.A.-H. and A.A.; methodology, E.A., F.K., M.A., I.A.-H. and A.A.; validation, E.A., F.K., M.A. and A.A.; formal analysis, E.A., F.K. and M.A.; investigation, E.A., F.K., M.A., I.A.-H. and A.A.; writing—original draft preparation, E.A., F.K., M.A. and A.A.; writing—review and editing, E.A., F.K., M.A., I.A.-H. and A.A.; visualization, E.A., F.K., M.A. and A.A.; supervision E.A. and F.K. All authors have read and agreed to the published version of the manuscript.
Funding
This research received no external funding.
Conflicts of Interest
The authors declare no conflict of interest.
Nomenclature
| A | Area: (m2) |
| H | Height, (m) |
| cp | Specific heat capacity, (J/kg.K) |
| D | Diameter, (m) |
| I | Solar irradiation intensity, (W/m2) |
| Pelc | Electrical Out Power, (W) |
| T | Temperature, (K) |
| Qout | The heat transfer between the chimney and the ambient, (W) |
| h | Heat transfer coefficient, (W/m2. K) |
| hfg | Latent heat of water evaporation, (W/m2. K) |
| Mass flow rate, (kg/sec) | |
| g | Acceleration of gravity, (m/s2) |
| q | Heat transfer rate, (W/m2) |
| i | Enthalpy |
| r | Radius, (m) |
| k | Air thermal conductivity |
| dh | Hydraulic diameter, (m) |
| f | Friction factor |
| PV | Photo Voltaic |
| CPU | Central Processing Unit |
| RAM | Random Access Memory |
| GH | Giga Hertz |
| GB | Giga Byte |
| rw | Water Pool Radius |
| It | Yearly Investment Expenditures (Including Financing) |
| t | One Year Time |
| Mt | Yearly Operating and Maintenance Expenditures |
| Ft | Yearly fuel expenditures |
| Et | Yearly Electricity Production |
| dr | Discount Rate |
| n | System Life |
| Greek Symbols | |
| Τ | Transmissivity |
| A | Absorptivity |
| Ρ | Density, kg/m3 |
| ω | Humidity ratio |
| Τ | Transmissivity |
| Subscripts | |
| air | Airflow |
| gls | Glass cover or convective heat transfer |
| abs | Absorber plate |
| ch | Chimney |
| cd | Condensated water |
| col | Collector roof |
| e | Evaporation |
| rad | Radiation heat transfer |
| out | Outside |
| ent | Entrance |
| wtr | Water |
| sky | Sky |
| c | Convective heat transfer |
| r | Radiative heat transfer |
References
- Dincer, I. Renewable energy and sustainable development: A crucial review. Renew. Sustain. Energy Rev. 2000, 4, 157–175. [Google Scholar] [CrossRef]
- Salameh, T.; Ghenai, C.; Merabet, A.; Alkasrawi, M. Techno-economical optimization of an integrated stand-alone hybrid solar PV tracking and diesel generator power system in Khorfakkan, UAE. Energy 2020, 190, 116475. [Google Scholar] [CrossRef]
- Al Momani, F.A.; Shawaqfeh, A.T.; Mo‘ayyed, S.S. Solar wastewater treatment plant for aqueous solution of pesticide. Solar Energy 2007, 81, 1213–1218. [Google Scholar] [CrossRef]
- Al-Addous, M.; Alnaief, M.; Class, C.; Nsair, A.; Kuchta, K.; Alkasrawi, M. Technical Possibilities of Biogas Production from Olive and Date Waste in Jordan. BioResources 2017, 12, 9383–9395. [Google Scholar]
- Bozorg-Haddad, O.; Zolghadr-Asli, B.; Sarzaeim, P.; Aboutalebi, M.; Chu, X.; Loáiciga, H.A. Evaluation of water shortage crisis in the Middle East and possible remedies. J. Water Supply Res. Technol. 2020, 69, 85–98. [Google Scholar] [CrossRef]
- Zhou, X.; Wang, F.; Ochieng, R.M. A review of solar chimney power technology. Renew. Sustain. Energy Rev. 2010, 14, 2315–2338. [Google Scholar] [CrossRef]
- Dhahri, A.; Omri, A. A review of solar chimney power generation technology. Int. J. Eng. Adv. Technol. 2013, 2, 1–17. [Google Scholar]
- Schlaich, J. The solar chimney: Electricity from the sun, Edition Axel Menges, Stuttgart, Germany, 1995.[2] ROBERT R. Span. Sol. Chimney Nears Complet. MPS Rev. 1981, 6, 21–23. [Google Scholar]
- Elsayed, I.; Nishi, Y. A feasibility study on power generation from solar thermal wind tower: Inclusive impact assessment concerning environmental and economic costs. Energies 2018, 11, 3181. [Google Scholar] [CrossRef] [Green Version]
- Lipnicki, Z.; Gortych, M.; Staszczuk, A.; Kuczyński, T.; Grabas, P. Analytical and experimental investigation of the solar chimney system. Energies 2019, 12, 2060. [Google Scholar] [CrossRef] [Green Version]
- Kommalapati, R.; Kadiyala, A.; Shahriar, M.T.; Huque, Z. Review of the life cycle greenhouse gas emissions from different photovoltaic and concentrating solar power electricity generation systems. Energies 2017, 10, 350. [Google Scholar] [CrossRef] [Green Version]
- Tan, A.Y.K.; Wong, N.H. Parameterization studies of solar chimneys in the tropics. Energies 2013, 6, 145–163. [Google Scholar] [CrossRef] [Green Version]
- Klimes, L.; Charvát, P.; Hejčík, J. Comparison of the energy conversion efficiency of a solar chimney and a solar PV-powered fan for ventilation applications. Energies 2018, 11, 912. [Google Scholar] [CrossRef] [Green Version]
- Gholamalizadeh, E.; Chung, J.D. A comparative study of CFD models of a real wind turbine in solar chimney power plants. Energies 2017, 10, 1674. [Google Scholar] [CrossRef] [Green Version]
- Gholamalizadeh, E.; Kim, M.H. Multi-objective optimization of a solar chimney power plant with inclined collector roof using genetic algorithm. Energies 2016, 9, 971. [Google Scholar] [CrossRef] [Green Version]
- Chergui, T.; Larbi, S.; Bouhdjar, A. Thermo-hydrodynamic aspect analysis of flows in solar chimney power plants—A case study. Renew. Sustain. Energy Rev. 2010, 14, 1410–1418. [Google Scholar] [CrossRef]
- Bilgen, E.; Rheault, J. Solar chimney power plants for high latitudes. Sol. Energy 2005, 79, 449–458. [Google Scholar] [CrossRef]
- Fluri, T.P.; Von Backström, T.W. Performance analysis of the power conversion unit of a solar chimney power plant. Sol. Energy 2008, 82, 999–1008. [Google Scholar] [CrossRef]
- Mathur, J.; Mathur, S. Anupma Summer-performance of inclined roof solar chimney for natural ventilation. Energy Build. 2006, 38, 1156–1163. [Google Scholar] [CrossRef]
- Afonso, C.; Oliveira, A. Solar chimneys: Simulation and experiment. Energy Build. 2000, 32, 71–79. [Google Scholar] [CrossRef]
- Guzma, J.D.; Heras, M.R.; Alvarez, G.; Xama, J.; Arce, J.; Jiménez, M.J.; Guzmán, J.D.; Heras, M.R.; Alvarez, G.; Xamán, J. Experimental study for natural ventilation on a solar chimney. Renew. Energy 2009, 34, 2928–2934. [Google Scholar] [CrossRef]
- Harris, D.J.; Helwig, N. Solar chimney and building ventilation. Appl. Energy 2007, 84, 135–146. [Google Scholar] [CrossRef]
- Jing, H.; Chen, Z.; Li, A. Experimental study of the prediction of the ventilation flow rate through solar chimney with large gap-to-height ratios. Build. Environ. 2015, 89, 150–159. [Google Scholar] [CrossRef]
- Pretorius, J.P.; Kröger, D.G. Critical evaluation of solar chimney power plant performance. Sol. Energy 2006, 80, 535–544. [Google Scholar] [CrossRef]
- Sangi, R.; Amidpour, M.; Hosseinizadeh, B. Modeling and numerical simulation of solar chimney power plants. Sol. Energy 2011, 85, 829–838. [Google Scholar] [CrossRef]
- Miqdam, T.C.; Hussein, A.K. Basement kind effects on air temperature of a solar chimney in Baghdad-Iraq weather. Int. J. Appl. Sci. 2011, 2, 12–20. [Google Scholar] [CrossRef]
- Ninic, N. Available energy of the air in solar chimneys and the possibility of its ground-level concentration. Sol. Energy 2006, 80, 804–811. [Google Scholar] [CrossRef]
- Koonsrisuk, A.; Chitsomboon, T. Mathematical modeling of solar chimney power plants. Energy 2013, 51, 314–322. [Google Scholar] [CrossRef]
- Chantawong, P.; Hirunlabh, J.; Zeghmati, B.; Khedari, J.; Teekasap, S.; Win, M.M. Investigation on thermal performance of glazed solar chimney walls. Sol. Energy 2006, 80, 288–297. [Google Scholar] [CrossRef]
- Tingzhen, M.; Wei, L.; Yuan, P. Numerical analysis of the solar chimney power plant with energy storage layer. In Proceedings of the ISES Solar World Congress; Springer: Berlin, Germany, 2007; Volume 3, pp. 1800–1805. [Google Scholar]
- Ghalamchi, M.; Kasaeian, A.; Ghalamchi, M.; Mirzahosseini, A.H. An experimental study on the thermal performance of a solar chimney with different dimensional parameters. Renew. Energy 2016, 91, 477–483. [Google Scholar] [CrossRef]
- Hamdan, M.O. Analysis of a solar chimney power plant in the Arabian Gulf region. Renew. Energy 2011, 36, 2593–2598. [Google Scholar] [CrossRef]
- Koonsrisuk, A.; Lorente, S.; Bejan, A. Constructal solar chimney configuration. Int. J. Heat. Mass. Transf. 2010, 53, 327–333. [Google Scholar] [CrossRef]
- Saifi, N.; Settou, N.; Dokkar, B.; Negrou, B.; Chennouf, N. Experimental study and simulation of airflow in solar chimneys. Energy Procedia 2012, 18, 1289–1298. [Google Scholar] [CrossRef] [Green Version]
- Kasaeian, A.; Ghalamchi, M.; Ghalamchi, M. Simulation and optimization of geometric parameters of a solar chimney in Tehran. Energy Convers. Manag. 2014, 83, 28–34. [Google Scholar] [CrossRef]
- Guo, P.; Li, J.; Wang, Y.Y.; Wang, Y.Y. Numerical study on the performance of a solar chimney power plant. Energy Convers. Manag. 2015, 105, 197–205. [Google Scholar] [CrossRef]
- Ming, T.; de Richter, R.K.; Meng, F.; Pan, Y.; Liu, W. Chimney shape numerical study for solar chimney power generating systems. Int. J. Energy Res. 2013, 37, 310–322. [Google Scholar] [CrossRef]
- Maia, C.B.; Ferreira, A.G.; Valle, R.M.; Cortez, M.F.B. Theoretical evaluation of the influence of geometric parameters and materials on the behavior of the airflow in a solar chimney. Comput. Fluids 2009, 38, 625–636. [Google Scholar] [CrossRef]
- Fasel, H.F.; Meng, F.; Shams, E.; Gross, A. CFD analysis for solar chimney power plants. Sol. Energy 2013, 98, 12–22. [Google Scholar] [CrossRef] [Green Version]
- Pastohr, H.; Kornadt, O.; Gürlebeck, K. Numerical and analytical calculations of the temperature and flow field in the upwind power plant. Int. J. Energy Res. 2004, 28, 495–510. [Google Scholar] [CrossRef]
- Bouabidi, A.; Ayadi, A.; Nasraoui, H.; Driss, Z.; Abid, M.S. Study of solar chimney in Tunisia: Effect of the chimney configurations on the local flow characteristics. Energy Build. 2018, 169, 27–38. [Google Scholar] [CrossRef]
- Abdelmohimen, M.A.H.; Algarni, S.A. Numerical investigation of solar chimney power plants performance for Saudi Arabia weather conditions. Sustain. Cities Soc. 2018, 38, 1–8. [Google Scholar] [CrossRef]
- Okoye, C.O.; Taylan, O. Performance analysis of a solar chimney power plant for rural areas in Nigeria. Renew. Energy 2017, 104, 96–108. [Google Scholar] [CrossRef]
- El-Haroun, A.A. Performance Evaluation of Solar Chimney Power Plants in Egypt. Int. J. Pure Appl. Sci. Technol. 2012, 13, 49–59. [Google Scholar]
- Sangi, R. Performance evaluation of solar chimney power plants in Iran. Renew. Sustain. Energy Rev. 2012, 16, 704–710. [Google Scholar] [CrossRef]
- Asnaghi, A.; Ladjevardi, S.M. Solar chimney power plant performance in Iran. Renew. Sustain. Energy Rev. 2012, 16, 3383–3390. [Google Scholar] [CrossRef]
- Maghrebi, M.J.; Masoudi Nejad, R.; Masoudi, S. Performance analysis of sloped solar chimney power plants in the southwestern region of Iran. Int. J. Ambient Energy 2017, 38, 542–549. [Google Scholar] [CrossRef]
- Larbi, S.; Bouhdjar, A.; Chergui, T. Performance analysis of a solar chimney power plant in the southwestern region of Algeria. Renew. Sustain. Energy Rev. 2010, 14, 470–477. [Google Scholar] [CrossRef]
- Larbi, S.; Bouhdjar, A.; Meliani, K.; Taghourt, A.; Semai, H. Solar chimney power plant with heat storage system performance analysis in South Region of Algeria. In Proceedings of the IEEE 3rd International Renewable and Sustainable Energy Conference (IRSEC), Marrakech, Morocco, 10–13 December 2015; pp. 1–6. [Google Scholar]
- Rabehi, R.; Chaker, A.; Aouachria, Z.; Tingzhen, M. CFD analysis on the performance of a solar chimney power plant system: Case study in Algeria. Int. J. Green Energy 2017, 14, 971–982. [Google Scholar] [CrossRef]
- Nizetic, S.; Ninic, N.; Klarin, B. Analysis and feasibility of implementing solar chimney power plants in the Mediterranean region. Energy 2008, 33, 1680–1690. [Google Scholar] [CrossRef]
- Okoye, C.O.; Atikol, U. A parametric study on the feasibility of solar chimney power plants in North Cyprus conditions. Energy Convers. Manag. 2014, 80, 178–187. [Google Scholar] [CrossRef]
- Guo, P.; Li, J.; Wang, Y. Annual performance analysis of the solar chimney power plant in Sinkiang, China. Energy Convers. Manag. 2014, 87, 392–399. [Google Scholar] [CrossRef]
- Cao, F.; Zhao, L.; Li, H.; Guo, L. Performance analysis of conventional and sloped solar chimney power plants in China. Appl. Therm. Eng. 2013, 50, 582–592. [Google Scholar] [CrossRef]
- Ahmed, M.R.; Patel, S.K. Computational and experimental studies on solar chimney power plants for power generation in Pacific Island countries. Energy Convers. Manag. 2017, 149, 61–78. [Google Scholar] [CrossRef]
- Akhtar, Z.; Rao, K.V.S. Study of economic viability of 200 MW solar chimney power plant in Rajasthan, India. In Proceedings of the IEEE 1st International Conference on Non Conventional Energy (ICONCE 2014), Kalyani, India, 16–17 January 2014; pp. 84–88. [Google Scholar]
- Zuo, L.; Zheng, Y.; Li, Z.; Sha, Y. Solar chimneys integrated with sea water desalination. Desalination 2011, 276, 207–213. [Google Scholar] [CrossRef]
- Zuo, L.; Yuan, Y.; Li, Z.; Zheng, Y. Experimental research on solar chimneys integrated with seawater desalination under practical weather condition. Desalination 2012, 298, 22–33. [Google Scholar] [CrossRef]
- Asayesh, M.; Kasaeian, A.; Ataei, A. Optimization of a combined solar chimney for desalination and power generation. Energy Convers. Manag. 2017, 150, 72–80. [Google Scholar] [CrossRef]
- Niroomand, N.; Amidpour, M. New combination of solar chimney for power generation and seawater desalination. Desalin. Water Treat. 2013, 51, 7401–7411. [Google Scholar] [CrossRef] [Green Version]
- Fluri, T.P.; Pretorius, J.P.; Van Dyk, C.; Von Backström, T.W.; Kröger, D.G.; Zijl, G.P.A.G.V. Cost analysis of solar chimney power plants. Sol. Energy 2009, 83, 246–256. [Google Scholar] [CrossRef]
- Kiwan, S.; Salam, Q.I.A. Solar chimney power-water distillation plant (SCPWDP). Desalination 2018, 445, 105–114. [Google Scholar] [CrossRef]
- Schlaich, J.; Bergermann, R.; Schiel, W.; Weinrebe, G. Sustainable electricity generation with solar updraft towers. Struct. Eng. Int. J. Int. Assoc. Bridg. Struct. Eng. 2004, 14, 225–229. [Google Scholar] [CrossRef]
- Bernardes, M. Technical, Economical and Ecological Analysis of Solar Chimney Power Plants. Ph.D. Thesis, Universität Stuttgart, Stuttgart, Germany, 2004. [Google Scholar]
- Towler, G.; Sinnott, R. Chemical Engineering Design: Principles, Practice and Economics of Plant and Process Design; Elsevier: Amsterdam, The Netherlands, 2012; ISBN 0080966608. [Google Scholar]
- Solar-Plus-Storage Beats Combined-Cycle Gas in Jordan and Morocco|Greentech Media. Available online: https://www.greentechmedia.com/articles/read/solar-storage-beats-combined-cycle-gas-in-jordan-and-morocco (accessed on 4 May 2020).
- Renewable Power Generation Costs In 2018; IRENA: Abu Dhabi, UAE, 2019; ISBN 978-92-9260-126-3.
- Breeze, P. The Cost of Electricity from Wind Turbines. In Wind Power Generation; Elsevier: Amsterdam, The Netherlands, 2016; pp. 93–97. [Google Scholar]
Figure 1.
Schematic diagram of the proposed system: (a) 3d model view, (b) top view and (c) cross section.
Figure 1.
Schematic diagram of the proposed system: (a) 3d model view, (b) top view and (c) cross section.

Figure 2.
Energy balance diagram showing Zone 1 (Solar Air Heating), Zone 2 (Water Evaporation) and Zone 3 (Chimney) of the SCPWDP system.
Figure 2.
Energy balance diagram showing Zone 1 (Solar Air Heating), Zone 2 (Water Evaporation) and Zone 3 (Chimney) of the SCPWDP system.

Figure 3.
Current model validation compared to the reference model in [62]. Showing the results of air temperature variations across the radial distance at different water pool radius (rw), (a) rw = 15 m, (b) rw = 25 m, (c) rw = 35 m and (d) rw = 55 m.
Figure 3.
Current model validation compared to the reference model in [62]. Showing the results of air temperature variations across the radial distance at different water pool radius (rw), (a) rw = 15 m, (b) rw = 25 m, (c) rw = 35 m and (d) rw = 55 m.

Figure 4.
Current model validation compared to the reference model in [62]. Showing the results of: (a) electrical power produced and (b) the rate of distilled water produced versus different water pool radius.
Figure 4.
Current model validation compared to the reference model in [62]. Showing the results of: (a) electrical power produced and (b) the rate of distilled water produced versus different water pool radius.

Figure 5.
Sensitivity analysis for the calculated levelized cost of energy (LCOE) and produced electrical power when varying chimney height. *—The LCOE in the sensitivity analysis was based only for monthly production. We selected the monthly operating cost related to the maximum production in June.


Table 1.
Literature review of the solar chimney power plant.
| Aim of the Study | Author(s) |
|---|---|
| Develop a new simulation models. | Chergui et al. [16], Bilgen and Rheault [17] |
| Introduce multi turbo generators and power electronics. | Fluri and Von Backstrom [18] |
| Induce ventilation system using roof solar chimney. | Mathur et al. [19], Afonso and Oliveira [20], Arce et al. [21], and Harris and Helwig [17], [22] |
| Improve modeling equations. | Jing et al. [23], Pretorious and Kroger [24], Sangi et al. [25] |
| Use different absorber materials and collector types. | Miqdam and Hussein [26], Ninic [27], Koonsrisuk [28] and Chantawong et al. [29] |
| Improve storing capabilities. | Ming et al. [30], Liu and Li [31] |
| The relation between the geometric parameters of solar chimney and the power generation. | Hamdan [32], Koonsrisuk et al. [33], Jing et al. [23], Saifi et al. [34], and Kasaeian et al. [35] |
| Numerical investigations. | Guo et al. [36], Ming et al. [37], Maia et al. [38], Fasel et al. [39], Pastohr et al. [40] |
Table 2.
Research contribution on solar chimney performance based on geographic locations.
| Location | Author(s) | Year | Contribution |
|---|---|---|---|
| Tunisia | Bouabidi et al. [41] | 2018 | Effect of the chimney configurations on the local flow characteristics. |
| Saudi Arabia | Abdelmohimen et al. [42] | 2018 | Numerical investigation of solar chimney power plants performance. |
| Nigeria | Okoye et al. [43] | 2017 | Performance analysis of SCPP using hourly weather data of seven selected regions. A theoretical model was established for power output, levelized cost of electricity (LCOE) and carbon emission predictions. |
| Egypt | El- Haroun [44] | 2012 | Performance evaluation of SCPP in some locations in Egypt theoretically to make an approximation of the quantity of the generated electrical energy. |
| Iran | Sangi [45], Asnaghi [46], Maghrebi et al. [47], Kasaeian et al. [35] | 2012, 2012, 2017, 2014 | Performance evaluation, simulation and optimization of different SCPP models in different locations across Iran. |
| Arabian Gulf region | Hamdan [32] | 2011 | Propose A simplified thermodynamics analytical model for steady airflow inside a solar chimney. Evaluate the effect of geometric parameters on the solar plant power generation. |
| Algeria | Larbi et al. [48], Larbi et al. [49], Rabehi et al. [50] | 2010, 2015, 2017 | Performance and CFD analysis of different SCPP Models across regions in Algeria. |
| Mediterranean region | Nizetic et al. [51] | 2008 | Analysis and feasibility of implementing solar chimney. |
| Cyprus | Okoye et al. [52] | 2014 | A parametric study on the feasibility of solar chimney. |
| China | Guo et al. [53], Cao et al. [54] | 2014, 2013 | Annual performance analysis of the solar chimney power plant in Sinkiang. Performance analysis of conventional and sloped solar chimney power plants in China. |
| Pacific Island Countries | Ahmed and Patel [55] | 2017 | Computational and experimental studies on solar chimney power plants for power generation in Pacific Island countries. |
| India | Akhtar and Rao [56] | 2014 | Study of economic viability of 200 MW solar chimney power plant. |
Table 3.
Solar chimney power-water distillation plant (SCPWDP) physical dimensions.
| Parameter | Dimension, m |
|---|---|
| Collector Diameter | 250 |
| Collector Entrance Height | 6 |
| Chimney Height | 200 |
| Chimney Diameter | 10 |
| Water Pool Depth | 0.03 |
Table 4.
SCPWDP collector materials’ properties.
| Material Characteristic | Value |
|---|---|
| Glass Transmissivity | 0.90 |
| Glass Emissivity | 0.90 |
| Glass Absorptivity | 0.05 |
| Water Transmissivity | 0.90 |
| Water Emissivity | 0.95 |
| Water Absorptivity | 0.05 |
| Base Absorptivity | 0.95 |
| Base Emissivity | 0.95 |
Table 5.
Data for a complete day on June 21 at Aqaba, Jordan.
| Time | Global Horizontal Solar Irradiation (W/m2) | Ambient Temperature (°C) | Wind Speed (m/s) | Time | Global Horizontal Solar Irradiation (W/m2) | Ambient Temperature (°C) | Wind Speed (m/s) |
|---|---|---|---|---|---|---|---|
| 0:00 | 0.00 | 30.86 | 7.10 | 12:00 | 985.60 | 41.05 | 5.00 |
| 1:00 | 0.00 | 29.91 | 6.80 | 13:00 | 909.40 | 41.63 | 4.70 |
| 2:00 | 0.00 | 29.41 | 6.20 | 14:00 | 772.79 | 41.84 | 3.40 |
| 3:00 | 0.00 | 29.06 | 4.70 | 15:00 | 589.90 | 41.62 | 3.90 |
| 4:00 | 0.71 | 29.02 | 3.70 | 16:00 | 380.11 | 40.85 | 4.10 |
| 5:00 | 103.40 | 30.03 | 4.30 | 17:00 | 174.31 | 39.67 | 3.30 |
| 6:00 | 295.21 | 31.66 | 3.40 | 18:00 | 8.90 | 38.24 | 2.90 |
| 7:00 | 507.10 | 33.55 | 4.10 | 19:00 | 0.00 | 36.90 | 3.40 |
| 8:00 | 701.90 | 35.47 | 5.00 | 20:00 | 0.00 | 35.55 | 4.70 |
| 9:00 | 854.79 | 37.26 | 5.90 | 21:00 | 0.00 | 34.20 | 3.90 |
| 10:00 | 957.60 | 38.83 | 5.90 | 22:00 | 0.00 | 32.86 | 2.80 |
| 11:00 | 1000.20 | 40.1 | 5.40 | 23:00 | 0.00 | 31.51 | 3.40 |
Table 6.
Monthly values of power and water production for the SCPWDP at Aqaba, Jordan.
| Month | Average Monthly Global Solar Irradiation (kWh/m2) | Electric Power (kWh) | Distilled Water (ton) |
|---|---|---|---|
| January | 112.06 | 21,846.24 | 4662.90 |
| February | 126.61 | 26,542.74 | 6066.50 |
| March | 186.81 | 42,384.30 | 10,054.61 |
| April | 206.22 | 47,485.61 | 12,041.33 |
| May | 233.99 | 53,760.64 | 14,072.61 |
| June | 248.17 | 57,934.94 | 14,975.27 |
| July | 248.90 | 57,222.29 | 14,700.75 |
| August | 232.43 | 52,992.54 | 14,778.50 |
| September | 192.43 | 42,322.52 | 11,846.42 |
| October | 160.64 | 33,813.33 | 9511.02 |
| November | 122.69 | 24,201.08 | 6185.75 |
| December | 108.23 | 20,934.28 | 4857.83 |
| Sum | 2179 | 481,440 | 123,753 |
Table 7.
Capital expenditures (cost) of main components of the SCPWDP.
| CAPEX | Cost, $US | Reference |
|---|---|---|
| Chimney column | 346,611 | Equation (13) |
| Glass Base | 35,000 | $200/m2 |
| Concert basin | 50,000 | $300/m2 |
| Turbine | 403,453 | Equation (13) |
| Installation cost | 417,532 | Installation cost factor for Jordan assumed 0.039 |
| Total | 1,252,596 |
Table 8.
Annual operating cost of the SCPWDP.
| OPEX | Cost, $US/Day | Cost, $US/Annual | Reference |
|---|---|---|---|
| Anti-corrosion chemicals | 10 | 3500 | |
| Pumps | 10 | 3500 | |
| Maintenance | 10 | 3500 | |
| Labors | 20 | 7000 | |
| Credit value produced electricity | −6.211 | −2173.97 | $93/MWh cost in Jordan |
| Total | 44 | 15,326 |
© 2020 by the authors. Licensee MDPI, Basel, Switzerland. This article is an open access article distributed under the terms and conditions of the Creative Commons Attribution (CC BY) license (http://creativecommons.org/licenses/by/4.0/).
Share and Cite
MDPI and ACS Style
Abdelsalam, E.; Kafiah, F.; Alkasrawi, M.; Al-Hinti, I.; Azzam, A. Economic Study of Solar Chimney Power-Water Distillation Plant (SCPWDP). Energies 2020, 13, 2789. https://doi.org/10.3390/en13112789
AMA Style
Abdelsalam E, Kafiah F, Alkasrawi M, Al-Hinti I, Azzam A. Economic Study of Solar Chimney Power-Water Distillation Plant (SCPWDP). Energies. 2020; 13(11):2789. https://doi.org/10.3390/en13112789
Chicago/Turabian StyleAbdelsalam, Emad, Feras Kafiah, Malek Alkasrawi, Ismael Al-Hinti, and Ahmad Azzam. 2020. "Economic Study of Solar Chimney Power-Water Distillation Plant (SCPWDP)" Energies 13, no. 11: 2789. https://doi.org/10.3390/en13112789
Note that from the first issue of 2016, this journal uses article numbers instead of page numbers. See further details here.