Considering Local Air Pollution in the Benefit Assessment and Cost Allocation of Cross Border Transmission Projects

Institute for Research in Technology (IIT), Comillas Pontifical University, 28015 Madrid, Spain
*
Author to whom correspondence should be addressed.
Energies 2020, 13(6), 1426; https://doi.org/10.3390/en13061426
Submission received: 30 January 2020
/
Revised: 7 March 2020
/
Accepted: 15 March 2020
/
Published: 18 March 2020
Abstract
:Developing a regional power system to achieve a high level of integration of national systems requires sufficient development of the regional transmission grid. This is possible only with appropriate schemes for the complete cost–benefit analyses, and cost allocation of these transmission investments, which plays a critical role in the selection of the most efficient network investment and the proper assignment of their cost to the national systems. Network reinforcements affect the operation of power systems and, therefore, the externalities of power generation. This paper examines the impacts of integrating local air pollution damage from power production within the benefit assessment and cost allocation of transmission investments. The paper describes the methodology followed and illustrates its application in a real-life case study where a simplified version of a European network is considered. Within this case study, we have assessed the impact of considering the reduction in air pollution damage achieved through a particular HVDC project between France and Spain on the benefits, and benefit-driven cost allocation, computed for this project. In this case study, local pollution related benefits are a relevant fraction of the overall benefits of the considered transmission project. However, considering the local air pollution benefits of the project does not affect the net positive benefits of each country significantly, resulting in a limited change in the cost allocation of the project.
1. Introduction
1.1. Current Trends in Power System
Current power systems have experienced substantial changes in recent decades. Increasing concerns about global warming and pollution have triggered the deployment of renewable energy generation. For instance, the European Union (EU) follows an ambitious strategy to increase the renewable energy share and reduce greenhouse gas emissions. The Union aims to lower these emissions by 40% from 1990 levels in all sectors, while increasing the share of renewable energies in final energy consumption to 32% by 2030 [1]. Since emissions from electricity generation are easier to mute compared to the other emitting industries, the electricity power sector is under more pressure to reduce emissions. For instance, carbon emissions within the EU should drop to 57%–65% by 2030 in the power sector, and nearly to zero by 2050 [2]. Similarly, California, being the pioneer state in emission reductions and clean energy investments, has set a goal of 100% clean electricity by 2045 [3].
In line with the global strategy of the shift from fossil fuel-fired generation to the generation from renewable energy sources (RES), wind and solar PV generation has undergone drastic efficiency increases and cost decreases in the last decade. The total wind capacity reached 591 GW with the additional 51.3 GW installed at a global level at the end of 2018 [4]. RES-based generation capacity is expected to grow steadily in the future. However, renewable generation investments are not expected to take place close to large demand locations. These investments are typically located in remote areas where the wind or solar radiation potential is higher. The power generation in those areas will be needed to be transferred across borders, over long distances. Then, the current network will be insufficient to transfer this cheap, excess energy from those areas to the main load centers. This will create the need to undertake large investments in the power grid along with the generation expansion. European Network of Transmission System Operators for Electricity (ENTSO-E) expects approximately €114 billion of transmission and storage investments by 2030 [5].
1.2. The Challenges for Transmission Investments
Electricity transmission infrastructure at a European-wide level may contribute, to a substantial extent, to achieving both a more efficient electricity market and a larger integration of renewable sources. In order to enjoy their benefits, the required transmission projects need to be implemented in their planned time period. However, they run the risk of being delayed, or even cancelled, due to the difficulty to obtain the required permits, the instability of the regulatory framework, the existence of a funding gap for some of them, and public opposition [6,7,8]. Cross-border projects bring several parties together, e.g., regulatory authorities and project promoters, and are implemented over long distances, passing through multiple jurisdictions. In this context, how the projects are chosen and how their costs are allocated to the network users may largely affect the attitude of the relevant stakeholders towards the construction of the corresponding network reinforcements [9,10].
1.3. How the Benefit Assessment and Cost Allocation of Cross-Border Electricity Transmission Projects are Addressed in Current Practices
New regulatory mechanisms have been implemented in order to decrease the risks that the transmission projects face, and to promote their deployment process. In this regard, the advisability to undertake large interconnection projects, such as those that would make the European HVDC Supergrid, should be properly assessed based on their costs and benefits. Also, the cost of such expensive infrastructure should be allocated to countries within the EU, or to states in other regions, in a sensible way. The results of this cost allocation should be robust enough. Indeed, parties (countries, states, or large agents within them) perceiving the allocation of the cost of these projects as not being in line with the benefits they are expected to obtain from the former, may oppose, and if possible, block the deployment of such infrastructure. In the US, the Federal Energy Regulatory Commission (FERC) has developed and is applying a cost–benefit analysis framework [11] to address this issue. This framework requires the full assessment of the quantifiable benefits of projects to ensure the selection and deployment of the most beneficial of them. Within Europe, the Regulation (EU) No 347/2013 of the European Parliament and of the Council [12] for cross-border transmission projects attempts to increase the efficiency of the transmission expansion planning and implementation practices. This regulation standardizes the transmission investment assessment process and sets common rules on cost–benefit analysis (CBA) and cross-border cost allocation (CBCA) across the EU [13].
The authorities in Australia, the USA, and Europe require the application of the beneficiary-pays principle to allocate the cost of transmission investments, meaning that the cost of each investment should be allocated to each beneficiary in proportion to the benefits they are expected to gain from this investment [11,12,14,15]. This involves basing transmission planning and cost allocation decisions on a proper assessment of the benefits of projects.
1.4. Why Factor the Local Air Pollution Impact of Transmission Projects in the Benefit Assessment and Cost Allocation Decisions
The benefits of transmission projects considered by authorities in CBA traditionally include the change in the electricity production costs, which result in a change in the market benefits of producers, consumers and network congestion rents. However, carrying out a proper benefit assessment and cost allocation is possible only when the full set of benefits are included and when those benefits are comparable, i.e., when they are all represented by monetary terms.
According to [16], properly carrying out the benefit assessment and cost allocation of projects requires considering all the benefits of transmission investments even if they are difficult to determine or are subject to large uncertainty, as may happen for local air pollution benefits. Hogan [9] also objects to the socialization of this cost. He emphasizes on the quantification of all the benefits of transmission expansion projects, including those that are difficult to quantify. At the same time, the study [17] advices monetizing transmission expansion benefits to compare them in CBA.
Given the generation mix in most systems, the integration of increasing amounts of renewable generation should largely reduce air pollutants. RES generation will first replace polluting generation in the dispatch, and, thus, will decrease not only the carbon dioxide (CO2) emissions, but also the emission of local pollutants, such as nitrogen oxides (NOx), and sulfur dioxide (SO2) [16]. CO2 emissions, as the main driver of climate change, have a global environmental impact. On the contrary, NOx and SO2 emissions largely have an impact on local air quality. At the international scale, NOx and SO2 emission damage takes place through acid deposition while, at the local scale, they severely damage human health and the ecosystem by contributing to the formation of harmful pollutants, particulate matter and ozone [18]. The damages caused by NOx and SO2 depend on where and when they are released [19].
When assessing those cross-border projects that are expected to carry cheap and emission-free energy over long distances, it is critically important that the authorities consider their local environmental benefits, since they may have a large impact on the final decision on undertaking these projects and allocating their cost across countries. For instance, Europe would enjoy €13.6 to €40.7 billion direct health benefits per year if European large combustion plants reduced their NOx and SO2 emissions to the emission limit values set in the Industrial Emission Directive (Directive 2010/75/EU). Also, for the interconnection between southern California, Arizona, and the southwest in the US, the avoided NOx emissions are worth $2.2 million [20]. In fact, the authors in [21] state that the replacement of energy generated from fossil fuels by wind can even bring higher health-related savings, because of avoiding the CO2, NOx, SO2, and PM emission release, than the production cost reduction in the Iberian Peninsula. In line with references [21,22,23] highlight the relevance of the environmental gains that would result from decreasing CO2, NOx, and SO2 emissions within the power sector in various states in the US, compared with the corresponding production cost savings.
1.5. Current Regulatory Situation in Europe and in the US Regarding the Consideration of the Local Environmental Benefits of Projects
In Europe, under the ENTSO-E schemes, the socio-economic welfare gains provided by projects that are related to reduction in power production costs are monetized, while other benefits are quantified in different physical units, such as tons of CO2 emissions, MW or MWh/yr for RES integration, or MWh/yr for losses. Regarding the environmental benefits, it is important to underline the fact that the impact of CO2 emissions is internalized in the generation cost through the current Emission Trading Scheme (ETS) market in the EU. However, the effects of local air pollutants are ignored.
In the US, the California Independent System Operator (CAISO) and the New York Independent System Operator (NYISO) address the environmental benefits of the transmission projects in the broad cost–benefit analysis (CBA) they carry out within their jurisdictions. The CBA methodology developed by CAISO, the Transmission Economic Assessment Methodology (TEAM) [24], and its updated version [25], define and quantify the benefits of reinforcements for producers, consumers, and transmission owners, and social aspects in detail [24]. The quantification of the local environmental benefits in this scheme are based on the tons of NOx reduction per year achieved by each transmission project and the average allowance price, for the same years, of the CAISO NOx allowance market [26]. However, assigning a uniform value to the local air pollutants, NOx and SO2, across the whole region ignores the heterogeneous dispersion of the pollutants and does not capture their source-specific characteristics. Also, these assessments in the two regions were bounded to be applied only for the CBA, while local environmental benefits were not considered in cost allocation decisions of the project. The authorities in New York [27] adopt a similar scheme for SO2, NOx, and CO2 based on the forecasted allowance prices and the emission reductions achieved through projects. Yet, they provide the emissions cost separately and do not integrate it in their CBA.
1.6. Academic Studies of the Benefit Assessment and Cost Allocation of Transmission Investments
Among European research projects, the e-Highway 2050 [28,29,30], Realisegrid [31], and THINK [17] research projects have developed their own methodologies to compute the socio-economic benefits of the transmission projects. The e-Highway 2050 and THINK projects only take into account the traditionally considered benefits, i.e., those directly related to the decrease in production costs (consumer surplus, producer surplus, and congestion rents) and non-served energy produced by projects under normal conditions. Reductions in CO2 emissions are factored in through the internalization of the corresponding costs in the dispatch through ETS prices. Realisegrid considers a wider set of benefits from a conceptual point of view, including the local environmental benefits based on ExternE methodology. However, these are not computed at the implementation step because of the lack of sources [32].
Some academic publications have considered the local environmental impact of the development of the system. References [33,34] monetize the NOx and SO2 impact of generation expansion decisions considering the heterogeneous behavior of these pollutants in Vietnam and in the US, respectively. The study [35] provides a generic framework for the evaluation of the smart grid benefits. Regarding transmission expansion projects, only the authors in [36] quantify the decrease in the amount of CO2, NOx, SO2, and dust emitted due to the interprovincial electricity transmission projects within China. However, they do not consider the dispersion of the pollutants nor monetize these impacts.
1.7. Contributions of This Research Work
Based on the previous review, one can conclude that no previous study has included the economic value of the local environmental benefits (for NOx and SO2 emissions) produced by transmission projects within the benefit assessment and cost allocation of these projects considering their heterogeneous dispersion. We propose a methodology for this, and apply it to the benefit assessment and cost allocation analysis of a relevant transmission project in Europe for several paradigmatic future energy scenarios defined by ENTSO-E. We also assess the impact of the scenario features on the results of the previous analyses.
2. Methodology
Transmission projects may result in a reduction of the local pollutants, NOx and SO2, emitted by fossil fuel generation. In this section, we describe the approach followed to assess the impact of the consideration of the local pollution reduction benefits of transmission projects in their benefit assessment and cost allocation decisions. The benefit assessment of a project involves the computation of the benefits produced by this project. The allocation of the cost of each project is here deemed to be carried out according to the beneficiary pays principle. Those parties being negatively affected by the transmission investment assessed should, probably, not be compensated for these. However, those countries being negatively affected could try to block the construction of the corresponding project. To avoid this, in the case study considered, which is focused on the European electricity system, those countries negatively affected by the project are deemed to be compensated for these negative benefits
The benefit assessment and cost allocation of network investments have traditionally been based on the assessment of the impact of these on the energy market benefits of the system stakeholders, generators, and consumers, including the impact of these projects on congestion rents. Following this same approach, we extend it to consider the impact of transmission projects on the damages caused by two of the most relevant local pollutants, NOx and SO2. As discussed in Section 1, there are additional aspects of the functioning of power systems affected by transmission projects, like the impact of these on system resiliency, or that on competition in markets. However, these are left out because the focus of this research work is the health-related impacts of transmission projects due to their role in the change in local air pollution (Due to data availability, the damage of NOx and SO2 pollution to the ecosystem and crops is ignored).
Therefore, we consider the local environmental benefits of transmission projects within the benefit assessment and cost allocation of these projects. Then, we assess the impact of considering these benefits on the results of the benefit assessment and cost allocation at the European level and in monetary terms. Thus, the process of computation of the economic impact of transmission projects, which is proposed in this article to guide the benefit assessment and the cost allocation of these projects, comprises two separate parts:
- The computation of the impact of each project on the electricity market surplus (EMS) of the power system, including the consumer surplus, the producer surplus, and the congestion rents, while taking the evolution of the generation and demand as given.
- The computation of the monetized health benefits, in other words, avoided local pollution damage (ALPD) produced by the transmission projects. The ALPD is associated with the impact of these projects on the change in NOx and SO2 concentration levels in countries.
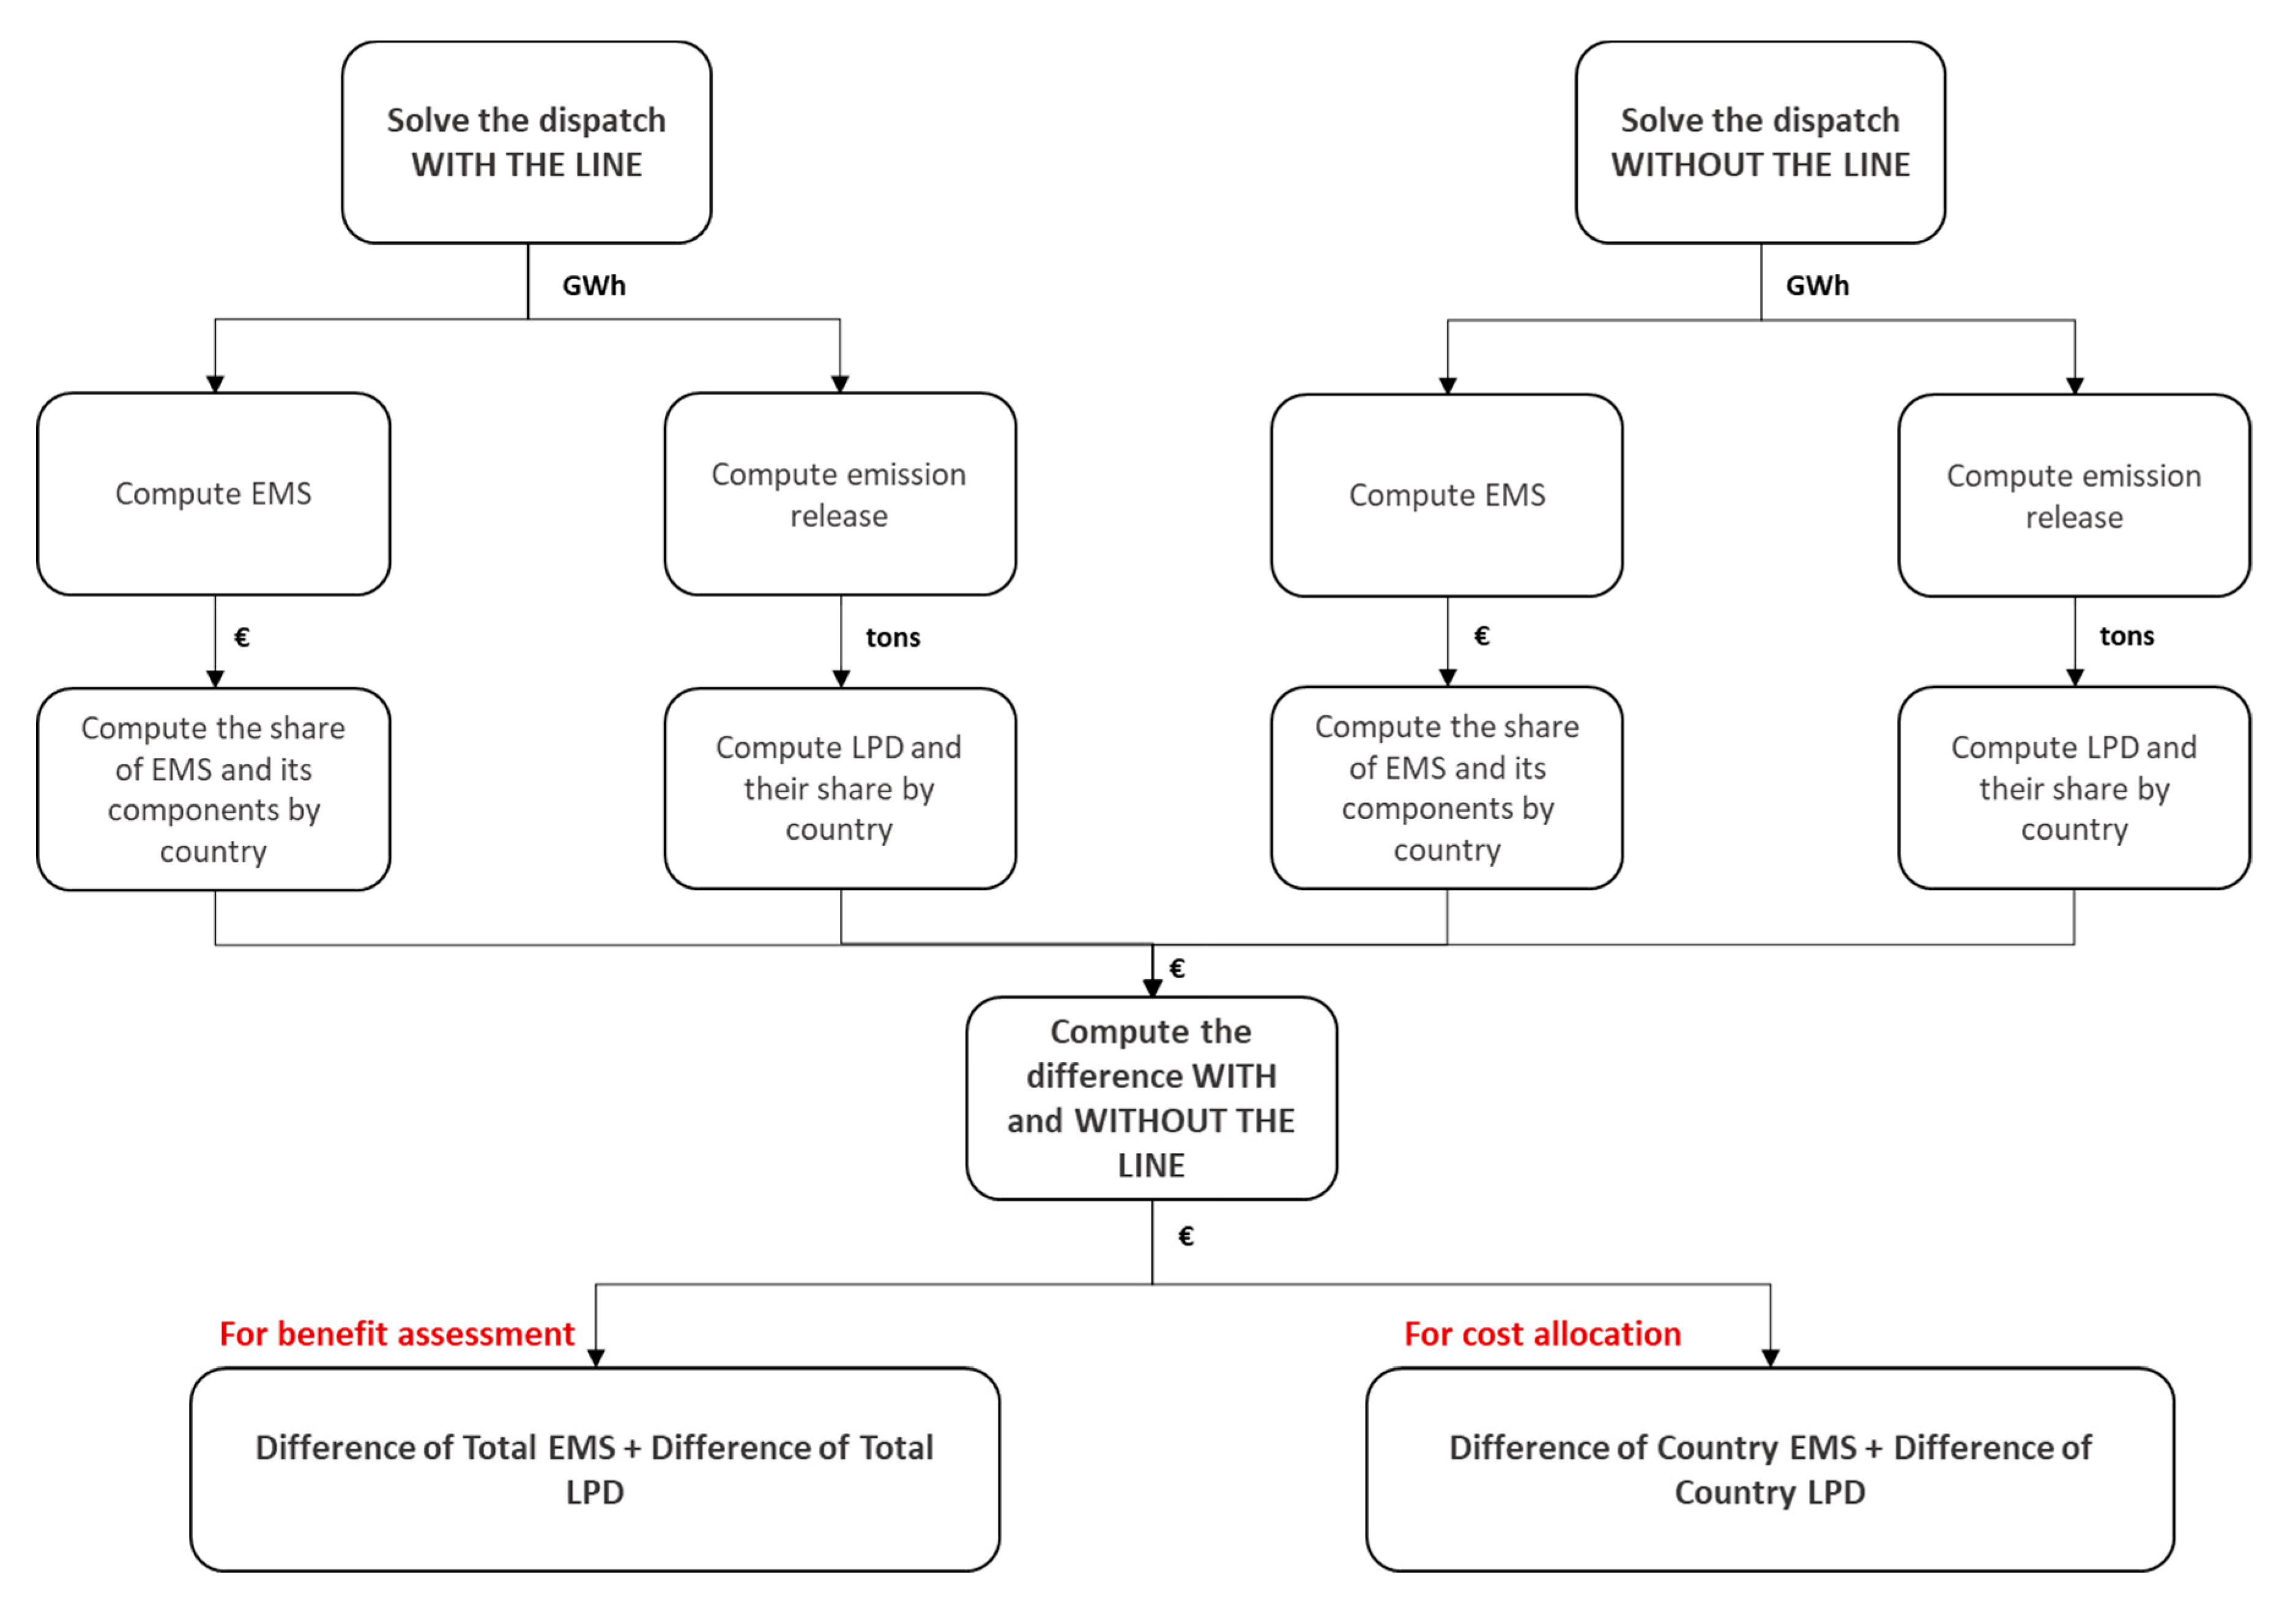
This requires computing the effect of the NOx and SO2 emissions produced by power generation on the EMS and the Local Pollution Damage (LPD) in two situations (Figure 1): (i) the situation where the transmission project is in place, and (ii) the other situation where the transmission project is not in place. The sum of both effects corresponds to the impact of NOx and SO2 emissions on the benefits created by this transmission project here considered, while the overall change in the EMS and the LPD between situations (i) and (ii) corresponds to the total benefits of this transmission investment.
In both the “with” and the “without” transmission project situations, the EMS and the LPD depend on whether a price is set on the emissions of local air pollutants. In our analysis, we assume that there is no tax applied to these emissions.
In the remainder of this section, we describe the steps to be taken to compute the EMS and the LPD in any specific situation.
2.1. Computation of Electricity Market Surplus (EMS)
As stated in the literature, the electricity market surplus within the power sector includes the consumer surplus, the producer surplus, and the congestion rents for any operation situation [9]. The consumer surplus amounts to the difference between the utility value that the electricity consumed has for the corresponding consumers and the cost for those of purchasing this electricity. Thus, consumers are better off when the purchase cost of the electricity decreases because prices decrease. The producer surplus amounts to the difference between the revenue they obtain from the sale of electricity and the cost they incur in producing it. Thus, generators are better off when a transmission project allows them to increase the amount of electricity produced, and sold, and/or when this project causes an increase in the price applied to the electricity they sell. Consumer and producer surpluses can be expressed as in Equations (1) and (2).
where is the value of lost load or utility of electricity for consumers, is the Locational Marginal Price of electricity at node, or area i, at time t, is the sum of the fuel cost and taxes applied on production by the generation unit , and is the energy produced by at time t.
Congestion rents are produced when there is not enough transmission capacity to allow all the economic electricity transactions to take place. Then, the nodal prices of electricity at both ends of certain lines, or corridors, differ. The revenues from congestion rents are, in the first place, collected by the system operator. When produced by merchant investors or associations of network users, these rents can be used to remunerate their owners. When produced by regulated transmission projects, these rents can be paid back directly or indirectly to the network users by, for instance, reducing the transmission charges they have to pay. Usually, the congestion rents produced by the interconnections among two or more systems are distributed evenly among these. Considering the existence of losses, the congestion rents produced by a line are computed as described in Equation (3).
where is the power injected at the sending end of line l connecting nodes i and j, and is the power retrieved at the receiving end of line l.
2.2. Computation of the Damage Cost of Local Pollutants
The amount of electricity produced in each country by each technology is used as an input to compute the amount of polluting emissions released in this country, as described in Equation (4) [37].
where is the emission factor for the type of emission e released by the generation unit , is the net power output of the generation unit at time t, and ηg is the efficiency rate of the generation unit g. When the emissions considered are CO2, the emission factor corresponds to the carbon content of the fuel burn by the generation unit.
In recent years, various methodologies and computer models have been used to assess the external costs of electricity generation [38]. These methodologies follow one of two possible approaches: top-down or bottom-up. The bottom-up methodology, the Impact Pathway Approach (IPA) [39], is used here to monetize the health damages caused by the local air pollutants, NOx and SO2. The IPA was developed in the ExternE project, which is a pioneer study in the field of quantification and monetization of externalities. The methodology was revised and updated repeatedly in the projects CAFÉ, NEEDS, and CASES. References [33,40,41,42,43] are a few of the various studies that follow the IPA approach to compute the externalities of power generation.
Following the steps illustrated in Figure 2, we use the IPA to assess the external cost of each pollutant emitted. This approach considers sequential links among the emissions released, their concentrations, their impacts on human beings, and the economic valuation of the resulting damages. Thus, computing the cost of emissions is a multidisciplinary analysis making use of scientific knowledge from several fields [44]. First, the quantity of emissions, for each pollutant, released at specific locations is computed based on the local electricity production per technology, its efficiency and its emission factor. Second, the dispersion of emissions is tracked to assess the concentration increase at each receiver site, for each emission type, according to the atmospheric conditions, the fuel type, the emission abatement technologies in place, and the site-specific emission concentration levels in the baseline situation [39]. As mentioned above, the pollutants damage human health both directly and contributing to the formation of harmful pollutants, particulate matter, and ozone [18]. In the analyses, both the direct and secondary damaging effects of pollutants are considered. In the third place, the resulting health damages, in physical units, are determined as a linear dose-response function of the aforementioned emission concentration increases, where these functions are computed for the population subject to the concentration of pollutants. Finally, the damages computed for each receiver site are expressed in monetary units [42,45]. Human health damages are monetized based on the individuals’ willingness-to-pay to avoid these health effects, or their willingness-to-accept the equivalent compensation.
3. Description of the Case Study
One main contribution of this work is the application of the methodology proposed to a real-life case study in Europe to properly assess the impact of considering the local pollution benefits on the benefit assessment and cost allocation of a real transmission cross-border project. The data employed in the case study should be reliable and complete to allow us to compute realistic results.
We apply the developed methodology in a context where large HVDC investments should have a role in replacing fossil fuel-fired generation in some areas with renewable energy generation in others. Thus, we have here selected and focused on a transmission investment project, within the PCIs (Projects of Common Interest) list, that has high potential to integrate renewable generation and to decrease emissions in the European system.
Taking into account its impact on local air pollution, we assess the benefits and allocate the cost of the PCI project “Biscay Gulf”, which is to be located in the western part of the French–Spanish border. This involves the deployment of an HVDC subsea cable expected to be commissioned by 2025, which will increase the interconnection capacity between these two countries from 2800 MW to 5000 MW [46]. Apart from enhancing security of supply, this project will allow a relevant amount of nuclear and renewable generation located in the Iberian Peninsula to be integrated into the European transmission grid. The project is to be paid for, mainly, by the hosting countries. However, the European Commission will also cover a part of its cost, since some of its benefits will be enjoyed by non-hosting countries [47].
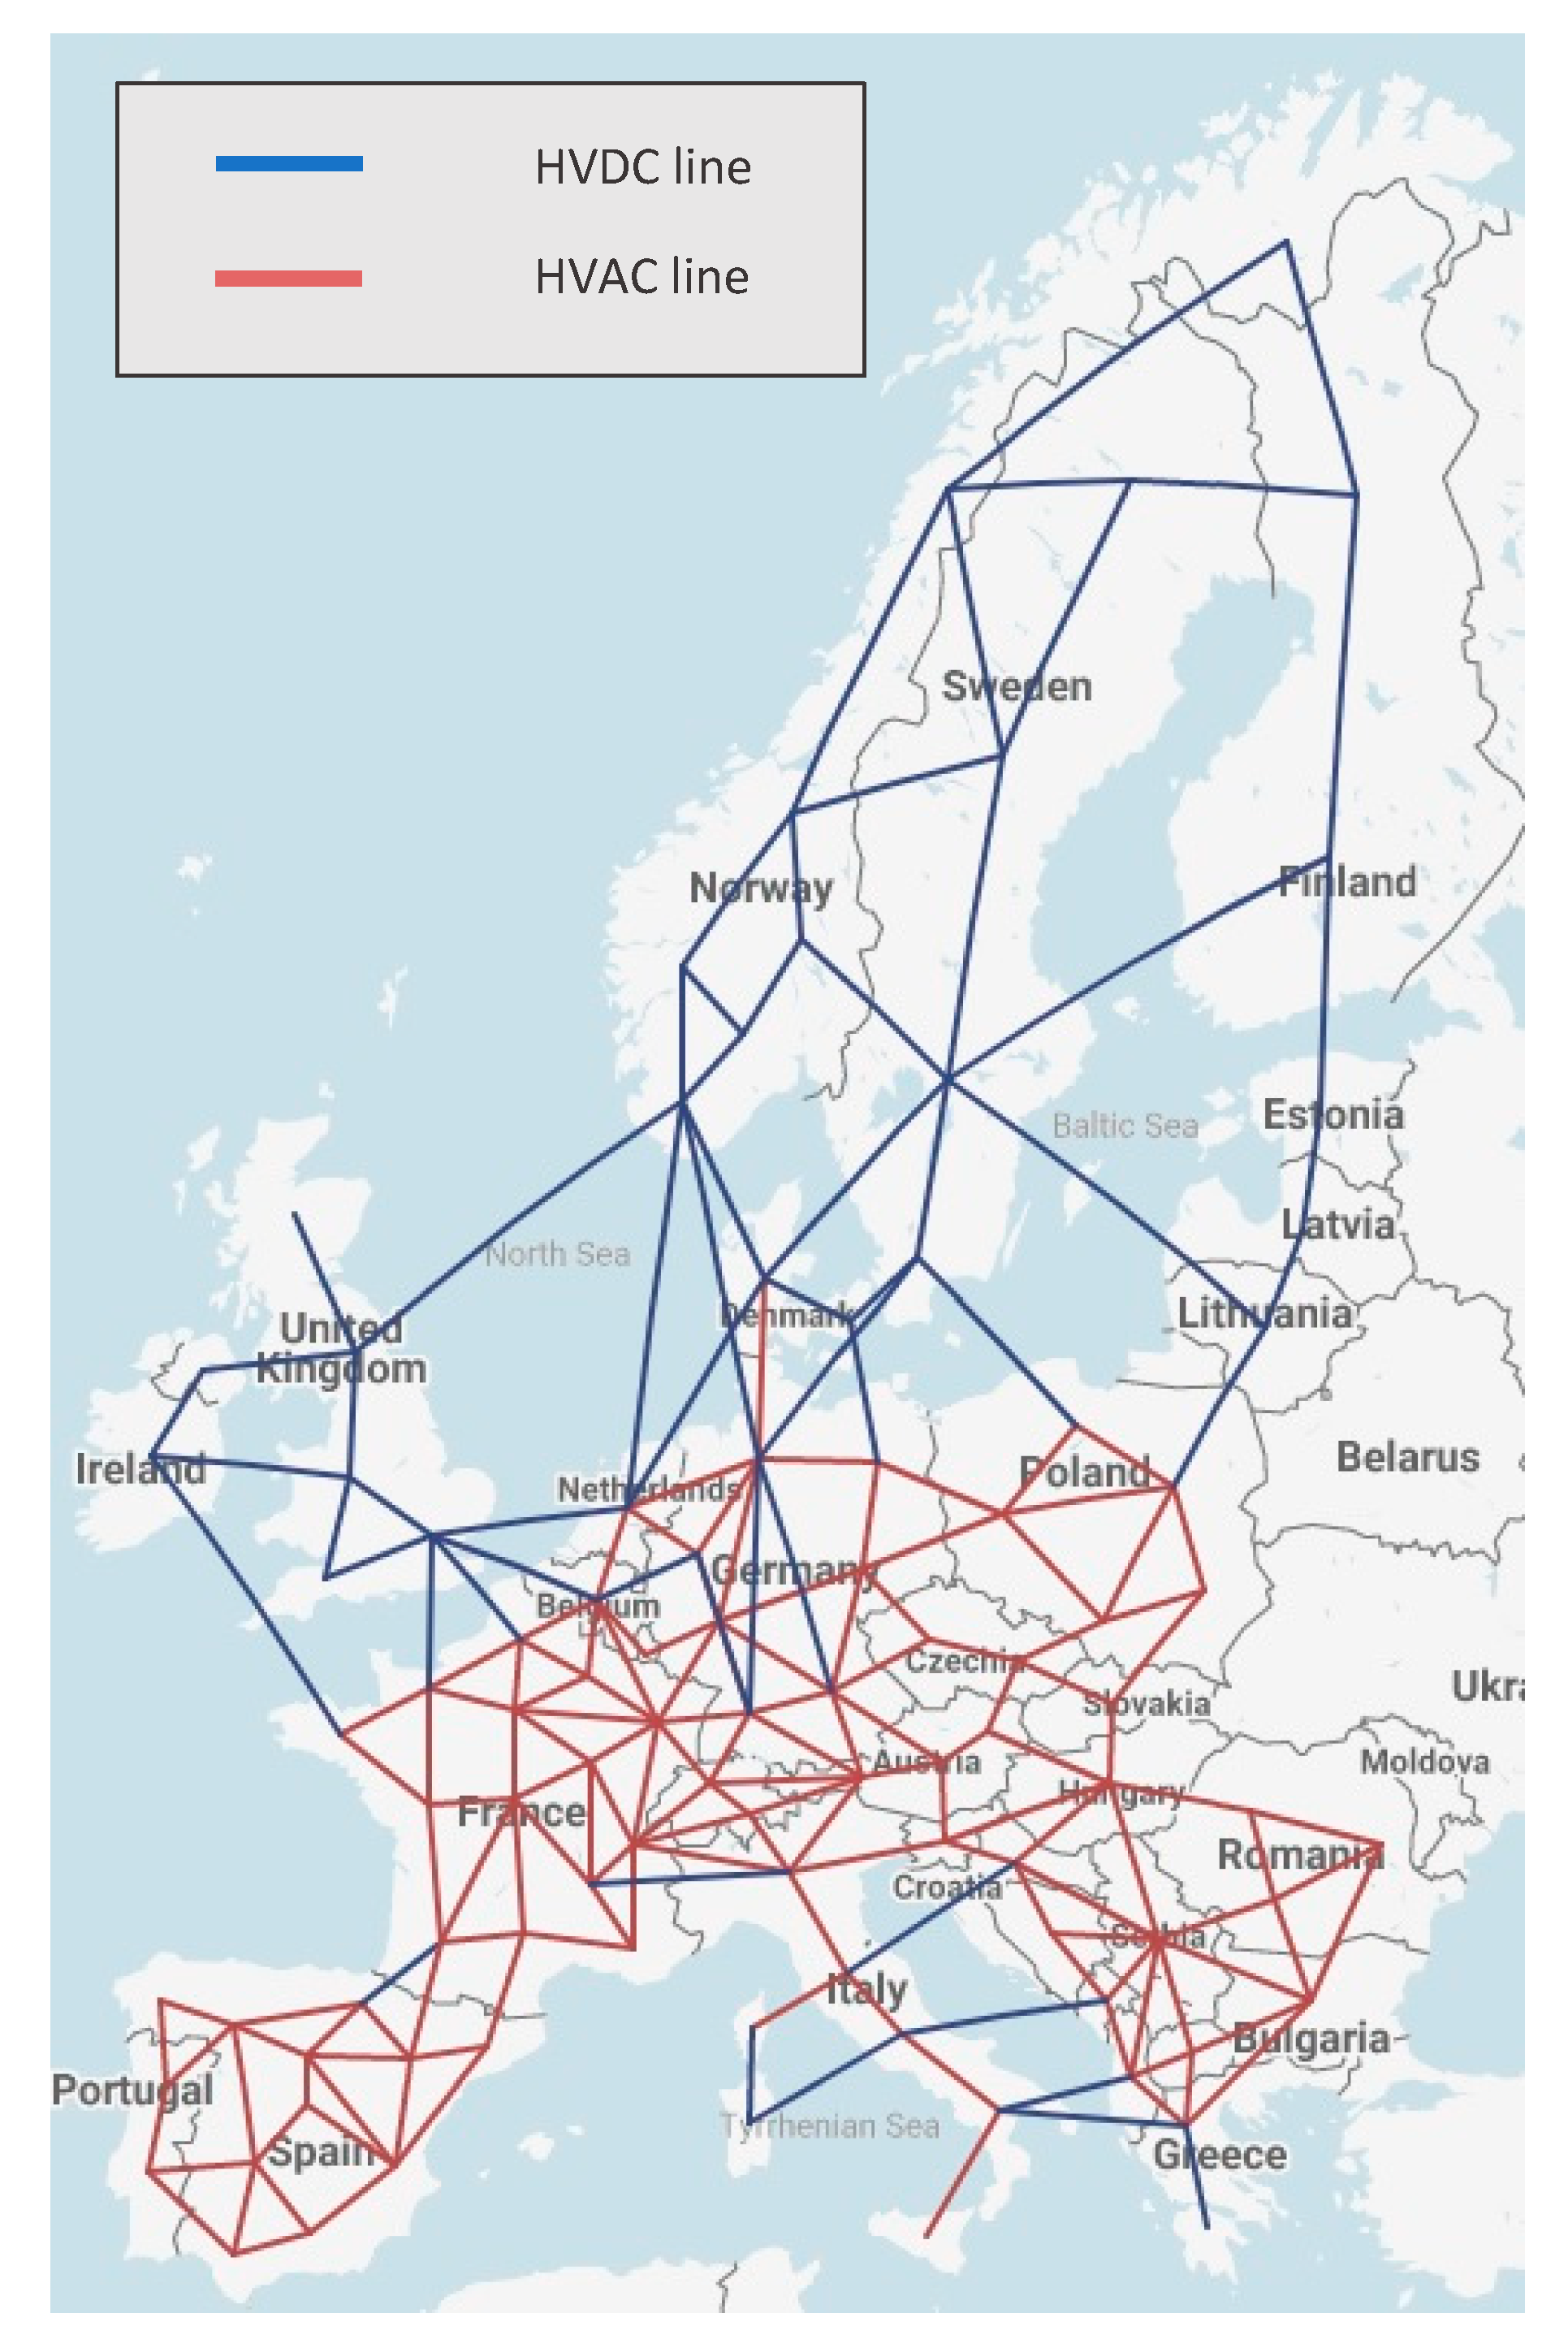
The European network model, generation, demand, and other time varying data considered within this case study correspond to the year 2030 and are based on the e-Highway 2050 Project [48] and ENTSO-E’s Ten-Year Network Development Plan (TYNDP) 2016 [49,50]. In the case study, the European transmission grid is represented by 96 nodes belonging to 33 countries (EU-28 (except Malta and Cyprus), Albania, Bosnia and Herzegovina, Montenegro, Republic of Macedonia, Norway, Serbia, and Switzerland), where there is at least one node belonging to each country, and 212 transmission lines. A single link is defined between each pair of directly connected nodes (see Figure 3). The generation technologies considered include wind, solar, hydro, biomass, combined heat-power, nuclear, hard coal, lignite, gas, and oil power plants (In TYNDP 2016, some technologies are aggregated under the names “others-RES” and “others non-RES”. According to [51,52] others-RES is mainly biomass while others non-RES is combined heat power plants. CHP is considered as non-dispatchable at our study.).
The data available in the e-Highway project data set only include the relative level of the line impedances, not their absolute values. The latter were not necessary in that project because losses were not considered in the analyses there. However, within our analyses, we consider losses; thus we have rescaled the impedances provided in the e-Highway data set considering the range provided for them in the study RESCost [54]. The level of the resistance in each High Voltage AC (HVAC) line is assumed to be 1/10 of the value of its reactance, in line with the ENTSO-E’s TYNDP 2016 data, while the resistance of HVDC lines is computed as a function of their length and capacity (The corresponding network can be found in Appendix A, Table A1).
Power flows are computed using a DC load flow model coded in GAMS. The Transmission Expansion Planning Model for an Electric System (TEPES) tool is employed to compute these flows and the economic dispatch [55]. We consider 80 hourly operation snapshots to represent the operation of the European system throughout the year 2030. These are selected based on a clustering analysis aimed at choosing those that are most representative of all the situations taking place in the year. The clustering variable employed is the vector of net nodal demand following the methodology used in [56]. Ohmic losses in the transmission grid are represented using a piecewise linear model. The variabilities of wind and solar generation output, and demand, are represented using full year-hourly profiles, while hydropower variability is represented by season and regions. The operation and expansion of the transmission network is computed deterministically, in other words, taking the evolution of demand, RES generation, and hydro inflows as given. Data from [29,57] have been employed to set the VOLL at 10 k€/MWh in all the 33 countries.
It is crucial to use accurate and reliable values of the monetized health impact of local pollution. The methodology chosen to compute the aforementioned impacts in this study, the IPA, was implemented in the EcoSense model. In our study, the updated version of this model, EcoSenseWeb2 by [58], was employed. The latter model applies an improved methodology and computes updated values for the impact factors. This allowed us to consider separately the polluter–receiver country emission relationship in 2030 for the 33 countries of focus. Making use of this, emitter–receiver country emission relationships have been properly established and the damages caused in each country by changes in the emissions in this or any other have been assessed accurately.
The methodology here proposed is applied to two of the scenarios considered in the computation of the ENTSO-E TYNDP 2016. These two stand at two opposite ends within the 2050 energy roadmap. While the first scenario, Vision 1, or “Slowest Progress”, is delayed to reach 2050 emission reduction targets, the second scenario, Vision 3, or “National Green Transition”, stays on track. Both Visions assume the continuation of the ETS market for the determination of CO2 prices and no European taxation or market mechanism implemented for NOx and SO2. Regarding the analysis here, both scenarios differ in the assumptions made on the variable production costs of technologies, their installed capacities, the demand and RES generation output time series, provided by ENTSO-E.
Vision 1 assumes a weak focus on emission reduction and a low level of investments in new generation facilities of any type by 2030 in Europe. Under Vision 1, the installed capacity of coal, lignite, and gas power plants amounts, in total, to 27% of the total installed generation capacity. On the other hand, the installed capacity of solar and wind energy stays at 34% of the total installed capacity while the share of hydro power plants is 20%. Nuclear is still a key generation technology in Western Europe together with fossil-fuel fired generation. Compared to Vision 1, Vision 3 is very ambitious regarding the level of installed renewable energy generation. In this scenario, the European countries are expected to meet their national energy policy targets in terms of penetration of renewable energy generation, efficiency, and emissions reduction by 2030. Accordingly, the share of wind and solar installed capacity over the total installed capacity in Europe reaches 42%. Hydro power plant capacity stays at 20% of the total installed capacity but with a capacity increase of 24 GW. Table 1 shows the detailed breakdown of generation capacity by technology for both scenarios for selected countries.
Table 2 shows the components of the variable costs considered for electricity production per technology and scenario. The NOx and SO2 marginal health damage costs provided in the table are the average of those considered for all the countries in Europe. The CO2 costs, which are internalized by generation through the price they have to pay for emission allowances, are specific to each ENTSO-E scenario. The NOx and SO2 damage costs should also be, but common figures have been considered because data on these were only available for a reference EcoSenseWeb2 scenario.
The efficiencies of power plants are derived from [59,60], while the carbon content of fuels is obtained from TYNDP 2018 [61]. Technology-specific emission factors for the year 2030 are derived based on the EMEP/EEA Emission Inventory Guidebook [62] and Best Available Technologies [63]. All values are shown in Table 3.
4. Results
This section provides the results computed for each scenario on the benefits of the transmission project concerned, as well as on the fraction of the overall benefits of the project that each country is expected to obtain. The set of benefits considered include those benefits related to the reduction of local air pollution damage achieved through the project. Then, the impact of the local environmental benefits on the previous results is also assessed.
4.1. Impact of the Avoided Local Air Pollution Damage on the Benefit Assessment of the New Transmission Project
The system-wide benefits of each type produced by the project are presented in Table 4. The results show an increase in the efficiency of the generation dispatch leading to an increase in the EMS. Considering the ALPD in the benefit assessment results in 36% and 20% increase in the Total Benefits (TB) in Vision 1 and Vision 3, respectively. Table 5 displays the ALPD related to each air pollutant, together with avoided CO2 and fuel cost by the project for each scenario. Note that the change in generation cost is equal to the change in electricity market surplus if demand is considered inelastic. The change in consumer surplus, producer surplus, congestion rent, and avoided NOx and SO2 damages are provided in Table 6 for the countries largely effected by the new transmission project.
Next, the results for each Vision are discussed in detail.
4.1.1. Results for Vision 1
In this scenario, the annual, system-wide, local pollution damage is higher, around €35 billion in 2030, while the CO2 emissions cost reaches only €7 billion. Fuel costs stay around €27 billion, which is lower than the local pollution damage.
In 2030, the health damage costs related to the NOx and SO2 emissions decrease by €44 million due to the installation of the transmission line. This is almost twice the CO2 cost savings and corresponds to 36% of the EMS increase produced by the new line.
This is because, due to the project, larger amounts of cheap, zero-CO2 emitting, electricity is produced by nuclear generation in France to supply load in Spain. Annual coal and biomass generation decrease considerably in Spain, by 2.7 TWh and 1.8 TWh, respectively. These are largely replaced by 4 TWh of additional nuclear generation in France. Coal generation in Germany slightly increases (0.6 TWh). The resulting NOx emissions drop, of almost 2000 tons, is due to the reduction in biomass generation taking place, while the SO2 emissions drop, of 4000 tons, is due to the coal generation decrease (largely occurring in Spain). Accordingly, the reduction in NOx and SO2 emissions leads to €44 million worth of savings in health damages in the region. Replacing expensive coal generation with cheaper nuclear generation leads to variable generation cost savings (market surplus increases) of €122 million. Within these, CO2 emissions cost reductions amount to €26 million, while fuel cost reductions amount to €96 million (Table 5). Thus, the overall line benefits reach €166 million.
The deployment of the project produces a rise in the marginal electricity price in Belgium and France of €1/MWh overall, while the price in Spain decreases by the same amount due to the replacement of expensive generation there by cheaper methods. Larger amounts of cheap, zero-CO2 emitting, electricity produced in France by nuclear generation supply load in Spain, thanks to the increase in the transmission capacity between both countries. Producers’ and consumers’ welfare in Spain and France change in opposite directions. While producers enjoy annual market profits €118 million larger in France, producers’ profits in Spain decrease by €430 million. The annual Spanish consumers’ increase in market benefits amounts to €830 million, while the resulting welfare losses for those in France are €200 million. Spain is also benefiting from a decrease in local air pollutants. Spain and Portugal enjoy improved health conditions worth €90 million. On the other hand, the local pollution damage in Germany, the Netherlands, Belgium, Czech Republic, Poland, and Italy increases by more than €45 million. Half of this extra damage occurs in Germany.
4.1.2. Results for Vision 3
In Vision 3, the relative weights of generation technologies in the mix differ from those in Vision 1. As mentioned in Section 3, the share of renewable generation is significantly larger in Vision 3. This leads to a lower total local pollution damage for both with and without the line in Vision 3. Consequently, total local pollution damage is significantly smaller than that in Vision 1. It amounts to €16 billion. On the other hand, CO2 costs increase significantly with respect to Vision 1 as a result of higher CO2 costs. They amount to €12 billion (Table 5).
Undertaking the new transmission project reduces the ALPD of NOx and SO2 by €20 million (Table 4). This corresponds to half of the CO2 cost savings and 20% of the change in EMS (including the reductions in fuel costs and CO2 costs). Most of the savings achieved by this project are due to the replacement of 1.4 TWh of generation by gas plants and 0.5 TWh of generation by lignite plants in Europe with 1.8 TWh of additional generation by wind plants, largely in the North Sea. Changes in generation are widespread over a higher number of units. NOx and SO2 emissions decrease by 500 tons due to a reduction of biomass generation in Spain and lignite generation in Germany. These reductions in emission release lessen the health damage by €30 million, mainly in Germany, Spain, France, and Poland. However, a slight increase in lignite generation in Czech Republic and Bosnia and Herzegovina increase the health damages in these countries and its surroundings by €10 million.
As for the country-wise distribution of the benefits provided by the project, the hosting countries, Spain and France, are also the countries obtaining the largest benefits from it. The overall total benefits including the ALPD obtained by the agents in these two countries increase by €210 million and €85 million due to the project, respectively.
4.2. Assessment of the Impact of the Consideration of the Local Air Pollution Damage on the Cost Allocation of the Transmission Project
According to the beneficiary-pays principle, those countries who benefit from a new transmission project should bear its cost in proportion to their share of the total benefits expected to be produced by the project. In an international context, those countries, or States, obtaining negative net benefits from the project could receive a compensation to overcome their opposition to the undertaking of the project. This may not be justified on theoretical grounds (based on economic theory), but could be of help to achieve a sufficient development of the regional grid. Compensations would have to be paid by those countries, or States, obtaining positive net benefits from the project, and would, therefore, increase the size of the payments they should face. Here, we consider the payment of compensations to those countries being negatively affected by the project in net terms.
Some regional institutions in Europe, namely Agency for the Cooperation of Energy Regulators (ACER), support assigning the cost of new projects only to those countries obtaining more than 10% of their positive benefits, in order to streamline cost allocation decisions [64]. However, allocating the cost of new projects only to their main beneficiaries could be largely inefficient for projects whose benefits are widespread, giving rise to a free-riding problem. Thus, generally speaking, we advocate considering all the beneficiaries of projects in their cost allocation. Given that the benefits produced by the concerned project are largely concentrated in few countries, here we will only provide and discuss the results for these countries.
Table 7 and Table 8 show the change in the EMS, ALPD, and TB of those countries which are largely affected by the implementation of the project. The total benefits obtained by each country from the project comprise the changes in the EMS from the dispatch and the ALPD corresponding to this country. The values are represented in percentages and in M€, yet the percentages are added only to the countries with positive benefits. The percentages in these tables correspond to the ratio of the positive benefit a country obtains to the total positive benefit obtained by Europe, as a whole, from the implementation of the line. The reason is that only the positively affected countries are responsible from the cost of the line with respect to the benefits they gain over the total positive benefits, meaning that the percentages are relevant for positively affected countries. The countries with negative benefits, on the other hand, are to be compensated in real terms.
4.2.1. Results for Vision 1
Although the consideration of local air pollution benefits significantly increases the net benefits of the project, the corresponding changes in the benefits of individual countries from this project are far less significant in this case. Even though the total avoided health damages through this project are large, their change within individual countries is much smaller than the changes caused by this project in the EMS by these countries, individually. For instance, as a result of the consideration of the impact of the project on the local environmental damage within each country, the share of the total positive benefits produced by the project that is enjoyed by Spain increases from 83% to 85%, while that for Portugal decreases from 15% to 14% (Table 7). The absolute negative benefits obtained by France change slightly from −€193 to −€194 million. An exception is Germany, whose negative benefits more than double and reach −€48 million.
According to the cost allocation rules defined above, the consideration of the local pollution damages avoided by the project would result in a 2% increase in Spain’s payment associated with the project, while Portugal’s would decrease by 1%. Germany and France should be compensated for the losses they incur due to the project. These losses are equal to the change in TB they experience.
4.2.2. Results for Vision 3
Analogous to the case for Vision 1, the magnitude of the local air pollution damage avoided by the project in each country is much smaller than the net change in the EMS in this country. Thus, the shares of the TB of the project obtained by individual countries remain largely unchanged when local air pollution benefits are considered. Germany is the country affected to a largest extent. Its net losses decrease by half, from €35 million to €17 million, when considering local air pollution costs. On the other hand, the net benefits of Spain and France only rise by €10 million and €2 million, respectively, when considering local environmental benefits, which are small amounts compared to their overall benefits from the project (Table 8).
Consequently, the payments of individual countries associated with the project do not change significantly when considering the local environmental benefits. Spain’s share in the overall project benefits stays at 64%; in other words, the cost share of Spain in the transmission project does not change. Since France’s benefits decrease from 26% to 25%, the payment decreases by 1% of the total payments related to the project. An exception to this general trend is Germany, whose benefits from the project remain negative when considering the local environmental benefits (TB), but are half, in magnitude, of those obtained by the country when the local environmental benefits are not considered (EMS). This results in a decrease in the compensation earned by the country. Belgium and Italy obtain negative benefits from the transmission project, i.e., are negatively affected by it. However, the consideration of the avoided local pollution damage within the benefits produced by the project does not change significantly the compensation payment to be received by these negatively affected countries.
5. Conclusions
Large transmission investments can be expected in the future and should bring fundamental changes in the operation and investment decisions of the power system. Therefore, these network projects may bring substantial benefits to the stakeholders and the system as a whole. Given the large cost and expected impact of new HVDC projects and others alike, it is essential to accurately determine their benefits and their distribution across stakeholders or local systems. This should allow authorities to efficiently determine which network investments to undertake and how to allocate their cost. Accurately carrying out the cost–benefit analysis, and cost allocation, of the new transmission projects requires the assessment of the benefits of all types they are expected to produce, even the ones which are difficult to quantify and monetize.
Within this context, we propose a framework to determine and monetize the local environmental benefits of the new transmission projects. Then, we estimate, for a relevant case study of the European system, the impact of considering the local environmental benefits of projects on the assessment of their total benefits, and the efficient allocation of their cost based on the distribution across countries of these benefits. This is especially relevant for those transmission projects contributing to the integration of large amounts of clean (renewable or nuclear) electricity generation.
In the case study considered, we compute the benefits of a particular interconnection line in Europe connecting Spain and France. The generation mix existing in the system and within each country may significantly affect the benefits produced by the project. These results may be largely dependent on the transmission project assessed and the scenario considered. Thus, in Vision 1, nuclear generation in France is most largely affected by increasing its production as a result of the implementation of the project. However, in Vision 3, wind generation is the technology increasing its production to the largest extent.
In the case study, the benefits of the considered project related to the reduction of local pollution constitute a relevant part of the overall benefits. Apparently, the local environmental benefits created by some projects may be even larger than those related to the reduction of CO2 emissions they bring about. However, the local environmental benefits obtained by individual countries from the project considered in the case study are, for the majority of countries, much smaller than the benefits of other types, namely the electricity market surplus benefits, obtained by these countries from the project. Then, the consideration of the local environmental benefits of this project does not alter relevantly the efficient allocation of its cost, carried out according to the beneficiary-pays principle.
Further research should focus on applying the framework proposed to other transmission projects. In addition, this framework should be adapted to the consideration of the application of NOx and SO2 taxes in those regions where they are expected to be in place.
Author Contributions
Conceptualization, D.S., L.O, and M.R.; methodology, D.S., L.O., and M.R.; validation, D.S., L.O, and M.R.; formal analysis, D.S.; investigation, D.S.; data curation, D.S.; writing—original draft preparation, D.S.; writing—review and editing, L.O. and M.R.; visualization, D.S.; supervision, L.O. and M.R.; project administration, L.O. and M.R. All authors have read and agreed to the published version of the manuscript.
Funding
This research was funded by the SUPERRED project financed by the Spanish Ministry of Economy, Industry and Competitiveness and the European Regional Development Fund (ENE2015-67048-C4-2-R/MINECO/FEDER).
Acknowledgments
The authors would like to express their gratitude to Dorothea Schmid and Institut für Energiewirtschaft und Rationelle Energieanwendung (IER), who provided the EcoSenseWeb2 data for our research. We are grateful to Andrés Ramos, Isaac Camilo González, and Leandro Lind from Comillas Pontifical University for their support in the model. We would also like to thank Laura Supple for her supporting work while visiting Comillas Pontifical University. This work has also benefitted from conversations of the authors with Julio Lumbreras from the Department of Industrial Chemical and Environmental Engineering at the Polytechnic University of Madrid, and Pedro Linares, from Comillas Pontifical University.
Conflicts of Interest
The authors declare no conflict of interest.
Appendix A

| Node | Node | Line Type | R (pu) | X (pu) | NTC (MW) | Node | Node | Line Type | R (pu) | X (pu) | NTC (MW) |
|---|---|---|---|---|---|---|---|---|---|---|---|
| 01_ES | 02_ES | AC | 0.0002 | 0.0022 | 7200 | 44_PL | 45_PL | AC | 0.0002 | 0.0020 | 8900 |
| 01_ES | 03_ES | AC | 0.0003 | 0.0029 | 0 | 46_SK | 58_HU | AC | 0.0001 | 0.0009 | 5400 |
| 01_ES | 12_PT | AC | 0.0003 | 0.0028 | 1200 | 47_CH | 48_CH | AC | 0.0000 | 0.0003 | 19800 |
| 02_ES | 03_ES | AC | 0.0001 | 0.0009 | 19100 | 47_CH | 49_AT | AC | 0.0023 | 0.0231 | 900 |
| 02_ES | 04_ES | AC | 0.0007 | 0.0073 | 2400 | 48_CH | 49_AT | AC | 0.0021 | 0.0209 | 1500 |
| 02_ES | 07_ES | AC | 0.0003 | 0.0029 | 0 | 48_CH | 52_IT | AC | 0.0002 | 0.0020 | 8500 |
| 02_ES | 08_ES | AC | 0.0018 | 0.0176 | 2400 | 49_AT | 50_AT | AC | 0.0004 | 0.0043 | 6300 |
| 02_ES | 12_PT | AC | 0.0008 | 0.0084 | 950 | 49_AT | 52_IT | AC | 0.0007 | 0.0074 | 2300 |
| 03_ES | 04_ES | AC | 0.0002 | 0.0022 | 7100 | 50_AT | 51_AT | AC | 0.0004 | 0.0044 | 6100 |
| 03_ES | 05_ES | AC | 0.0006 | 0.0061 | 3900 | 50_AT | 57_SI | AC | 0.0021 | 0.0205 | 1600 |
| 03_ES | 07_ES | AC | 0.0002 | 0.0019 | 10200 | 51_AT | 58_HU | AC | 0.0008 | 0.0079 | 1600 |
| 03_ES | 11_ES | AC | 0.0007 | 0.0071 | 2700 | 52_IT | 53_IT | AC | 0.0007 | 0.0075 | 2200 |
| 04_ES | 05_ES | AC | 0.0008 | 0.0085 | 900 | 52_IT | 57_SI | AC | 0.0013 | 0.0131 | 3600 |
| 04_ES | 07_ES | AC | 0.0003 | 0.0029 | 0 | 53_IT | 54_IT | AC | 0.0008 | 0.0076 | 2000 |
| 05_ES | 06_ES | AC | 0.0002 | 0.0022 | 7000 | 53_IT | 99_FR | AC | 0.0009 | 0.0087 | 300 |
| 05_ES | 07_ES | AC | 0.0003 | 0.0029 | 0 | 54_IT | 55_IT | AC | 0.0003 | 0.0029 | 10000 |
| 05_ES | 11_ES | AC | 0.0005 | 0.0048 | 5700 | 55_IT | 56_IT | AC | 0.0008 | 0.0083 | 1100 |
| 05_ES | 14_FR | AC | 0.0024 | 0.0239 | 700 | 57_SI | 58_HU | AC | 0.0008 | 0.0085 | 900 |
| 06_ES | 07_ES | AC | 0.0003 | 0.0029 | 0 | 57_SI | 62_HR | AC | 0.0003 | 0.0026 | 3400 |
| 06_ES | 11_ES | AC | 0.0022 | 0.0224 | 1100 | 58_HU | 59_RO | AC | 0.0008 | 0.0081 | 1400 |
| 06_ES | 15_FR | AC | 0.0003 | 0.0029 | 2100 | 58_HU | 62_HR | AC | 0.0003 | 0.0027 | 2300 |
| 07_ES | 08_ES | AC | 0.0002 | 0.0020 | 8700 | 58_HU | 65_RS | AC | 0.0024 | 0.0239 | 700 |
| 07_ES | 11_ES | AC | 0.0008 | 0.0075 | 2100 | 59_RO | 60_RO | AC | 0.0003 | 0.0026 | 3500 |
| 07_ES | 12_PT | AC | 0.0003 | 0.0029 | 0 | 59_RO | 61_RO | AC | 0.0008 | 0.0085 | 900 |
| 08_ES | 09_ES | AC | 0.0004 | 0.0044 | 6100 | 60_RO | 61_RO | AC | 0.0002 | 0.0025 | 4700 |
| 08_ES | 10_ES | AC | 0.0006 | 0.0061 | 4000 | 60_RO | 65_RS | AC | 0.0007 | 0.0072 | 2500 |
| 08_ES | 13_PT | AC | 0.0023 | 0.0231 | 900 | 60_RO | 66_BG | AC | 0.0024 | 0.0235 | 800 |
| 09_ES | 10_ES | AC | 0.0003 | 0.0029 | 8100 | 61_RO | 66_BG | AC | 0.0008 | 0.0085 | 900 |
| 09_ES | 13_PT | AC | 0.0025 | 0.0246 | 500 | 62_HR | 63_BA | AC | 0.0003 | 0.0025 | 4000 |
| 10_ES | 11_ES | AC | 0.0015 | 0.0146 | 3200 | 62_HR | 65_RS | AC | 0.0009 | 0.0086 | 700 |
| 12_PT | 13_PT | AC | 0.0006 | 0.0061 | 4000 | 63_BA | 64_ME | AC | 0.0003 | 0.0028 | 1400 |
| 14_FR | 15_FR | AC | 0.0003 | 0.0028 | 2000 | 63_BA | 65_RS | AC | 0.0003 | 0.0026 | 3100 |
| 14_FR | 17_FR | AC | 0.0007 | 0.0068 | 3000 | 64_ME | 65_RS | AC | 0.0007 | 0.0069 | 2900 |
| 14_FR | 18_FR | AC | 0.0022 | 0.0224 | 1100 | 64_ME | 70_AL | AC | 0.0008 | 0.0085 | 900 |
| 15_FR | 16_FR | AC | 0.0006 | 0.0065 | 3500 | 65_RS | 66_BG | AC | 0.0008 | 0.0085 | 900 |
| 15_FR | 18_FR | AC | 0.0006 | 0.0057 | 4500 | 65_RS | 67_MK | AC | 0.0008 | 0.0077 | 1900 |
| 16_FR | 19_FR | AC | 0.0002 | 0.0024 | 5200 | 65_RS | 70_AL | AC | 0.0023 | 0.0231 | 900 |
| 16_FR | 20_FR | AC | 0.0026 | 0.0261 | 450 | 66_BG | 67_MK | AC | 0.0009 | 0.0086 | 700 |
| 17_FR | 18_FR | AC | 0.0003 | 0.0025 | 4200 | 66_BG | 68_GR | AC | 0.0025 | 0.0246 | 500 |
| 17_FR | 21_FR | AC | 0.0002 | 0.0024 | 5400 | 67_MK | 68_GR | AC | 0.0009 | 0.0087 | 600 |
| 17_FR | 22_FR | AC | 0.0046 | 0.0457 | 250 | 67_MK | 70_AL | AC | 0.0009 | 0.0086 | 700 |
| 18_FR | 19_FR | AC | 0.0007 | 0.0075 | 2200 | 68_GR | 70_AL | AC | 0.0024 | 0.0235 | 800 |
| 18_FR | 23_FR | AC | 0.0002 | 0.0019 | 10000 | 04_ES_ | 14_FR_ | DC | 0.0002 | 0.0238 | 2000 |
| 18_FR | 24_FR | AC | 0.0058 | 0.0580 | 125 | 19_FR_ | 52_IT_ | dc | 0.0007 | 0.0448 | 1000 |
| 19_FR | 20_FR | AC | 0.0001 | 0.0008 | 6000 | 21_FR_ | 96_IE_ | DC | 0.0016 | 0.0680 | 700 |
| 19_FR | 24_FR | AC | 0.0003 | 0.0027 | 2500 | 22_FR_ | 90_UK_ | DC | 0.0005 | 0.0312 | 1000 |
| 20_FR | 24_FR | AC | 0.0003 | 0.0026 | 3000 | 26_FR_ | 90_UK_ | DC | 0.0002 | 0.0274 | 2000 |
| 20_FR | 25_FR | AC | 0.0022 | 0.0222 | 1150 | 28_BE_ | 33_DE_ | DC | 0.0004 | 0.0222 | 1000 |
| 20_FR | 47_CH | AC | 0.0011 | 0.0106 | 4300 | 28_BE_ | 90_UK_ | DC | 0.0006 | 0.0353 | 1000 |
| 20_FR | 48_CH | AC | 0.0022 | 0.0217 | 1300 | 30_NL_ | 38_DK_ | DC | 0.0011 | 0.0498 | 700 |
| 20_FR | 52_IT | AC | 0.0009 | 0.0087 | 4800 | 30_NL_ | 79_NO_ | DC | 0.0017 | 0.0739 | 700 |
| 21_FR | 22_FR | AC | 0.0002 | 0.0022 | 7000 | 30_NL_ | 90_UK_ | DC | 0.0006 | 0.0389 | 1000 |
| 22_FR | 23_FR | AC | 0.0007 | 0.0073 | 2400 | 31_DE_ | 36_DE_ | DC | 0.0004 | 0.0510 | 2000 |
| 22_FR | 26_FR | AC | 0.0007 | 0.0067 | 3200 | 31_DE_ | 37_DE_ | DC | 0.0002 | 0.0487 | 4000 |
| 23_FR | 24_FR | AC | 0.0006 | 0.0065 | 3500 | 31_DE_ | 79_NO_ | DC | 0.0007 | 0.0651 | 1400 |
| 23_FR | 25_FR | AC | 0.0006 | 0.0061 | 4000 | 31_DE_ | 89_SE_ | DC | 0.0006 | 0.0473 | 1200 |
| 23_FR | 26_FR | AC | 0.0001 | 0.0010 | 17900 | 32_DE_ | 72_DK_ | DC | 0.0007 | 0.0269 | 600 |
| 23_FR | 27_FR | AC | 0.0022 | 0.0224 | 1100 | 33_DE_ | 36_DE_ | DC | 0.0003 | 0.0343 | 2000 |
| 24_FR | 25_FR | AC | 0.0006 | 0.0059 | 4200 | 38_DK_ | 72_DK_ | DC | 0.0005 | 0.0171 | 600 |
| 25_FR | 27_FR | AC | 0.0003 | 0.0026 | 3500 | 38_DK_ | 79_NO_ | DC | 0.0003 | 0.0335 | 1700 |
| 25_FR | 28_BE | AC | 0.0025 | 0.0250 | 400 | 38_DK_ | 88_SE_ | DC | 0.0010 | 0.0464 | 740 |
| 25_FR | 35_DE | AC | 0.0008 | 0.0075 | 2100 | 41_PL_ | 77_LT_ | DC | 0.0006 | 0.0348 | 1000 |
| 25_FR | 36_DE | AC | 0.0020 | 0.0198 | 1800 | 45_PL_ | 89_SE_ | DC | 0.0011 | 0.0421 | 600 |
| 25_FR | 47_CH | AC | 0.0012 | 0.0120 | 3900 | 53_IT_ | 62_HR_ | DC | 0.0007 | 0.0455 | 1000 |
| 26_FR | 27_FR | AC | 0.0005 | 0.0054 | 4900 | 54_IT_ | 64_ME_ | DC | 0.0008 | 0.0496 | 1000 |
| 26_FR | 28_BE | AC | 0.0007 | 0.0069 | 2900 | 54_IT_ | 98_IT_ | DC | 0.0010 | 0.0427 | 700 |
| 27_FR | 28_BE | AC | 0.0022 | 0.0217 | 1300 | 55_IT_ | 68_GR_ | DC | 0.0007 | 0.0460 | 1000 |
| 28_BE | 29_LU | AC | 0.0003 | 0.0029 | 700 | 55_IT_ | 70_AL_ | DC | 0.0005 | 0.0333 | 1000 |
| 28_BE | 30_NL | AC | 0.0006 | 0.0065 | 3500 | 68_GR_ | 69_GR_ | DC | 0.0000 | 0.0256 | 11600 |
| 29_LU | 35_DE | AC | 0.0016 | 0.0157 | 2900 | 72_DK_ | 89_SE_ | DC | 0.0002 | 0.0168 | 1700 |
| 30_NL | 31_DE | AC | 0.0008 | 0.0081 | 1400 | 73_EE_ | 75_FI_ | DC | 0.0006 | 0.0403 | 1000 |
| 30_NL | 33_DE | AC | 0.0002 | 0.0022 | 7100 | 73_EE_ | 78_LV_ | DC | 0.0003 | 0.0204 | 950 |
| 31_DE | 32_DE | AC | 0.0002 | 0.0024 | 5400 | 74_FI_ | 75_FI_ | DC | 0.0002 | 0.0498 | 3500 |
| 31_DE | 33_DE | AC | 0.0000 | 0.0004 | 17330 | 74_FI_ | 85_NO_ | DC | 0.0100 | 0.0314 | 50 |
| 31_DE | 35_DE | AC | 0.0002 | 0.0023 | 6300 | 74_FI_ | 86_SE_ | DC | 0.0003 | 0.0283 | 1800 |
| 31_DE | 38_DK | AC | 0.0007 | 0.0068 | 3000 | 75_FI_ | 88_SE_ | DC | 0.0008 | 0.0689 | 1350 |
| 31_DE | 72_DK | AC | 0.0003 | 0.0029 | 0 | 77_LT_ | 78_LV_ | DC | 0.0002 | 0.0181 | 1500 |
| 32_DE | 34_DE | AC | 0.0001 | 0.0007 | 9300 | 77_LT_ | 88_SE_ | DC | 0.0016 | 0.0694 | 700 |
| 32_DE | 38_DK | AC | 0.0003 | 0.0029 | 0 | 79_NO_ | 80_NO_ | DC | 0.0002 | 0.0151 | 1500 |
| 32_DE | 44_PL | AC | 0.0007 | 0.0065 | 3400 | 79_NO_ | 81_NO_ | DC | 0.0002 | 0.0216 | 1700 |
| 32_DE | 89_SE | AC | 0.0003 | 0.0029 | 0 | 79_NO_ | 92_UK_ | DC | 0.0001 | 0.0899 | 0 |
| 33_DE | 35_DE | AC | 0.0000 | 0.0003 | 19050 | 79_NO_ | 93_UK_ | DC | 0.0008 | 0.0716 | 1400 |
| 34_DE | 35_DE | AC | 0.0007 | 0.0072 | 2600 | 80_NO_ | 81_NO_ | DC | 0.0002 | 0.0143 | 1500 |
| 34_DE | 37_DE | AC | 0.0001 | 0.0013 | 14840 | 80_NO_ | 82_NO_ | DC | 0.0001 | 0.0171 | 5300 |
| 34_DE | 39_CZ | AC | 0.0008 | 0.0078 | 1700 | 81_NO_ | 83_NO_ | DC | 0.0006 | 0.0283 | 800 |
| 34_DE | 44_PL | AC | 0.0020 | 0.0202 | 1700 | 81_NO_ | 90_UK_ | DC | 0.0001 | 0.1093 | 0 |
| 35_DE | 36_DE | AC | 0.0002 | 0.0021 | 7700 | 82_NO_ | 83_NO_ | DC | 0.0008 | 0.0189 | 400 |
| 35_DE | 37_DE | AC | 0.0002 | 0.0023 | 6130 | 82_NO_ | 88_SE_ | DC | 0.0002 | 0.0322 | 2148 |
| 36_DE | 37_DE | AC | 0.0002 | 0.0021 | 7500 | 83_NO_ | 84_NO_ | DC | 0.0039 | 0.0489 | 200 |
| 36_DE | 47_CH | AC | 0.0005 | 0.0045 | 6000 | 83_NO_ | 87_SE_ | DC | 0.0005 | 0.0314 | 1000 |
| 36_DE | 49_AT | AC | 0.0016 | 0.0161 | 2800 | 84_NO_ | 85_NO_ | DC | 0.0011 | 0.0498 | 700 |
| 37_DE | 39_CZ | AC | 0.0008 | 0.0076 | 2000 | 84_NO_ | 86_SE_ | DC | 0.0005 | 0.0232 | 700 |
| 37_DE | 49_AT | AC | 0.0007 | 0.0072 | 2500 | 84_NO_ | 87_SE_ | DC | 0.0023 | 0.0363 | 250 |
| 37_DE | 50_AT | AC | 0.0005 | 0.0049 | 5500 | 86_SE_ | 87_SE_ | DC | 0.0002 | 0.0408 | 4200 |
| 39_CZ | 40_CZ | AC | 0.0002 | 0.0021 | 7600 | 87_SE_ | 88_SE_ | DC | 0.0001 | 0.0500 | 7300 |
| 39_CZ | 44_PL | AC | 0.0003 | 0.0029 | 0 | 88_SE_ | 89_SE_ | DC | 0.0001 | 0.0307 | 6500 |
| 40_CZ | 43_PL | AC | 0.0008 | 0.0075 | 2100 | 90_UK_ | 91_UK_ | DC | 0.0000 | 0.0232 | 7600 |
| 40_CZ | 46_SK | AC | 0.0007 | 0.0071 | 2700 | 90_UK_ | 92_UK_ | DC | 0.0000 | 0.0196 | 8000 |
| 40_CZ | 51_AT | AC | 0.0008 | 0.0075 | 2100 | 91_UK_ | 92_UK_ | DC | 0.0001 | 0.0204 | 5000 |
| 41_PL | 42_PL | AC | 0.0006 | 0.0055 | 4700 | 92_UK_ | 93_UK_ | DC | 0.0000 | 0.0238 | 7900 |
| 41_PL | 43_PL | AC | 0.0001 | 0.0009 | 4900 | 92_UK_ | 96_IE_ | DC | 0.0012 | 0.0385 | 500 |
| 41_PL | 44_PL | AC | 0.0003 | 0.0026 | 3400 | 93_UK_ | 94_UK_ | DC | 0.0001 | 0.0272 | 4500 |
| 41_PL | 45_PL | AC | 0.0002 | 0.0025 | 4400 | 93_UK_ | 95_UK_ | DC | 0.0009 | 0.0287 | 500 |
| 42_PL | 43_PL | AC | 0.0006 | 0.0058 | 4300 | 95_UK_ | 96_IE_ | DC | 0.0003 | 0.0187 | 1100 |
| 42_PL | 46_SK | AC | 0.0009 | 0.0087 | 600 | 98_IT_ | 99_FR_ | DC | 0.0009 | 0.0230 | 400 |
| 43_PL | 44_PL | AC | 0.0003 | 0.0025 | 4000 | 06_ES_ | 15_FR_ | DC | 0.0003 | 0.0273 | 1400 |
References
- European Commission. 2030 Climate & Energy Framework. Available online: https://ec.europa.eu/clima/policies/strategies/2030_en#tab-0-0 (accessed on 20 August 2019).
- European Commission. Energy Roadmap 2050; European Commission: Brussels, Belgium, 2012. [Google Scholar]
- California Legislature. Senate Bill No. 100; Secretary of State: Sacramento, CA, USA, 2018. Available online: https://leginfo.legislature.ca.gov/faces/billNavClient.xhtml?bill_id=201720180SB100 (accessed on 17 March 2020).
- GWEC. Global Wind Report 2018; GWEC: Brussels, Belgium, 2019. [Google Scholar]
- ENTSO-E. Ten-Year Network Development Plan (TYNDP) 2018; ENTSO-E: Brussels, Belgium, 2018. [Google Scholar]
- Battaglini, A.; Komendantova, N.; Brtnik, P.; Patt, A. Perception of barriers for expansion of electricity grids in the European Union. Energy Policy 2012, 47, 254–259. [Google Scholar] [CrossRef]
- European Commission. Commission Staff Working Paper: Energy Infrastructure Investment Needs and Financing Requirements; European Commission: Brussels, Belgium, 2011. [Google Scholar]
- European Commission. Study on Regulatory Incentives for Investments in Electricity and Gas Infrastructure Projects; European Commission: Brussels, Belgium, 2014. [Google Scholar]
- Hogan, W.W. A primer on transmission benefits and cost allocation. Econ. Energy Environ. Policy 2018, 7, 25–46. [Google Scholar] [CrossRef]
- Hadush, S.Y.; De Jonghe, C.; Belmans, R. The effect of welfare distribution and cost allocation on offshore grid design. IEEE Trans. Sustain. Energy 2015, 6, 1050–1058. [Google Scholar] [CrossRef]
- Federal Energy Regulatory Commission (FERC). Order No. 1000; FERC: Washington, DC, USA, 2011. [Google Scholar]
- European Commission. European Commission Regulation (EU) No 347/2013 of the European Parliament and of the Council of 17 April 2013 on guidelines for trans-European energy infrastructure and repealing Decision No 1364/2006/EC and amending Regulations (EC) No 713/2009, (EC) No 714/2009 and (EC) No 715/2009; European Commission: Brussels, Belgium, 2013. [Google Scholar]
- Meeus, L.; He, X. Guidance for Project Promoters and Regulators for the Cross-Border Cost Allocation of Projects of Common Interest; Florence School of Regulation: Florence, Italy, 2014. [Google Scholar]
- Australian Energy Regulator. Regulatory Investment Test for Transmission; Australian Energy Regulator: Melbourne, Australia, 2010. [Google Scholar]
- ENTSO-E. ENTSO-E Guideline for Cost Benefit Analysis of Grid Development Projects: Final-Approved by the European Commission; ENTSO-E: Brussels, Belgium, 2015. [Google Scholar]
- Chang, J.W.; Pfeifenberger, J.P.; Hagerty, J.M. The Benefits of Electric Transmission: Identifying and Analyzing the Value of Investments; Brattle Group: Cambridge, MA, USA, 2013. [Google Scholar]
- von der Fehr, N.H.; Meeus, L.; Azevedo, I.; He, X.; Olmos, L.; Glachant, J.M. Cost Benefit Analysis in the Context of the Energy Infrastructure Package; European University Institute: Fiesole, Italy, 2013; ISBN 9789290841166. [Google Scholar]
- EEA. Air Quality in Europe—2013 Report; EEA: Copenhagen, Denmark, 2013; ISBN 9789292134068. [Google Scholar]
- Mauzerall, D.; Sultan, B.; KIM, N.; Bradford, D. NOx emissions from large point sources: Variability in ozone production, resulting health damages and economic costs. Atmos. Environ. 2005, 39, 2851–2866. [Google Scholar] [CrossRef]
- California ISO (CAISO). Board Report: Economic Evaluation of the Palo Verde-Devers Line No. 2 (PVD2); CAISO: Folsom, CA, USA, 2005. [Google Scholar]
- Sun, D. Marginal Contribution of Renewable Energy Sources to the Reduction of Emissions and Security of Supply; Universidad Pontificia Comillas de Madrid: Madrid, Spain, 2016. [Google Scholar]
- Novan, K. Valuing the wind: Renewable energy policies and air pollution avoided. Am. Econ. J. Econ. Policy 2015, 7, 291–326. [Google Scholar] [CrossRef] [Green Version]
- Callaway, D.; Fowlie, M.; Mccormick, G. Location, Location, Location: The Variable Value of Renewable Energy and Demand-Side Efficiency Resources; Energy Institute at Haas: Berkeley, CA, USA, 2015. [Google Scholar]
- Sheffrin, A.; Awad, M.; Broad, S.; Chen, J.; Geevarghese, A.; Miller, J.; Toolson, E.; Zhang, M. Transmission Economic Assessment Methodology (TEAM); California ISO: Folsom, CA, USA, 2004. [Google Scholar]
- California ISO (CAISO). Transmission Economic Assessment Methodology (TEAM); CAISO: Folsom, CA, USA, 2017. [Google Scholar]
- Awad, M.; Casey, K.E.; Geevarghese, A.S.; Miller, J.C.; Rahimi, A.F.; Sheffrin, A.Y.; Zhang, M.; Toolson, E.; Drayton, G.; Hobbs, B.F.; et al. Economic Assessment of Transmission Upgrades: Application of the California ISO Approach. In Restructured Electric Power Systems: Analysis of Electricity Markets with Equilibrium Models; Wiley: Hoboken, NJ, USA, 2010; Chapter 7; pp. 241–270. [Google Scholar]
- NYISO. 2015 Congestion Assessment and Resource Integration Study: CARIS–Phase 1; NYISO: New York, NY, USA, 2015. [Google Scholar]
- Migliavacca, G.; Rossi, S.; Careri, F.; Sijm, J.; Olmos, L.; Ramos, A.; Rivier, M.; Van Hertem, D.; Huang, D. e-HIGHWAY 2050 D6.1: A Comprehensive Long Term Benefit Cost Assessment for Analyzing Pan-European Transmission Highways Deployment; e-HIGHWAY 2050: Brussels, Belgium, 2014. [Google Scholar]
- Careri, F.; Viscardi, V.; Migliavacca, G.; Nieuwenhout, F.; Sijm, J.; Olmos, L.; Ramos, A.; Rivier, M.; La Torre, J.; RSESR. e-HIGHWAY 2050 D6.3: Modular Development Plan of the Pan-European Transmission System 2050: Modular Plan over 2030–2050 for the European Transmission System: A Complete Analysis of Costs and Benefits; e-HIGHWAY 2050: Brussels, Belgium, 2015. [Google Scholar]
- Olmos, L.; Ramos, A.; Rivier, M.; Torre, J. La e-HIGHWAY 2050 D6.2: A Toolbox Supporting a Pan-European Technical Evaluation of Costs and Benefits; e-HIGHWAY 2050: Brussels, Belgium, 2015. [Google Scholar]
- L’abbate, A.; Losa, I.; Migliavacca, G.; Ciupuliga, A.R.; Gibescu, M.; Auer, H.; Zach, K. REALISEGRID D3.3.1: Possible Criteria to Assess Technical-Economic and Strategic Benefits of Specific Transmission Projects; REALISEGRID: Brussels, Belgium, 2010. [Google Scholar]
- Losa, I.; Calisti, R.; L’abbate, A.; Migliavacca, G.; Vergine, C.; Sallati, A. REALISEGRID D3.5.1: Application of the REALISEGRID Framework to Assess Technical-Economic and Strategic Benefits of Specific Transmission Projects; REALISEGRID: Brussels, Belgium, 2011. [Google Scholar]
- Nguyen, K. Internalizing externalities into capacity expansion planning: The case of electricity in Vietnam. Energy 2008, 33, 740–746. [Google Scholar] [CrossRef]
- Rodgers, M.D.; Coit, D.W.; Felder, F.A.; Carlton, A. Generation expansion planning considering health and societal damages—A simulation-based optimization approach. Energy 2018, 164, 951–963. [Google Scholar] [CrossRef]
- Livieratos, S.; Vogiatzaki, V.-E.; Cottis, P. A generic framework for the evaluation of the benefits expected from the smart grid. Energies 2013, 6, 988–1008. [Google Scholar] [CrossRef] [Green Version]
- Li, F.; Xiao, X.; Xie, W.; Ma, D.; Song, Z.; Liu, K. Estimating air pollution transfer by interprovincial electricity transmissions: The case study of the Yangtze River Delta Region of China. J. Clean. Prod. 2018, 183, 56–66. [Google Scholar] [CrossRef]
- Rabl, A.; Spadaro, J.V.; Holland, M. How Much Is Clean Air Worth? Calculating the Benefits of Pollution Control; Cambridge University Press: Cambridge, UK, 2014; ISBN 9781107043138. [Google Scholar]
- Schleisner, L. Comparison of methodologies for externality assessment. Energy Policy 2000, 28, 1127–1136. [Google Scholar] [CrossRef]
- Friedrich, R.; Bickel, P. The impact pathway methodology. In Environmental External Costs of Transport; Springer: Berlin/Heidelberg, Germany, 2001; pp. 5–10. [Google Scholar]
- Czarnowska, L.; Frangopoulos, C.A. Dispersion of pollutants, environmental externalities due to a pulverized coal power plant and their effect on the cost of electricity. Energy 2012, 41, 212–219. [Google Scholar] [CrossRef]
- Dimitrijevic, Z.; Salihbegovic, I. Sustainability assessment of increasing renewable energy sources penetration—JP Elektroprivreda B & H case study. Energy 2012, 47, 205–212. [Google Scholar] [CrossRef]
- Rabl, A.; Spadaro, J.V. External costs of energy: How much is clean energy worth? J. Sol. Energy Eng. 2016, 138, 040801. [Google Scholar] [CrossRef]
- Thopil, G.A.; Pouris, A. Aggregation and internalisation of electricity externalities in South Africa. Energy 2015, 82, 501–511. [Google Scholar] [CrossRef] [Green Version]
- Jorli, M.; Van Passel, S.; Sadeghi Saghdel, H. External costs from fossil electricity generation: A review of the applied impact pathway approach. Energy Environ. 2018, 29, 635–648. [Google Scholar] [CrossRef] [Green Version]
- European Commission. ExternE Externalities of Energy, Vol 10 National Implementation; European Commission: Brussels, Belgium, 1999. [Google Scholar]
- European Commission. Project of Common Interest: The Bay of Biscay Interconnector; European Commission: Brussels, Belgium, 2017. [Google Scholar]
- ENTSO-E. Project 16—Biscay Gulf; ENTSO-E: Brussels, Belgium, 2016. [Google Scholar]
- e-Highway Project; ENTSO-E e-Highway Database Per Country. Available online: http://www.e-highway2050.eu/results/ (accessed on 1 February 2018).
- ENTSO-E. Ten-Year Network Development Plan (TYNDP) 2016; ENTSO-E: Brussels, Belgium, 2016. [Google Scholar]
- ENTSO-E. TYNDP 2016 Market Modeling Data. Available online: https://tyndp.entsoe.eu/maps-data/ (accessed on 1 December 2016).
- Purvins, A.; Sereno, L.; Ardelean, M.; Covrig, C.-F.; Efthimiadis, T.; Minnebo, P. Submarine power cable between Europe and North America: A techno-economic analysis. J. Clean. Prod. 2018, 186, 131–145. [Google Scholar] [CrossRef]
- Gronau, M.; Dusch, A.; Strunz, K. e-Highway 2050 D4.3: Data Sets of Scenarios and Intermediate Grid Architectures for 2040; e-HIGHWAY 2050: Brussels, Belgium, 2015. [Google Scholar]
- Anderski, T.; Surmann, Y.; Stemmer, S.; Grisey, N.; Momot, E.; Leger, A.-C.; Betraoui, B.; Van Roy, P. e-Highway 2050: European Cluster Model of the Pan-European Transmission Grid; e-HIGHWAY 2050: Brussels, Belgium, 2015. [Google Scholar]
- Held, A.; Ragwitz, M.; Sensfuß, F.; Resch, G.; Olmos, L.; Ramos, A.; Rivier, M. How can the renewables targets be reached cost-effectively? Policy options for the development of renewables and the transmission grid. Energy Policy 2018, 116, 112–126. [Google Scholar] [CrossRef]
- Ramos, A. TEPES. Available online: https://www.iit.comillas.edu/aramos/TEPES.htm (accessed on 1 April 2018).
- Lumbreras, S.; Ramos, A.; Olmos, L.; Ploussard, Q.; Sensfuß, F.; Deac, G.; Bernath, C. SET-Nav: D6.4-Centralized vs. Decentralized Development of the Electricity Sector; SET-Nav: Brussels, Belgium, 2018. [Google Scholar]
- ENTSO-E. Methodology: Generation Adequacy Benefit Monetization; ENTSO-E: Brussels, Belgium, 2018. [Google Scholar]
- Institut für Energiewirtschaft und Rationelle Energieanwendung (IER)-Universität Stuttgart. Unit Cost Factors for Health Impacts based on the Integrated Assessment Model EcoSenseWeb2. Available online: http://ecosenseweb.ier.uni-stuttgart.de/ (accessed on 1 July 2018).
- ENTSO-E. TYNDP 2016 Scenario Development Report; ENTSO-E: Brussels, Belgium, 2016. [Google Scholar]
- Vafeas, A.; Pagano, T.; Peirano, E. e-HIGHWAY 2050 D3.1: Technology Assessment from 2030 to 2050; e-HIGHWAY 2050: Brussels, Belgium, 2014. [Google Scholar]
- ENTSO-E. TYNDP 2018 Input Data. Available online: https://tyndp.entsoe.eu/maps-data/ (accessed on 1 August 2018).
- European Environment Agency. EMEP/EEA Air Pollutant Emission Inventory Guidebook 2016—Emission Factors; European Environment Agency: Copenhagen, Denmark, 2016. [Google Scholar]
- EIPPCB. IPPC BAT Reference Document for Large Combustion Plant; EIPPCB: Seville, Spain, 2006. [Google Scholar]
- Meeus, L.; Keyaerts, N. First Series of Cross-Border Cost Allocation Decisions for Projects of Common Interest: Main Lessons Learned; Florence School of Regulation: Florence, Italy, 2015. [Google Scholar] [CrossRef]
- Gorenstein Dedecca, J.; Lumbreras, S.; Ramos, A.; Hakvoort, R.A.; Herder, P.M. Expansion planning of the North Sea offshore grid: Simulation of integrated governance constraints. Energy Econ. 2018, 72, 376–392. [Google Scholar] [CrossRef]
Figure 1.
Steps of the assessment of the benefits of a transmission project.

Figure 2.
Impact Pathway Approach (Adapted from [45]).
Figure 2.
Impact Pathway Approach (Adapted from [45]).

Figure 3.
Reduced European Electricity Grid in 2030 (Data from [53]).
Figure 3.
Reduced European Electricity Grid in 2030 (Data from [53]).

Table 1.
Generation share by technology for Vision 1 and Vision 3 in 2030, for selected countries (Data from [59]).
Table 1.
Generation share by technology for Vision 1 and Vision 3 in 2030, for selected countries (Data from [59]).
| Technology | Oil | Gas | Hard coal | Lignite | Biomass | Others non-RES | Nuclear | Hydro | Solar | Wind | |
|---|---|---|---|---|---|---|---|---|---|---|---|
| Country | Scenario | Capacity (GW) | |||||||||
| BE | Vision 1 | 0.0 | 7.4 | 0.0 | 0.0 | 1.7 | 3.2 | 0.0 | 1.4 | 4.1 | 4.9 |
| Vision 3 | 0.0 | 6.8 | 0.0 | 0.0 | 2.5 | 3.2 | 0.0 | 2.7 | 5.8 | 8.5 | |
| DE | Vision 1 | 1.0 | 21.1 | 23.4 | 12.6 | 7.0 | 8.7 | 0.0 | 13.3 | 57.2 | 74.1 |
| Vision 3 | 0.9 | 34.4 | 14.9 | 10.2 | 9.3 | 10.6 | 0.0 | 17.6 | 60.7 | 100.8 | |
| DK | Vision 1 | 0.7 | 2.6 | 0.4 | 0.0 | 1.7 | 0.0 | 0.0 | 0.0 | 0.8 | 6.2 |
| Vision 3 | 0.7 | 3.8 | 0.4 | 0.0 | 1.7 | 0.0 | 0.0 | 0.0 | 2.0 | 10.8 | |
| ES | Vision 1 | 0.0 | 25.0 | 5.9 | 0.0 | 2.4 | 10.5 | 7.1 | 23.5 | 16.8 | 35.8 |
| Vision 3 | 0.0 | 29.2 | 4.2 | 0.0 | 5.1 | 12.2 | 7.1 | 25.1 | 25.0 | 39.3 | |
| FR | Vision 1 | 0.8 | 6.1 | 1.7 | 0.0 | 1.4 | 5.4 | 57.6 | 25.2 | 12.3 | 21.7 |
| Vision 3 | 0.8 | 14.1 | 1.7 | 0.0 | 4.8 | 5.4 | 37.7 | 27.2 | 24.1 | 36.6 | |
| IT | Vision 1 | 1.4 | 39.0 | 7.9 | 0.0 | 7.2 | 10.2 | 0.0 | 22.6 | 24.6 | 13.4 |
| Vision 3 | 1.4 | 38.0 | 7.1 | 0.0 | 10.8 | 10.2 | 0.0 | 23.5 | 40.4 | 19.0 | |
| NL | Vision 1 | 0.0 | 8.8 | 4.6 | 0.0 | 0.3 | 5.1 | 0.5 | 0.0 | 4.0 | 7.0 |
| Vision 3 | 0.0 | 9.4 | 0.0 | 0.0 | 5.1 | 5.1 | 0.5 | 0.0 | 15.4 | 12.7 | |
| NO | Vision 1 | 0.0 | 0.5 | 0.0 | 0.0 | 0.0 | 0.0 | 0.0 | 38.9 | 0.0 | 2.1 |
| Vision 3 | 0.0 | 0.9 | 0.0 | 0.0 | 0.0 | 0.0 | 0.0 | 40.8 | 0.0 | 2.9 | |
| PL | Vision 1 | 0.0 | 2.8 | 5.5 | 7.0 | 7.1 | 7.6 | 3.0 | 2.4 | 1.5 | 8.9 |
| Vision 3 | 0.0 | 1.9 | 5.4 | 6.6 | 6.5 | 9.9 | 0.0 | 3.2 | 4.0 | 11.0 | |
| PT | Vision 1 | 0.0 | 4.2 | 0.0 | 0.0 | 0.7 | 1.3 | 0.0 | 7.9 | 0.7 | 5.3 |
| Vision 3 | 0.0 | 3.7 | 0.0 | 0.0 | 0.9 | 1.6 | 0.0 | 9.7 | 0.9 | 6.4 | |
| UK | Vision 1 | 0.3 | 45.0 | 2.9 | 0.0 | 5.6 | 4.1 | 4.6 | 4.8 | 8.5 | 23.3 |
| Vision 3 | 0.2 | 38.2 | 0.0 | 0.0 | 8.7 | 4.3 | 9.0 | 7.7 | 15.9 | 52.8 | |
Table 2.
Components of variable electricity production costs per technology and scenario in 2030.
| Vision 1 | Vision 3 | |||||||
|---|---|---|---|---|---|---|---|---|
| Technology | Fuel Cost (€/MWh) | CO2 Cost (€/MWh) | NOx Damage Cost (€/MWh) | SO2 Damage Cost (€/MWh) | Fuel Cost (€/MWh) | CO2 Cost (€/MWh) | NOx Damage Cost (€/MWh) | SO2 Damage Cost (€/MWh) |
| Biomass | 20.0 | 0.0 | 5.4 | 9.4 | 20.0 | 0.0 | 5.4 | 9.4 |
| Gas | 62.6 | 6.2 | 1.9 | 0.0 | 47.7 | 25.7 | 1.9 | 0.0 |
| Hardcoal | 25.3 | 12.9 | 1.3 | 39.0 | 23.6 | 53.7 | 1.3 | 39.0 |
| Lignite | 9.5 | 14.3 | 5.5 | 56.3 | 9.5 | 59.6 | 5.5 | 56.3 |
| Nuclear | 4.7 | 0.0 | 0.0 | 0.0 | 4.7 | 0.0 | 0.0 | 0.0 |
| Oil | 121.5 | 11.8 | 5.0 | 27.8 | 87.6 | 49.1 | 5.0 | 27.8 |
Notes: 1. Only averages of NOx and SO2 damage cost are indicated here. Per country values are used in the computations. 2. The fuel and CO2 prices considered for each scenario are derived from [59].
Table 3.
Electrical efficiencies, carbon content, and emission factors of NOx and SO2 by technologies.
Table 3.
Electrical efficiencies, carbon content, and emission factors of NOx and SO2 by technologies.
| Type | Biomass | Gas | Hardcoal | Lignite | Nuclear | Oil |
|---|---|---|---|---|---|---|
| El. Efficiency (%) | 33 | 55 | 43 | 42 | 35 | 41 |
| CO2 content (kg/Net GJ) | 0 | 55 | 90 | 97 | 0 | 78 |
| NOx Emission Factor (t/PJ) | 57 | 33 | 18 | 73 | 0 | 64 |
| SO2 Emission Factor (t/PJ) | 42 | 0 | 228 | 319 | 0 | 131 |
Table 4.
Change in system-wide benefits of the project (EMS, LPD, and TB) for Vision 1 and Vision 3 in 2030.
Table 4.
Change in system-wide benefits of the project (EMS, LPD, and TB) for Vision 1 and Vision 3 in 2030.
| Benefits | Vision 1 | Vision 3 |
|---|---|---|
| Avoided Local Pollution Damage | 44 M€ | 20 M€ |
| Change in Total Electricity Market Surplus | 122 M€ | 104 M€ |
| Change in Total Benefits | 166 M€ | 124 M€ |
Notes: The cost of non-served energy does not change due to the implementation of the new project.
Table 5.
Breakdown of the system-wide benefits of the project for Vision 1 and Vision 3 in 2030.
| Benefits | Breakdown | Vision 1 | Vision 3 |
|---|---|---|---|
| Avoided Local Pollution Damage | Avoided NOx Damage | 17 M€ | 3 M€ |
| Avoided SO2 Damage | 27 M€ | 17 M€ | |
| Avoided Generation Cost | Avoided CO2 Cost | 26 M€ | 38 M€ |
| Avoided Fuel Cost | 96 M€ | 66 M€ |
Table 6.
The breakdown of the ALPD and the change in EMS to their components for the selected countries for Vision 1 and Vision 3 in 2030.
Table 6.
The breakdown of the ALPD and the change in EMS to their components for the selected countries for Vision 1 and Vision 3 in 2030.
| Vision 1 | Vision 3 | |||||||||
|---|---|---|---|---|---|---|---|---|---|---|
| Country | Change in Consumer Surplus | Change in Producer Surplus | Change in Congestion Rents | Avoided NOx Damage | Avoided SO2 Damage | Change in Consumer Surplus | Change in Producer Surplus | Change in Congestion Rents | Avoided NOx Damage | Avoided SO2 Damage |
| BE | 10 | −2 | −12 | 0 | −2 | −74 | 44 | −7 | 0 | 0 |
| DE | −63 | 29 | 11 | 0 | −25 | −29 | 5 | −11 | 0 | 18 |
| ES | 828 | −430 | −30 | 15 | 63 | 521 | −275 | −35 | 5 | 5 |
| FR | −208 | 118 | −103 | 0 | −1 | −253 | 345 | −7 | 1 | 1 |
| IT | −11 | 2 | −3 | 2 | −4 | −83 | 21 | −6 | 0 | −3 |
| PL | −20 | 18 | 1 | 0 | −2 | −5 | 6 | −2 | 0 | 3 |
| PT | 91 | −26 | −1 | 1 | 9 | 15 | 3 | 9 | 0 | 1 |
Table 7.
The breakdown of the ALPD, and the change in EMS and TB, for selected countries for Vision 1 in 2030.
Table 7.
The breakdown of the ALPD, and the change in EMS and TB, for selected countries for Vision 1 in 2030.
| Change in Electricity Market Surplus | Avoided Local Pollution Damage | Change in Total Benefits | ||||
|---|---|---|---|---|---|---|
| Country | % | M€ | % | M€ | % | M€ |
| BE | −1 | −5 | −4 | −2 | −2 | −7 |
| DE | −7 | −23 | −53 | −25 | −13 | −48 |
| ES | 83 | 368 | 86 | 78 | 85 | 446 |
| FR | −60 | −193 | −2 | −1 | −54 | −194 |
| IT | −4 | −12 | −6 | −3 | −4 | −15 |
| PL | −1 | −2 | −5 | −2 | −1 | −4 |
| PT | 15 | 65 | 10 | 9 | 14 | 74 |
Table 8.
The breakdown of the ALPD, and the change in EMS and TB, for selected countries for Vision 3 in 2030.
Table 8.
The breakdown of the ALPD, and the change in EMS and TB, for selected countries for Vision 3 in 2030.
| Change in Electricity Market Surplus | Avoided Local Pollution Damage | Change in Total Benefits | ||||
|---|---|---|---|---|---|---|
| Country | % | M€ | % | M€ | % | M€ |
| BE | −16 | −36 | −3 | −1 | −17 | −37 |
| DE | −15 | −35 | 49 | 18 | −8 | −17 |
| ES | 64 | 212 | 28 | 10 | 64 | 222 |
| FR | 26 | 85 | 6 | 2 | 25 | 87 |
| IT | −30 | −68 | −16 | −3 | −32 | −71 |
| PL | −0 | −1 | 7 | 3 | 1 | 2 |
| PT | 8 | 26 | 4 | 2 | 8 | 28 |
© 2020 by the authors. Licensee MDPI, Basel, Switzerland. This article is an open access article distributed under the terms and conditions of the Creative Commons Attribution (CC BY) license (http://creativecommons.org/licenses/by/4.0/).
Share and Cite
MDPI and ACS Style
Sun, D.; Olmos, L.; Rivier, M. Considering Local Air Pollution in the Benefit Assessment and Cost Allocation of Cross Border Transmission Projects. Energies 2020, 13, 1426. https://doi.org/10.3390/en13061426
AMA Style
Sun D, Olmos L, Rivier M. Considering Local Air Pollution in the Benefit Assessment and Cost Allocation of Cross Border Transmission Projects. Energies. 2020; 13(6):1426. https://doi.org/10.3390/en13061426
Chicago/Turabian StyleSun, Deniz, Luis Olmos, and Michel Rivier. 2020. "Considering Local Air Pollution in the Benefit Assessment and Cost Allocation of Cross Border Transmission Projects" Energies 13, no. 6: 1426. https://doi.org/10.3390/en13061426
Note that from the first issue of 2016, this journal uses article numbers instead of page numbers. See further details here.