Improvements in CO2 Booster Architectures with Different Economizer Arrangements


Dep. of Mechanical Engineering and Construction, Jaume I University, Campus de Riu Sec s/n, E-12071, Castellón, Spain
*
Author to whom correspondence should be addressed.
Energies 2020, 13(5), 1271; https://doi.org/10.3390/en13051271
Submission received: 6 February 2020
/
Revised: 3 March 2020
/
Accepted: 4 March 2020
/
Published: 9 March 2020
(This article belongs to the Special Issue Improvements on CO2 Vapour Compression Cycles)
Abstract
:CO2 transcritical booster architectures are widely analyzed to be applied in centralized commercial refrigeration plants in consonance with the irrevocable phase-out of HFCs. Most of these analyses show the limitations of CO2 cycles in terms of energy efficiency, especially in warm countries. From the literature, several improvements have been proposed to raise the booster efficiency in high ambient temperatures. The use of economizers is an interesting technique to reduce the temperature after the gas cooler and to improve the energy efficiency of transcritical CO2 cycles. The economizer cools down the high pressure’s line of CO2 by evaporating the same refrigerant extracted from another point of the facility. Depending on the extraction point, some configurations are possible. In this work, different booster architectures with economizers have been analyzed and compared. From the results, the combination of the economizer with the additional compressor allows obtaining energy savings of up to 8.5% in warm countries and up to 4% in cold countries with regard to the flash-by-pass arrangement and reduce the volumetric displacement required of the MT compressors by up to 37%.
1. Introduction
The adoption of the F-Gas regulation in 2015 [1] has struck the commercial refrigeration sector harshly, where new limits for the refrigerants used until nowadays were adopted. Accordingly, in centralized refrigeration systems with cooling capacity higher than 40 kW and direct expansion arrangement, the F-Gas demands the use of substances with a GWP100 lower than 150. Since the vast majority of anthropogenic refrigerants with low-GWP are middle-flammable [2], the CO2 is a durable solution to ensure safety conditions, especially in the sales area.
CO2 as refrigerant is used in both transcritical and subcritical conditions depending on the heat rejection conditions. Hence, it can be used as the main refrigerant in transcritical/subcritical refrigerating plants [3], as secondary fluid in CO2 pumped systems [4], or as an additional refrigerant in cascade refrigerating facilities [5,6]. At present, one of the most representative arrangements using this fluid is the booster systems, which have been extended in commercial refrigeration thanks to the complete solution that they provide, covering the services of low and medium temperature [7,8,9]. At first, this architecture was used mainly in the northern countries of Europe where the ambient temperatures allow working in subcritical conditions most of the time. Later, with the entry into force of the F-Gas, transcritical CO2 booster systems were adopted in the Southern European countries in order to achieve a long-term solution by avoiding the use of fluorinated refrigerants. However, there are important energy differences between the traditional refrigeration systems and the simplest CO2 booster systems [10], which demand the use of new technologies [11] and improvements to enhance their efficiency [12,13]. These technologies range from the most basic improvements such as the use of a desuperheater [14] to the main advanced systems for CO2 boosters. Among the advanced improvements, there are the parallel compression [15,16], the dedicated [17] or integrated mechanical subcooling [18], the ejector technology [19] such as the multi-ejector arrangements [20], combinations of these systems [21], flooded evaporators [22], liquid ejectors [23], and the “all-in-one” systems that integrate the A/C and the tap water heating in the same refrigerating plant [24,25,26,27]. In addition, there are other improvements applied to the heat rejection zone for high ambient temperatures, such as adiabatic gas coolers [17] or desiccant wheels [28], which are able to increase the efficiency of all facilities, reducing the temperature by increasing the humidity in the heat rejection medium. Some of these technologies are based on the addition an extra heat exchanger named the economizer heat exchanger or subcooler at the exit of the gas cooler. The main function of this element is to reduce the temperature at the exit of the gas cooler just before entering the expansion device, minimizing the vapor quality at the inlet of the evaporators and consequently increasing the cooling capacity of the refrigerating plant [29]. Additionally, these systems allow reducing the optimum heat rejection pressure of the system. Depending on the arrangement used to cool the CO2 through the subcooler, subcooling control can be performed in several ways. This improvement to CO2 booster architecture is analyzed in detail in this work as well as the use of an additional economizer compression stage with the economizer heat exchanger (integrated mechanical subcooling), which have received little attention on CO2 booster architectures.
According to the literature, the system with integrated subcooling in booster systems has only been evaluated by Catalan-Gil et al. [18], who performed an energy analysis with respect to the system with dedicated subcooling and parallel compression. However, this system provides high improvements to the basic booster with low-complexity changes in the basic architecture.
Therefore, this work analyzes these improvement systems, evaluating different specific parameters not previously analyzed in CO2 booster systems, aiming to maximize efficiency by modifying certain parameters, such as those experimentally analyzed by Nebot-Andrés [30] in a single-stage CO2 refrigeration plant.
In this work, a detailed thermodynamic analysis is presented for several arrangements of an economizer installed in a CO2 booster system for a typical European supermarket ( = 41 kW at −32 °C = 140 kW at −6 °C). In order to be close to reality, an accurate parametric compressor model (error less than 0.2% regarding compressors’ manufacturing data) has been adopted to take into account the effect of the rotation speed over the efficiencies of the compressors, which has not been considered in booster architectures to the best of the authors’ knowledge.
For each arrangement, a wide range of heat rejection temperatures from 0 to 40 °C have been used to determine the optimal operating conditions of the refrigerating plant, including the optimal heat rejection pressure, the optimum subcooling, the required compressor displacement, and its optimal rotation speed. In addition, some relevant parameters that have not been analyzed in other works with booster architectures are studied in detail as well as the importance of controlling the heat rejection pressure and the suction pressure of the additional compressors (EC), as well as the level of subcooling applied. The combined effect of all parameters is reflected in an annual energy consumption study obtained for different European cities and additionally for 282 locations distributed throughout Europe, aiming to clarify the most suitable regions for each system.
2. Booster Architectures
This section is devoted to presenting the main architectures analyzed in this manuscript. All of them are designed to cover two specific cooling demands: 140 kW at medium temperature conditions (approximately −6 °C) and 41 kW at a low-temperature regime (approximately −32 °C). These values are selected according to the field data gathered by Sawalha et al. [31,32] in several supermarkets which revealed a typical load ratio (LR) between medium and low-temperature loads from 3:1 to 3.5:1. The rest of the parameters considered at each architecture as well as the particular operating limitations for each component are described in Section 3 (Model assumptions).
2.1. Basic Booster (BB)
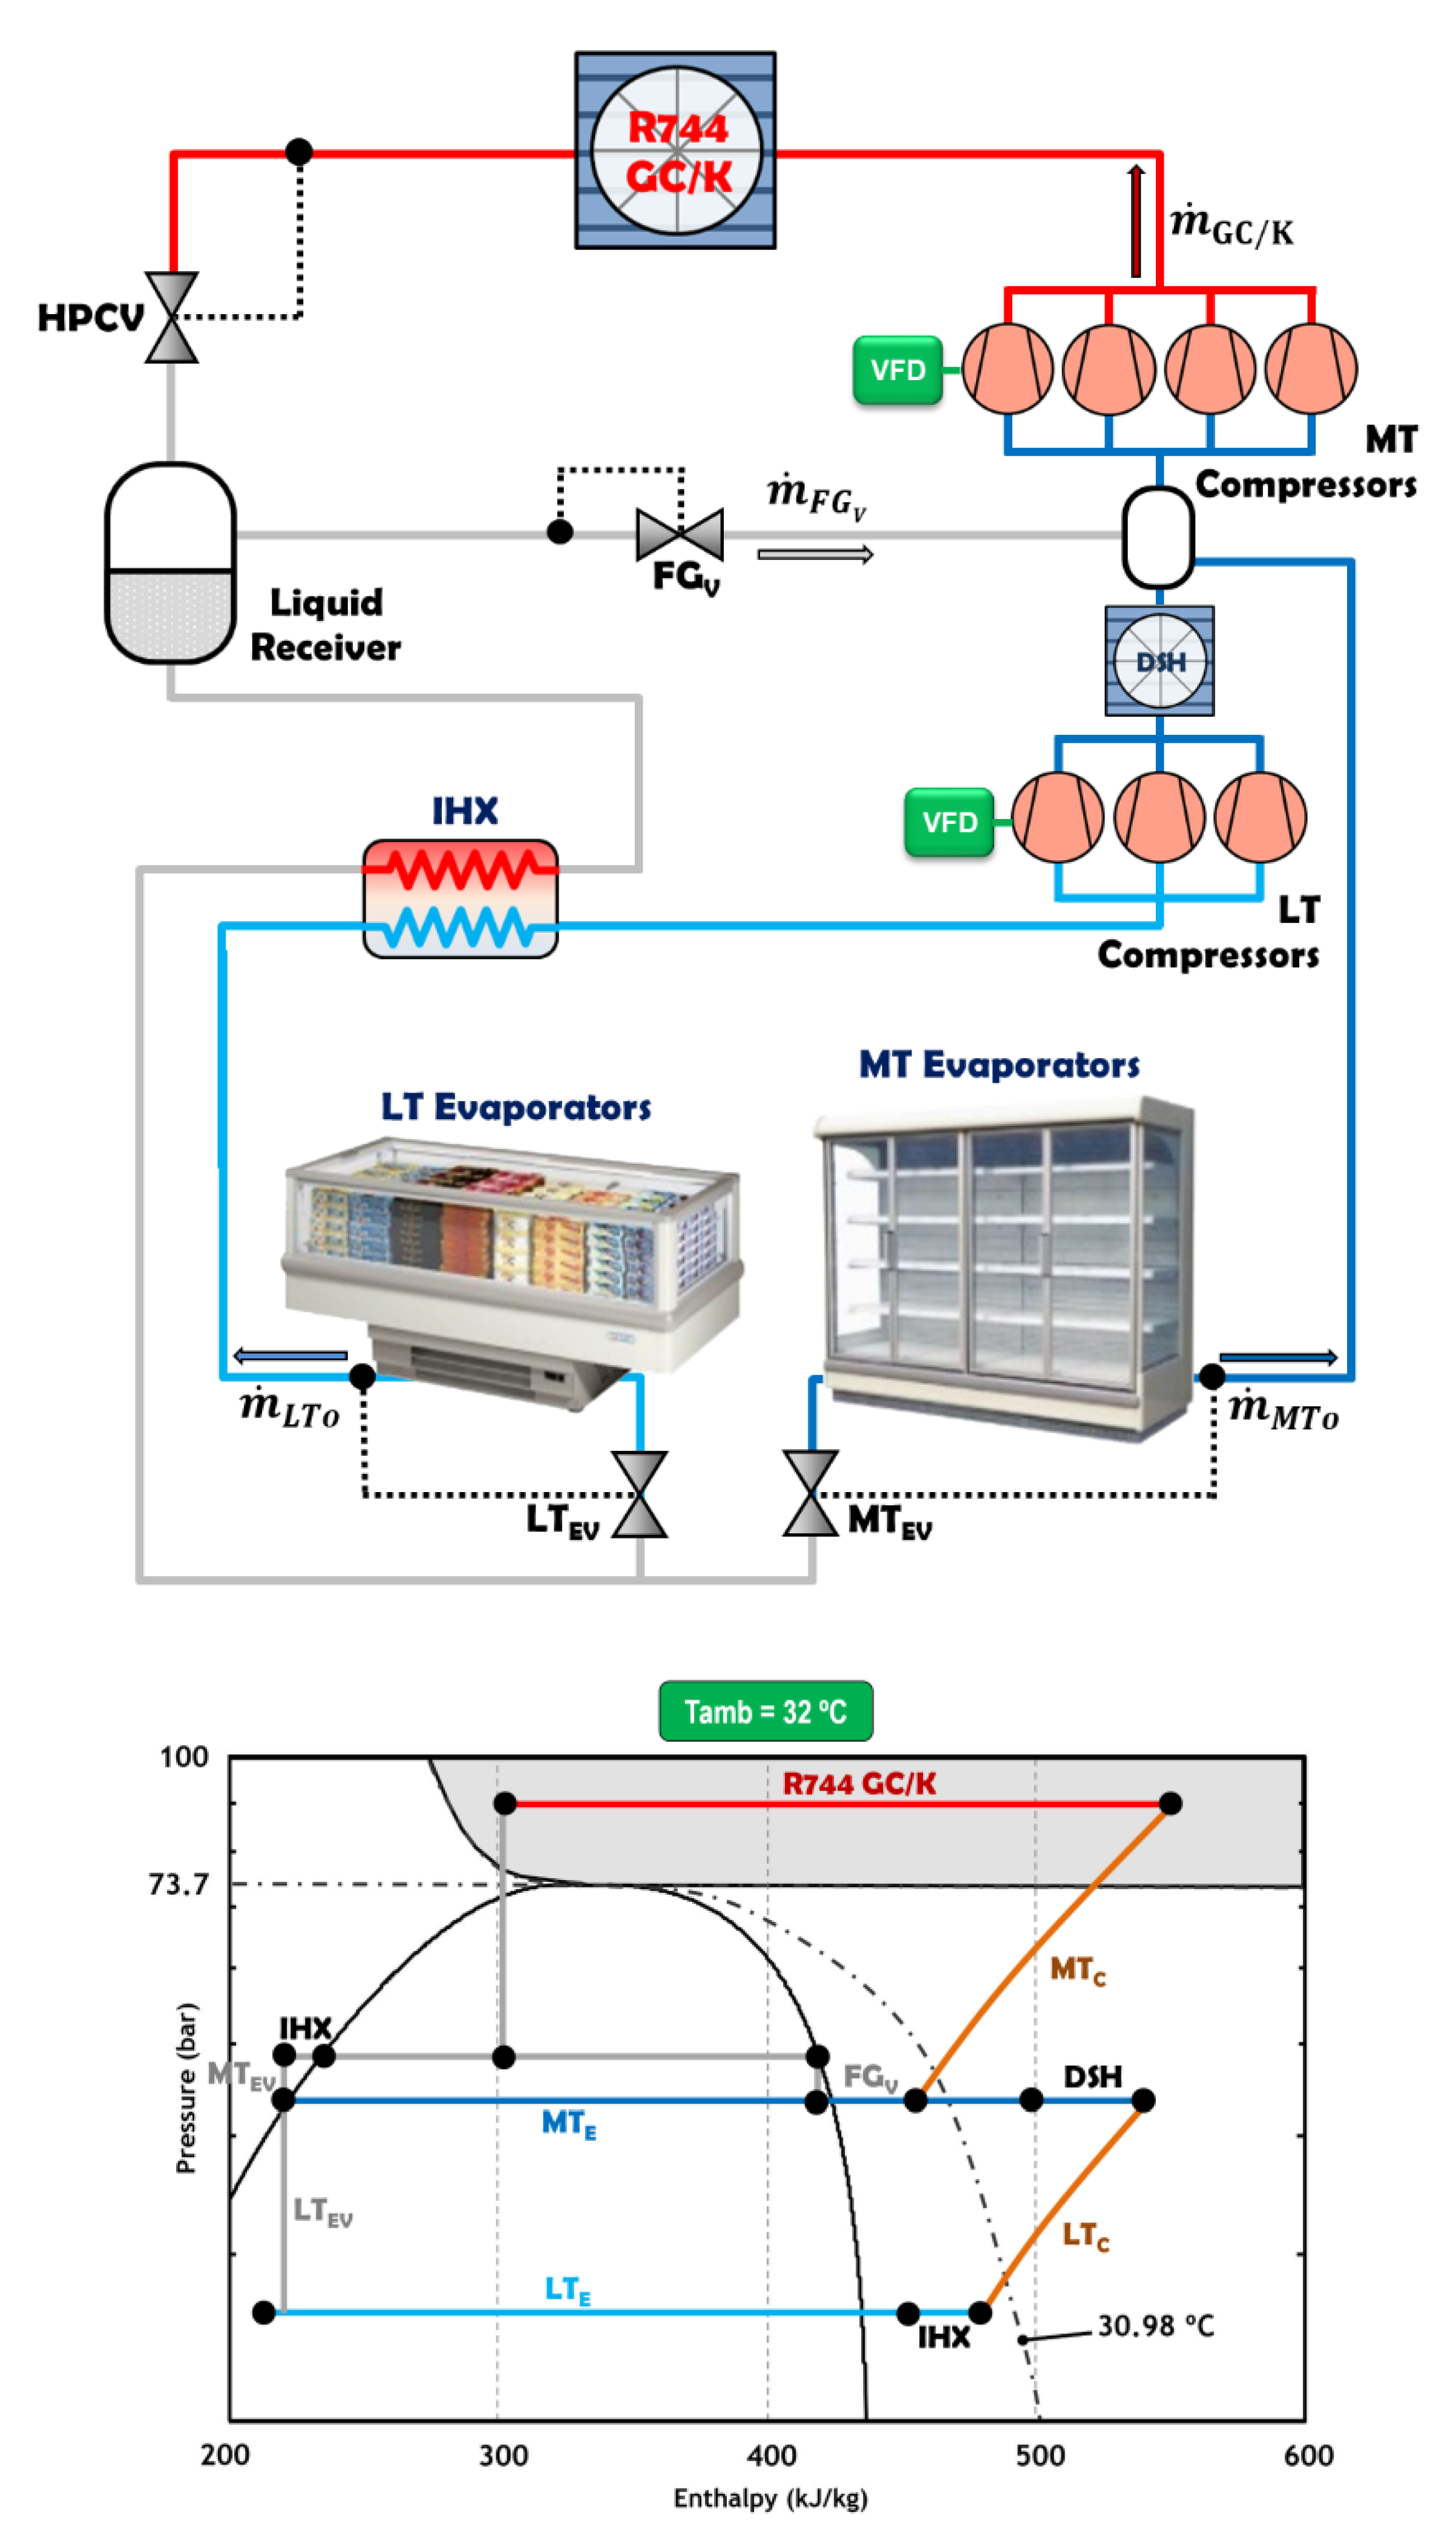
To determine the degree of improvement reached using the economizer, a typical CO2 booster arrangement (BB) has been taken as a reference (Figure 1). This base cycle is composed by a rack of compressors at the low-temperature side (LTC), a desuperheater (DSH) installed at the exit of these compressors, a rack of compressors at the high-temperature side (MTC), a flash-gas valve (FGv), and an internal heat exchanger (IHX) placed at the exit of the liquid receiver.
The use of the DSH allows reducing the temperature at the inlet of the MT compressors improving their operation and lowering their discharge temperature. In this case, a cross-flow heat exchanger has been used employing ambient air as secondary fluid.
The discharge from the second compressor rack is connected to an air-cross-flow heat exchanger (GC/K), which can operate in a transcritical or subcritical regime depending on the ambient temperature. The heat rejection pressure also depends on the ambient temperature, and it is controlled by a high-pressure control valve (HPCV) that ensures optimal operating conditions [33]. A liquid receiver installed after the HPCV regulates the refrigerant mass distribution as well as feeds the LTEV and MTEV with liquid phase. The use of a flash-gas valve (FGV) extracts vapor from the liquid receiver, reducing the pressure of the accumulator tank and, consequently, the enthalpy at the inlet of both expansion valves (LTEV and MTEV). The vapor extracted is expanded and injected at the inlet of the MT compressors, which reduces their suction and discharge temperature.
Finally, an IHX is installed at the outlet of the liquid receiver to ensure the liquid phase at the inlet of thermostatic valves (LTEV and MTEV) and to heat up the lubricant oil of the LT compressors [34].
It is important to notice that one compressor of each compression rack is driven by a variable frequency drive (VFD) in order to cover easier the cooling demand with the minimal energy consumption.
2.2. Basic Booster with Economizer (BB+EHX)
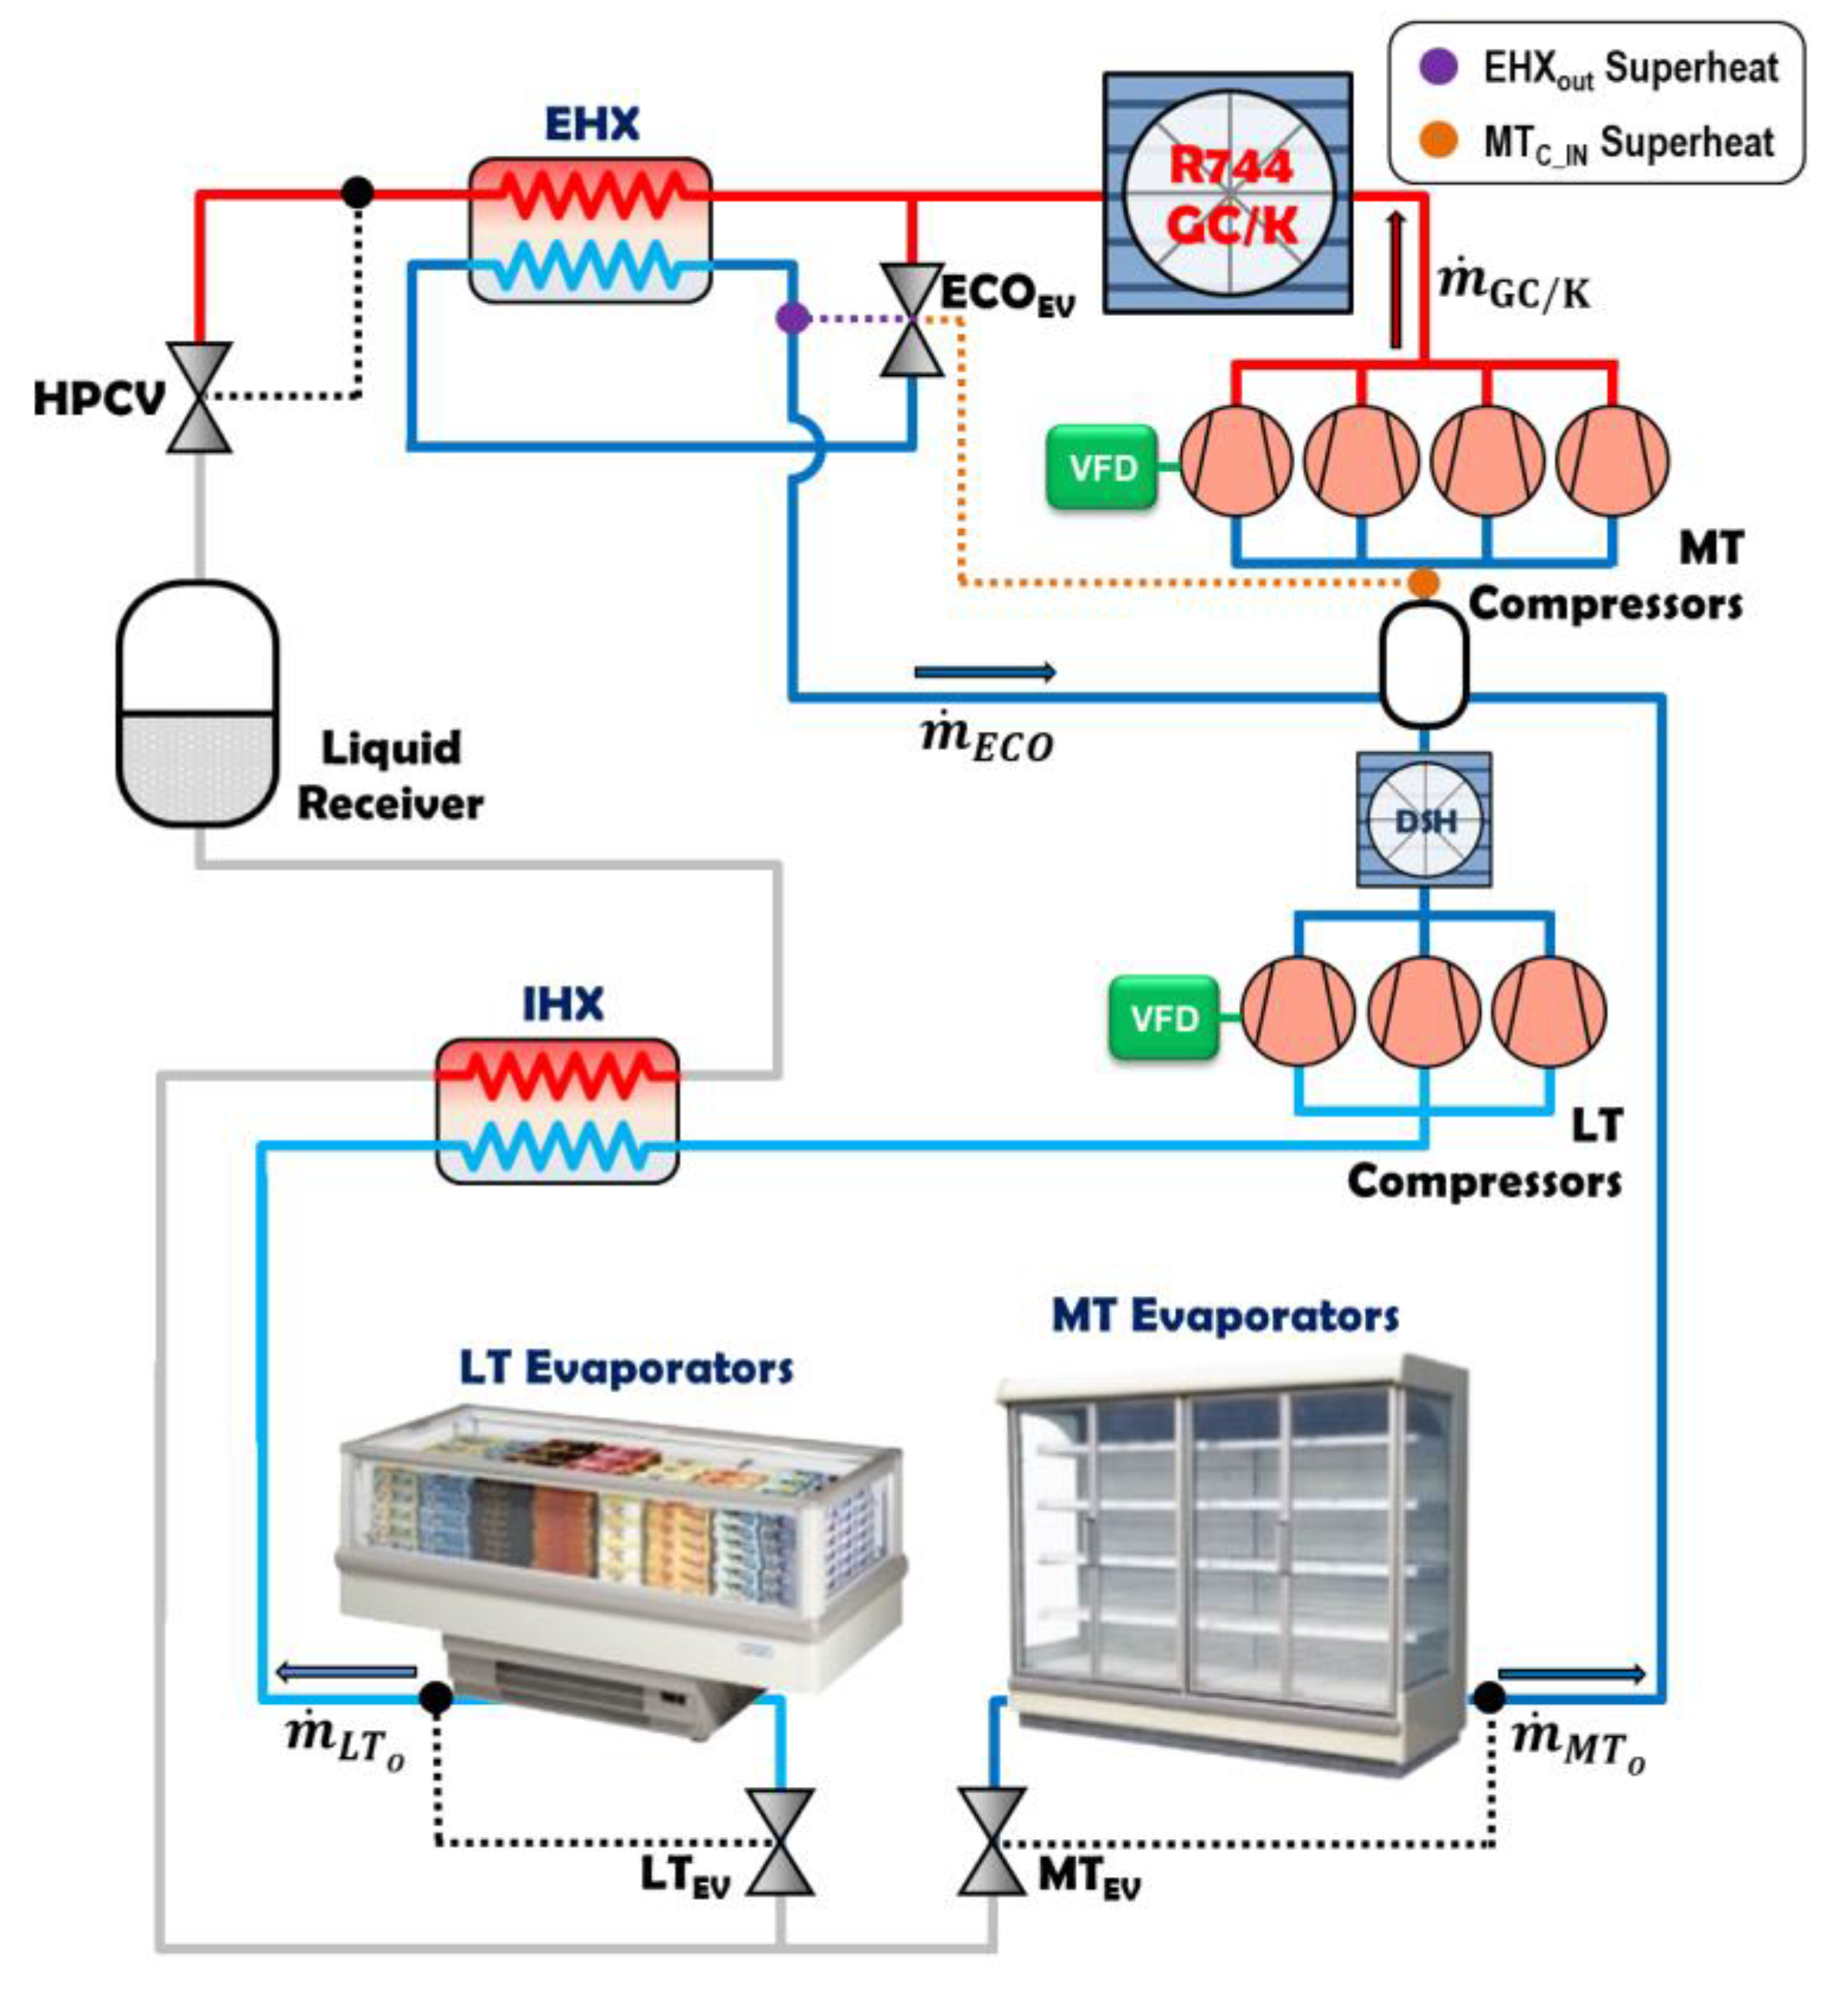
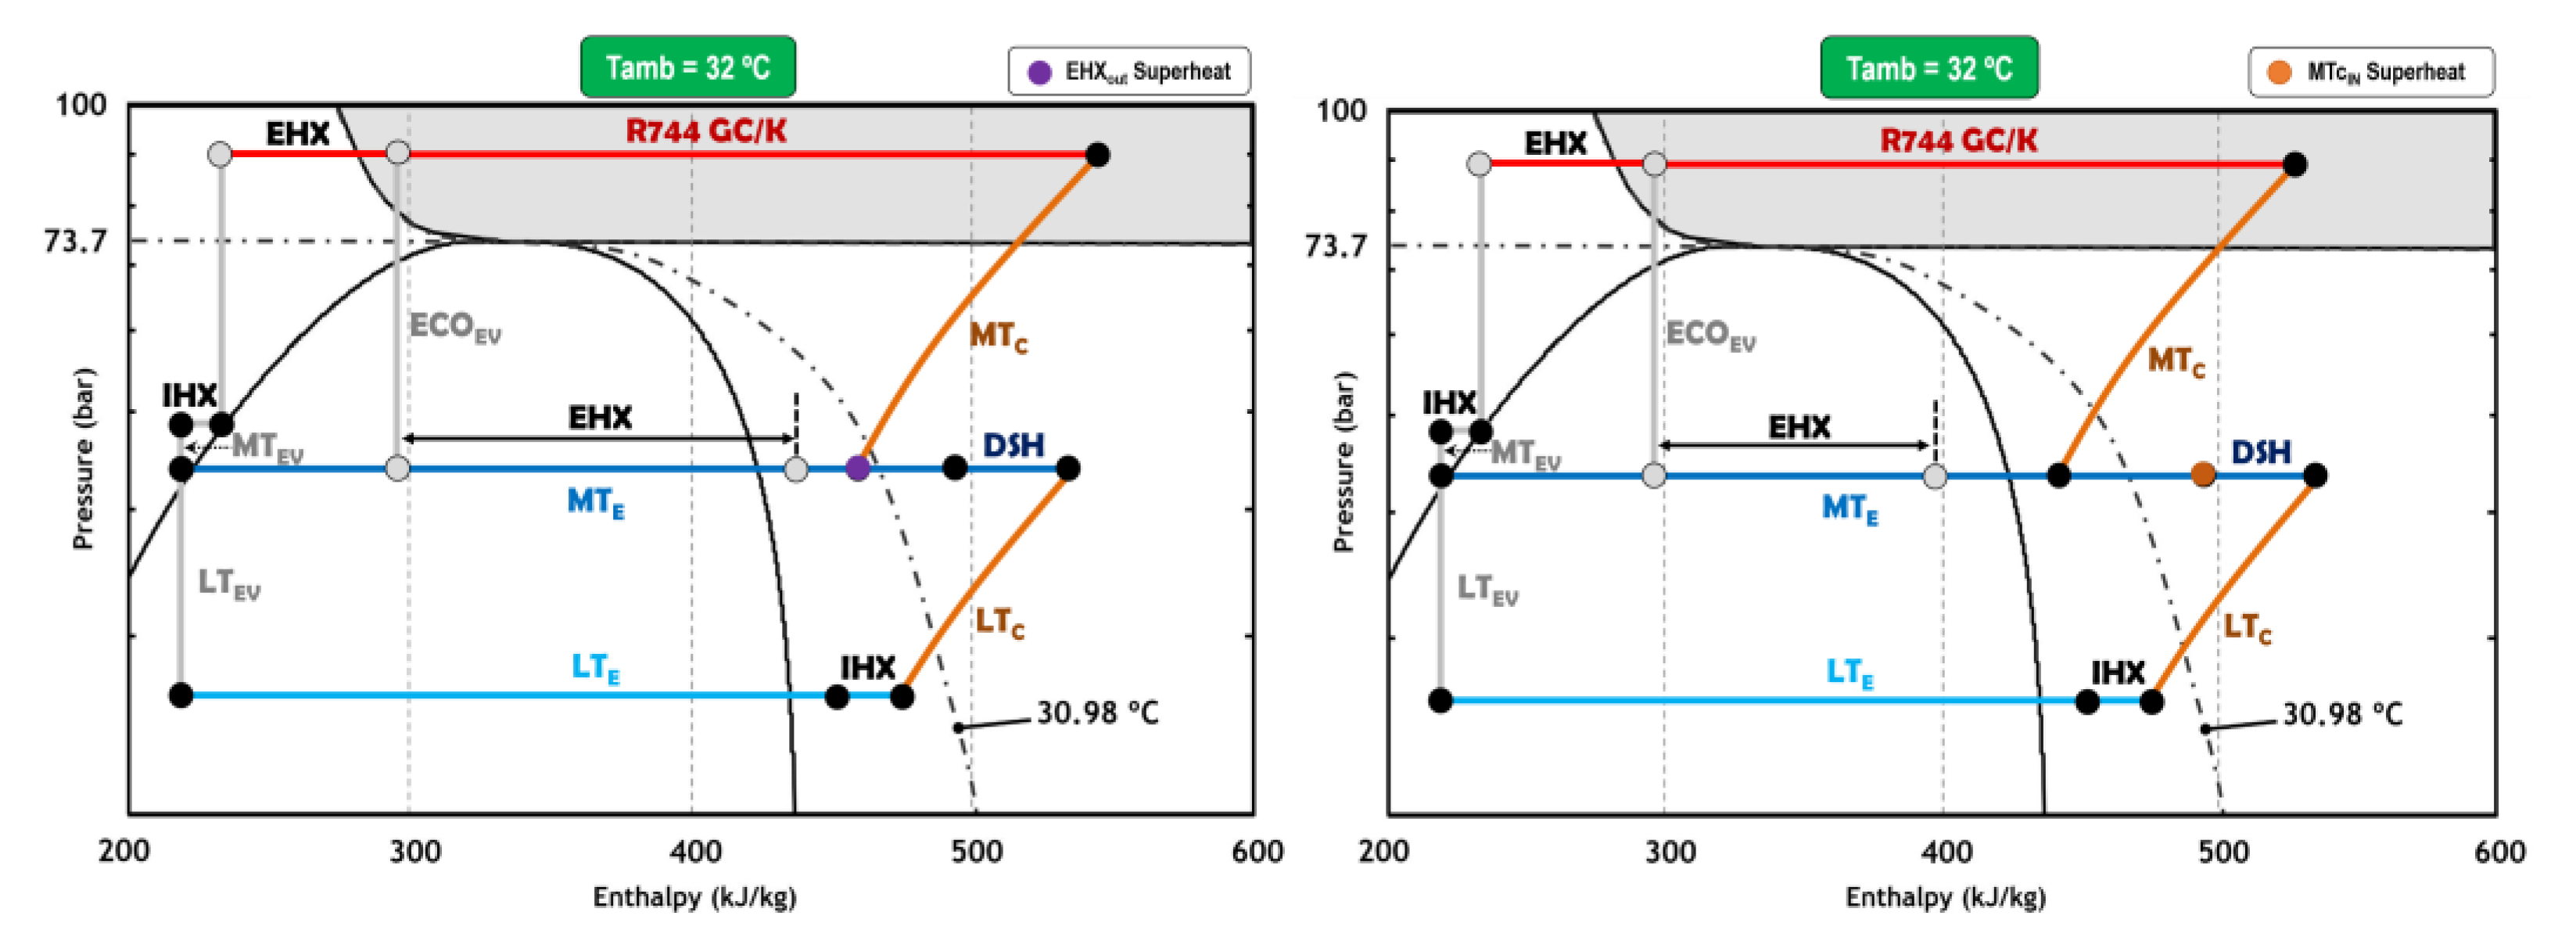
In this case, an additional heat exchanger named the economizer or subcooler (EHX) is introduced in the architecture (Figure 2). The EHX cools down the exhaust refrigerant from the GC/K by means of a stream of refrigerant extracted and expanded from the GC/K exit. The expanded fluid has low vapor quality; thus, the cooling capacity to reduce the temperature of the high-pressure stream is greater than that of other cooling systems that reduce the temperature with the vapor extracted from the liquid receiver. The expansion valve used in this case is labeled as ECOEV and its superheating control mode defines two different cycles, as can be shown in Figure 2. The first one (EHXOUT Superheat) controls the superheating degree at the exit of economizer, while the second one (MTC_IN Superheat) minimizes the superheating degree at the inlet of the MT compressors (MTC). Depending on the control mode adopted, the refrigerant mass flow injected and the degree of subcooling will vary, affecting the pressure of the liquid receiver.
From the results obtained in the computational model presented in this work, it has been proved that both configurations have a similar COP, so for the complete analysis of the BB + EHX configuration, only the arrangement that controls the superheating degree at the exit of the economizer (EHXOUT Superheat) has been chosen, because it is easier to implement in a real facility.
2.3. Basic Booster with Economizer and Additional Compression Stage (BB+IMS)
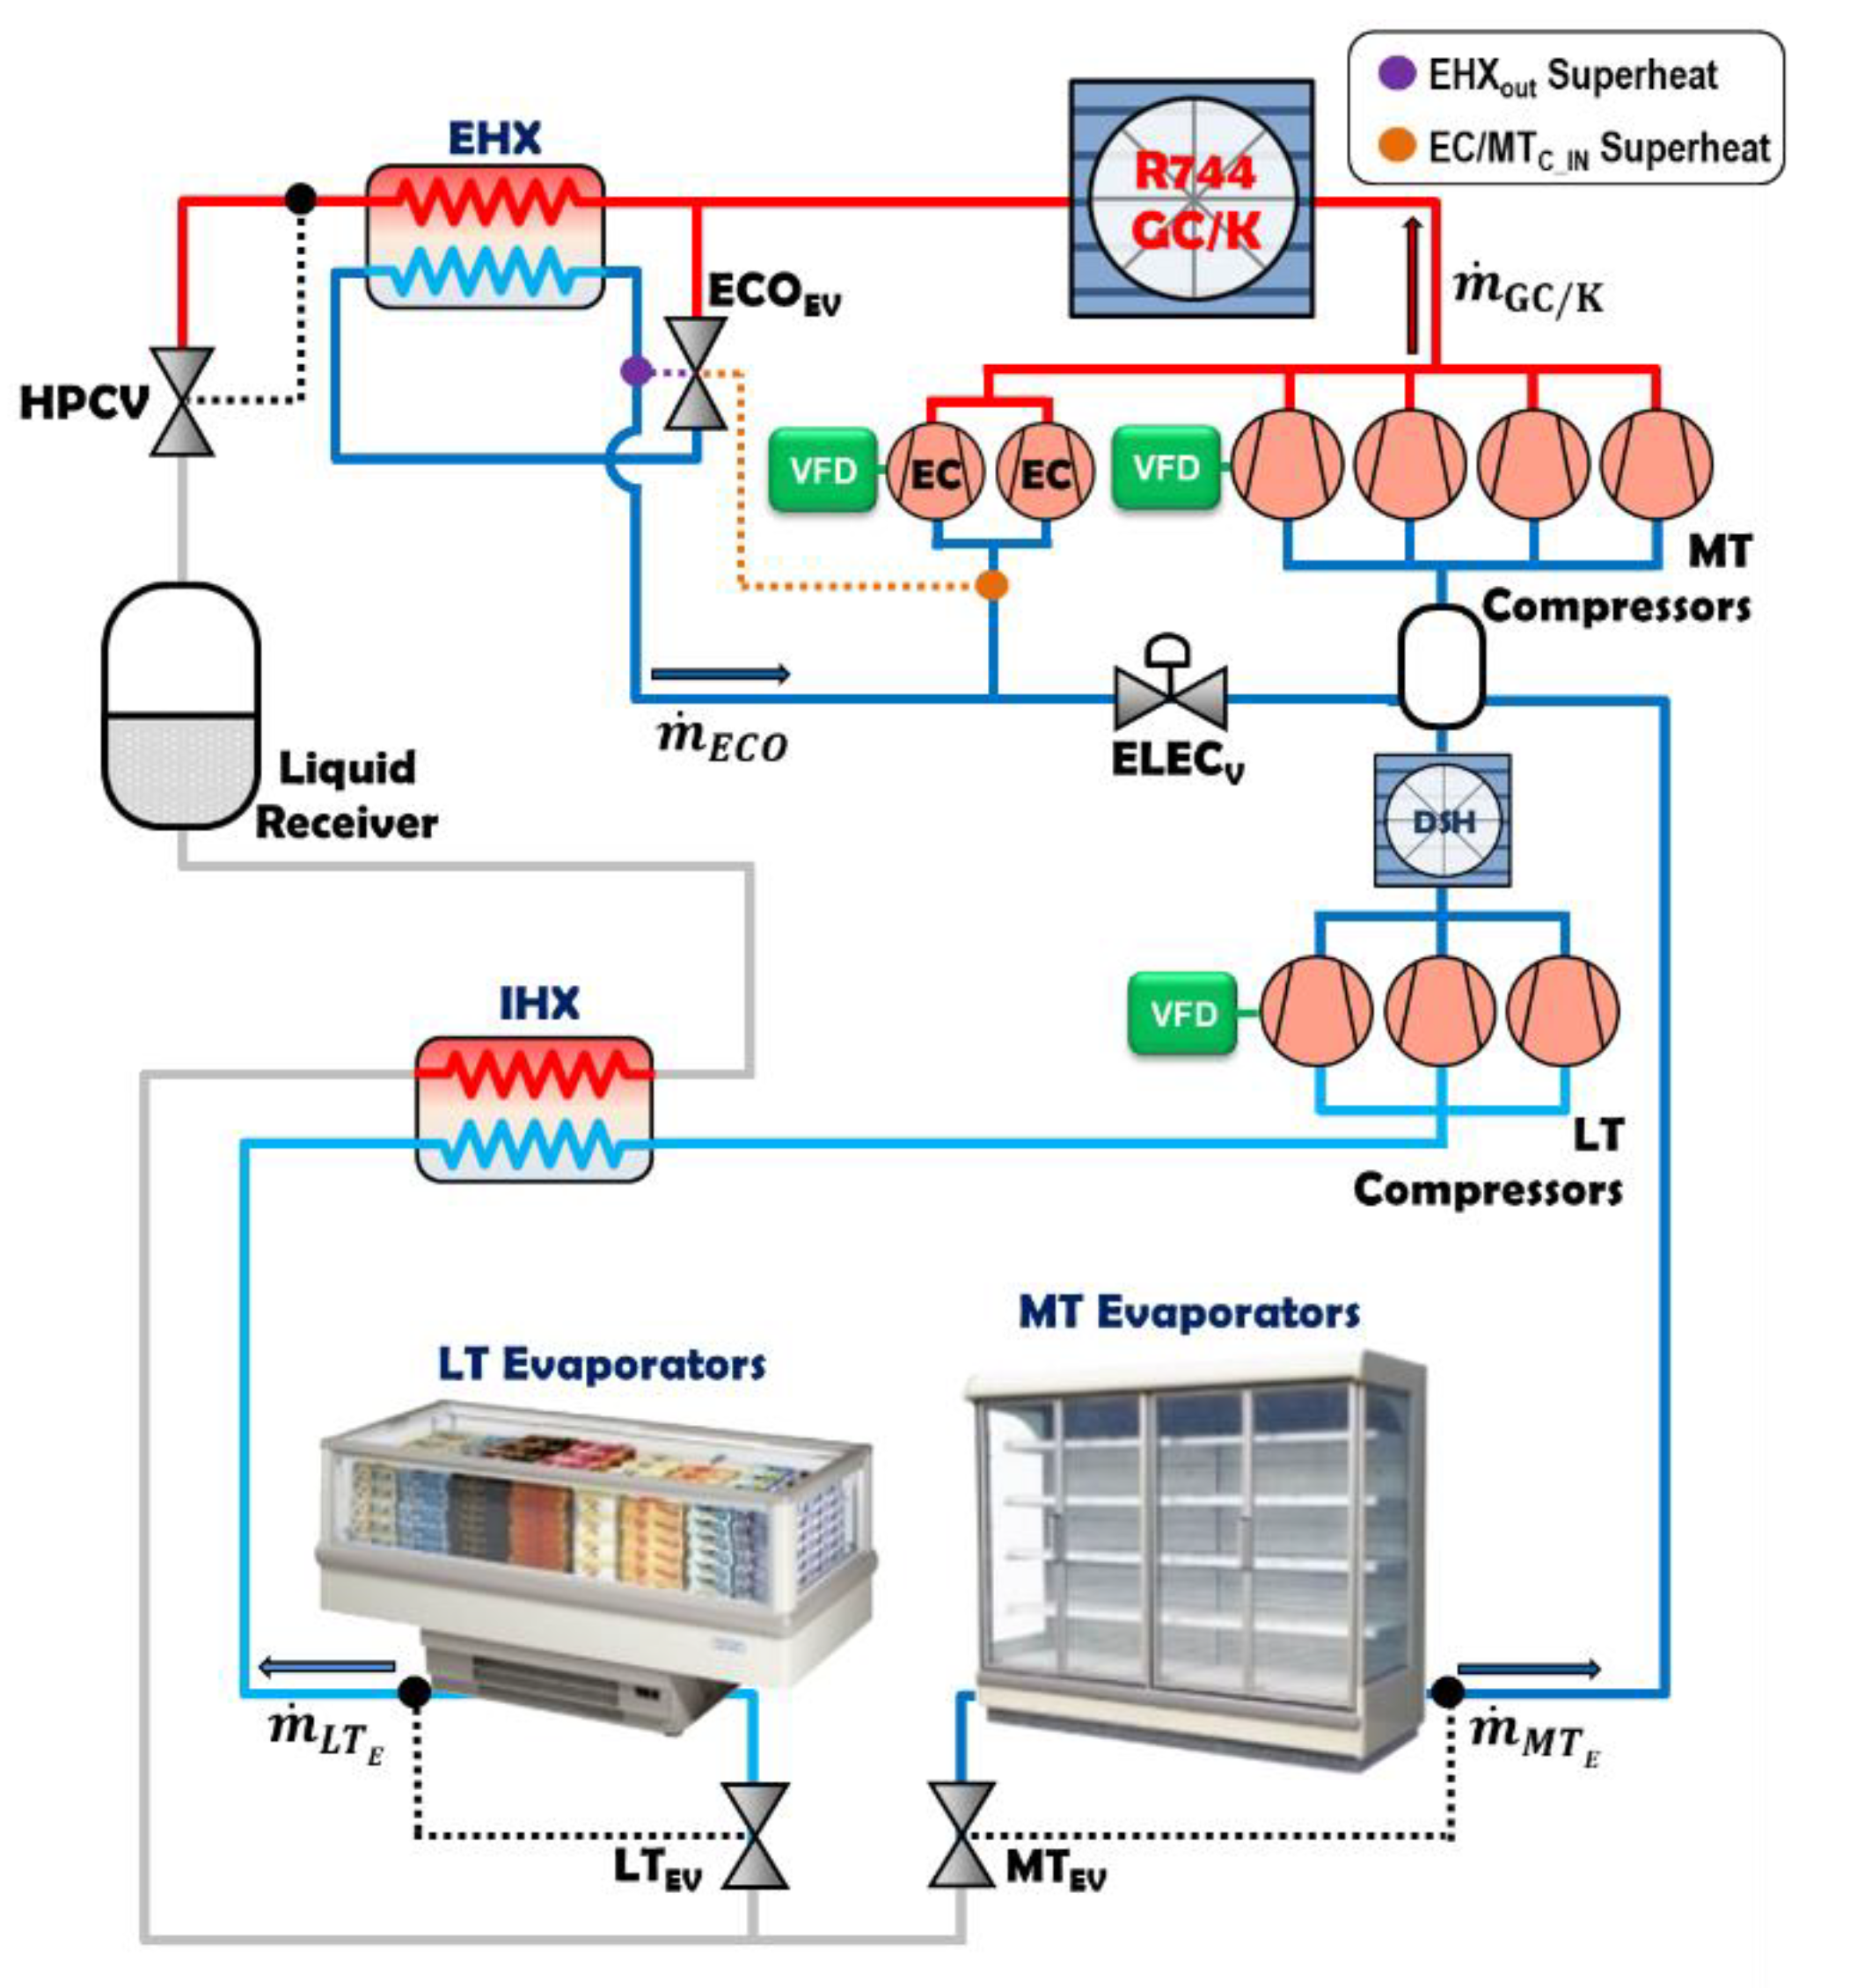
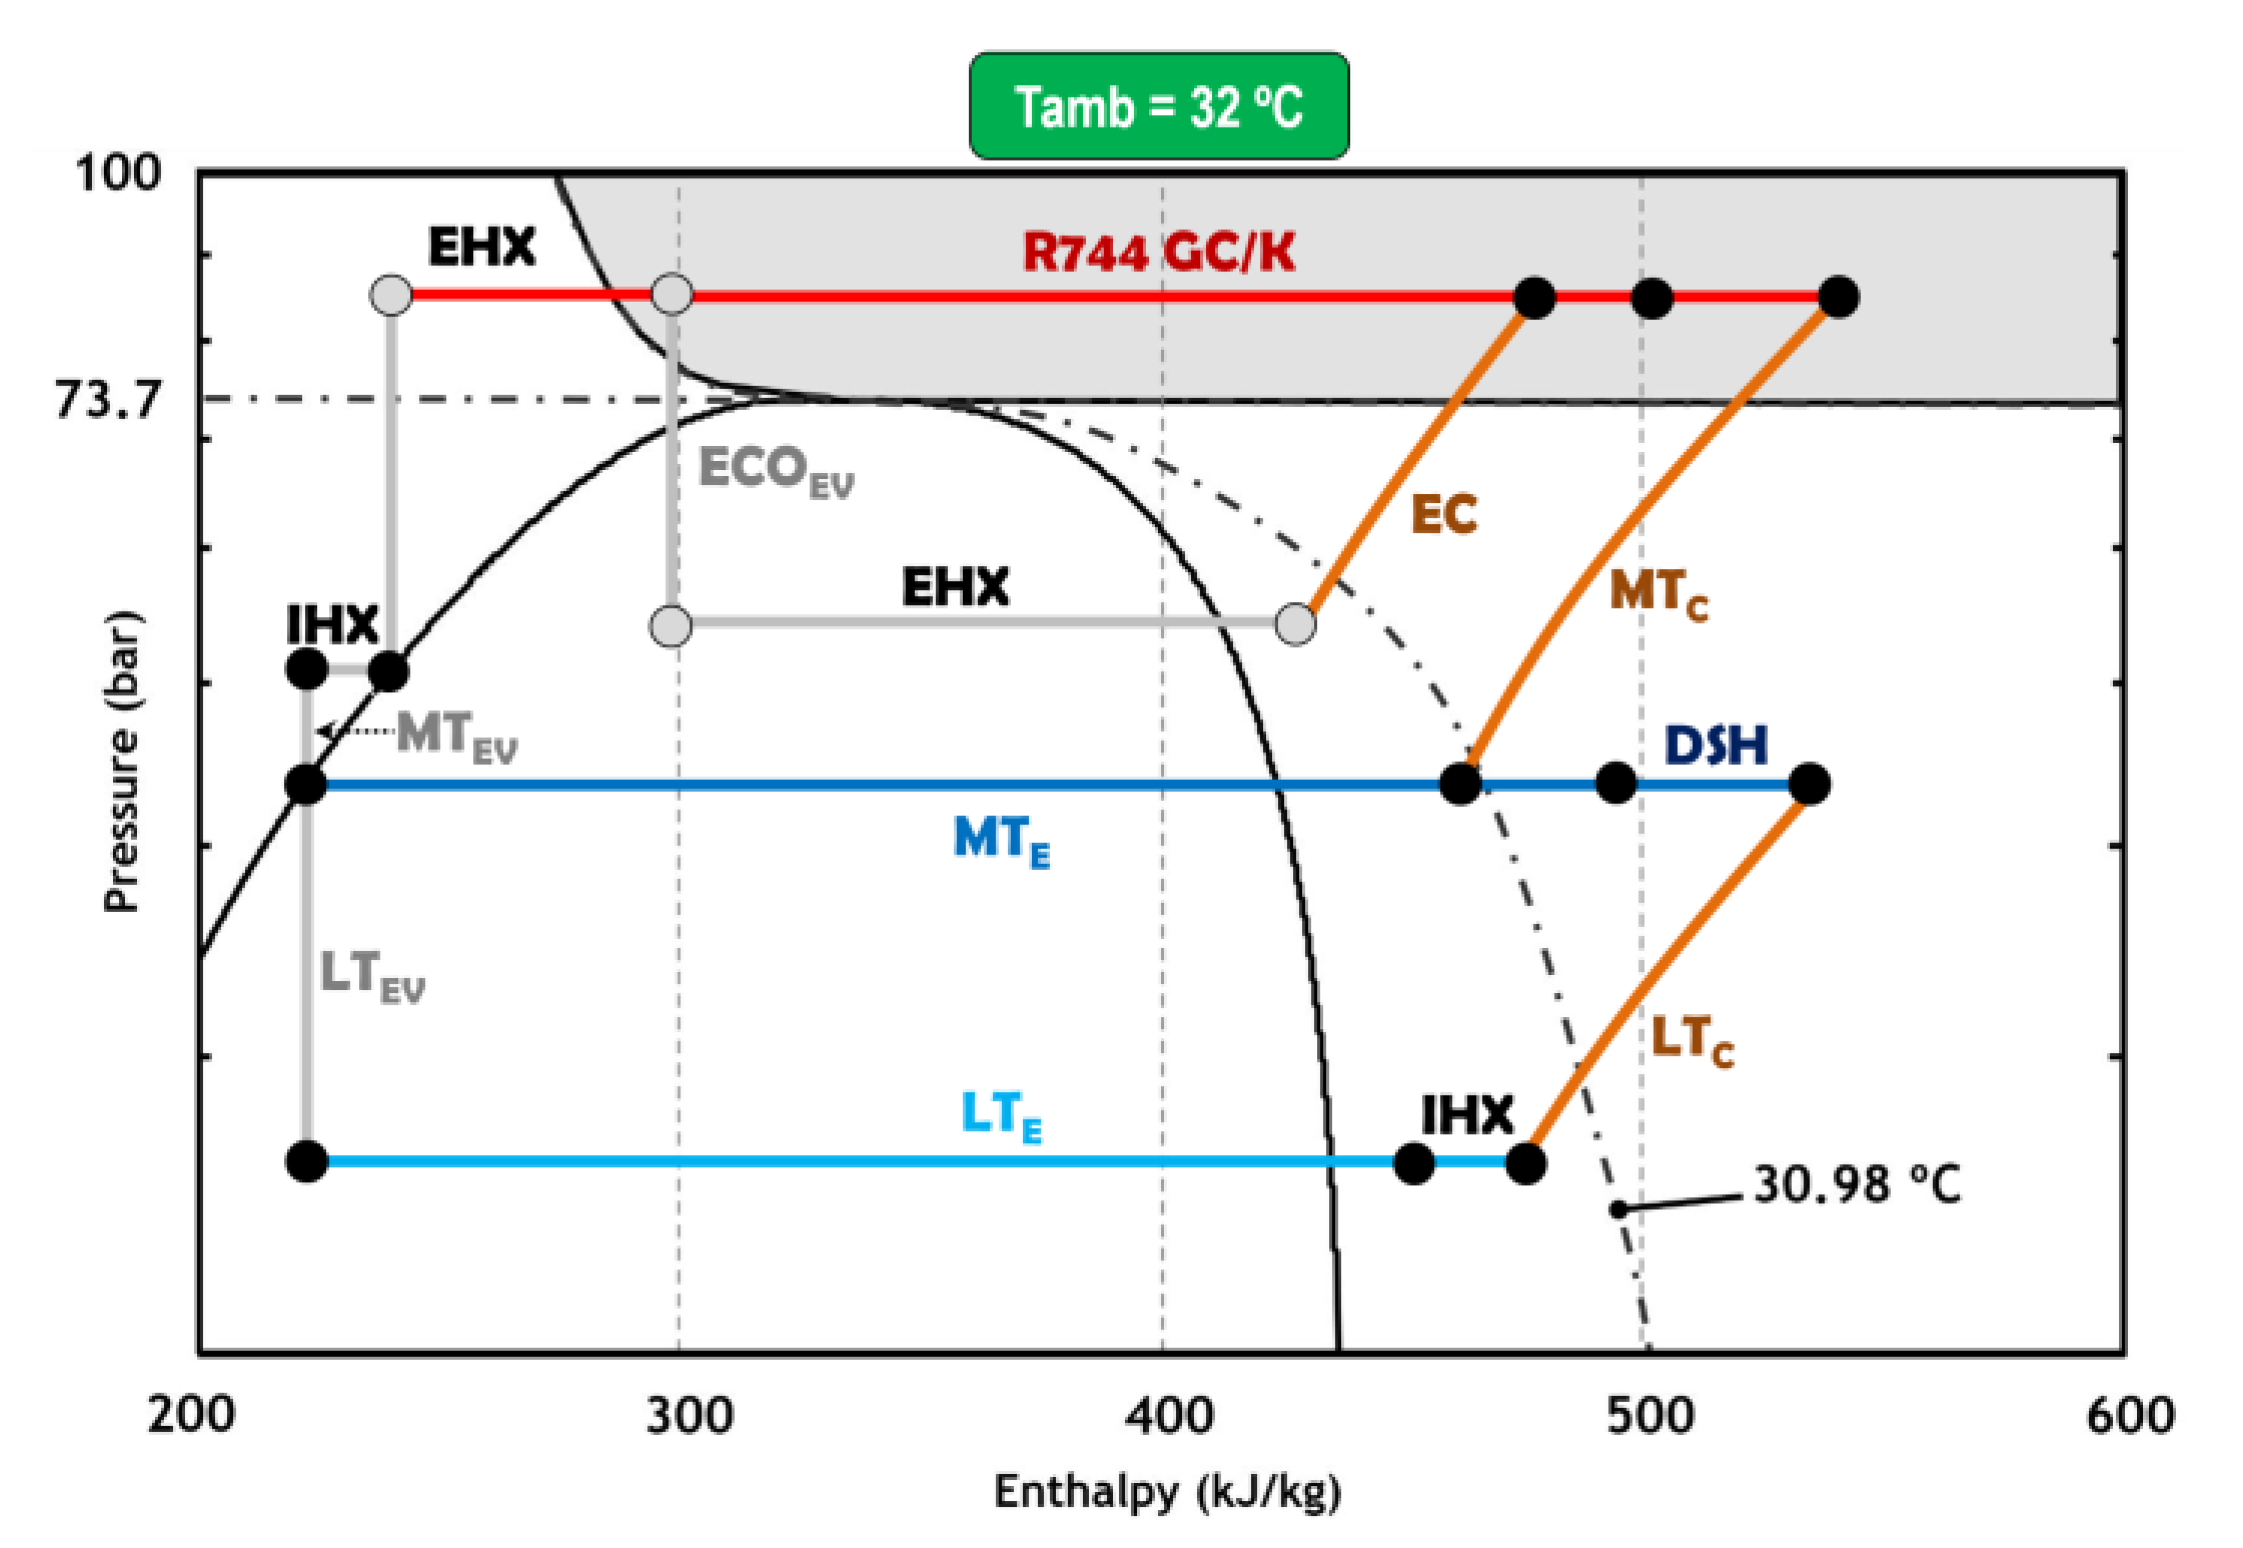
The arrangements shown in Figure 2 can be improved by adding an additional compression stage acting over the stream of refrigerant expanded from the high-pressure level. The purpose of those compressors (EC) is to reduce the mass flow rate driven by the MT compressors, taking advantage of its low compression ratio. As before, Figure 3 presents the possible arrangements of the refrigeration cycle depending on the temperature control of the ECOEV valve. The valve labeled as ELECV allows bypassing the EC compressors when they are not used, mainly when their compression ratio is below the manufacturer limits [35] or if the use of the EC compressors does not provide significant energy saving.
Similarly to Section 2.2, the configurations depicted in Figure 3 have similar results in terms of COP when the computational model developed in this manuscript is applied. Consequently, the analysis of the BB + IMS configuration will be referred to the configuration that controls the superheating degree at the exit of the economizer (EHXOUT Superheat), as its control is easier to implement.
3. Model Assumptions
This section is dedicated to listing all the model assumptions considered for the theoretical calculation.
3.1. Heat Rejection Conditions
Since all the architectures described before use air as the secondary fluid, the heat rejection conditions depend on the ambient temperature. Hence, for transcritical conditions (PGC/K ≥ 73.75 bar), the temperature at the exit of the gas cooler has been obtained by means of Equation (1) with the ambient temperature (Tamb) and a temperature approach (ATD) of 2 K. The low value of ATD is based on the high thermal effectiveness of the gas cooler in transcritical conditions [36]. On the other hand, the heat rejection pressure was adjusted to the optimal one with an iterative method from 120 bar to 73.75 bar with small intervals of 0.05 bar.
For subcritical conditions (PGC/K < 73.75 bar), the temperature approach has fixed to 5K in order to consider the loss of thermal effectiveness when the heat exchanger is operating as a condenser [36]. Additionally, a subcooling degree (SUB) of 2 K has been added according to the control strategies described by Danfoss [37] to ensure the proper operation of the facility. With those values, the condensing temperature (TK) is determined with Equation (2).
3.2. Economizer (EHX)
As was stated before, the aim of the economizer (EHX) is to cool down the refrigerant at the exit of the GC/K using a stream of CO2 expanded with the ECOEV. Depending on how the valve is controlled, the cycle arrangement changes as shown in Figure 2 and Figure 3. Notwithstanding, in both cases, the set point for the superheating control was fixed to 5 K to avoid liquid in the suction line of the compressors. Equations (3)–(7) determine the inlet and outlet temperatures at the economizer.
3.3. Desuperheater (DSH)
The function of the desuperheater is to reduce the temperature of the refrigerant at the discharge line of the LT compressors. To achieve this, a cross-flow heat exchanger has been used employing ambient air as the secondary fluid. Since the discharge temperature of the LT compressors is above the ambient temperature, the use of a desuperheater is always positive, reducing the temperature at the suction port of the MT compressors [38]. Equation (8) allows determining the temperature at the exit of the DSH, assuming a temperature approach (ATD) of 5 K regarding the ambient temperature (Tamb).
3.4. Service Thermal Loads
For all booster architectures, similar operating conditions have been assumed for the low and medium temperature levels. Taking into account the values reported by Emerson [39], the evaporating levels adopted for medium and low temperature are −6 °C and −32 °C, respectively. The cooling load assumed is 140 kW for the medium temperature level and 41 kW for the low-temperature services, resulting in a load ratio (LR) of 3.4.
To make the analysis more realistic, a heat load profile of the evaporators was considered taking into account the opening and closing schedule of a typical supermarket. Thus, it was assumed that the 100% of the heat load is effective from 7:00 to 22:00, while this load falls by up to 50% the rest of time (from 22:00 to 7:00) as considered by Catalán-Gil et al. [13].
3.5. Internal Heat Exchanger (IHX)
Regardless of the arrangement adopted, a suction-to-liquid heat exchanger (IHX) was considered at the exit of the liquid receiver. The presence of the IHX guarantees the absence of any vapor phase at the inlet of the thermostatic valves LTEV and MTEV. Moreover, it also introduces a slight subcooling degree that enhances the cooling capacity and a moderate superheating degree which ensures a minimum temperature in the lubricant oil [34]. From Llopis et al. [40], a constant thermal effectiveness of 65% was considered in this work.
3.6. Compressors
To cover the cooling demand assumed in Section 3.4, two compression racks have been used in all systems. According to the thermal loads, the low-temperature rack is composed by three compressors, while the medium-temperature rack has 4. The economizer arrangement has also two additional compressors, whose position is depicted in Figure 3. Depending on the operating conditions, the compressors are switched on or off, guaranteeing the minimal energy consumption.
Each compression rack is equipped with one variable frequency drive (VFD) for one of the compressors to make the adaptation to the thermal load precise. The frequency operation of these compressors varies from 25 to 75 Hz, while the rest of them work with a fixed frequency of 50 Hz.
Taking into account the manufacturer restrictions, we have assumed a minimum compression ratio (t) of 1.5 and a maximum suction pressure of 55 bar in all compressors [35,41].
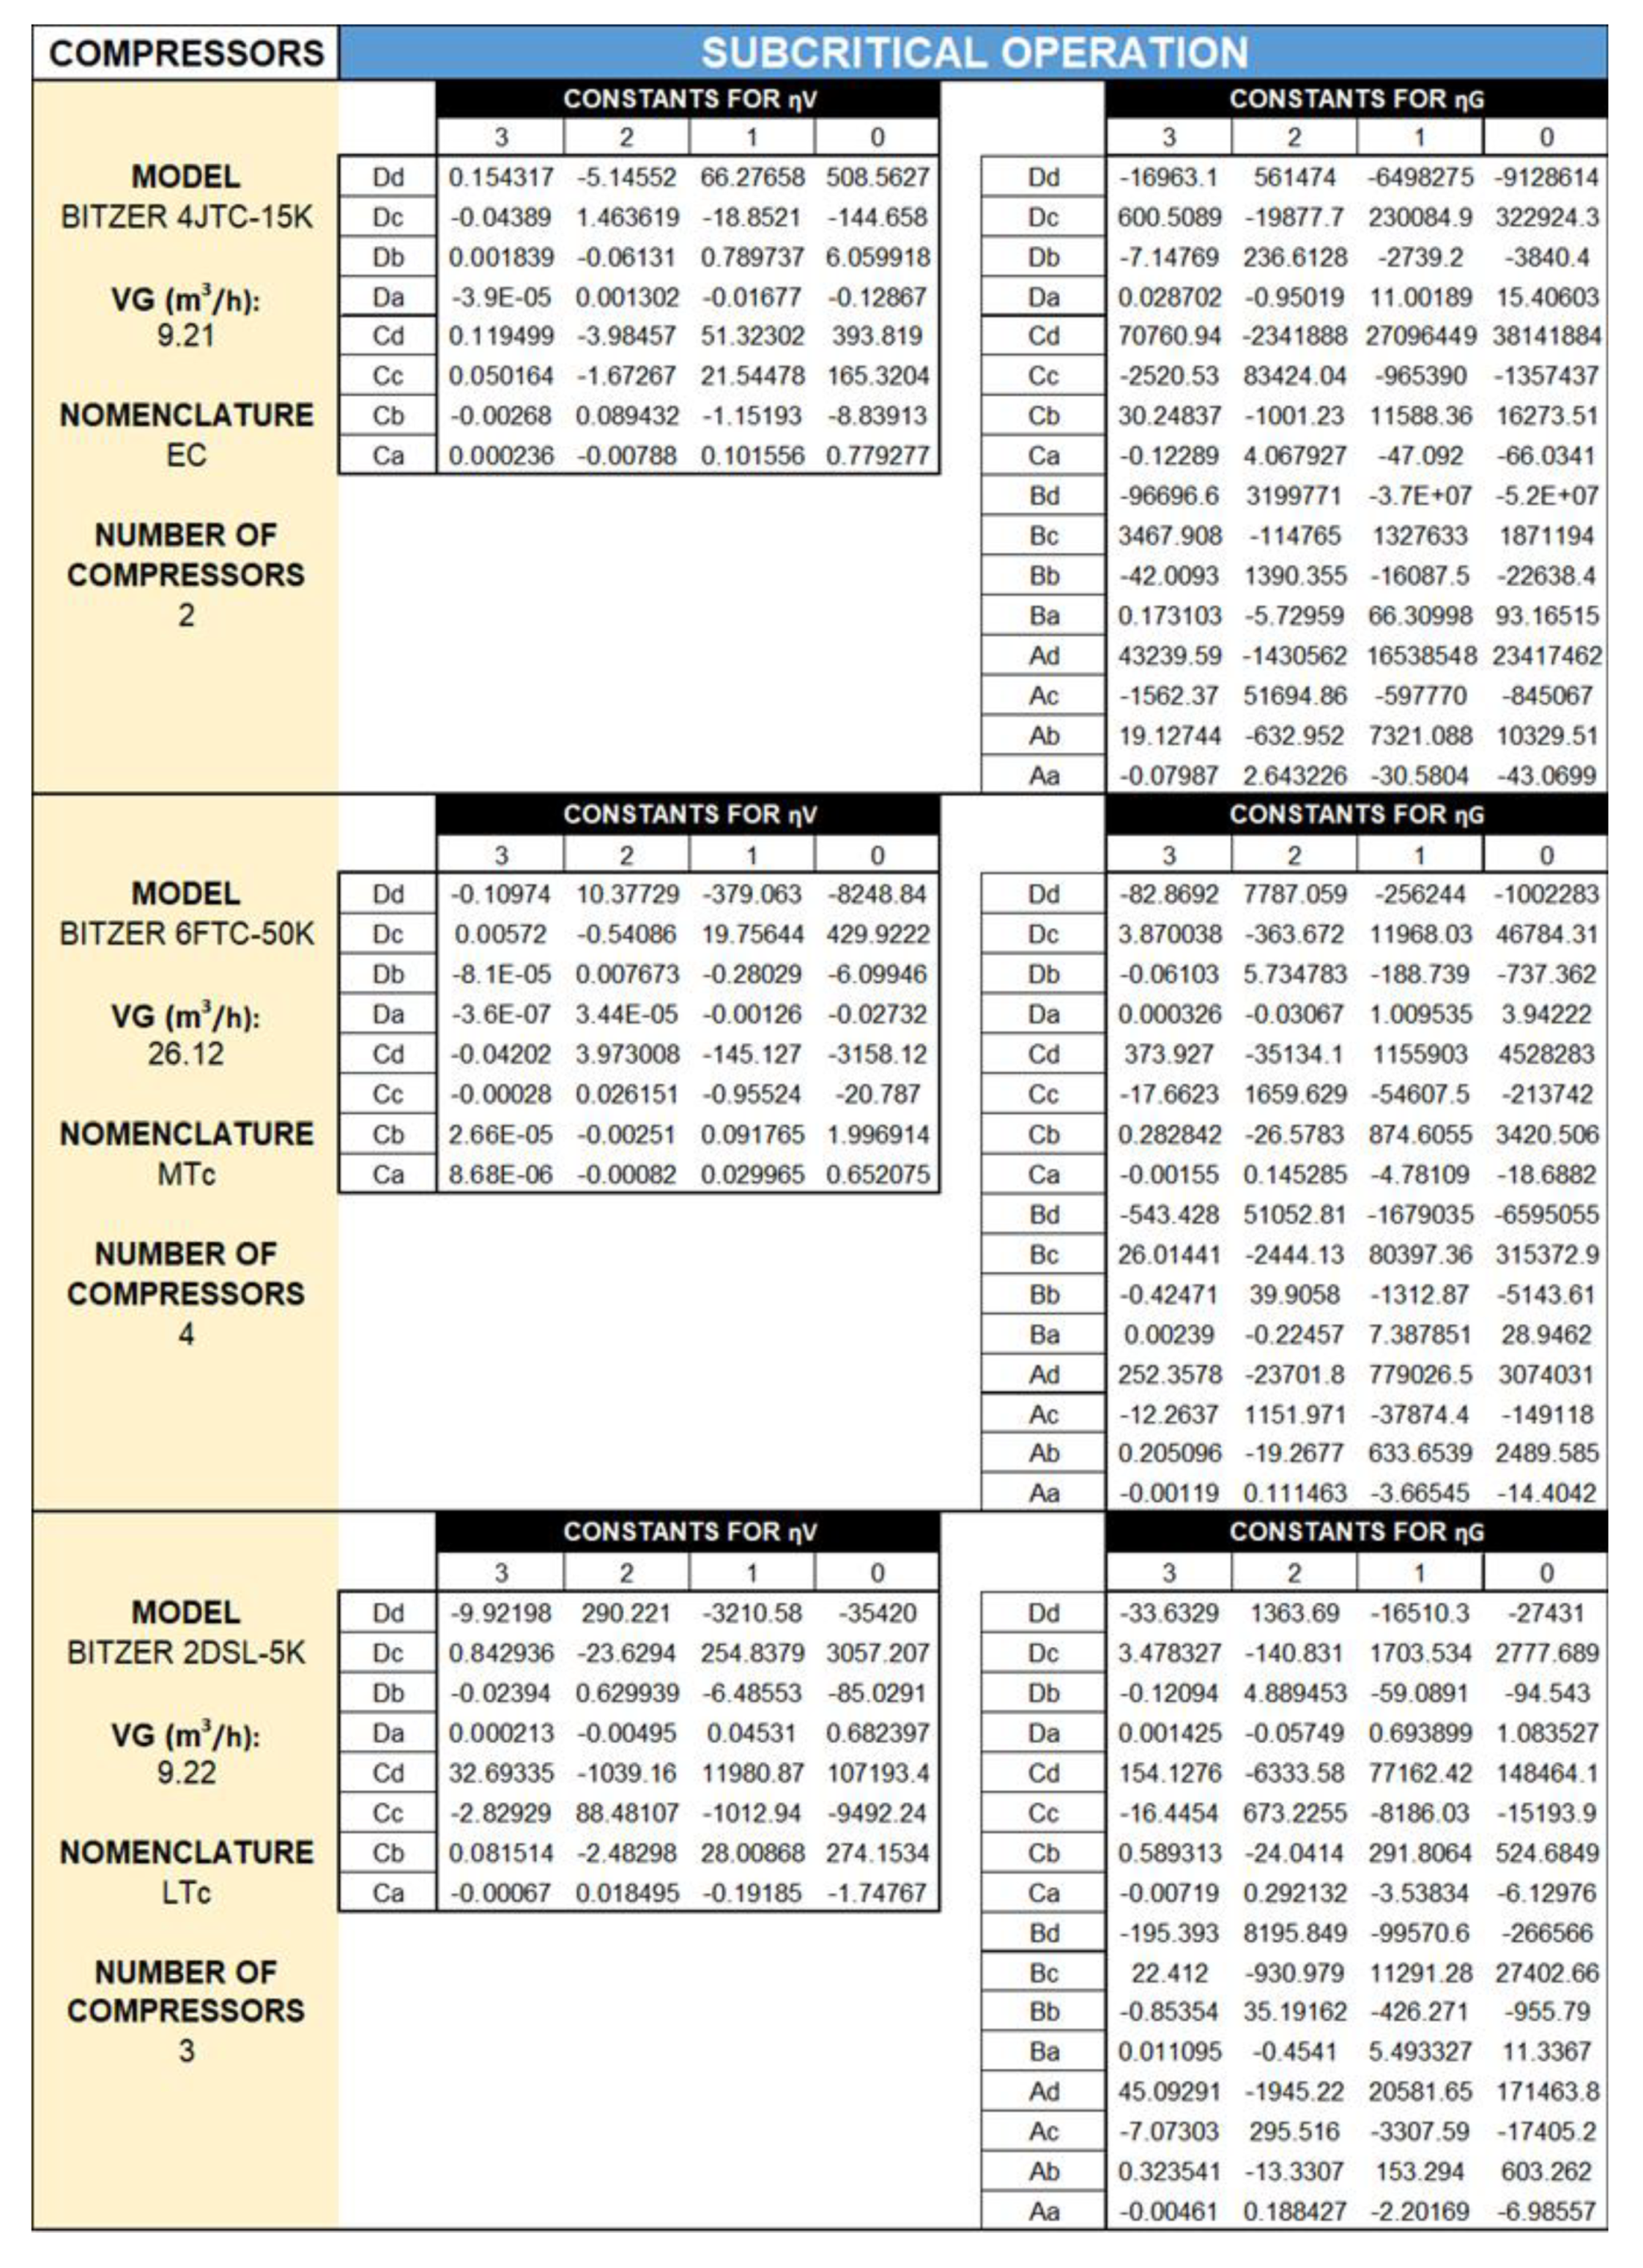
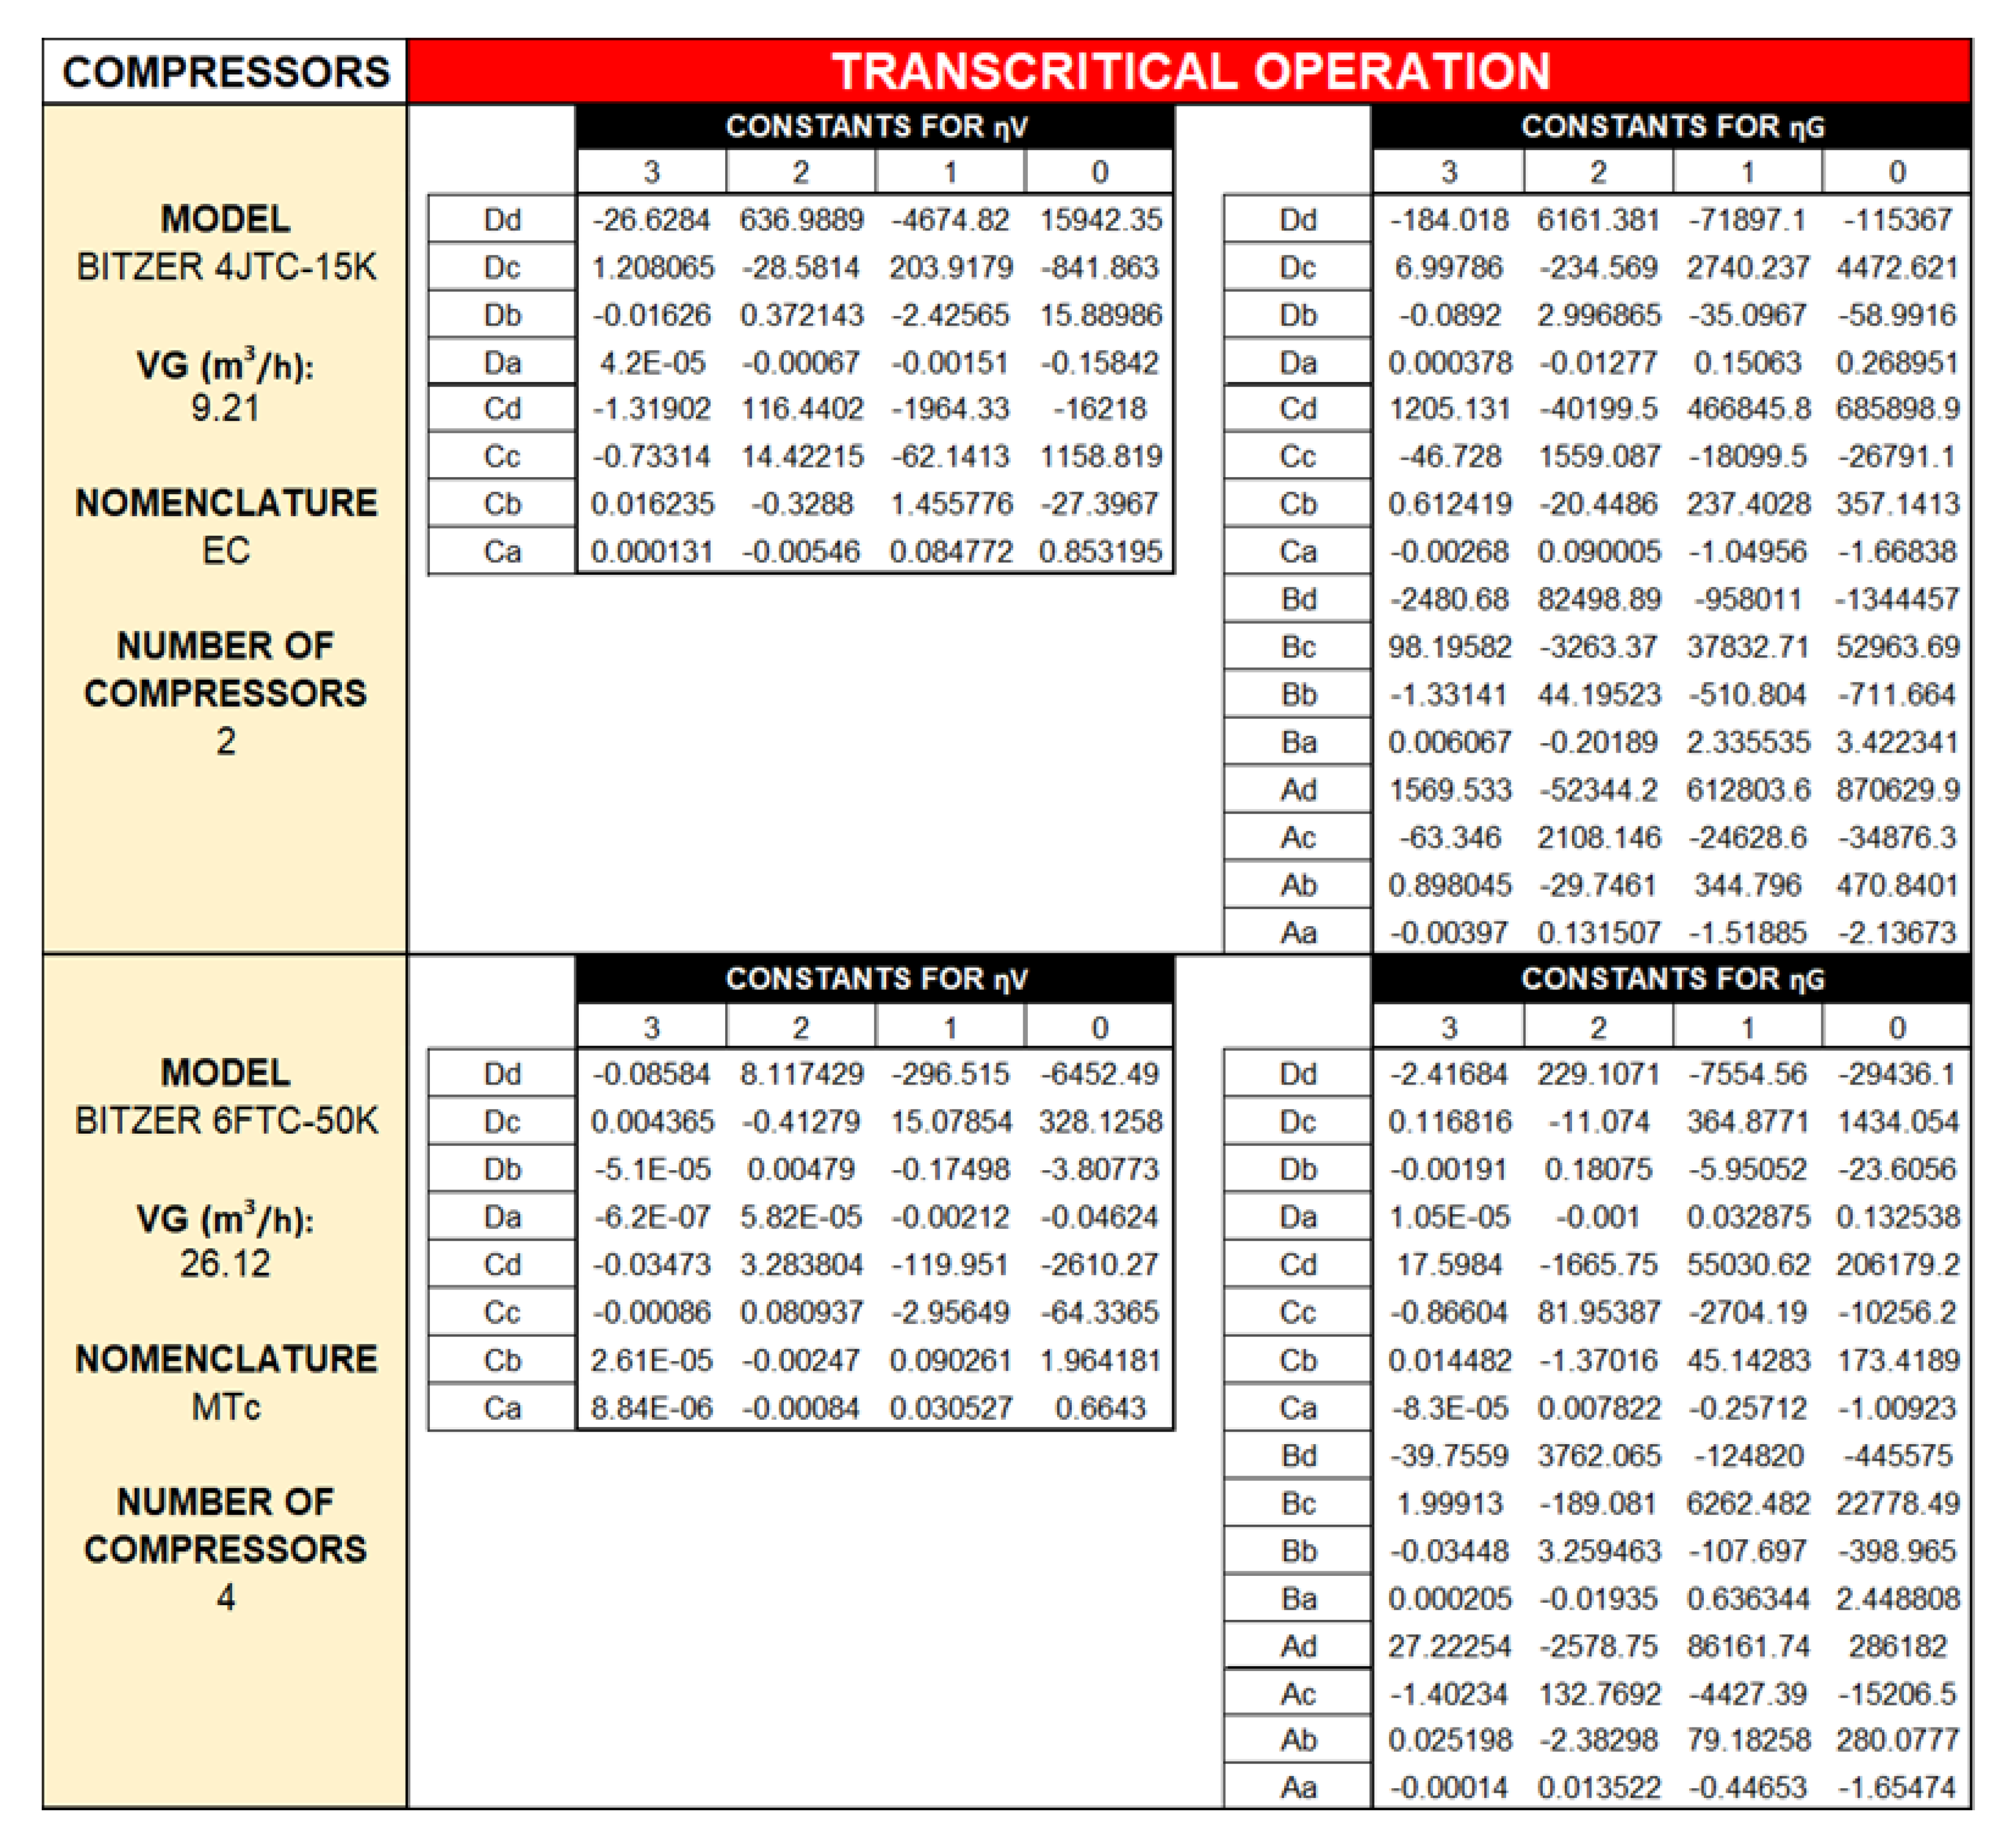
The mathematical model of the reciprocating compressors has been adjusted from the manufacturer’s data [41] using the parameters of volumetric efficiency (ηvolum.) and global efficiency (ηglobal). Equations (9) and (10) describe the mathematical model obtained for the compressor efficiencies as a polynomial equation, with the variables of compression ratio (t), specific volume at the suction port (v), and displacement (). Since this last also depends on the compressor rotation speed, a precise polynomial model has been developed to take into account the effect of the rotation speed over the compressor operation. The maximum relative error obtained from the mathematical adjustment, compared to the manufacturer’s data, was lower than 0.2%, so we can assume that the model predictions are in good agreement with the manufacturer data.
Appendix A includes the main features of the compressors as well as the coefficients used in Equations (9) and (10).
3.7. Expansion Devices
All the expansion devices used in the model have been assumed as isenthalpic with a minimum pressure difference of 3.5 bar between the inlet and the outlet ports [42]. Moreover, the maximum operation pressure (MOP) has been fixed to 120 bar, which corresponds with the maximum operation pressure of the refrigerating plant. For thermostatic valves, the useful superheating was fixed to 5 K in all cases.
3.8. Liquid Receiver Pressure
The pressure of the liquid receiver always depends on the configuration adopted, the heat rejection conditions, and the subcooling introduced after the GC/K heat exchanger. Therefore, the use of economizer or a flash-gas valve (FGV) reduces the pressure at the liquid receiver. To take into account all these variations, we have assumed a variable liquid receiver pressure with a minimal pressure of 35 bar to comply with the restriction mentioned above of keeping a minimal pressure difference in all expansion devices.
3.9. Additional Considerations
The pressure drops in pipelines, and heat exchangers have been neglected. Similarly, the heat transfer between components and ambient has also been neglected.
3.10. Summary Table
Table 1 summarizes all the assumptions stated before for the analyzed configurations.
4. Model Description
To evaluate the maximum COP of all the configurations described in Section 2, a computational model was developed according to the restrictions described in Section 3. The model was programmed using Matlab® and Microsoft® VBA, using the database of RefProp® v.9.1 [43] for determining the thermophysical properties. Figure 4, Figure 5 and Figure 6 describe the iterative method used by the model to find the maximum COP (COPopt) of the facility at each ambient temperature (Tamb).
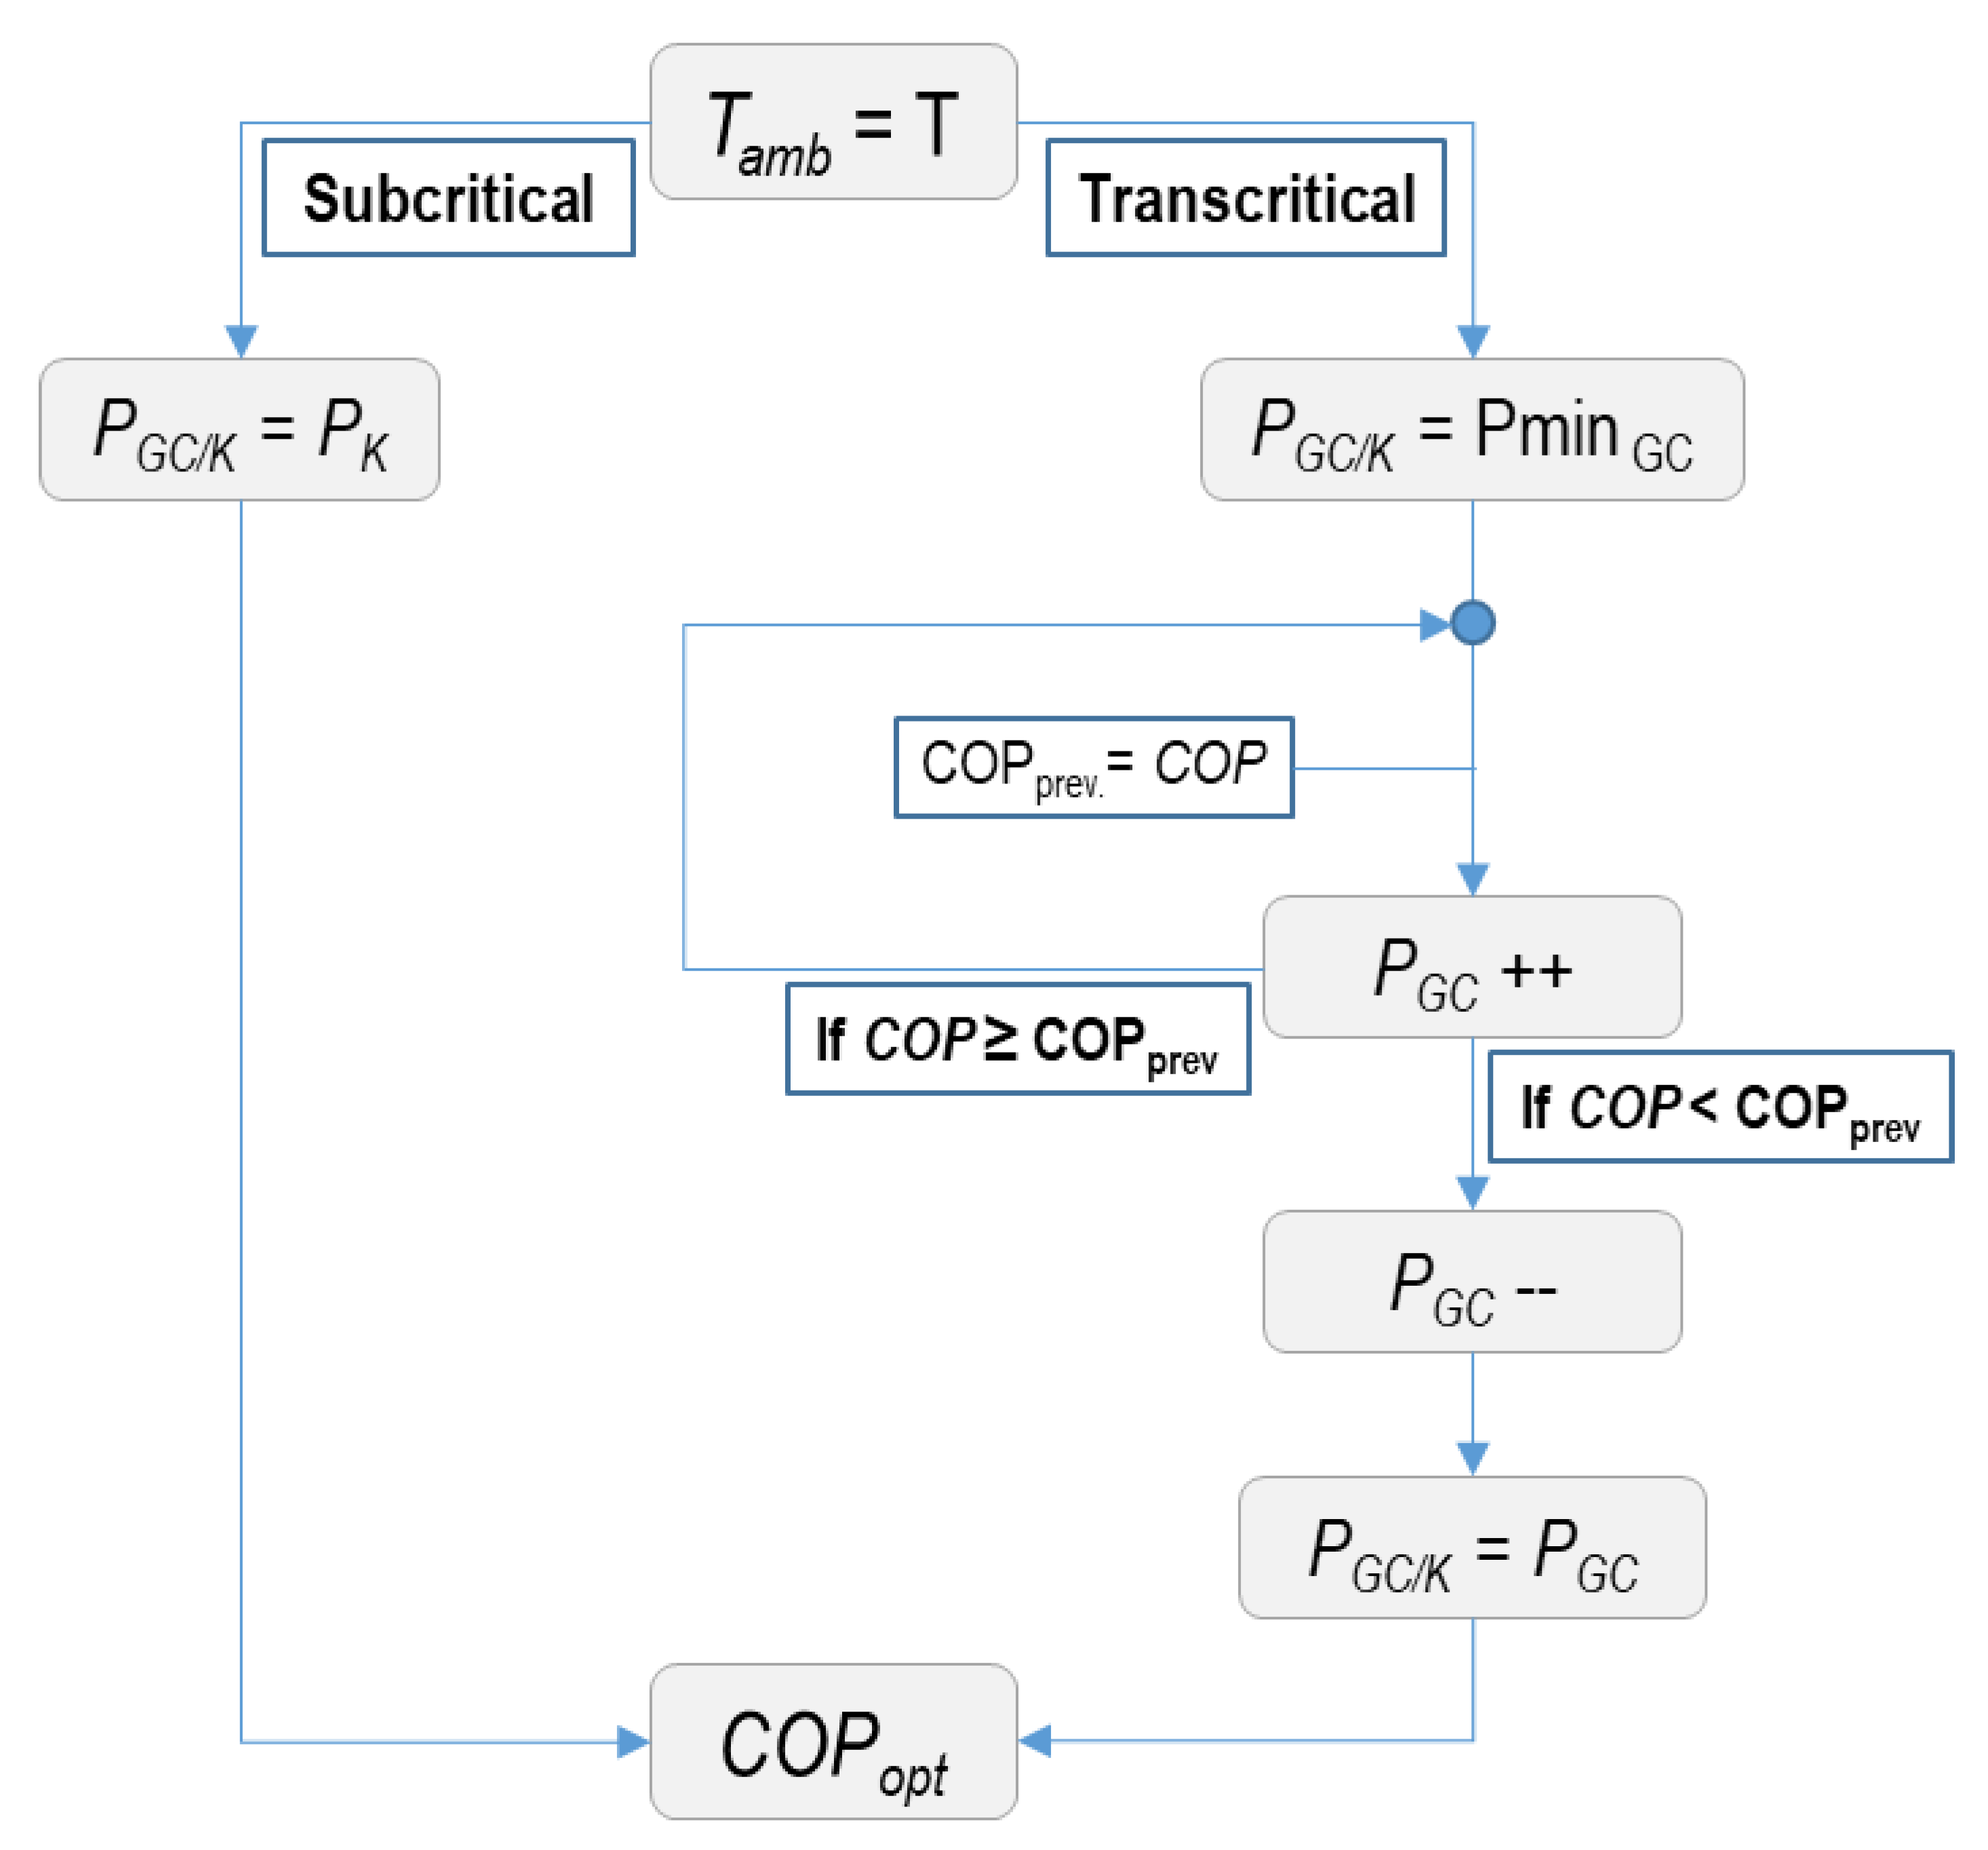
For the Basic Booster arrangement (BB) (Figure 4), the maximum COP is achieved at the optimum GC/K pressure (PGC/K) in transcritical conditions. In subcritical conditions, the optimal pressure corresponds to the condensing pressure (PK) except for the transition zone (near the critical point), where a linear pressure variation with the ambient conditions was considered according to Catalán-Gil et al. [13]. In transcritical operation, the iteration is started with the lowest transcritical pressure (PminGC = 74 bar), the COP is obtained with Equation (11), and the GC/K pressure is increased in steps of 0.1 bar (PGC ++). With this pressure, another COP is obtained and compared with the previous one (COPprev). If the current COP is higher, the GC/K pressure is further increased; else, if it is lower, the previous pressure is returned (PGC −−). This will be the optimum pressure that maximizes the COP (COPopt).
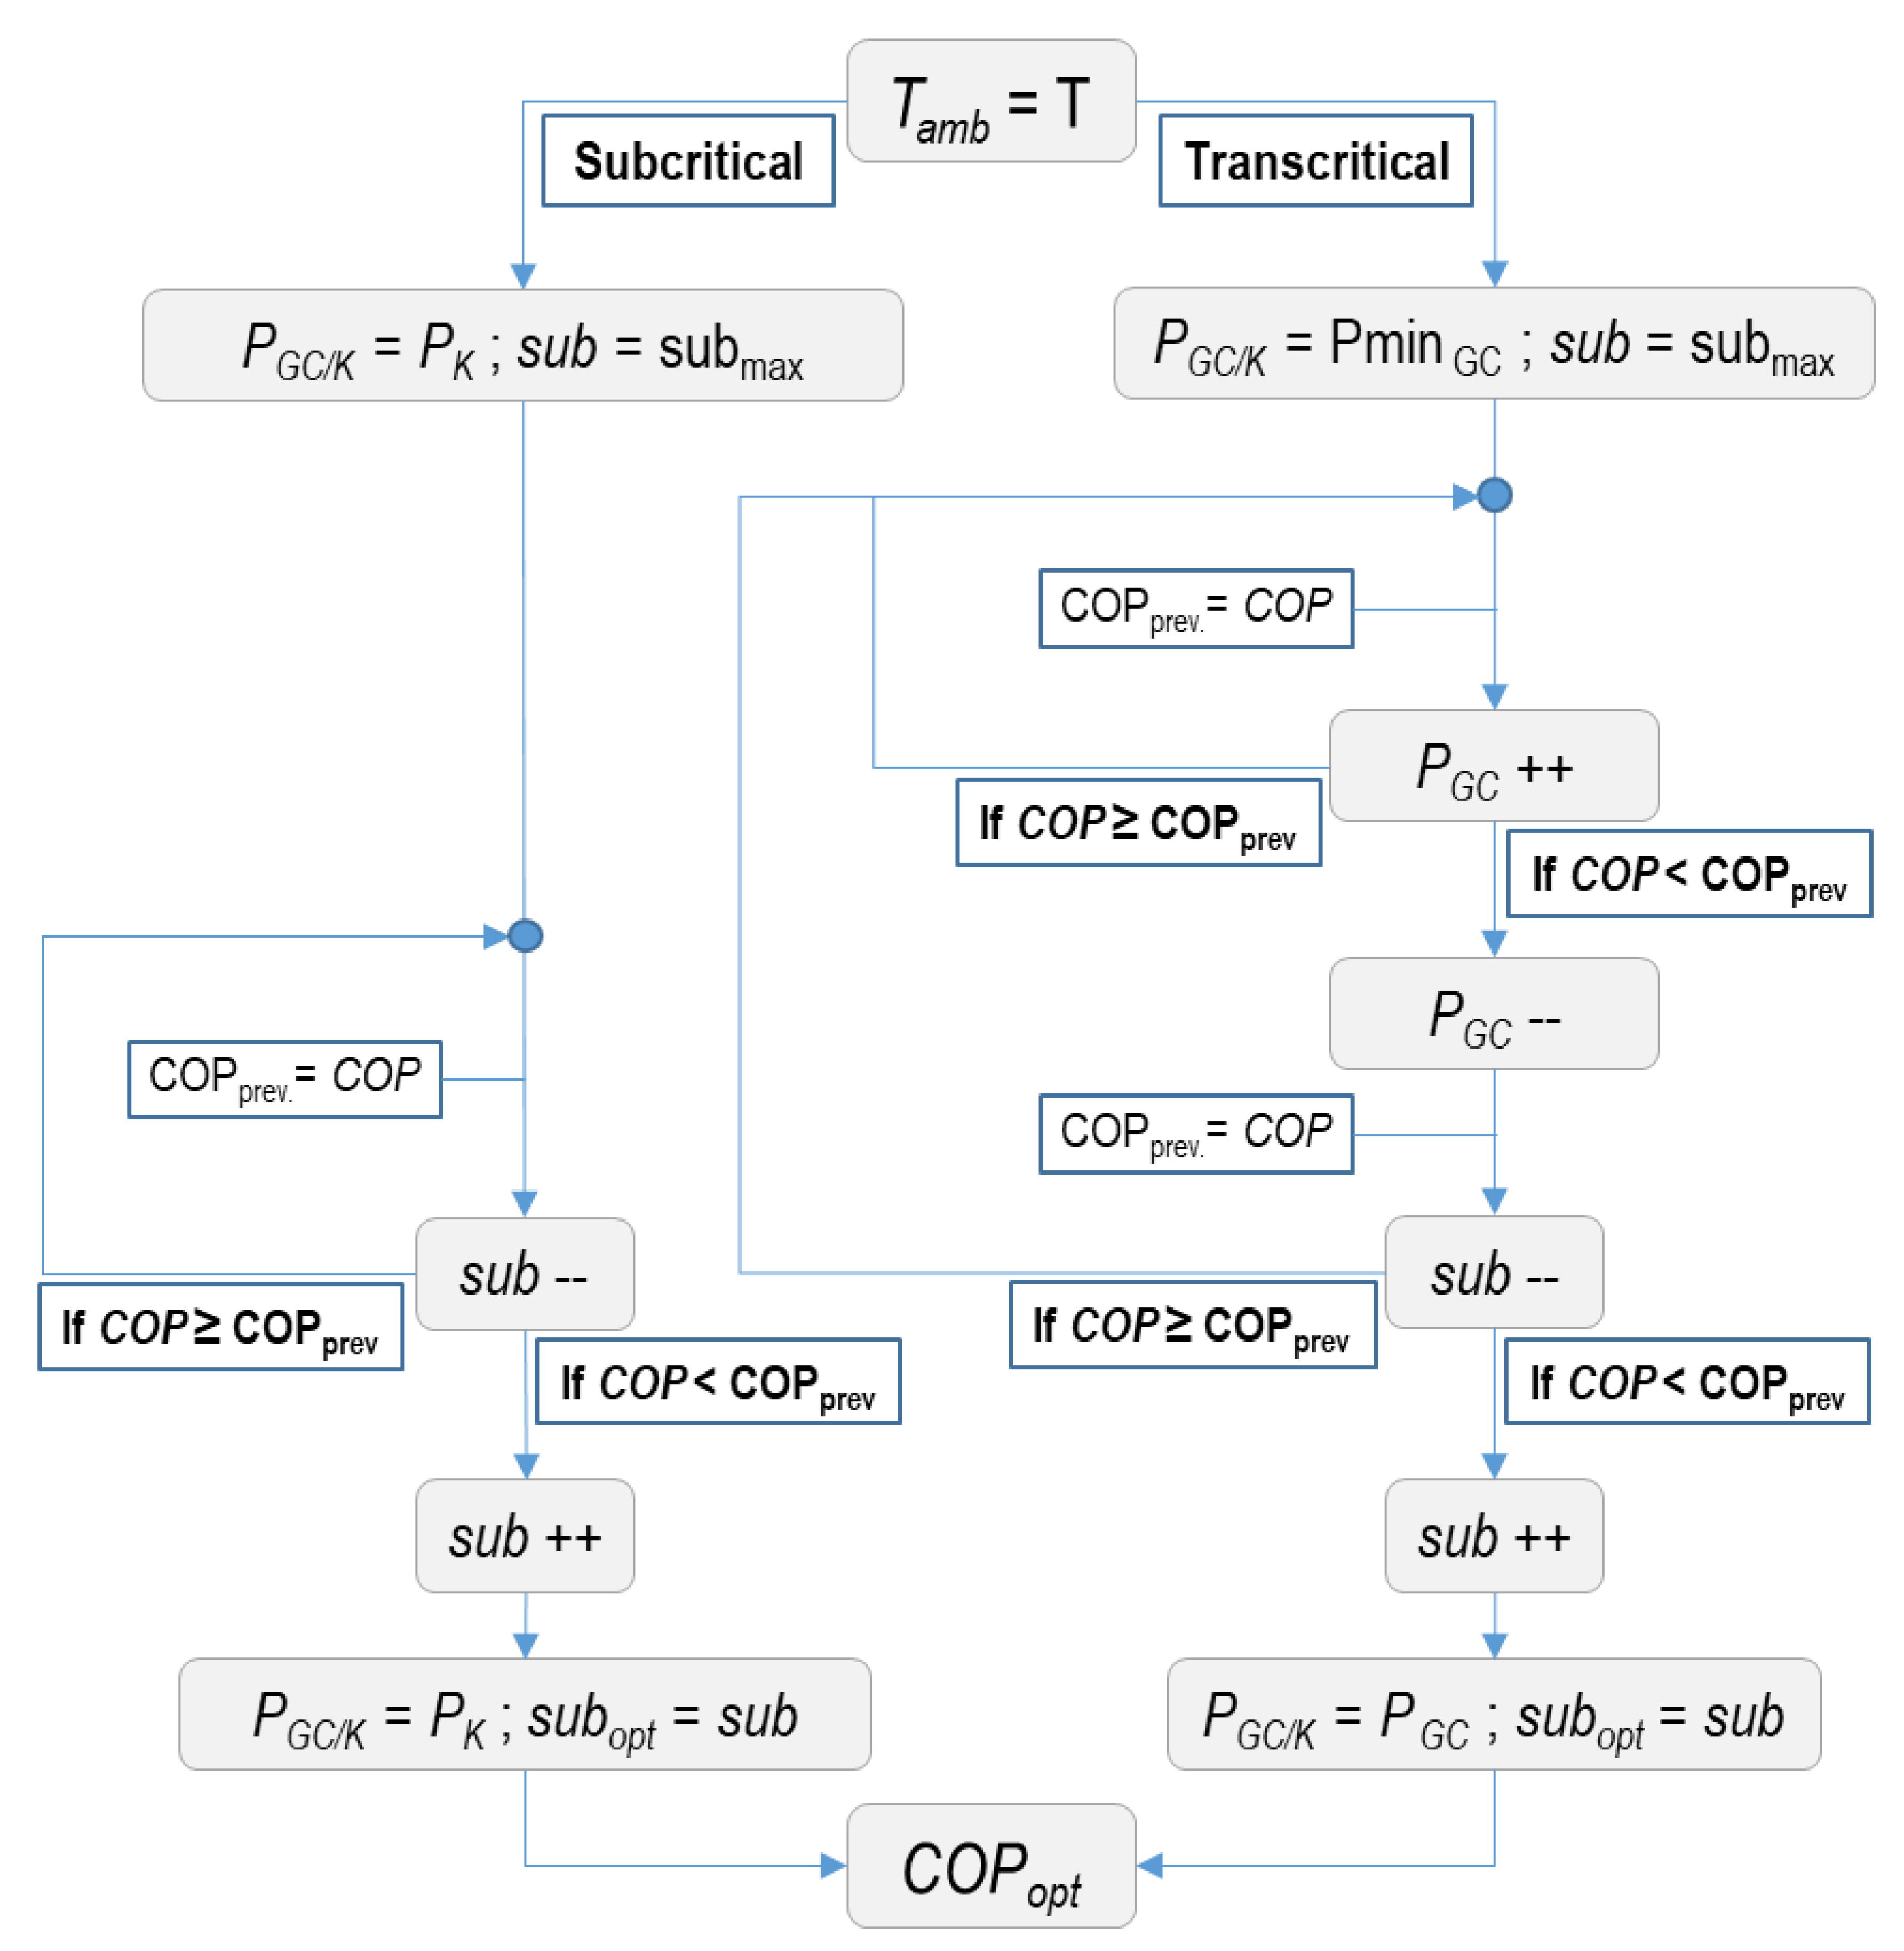
Regarding the Basic Booster with economizer arrangement (BB+EHX), the optimum COP depends not only on the GC pressure, but also on the refrigerant mass flow expanded by the expansion valve (ECOEV) used to produce the subcooling at the EHX; thus, the iteration method (Figure 5) is similar to the previous one but adding another iteration to obtain the optimum subcooling.
Hence, two iterative tested loops have been used in this arrangement. The first one determines the optimal heat GC/K pressure, while the second one is focused on determining the optimal subcooling degree which is achieved by varying the mass flow rate expanded by the ECOEV. The subcooling degree is changing in steps of 0.1 K (sub ++, sub −−).
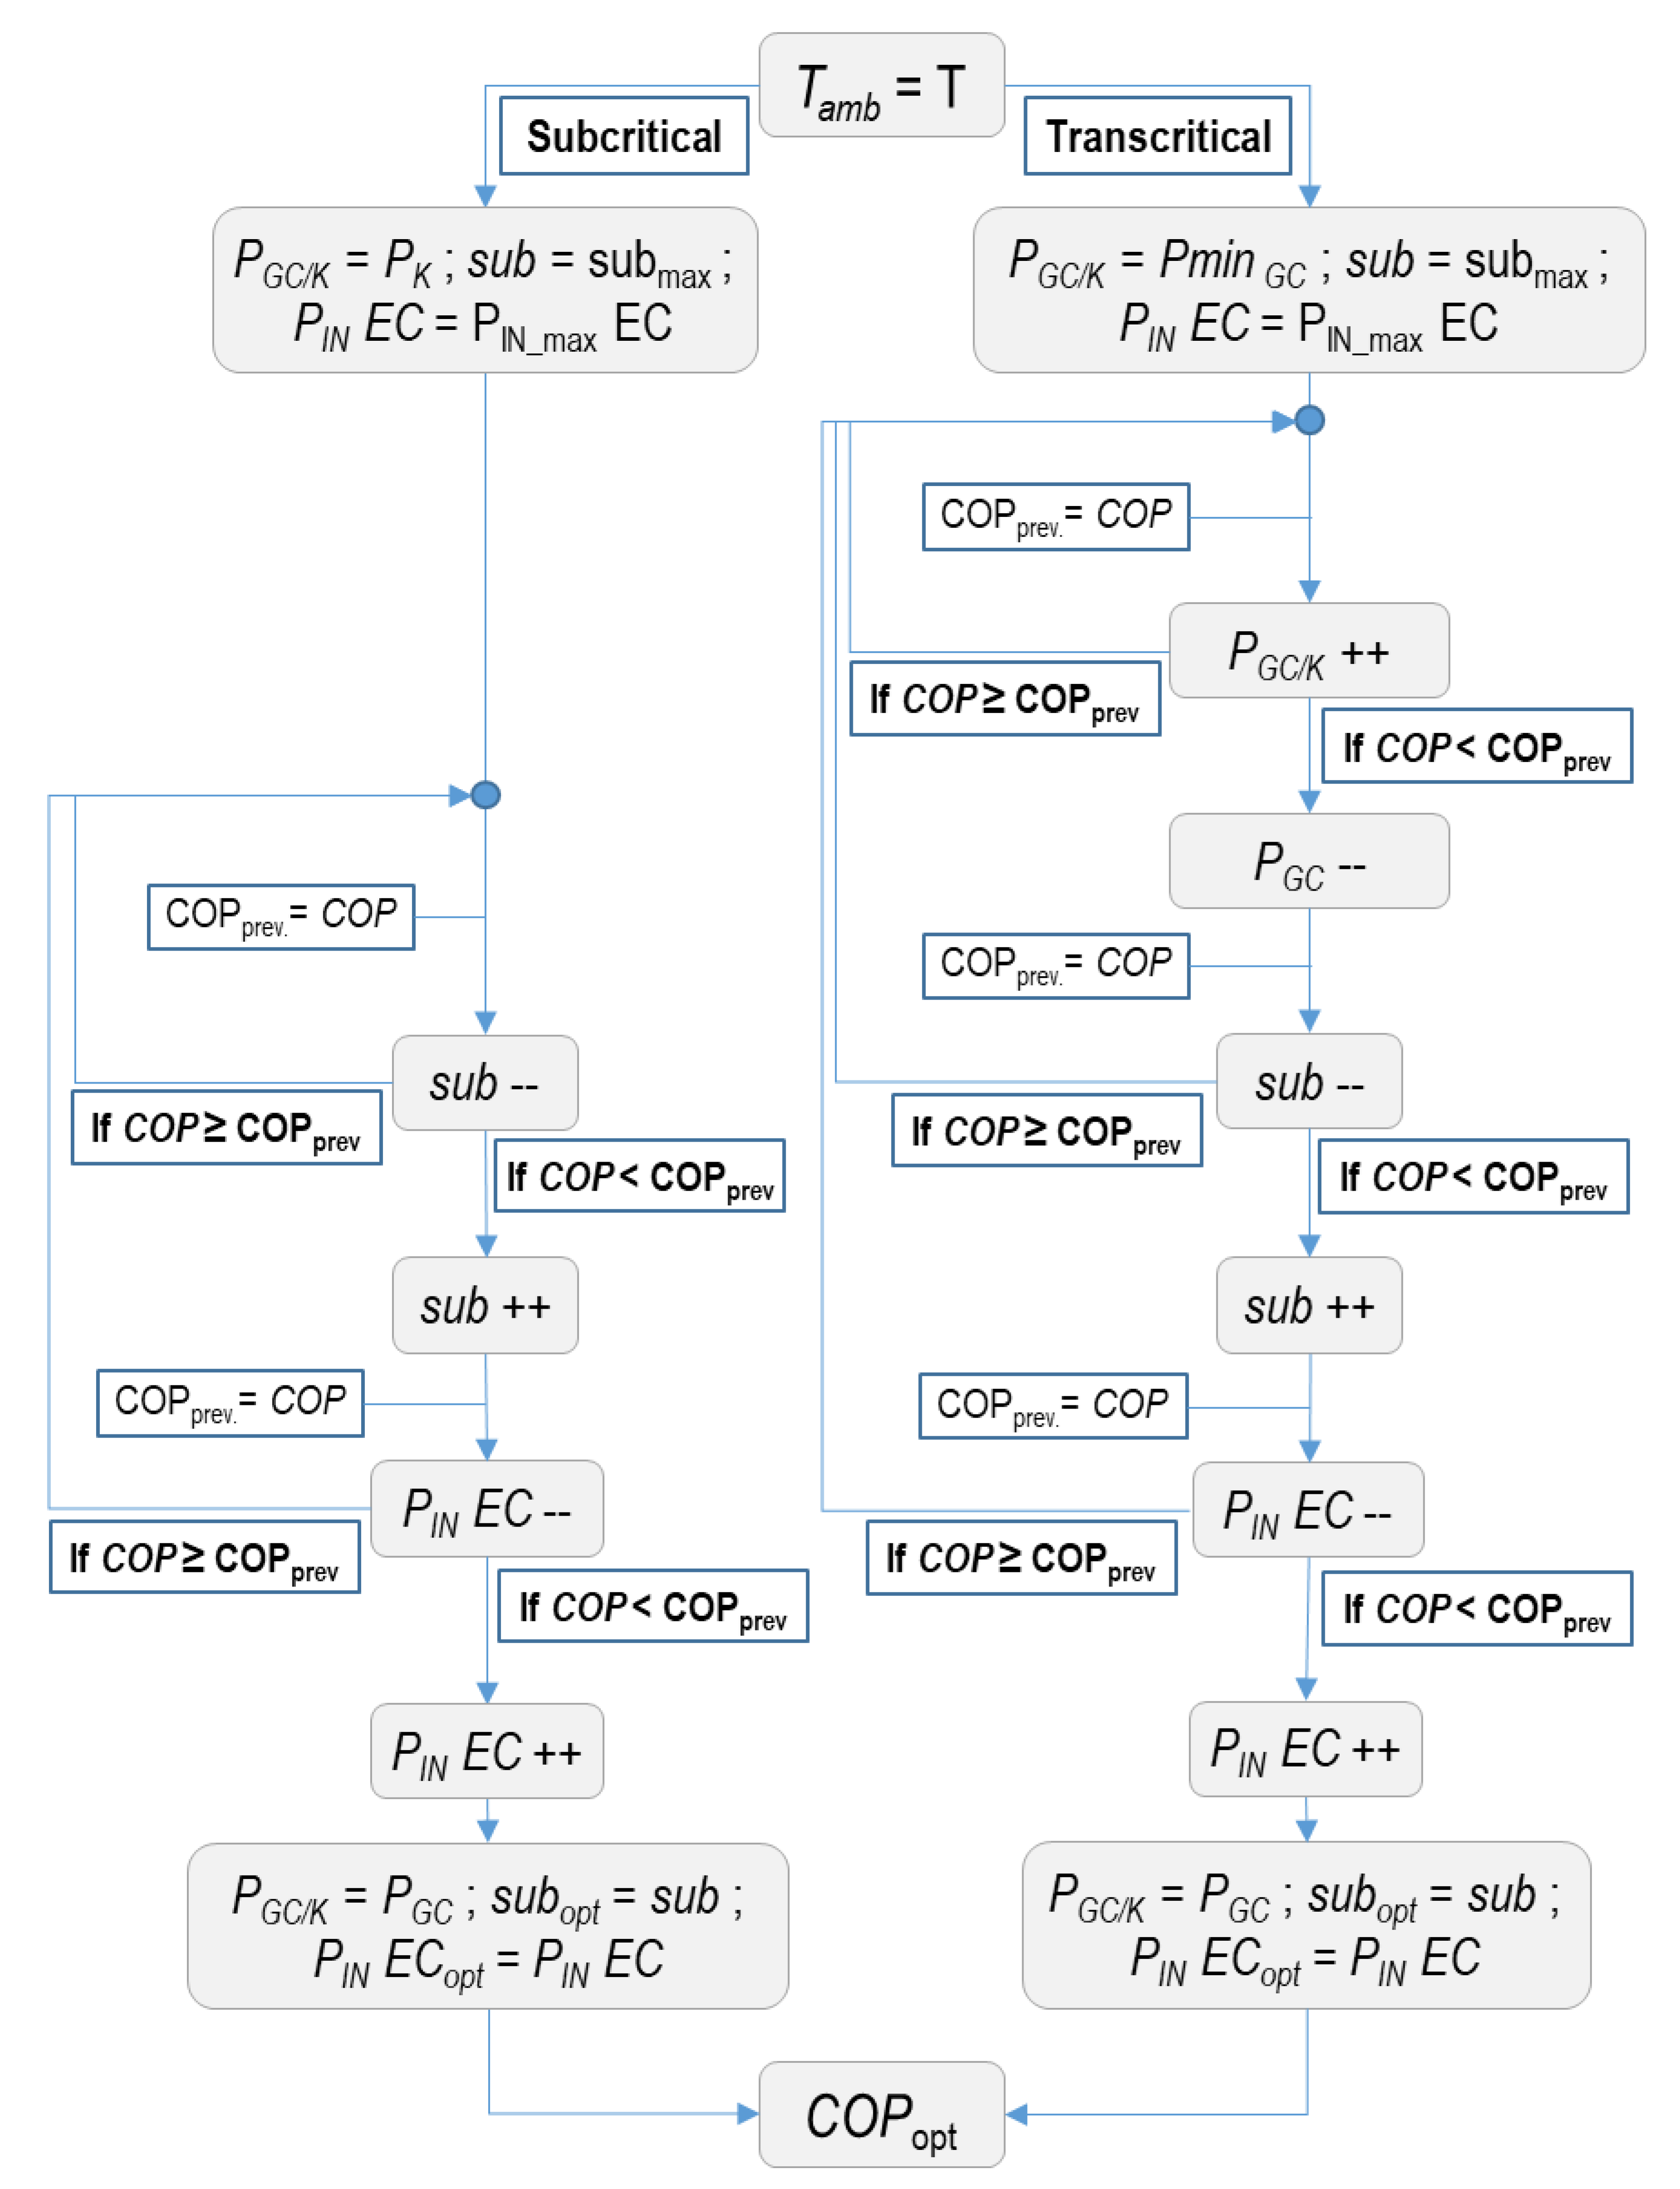
Finally, the last configuration (BB+IMS) introduces an additional compressor (EC) to act over the refrigerant evaporated in the EHX. The presence of this component means that the inlet pressure of the EC needs to be controlled by the computational model (Figure 6) in order to obtain the maximum COP of the facility. Taking into account the restrictions explained in Section 3, the maximum value for this pressure is 55 bar, and the minimum one must ensure a minimum pressure ratio of 1.5 in the EC. Accordingly, an extra iterative loop has been programmed acting over the previous programmed loops. Similar to the previous method, the optimum subcooling degree depends on the GC/K pressure and the mass flow rate but, in this case, it also depends on the suction pressure of the additional compressors (PIN EC).
5. Results and Discussion
In this section, the computational model results are presented and discussed in a wide range of ambient temperatures from 0 to 40 °C. The results are used to determine the annual energy consumption in different European cities in order to justify which is the best configuration.
5.1. Operating Modes
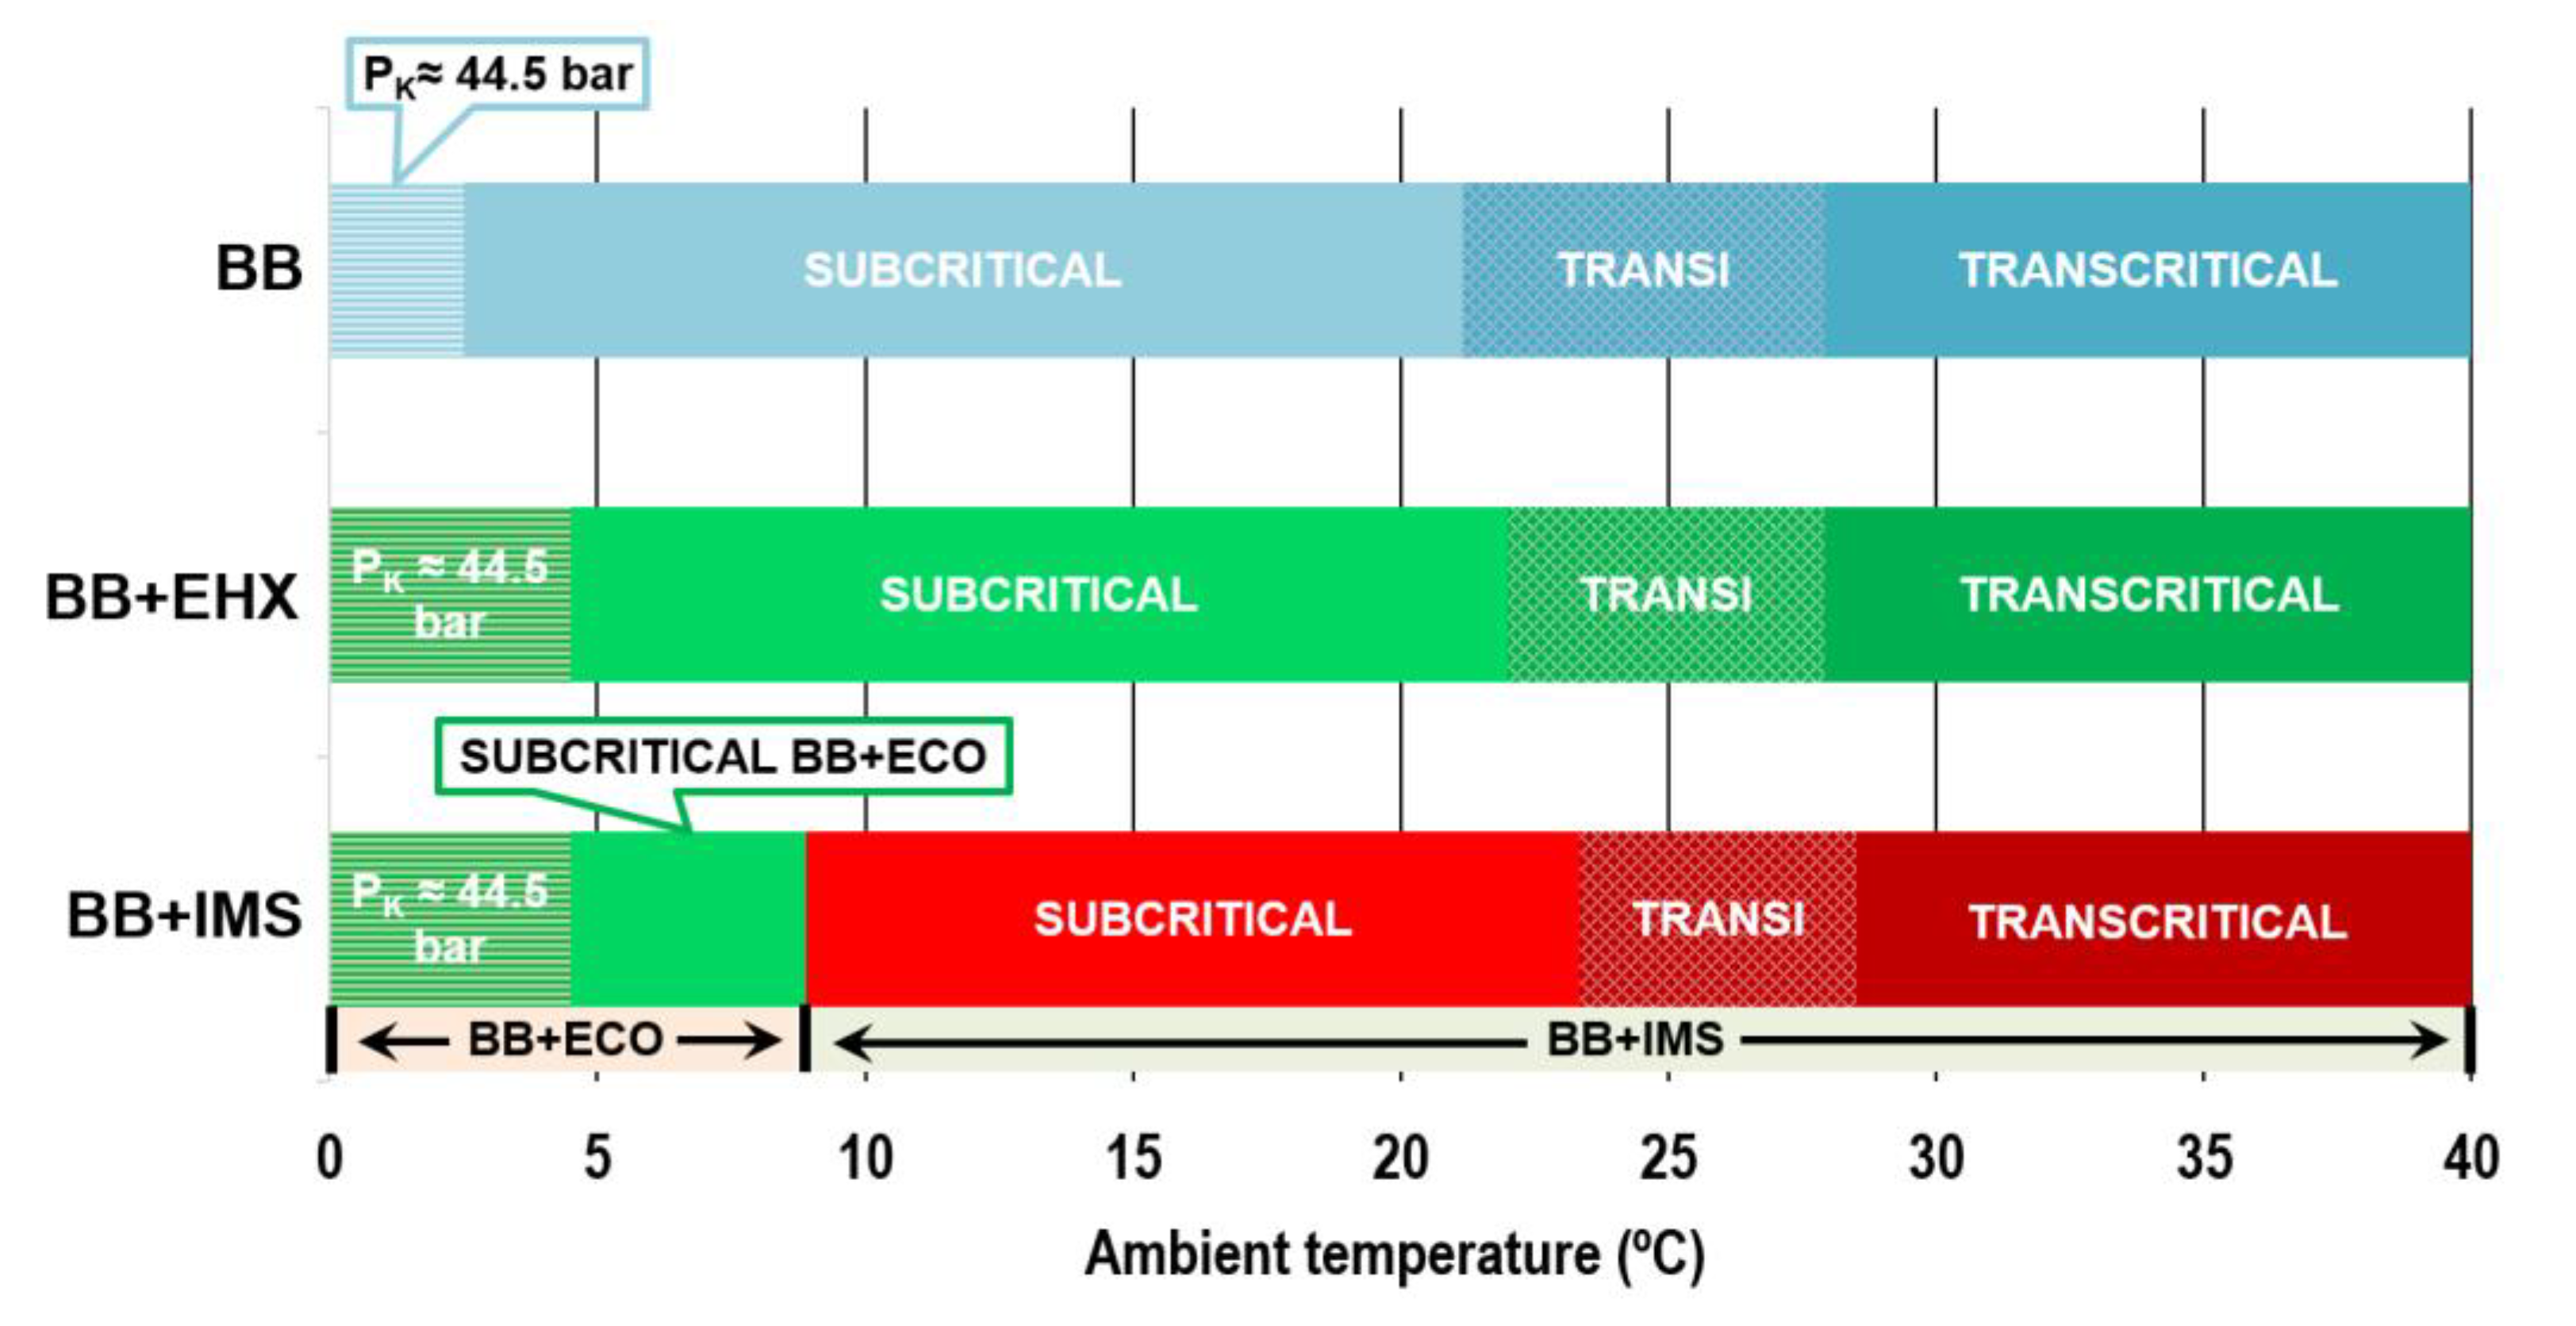
Taking into account the restrictions summarized in Section 3 and the best-performing conditions of the systems, Figure 7 presents the operation modes of each configuration according to the ambient temperature.
It must be highlighted that in each arrangement at least three operative modes can be achieved: transcritical operation, subcritical operation, and transition mode, which corresponds to the change from transcritical to subcritical and vice versa.
For the Basic Booster system (BB), the transcritical operating mode is achieved for ambient temperatures above 27.9 °C, while subcritical is recommended for below 21.2 °C. The range from 27.9 °C to 21.2 °C corresponds to the transition zone where the pressure is reduced progressively from 73.75 °C bar to the corresponding condensing one for 21.2 °C. It is important to outline that floating condensing is limited from 21.2 °C to 2.5 °C in subcritical operation. For ambient temperatures below 2.5 °C, the system is forced to keep the same condensing pressure in order to ensure a minimum compression ratio of 1.5 in the MTC rack.
Regarding the configuration with economizer (BB+EHX), the temperature limits vary only for the subcritical operating mode. Thus, the floating condensing is limited from 22 °C to 4.5 °C, while the transient zone is delimited from 27.9 °C to 22 °C. The presence of the economizer reduces the temperature at the inlet of the expansion device and also the condensing temperature in subcritical conditions. As a consequence, the minimum ambient temperature for floating condensing (when MTC compression rate = 1.5) is higher than the basic cycle.
Finally, the inclusion of an additional compressor in the system (BB+IMS) modifies not only the subcritical limits but also the transcritical ones. Thus, this system works in transcritical operation for ambient temperatures above 28.5 °C and in subcriticial operation from 23.4 °C to 8.9 °C. Below 8.9 °C, the BB+EHX configuration is preferred because it works more efficiently.
5.2. Compressors Sizing and Operation
As described in Section 3, each compression stage has a compressor with variable frequency drive (VFD) to achieve the desired volumetric displacement without abrupt changes. Figure 8, Figure 9 and Figure 10 present the volumetric displacement of the compressors used for each configuration.
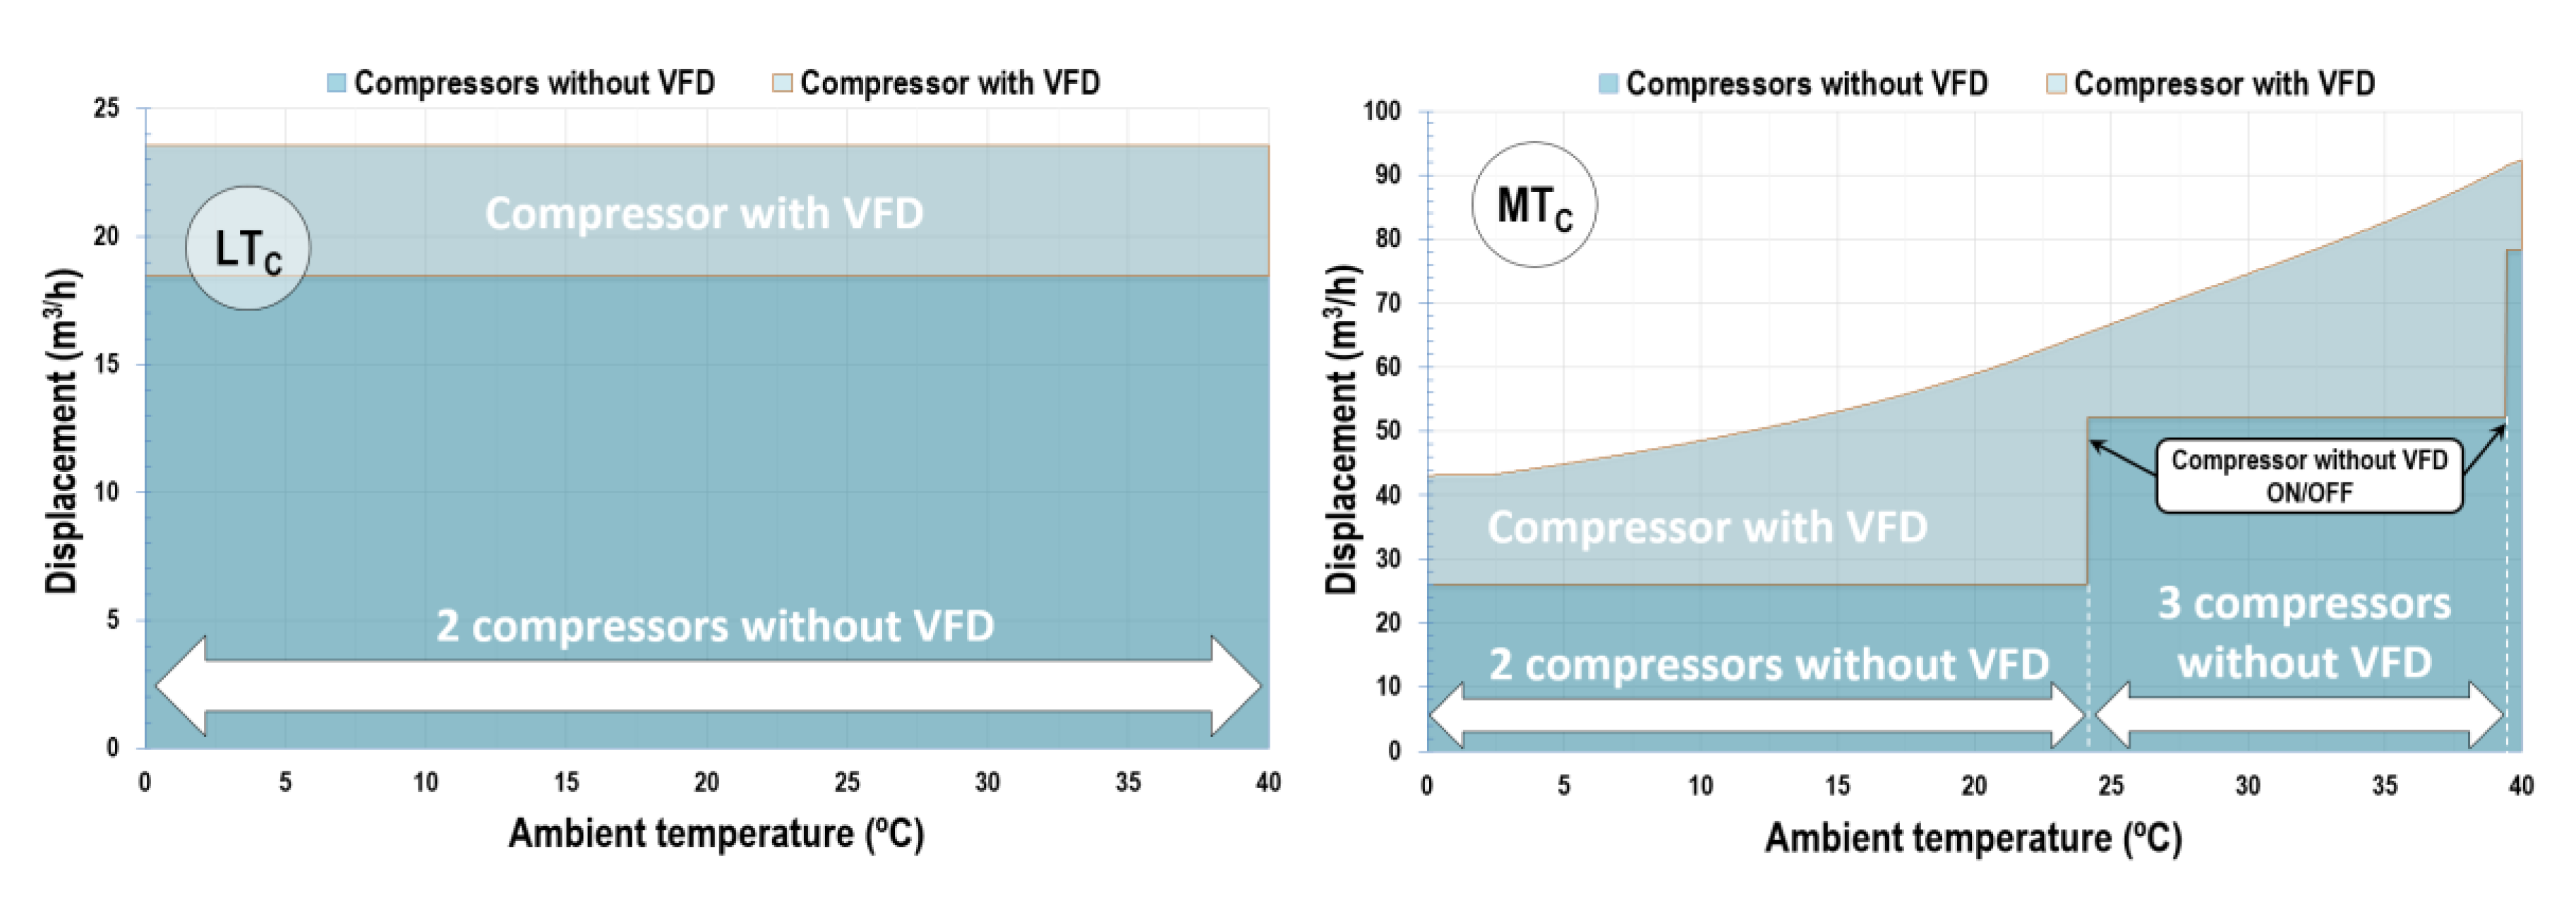
Figure 8 refers to the BB configuration. The LT stage uses two compressors with a displacement of 9.22 m3/h at their nominal frequency (without VFD at 50 Hz) and one compressor with VFD operating with a displacement of 5.1 m3/h at about 32 Hz. These compressors have the same operation for all the heat rejection conditions, since the pressure of the receiver is kept constant at 35 bar. That means a constant cooling capacity in LTO as well as the mass flow rate.
Regarding the medium temperature compressors (MTC), the volumetric requirements of the MTC are not constants. Thus, for ambient temperatures from 0 °C to 24.1 °C, the system operates with one MTC at nominal conditions (26.12 m3/h at 50 Hz) and one compressor with VFD operating from 16.95 to 39.18 m3/h (38.3–75 Hz). When the ambient temperature ranges between 24.1 °C and 39.4 °C, another compressor at its nominal conditions is switched on, and the compressor with VFD reduces its frequency to 25 Hz (13.06 m3/h). Finally, for ambient temperatures above 39.4 °C, a fourth compressor without VFD is switched on.
Figure 9 shows the displacement of the low and medium-temperature compressors of the BB+EHX system. This system cools the refrigerant after the GC/K, and the pressure of the receiver changes depending on the subcooling degree in the EHX. The optimal subcooling allows the receiver pressure to be close to the previous system (35 bar) for all ambient temperature. So, the graphs of Figure 9 are quite similar to Figure 8. The main difference is depicted in the temperature limits that are stated at 23.6 °C and 37.75 °C.
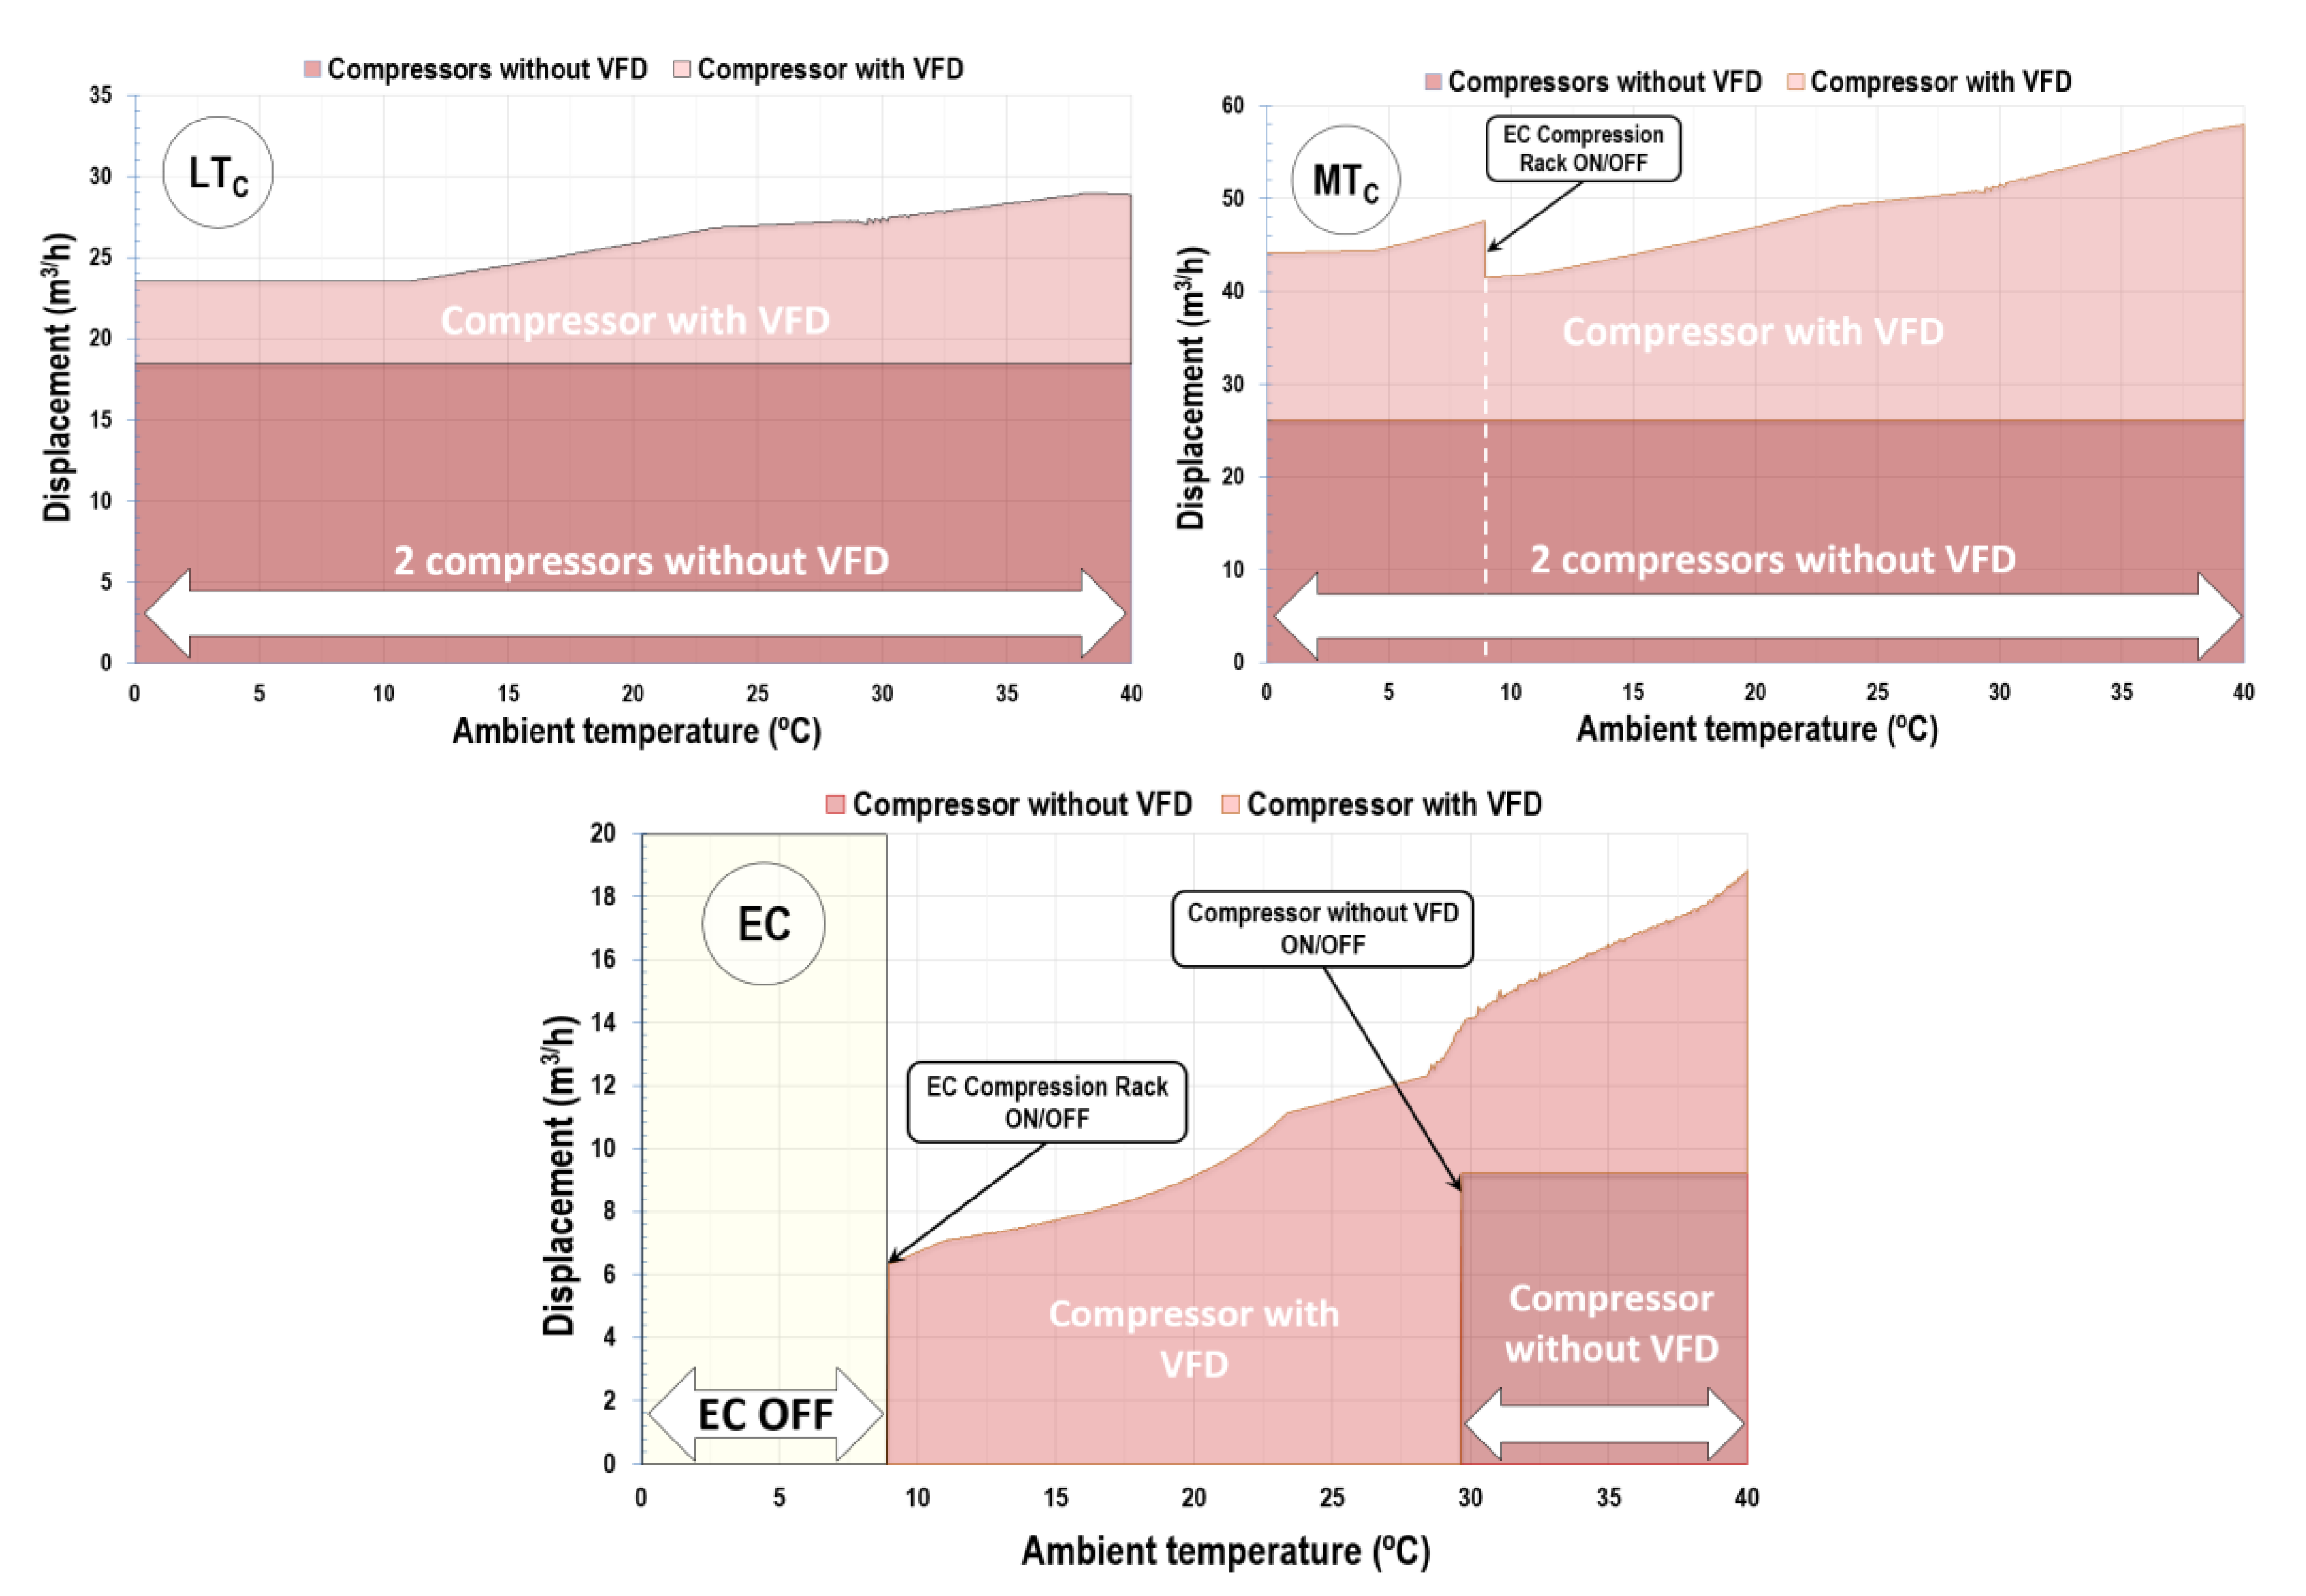
Figure 10 shows the volumetric displacement of the compressors for BB+IMS. In this case, the system works slightly different than the previous ones. For LTC, the system works with three compressors: two at their nominal frequency and one with VFD. In this case, the compressor with VFD keeps its frequency constant from 0 to 11 °C because the receiver optimum pressure remains constant at 35 bar. However, for above ambient temperature, this compressor changes its frequency from 32 to 56.9 Hz (5.1–10.5 m3/h) due to the variation of the pressure in the liquid receiver (Figure 11).
For MTC, the system works with one compressor at its nominal frequency and one with VFD for all the rejection temperatures analyzed. In this case, the displacement of the MTC rack has been significantly reduced compared to previous systems. For ambient temperatures below 8.9 °C, the system works as BB+EHX due to the better energy efficiency (EC is switched off). For ambient temperatures above (8.9–40 °C), the system works as BB+IMS. In this range of temperatures, the compressor with VFD changes its frequency from 29.2 °C to 60.7 Hz (15.3 m3/h to 31.8 m3/h).
Finally, the EC rack operates from 8.9 °C to 29.5 °C with a VFD compressor running from 34.6 Hz to 75 Hz (6.3–13.6 m3/h) and from 29.5 °C with an additional compressor running at nominal conditions.
Focusing on the medium-temperature compressor rack (MTc), which is the one that most affects the efficiency of a CO2 booster facility (they are the most energy-consuming compressors), it can be seen from the above figures that the introduction of the EHX without additional compression does not reduce the displacement needed in the MTc; however, the reduction of the volumetric displacement required in MTc, with the introduction of the EHX with additional compression, is drastically reduced (over 37%), at the cost of a reduced increase in the volumetric displacement of the additional compression stage.
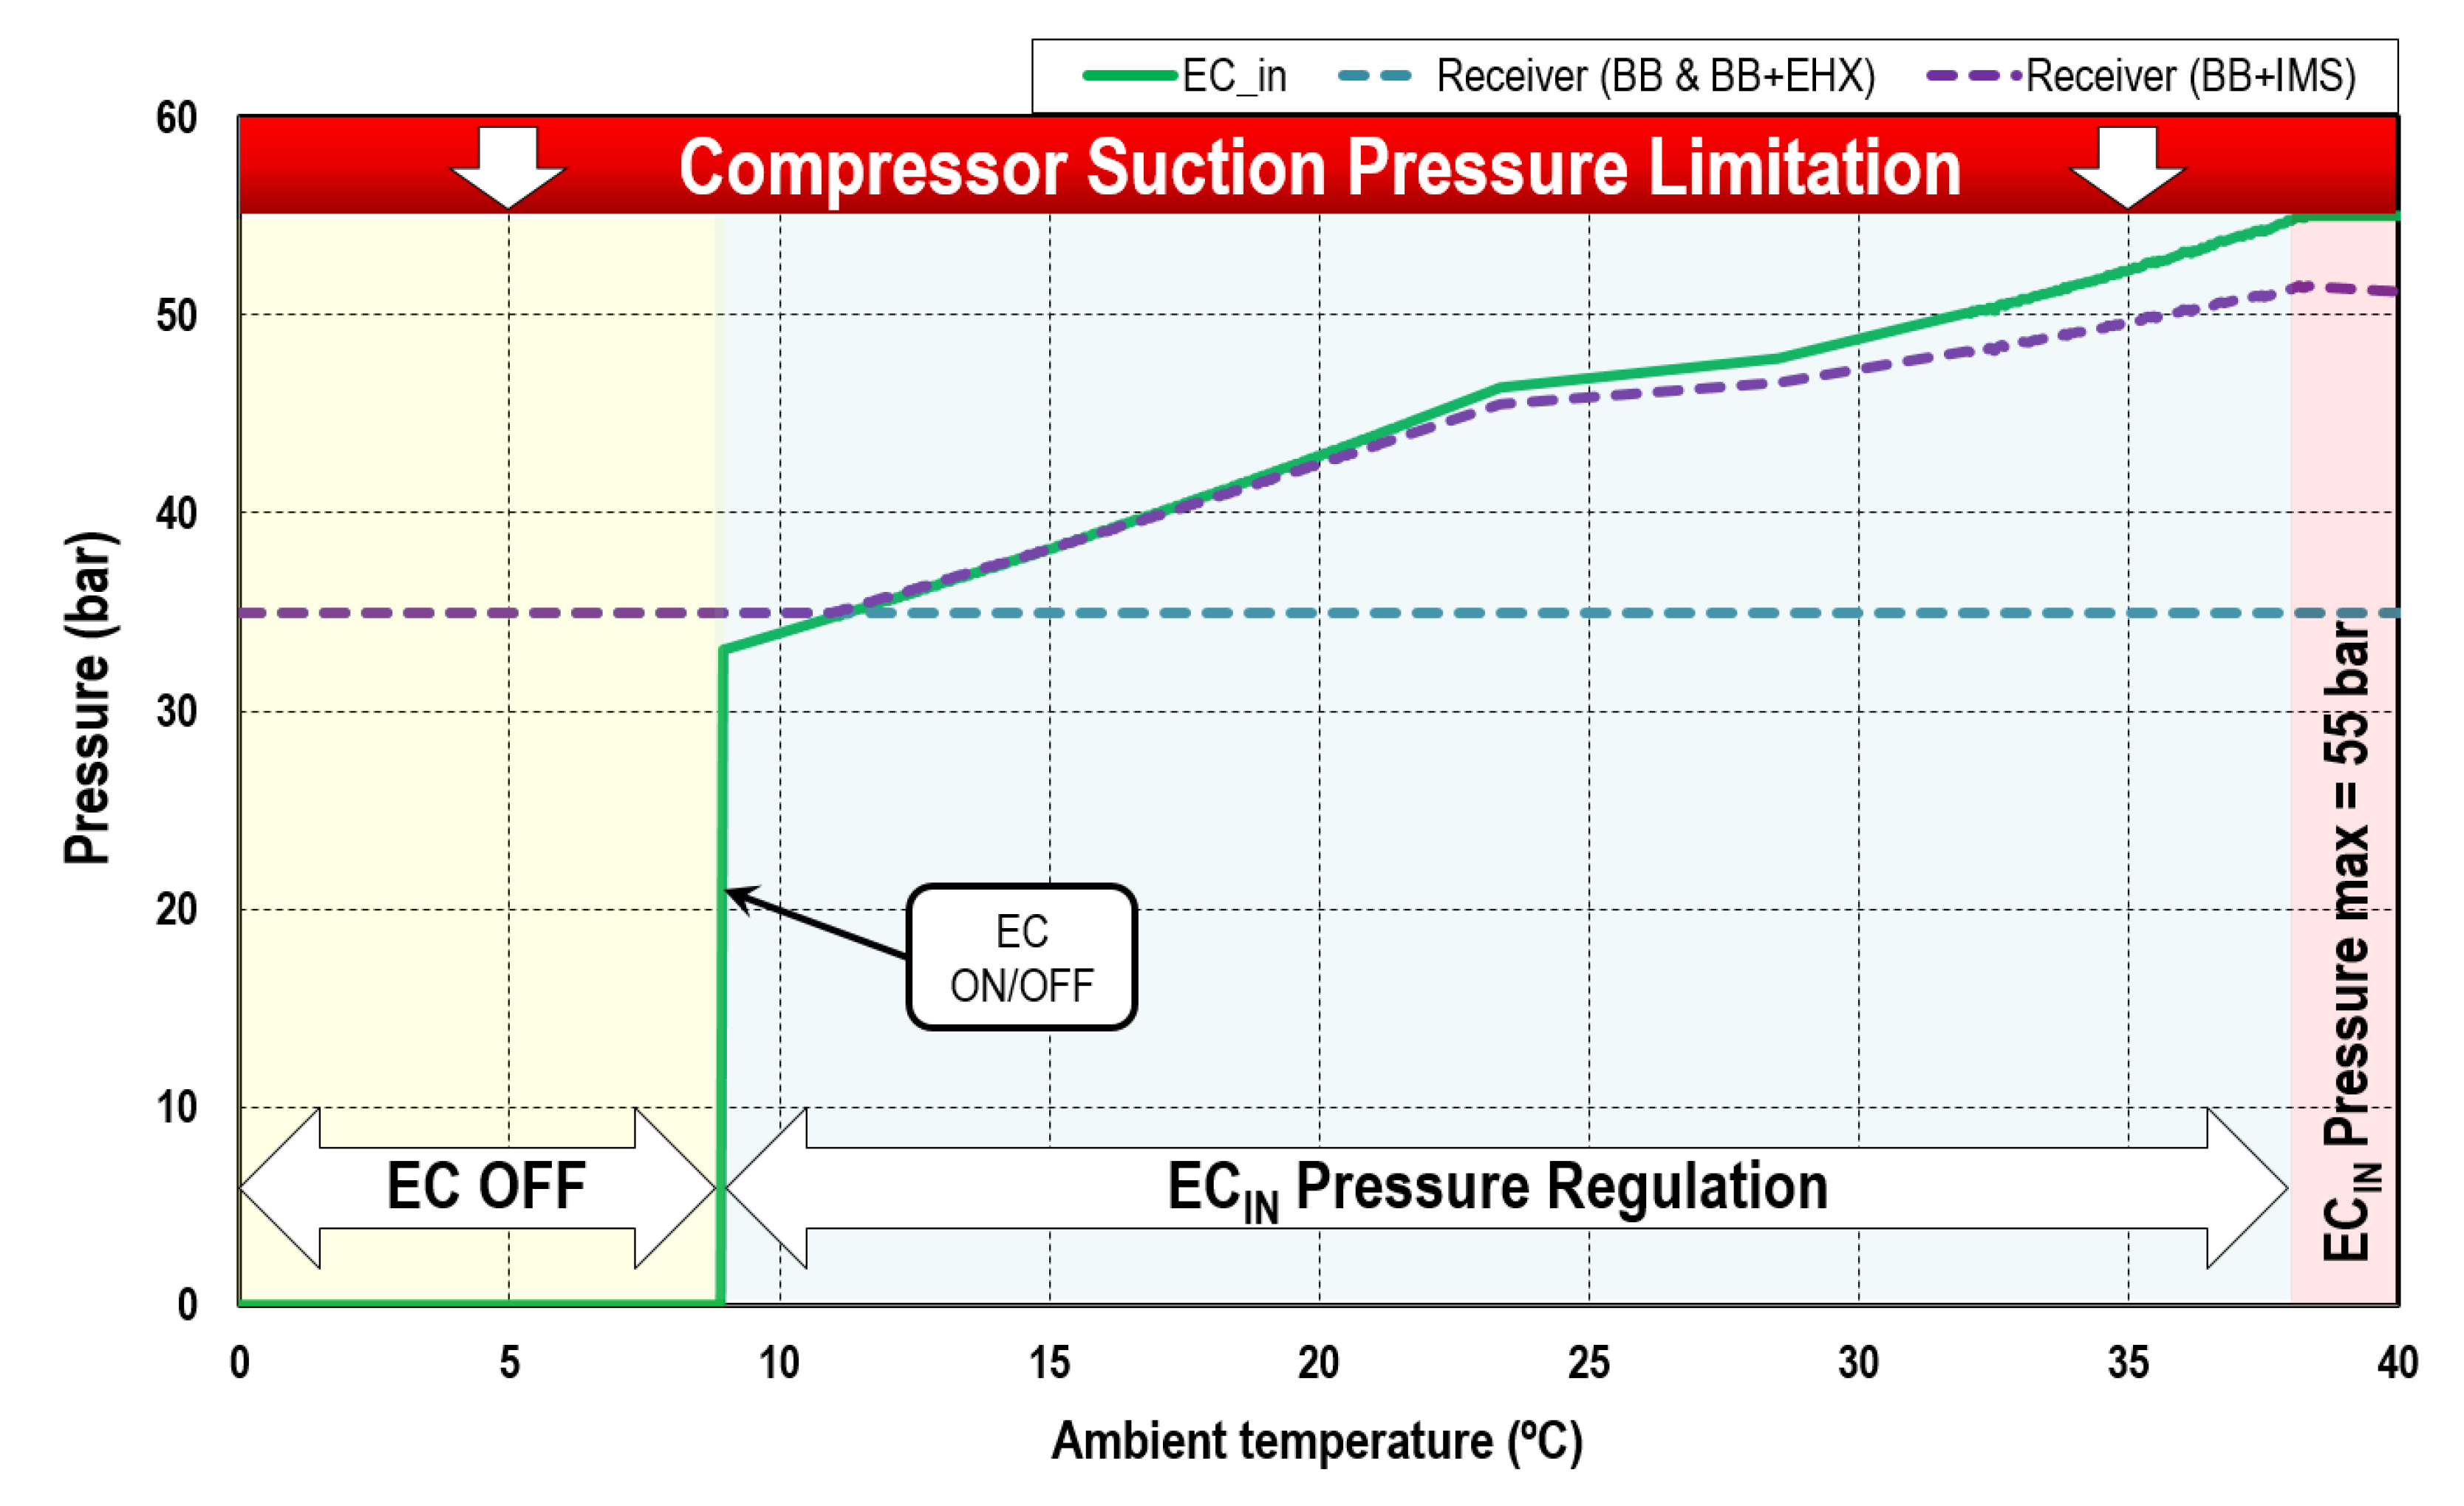
5.3. Optimal EC Suction Pressure
To achieve the higher COP at the BB+IMS system, the suction pressure of the EC compressors has been optimized. This value is related with the subcooling degree at the economizer. Figure 11 shows the variation of the suction pressure with the ambient temperature taking into account the restrictions considered in Section 3. Accordingly, three different operation zones can be identified. For temperatures higher than 38.2 °C, the suction pressure is kept at 55 bar, which is the maximum value recommended by the compressor’s manufacturer. From 38.2 °C to 8.9 °C, the suction pressure proportionally decreases to 33.1 bar with ambient temperature and a slight change in the transition from transcritical to subcritical (23.4–28.5 °C). Finally, below 8.9 °C, it is not worth using the EC compressors, since their use penalizes the refrigeration facility’s COP (Section 5.6).
5.4. EHX Operation
This section discusses the different parameters related to the EHX, such as the subcooling degree, heat load, and efficiency.
5.4.1. Subcooling Degree
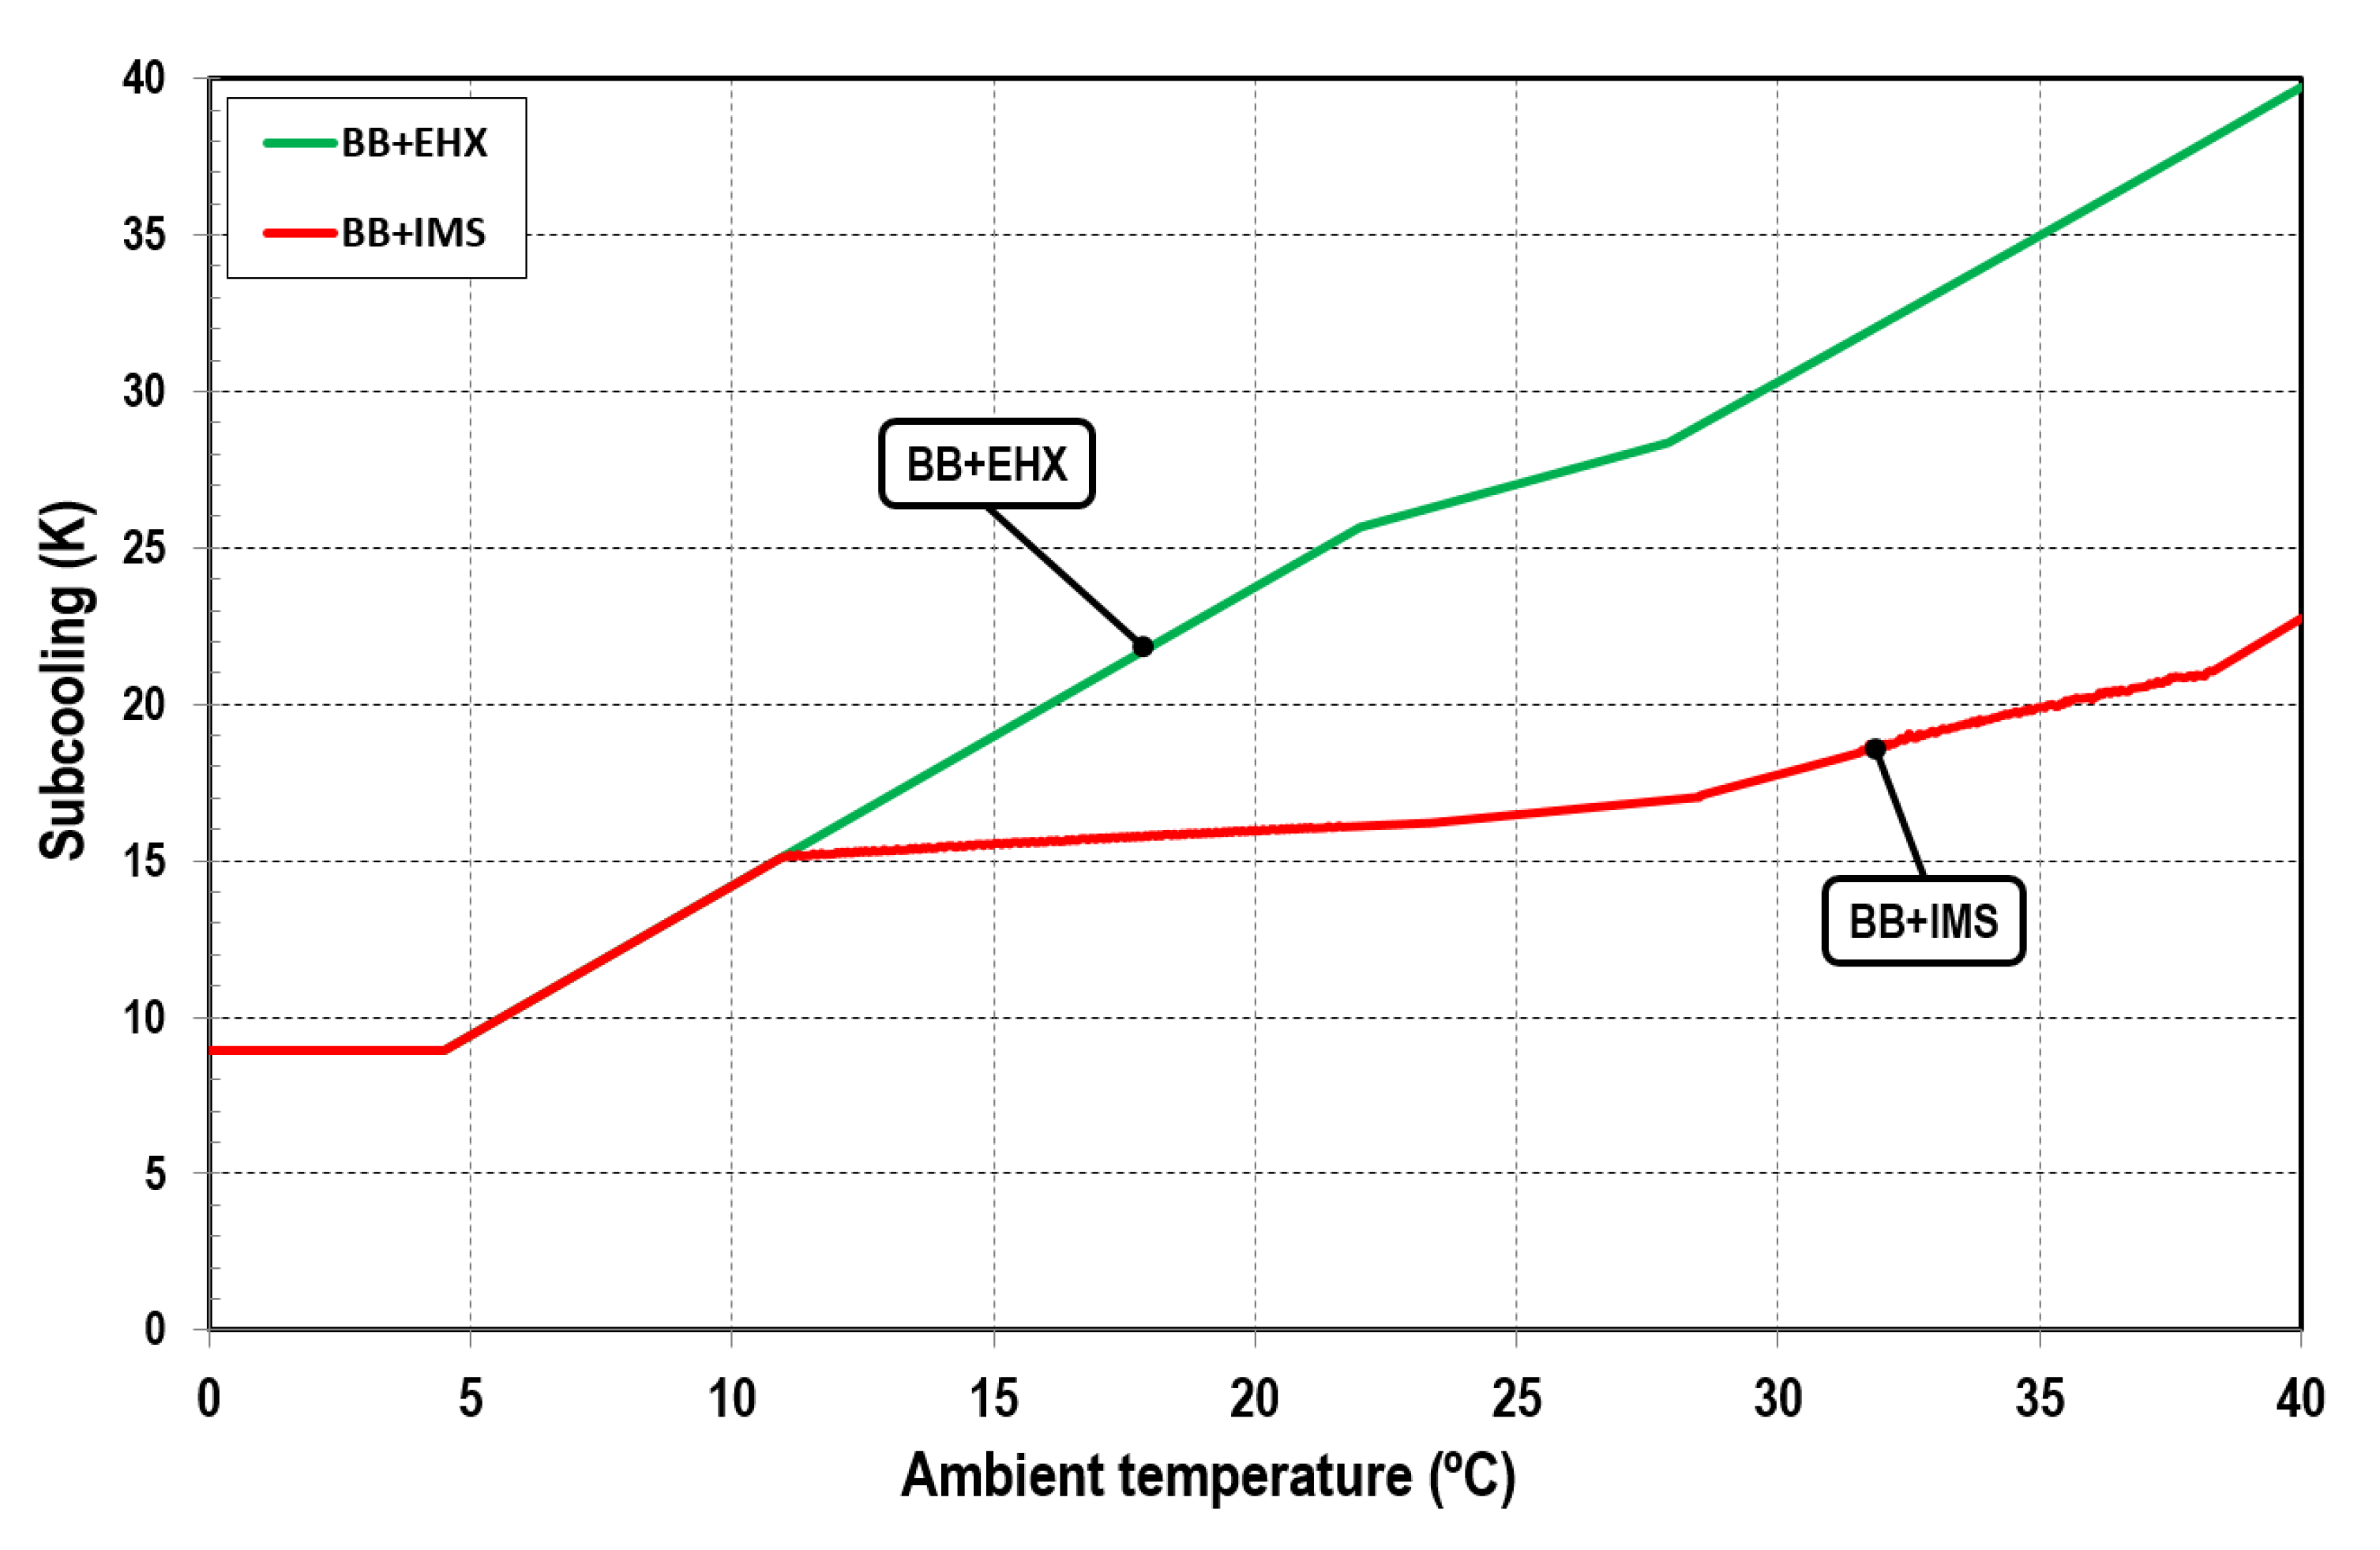
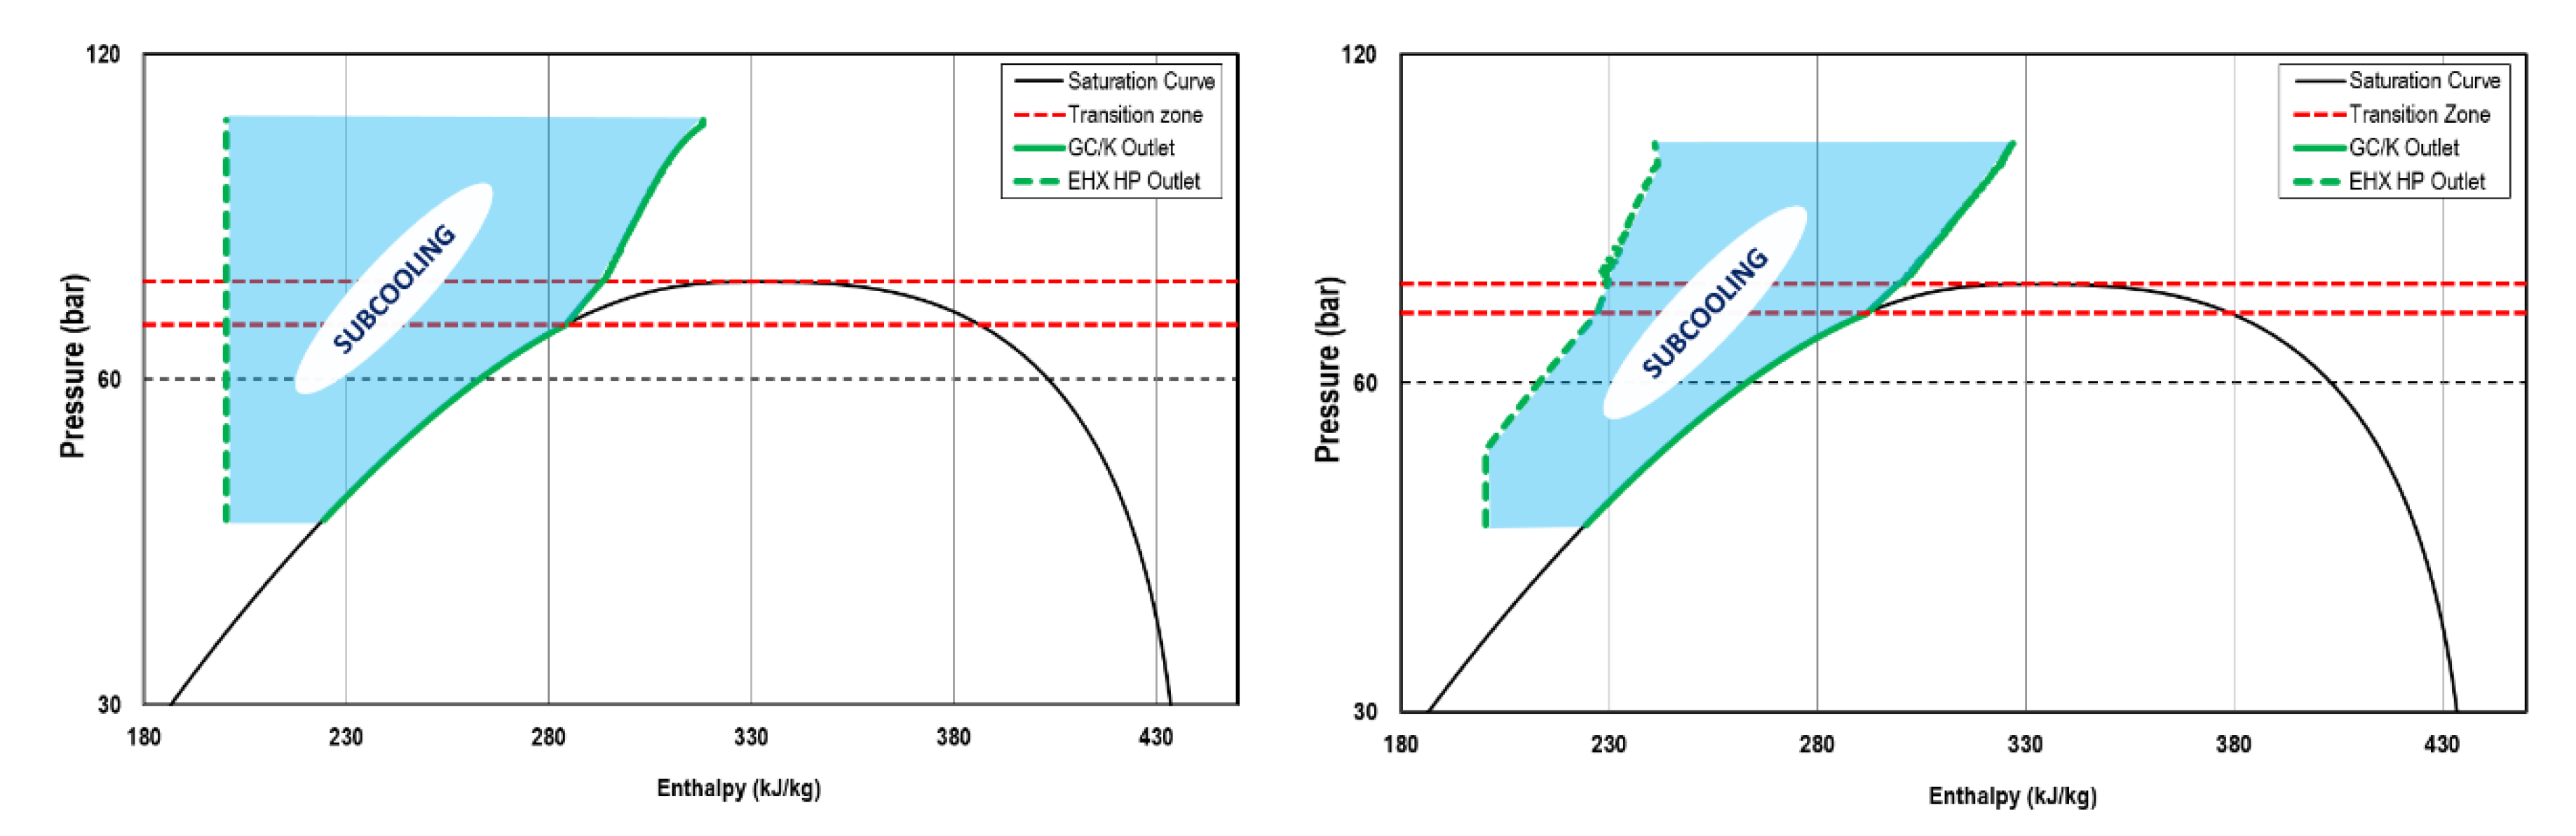
As was stated in Section 4, there is an optimal subcooling degree that maximizes the COP of the refrigeration facility [18]. The subcooling degree has been varied from 0 K to a maximum value that ensures a liquid receiver pressure above 35 bar or a minimum enthalpy of about 200 kJ/kg (hsat_liq at 35 bar). The results from model are depicted in Figure 12 and Figure 13. Figure 12 shows the subcooling degree versus the ambient temperature for the two economizer arrangements, while Figure 13 graphically shows the subcooling area depending on the configuration adopted.
The degree of subcooling is related to the heat rejection pressure, the suction pressure of the additional compressors EC (refrigerant evaporating pressure in the EHX), the refrigerant mass flow in the heat rejection line, and the considered superheat in the EHX (low-pressure side in the heat exchanger), so the subcooling applied will depend on the values of the above parameters.
Taking into account Figure 12 and Figure 13, it can be noticed that the optimum subcooling degree always decreases with the ambient temperature, reaching a minimum value of 9 K for ambient temperatures below 4.5 °C. Notwithstanding, depending on the arrangement, this subcooling degree varies significantly (Figure 12). Thus, the inclusion of an extra compressor entails a significant reduction of the required optimum subcooling degree from ambient temperatures higher than 11.3 °C. The maximum difference is reached at 40 °C, where the BB+EHX system needs a subcooling degree of 40 K, while the configuration of BB+IMS only requires 22.5 K. For ambient temperatures below 11.3 °C, both arrangements require the same subcooling degree due to the pressure limitation of the liquid receiver.
As shown in the graphs that relate the EC compression rate with the GC/K pressure (EC suction pressure can be obtained), relating to the COP of the BB+IMS (Figure 16), the suction pressure control of the EC is an important term for maximizing the COP of the BB+IMS system. This can also be seen in Figure 16, which shows the COP variation of the system with the variation of the heat rejection pressure and the compression rate of the EC compressor (it depends on the EC suction pressure).
5.4.2. Load and Efficiency
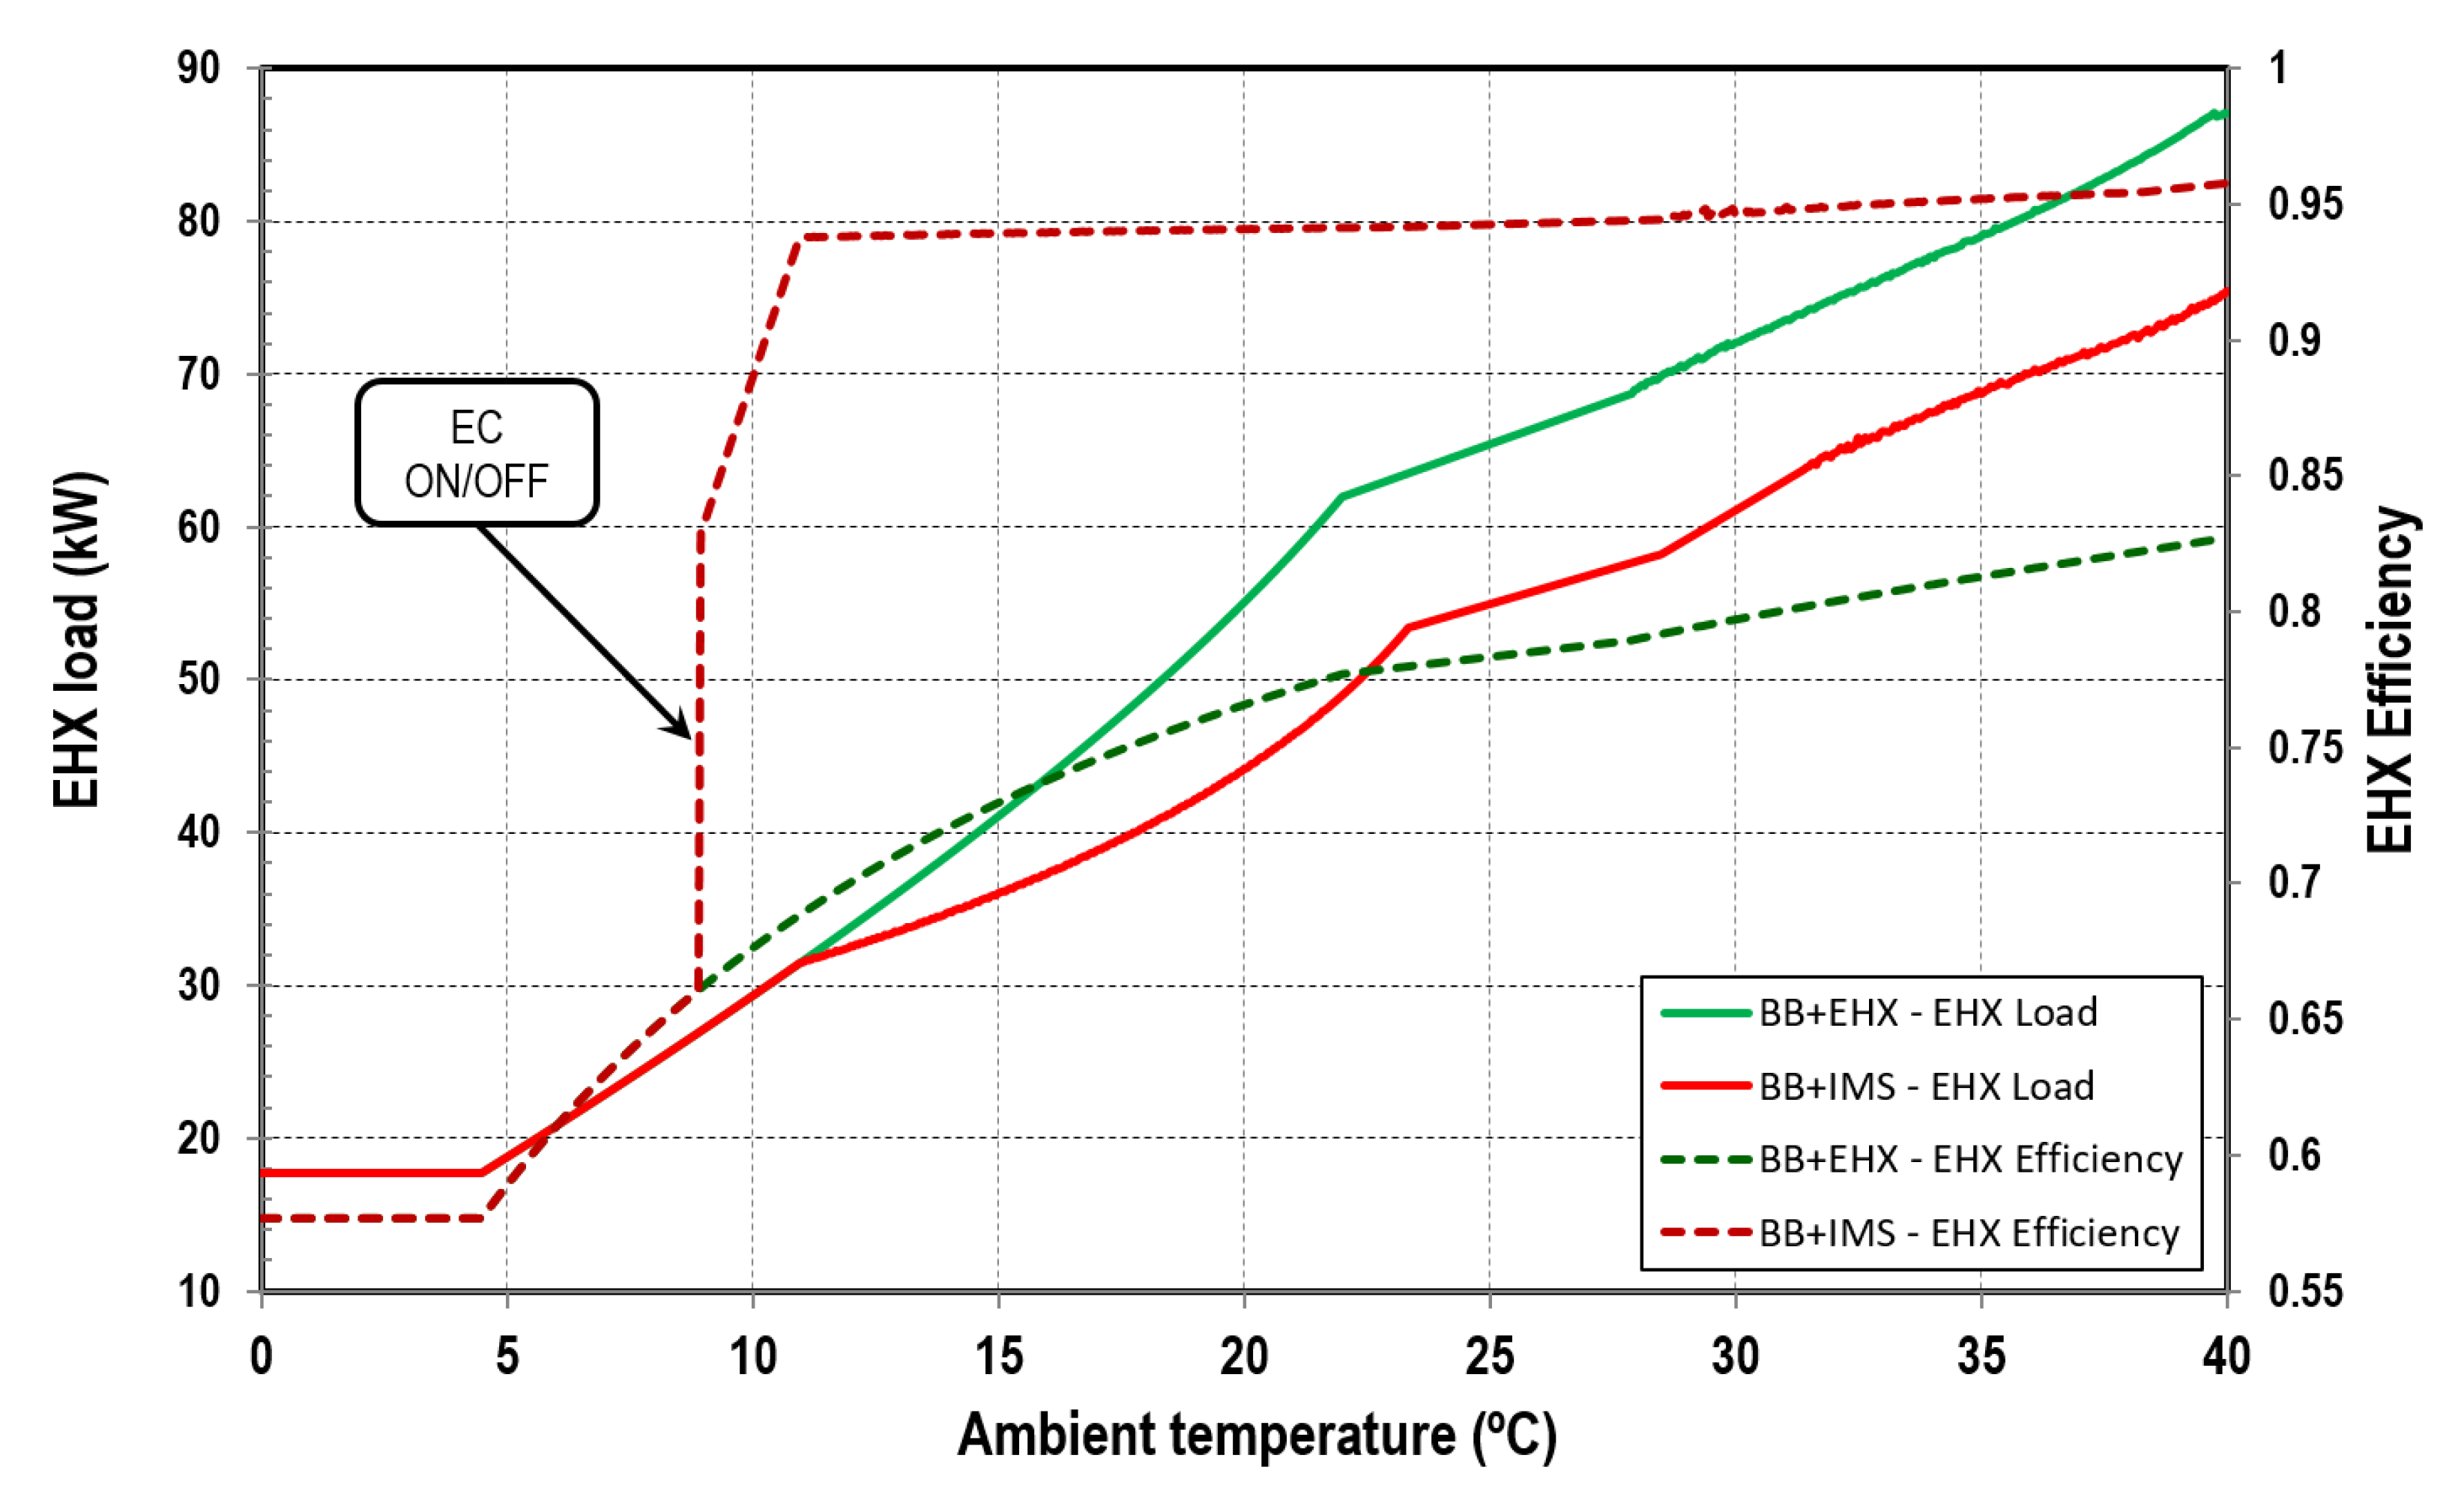
The important variation of temperatures stated in Figure 12 denotes a remarkable variation of the economizer cooling capacity, whose dependence on ambient temperature is depicted in Figure 14.
The heat exchange capacity in the EHX depends mainly on the conditions of the refrigerant at the inlets and outlets, but also on the refrigerant mass flow rate. The refrigerant mass flow expanded to produce subcooling in the EHX changes depending on the required cooling load by controlling the superheat at the output of the EHX. Therefore, this cooling capacity variation is possible by controlling the superheat of the EHX expansion valve in both systems. Accordingly, depending on the location, the heat transfer area of the economizer needed must be adjusted. Additionally, the efficiency achieved in the economizer (EHX) for system with an additional compression stage (BB+IMS) is greater than the system without EC (BB+EHX), which occurs whenever the EC compressors are turned on.
5.5. COP
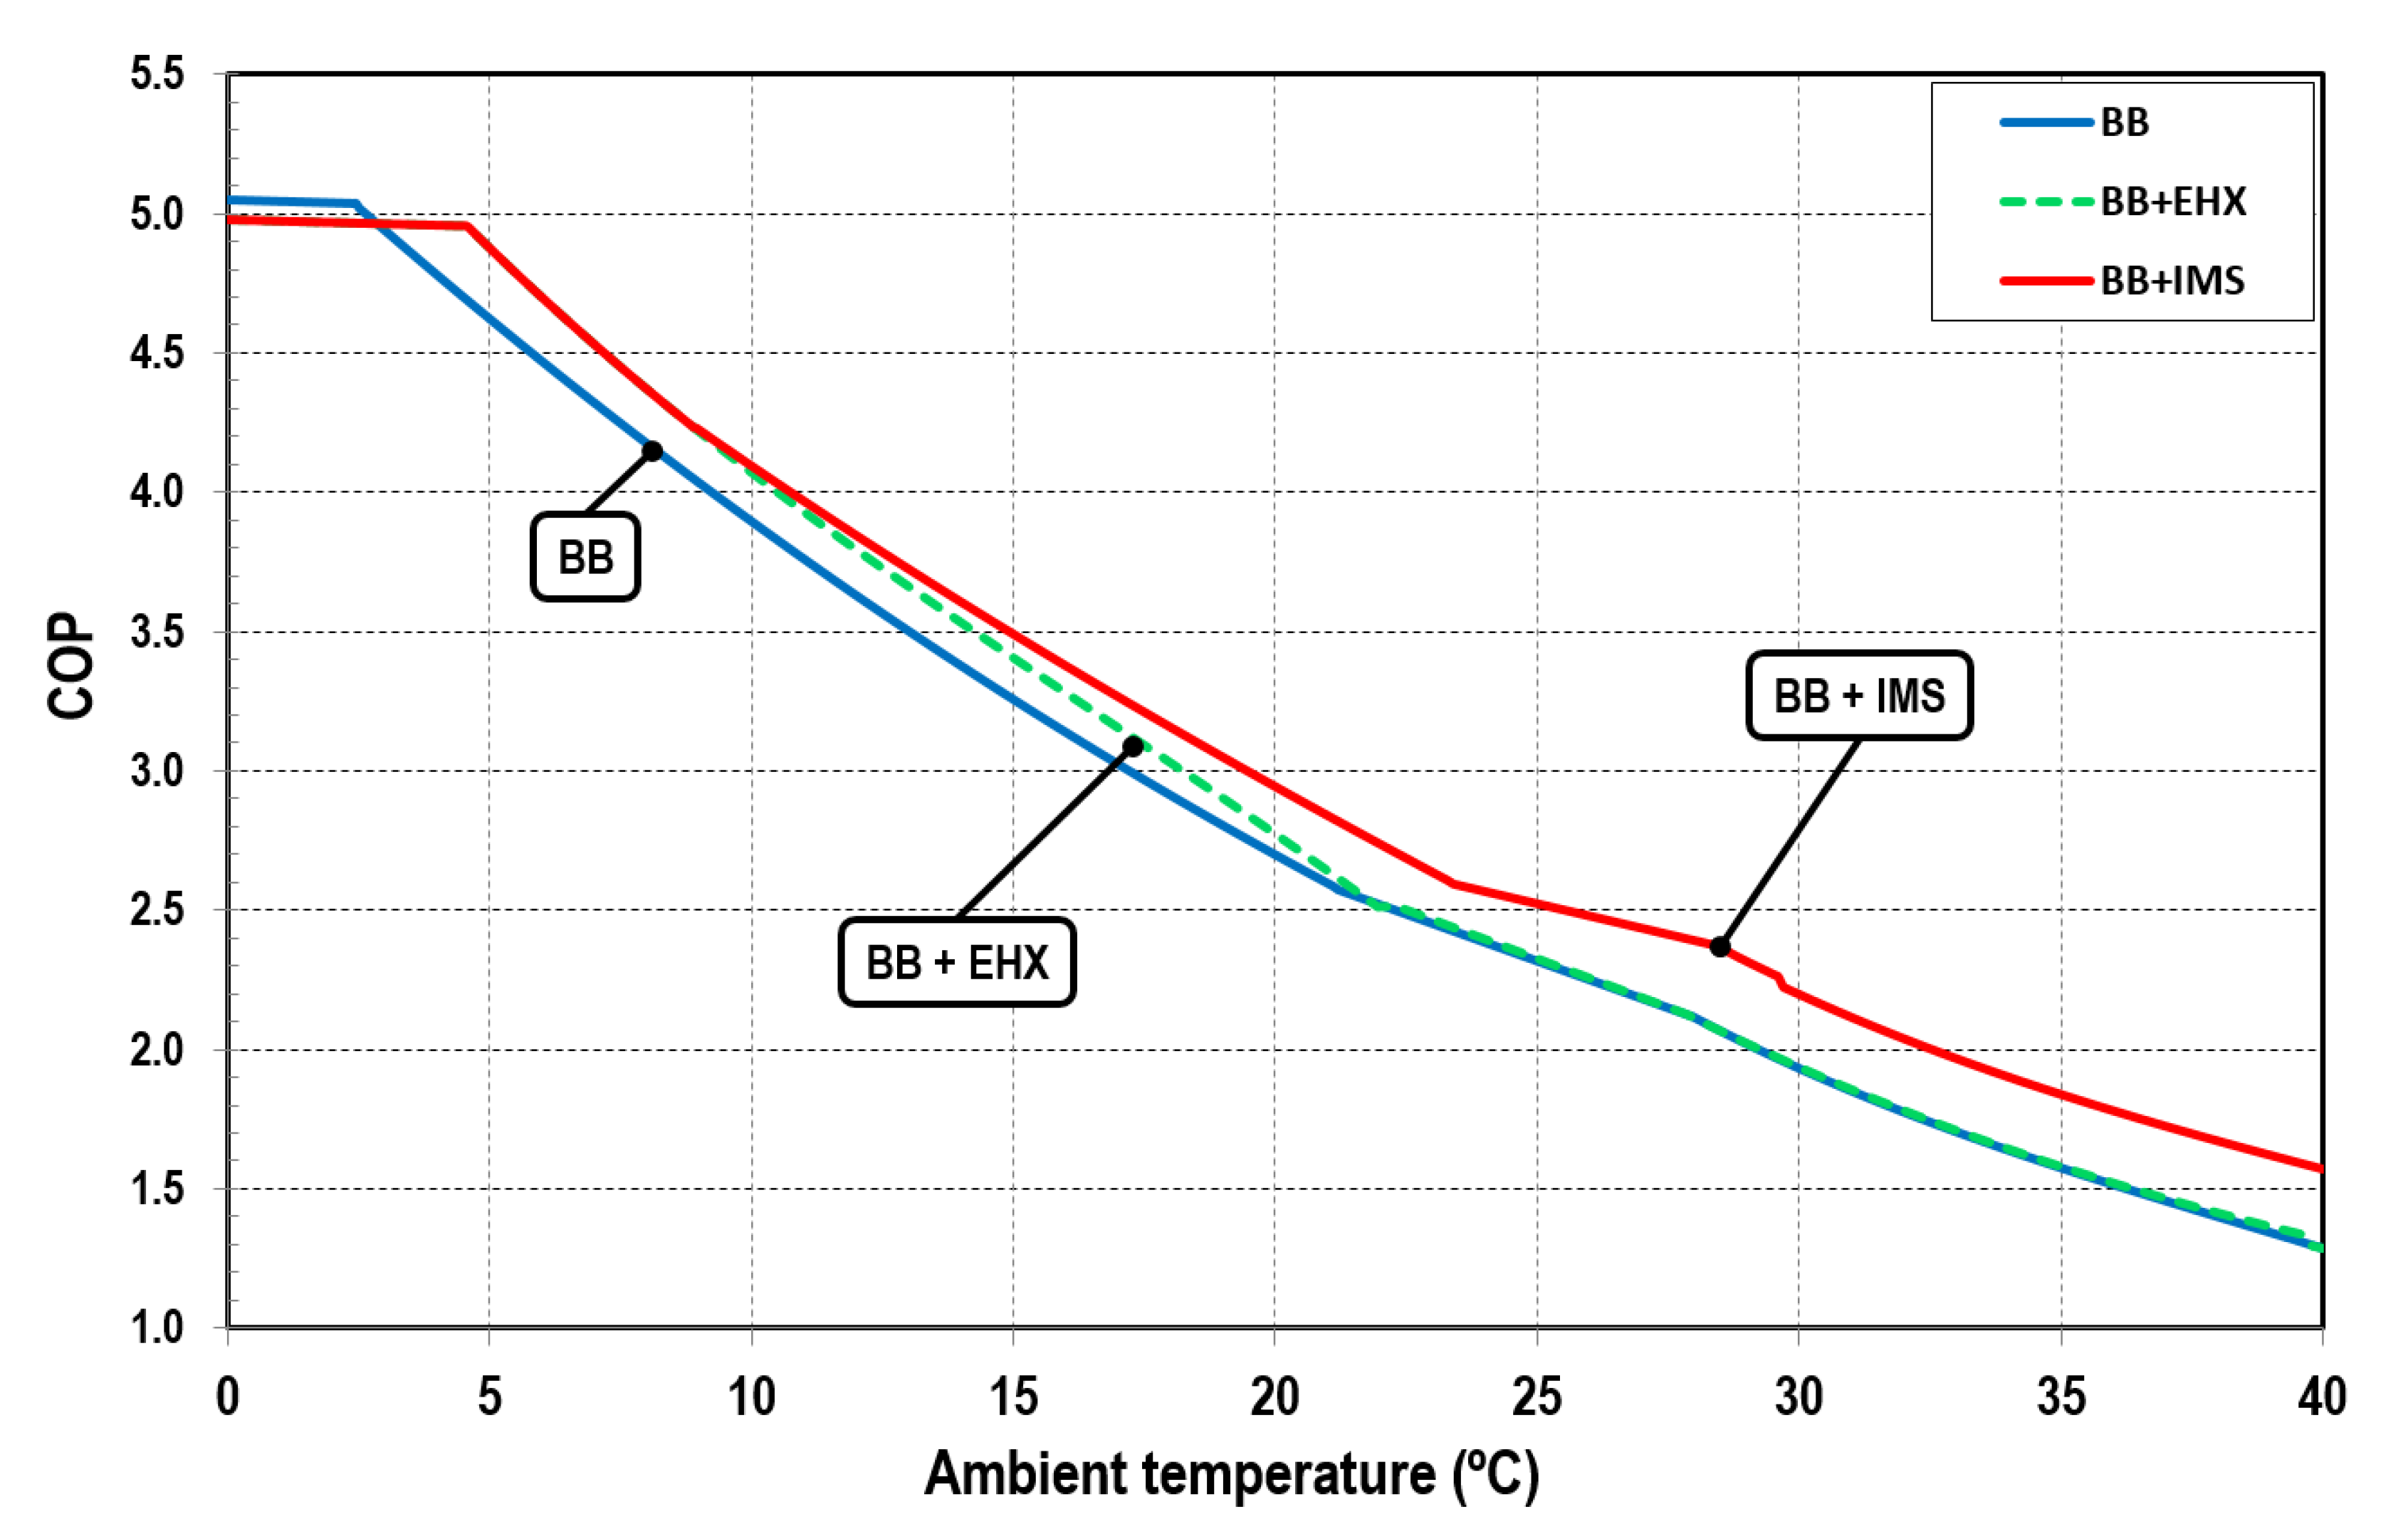
The COP of the facility can be obtained by using the Equation (11), which depends on the cooling loads and the total power consumption by the compressors. The latter is calculated with the Equation (12) as a function of the mass flow rate, the specific compression work, and the global effectiveness from Equation (10).
The results from Equation (11) are presented in Figure 15, where the positive effect of the economizer is evident when it is installed in the refrigeration facility, especially when the EC compressor is used. Only when the ambient temperature is below 2.6 °C does the basic cycle achieve the best results in terms of COP. Additionally, Table 2 presents the variation of COP with regard to the base cycle.
Focusing on both improved systems, it is evident that the implementation of an additional compressor enhances the COP of the base system in a wide range of ambient temperatures (from 2.6 °C onwards). This makes this configuration very interesting in almost all European climates.
In order to maximize the COP of CO2 booster systems operating in transcritical, different parameters can be modified depending on the booster configuration.
In this case, the heat rejection pressure is changed for the BB system as described in Figure 4. In the BB+EHX configuration, the pressure of the GC/K is also changed and depending on the mass flow rate through the EHX, certain subcooling is applied to the high-pressure mass flow (Figure 5). Finally, the BB+IMS adds another parameter, so that in addition to controlling the GC/K pressure, the EC suction pressure must be controlled as shown in Figure 6 and thus a certain subcooling after the GC/K is applied to the high-pressure mass flow.
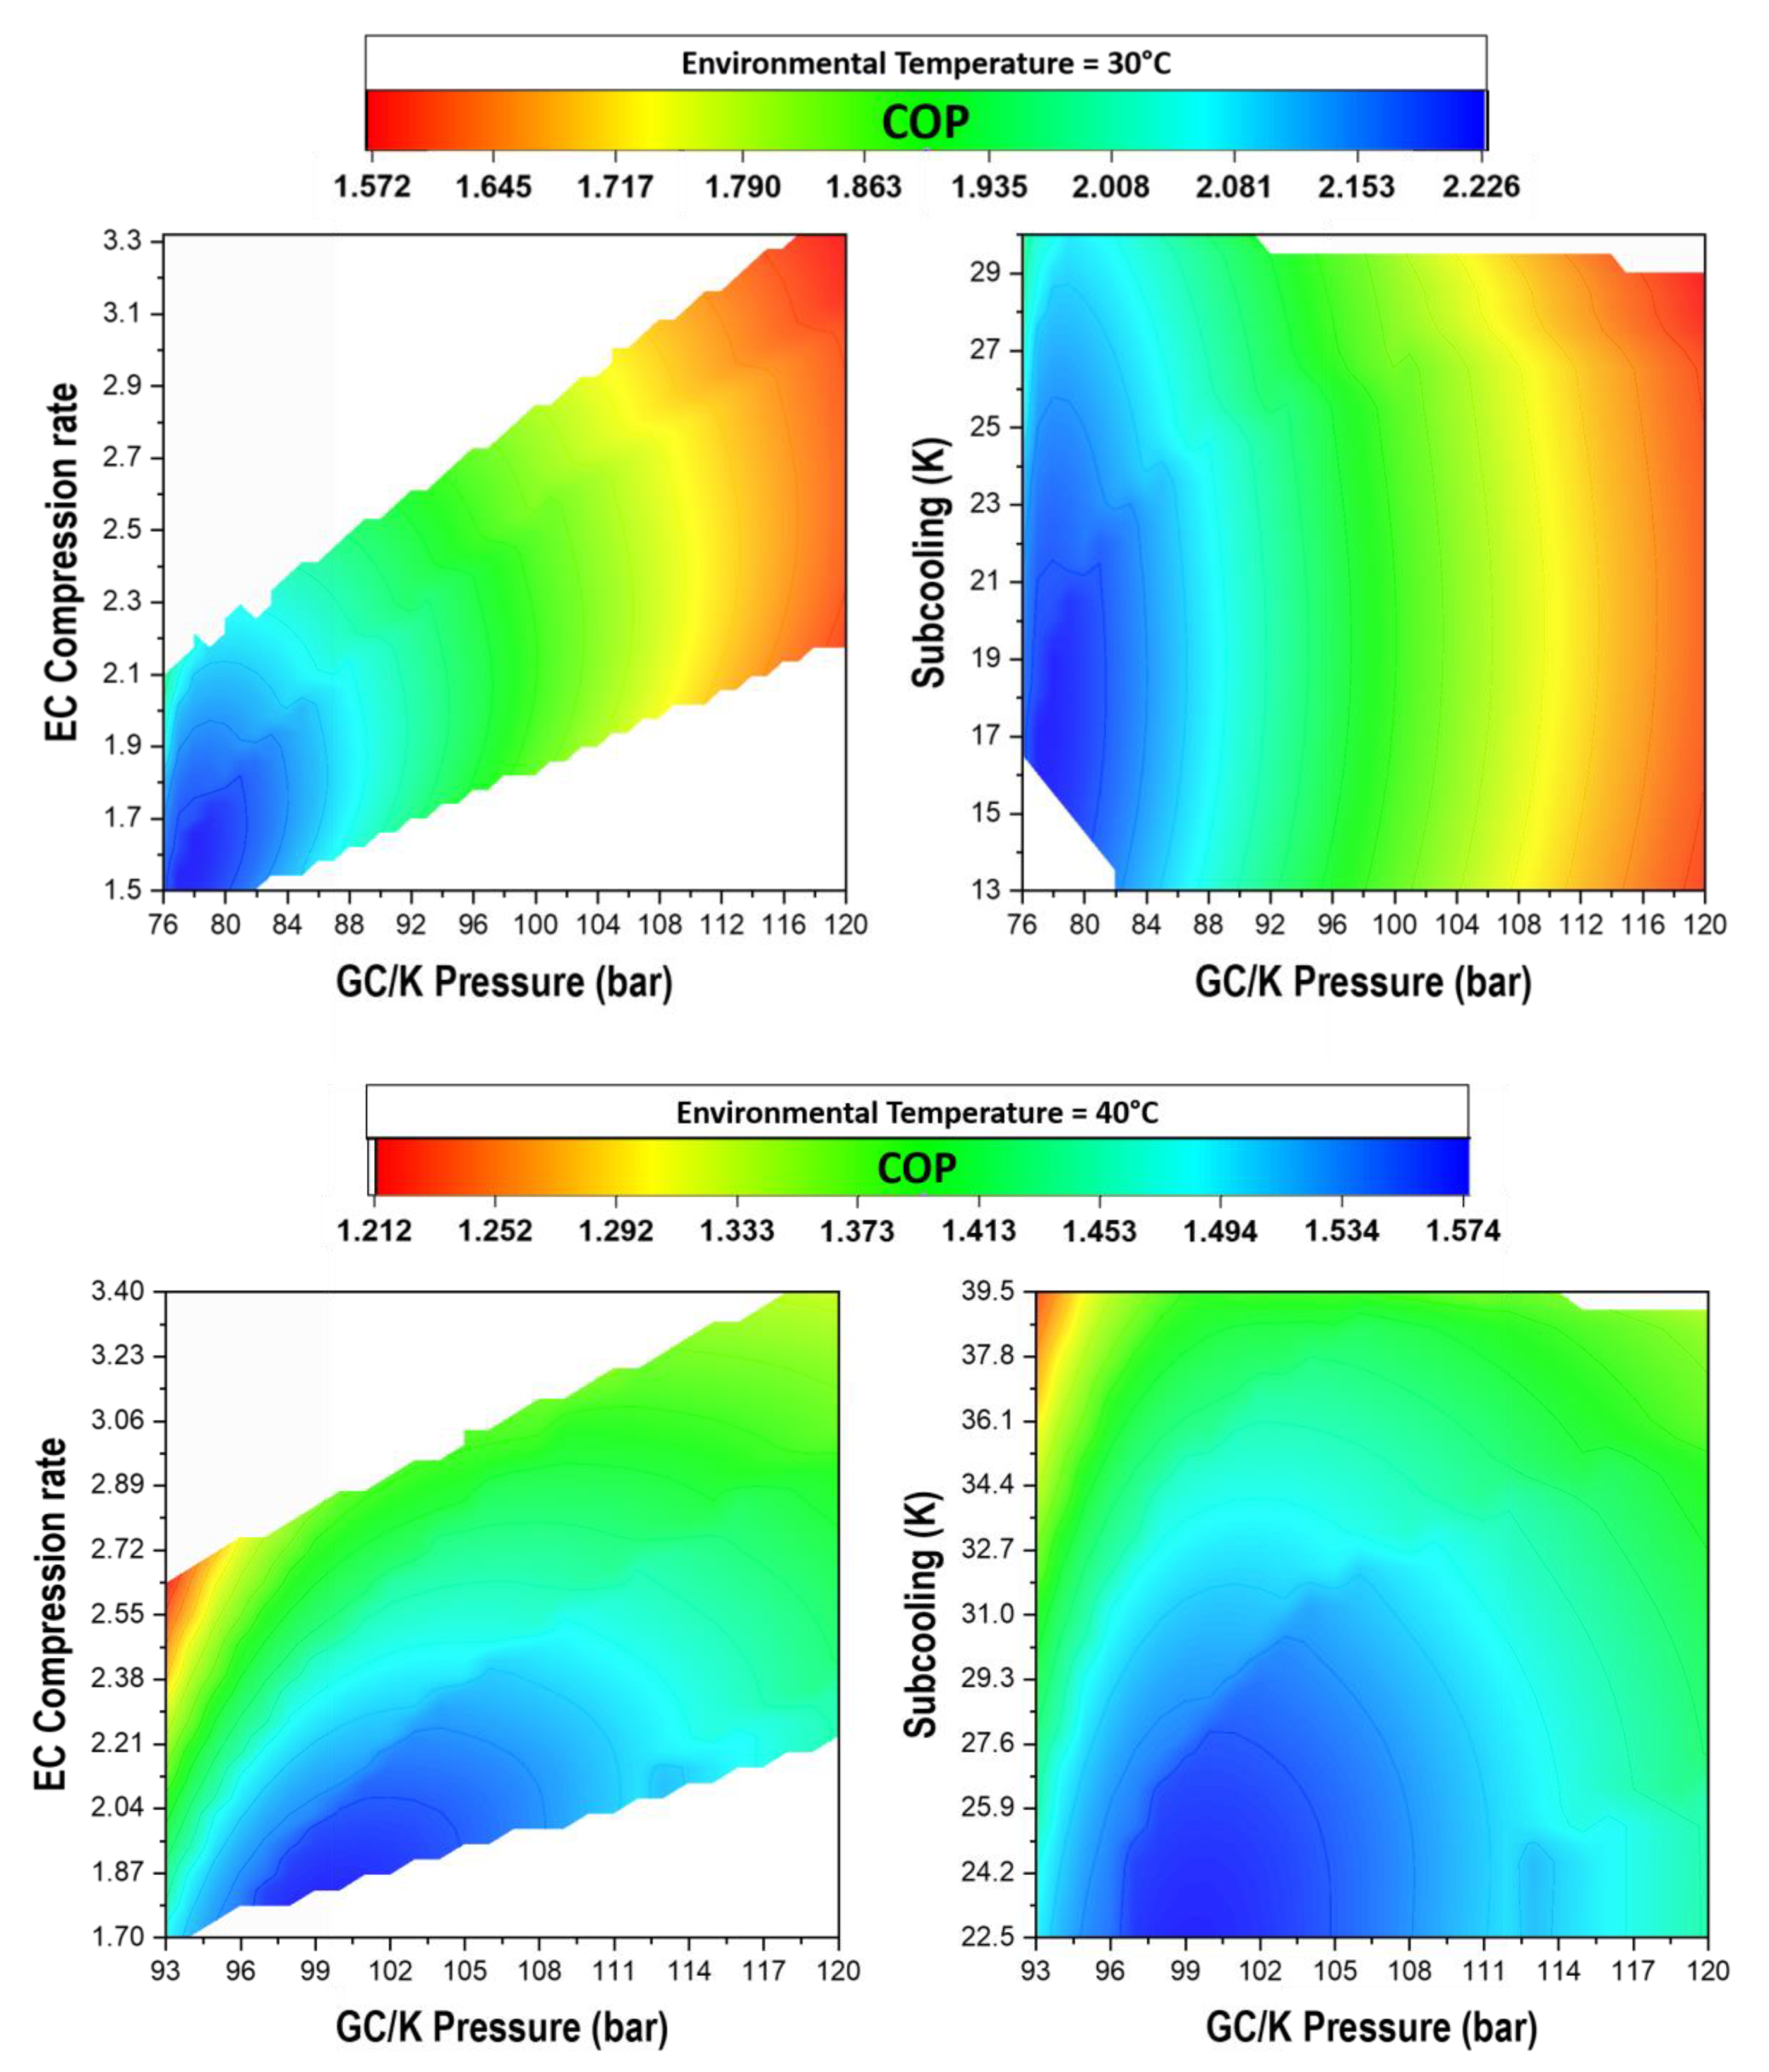
In this case, depending on the chosen values of these parameters, the COP of the facility will change as experimentally analyzed by Nebot-Andrés et al. [30]. Figure 16 shows how the variation of these parameters affects the COP of the most complex system (BB+IMS) for two heat rejection temperatures (30 °C and 40 °C).
As shown in the graphs that relate the EC compression rate with the GC/K pressure (EC suction pressure can be obtained), relating to the COP of the BB+IMS (Figure 16 left), the suction pressure control of the EC is an important term for maximizing the COP of the BB+IMS system.
The graphs on the left show the relationship between the EC compression rate, GC/K pressure, and COP, while the graphs on the right show the relationship between subcooling, GC/K pressure, and COP. For ambient temperature of 30 °C, the maximum COP (2.22) is achieved at the GC/K pressure of 77 bar, a subcooling of 17.5 K, and an EC compression rate of 1.54 (corresponds to 51.3 bar at EC suction port); nonetheless, for an ambient temperature of 40 °C, the maximum COP of 1.57 is achieved at the GC/K pressure of 100.1 bar, a subcooling of 22.5 K, and an EC compression rate of 1.82 (corresponds to 55 bar at the EC suction port). These results show that the compressors used in the EC rack must have the capacity to work at low compression rates and high suction pressures.
It has been calculated that for ambient temperatures below 23.4 °C, the optimum COP is achieved at an EC compression rate below 1.5 (minimum recommended by the manufacturer), and for rejection temperatures above 38.2 °C (Figure 11), the maximum COP is achieved at an EC suction pressure above 55 bar (maximum recommended by the manufacturer). Therefore, with compressors designed to operate efficiently at lower compression rates and higher suction pressures than the above operating limitations, the results for this system would be even better.
5.6. Annual Energy Consumption
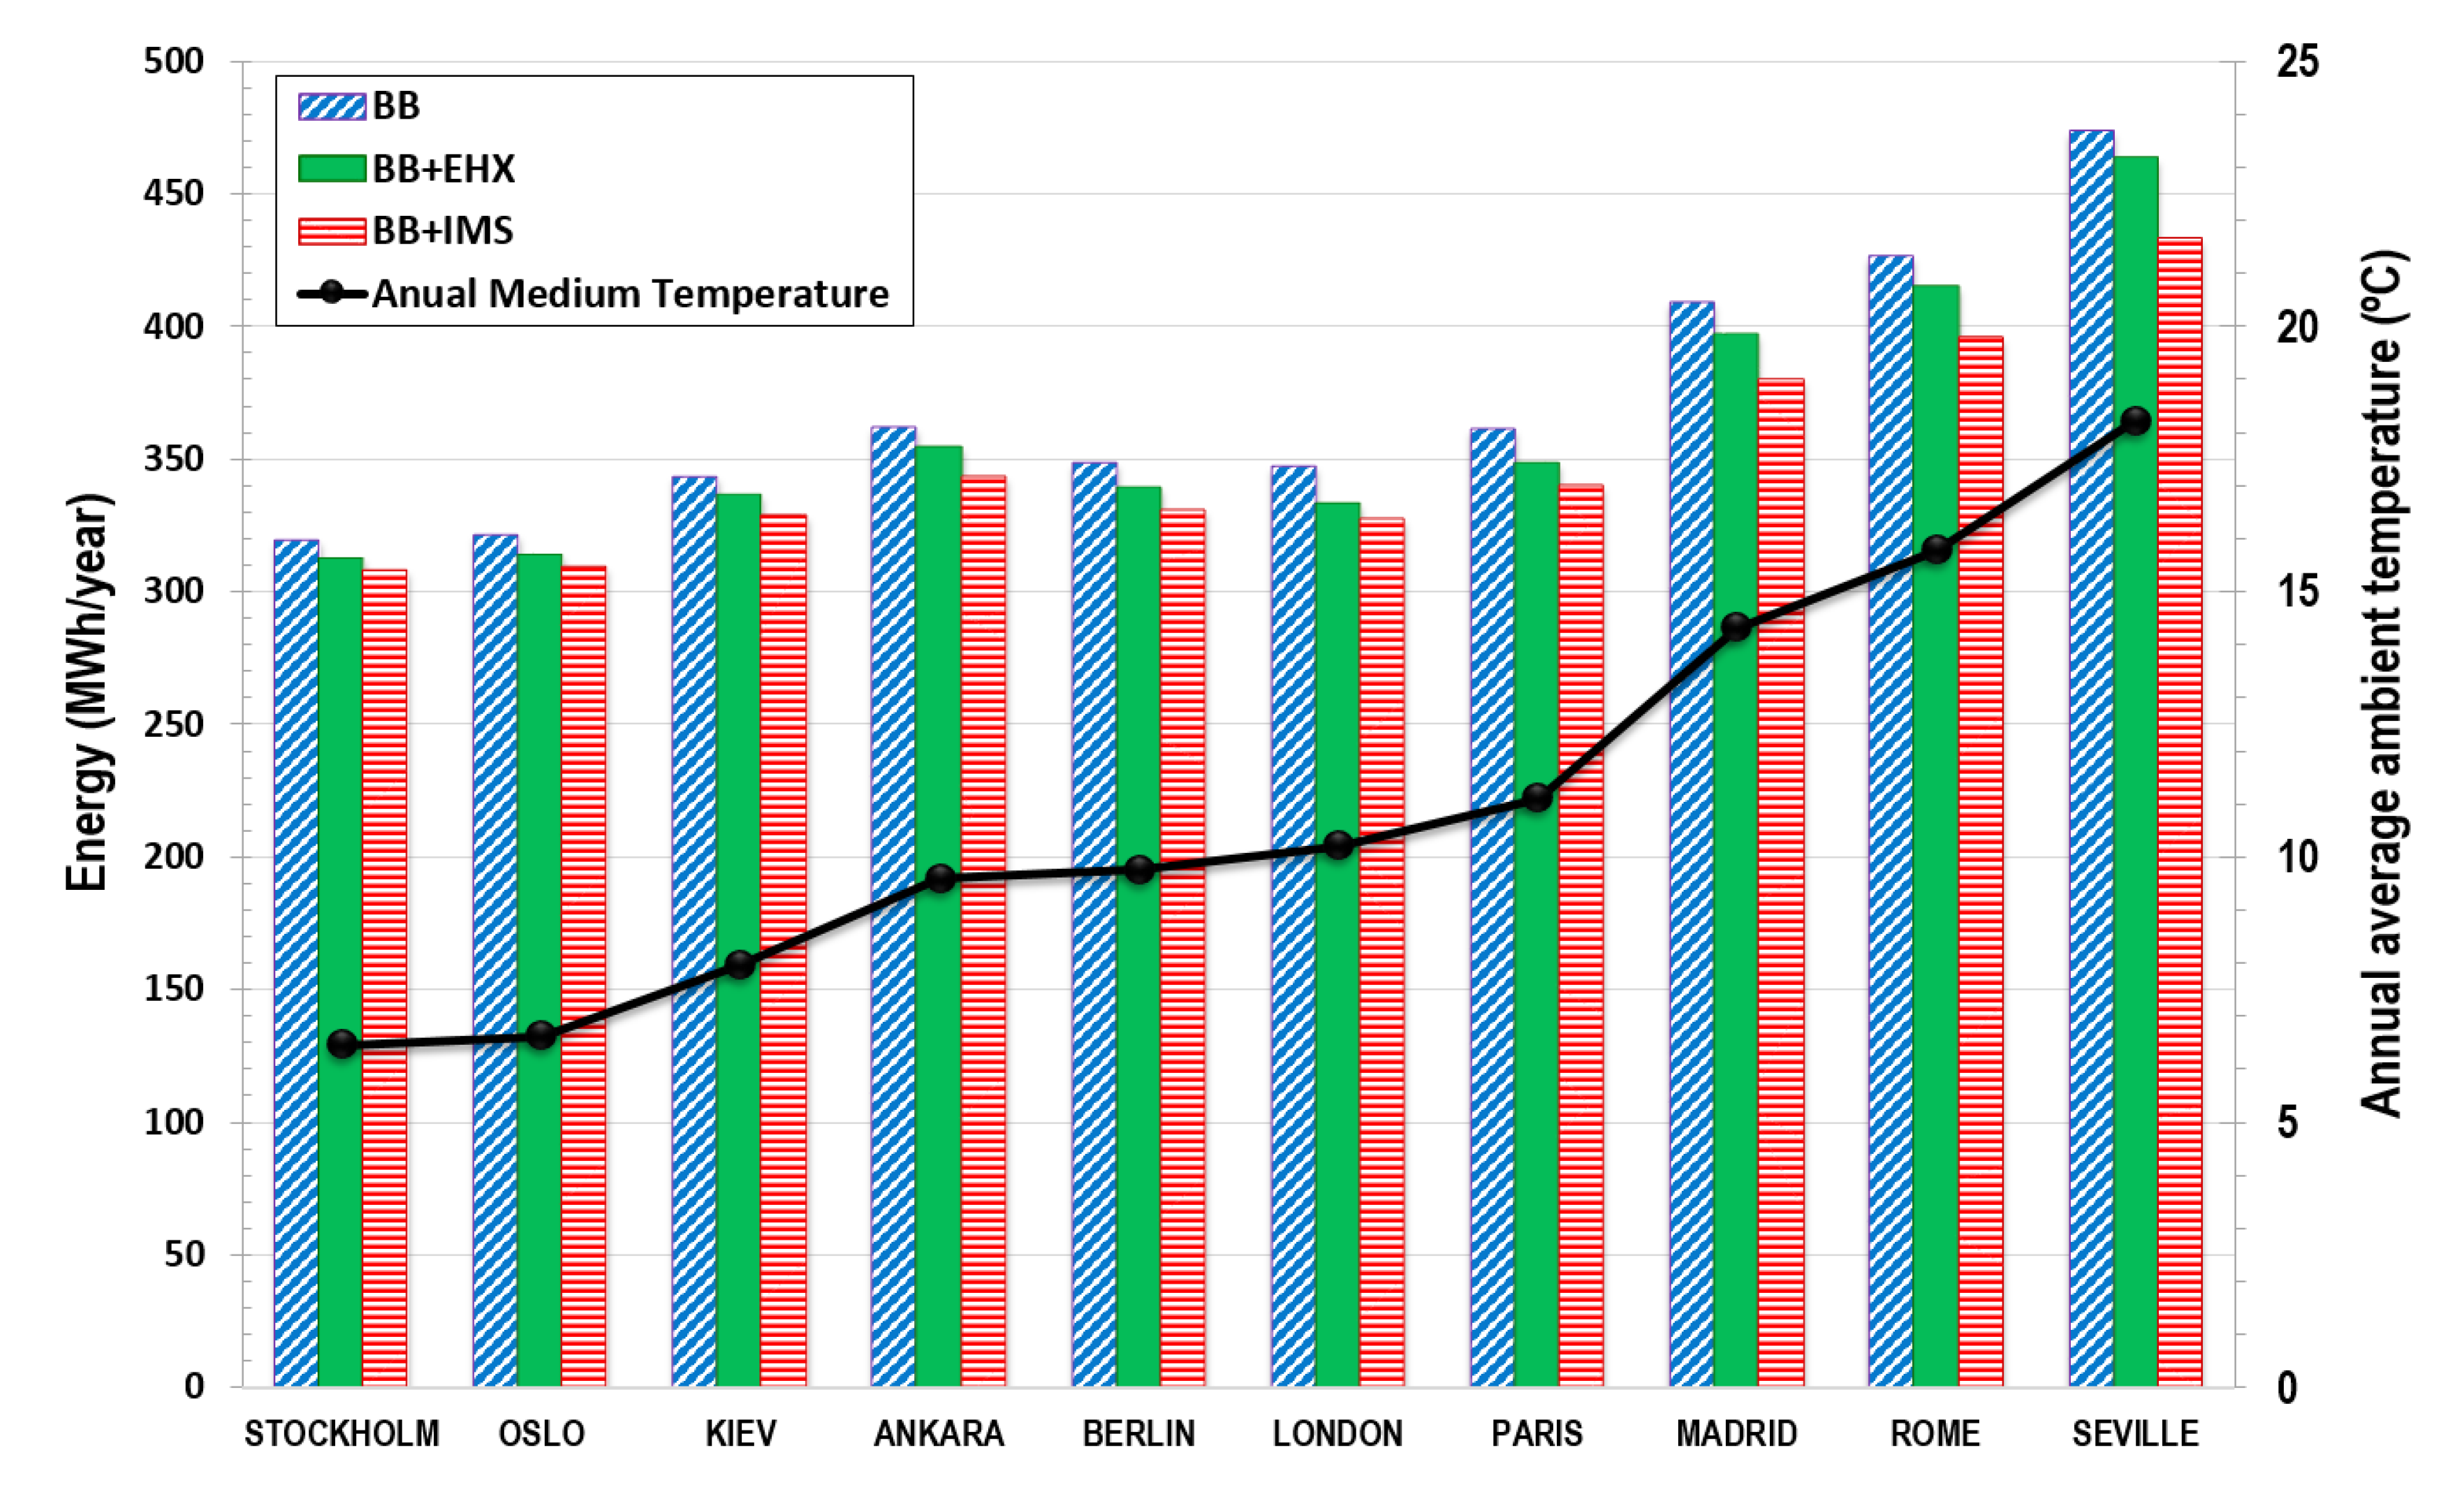
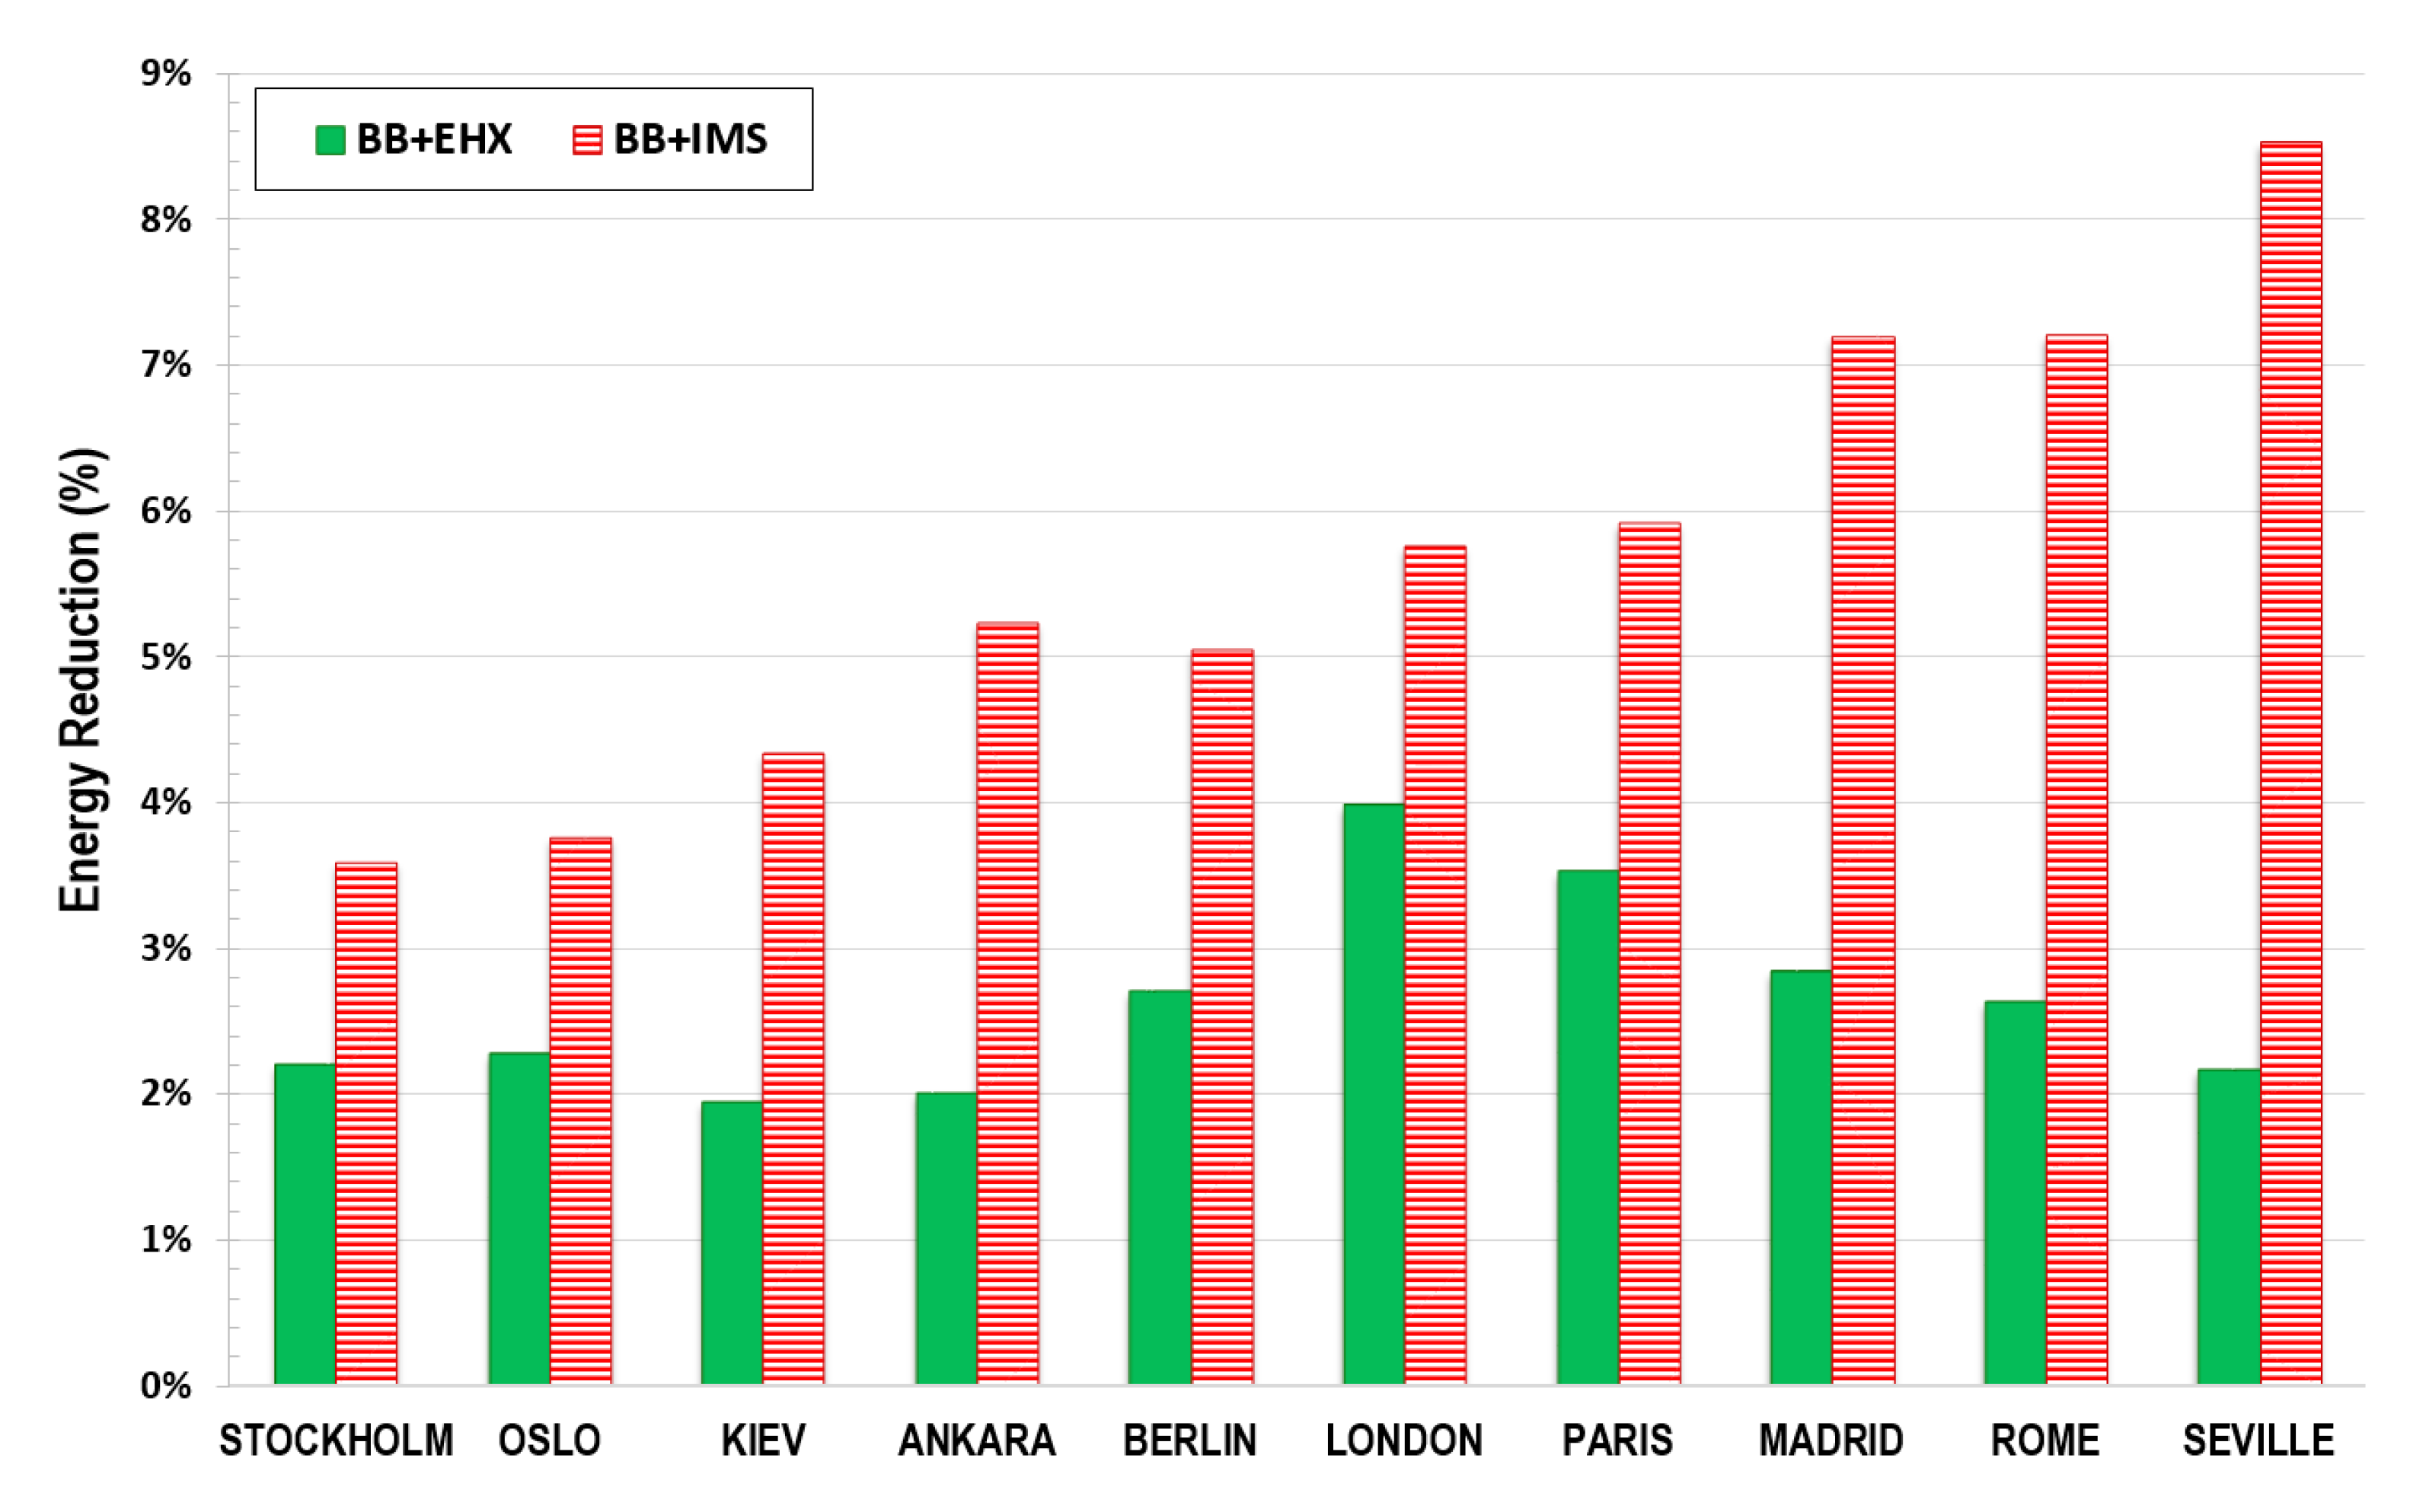
To sum up the positive effect of the economizer, this section presents the annual energy consumption of the analyzed configurations in several European cities with different temperature profiles. A heat load factor (LF) of 100% from 7:00 to 22:00 and 50% from 22:00 to 7:00 is assumed for all the days of the year at optimum operating conditions. The average hourly temperature for each month was obtained with the EnergyPlus tool [44], excluding the effect of the relative humidity. The annual energy consumption (AEC) for each location is calculated using Equation (13) and depicted in Figure 17. Figure 18 presents the energy consumption reduction with regard to the basic booster system obtained by Equation (14). For a load factor of 50%, the cooling load is reduced, and thus the volumetric requirements of the compressors is reduced as well. This reduction changes the COP of the system due to the variation of the efficiency of the compressor with variable frequency drive and the influence on the total energy consumption, despite the load reduction.
From Figure 17 and Figure 18, it is evident that the use of the economizer always reduces the energy consumption of the refrigerating plant. However, this reduction depends on the configuration and the location. Thus, if the architecture implemented is that described in Figure 2 (BB+EHX), the savings made range between 1.95% and 4%. However, if the architecture installed contains the extra compressor described in Figure 3 (BB+IMS), the reductions vary from 3.6% to 8.5% at the same operating conditions.
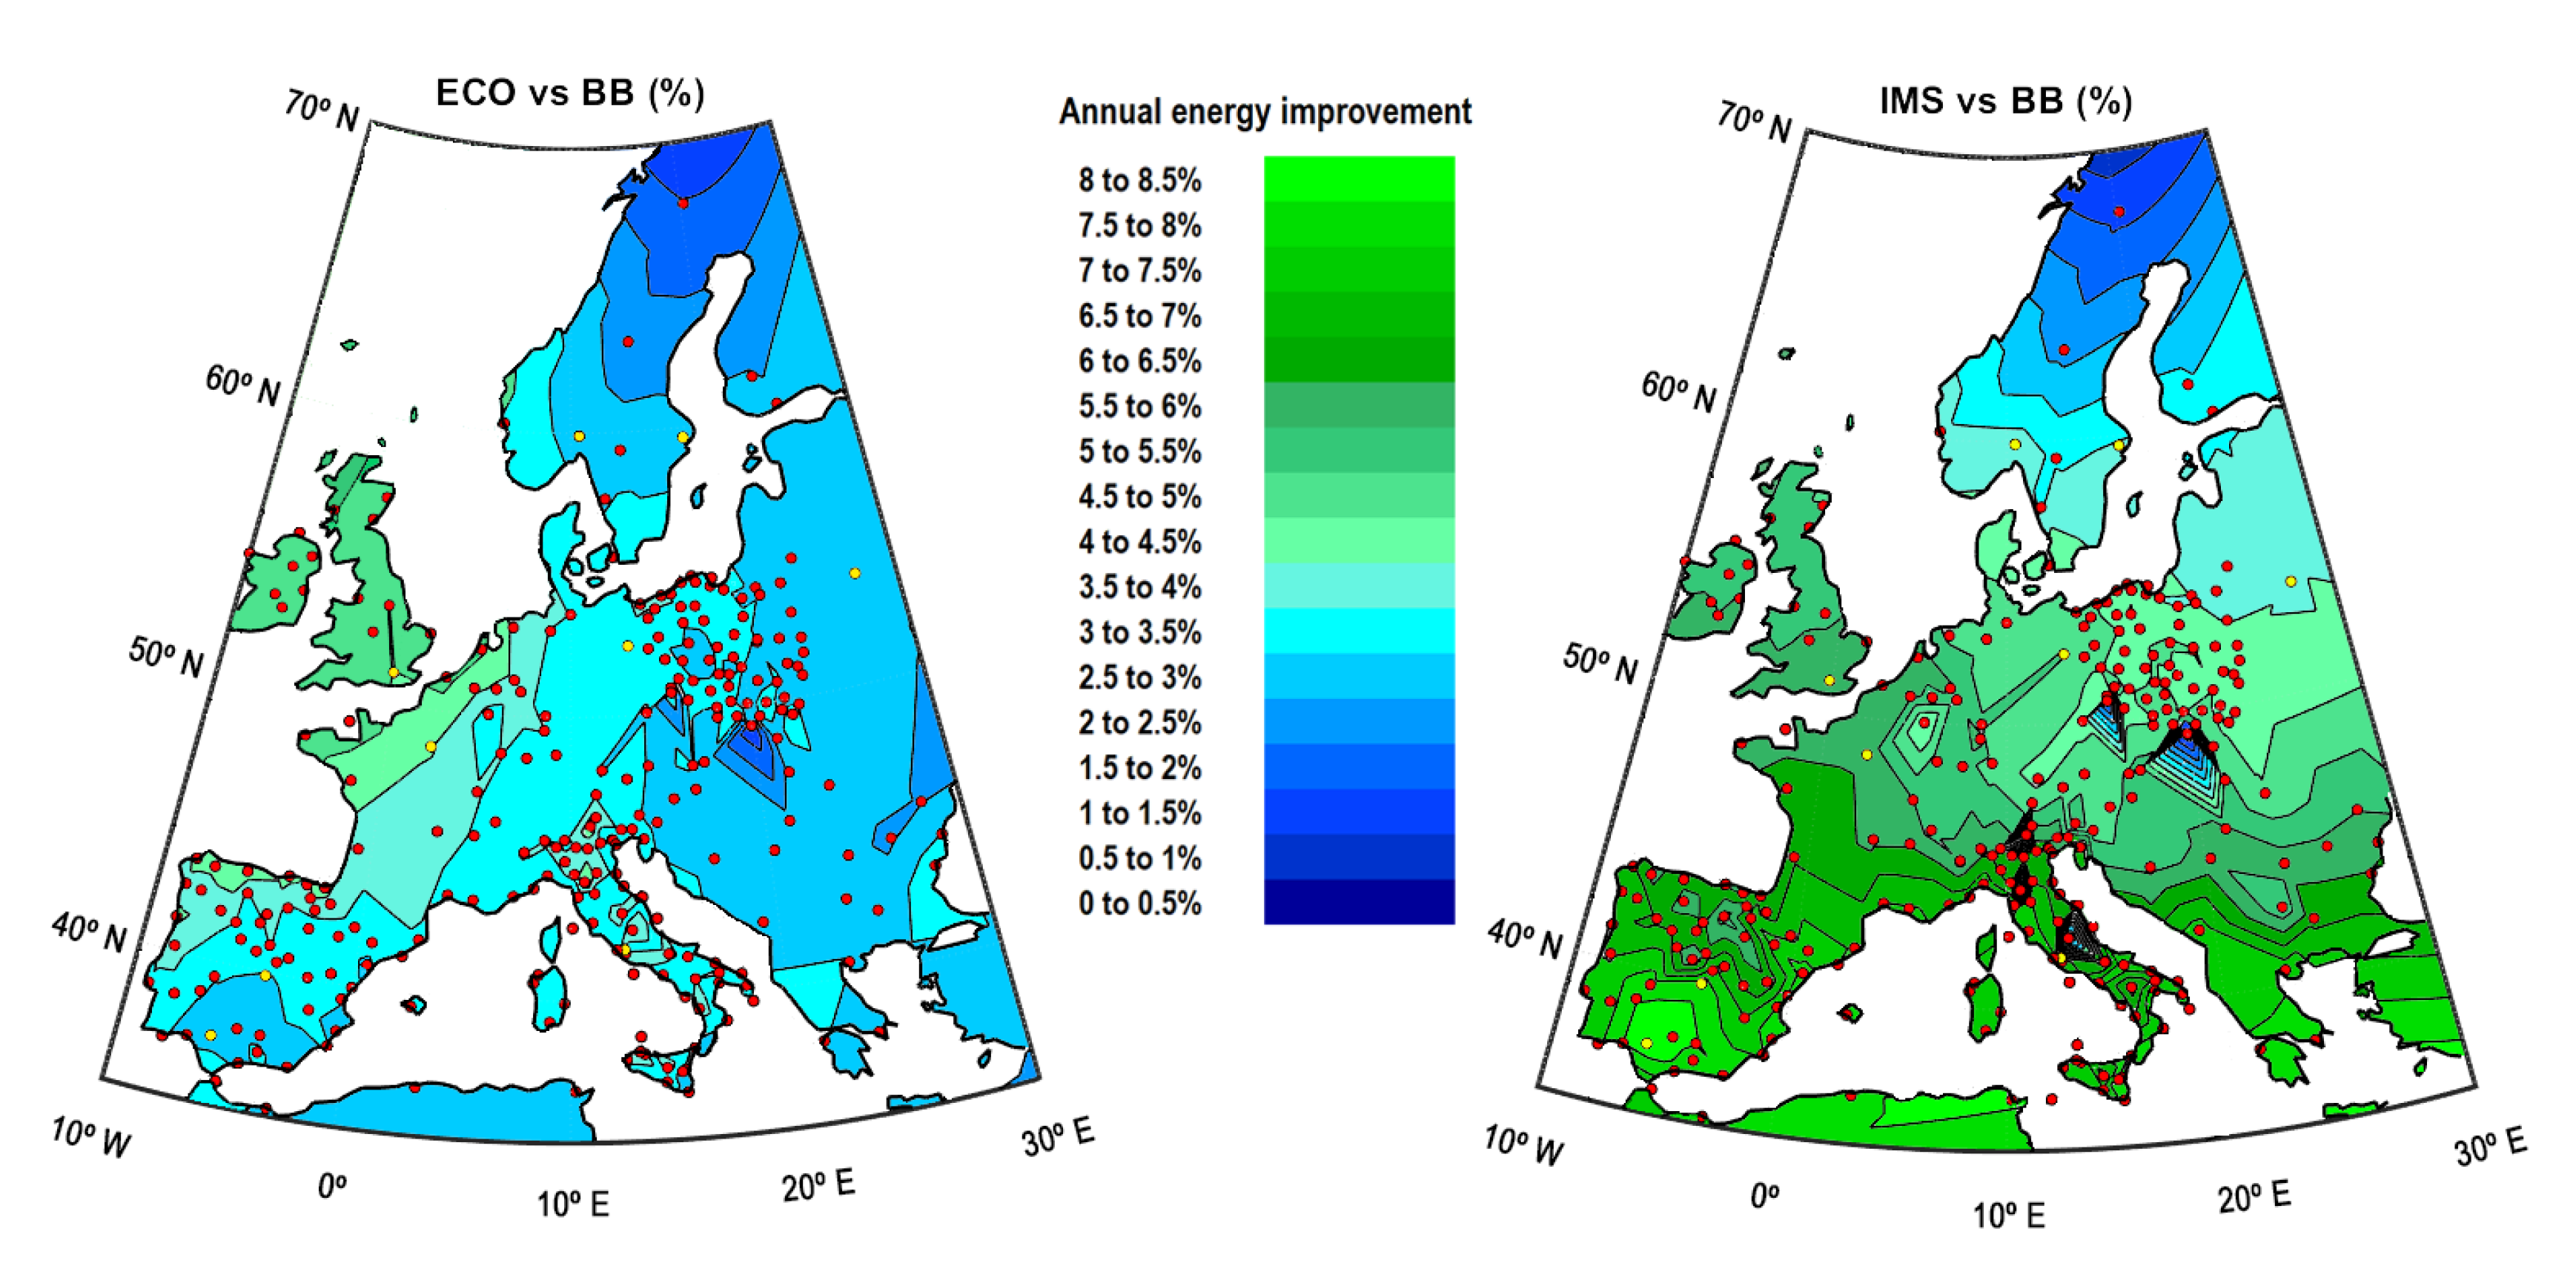
To extend the analysis to more locations in Europe, a contour map of the energy consumption improvements of the systems regarding BB are presented in Figure 19, BB+EHX (left) and BB+IMS (right). The yellow dots represent the cities considered in Figure 19.
In relation to the BB+EHX configuration, the system offers greater energy improvements for locations with cool temperatures as Northern France, Belgium, Netherlands, Ireland, or the United Kingdom. However, BB+IMS offers major energy improvements for all countries in Europe, but the best results are obtained for locations with higher ambient temperatures such as Spain, Italy, France, and Greece.
6. Conclusions
This work analyzes two subcooling systems to improve the efficiency of the CO2 booster architectures. The analysis has been made for a medium-sized supermarket in different European cities with cooling loads of 41 kW and 140 kW for low and medium-temperature services, respectively. Real constraints in the operation of the systems have been taken into account as well as the performance data of the compressors provided by manufacturer, including the effect of the frequency variation in compressors.
Regarding the operating mode of the systems, the most important data are those of the basic booster with economizer and additional compression stage (BB+IMS), as the use of this additional compression stage (EC) is more beneficial for ambient temperatures above 8.9 °C regarding a basic booster with an economizer (BB+EHX).
The analysis of the compressors’ sizing and their operation reveals, on the one hand, that the basic booster (BB) and BB+EHX similarly operate in the low-temperature compression rack (LTC) for all the rejection temperatures analyzed and for the medium-temperature compression rack (MTC). On the other hand, the BB+IMS system operates with two compressors at their nominal frequency and one with VFD in LTC with changes in frequency from 32 to 56.9 Hz depending on the rejection temperature. For MTC, the great difference regarding the previous systems is that BB+IMS needs compressors with lower volumetric displacement. This reduction directly affects by lowering the power consumption of the compressors, and thus the efficiency of the facility increases. With respect to the additional compression stage of the BB+IMS, the system only uses the compressor with VFD at rejection temperatures from 8.9 to 29.5 °C (34.6 to 75 Hz), adding another compressor at its nominal frequency (50 Hz) for higher ambient temperatures.
With respect to the optimal pressure at the suction port for the EC stage, it changes from 33.1 to 55 bar to achieve the optimum COP at temperatures from 8.9 to 38.2 °C, limiting the maximum EC suction pressure to 55 bar for rejection temperatures above 38.2 °C.
The economized systems provide a degree of subcooling to the refrigerant after the GC/K. This subcooling is different depending on the system and the ambient temperature. The optimum subcooling for BB+EHX changes from 9 to 40 K for rejection temperatures from 0 to 40 °C. However, the introduction of an additional compression rack (BB+IMS) significantly reduces the optimum subcooling up to a maximum of 22.5 K and is more consistent over a wide range of temperatures.
Focusing on COP results, the higher improvement is obtained by the BB+IMS system in all ranges of ambient temperatures above 2.6 °C with a maximum improvement regarding a BB of 22%. Moreover, BB+EHX improves the COP with respect to BB for ambient temperatures from 2.6 to 21 °C up to 5.5%. The optimum COP points obtained in the BB+IMS are achieved at low compression rates in the additional compression stage (EC) for all the heat rejection temperatures analyzed and high suction pressures in the EC for high rejection temperatures.
Both improved systems provide a reduction in energy consumption in all the cities analyzed. BB+EHX reduce the annual energy consumption from 1.95% to 4%, offering greater energy improvements for locations with cool temperatures as Northern France, Belgium, Netherlands, Ireland, or the United Kingdom. However, the best results for all the countries in Europe have been obtained by the BB+IMS, which achieve reductions in energy from 3.5% to 8.5%, being more beneficial for cities with higher annual medium temperature such as Spain, Italy, France, and Greece.
It has been concluded that the BB+EHX system improves the COP of the basic one from 2.6 to 21 °C. Notwithstanding, the BB+IMS provides higher energy improvements for all ambient temperatures above 2.6 °C without adding a large complexity to the system.
Author Contributions
J.C.-G. and D.S. conceived the idea. J.C.-G. performed the theoretical simulations. R.L., D.S. and R.C. checked the validity of the results. The manuscript was written by J.C.-G., D.S., R.L., R.C., D.C.-A., and L.N.-A. revised it. All authors have read and agreed to the published version of the manuscript.
Funding
This research was funded by Ministerio de Economía y Competitividad of Spain (project ENE2014-53760-R.7, grant FPI BES-2015-073612) and Jaume I University of Spain (project P11B2015-66).
Acknowledgments
Authors gratefully acknowledge Ministerio de Economía y Competitividad of Spain (project ENE2014-53760-R.7, grant FPI BES-2015-073612) and Jaume I University of Spain (project P11B2015-66) for financing this research work.
Conflicts of Interest
The authors declare that no part of manuscript has been published previously and that it will not be published elsewhere including electronically in the same form, in English or in any other languages without the written consent of the copyright-holder. Publication is approved by authors and by responsible authorities where the work was carried out. Authors declare that there is non additional conflict of interest.
Nomenclature
| AEC | annual energy consumption (kWh) |
| ATD | ambient temperature difference |
| BB | Basic Booster |
| CC | comparative cycle |
| COP | coefficient of performance |
| D | number of days |
| DSH | desuperheater |
| E | energy |
| EC | economizer compressor |
| ECO | economizer |
| EHX | economizer heat exchanger |
| ELEC | electric |
| FG | Flash gas |
| GC/K | gas cooler/condenser |
| H | number of hours |
| HFC | hydrofluorocarbon |
| HPS | high-pressure side |
| HPCV | high-pressure control valve |
| IMS | integrated mechanical subcooling |
| IHX | internal heat exchanger |
| Ksub | condenser subcooling (K) |
| LF | load factor |
| LT | low temperature |
| LPS | low-pressure side |
| LR | load ratio |
| mass flow (kg·s-1) | |
| M | number of months |
| MT | medium temperature |
| P | pressure (bar) |
| cooling load (kW) | |
| SH | useful superheating (K) |
| SHC | superheat control |
| SUB | subcooling (K) |
| t | compression ratio |
| T | temperature (°C) |
| v | specific volume (m3·kg−1) |
| VFD | variable frequency drive |
| compressor swept volume (m3·s−1) | |
| power consumption (W) | |
| Greek Symbols | |
| Δ | variation (increment or decrement) |
| ε | relative error (%)/thermal effectiveness |
| ηV | volumetric efficiency |
| ηG | global efficiency |
| Subscripts | |
| amb | ambient |
| C | compressor |
| CO2 | carbon dioxide |
| EV | expansion valve |
| GC | gas cooler |
| in | inlet/in |
| K | condenser |
| LT | low temperature |
| m | month |
| max | maximum |
| MT | medium temperature |
| o | evaporator |
| out | out/outlet |
| opt | optimum |
| prev | previous |
| SUB | subcooling degree |
| sub_opt | optimum subcooling |
| V | valve |
Appendix A. Compressor coefficients
The coefficients used for modelling each compressor are detailed in this appendix. These data have been obtained from the real operating curves of the compressors in transcritical and subcritical operation.
Using these coefficients with Equations (9) and (10), we can obtain the global and volumetric efficiency of each compressor for the entire operating range.
Figure A1.
Compressor coefficients.


References
- European Parliament. Regulation (EU) No 517/2014 of the European Parliament and of the Council of 16 April 2014 on Fluorinated Greenhouse Gases and Repealing. 2014. Available online: https://eur-lex.europa.eu/legal-content/EN/TXT/?qid=1577567799194&uri=CELEX:32014R0517 (accessed on 5 February 2020).
- BRA. Guide to Flammable Refrigerants. 2012. Available online: http://area-eur.be/sites/default/files/2016-05/BRAGuidetoFlammableRefrigerants—Issue1—Oct12.pdf (accessed on 5 February 2020).
- Gullo, P.; Tsamos, K.; Hafner, A.; Ge, Y.; Tassou, S.A. State-of-the-art technologies for transcritical R744 refrigeration systems—a theoretical assessment of energy advantages for European food retail industry. Energy Procedia 2017, 123, 46–53. [Google Scholar] [CrossRef]
- Pumped CO2 in Industrial Refrigeration Systems Application guide Application guide Pumped CO2 in Industrial Refrigeration Systems. Available online: http://files.danfoss.com/TechnicalInfo/Dila/01/DKRCIPA000E102_Pumped_co2_in_industrial_refrigeration_systems_Final.pdf (accessed on 5 February 2020).
- Sanz-Kock, C.; Llopis, R.; Sánchez, D.; Cabello, R.; Torrella, E. Experimental evaluation of a R134a/CO2 cascade refrigeration plant. Appl. Therm. Eng. 2014, 73, 41–50. [Google Scholar] [CrossRef] [Green Version]
- Mosaffa, A.H.; Farshi, L.G.; Ferreira, C.A.I.; Rosen, M.A. Exergoeconomic and environmental analyses of CO 2/NH 3 cascade refrigeration systems equipped with different types of flash tank intercoolers. Energy Convers. Manag. 2016, 117, 442–453. [Google Scholar] [CrossRef] [Green Version]
- Ge, Y.T.; Tassou, S.A. Thermodynamic analysis of transcritical CO2 booster refrigeration systems in supermarket. Energy Convers. Manag. 2011, 52, 1868–1875. [Google Scholar] [CrossRef]
- Tsamos, K.M.; Ge, Y.T.; Santosa, I.; Tassou, S.A.; Bianchi, G.; Mylona, Z. Energy analysis of alternative CO2 refrigeration system configurations for retail food applications in moderate and warm climates. Energy Convers. Manag. 2017, 150, 822–829. [Google Scholar] [CrossRef]
- Purohit, N.; Gupta, D.K.; Dasgupta, M.S. Energetic and economic analysis of trans-critical CO2 booster system for refrigeration in warm climatic condition. Int. J. Refrig. 2017, 80, 182–196. [Google Scholar] [CrossRef]
- Elbel, S.; Hrnjak, P. Flash gas bypass for improving the performance of transcritical R744 systems that use microchannel evaporators. Int. J. Refrig. 2004, 27, 724–735. [Google Scholar] [CrossRef]
- Karampour, M.; Sawalha, S. Comparison of State-of-the-art CO2 and Alternative Refrigeration Systems for Supermarkets. In Proceedings of the 13th IIR Gustav Lorentzen Conference on Natural Refrigerants: Natural Refrigerant Solutions for Warm Climate Countries, Valencia, Spain, 18–20 June 2018. [Google Scholar] [CrossRef]
- Gullo, P.; Elmegaard, B.; Cortella, G. Energy and environmental performance assessment of R744 booster supermarket refrigeration systems operating in warm climates. Int. J. Refrig. 2016, 64, 61–79. [Google Scholar] [CrossRef] [Green Version]
- Catalán-Gil, J.; Sánchez, D.; Llopis, R.; Nebot-Andrés, L.; Cabello, R. Energy Evaluation of Multiple Stage Commercial Refrigeration Architectures Adapted to F-Gas Regulation. Energies 2018, 11, 1915. [Google Scholar] [CrossRef] [Green Version]
- Catalán-Gil, J.; Sánchez, D.; Cabello, R.; Llopis, R.; Nebot-Andrés, L.; Calleja-Anta, D. Experimental evaluation of the desuperheater influence in a CO2 booster refrigeration facility. Appl. Therm. Eng. 2020, 168, 114785. [Google Scholar] [CrossRef]
- Sarkar, J.; Agrawal, N. Performance optimization of transcritical CO2 cycle with parallel compression economization. Int. J. Therm. Sci. 2009, 49, 838–843. [Google Scholar] [CrossRef]
- Chesi, A.; Esposito, F.; Ferrara, G.; Ferrari, L. Experimental analysis of R744 parallel compression cycle. Appl. Energy 2014, 135, 274–285. [Google Scholar] [CrossRef]
- Cortella, G.; D’Agaro, P.; Coppola, M.A. Transcritical CO2 commercial refrigeration plant with adiabatic gas cooler and subcooling via HVAC: Field tests and modelling. Int. J. Refrig. 2020, 111, 71–80. [Google Scholar] [CrossRef]
- Catalán-Gil, J.; Llopis, R.; Sánchez, D.; Nebot-Andrés, L.; Cabello, R. Energy analysis of dedicated and integrated mechanical subcooled CO2 boosters for supermarket applications. Int. J. Refrig. 2019, 101, 11–23. [Google Scholar] [CrossRef]
- Tao, B.; Jianlin, Y.; Gang, Y. Advanced exergy analyses of an ejector expansion transcritical CO2 refrigeration system. Energy Convers. Manag. 2016, 126, 850–861. [Google Scholar] [CrossRef]
- Hafner, A.; Försterling, S.; Banasiak, K. Multi-ejector concept for R-744 supermarket refrigeration. Int. J. Refrig. 2014, 43, 1–13. [Google Scholar] [CrossRef]
- Mitsopoulos, G.; Syngounas, E.; Tsimpoukis, D.; Bellos, E.; Tzivanidis, C.; Anagnostatos, S. Annual performance of a supermarket refrigeration system using different configurations with CO2 refrigerant. Energy Convers. Manag. X 2019. [Google Scholar] [CrossRef]
- Minetto, S.; Brignoli, R.; Zilio, C.; Marinetti, S. Experimental analysis of a new method for overfeeding multiple evaporators in refrigeration systems. Int. J. Refrig. 2013, 38, 1–9. [Google Scholar] [CrossRef]
- Haida, M.; Smolka, J.; Hafner, A.; Palacz, M.; Ostrowski, Z.; Bodys, J.; Kriezi, E.K.; Försterling, S.; Nowak, A.J.; Banasiak, K. Performance operation of liquid ejectors for a R744 integrated multi-ejector supermarket system using a hybrid ROM. Int. J. Refrig. 2020. [Google Scholar] [CrossRef]
- Karampour, M.; Sawalha, S. Energy efficiency evaluation of integrated CO2 trans-critical system in supermarkets: A field measurements and modelling analysis. Int. J. Refrig. 2017, 82, 470–486. [Google Scholar] [CrossRef] [Green Version]
- Pardiñas, Á.Á.; Hafner, A.; Banasiak, K. Novel integrated CO2 vapour compression racks for supermarkets. Thermodynamic analysis of possible system configurations and influence of operational conditions. Appl. Therm. Eng. 2017, 131, 1008–1025. [Google Scholar] [CrossRef]
- Purohit, N.; Sharma, V.; Sawalha, S.; Fricke, B.; Llopis, R.; Dasgupta, M.S. Integrated supermarket refrigeration for very high ambient temperature. Energy 2018. [Google Scholar] [CrossRef]
- D’Agaro, P.; Coppola, M.A.; Cortella, G. Field tests, model validation and performance of a CO2 commercial refrigeration plant integrated with HVAC system. Int. J. Refrig. 2019, 100, 380–391. [Google Scholar] [CrossRef]
- Aprea, C.; Greco, A.; Maiorino, A. The application of a desiccant wheel to increase the energetic performances of a transcritical cycle. Energy Convers. Manag. 2015, 89, 222–230. [Google Scholar] [CrossRef]
- Llopis, R.; Nebot-Andrés, L.; Sánchez, D.; Catalán-Gil, J.; Cabello, R. Subcooling methods for CO2 refrigeration cycles: A review. Int. J. Refrig. 2018, 93, 85–107. [Google Scholar] [CrossRef]
- Nebot-Andrés, L.; Catalán-Gil, J.; Sánchez, D.; Calleja-Anta, D.; Cabello, R.; Llopis, R. Experimental determination of the optimum working conditions of a transcritical CO2 refrigeration plant with integrated mechanical subcooling. Int. J. Refrig. 2020. [Google Scholar] [CrossRef]
- Sawalha, S. Theoretical evaluation of trans-critical CO2 systems in supermarket refrigeration. Part I: Modeling, simulation and optimization of two system solutions. Int. J. Refrig. 2007, 31, 516–524. [Google Scholar] [CrossRef] [Green Version]
- Sawalha, S. Theoretical evaluation of trans-critical CO2 systems in supermarket refrigeration. Part II: System modifications and comparisons of different solutions. Int. J. Refrig. 2007, 31, 525–534. [Google Scholar] [CrossRef]
- Danfoss. Electric Regulating Valves. Available online: https://assets.danfoss.com/documents/DOC230186439993/DOC230186439993.pdf (accessed on 5 February 2020).
- Bitzer. Bitzer CO2 Booster Rack. 2017. Available online: https://www.bitzer.de/shared_media/documentation/bao-107-1-au.pdf (accessed on 5 February 2020).
- Boudreau, P.J. The Compressor Operating Envelope. Available online: http://www.r744.com/files/the-compressor-operating-envelope.pdf (accessed on 5 February 2020).
- Sánchez, D.; Cabello, R.; Llopis, R.; Torrella, E. Development and validation of a finite element model for water—CO2 coaxial gas-coolers. Appl. Energy 2012, 93, 637–647. [Google Scholar] [CrossRef] [Green Version]
- Danfoss. Food Retail CO2 Refrigeration Systems. Designing Subcritical and Transcritical CO2 Systems and Selecting Suitable Danfoss Components. Available online: http://files.danfoss.com/TechnicalInfo/Dila/01/DKRCEPAR1A102_TheFoodRetailCO2applicationhandbook_DILA.pdf (accessed on 28 December 2019).
- Cabello, R.; Sánchez, D.; Patiño, J.; Llopis, R.; Torrella, E. Experimental analysis of energy performance of modified single-stage CO2 transcritical vapour compression cycles based on vapour injection in the suction line. Appl. Therm. Eng. 2012, 47, 86–94. [Google Scholar] [CrossRef] [Green Version]
- Emerson Climate Technologies. Refrigerant Choices for Commercial Refrigeration. Available online: https://docplayer.net/6650747-Refrigerant-choices-for-commercial-refrigeration-finding-the-right-balance.html (accessed on 28 December 2019).
- Llopis, R.; Sanz-Kock, C.; Cabello, R.; Sánchez, D.; Nebot-Andrés, L.; Catalán-Gil, J. Effects caused by the internal heat exchanger at the low temperature cycle in a cascade refrigeration plant. Appl. Therm. Eng. 2016, 103, 1077–1086. [Google Scholar] [CrossRef] [Green Version]
- Bitzer. Bitzer Software. Available online: https://www.bitzer.de/websoftware/Default.aspx (accessed on 5 February 2020).
- Dick, W. Commercial Refrigeration: For Air Conditioning Technicians, 2nd ed.; Cengage Learning: Vermillion, SD, USA, 2009. [Google Scholar]
- Lemmon, E.W.; Huber, M.L.; McLinden, M.O. NIST Standard Reference Database 23: Reference Fluid Thermodynamic and Transport Properties-REFPROP, Version 9.1|NIST. Available online: https://www.nist.gov/publications/nist-standard-reference-database-23-reference-fluid-thermodynamic-and-transport (accessed on 5 February 2020).
- EnergyPlus. Doe, Bto, Nrel, EnergyPlus. Available online: https://energyplus.net/ (accessed on 5 February 2020).
Figure 1.
Schematic of the basic booster arrangement (BB) and the P−h diagram for Tamb = 32 °C.

Figure 2.
Schematic of a basic booster with economizer and the P−h diagrams for Tamb = 32 °C.


Figure 3.
Schematic of a basic booster with IMS and the P−h diagram for Tamb = 32 °C.


Figure 4.
Iterative method for the BB system.

Figure 5.
Iterative method for the BB+EHX system.

Figure 6.
Iterative method for the BB+IMS.

Figure 7.
Operation mode of the analyzed configurations.

Figure 8.
BB compressors operation. A rack of compressors at the low-temperature side (LTC, left) and a rack of compressors at the high-temperature side (MTC, right).
Figure 8.
BB compressors operation. A rack of compressors at the low-temperature side (LTC, left) and a rack of compressors at the high-temperature side (MTC, right).

Figure 9.
BB+EHX compressors operation. LTC (left) and MTC (right).

Figure 10.
BB+IMS compressors operation. LTC (left), MTC (right), and EC (center).

Figure 11.
Optimal additional compressor (EC) suction pressure for BB+IMS and receiver pressure in all systems.
Figure 11.
Optimal additional compressor (EC) suction pressure for BB+IMS and receiver pressure in all systems.

Figure 12.
Economizer optimum subcooling degree.

Figure 13.
Subcooling area for the configurations of BB+EHX (left) and BB+IMS (right).

Figure 14.
Economizer’s cooling capacity vs. ambient temperature.

Figure 15.
COP vs. ambient temperature.

Figure 16.
COP variation depending on GC/K pressure and EC compression ratio (left) or subcooling (right) for the BB+IMS.
Figure 16.
COP variation depending on GC/K pressure and EC compression ratio (left) or subcooling (right) for the BB+IMS.

Figure 17.
Annual energy consumption of the analyzed booster architectures.

Figure 18.
Energy consumption reduction with regard to the basic booster system.

Figure 19.
Annual energy benefit of the BB+EHX and BB+IMS in relation to BB in Europe (%).


Table 1.
Assumptions for the computational models. EHX: economizer, GC/K: air-cross-flow heat exchanger, LT: low temperature: MT: high temperature.
Table 1.
Assumptions for the computational models. EHX: economizer, GC/K: air-cross-flow heat exchanger, LT: low temperature: MT: high temperature.
| BB | BB+EHX | BB+IMS | ||
|---|---|---|---|---|
| GC/Kout Temp. [°C] | Transcritical | Tamb + 2 | ||
| Subcritical | Tamb + 5 | |||
| Condenser Subcooling (KSUB) [K] | Subcritical | 2 | 0 | |
| Condensing Temp. [°C] | Tamb + 5 + KSUB | |||
| EHXpinch [K] | Transcritical | 2 | ||
| Subcritical | 5 | |||
| Tout EHX HPS [°C] | Transcritical --------- Subcritical | - | GC/Kout Temp. – EHXSUB_opt | |
| Tin EHX LPS [°C] | - | MTo Temp. | Tout EHX_HPS - EHXpinch | |
| Tout EHX LPS [°C] | - | Tin EHX LPS + 5 | ||
| Tin MTc [°C] | Variable | Variable | ||
| IHX Thermal Effectiveness [%] | 65 | |||
| DSHout Temp. [°C] | Tamb + 5 | |||
| Liquid Receiver Limit Pressures [bar] | From 35 to 55 | |||
| Minimum ΔP (Expansion Valves) [Bar] | 3.5 | |||
| Maximum Compressor Inlet Pressure [Bar] | 55 | |||
| Minimum Compression Ratio [-] | 1.5 | |||
| LTo Temp. [°C] | -32 | |||
| MTo Temp. [°C] | -6 | |||
| LTo, MTo R Superheating [K] | 5 | |||
| Evaporatorsout Useless Superheating [K] | 5 | |||
| LT Load [kW] | 41 | |||
| MT Load [kW] | 140 | |||
Table 2.
COP variation with regard to the basic cycle.
| SYSTEM | Ambient Temperature (°C) | ||||||||
|---|---|---|---|---|---|---|---|---|---|
| 0 | 5 | 10 | 15 | 20 | 25 | 30 | 35 | 40 | |
| BB+EHX | −1.43% | 5.47% | 4.47% | 4.53% | 2.74% | 0.31% | 0.14% | 0.19% | −0.2% |
| BB+IMS | −1.43% | 5.47% | 5.06% | 7.14% | 9.01% | 8.77% | 13.66% | 16.63% | 21.94% |
© 2020 by the authors. Licensee MDPI, Basel, Switzerland. This article is an open access article distributed under the terms and conditions of the Creative Commons Attribution (CC BY) license (http://creativecommons.org/licenses/by/4.0/).
Share and Cite
MDPI and ACS Style
Catalán-Gil, J.; Nebot-Andrés, L.; Sánchez, D.; Llopis, R.; Cabello, R.; Calleja-Anta, D. Improvements in CO2 Booster Architectures with Different Economizer Arrangements. Energies 2020, 13, 1271. https://doi.org/10.3390/en13051271
AMA Style
Catalán-Gil J, Nebot-Andrés L, Sánchez D, Llopis R, Cabello R, Calleja-Anta D. Improvements in CO2 Booster Architectures with Different Economizer Arrangements. Energies. 2020; 13(5):1271. https://doi.org/10.3390/en13051271
Chicago/Turabian StyleCatalán-Gil, J., L. Nebot-Andrés, D. Sánchez, R. Llopis, R. Cabello, and D. Calleja-Anta. 2020. "Improvements in CO2 Booster Architectures with Different Economizer Arrangements" Energies 13, no. 5: 1271. https://doi.org/10.3390/en13051271
Note that from the first issue of 2016, this journal uses article numbers instead of page numbers. See further details here.