Qualitative and Quantitative Characterisation of Major Elements in Particulate Matter from In-use Diesel Engine Passenger Vehicles by LIBS


Institute of Biomedical Mechatronics, Johannes Kepler University Linz, Altenberger strasse 69, 4040 Linz, Austria
*
Author to whom correspondence should be addressed.
Energies 2020, 13(2), 368; https://doi.org/10.3390/en13020368
Submission received: 25 November 2019
/
Revised: 21 December 2019
/
Accepted: 25 December 2019
/
Published: 12 January 2020
Abstract
:In this research we apply a high-resolution optical emission spectroscopy technique for spectrochemical analysis of collected diesel particulate matter. We use the laser-induced breakdown spectroscopy technique (LIBS) for qualitative and quantitative measurements of major chemical elements present in the particulate matter generated from different diesel engine passenger vehicles in use. The high-resolution LIBS technique can instantly measure major chemical elements within the diverse particulate matter matrices.
Keywords:
particulate matter; diesel particulate matter; soot; diesel emissions; ultrafine particles; nanoparticles; metallic nanoparticles; trace elements; carbon emissions; aerosols; air quality; diesel engine; in-use vehicles; laser induced breakdown spectroscopy; laser induced plasma spectroscopy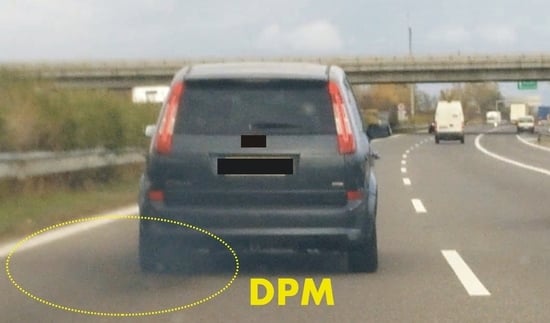
1. Introduction
Actual problems with diesel-engine emissions and control failures [1,2,3] are prominent in public perception around the world. To breathe clean air is very important for human health—not only for lungs and cardiovascular system, but also for the brain and central nervous system [4,5]. Therefore, it should be among our highest priorities to find out new technique(s) for accurate and sensitive measurement(s) of actual exhaust emissions.
The existing emission standards Euro [6,7], Tier [8], or Low-Emission Vehicle Program (LEV) [9], for diesel-engine vehicles specify the maximum allowable emissions of hydrocarbons, carbon monoxide, nitrogen oxides and Particulate Matter (PM) from diesel exhaust fumes.
Generally speaking, these emission standards do not concern an additional compounds or chemical elements contained in the exhaust emissions or exhaust vapour [10], PM, [11], black carbon/carbon black (BC/CB) [12], or in the soot [13], formed by the diesel or biodiesel [14], from combustion engines [15]. Nevertheless, chemical elements adsorbed by carbonous particles present significant volumetric as well as mass fraction of the total Diesel Particulate Matter (DPM) or soot emission contents.
Moreover, inhalation of metallic base particles or ions has numerous negative health effects, especially upon long-term exposure. Automotive emissions are considered the dominant source for airborne metal pollution in urban areas [16]. Therefore, accurate in-situ technique to assess the on-line atomic elemental composition of particulate matter from automotive emissions would be desirable.
Among the early pioneers in measurement of particulate trace emissions from vehicles was the group of Schauer et al. [11] as they used a comprehensive dilution source sampler, organic chemical analysis and X-ray fluorescence analysis for mass and chemical composition measurements of fine particles. Other groups [10,12,15,17], used Inductively-Coupled Plasma Mass Spectrometry (ICP-MS) and X-Ray Fluorescence (XRF) for characterisation of metals and other particle-phase species from on-road motor vehicles. They found the following trace elements in the particles: Al, Ba, Be, Ca, Cd, Co, Cr, Cu, Fe, K, Mg, Mn, Mo, Na, Ni, Pb, Pt, S, Sr, Ti, V, Zn.
Other groups [18,19,20,21,22], used Inductively Coupled Plasma-Optical Emission Spectrometry (ICP-OES) to characterize the different biodiesel samples with special concern to quantify the Al, Ca, Cu, Fe, K, Mg, Mn, Na, Ni, P, Sr, B and Cl content, to evaluate the fuel quality and to control the emission of pollutants to the atmosphere. In this case the samples were prepared using a high pressure asher digestion procedure for metal determination in biodiesel samples. Different groups used ICP-MS to characterise additional bound elements, like Cd, As, Ba and Ti in the particulate matter collected from ultra low sulphur diesel and biodiesel powered engine exhaust emissions [23].
In this research we apply a high-resolution laser-induced breakdown spectroscopy technique (LIBS) [24,25,26], for qualitative and quantitative spectrometric measurements of diesel particulate matter collected from passenger diesel combustion engine vehicles in use.
Laser induced breakdown spectroscopy is an emerging measurement technique [27] for rapid qualitative [28] and sensitive quantitative compositional analysis [29,30] of various forms of materials like solids [31], liquids [32], gases [33], powders [34] or nanoparticles [35].
The first pioneering group, that investigated the metallic elements in diesel soot collected on filter by means of laser induced breakdown spectroscopy, was Lombaert et al. [36]. They found that Fe, Cu, Ca, Zn, and Mg appear as the main metallic species deposited within diesel particles on the reference filter.
The aim of this study is to use the LIBS technique for qualitative and quantitative spectrochemical analyses of major chemical elements contained in the diesel-engine exhaust emissions that are contributing to the particulate matter composition from in-use vehicles. The presence of these elements in the exhausts of diesel-engine vehicles originates from different sources. Mainly from the fuel and additives, engine combustion process, incomplete catalytic reaction, inefficient diesel particulate filtering technique, engine failure or even from contaminated intake air.
Every information revealed from these studies can be very beneficial for scientists or engineers, like combustion physicists, engine developers, environmentalists, biomedical and medical scientists or emission specialists, to better understand the DPM composition, for modelling of PM emissions generated from diesel-engine vehicles, for the development of after treatment technologies and to set the future emission standards.
2. Methodology
2.1. Laser-Induced Breakdown Spectroscopy (LIBS) Technique
If a high-power and short-pulse laser is focused into a target material, absorption of the laser radiation followed by temperature rise and subsequent ablation of the material surface occurs. This process is accompanied with the formation of laser plasma [25]. Laser-induced plasma is a very intense and bright source of radiation. Its optical spectral information can be used as fingerprint of emitting atomic and ionic or molecular species, contained in the studied sample. The collected emission data can be further used for the basic spectrochemical analysis of the material’s composition [24]. In LIBS a high-power laser beam, usually with nanosecond pulse duration, is interacting with the target material [37]. This short light—matter interaction generates plasma, from which an optical emission spectrum is collected by the optical spectrometer and then further processed by software. From these LIBS spectra, the elemental chemical composition of the examined sample is obtained. The qualitative spectral information can be further calibrated, to obtain quantitative results. The LIBS technique provides very sensitive and rapid analytical measurements, without sample pre-treatment, in the range of ppm levels [38], almost instantaneously, in contrast to competing analytical techniques, such as Laser Ablation Inductively Coupled Plasma Mass Spectrometry (LA-ICP-MS) [39], Atomic Absorption Spectrometry (AAS) [40], X-Ray Fluorescence Spectroscopy (XRFS) [41], or Secondary Ion Mass Spectrometry (SIMS) [42]. This advantage pushes the LIBS technique forward in many new research areas [43], and makes it also attractive for industrial applications [44,45].
2.2. LIBS Technique for Quantitative Material Analysis
Qualitative and quantitative spectrochemical information about the composition of an examined analyte is contained in the LIBS spectrum. This originates from excited neutrals, ions and molecules within the laser-induced plasma. Therefore, different approaches are known to gain the quantitative information from LIBS measurements. One of the methods determines the concentration of each element independently by evaluating the line emission from known transition probabilities and from absolute measurements of the integrated line intensities. Another possible way is to measure the emission line intensities relative to the line intensity of the main abundant element. Quite often the approaches to obtain quantitative results are the LIBS intensities in relation to known calibration standards or certified reference materials. By assuming the optical emission line intensity (or integral of spectral peak curve), the ratio of the concentration of two species A and B can be expressed as a function ratio of the line intensity of species A to the line intensity of species B. Considering that the concentration ratio is directly proportional to the ratio of corresponding line intensities, it is possible to establish a calibration function. This curve is basically a plot of relative concentrations of an element obtained by LIBS measurements versus the known relative concentrations of this element in the samples. Calibration curves can be then used for the quantitative determination of unknown concentrations in the examined material.
3. Experimental Procedures
3.1. LIBS Setup
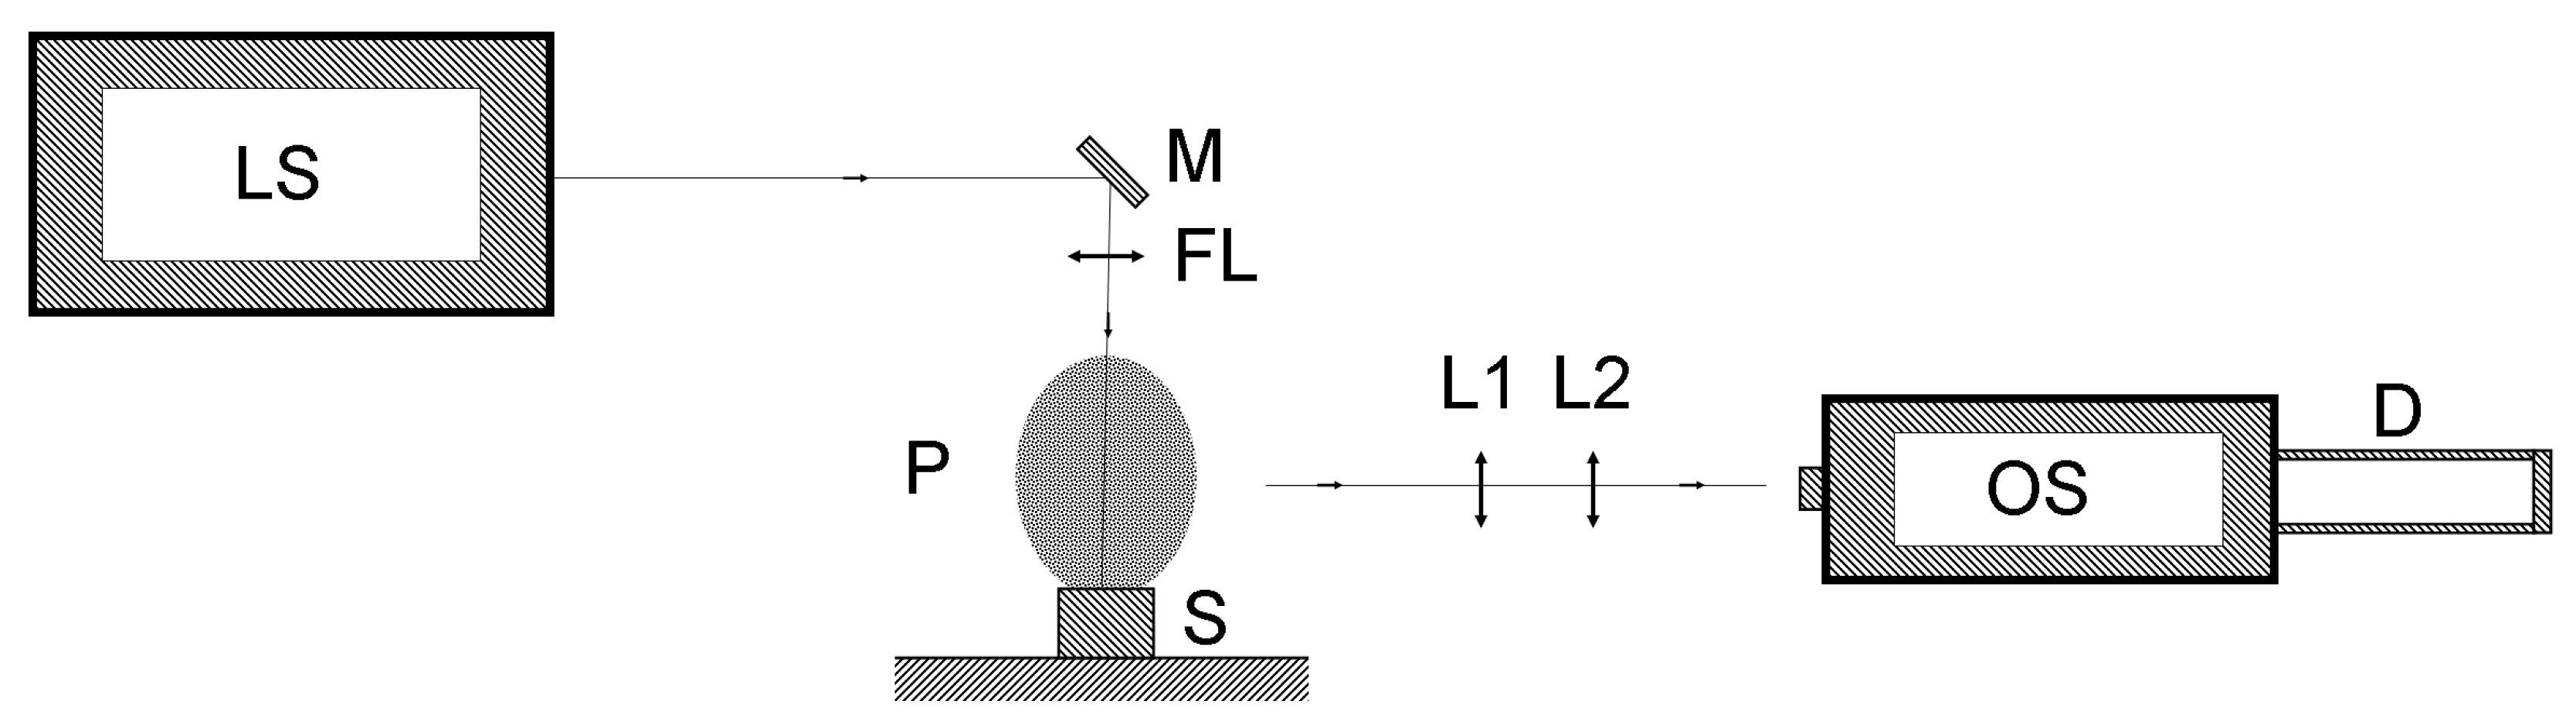
The experimental setup for laser induced breakdown spectroscopy measurements of particulate matter collected from in-use diesel-engine passenger vehicles consists of a high intensity pulsed laser system, with nanosecond laser pulse duration, the experimental chamber, a collection of optics and a high precision optical spectrometer. The plasma is generated by focusing the high-intensity laser pulse into the target. Usually a solid state laser or diode pumped laser is applied at its fundamental wavelength of 1064 nm or the second harmonic (532 nm) with repetition rates ranging from 1 Hz to few kHz. A schematic of the experimental LIBS setup is shown in Figure 1.
To generate the laser induced breakdown from diesel particulate matter, a Nd:YAG solid state laser from Quantel was used. It was operated at the fundamental laser wavelength of 1064 nm with pulse duration 8.5 ns and laser energy 300 mJ per single pulse. Due to the large number and different origin of DPM matrices, we applied higher laser energy, to enhance the optical emission from the plasma and gain signals from the infrared, visible as well as ultraviolet spectral regions. The laser radiation has been focused with a 10 cm focusing lens into the plane of the DPM solid target surface to create a plasma. Optical emissions from the plasma have been collected perpendicularly, via an optical telescope, into the high-resolution Echelle spectrograph (Model Aryelle Butterfly from LTB Lasertechnik Berlin, equipped with an Intensified Charge Coupled Device-ICCD) detector. The spectrometer consists of two separate spectrographs, one for the UV range from 190 nm to 440 nm and the second unit for the visible (VIS) optical spectrum in a range from 440 nm to 800 nm. The spectral resolution capability is from 3 p.m. to 7 p.m. for the ultraviolet (UV) range and from 4 p.m. to 8 p.m. for the VIS range, thus providing spectral information of a broad range with very high-resolution and variability. Optical emissions from the plasma have been collected from ultraviolet to infrared spectral window, thus the total spectrum from 190 nm to 800 nm were recorded. The delay time for starting recording of the optical spectral signal was set to 1 μs after the trigger signal, and gate time for spectral acquisition has been set to 2 μs. In earlier delay times than 1μs, the black body radiation dominates in the laser-induced plasma, while for later time intervals like 3 μs the atomic and ionic emissions start decaying [46]. The LIBS emission was measured in an open air atmosphere under atmospheric pressure and at room temperature.
3.2. Particulate Matter Collection and Sample Preparation
Sixty-seven different DPM samples were obtained from miscellaneous in-use diesel-engine passenger vehicles of diverse types and models from major brand car producers in Europe. Vehicles selected for the sample collection were from production models that are frequently encountered on public roads. Neither preproduction vehicles nor experimental engines were used. It is important to mention that these studies have not been concerned with the technical conditions and properties of individual vehicles. As well as the air pollution has not been taking into the account as we have neither measured the chemical composition of engine intake air nor the particles attached at the air filters of the vehicles. Both conditions would be hard to assess, because vehicles were driving in different environment during their life time. Diesel particulate matter has been extracted from the end sections of the tailpipes of the passenger vehicles that means from position after the Diesel Particulate Filter (DPF), Diesel Oxidation Catalyst (DOC) or catalytic converter if applied. For this purpose we have carefully collected only upper part of particulate matter residual deposits from the tailpipe wall, which has been stored individually for each vehicle. Each PM sample was produced from one different vehicle. Even more vehicles and PMs were actually accessed, but due to the sample preparation and measurements, not all samples were sustained or were sufficient for LIBS consistent measurements. Vehicles were selected randomly and no manufacturer was preferred. All these samples were analysed using the LIBS method. The results presented in this paper originate from eight largely diverse DPM matrices with respect to the LIBS spectrum. The reason is to qualitatively and quantitatively describe the elemental composition of these matrices by laser induced breakdown spectroscopy. A special emphasis is given to analyse the major spectral lines that are mostly pronounced in the ultraviolet, visible and infrared optical emission spectrum from diesel particulate matter. The collected exhaust particles from individual in-use diesel-engine vehicles have been mechanically pressed into solid pellets with a flat disc shape. These DPM samples were then analysed by LIBS without further preparation. The optical spectra obtained were averaged over 12 laser shots. Also various positions on each pellet were sampled, to assure the repeatability and reproducibility of the measurements.
4. Results and Discussion
4.1. Qualitative Measurements of Particulate Matter
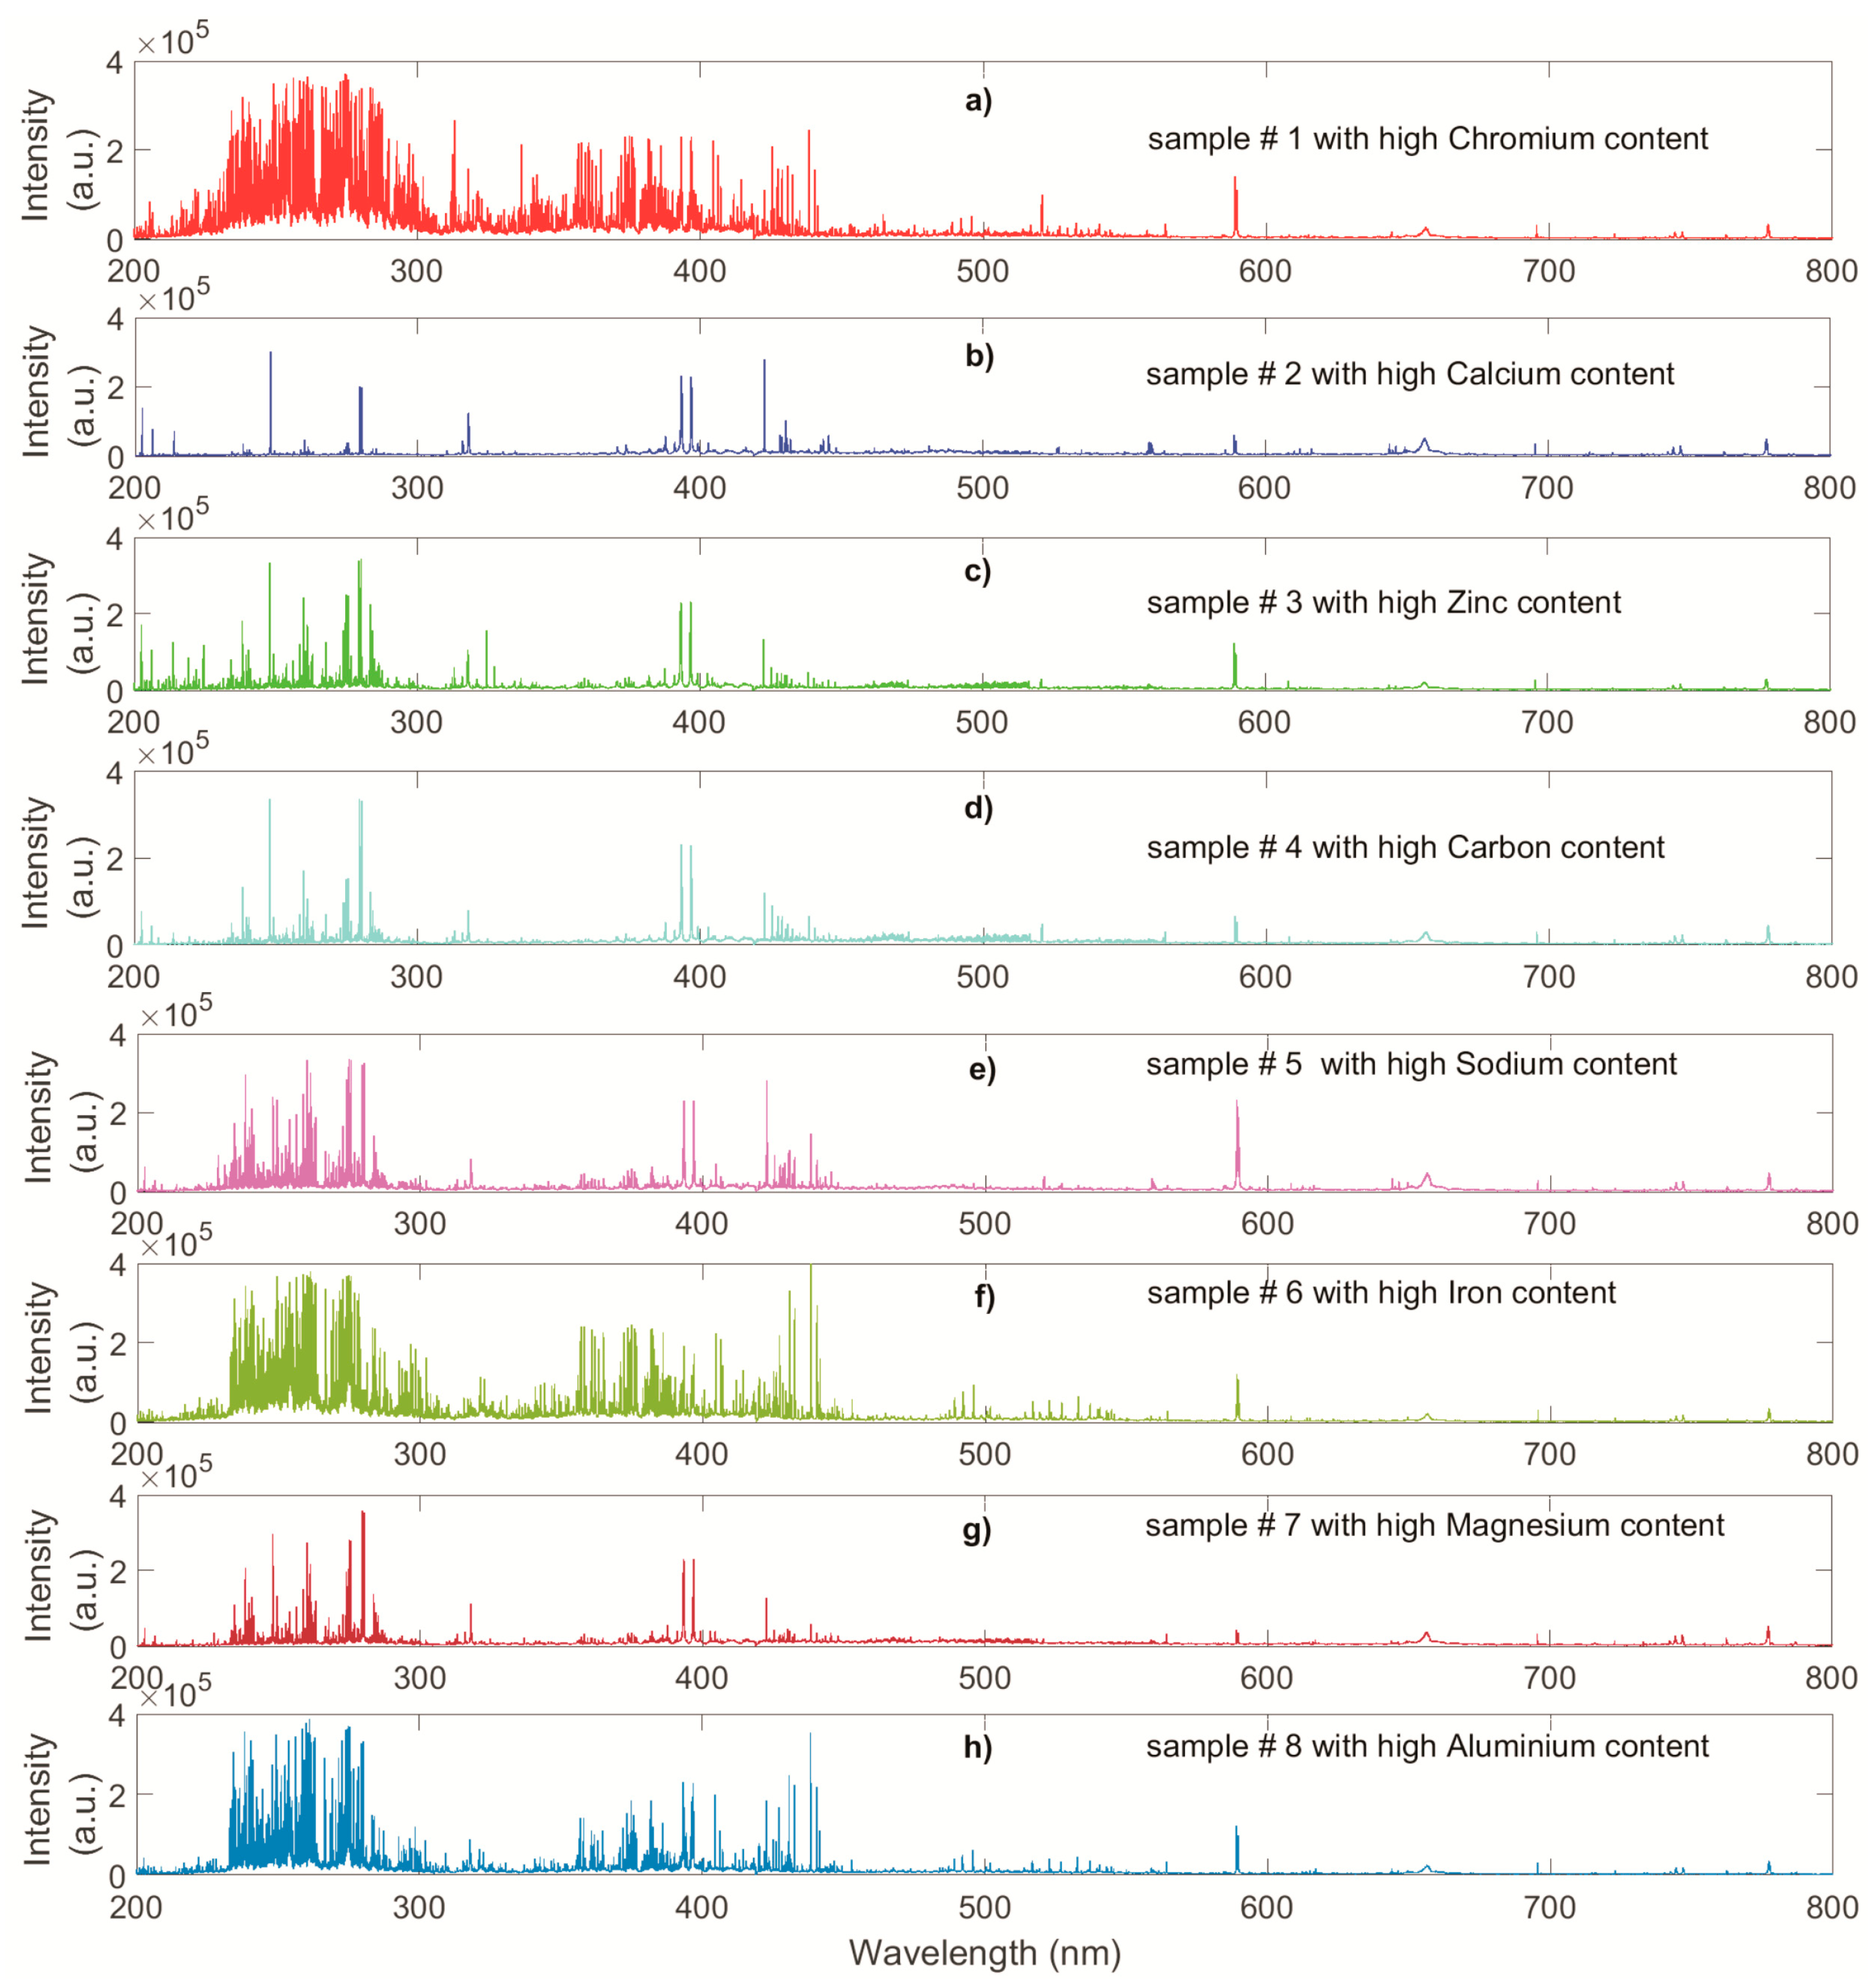
To this end, the state-of-the-art laboratory laser-induced breakdown spectroscopy setup was used to obtain precise and high resolution optical emission spectra recorded from laser induced plasma interaction with different DPM matrices. The qualitative LIBS results of these measurements are shown in Figure 2. Here, the signal is dominating by strong lines—optical emissions from: (a) carbon, (b) iron, (c) magnesium, (d) aluminium, (e) chromium, (f) zinc, (g) sodium and (h) calcium spectral lines. A LIBS spectrum exhibits characteristic optical emissions with distinct lines of atomic, ionic and molecular origin in the signal.
In Figure 2, the spectral line emission from DPM samples differs considerably. Thus the chemical compositions of the particulate matter matrix also change. Consequently this is because of different origin of DPM samples are the unique formation of the diesel exhaust emissions. In fact, the source of composition differences is a combination of: the composition of diesel fuel and quality, additives in the fuel, combustion process, type of the engine, performance of the engine and composition of the intake air. Other parts that influence the final composition of DPM are applied aftertreatment devices, like DPF or catalytic converter. All these input parameters influence the final chemical composition of exhaust diesel particulate matter matrix from diesel vehicles.
4.2. Major Chemical Elements of Particulate Matter
Carbon Spectral Line
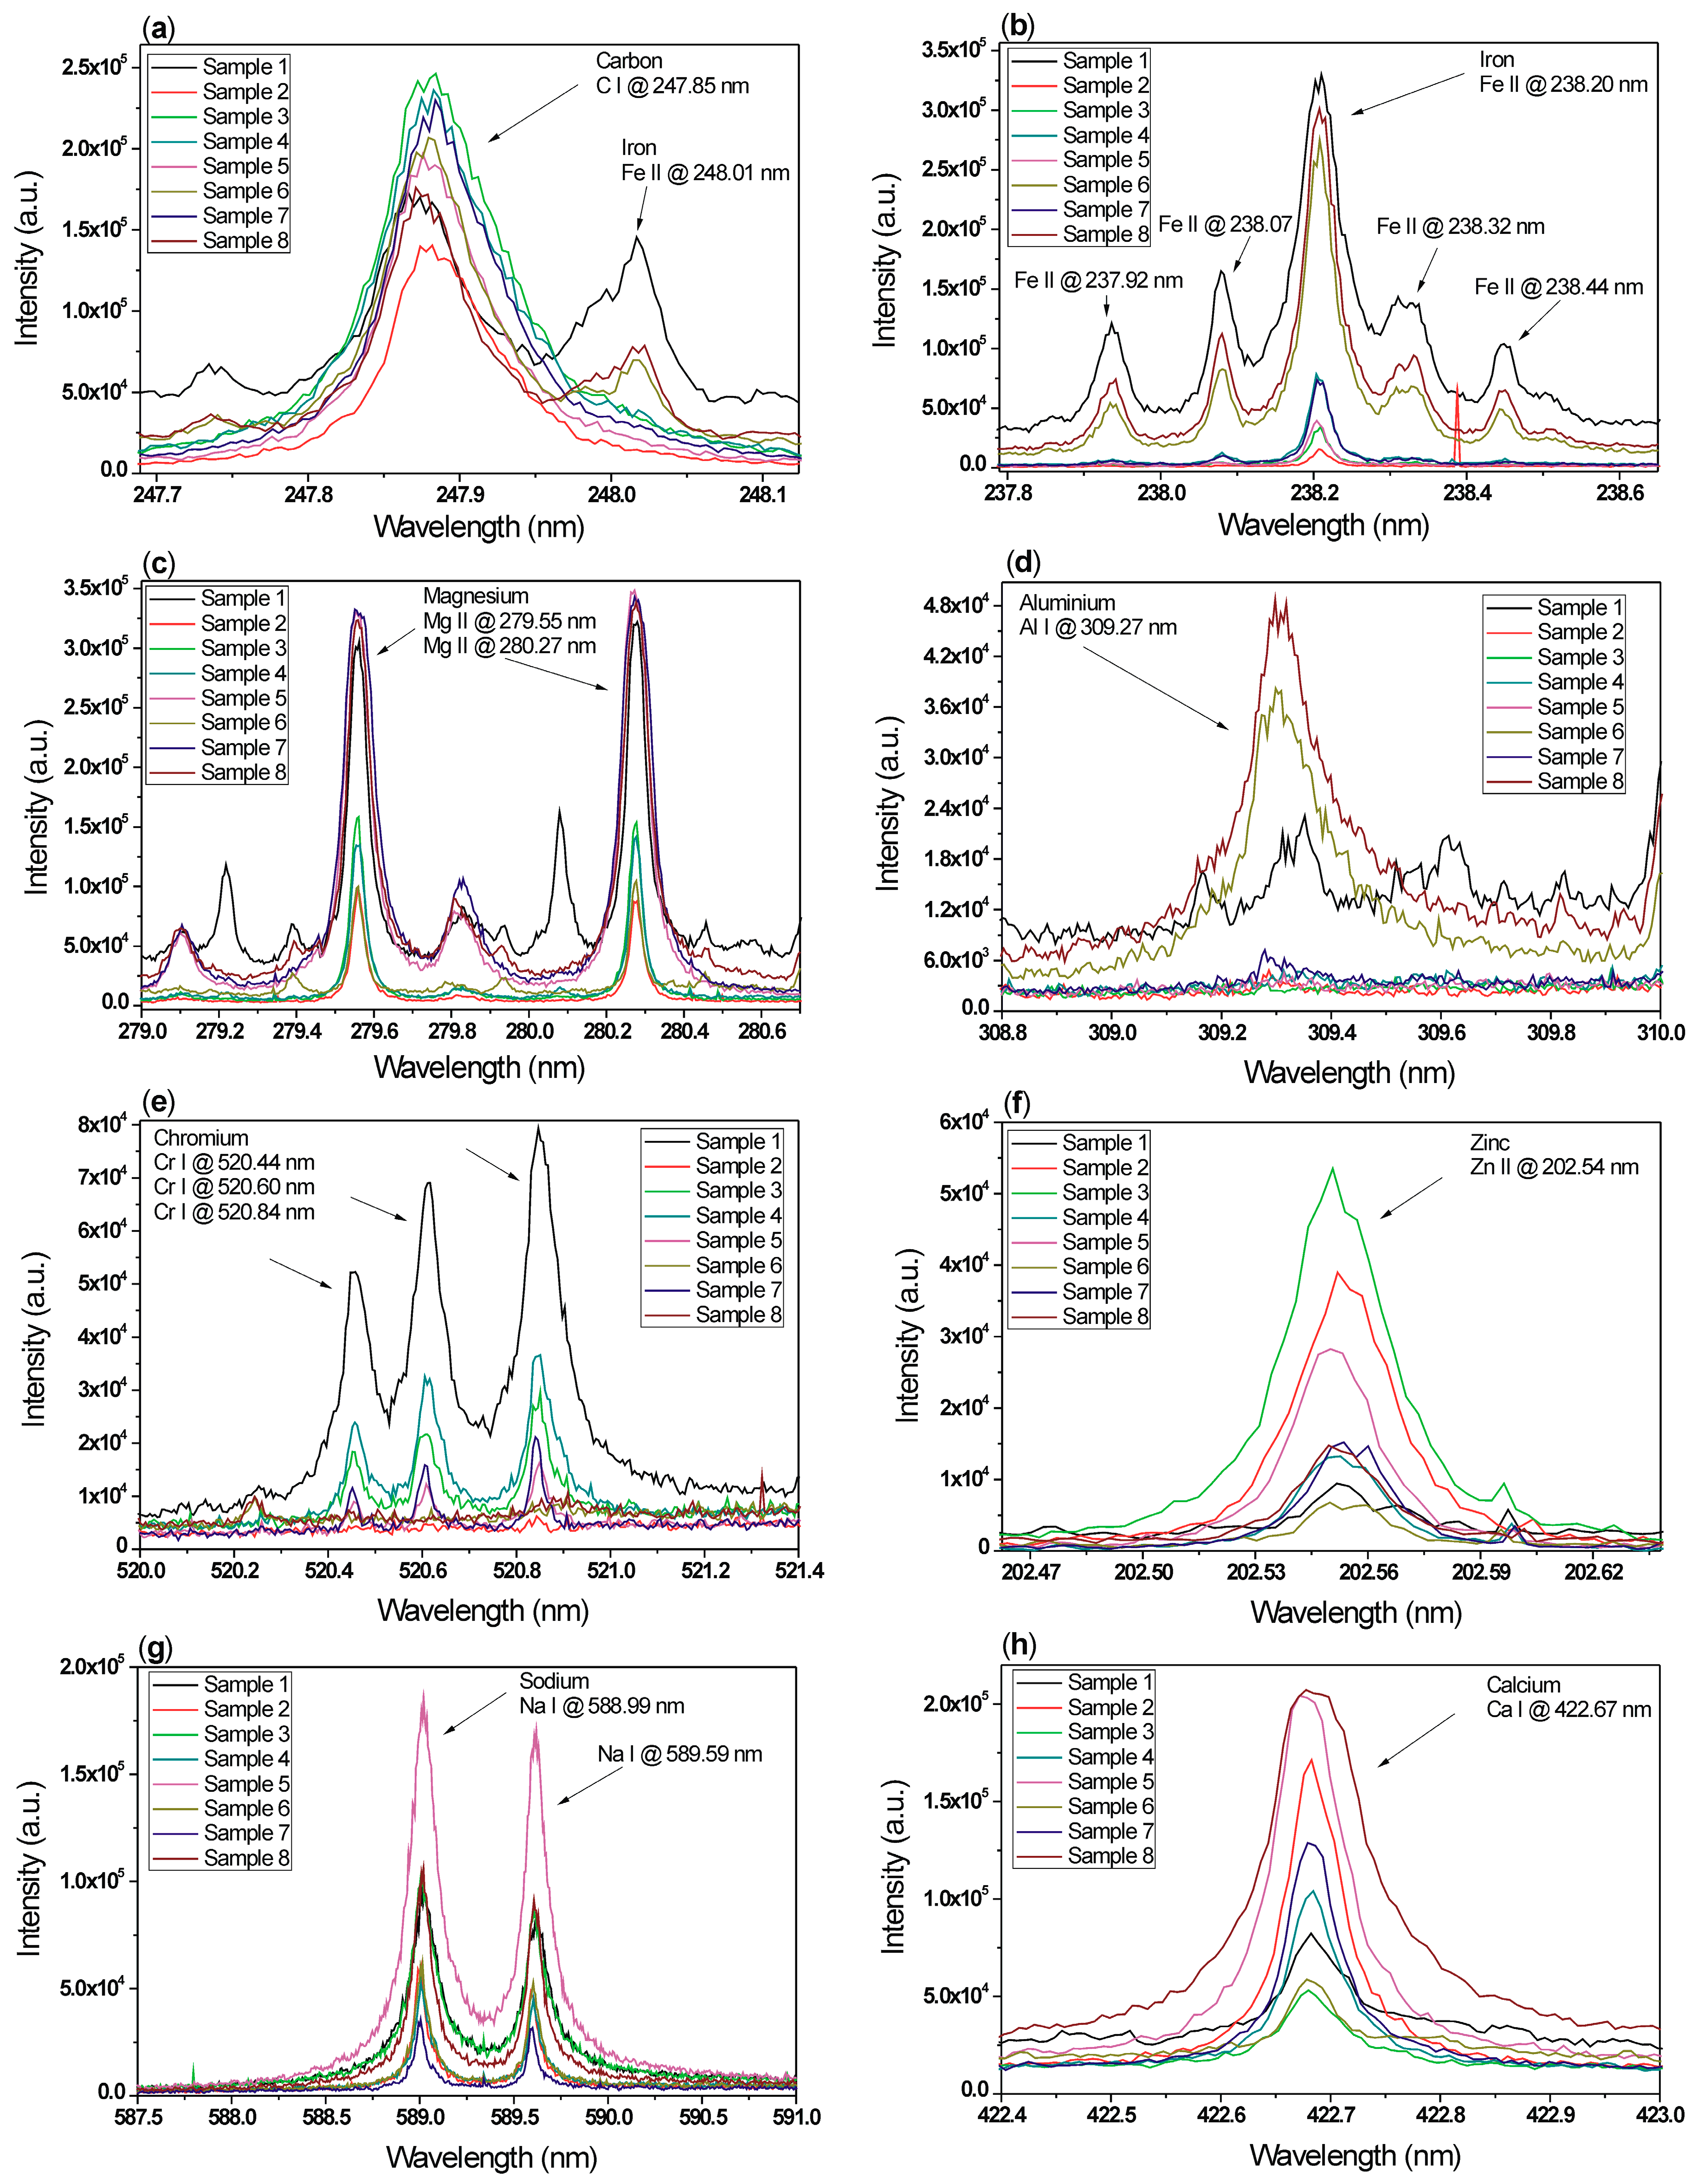
In Figure 3a a comparison of eight atomic carbon spectra (C I at 247.85 nm) from different DPM samples with high content of C, Fe, Mg, Al, Cr, Zn, Na, Ca is shown. The peak intensity and width varies for each spectrum. Additionally samples with a high content of iron (#6), aluminium (#8) or chromium (#1) posses an additional iron peak (Fe II at 248.015 nm), that partially interferes with the carbon spectrum.
Iron Spectral Line
In Figure 3b comparisons of the ionic emission from iron spectral line Fe II at 238.20 nm of eight DPM samples are shown. From the intensity of spectra lines, samples with high content of iron are samples #1, #6, #8. Iron is one of the components often present in the DPM that mainly influences the optical emission. It is responsible for matrix transition and affects the LIBS signal quite considerably.
Magnesium Spectral Line
In Figure 3c comparisons of the ionic doublet from magnesium spectral lines Mg II at 279.55 nm and Mg II at 280.27 nm are shown. Optical emission from magnesium is present in most of the DPM matrices.
Aluminium Spectral Line
In Figure 3d the ionic aluminium signal from Al II at 198.98 nm is shown. Strong aluminium lines are present in three selected DPM matrices, in samples (1, 6, 8).
Chromium Spectral Line
The comparison of the LIBS optical emissions from the atomic chromium triplet lines Cr I at 520.44 nm, 520.60 nm and 520.84 nm is shown in Figure 3e. Chromium lines are pronounced in samples (1,3–5,7).
Zinc Spectral Line
Signal from zinc line Zn II at 202.54 nm is shown in Figure 3f. Zinc is usually present in all DPM matrices. With high intensity is present in samples (2, 3, 5). Zinc is the major trace element and influences DMP matrices significantly.
Sodium Spectral Line
Optical emissions from the sodium doublet atomic spectral lines Na I at 588.99 nm and Na I at 589.59 nm are shown in Figure 3g. Sodium is principally present in all DPM matrices. Sodium lines are relatively intense and dominate in the visible part of the LIBS spectra. This significantly influences the overall composition of DPM.
Calcium Spectral Line
Calcium spectrum Ca I at 422.67 nm is shown in Figure 3h. Calcium lines pervasive in LIBS spectra from DPM and due to the strong LIBS emission are considered as a major element.
4.3. Quantification of the LIBS Signal
Preparation of the Calibration Samples
For the quantification of the LIBS signal, calibration standards with different concentrations of selected chemical elements in the particulate matter were prepared. In particular, carbon, iron, magnesium, aluminium, chromium, zinc, sodium and calcium that form the main matrix elements of DPM. Based on previous qualitative analytical research of individual DPM matrices by LIBS, similar particulate matter matrices were produced as internal standards. Calibration standards have been made of certified pure materials, either from Carl Roth GmbH or from Sigma-Aldrich Inc. (Germany). For all calibration samples, mixtures of extra pure nano-powdered materials were used. Nano-powdered materials were further milled together using a laboratory grinder to assure a well-mixed and fine powder. The powder was mechanically pressed into small pellets with 6 mm diameter, similar to the DPM samples.
Calculation of the Limit of Detection
The limit of detection (LOD) is defined as the minimum concentration of an element detected with a specified degree of uncertainty. In our case of a linear calibration function with 95% of confidence level, the LOD can be calculated as [25]:
where the sensitivity S is the slope of the calibration curve for the specific atomic emission at the lowest measured concentration. The standard deviation, σ, is the precision of the measurement given by:
where the mean value is defined as:
with the obtained quantity , measured n-times.
Measurement of Calibration Samples by LIBS
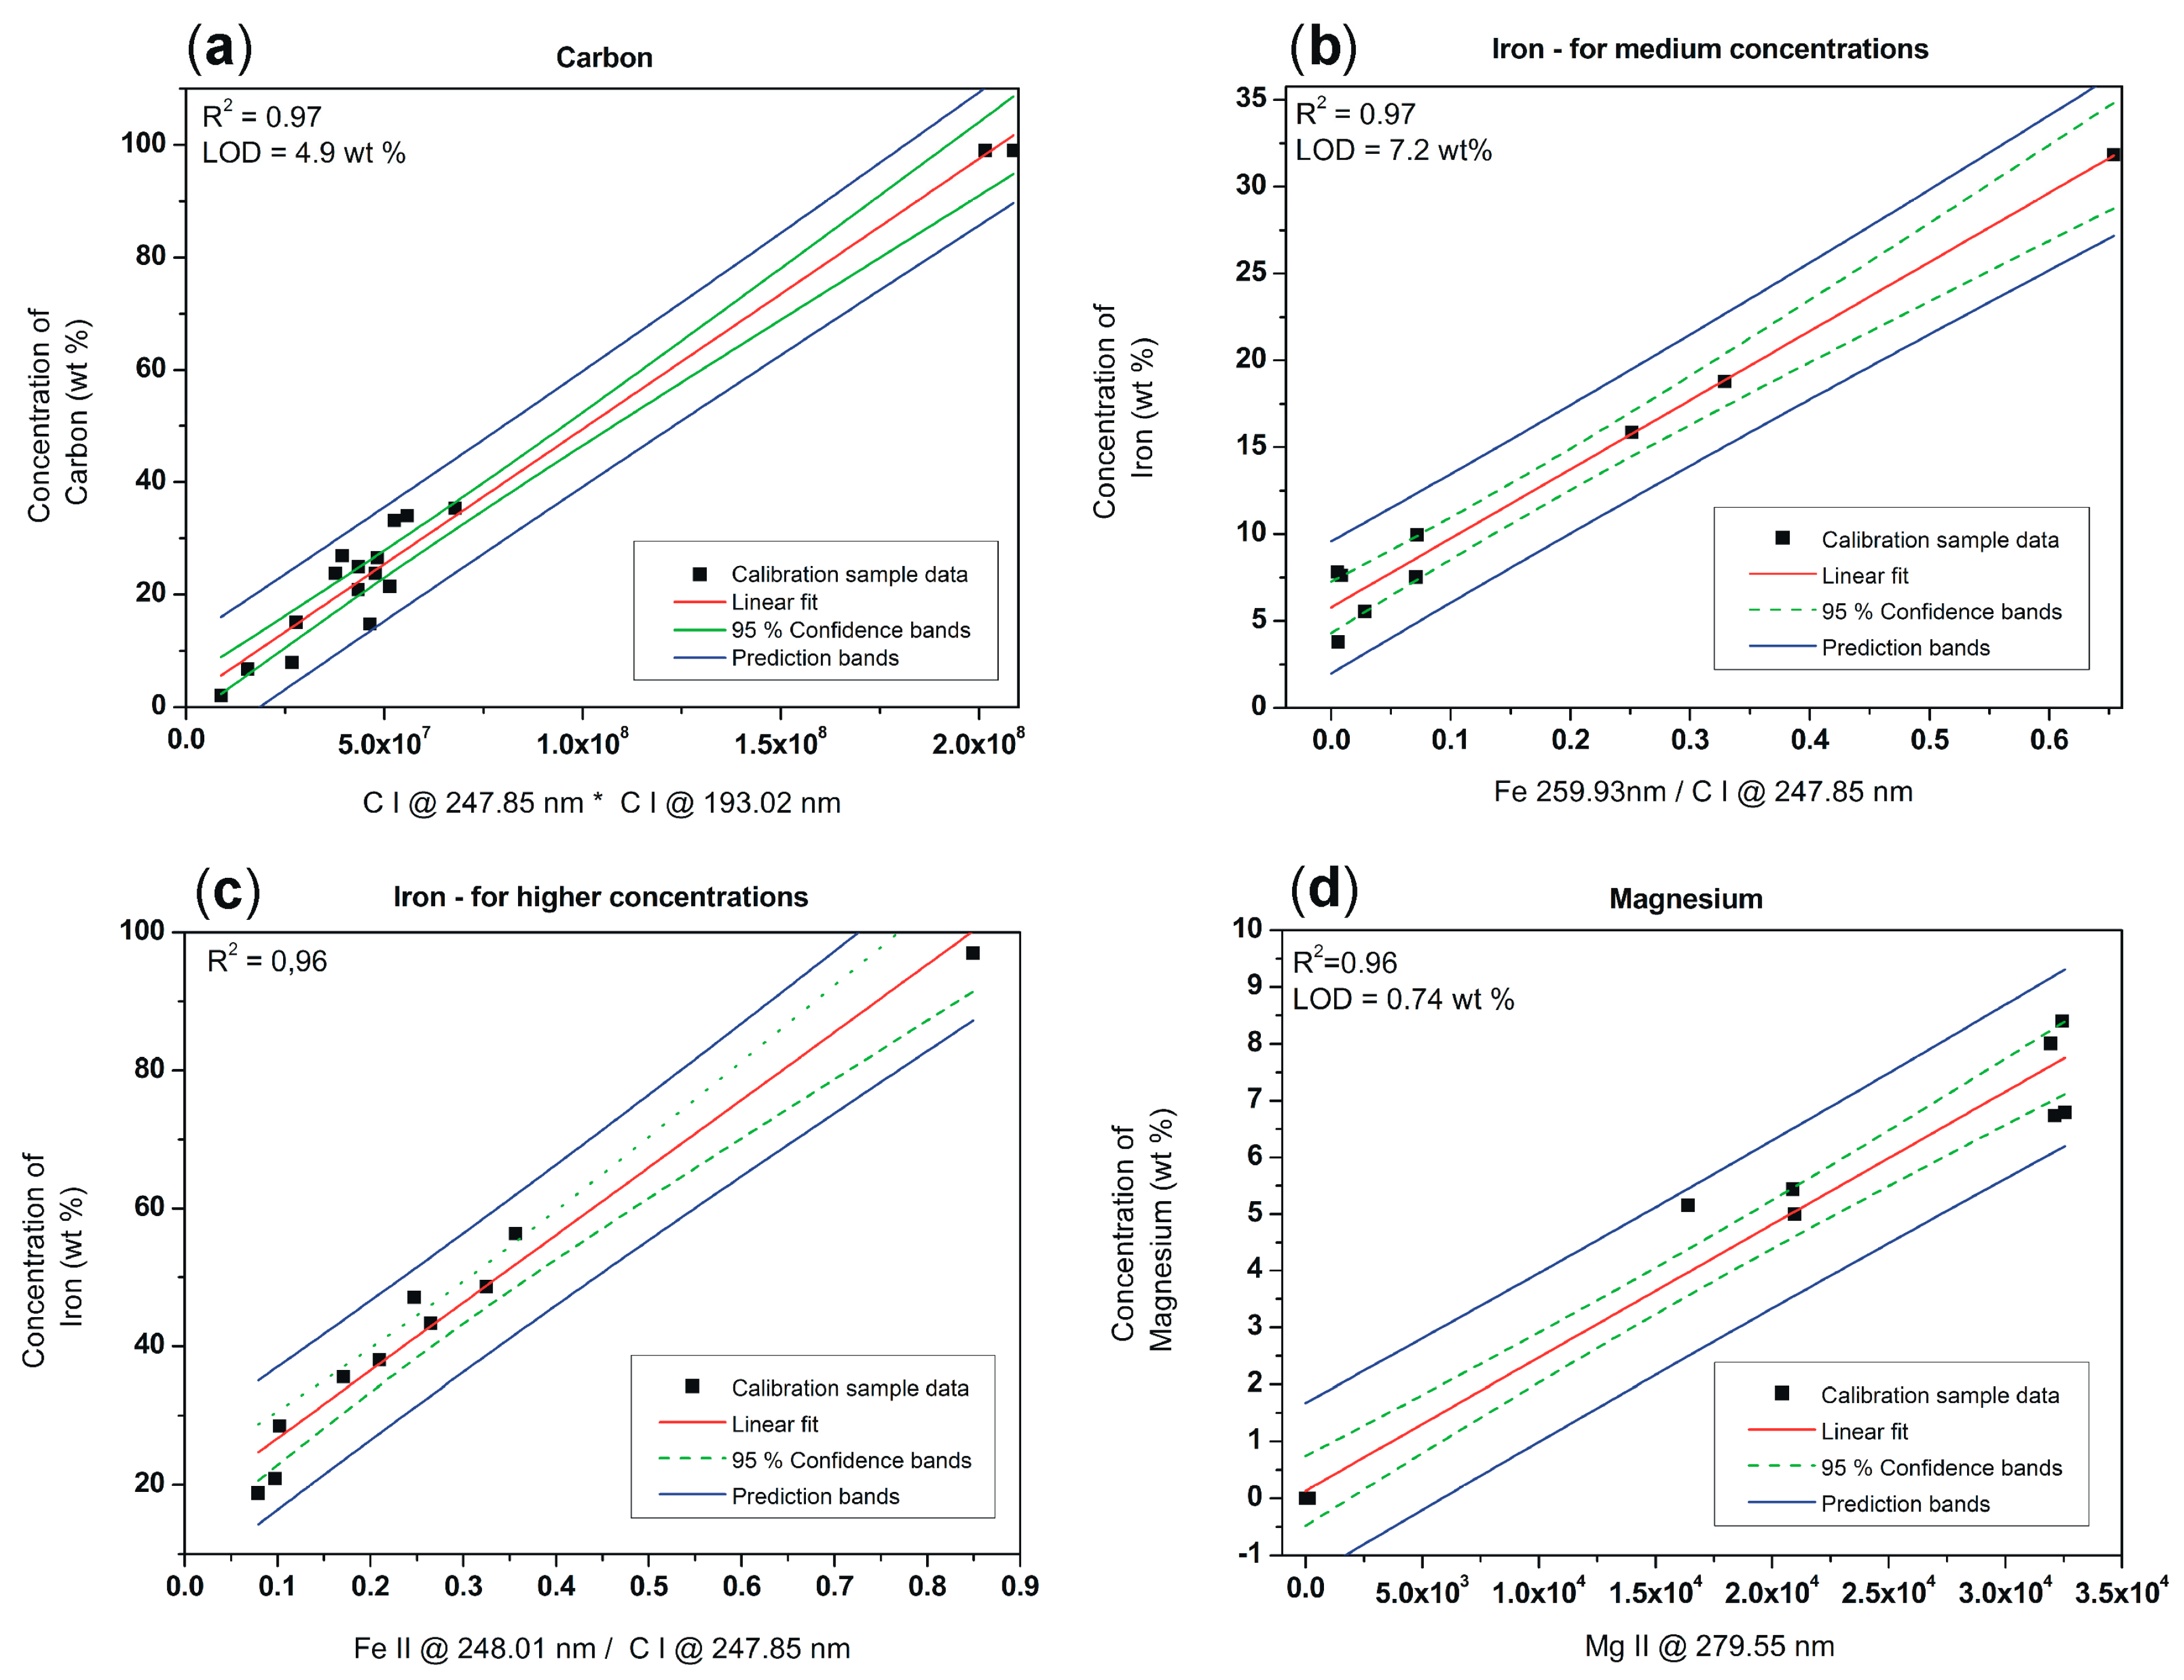
The calibration samples were measured under the same experimental conditions as the DPM matrices above. Identical experimental parameters, optical setup, laser energy (300 mJ), optical spectrometer and ICCD detector settings, particularly the delay time 1 μs and gate width 2 μs remained unchanged. Experimental LIBS measurements were performed in air atmosphere at normal atmospheric pressure. Obtained calibration curves (together with calculated regression parameter R2, limit of detection (LOD), 95% confidence limits and prediction bands) for: carbon, iron—medium concentrations, iron—high concentrations, magnesium, aluminium, chromium, zinc, sodium and calcium, in laboratory prepared PM calibration samples, are shown in Figure 4 and Figure 5.
Carbon Calibration Curve
Two carbon spectral lines that are available were selected to maximise the precision of the calibration function. The product of carbon atomic line C I at 247.85 nm and C I at 193.02 nm from the measured spectra, against the known concentration of carbon in the individual calibration samples were plotted. The integral of the peak signal have been calculated for all calibration samples. The calibration curve of carbon obtained for different particulate concentrations is shown in Figure 4a. In this figure, the calculated ratios are denoted in the graph as black squares, linear fit by solid line (red), 95% confidence limits by dashed lines (green) and prediction bands by solid lines (blue). The regressive parameter R2 was calculated to 0.97 and the LOD was determined from weighted linear fit and 95% confidence limits to 4.9 wt%. It is important at this stage to mention that the LOD for carbon is relatively high, due to the fact that we simply deal with a carbon dominated matrix, therefore this calibration protocol is not intended to be applied to low carbon concentrations. The obtained calibration curve will yield the possibility to predict the level of carbon concentrations in various diesel particulate matrices.
Iron Calibration Curves
Iron is very often present in the DPM matrices with either higher or lower concentrations. Due to the dominant characteristic of the iron spectral lines, it was necessary in this case to construct two calibration curves. The first calibration function for the range of medium iron concentrations was calculated for 5 wt% to 20 wt% and the second function for higher iron concentrations from 20 wt% to 100 wt%. This is due to the fact, that between the first and second group the matrix begins to transform from a carbon dominated matrix towards a more iron defined matrix. To increase the precision of calibration, it is useful to apply an individual calibration curve for each matrix type.
To construct a calibration curve for iron with medium content, we calculated the ratio between ionic iron lines, Fe II at 259.93 nm and carbon atomic lines C I at 247.85 nm. The result is shown in Figure 4b where the linear fit, together with 95% confidence bands and prediction bands for calibration sample data are shown. Here we obtained a regression parameter of R2 = 0.97 for the fit and identified the LOD as 7.2 wt%. In the second case—the calibration curve for higher concentrations of iron in the samples—we calculated the ratio between ionic iron lines, Fe II at 248.01 nm and the carbon atomic lines C I at 247.85 nm, see Figure 4c. Here, the regression parameter was R2 = 0.96.
Magnesium Calibration Curve
To obtain a magnesium calibration curve from the standardized samples we calculated the peak integral of ionic spectral line Mg II at 279.55 nm. The R2 parameter was calculated from linear regression to 0.96 and the LOD from 95% confidence bands to 0.74 wt%. Our calibration curve for Mg is shown in Figure 4d.
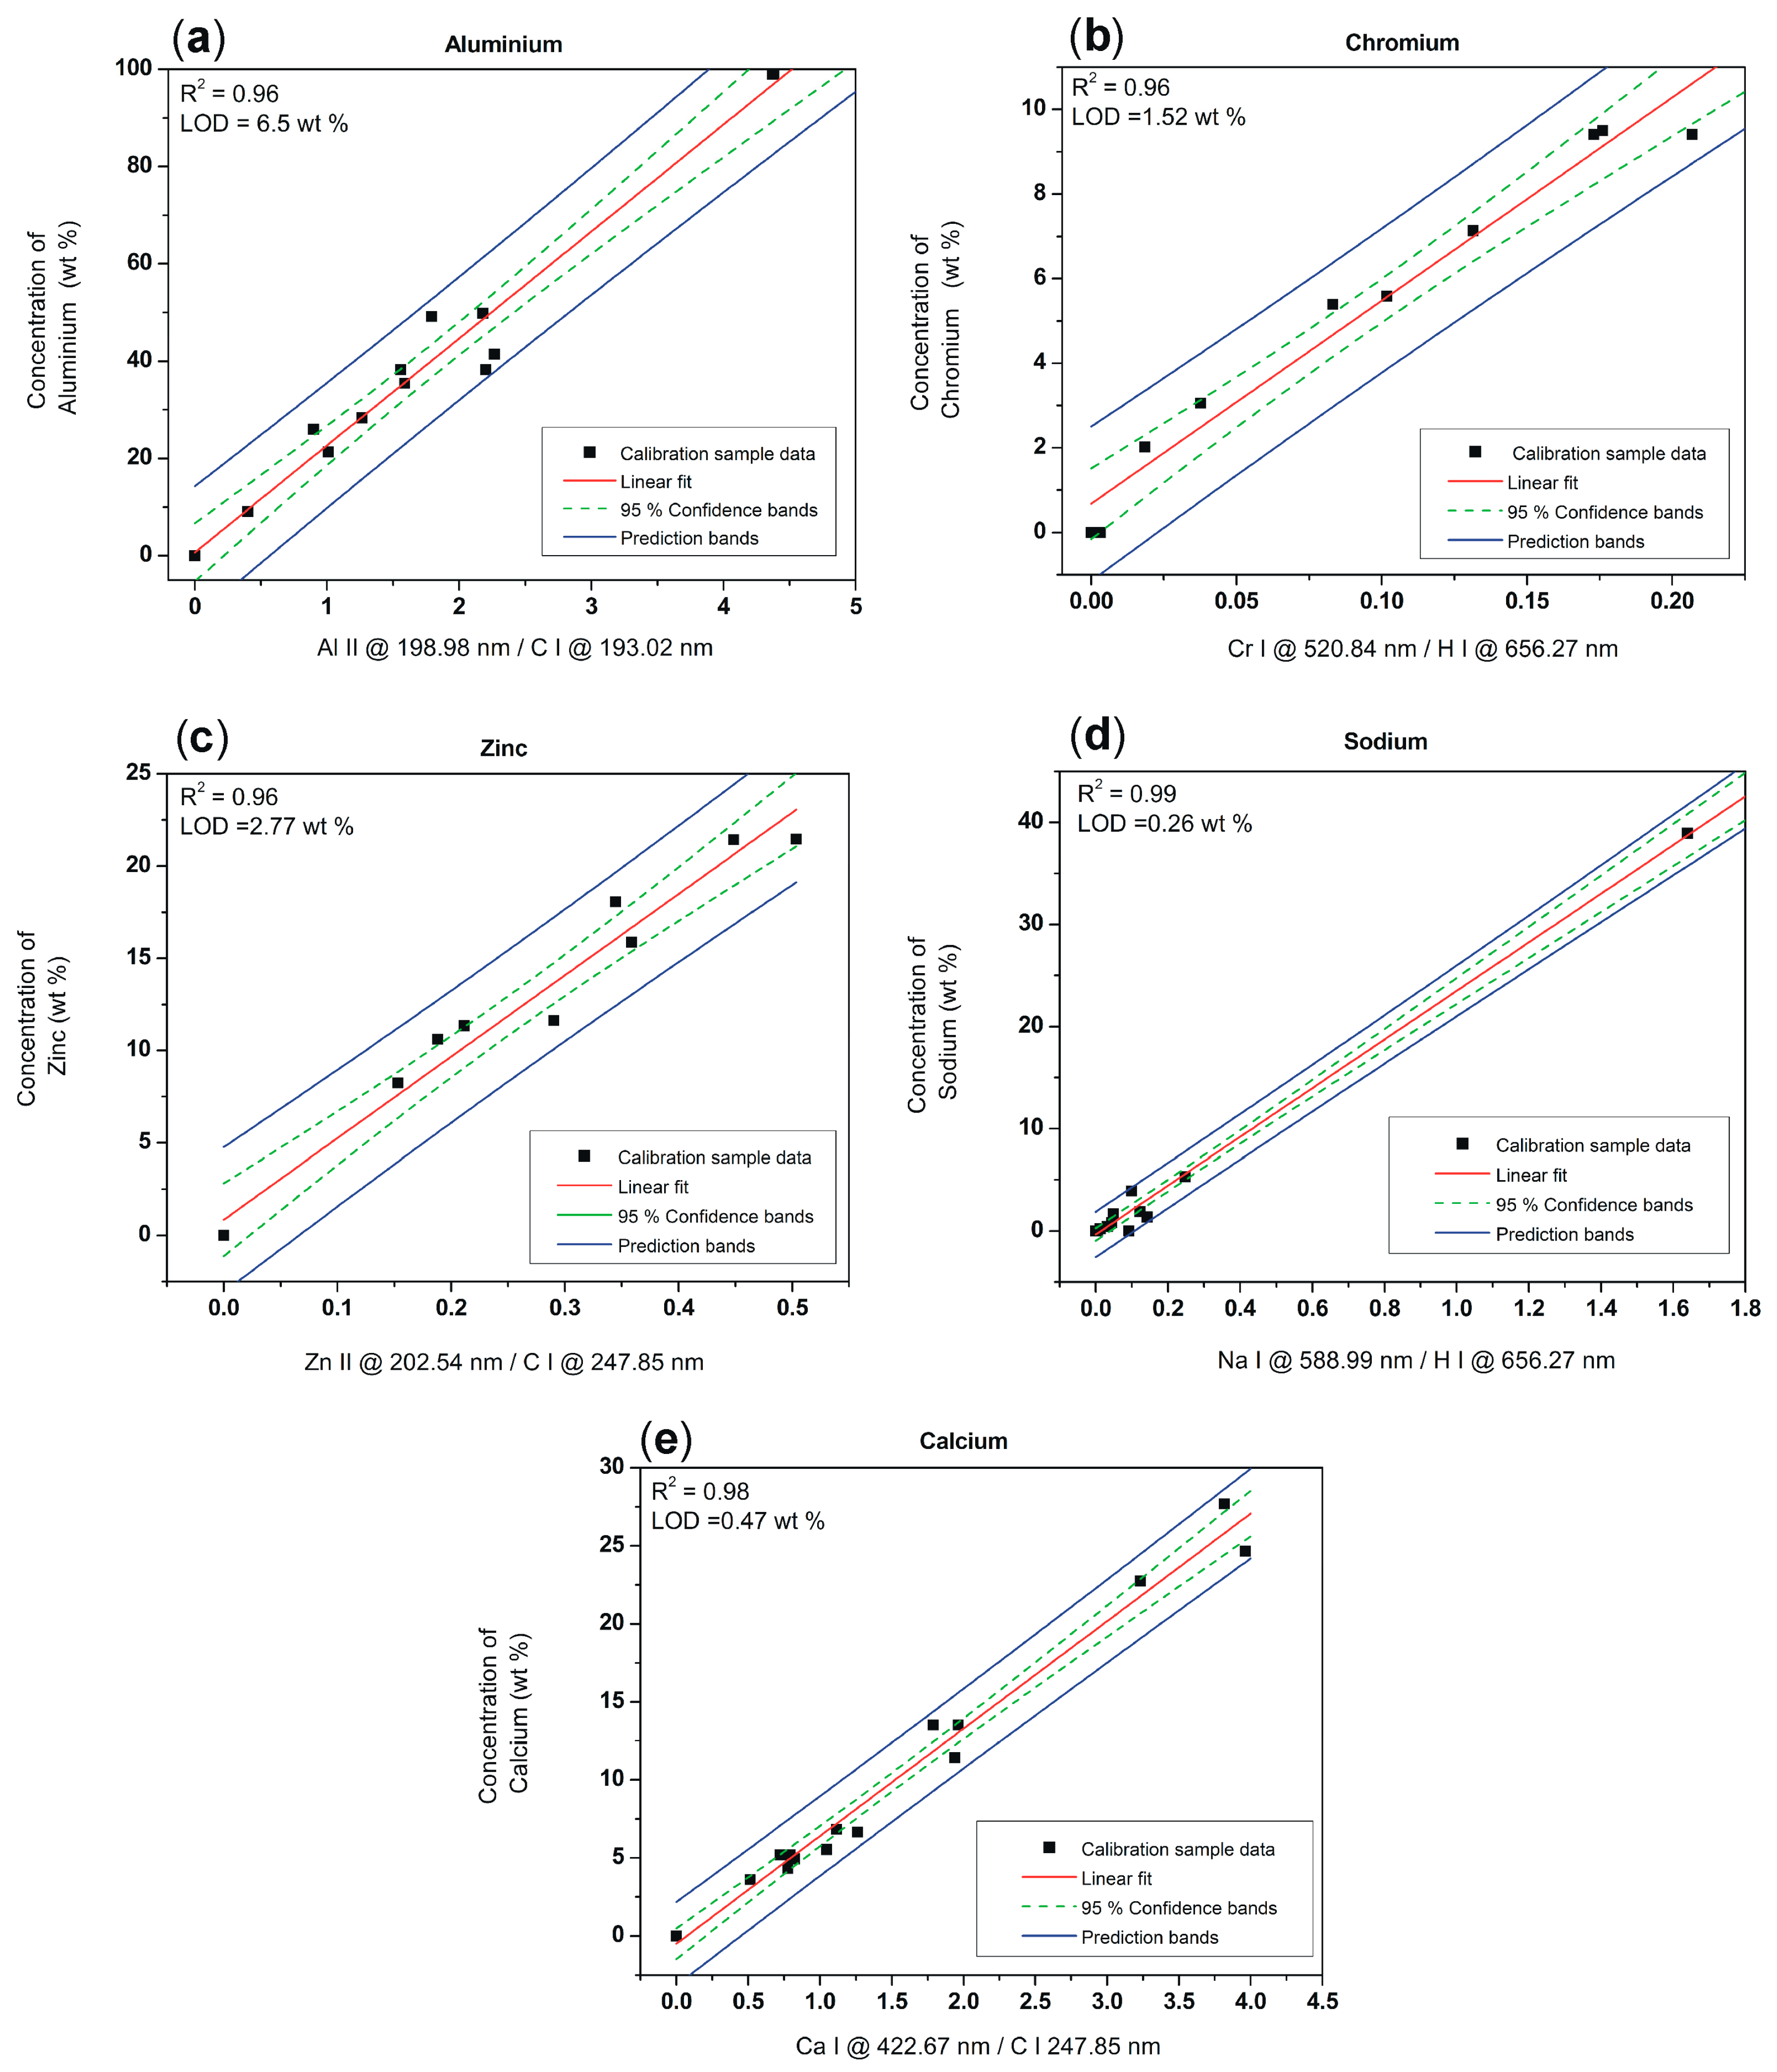
Aluminium Calibration Curve
An aluminium calibration curve was constructed from the ratio between ionic line Al II at 198.98 nm and the carbon atomic line C I at 193.02 nm. The R2 parameter was calculated from linear regression to 0.96 and the LOD from 95% confidence bands to 6.5 wt%. The linear fit for Al is shown in Figure 5a.
Chromium Calibration Curve
In Figure 5b the calibration data of chromium together with a linear fit are shown. The calibration curve was calculated as the ratio between atomic line Cr I at 520.84 nm and hydrogen, H alpha line, H I at 656.27 nm. The R2 parameter was calculated to 0.96 and the LOD to 1.52 wt%.
Zinc Calibration Curve
To gain the calibration curve for zinc from calibration samples, the ratio between ionic spectral line Zn II at 202.54 nm and the carbon atomic line, C I at 247.85 nm was calculated. In this case the regression parameter R2 from the linear fit was 0.96 and the limit of detection LOD = 2.77 wt%. The results for Zn are shown in Figure 5c, together with the confidence and prediction bands.
Sodium Calibration Curve
The element sodium was calibrated through the ratio between sodium atomic spectral line Na I at 588.99 nm and the hydrogen alpha line, H I at 656.27 nm. The integral of the spectral lines were calculated and data are shown in Figure 5d. Thus the calibration curve was obtained from a linear fit with the regression parameter R2 = 0.99. The limit of detection for sodium was determined from the confidence bands to 0.26 wt%.
Calcium Calibration Curve
Calcium is also a major element in diesel particulate matter. To obtain the concentration level of this element, the calibration function was constructed from the ratio of calcium atomic spectral line Ca I at 422.67 nm and the carbon atomic line C I at 247.85 nm. The calculated data are shown in Figure 5e, together with the linear fit, confidence and prediction bands. From linear regression, the R2 parameter was calculated to be 0.98 and the LOD = 0.47 wt%.
Selected spectral lines used for calculation of LIBS signal, and obtained regression parameters R2 together with LOD from calibration functions of different analytes are summarised in Table 2.
4.4. Quantitative Composition of Particulate Matter from Selected In-Use Diesel-Engine Vehicles
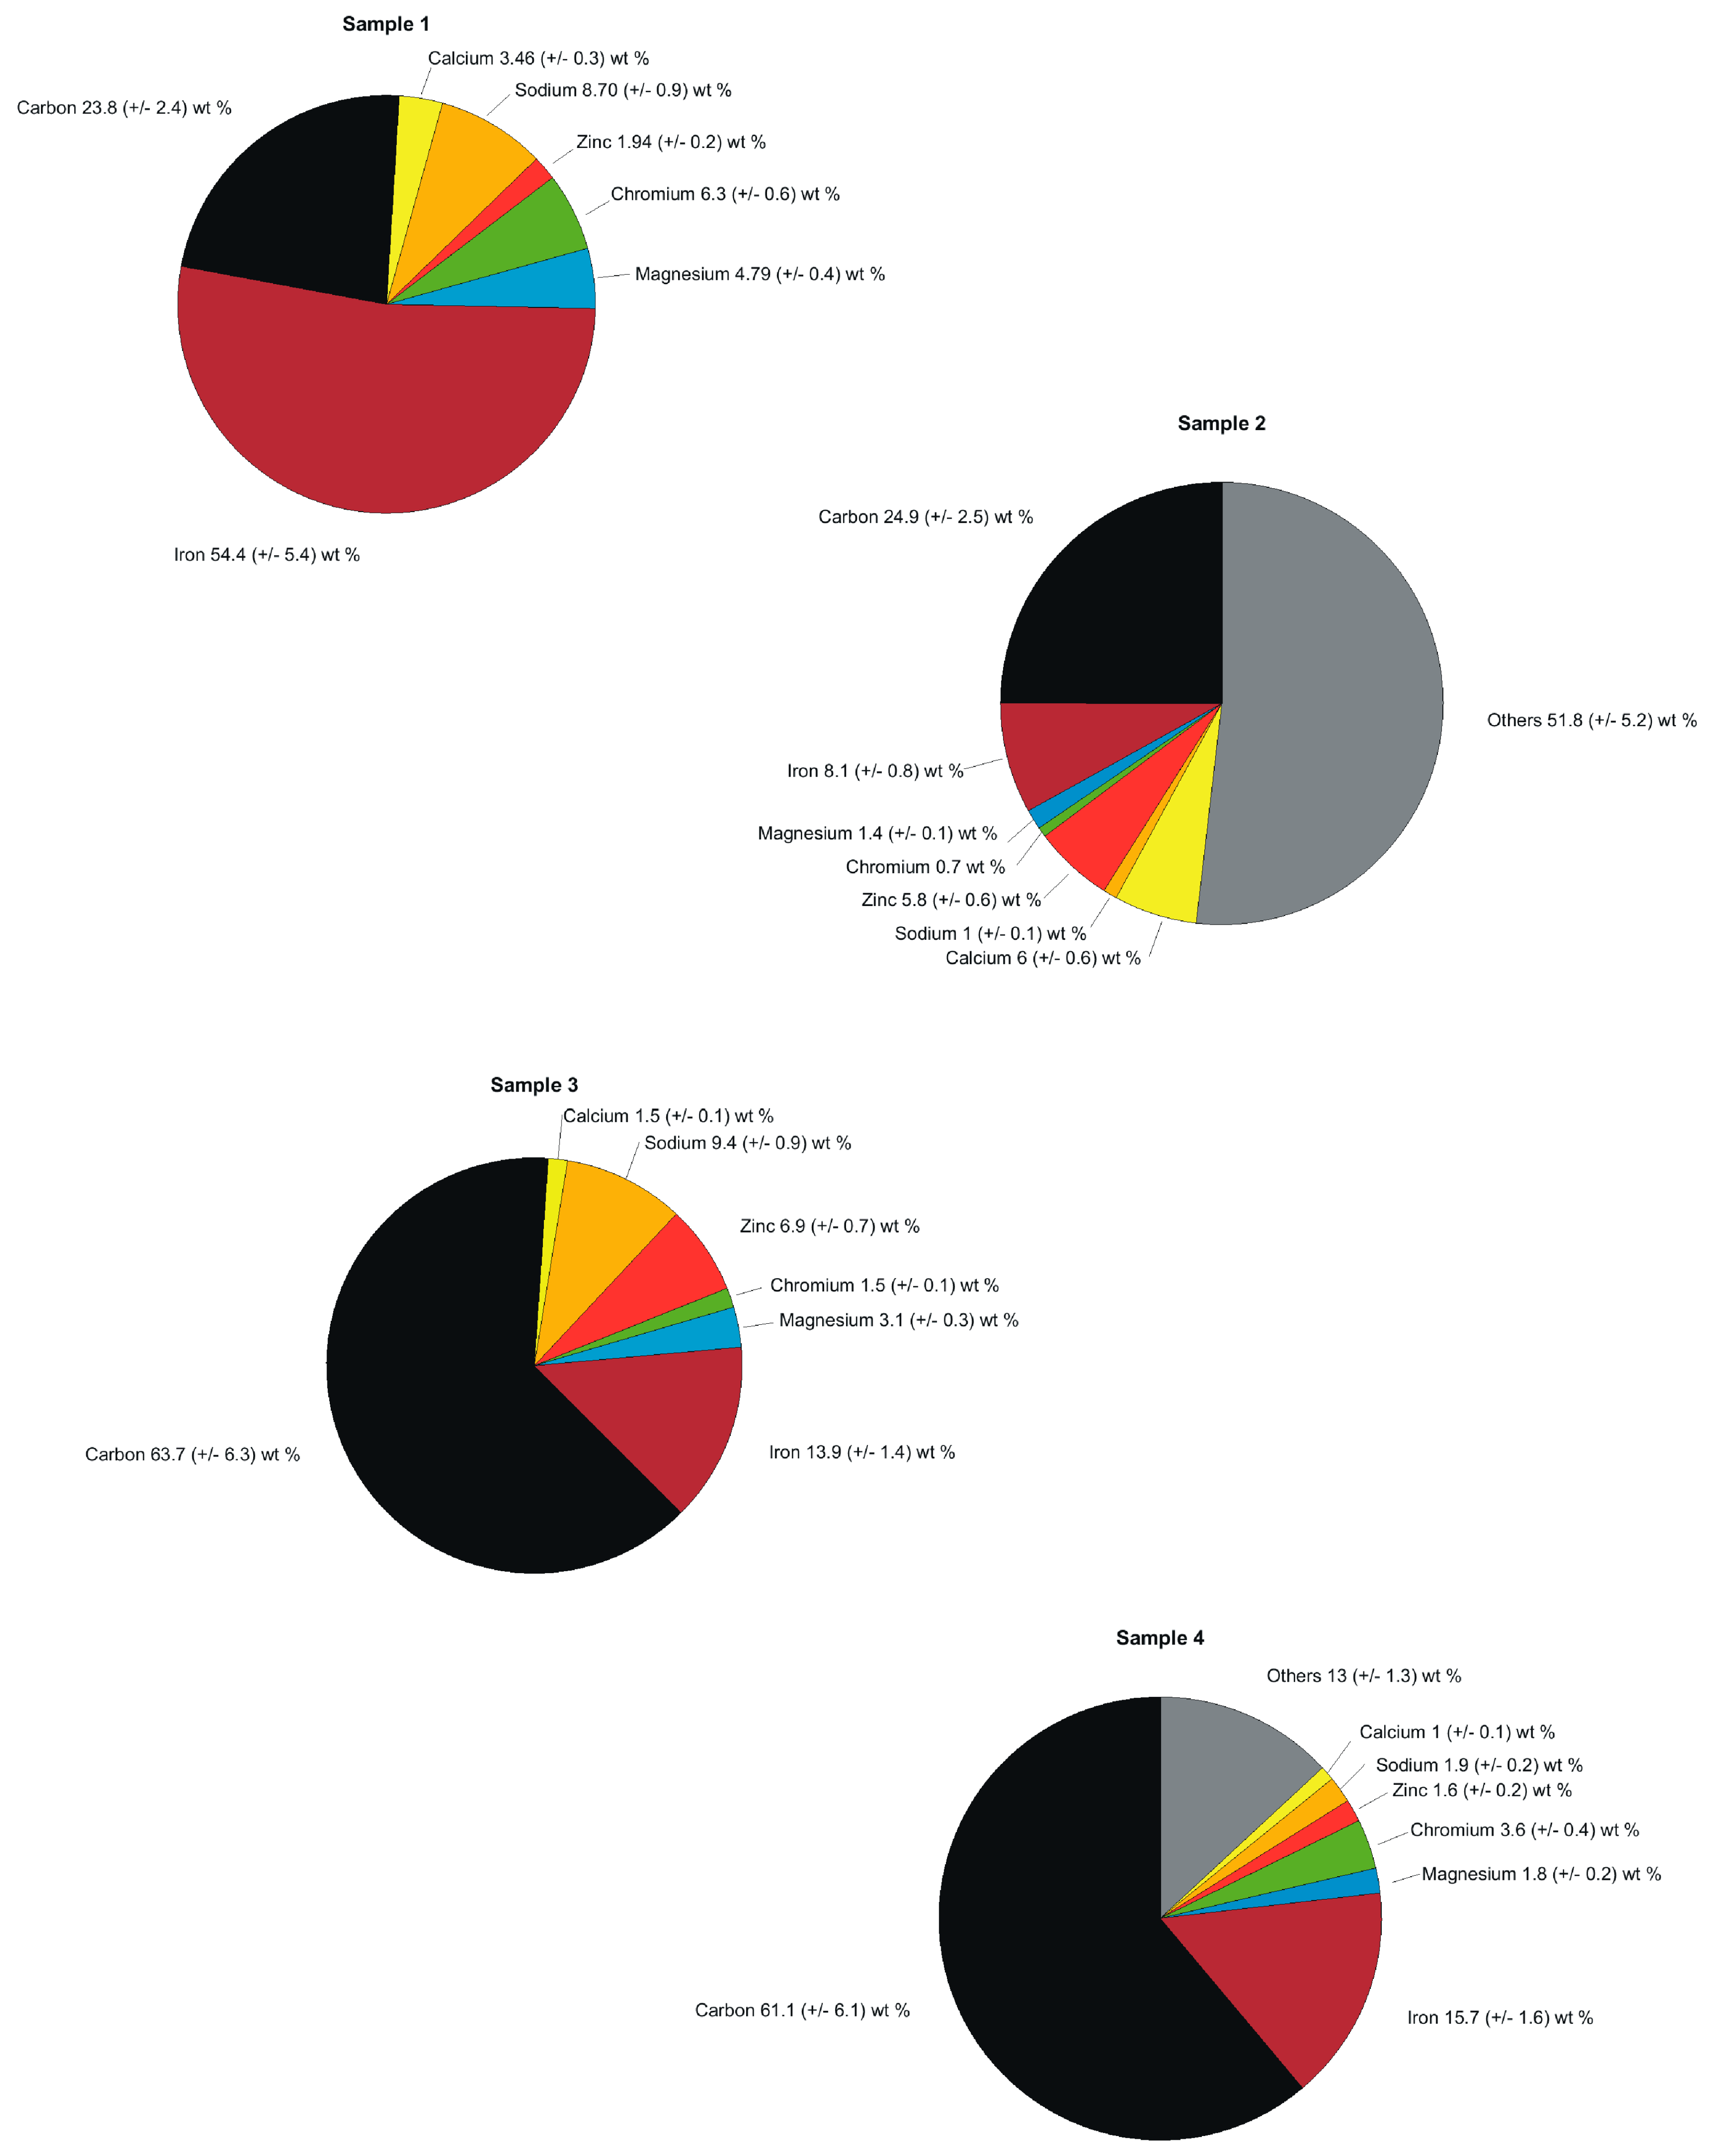
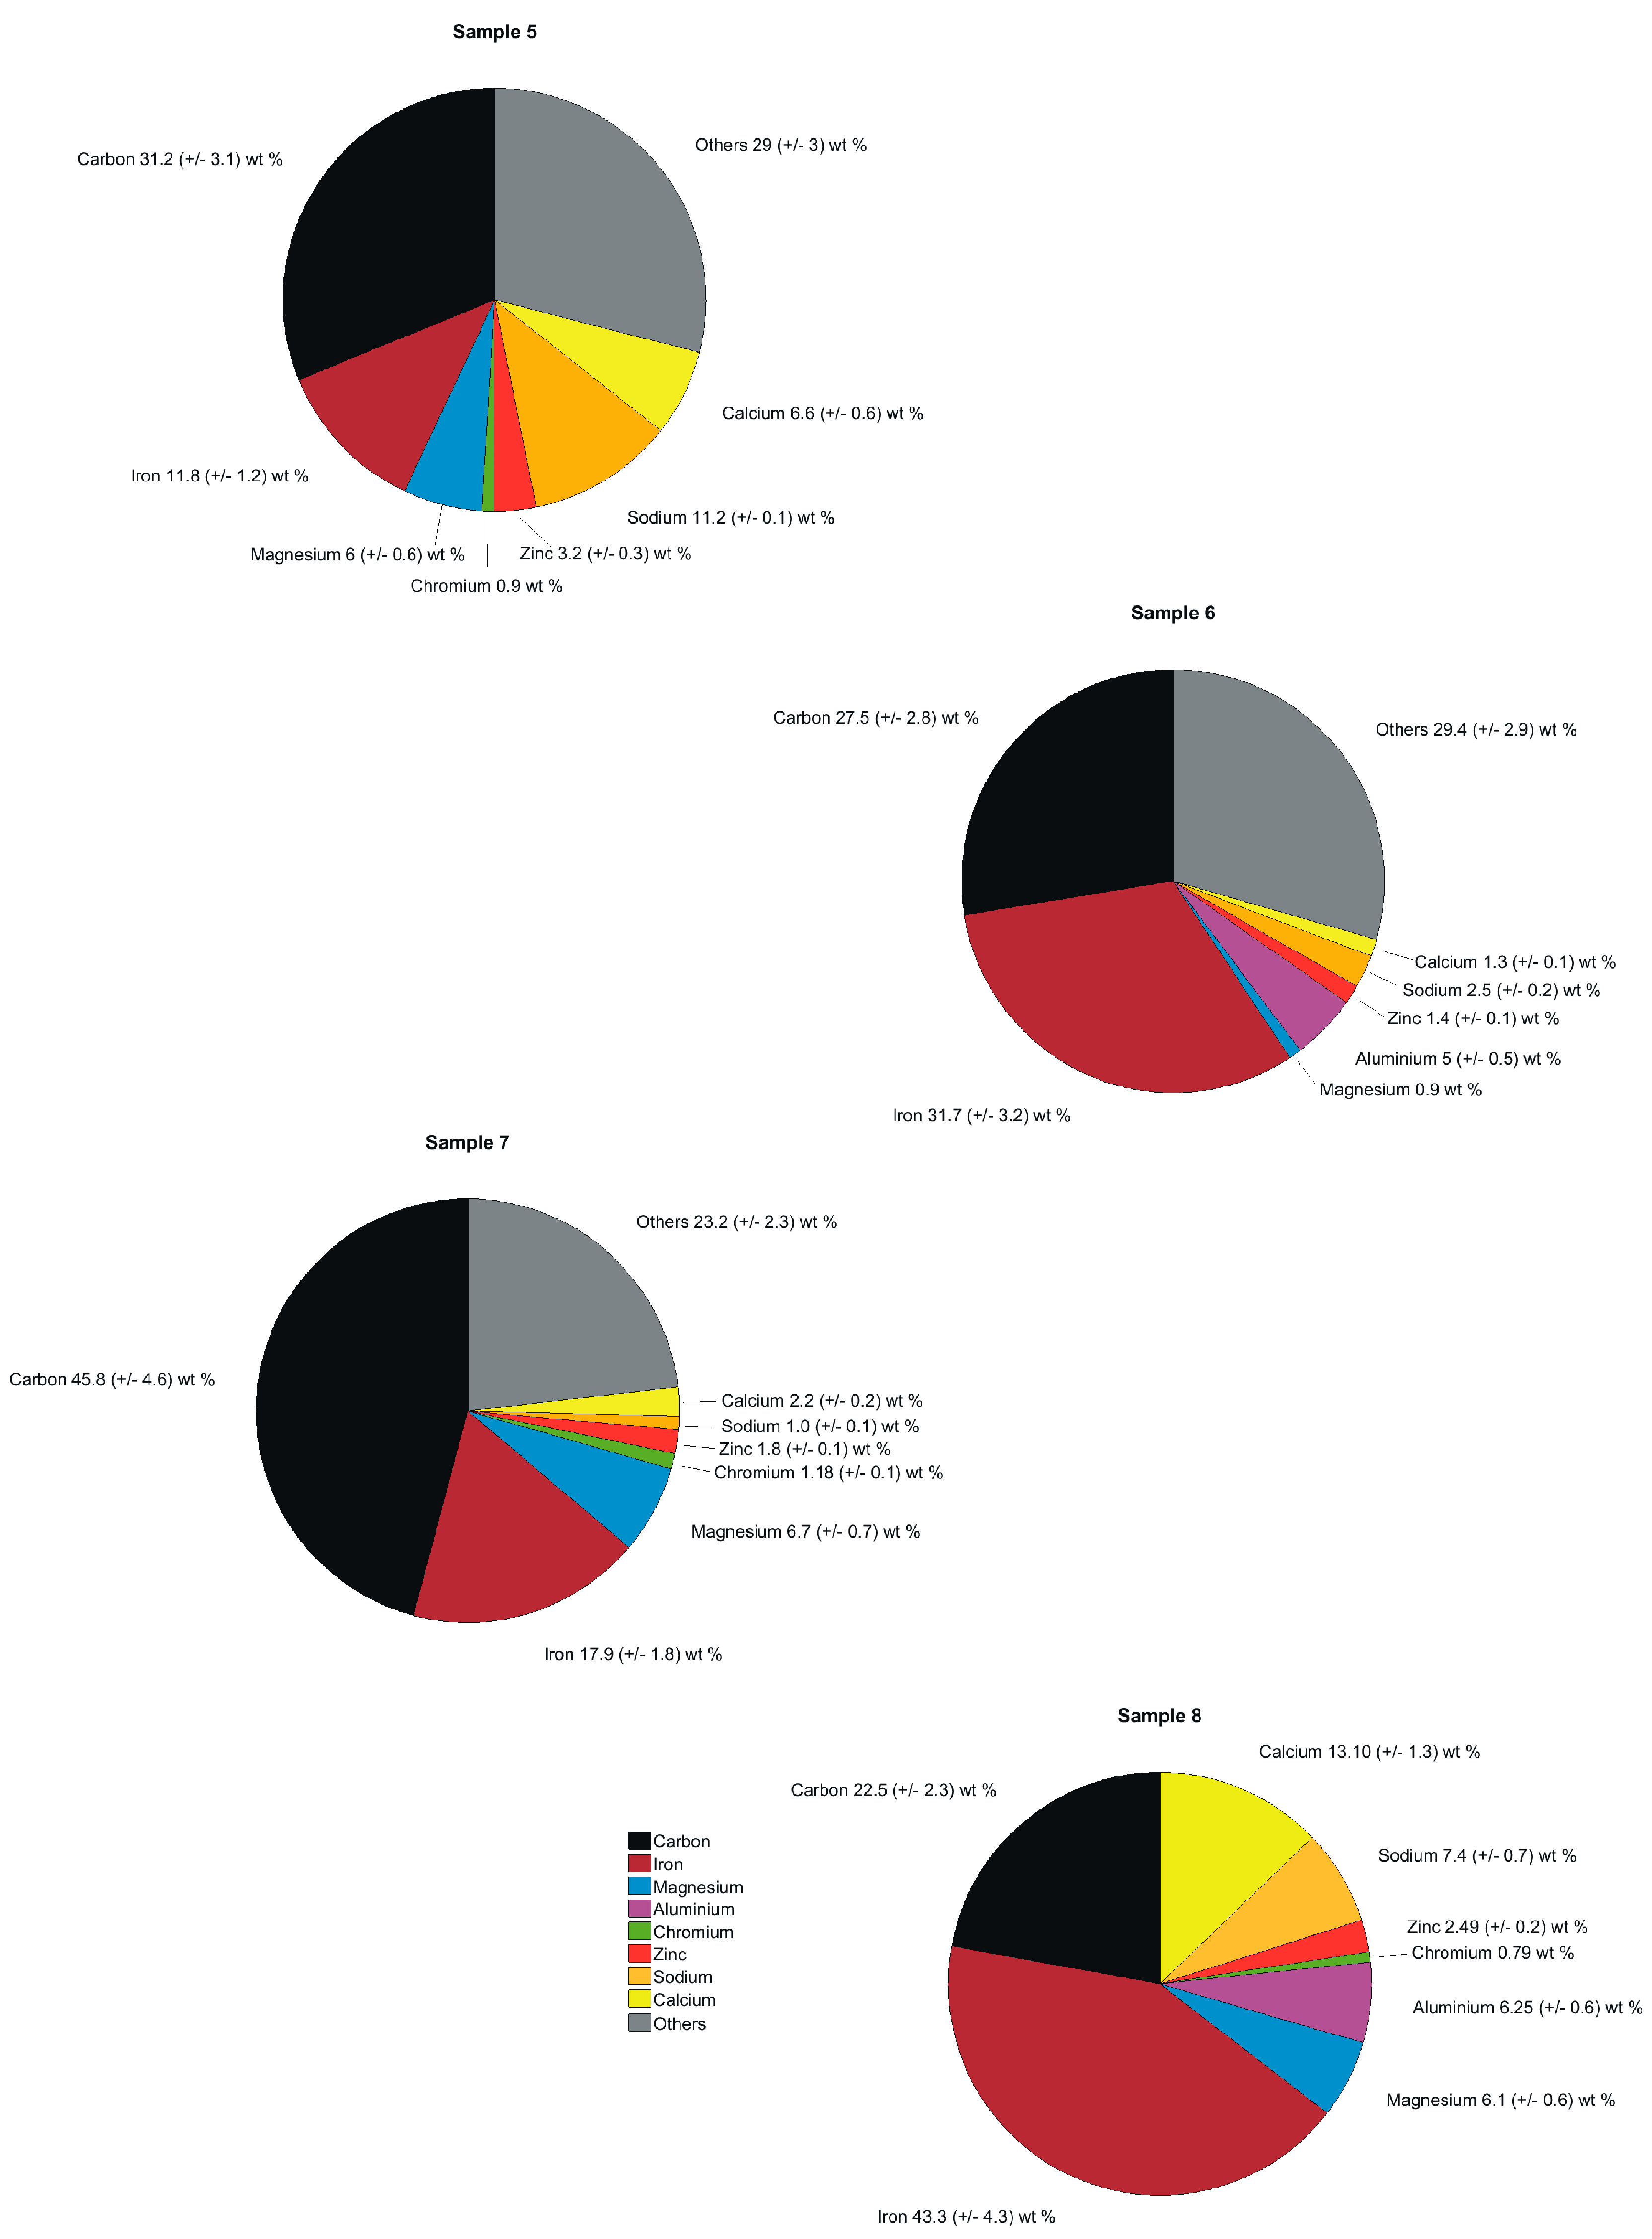
The results from quantitative determination of selected major chemical elements of eight DPM matrices acquired from different in-use diesel-engine passenger vehicles are shown in Figure 6 and Figure 7. The calculated concentration of carbon, iron, magnesium, aluminium, chromium, zinc, sodium and calcium in DPM were achieved by means of calibration curves obtained from prepared calibration standards. Each concentration number represented the average value of calculated concentration. These average values were obtained from three different position measurements by LIBS at the same DPM sample. The quantitative concentration of each element was determined from spectral line ratios and by means of calibration curves acquired for each major element. Values obtained were average concentrations of weight percent (wt%), because of the multiple LIBS measurements from different sample positions and consequent averaging.
From Figure 6 and Figure 7 one can observe that carbon concentrations are not consistent for all DPM samples. The carbon concentration is changing in the individual matrices, from maximum measured content of 64 wt% to minimum content 22 wt% for certain samples. Iron concentration also varies significantly, from 54 wt% to 8 wt%. Magnesium content between 7 wt% and 1 wt%. Two samples shown higher value of aluminium, more than 6 wt%. Almost all samples contain chromium with concentration below 1 wt% to more than 6 wt%. Zinc concentration is from 1 wt% up to 7 wt%. Sodium concentration is more than 11 wt% and calcium 13 wt%.
To quantitatively describe different DPM matrices, we underline individual major chemical elements and average concentrations in wt% for each sample.
Sample 1: consists of relatively high concentration of iron 54.4 wt%, carbon 23.8 wt%, sodium 8.7 wt%, chromium 6.3 wt%, magnesium 4.7 wt%, calcium 3.4 wt% and zinc 1.9 wt%.
Sample 2: contains carbon 24.9 wt%, iron 8.1 wt%, calcium 6 wt%, zinc 5.8 wt%, magnesium 1.4 wt%, sodium 1 wt%, chromium 0.7 wt% and other elements.
Sample 3: is composed of carbon 63.7 wt%, iron 13.9 wt%, sodium 9.4 wt%, zinc 6.9 wt%, magnesium 3.1 wt%, chromium 1.5 wt%, calcium 1.5 wt% and other elements.
Sample 4: carbon 61.1 wt%, iron 15.7 wt%, chromium 3.6 wt%, sodium 1.9 wt%, magnesium 1.8 wt%, zinc 1.6 wt%, calcium 1 wt% and other elements.
Sample 5: carbon 31.2 wt%, iron 11.8 wt%, sodium 11.2 wt%, calcium ~6.6 wt%, magnesium 6 wt%, zinc 3.2 wt%, chromium ~0.9 wt% and other elements.
Sample 6: iron 31.7 wt%, carbon 27.5 wt%, aluminium 5 wt%, sodium 2.5 wt%, zinc 1.4 wt%, calcium 1.3 wt%, magnesium 0.9 wt%, and other elements.
Sample 7: carbon 45.8 wt%, iron 17.9 wt%, magnesium 6.7 wt%, calcium 2.2 wt%, zinc 1.8 wt%, chromium 1.1 wt%, sodium 1 wt%, and other elements.
Sample 8: iron 43.3 wt%, carbon ~22.5 wt%, calcium 13.1 wt%, sodium 7.4 wt%, aluminium 6.3 wt%, magnesium 6.1 wt%, zinc ~2.5 wt% and chromium ~0.8 wt%. A summary of major chemical elements and their average concentration values in wt% for eight selected DPM sample, measured by LIBS using calibration curves, is shown in Table 3.
Additionally most of the samples (2, 4, 5, 6 and 7) are consisting of other elements—major and minor, depicted in the Figure 6 as “Others”. These are the elements not measured, detected or not analysed by LIBS so far, in this paper. These can include e.g., sulphur or chlorine and other major, minor as well as trace elements contained in DPM.
The main outline of this study was to qualitatively and quantitatively analyse major chemical elements contained in the PM exhaust emissions from in-use passenger diesel-engine vehicles. The presence of carbon, iron, magnesium, aluminium, chromium, zinc, sodium and calcium in the particulate matter of diesel exhausts as principal components could have different reasons. Generally the birthplace can be from diversified sources. One source is from engine intake (fuel, additives, air), the second source is from engine combustion process (engine materials, piston, cylinder, bearings, etc.), the third is from engine lubricating oil, and the last source from filtering like DPF and catalytic converter devices.
These components altogether influence the total chemical composition of diesel exhausts and particulate matter (PM) from in-use diesel-engine vehicles.
5. Conclusions
This research presents a LIBS technique for accurate qualitative and quantitative analytical measurements of DPM. Particulate matter has been collected from in-use diesel-engine vehicles. Diesel passenger vehicles were randomly chosen from a daily-life environment and major brand car producers in Europe. From spectrochemical LIBS analysis we found that DPM from in-use vehicles does not consist solely or at least mainly of pure carbon particles. Instead it consists of many chemical elements with diverse concentrations. The high-resolution LIBS technique can instantly measure major chemical elements within diverse types of DPM matrix. From qualitative LIBS measurements we obtained principal compounds of DPM: carbon, iron, aluminium, chromium, zinc, magnesium, calcium and sodium elements.
Special concern has been given to the quantification of the LIBS signal obtained from the different DPM matrices. We characterised quantitatively the different DPM samples and their main elemental compositions.
In this study we have assessed the qualitative and quantitative composition of major chemical elements in various DPM matrices using a high-resolution LIBS technique. Nevertheless, in future research it will be necessary to obtain detailed information about additional major elements contained in DPM, which were not measured, particularly Sulphur and Chlorine content. This is because of spectral window gap in our current LIBS setup. Further interests are minor and trace elements in DPM.
General comprehension of DPM and its chemical composition can lead to better control of the diesel exhaust emissions as well as diesel-engine and combustion processes. Therefore, in the future the development of the in situ LIBS technique for particulate matter will be crucial for further help in controlling and limiting unwanted pollutant emissions from diesel-engine driven vehicles in real driving situations. However the composition of final PM emissions from the diesel-engine vehicles besides the diesel fuel, fuel additives and lubricating oils can be further affected by aftertreatment devices such as DPF, DOC or catalytic converters. Therefore, first it would be important to assess individual components and traces from these devices to clarify and distinguish the proportion of chemical elements and composition in the final PM matrix from the diesel-engine exhaust emissions. This knowledge can in the future help to meet further emission standards and regulations.
Author Contributions
All authors contributed to the manuscript. For further details please contact the corresponding author. All authors have read and agreed to the published version of the manuscript.
Funding
Authors would like to thank for the financial support of the Linz Center of Mechatronics (LCM), project number K 24400/LCM. This research was funded by Austrian Science Fund (Fonds zur Förderung der wissenschaftlichen Forschung) FWF, project number P 27967. Austrian Science Fund: P 27967
Acknowledgments
Authors would like to thank Maria Rusnak for the proofreading and for the valuable corrections. Open Access Funding by Austrian Science Fund (Fonds zur Förderung der wissenschaftlichen Forschung) FWF. Authors would like to acknowledge the financial support of the Linz Center of Mechatronics (LCM), project number K 24400/LCM.
Conflicts of Interest
The authors declare no conflict of interest.
References
- Ntziachristos, L.; Papadimitriou, G.; Ligterink, N.; Hausberger, S. Implications of Diesel emissions control failures to emission factors and road transport NOx evolution. Atmos. Environ. 2016, 141, 542–551. [Google Scholar] [CrossRef]
- Zacharof, N.; Tietge, U.; Franco, V.; Mock, P. Type approval and real-world CO2 and NOx emissions from EU light commercial vehicles. Energy Policy 2016, 97, 540–548. [Google Scholar] [CrossRef]
- Commission Regulation (EU) 2016/646. Commission Regulation (EU) 2016/646 of 20 April 2016 Amending Regulation (EC) (No 692/2008) as Regards Emissions from Light Passenger and Commercial Vehicles (Euro 6). Available online: http://eur-lex.europa.eu/eli/reg/2016/646/oj (accessed on 9 January 2020).
- Calderón-Garcidueñas, L.; Mora-Tiscareño, A.; Ontiveros, E.; Gómez-Garza, G.; Barragán-Mejía, G.; Broadway, J.; Chapman, S.; Valencia-Salazar, G.; Jewells, V.; Maronpot, R.R.; et al. Air pollution, cognitive deficits and brain abnormalities: A pilot study with children and dogs. Brain Cogn. 2008, 68, 117–127. [Google Scholar] [CrossRef] [PubMed]
- Block, M.L.; Calderon-Garciduenas, L. Air pollution: Mechanisms of neuroinflammation and CNS disease. Trends Neurosci. 2009, 32, 506–516. [Google Scholar] [CrossRef] [Green Version]
- Commission Regulation (EC) 692/2008. Commission Regulation (EC) 692/2008 of 18 July 2008 Implementing and Amending Regulation (EC) No 715/2007 of the European Parliament and of the Council on Type-Approval of Motor Vehicles with Respect to Emissions from Light Passenger and Commercial Vehicles (Euro 5 and Euro 6) and on Access to Vehicle Repair and Maintenance Information. Available online: http://eur-lex.europa.eu/eli/reg/2008/692/oj (accessed on 9 January 2020).
- Regulation (EC) No 715/2007. Regulation (EC) No 715/2007 of the European Parliament and of the Council of 20 June 2007 on Type Approval of Motor Vehicles with Respect to Emissions from Light Passenger and Commercial Vehicles (Euro 5 and Euro 6) and on Access to Vehicle Repair and Maintenance Information. Available online: http://eur-lex.europa.eu/eli/reg/2007/715/oj (accessed on 9 January 2020).
- United States Environmental Protection Agency, Regulations for Emissions from Vehicles and Engines, Tier 3 Motor Vehicle Emission and Fuel Standards. Available online: https://www.epa.gov (accessed on 9 January 2020).
- California Environmental Protection Agency, Low-Emission Vehicle Program-LEV III. Available online: https://www.arb.ca.gov/ (accessed on 9 January 2020).
- Lough, G.C.; Schauer, J.J.; Park, J.S.; Shafer, M.M.; Deminter, J.T.; Weinstein, J.P. Emissions of metals associated with motor vehicle roadways. Environ. Sci. Technol. 2005, 39, 826–836. [Google Scholar] [CrossRef]
- Schauer, J.J.; Kleeman, M.J.; Cass, G.R.; Simoneit, B.R.T. Measurement of emissions from air pollution sources. 2. C-1 through C-30 organic compounds from medium duty diesel trucks. Environ. Sci. Technol. 1999, 33, 1578–1587. [Google Scholar] [CrossRef]
- Cheung, K.L.; Ntziachristos, L.; Tzamkiozis, T.; Schauer, J.J.; Samaras, Z.; Moore, K.F.; Sioutas, C. Emissions of Particulate Trace Elements, Metals and Organic Species from Gasoline, Diesel, and Biodiesel Passenger Vehicles and Their Relation to Oxidative Potential. Aerosol Sci. Technol. 2010, 44, 500–513. [Google Scholar] [CrossRef]
- Tolomelli, L.T.E.; Barreta, L.G.; Lacava, P.T.; Carinhana, D. Study of the influence of the Biodiesel in Soot Emissions of Diesel Laminar Diffusion Flames. J. Braz. Chem. Soc. 2017, 28, 1384–1388. [Google Scholar] [CrossRef]
- Das, D.; Kumar, A.; Yadav, A. Evaluation of performance, emission and combustion characteristics of a CI engine fueled with karanja biodiesel and diethyl ether blends. Biofuels 2018, 9, 89–94. [Google Scholar] [CrossRef]
- Ntziachristos, L.; Ning, Z.; Geller, M.D.; Sheesley, R.J.; Schauer, J.J.; Sioutas, C. Fine, ultrafine and nanoparticle trace element compositions near a major freeway with a high heavy-duty diesel fraction. Atmos. Environ. 2007, 41, 5684–5696. [Google Scholar] [CrossRef]
- Schauer, J.J.; Lough, G.C.; Shafer, M.M.; Christensen, W.F.; Arndt, M.F.; DeMinter, J.T.; Park, J.S. Characterization of metals emitted from motor vehicles. Research report. Health Eff. Inst. 2006, 133, 1. Available online: http://www.healtheffects.org (accessed on 9 January 2020).
- Kleeman, M.J.; Schauer, J.J.; Cass, G.R. Size and composition distribution of fine particulate matter emitted from motor vehicles. Environ. Sci. Technol. 2000, 34, 1132–1142. [Google Scholar] [CrossRef]
- Packer, A.P.; Sarkis, J.E.S.; Giné, M.F.; Santos, É.J. High Pressure Asher (HPA-S) Decomposition of Biodiesel Samples for Elemental Analysis by Inductively Coupled Plasma Optical Emission Spectrometry (ICP OES). J. Braz. Chem. Soc. 2014, 25, 743–749. [Google Scholar] [CrossRef]
- Fontaras, G.; Karavalakis, G.; Kousoulidou, M.; Tzamkiozis, T.; Ntziachristos, L.; Bakeas, E.; Stournas, S.; Samaras, Z. Effects of biodiesel on passenger car fuel consumption, regulated and non-regulated pollutant emissions over legislated and real-world driving cycles. Fuel 2009, 88, 1608–1617. [Google Scholar] [CrossRef]
- Edlund, M.; Visser, H.; Heitland, P. Analysis of biodiesel by argon–oxygen mixed-gas inductively coupled plasma optical emission spectrometry. J. Anal. At. Spectrom. 2002, 7, 232–235. [Google Scholar] [CrossRef]
- Gangwar, J.N.; Guptab, T.; Agarwal, A.K. Composition and comparative toxicity of particulate matter emitted from a diesel and biodiesel fuelled CRDI engine. Atmos. Environ. 2012, 46, 472–481. [Google Scholar] [CrossRef]
- Agarwal, A.K.; Gupta, T.; Kothari, A. Particulate emissions from biodiesel vs diesel fuelled compression ignition engine. Renew. Sustain. Energy Rev. 2011, 15, 3278–3300. [Google Scholar] [CrossRef]
- Betha, R.; Balasubramanian, R. Emissions of particulate-bound elements from stationary diesel engine: Characterization and risk assessment. Atmos. Environ. 2011, 45, 5273–5281. [Google Scholar] [CrossRef]
- Noll, R. Laser-Induced Breakdown Spectroscopy, Fundamentals and Applications; Springer: Berlin, Germany, 2012. [Google Scholar]
- Miziolek, A.W.; Palleschi, V.; Schechter, I. Laser-Induced Breakdown Spectroscopy (LIBS): Fundamentals and Application; Cambridge University Press: New York, NY, USA, 2006. [Google Scholar]
- Cremers, D.A.; Radziemski, L.J. Handbook of Laser-Induced Breakdown Spectroscopy; John Wiley & Sons Inc.: New Delhi, India, 2013. [Google Scholar]
- Hahn, D.W.; Omenetto, N. Laser-Induced Breakdown Spectroscopy (LIBS), Part II: Review of Instrumental and Methodological Approaches to Material Analysis and Applications to Different Fields. Appl. Spectrosc. 2012, 66, 347–419. [Google Scholar] [CrossRef]
- Noll, R.; Fricke-Begemann, C.; Brunk, M.; Connemann, S.; Meinhardt, C.; Scharun, M.; Sturm, V.; Makowe, J.; Gehlen, C. Laser-induced breakdown spectroscopy expands into industrial applications. Spectrochim. Acta Part B At. Spectrosc. 2014, 93, 41–51. [Google Scholar] [CrossRef]
- Fortes, F.J.; Moros, J.; Lucena, P.; Cabalin, L.M.; Laserna, J.J. Laser-Induced Breakdown Spectroscopy. Anal. Chem. 2013, 85, 640–669. [Google Scholar] [CrossRef] [PubMed]
- Wang, Z.Z.; Deguchi, Y.; Zhang, Z.Z.; Wang, Z.; Zeng, X.Y.; Yan, J.J. Laser-induced breakdown spectroscopy in Asia. Front. Phys. 2016, 11, 114213. [Google Scholar] [CrossRef]
- Viskup, R.; Praher, B.; Linsmeyer, T.; Scherndl, H.; Pedarnig, J.D.; Heitz, J. Influence of pulse-to-pulse delay for 532 nm double-pulse laser-induced breakdown spectroscopy of technical polymers. Spectrochim. Acta Part B At. Spectrosc. 2010, 65, 935–942. [Google Scholar] [CrossRef]
- Samek, O.; Beddows, D.C.S.; Kaiser, J.; Kukhlevsky, S.V.; Liska, M.; Telle, H.H.; Young, J. Application of laser-induced breakdown spectroscopy to in situ analysis of liquid samples. Opt. Eng. 2000, 39, 2248–2262. [Google Scholar] [CrossRef]
- Effenberger, A.J.; Scott, J.R. Effect of Atmospheric Conditions on LIBS Spectra. Sensors (Basel) 2010, 10, 4907–4925. [Google Scholar] [CrossRef]
- Stehrer, T.; Praher, B.; Viskup, R.; Jasik, J.; Wolfmeir, H.; Arenholz, E.; Heitz, J.; Pedarnig, J.D. Laser-induced breakdown spectroscopy of iron oxide powder. J. Anal. At. Spectrom. 2009, 24, 973–978. [Google Scholar] [CrossRef]
- Viskup, R.; Praher, B.; Stehrer, T.; Jasik, J.; Wolfmeir, H.; Arenholz, E.; Pedarnig, J.D.; Heitz, J. Plasma plume photography and spectroscopy of Fe-Oxide materials. Appl. Surf. Sci. 2008, 255, 5215–5219. [Google Scholar] [CrossRef]
- Lombaert, K.; Morel, S.; Le Moyne, L.; Adam, P.; de Maleissye, J.T.; Amouroux, J. Nondestructive analysis of metallic elements in Diesel soot collected on filter: Benefits of laser induced breakdown spectroscopy. Plasma Chem. Plasma P 2004, 24, 41–56. [Google Scholar] [CrossRef]
- Aragón, C.; Aguilera, J. Characterization of laser induced plasmas by optical emission spectroscopy: A review of experiments and methods. Spectrochim. Acta Part B At. Spectrosc. 2008, 63, 893–916. [Google Scholar] [CrossRef]
- Stepputat, M.; Noll, R. On-line detection of heavy metals and brominated flame retardants in technical polymers with laser-induced breakdown spectrometry. Appl. Opt. 2003, 42, 6210–6220. [Google Scholar] [CrossRef]
- Günther, D.; Hattendorf, B. Solid sample analysis using laser ablation inductively coupled plasma mass spectrometry. Trac Trend Anal. Chem. 2005, 24, 255–265. [Google Scholar] [CrossRef]
- De Schrijver, I.; Aramendia, M.; Vincze, L.; Resano, M.; Dumoulin, A.; Vanhaecke, F. Comparison of atomic absorption, mass and x-ray spectrometry techniques using dissolution-based and solid sampling methods for the determination of silver in polymeric samples. Spectrochim. Acta Part B At. Spectrosc. 2007, 62, 1185–1194. [Google Scholar] [CrossRef]
- Mans, C.; Hanning, S.; Simons, C.; Wegner, A.; Janβen, A.; Kreyenschmidt, M. Development of suitable plastic standards for x-ray fluorescence analysis. Spectrochim. Acta Part B At. Spectrosc. 2007, 62, 116–122. [Google Scholar] [CrossRef]
- Benninghoven, A. Surface analysis by secondary ion mass spectrometry (SIMS). Surf. Sci. 1994, 299, 246–260. [Google Scholar] [CrossRef]
- Praher, B.; Palleschi, V.; Viskup, R.; Heitz, J.; Pedarnig, J.D. Calibration free laser-induced breakdown spectroscopy of oxide materials. Spectrochim. Acta Part B At. Spectrosc. 2010, 65, 671–679. [Google Scholar] [CrossRef]
- Noll, R.; Sturm, V.; Aydin, Ü.; Eilers, D.; Gehlen, C.; Höhne, M.; Lamott, A.; Makowe, J.; Vrenegor, J. Laser-induced breakdown spectroscopy–from research to industry, new frontiers for process control. Spectrochim. Acta Part B At. Spectrosc. 2008, 63, 1159–1166. [Google Scholar] [CrossRef]
- Pedarnig, J.D.; Heitz, J.; Ionita, R.; Dinescu, G.; Praher, B.; Viskup, R. Combination of RF–plasma jet and Laser–induced plasma for breakdown spectroscopy analysis of complex materials. Appl. Surf. Sci. 2011, 257, 5452–5455. [Google Scholar] [CrossRef]
- Viskup, R. Single and Double Laser Pulse Interaction with Solid State–Application to Plasma Spectroscopy. In Nd YAG Laser; Dumitras, D.C., Ed.; InTech: Rijeka, Croatia, 2012; ISBN 978-953-51-0105-5. [Google Scholar] [CrossRef] [Green Version]
- Kramida, A.; Ralchenko, Y.; Reader, J.; NIST ASD Team National Institute of Standards and Technology NIST. Atomic Spectra Database. Available online: http://physics.nist.gov/asd (accessed on 9 January 2020).
Figure 1.
Layout of the laser-induced breakdown spectroscopy (LIBS) experimental setup. LS—Laser Source, M—Mirror, P—Plasma, S—Sample, FL—Focusing Lens, L1 and L2—Optical Telescope, OS—Optical Spectrometer, D— Intensified Charge Coupled Device (ICCD) Detector.
Figure 1.
Layout of the laser-induced breakdown spectroscopy (LIBS) experimental setup. LS—Laser Source, M—Mirror, P—Plasma, S—Sample, FL—Focusing Lens, L1 and L2—Optical Telescope, OS—Optical Spectrometer, D— Intensified Charge Coupled Device (ICCD) Detector.

Figure 2.
Optical emission spectra of eight different diesel particulate matter (DPM) matrices measured by laser-induced breakdown spectroscopy.
Figure 2.
Optical emission spectra of eight different diesel particulate matter (DPM) matrices measured by laser-induced breakdown spectroscopy.

Figure 3.
Optical emission spectrum of carbon (a), iron (b), magnesium (c), aluminium (d), chromium (e), zinc (f), sodium (g) and calcium (h) measured by high resolution LIBS from selected diesel particulate matter collected from in-use passenger diesel-engine vehicles.
Figure 3.
Optical emission spectrum of carbon (a), iron (b), magnesium (c), aluminium (d), chromium (e), zinc (f), sodium (g) and calcium (h) measured by high resolution LIBS from selected diesel particulate matter collected from in-use passenger diesel-engine vehicles.

Figure 4.
Calibration curves including regression parameter R2, limit of detection (LOD), 95% confidence limits and prediction bands for: (a) carbon, (b) iron—medium concentrations, (c) iron—high concentrations and (d) magnesium obtained from laboratory prepared PM calibration samples.
Figure 4.
Calibration curves including regression parameter R2, limit of detection (LOD), 95% confidence limits and prediction bands for: (a) carbon, (b) iron—medium concentrations, (c) iron—high concentrations and (d) magnesium obtained from laboratory prepared PM calibration samples.

Figure 5.
Calibration curves including regression parameter R2, limit of detection (LOD), 95% confidence limits and prediction bands for: (a) aluminium, (b) chromium, (c) zinc, (d) sodium and (e) calcium obtained from laboratory prepared PM calibration samples.
Figure 5.
Calibration curves including regression parameter R2, limit of detection (LOD), 95% confidence limits and prediction bands for: (a) aluminium, (b) chromium, (c) zinc, (d) sodium and (e) calcium obtained from laboratory prepared PM calibration samples.

Figure 6.
Quantitative determination of selected major chemical elements measured by LIBS, showing average values of wt% in different DPM matrices, (Sample 1, 2, 3 and 4) obtained from in-use passenger diesel combustion engine vehicles.
Figure 6.
Quantitative determination of selected major chemical elements measured by LIBS, showing average values of wt% in different DPM matrices, (Sample 1, 2, 3 and 4) obtained from in-use passenger diesel combustion engine vehicles.

Figure 7.
Quantitative determination of selected major chemical elements measured by LIBS, showing average values of wt% in different DPM matrices, (Sample 5, 6, 7 and 8) obtained from in-use passenger diesel combustion engine vehicles.
Figure 7.
Quantitative determination of selected major chemical elements measured by LIBS, showing average values of wt% in different DPM matrices, (Sample 5, 6, 7 and 8) obtained from in-use passenger diesel combustion engine vehicles.


Table 1.
Spectral atomic and ionic lines used for analytical LIBS measurements.
| Spectral Line | Wavelength λ (nm) |
|---|---|
| C I | 193.02 |
| C I | 247.85 |
| Fe II | 238.20 |
| Fe II | 259.93 |
| Fe II | 248.01 |
| Al I | 309.27 |
| Al II | 198.98 |
| Cr I | 520.44 |
| Cr I | 520.60 |
| Cr I | 520.84 |
| Zn II | 202.54 |
| Na I | 588.99 |
| Na I | 589.59 |
| Ca I | 422.67 |
| H I | 656.27 |
| Mg II | 279.55 |
| Mg II | 280.27 |
Table 2.
Summary of spectral lines used for LIBS signal calculation, calibration of major chemical elements in DPM, obtained regression parameter R2, and limit of detection (LOD).
Table 2.
Summary of spectral lines used for LIBS signal calculation, calibration of major chemical elements in DPM, obtained regression parameter R2, and limit of detection (LOD).
| Calibration for Analyte | Regression Parameter R2 | LOD in wt% | Integrated Peak Ratio Calculation |
|---|---|---|---|
| C | 0.97 | 4.9 | C I @ 247.85 nm, C I @ 193.02 nm |
| Fe–medium | 0.97 | 7.2 | Fe II @ 259.93 nm, C I @ 247.85 nm |
| Fe–high | 0.96 | - | Fe II @ 248.01 nm, C I @ 247.85 nm |
| Mg | 0.96 | 0.74 | Mg II @ 279.55nm |
| Al | 0.96 | 6.5 | Al II @ 198.98 nm, C I @ 193.02 nm |
| Cr | 0.96 | 1.52 | Cr I @ 520.84 nm, H I @ 656.27 nm |
| Zn | 0.96 | 2.77 | Zn II @ 202.54 nm, C I @ 247.85 nm |
| Na | 0.99 | 0.26 | Na I @ 588.99 nm, H I @ 656.27 nm |
| Ca | 0.98 | 0.47 | Ca I @ 422.67 nm, C I @ 247.85 nm |
Table 3.
Composition of major chemical elements in selected DPM samples, measured by LIBS using calibration curves. Showing average values in wt%.
Table 3.
Composition of major chemical elements in selected DPM samples, measured by LIBS using calibration curves. Showing average values in wt%.
| Sample | C (wt%) | Fe (wt%) | Mg (wt%) | Al (wt%) | Cr (wt%) | Zn (wt%) | Na (wt%) | Ca (wt%) |
|---|---|---|---|---|---|---|---|---|
| 1 | 23.8 | 54.4 | 4.7 | - | 6.3 | 1.9 | 8.7 | 3.4 |
| 2 | 24.9 | 8.1 | 1.4 | - | 0.7 | 5.8 | 1 | 6 |
| 3 | 63.7 | 13.9 | 3.1 | - | 1.5 | 6.9 | 9.4 | 1.5 |
| 4 | 61.1 | 15.7 | 1.8 | - | 3.6 | 1.6 | 1.9 | 1 |
| 5 | 31.2 | 11.8 | 6 | - | 0.9 | 3.2 | 11.2 | 6.6 |
| 6 | 27.5 | 31.7 | 0.9 | 5 | - | 1.4 | 2.5 | 1.3 |
| 7 | 45.8 | 17.9 | 6.7 | - | 1.1 | 1.8 | 1 | 2.2 |
| 8 | 22.5 | 43.3 | 6.1 | 6.3 | 0.8 | 2.5 | 7.4 | 13.1 |
© 2020 by the authors. Licensee MDPI, Basel, Switzerland. This article is an open access article distributed under the terms and conditions of the Creative Commons Attribution (CC BY) license (http://creativecommons.org/licenses/by/4.0/).
Share and Cite
MDPI and ACS Style
Viskup, R.; Wolf, C.; Baumgartner, W. Qualitative and Quantitative Characterisation of Major Elements in Particulate Matter from In-use Diesel Engine Passenger Vehicles by LIBS. Energies 2020, 13, 368. https://doi.org/10.3390/en13020368
AMA Style
Viskup R, Wolf C, Baumgartner W. Qualitative and Quantitative Characterisation of Major Elements in Particulate Matter from In-use Diesel Engine Passenger Vehicles by LIBS. Energies. 2020; 13(2):368. https://doi.org/10.3390/en13020368
Chicago/Turabian StyleViskup, Richard, Christoph Wolf, and Werner Baumgartner. 2020. "Qualitative and Quantitative Characterisation of Major Elements in Particulate Matter from In-use Diesel Engine Passenger Vehicles by LIBS" Energies 13, no. 2: 368. https://doi.org/10.3390/en13020368
Note that from the first issue of 2016, this journal uses article numbers instead of page numbers. See further details here.