Consumption versus Technology: Drivers of Global Carbon Emissions 2000–2014


1
Department of Economic History, School of Economics and Management, Lund University, 22363 Lund, Sweden
2
Institute of Environmental Engineering, ETH Zürich, 8093 Zürich, Sweden
*
Author to whom correspondence should be addressed.
Energies 2020, 13(2), 339; https://doi.org/10.3390/en13020339
Submission received: 7 December 2019
/
Revised: 3 January 2020
/
Accepted: 6 January 2020
/
Published: 10 January 2020
(This article belongs to the Special Issue Carbon Footprinting and Life Cycle Assessment)
Abstract
:This study utilizes recently published environmental extensions to the World Input–Output Database (WIOD) to compare production-based, consumption-based and technology-adjusted carbon emissions for 44 countries and country groups for the period 2000 to 2014. Results show some significant shifts in global emission trends compared to similar studies of the period before 2009. For 20 European Union (EU) countries and the US, emissions decreased over the period regardless of measure, and the same was true for the EU. Since GDP grew in 18 of these countries, the results provide unambiguous evidence for absolute, albeit modest, decoupling of economic growth from carbon emissions. The large increase in global emissions that nevertheless occurred during the period was driven almost entirely by increasing consumption in China and developing countries.
1. Introduction
Effective climate mitigation requires reliable, relevant and up-to-date data on greenhouse gas (GHG) emissions, and on the drivers of such emissions. Traditionally, national GHG inventories have been calculated according to territorial or production-based accounting (PBA) principles; each country accounts for emissions that occur within its borders, in the household sector and in the production of goods and services, regardless of whether these goods and services are produced to satisfy domestic demand or for export.
Critics have pointed out that with consumption being a main driver of human-induced GHG emissions, and with increasingly fragmented global value chains and a large part of global emissions being generated in the production of goods that are traded across borders, it makes sense to hold countries accountable not only for emissions that occur within their territories, but also for emissions in other countries related to production of goods and services that are consumed by their residents [1].
A country’s consumption-based emissions are calculated by adding emissions embodied in imports to its production-based emissions while subtracting emissions embodied in exports. Several studies [2,3,4,5,6,7] have indicated that for developed countries, consumption-based emissions are generally larger than production-based emissions, whereas for developing countries the opposite holds. Moreover, domestic emissions reductions that several developed countries have reported during recent decades often evaporate when the balance of emissions embodied in international trade is taken into account. These facts have been taken as evidence that developed countries are increasingly outsourcing emissions-intensive production to developing and emerging economies and that this explains, at least in part, the observed reductions in domestic emissions in many developed countries [4,8,9].
Other studies have questioned this conclusion [10,11,12,13,14], showing that the observed imbalances between developing and developed countries regarding emissions embodied in trade may largely stem from differences in technology between countries, i.e., differences in carbon intensity of energy and energy intensity of production, rather than from outsourcing.
Technology-adjusted consumption-based carbon accounting (TCBA) was developed to amend this weakness of standard consumption-based accounting (CBA). It is similar to CBA in many respects, but applies the average carbon intensity on the world market for each sector when subtracting emissions embodied in exports, instead of average domestic emissions intensities [14]. Thereby each country is held fully accountable for factors that it can influence, such as the level and composition of its consumption, as well as the production technologies, also for exports. The reasoning behind this twist was that for carbon accounting to reflect how a country’s export affect global emissions, it must take into account, “not only how a certain exported commodity was actually produced, but also what alternative production it replaces” [14].
With TCBA, the clear divide between developed countries being net importers of embodied emissions, and developing countries being net exporters, dissolved. For some developed countries, like the US, Australia and Canada, TCBA, as with CBA, was significantly larger than PBA. For many European countries, however, as well as for the European Union (EU) as a whole, TCBA was found to be lower than both PBA and CBA, thus contradicting the interpretation of the gap between CBA and PBA as evidence of emissions outsourcing.
TCBA has been criticized for lack of scale invariance due to treating exports and imports differently; for instance, the sum of TCBA for all EU27 countries does not equal TCBA for EU27 as one unit (although the difference is small, around 5%) [15,16]. This problem can be solved by using world average emissions factors also on the import side. The downside of this is, of course, that countries are no longer accountable for the effects of sourcing of imported good. This slightly modified version of technology adjustment was used in two studies of the balance of emissions embodied in trade for the UK and Sweden 1995–2009 [10] and the world 1995–2009 [13]. The technology-adjusted balance of emissions embodied in trade measures emission flows due to the scale and composition of exports and imports only, and is hence a more reliable indicator of outsourcing of emissions than the standard balance of emissions embodied in trade, which includes the effects of technology differences between countries.
The issue of how to interpret the observed gap between consumption-based and territorial emissions is important for several reasons. First, to what extent emissions reductions in developed countries have been offset by outsourcing of emissions to developing countries has implications for whether there is evidence of decoupling economic growth from GHG-emissions, the possibility of which is a sine qua non for sustainable development. Second, if emissions reductions in some countries are offset by increased emissions somewhere else, this may undermine climate policy efforts [17,18]. Alternatively, the mere suspicion that this could be the case may undermine support for ambitious national climate policies. Third, misunderstanding the effects on global emissions of a country’s foreign trade could lead to counterproductive policy proposals [14]; for example it has been suggested that a country with carbon efficient energy can reduce its climate impact by reducing the share of foreign trade in the economy [19].
However, the debate on this subject has been hampered by data limitations. Whereas data on territorial- and production-based emissions have been available for more recent years, consumption-based accounting depends on input-output tables that are not updated very frequently, and with environmentally extended data lagging several years behind.
The World Input–Output Database (WIOD), one of the most frequently used databases, was updated 2016 to cover the period 2000 to 2014, but does not contain environmental satellite accounts. Recently, some researchers have compiled energy and CO2 accounts for the WIOD 2016 release [20,21].
The aim of this paper is to revisit the differences in results between production-based, consumption-based and technology-adjusted accounting methods, utilizing the CO2 accounts compiled by Corsatea et al. [20], in order to see how the situation has developed since 2009. We calculate national emissions for 44 countries and regions between 2000 and 2014 according to PBA, CBA and TCBA.
In addition, we perform a decomposition analysis of the drivers behind the changes in global emissions as well as domestic emissions and emissions embodied in trade for different countries, over the period. The decomposition separates the effects of changes in carbon intensity of production technologies, in composition and sourcing of intermediate goods, and in composition and level of consumption.
There are good reasons to suspect that the development after the global financial crisis around 2008 might differ significantly from the period before the crisis. First, countries have grown at different speed, with Asia growing the most; and technological advances, for example in energy production and transportation, have changed the carbon intensity of production, but not necessarily at the same pace in different countries.
Second, some recent studies have shown shifting patterns of trade in materials and embodied energy that indicate the emergence of a new and partly different narrative. Kulionis [21] combined trade data from WIOD 2016 release with energy data from International Energy Agency (IEA) energy accounts, and demonstrated converging energy embodied in trade for developed and developing countries. Karstensen et al. [22] used a combination of datasets and estimations to calculate the development of EU emissions trends to show reduced consumption-based as well as territorial emissions for EU-countries after the global financial crisis around 2008.
Our results are in line with these studies, and indicate that there has been significant shifts in emission trends compared to the period 1995–2009, in particular with regard to consumption-based emissions. Whereas some EU countries showed declining production-based emissions from 1995–2009, consumption-based emissions were still generally increasing, and trends for technology-adjusted emissions were mixed. For the US, emissions were increasing on all measures.
Between 2000 and 2014, emissions decreased for the majority of EU countries and the EU as a whole regardless of measure, and the same was true for the US. The large increase in global emissions that nevertheless occurred during the period was driven almost entirely by increasing consumption in China and developing countries. Increasing consumption in developing countries was a major driver behind the increase in global emissions from 1995–2009 as well [23], but this trend was even stronger from 2000–2014.
2. Materials and Methods
2.1. Data
The analysis in this study is based on the Global Multi-Regional Input-Output (GMRIO) tables from the WIOD 2016 release [24,25]. The database covers 44 countries including 28 EU member states, 15 other major economies and the Rest of the World (ROW) aggregate. The tables are based on data for 56 products classified according to International Standard Industrial Classification revision 4 (ISIC Rev. 4). The tables adhere to the 2008 version of the Systems of National Accounts (SNA). Since the WIOD 2016 release does not contain environmental extensions, we utilize CO2 accounts compiled by Corsatea et al. [20].
2.2. Multi-Region Input–Output Analysis (MRIO)
Carbon dioxide emissions are calculated using input-output analysis developed by [26]. Detailed explanation of the method can be found in [27]. An environmentally extended multi-regional input–output model can be expressed as:
where is the matrix of technical coefficients it is obtained as , where is the vector of output the intermediate demand, represents final demands, (I − A)−1 L is the total requirement matrix (often known as the Leontief inverse) representing interdependencies between industries, is the identity matrix, and is the direct CO2 intensity.
The MRIO model in Equation (1) can be expressed as consisting of two regions: the focal country and the rest of the world aggregate.
The production-based (PB) emissions for country 1 are given by . Where captures emissions that occur in country 1 to satisfy final demand in country 1 and gives emissions that occur in country 1 but are finally consumed in region 2. Note that we also add which captures direct emissions by households (e.g., for cooking, heating). The consumption-based (CB) emissions are given by , where gives emissions that occur in region 2 to produce goods that are finally consumed in country 1. In the text we refer to as domestic emissions (DOM), as emissions embodied in exports (EEE), and as emissions embodied in imports (EEI) for country 1.
TCBA emissions are obtained by replacing country-specific CO2 intensities with the world average carbon intensity: . Then using we calculate emissions that would have occurred if exports from country 1 were produced with the world average technology (in the text we refer to this term as EEEwa). Finally, the TCBA is given as . The term in the brackets is an “adjustment” factor. It has a negative effect on when the production of the export bundle (from country 1) with the world average technology generates more emissions than the production of the same bundle in with the actual technology available in country 1.
2.3. Structural Decomposition Analysis (SDA)
To understand to what extent increasing global emissions are driven by changes in consumption in different parts of the world, and to what extent this is counteracted or enhanced by changes in production technologies and sourcing we have performed a structural decomposition analysis. We decomposed the changes in emissions into effects of changes in technology () changes in the composition and sourcing of intermediate goods (the Leontief inverse ) and changes in final demand () which are further split as where, M captures changes in the composition and sourcing of final demand, captures changes in the level of final demand (“consumption”).
The change in from Equation (2) between two points in time (t0 and t1) can be expressed as:
Contribution by each determinant can be obtained as:
In a similar manner as shown in Equation (2) from we obtain factors that explain changes for , . We apply the same decomposition procedure for but we replace actual intensities (i.e., ) with the world average intensity (i.e., ). Direct emissions by households are included in factor domestic (DOM) part. It is important to note that an additive decomposition as expressed in Equation (4) is not unique because each term can be weighted by different points in time, for instance or . To overcome this non-uniqueness issue we use an average of the two so called polar decomposition forms as proposed by Dietzenbacher and Los [28]. Furthermore, to eliminate price effects we use MRIO tables in previous year’s prices and chain the results.
3. Results
3.1. Development of Production-Based Accounting (PBA), Consumption-Based Accounting (CBA) and Technology-Adjusted Consumption-Based Accounting (TCBA)
The most significant result of this study is that 21 developed countries—20 out of 28 EU countries and the US—reduced their emissions between 2000 and 2014, regardless of accounting principle used.
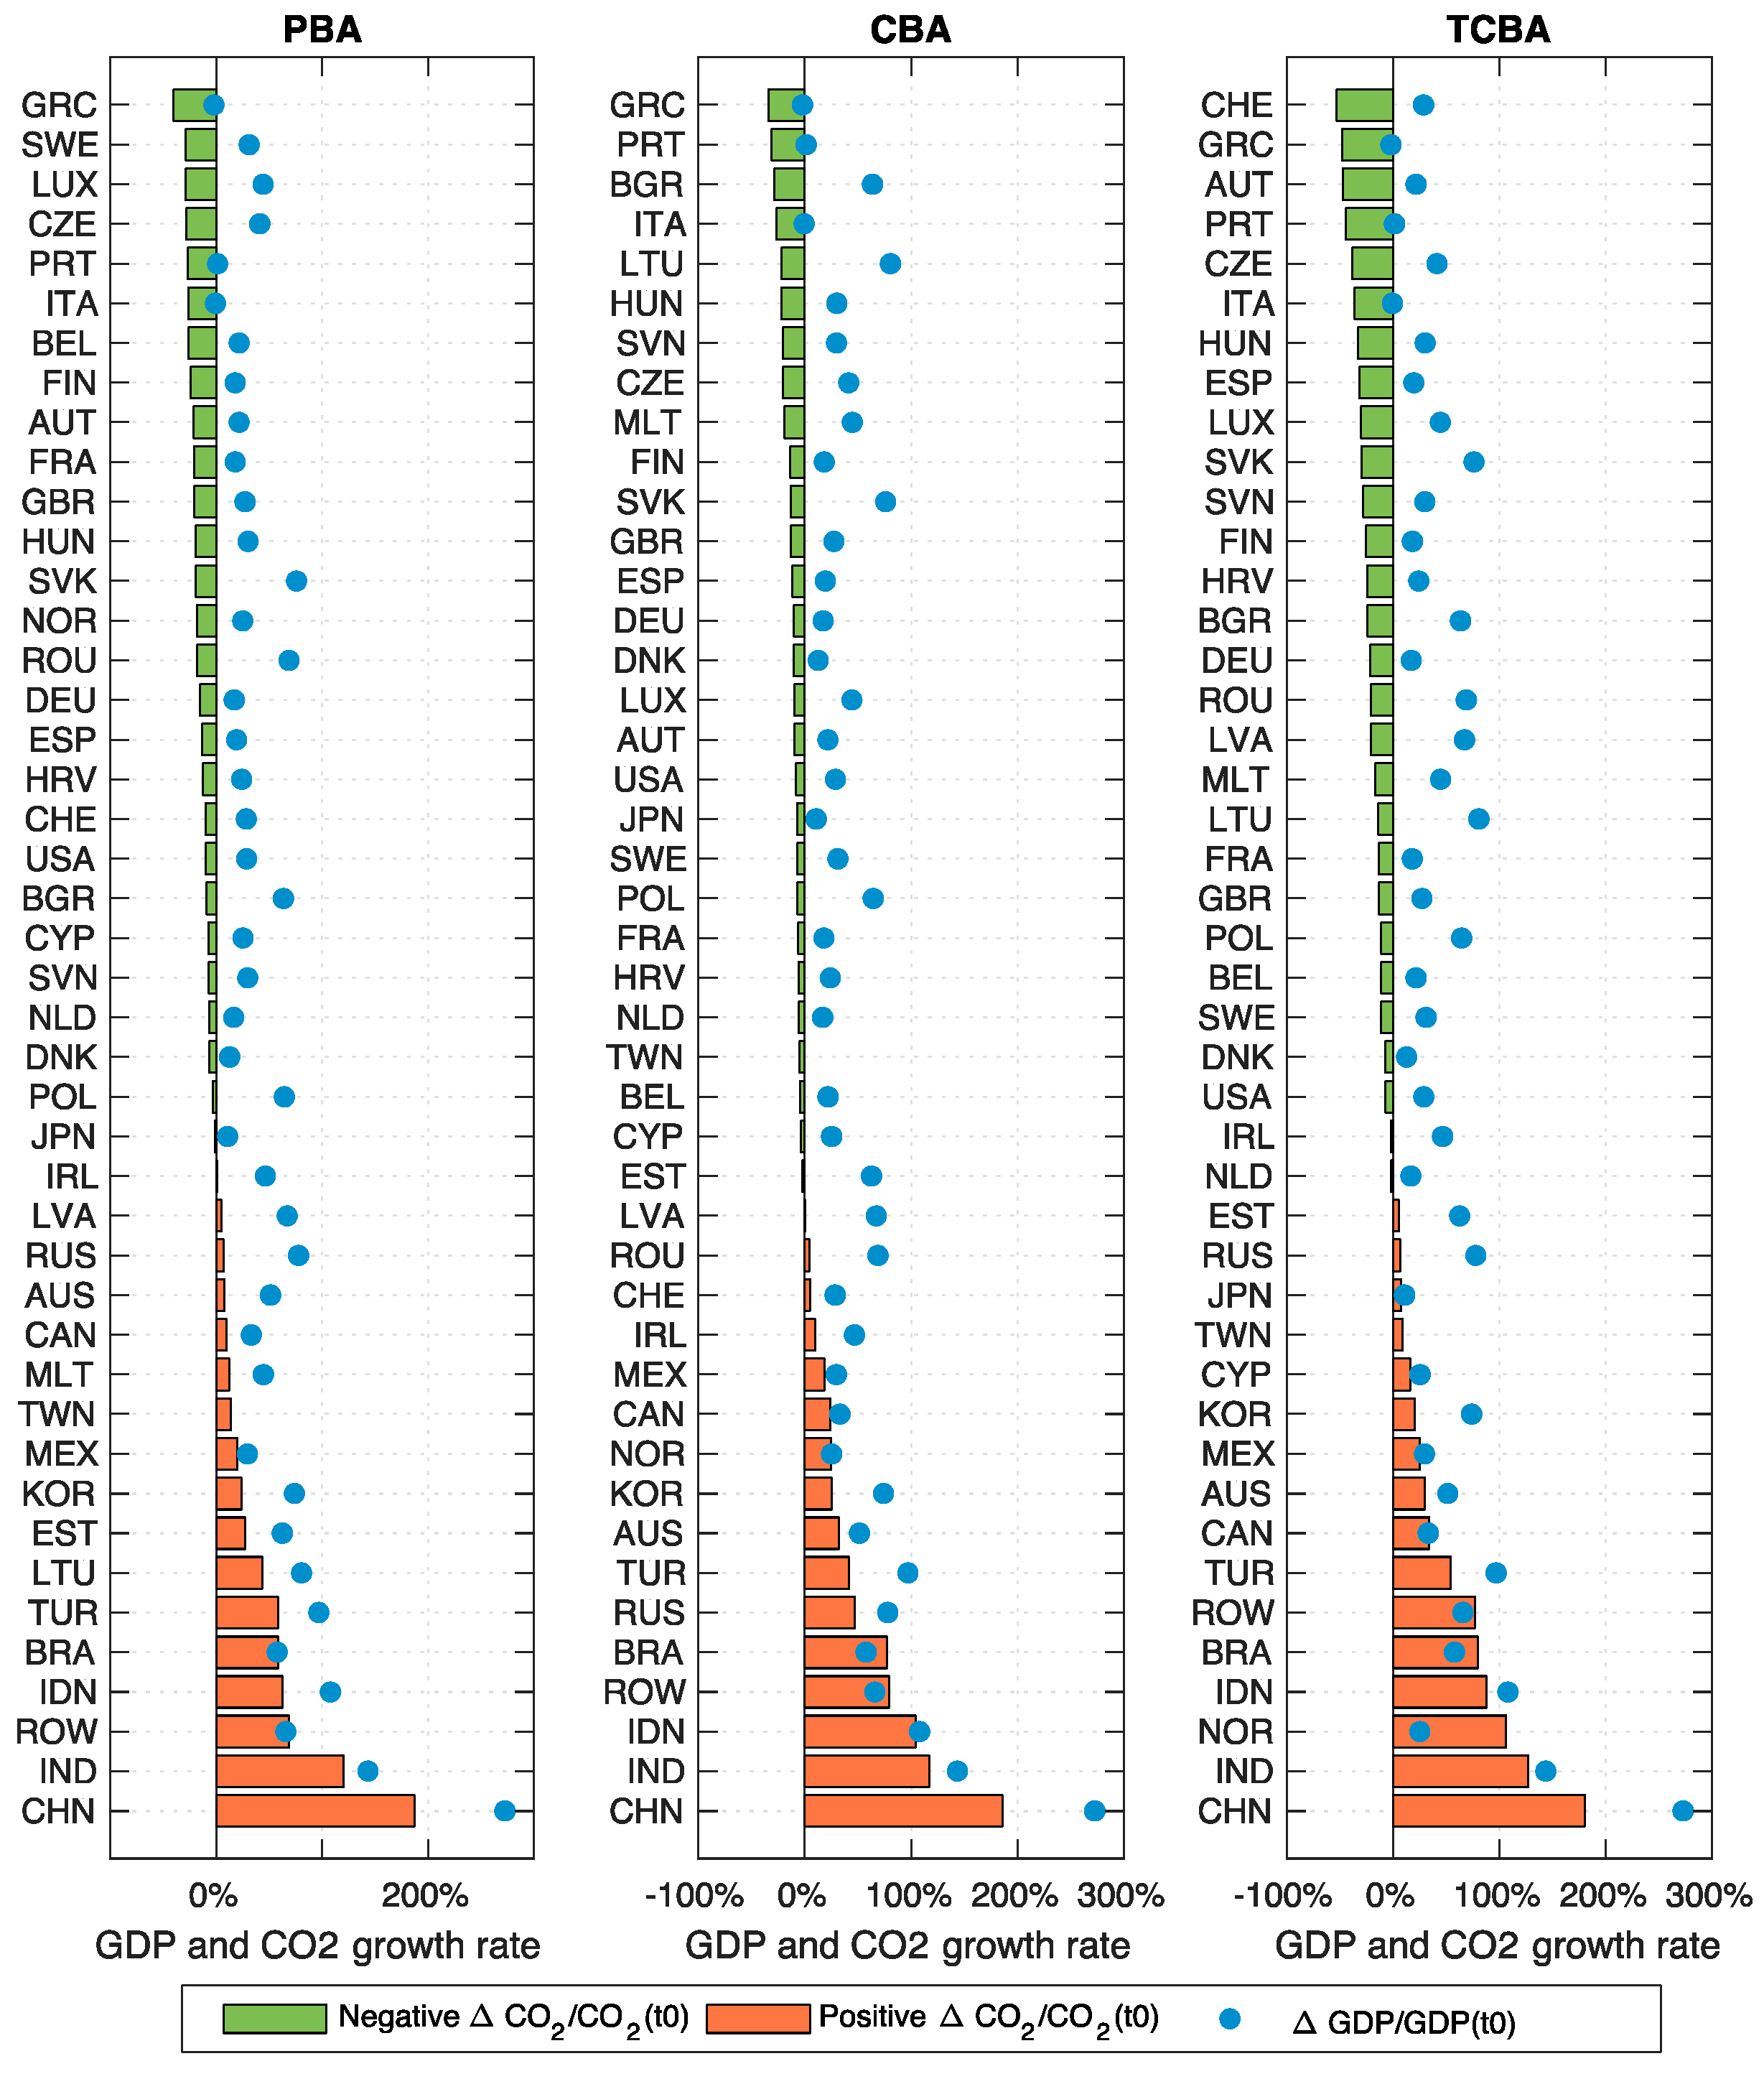
Figure 1 shows change in per cent for PBA, CBA and TCBA, from 2000 to 2014, for 43 countries plus the Rest of the World. Countries with green bars to the left have reduced their emissions under the accounting principle in question, whereas countries with red bars to the right have increased their emissions.
For each measure, there are more than 25 countries showing reduced emissions, and 21 countries have green bars for all measures. On average, for these 21 countries, PBA decreased by 14%, CBA by 11%, and TCBA by 14%. For the EU as a whole, the average reduction was 18% (PBA), 13% (CBA) and 22% (TCBA). For the US, emissions were reduced by 10% (PBA), 8% (CBA) and 7% (TCBA).
This contrasts with results for the period 1995–2009, when US emissions increased regardless of measure, whereas EU emissions increased for CBA, and decreased by only 6% for PBA and 7% for TCBA [14].
China, India, Indonesia, Brasil and Rest of the World have all increased their emissions by more than 50% during the same period, again regardless of accounting principle. India has more than doubled, and China nearly tripled, its emissions regardless of measure. The only countries that were unambiguously classified as developed markets throughout the period, which show red bars on all three measures, are Australia and Canada.
Blue dots represent change in GDP during the same period. As can be seen, 18 of the 21 countries which reduced their emissions on all three measures, also had a positive GDP growth over the period, thus providing clear and unambiguous evidence of absolute decoupling of economic growth from CO2-emissions.
For each measure, there are 23 to 24 countries showing reduced emissions combined with positive GDP growth.
It should be noted, of course, that the per capita levels of emissions in countries such as India and Indonesia are still much lower than in the developed countries that have reduced their emissions during the period. For China, on the other hand, per capita emissions are now on the same level as for some European countries.
It should also be noted that, even if a number of developed countries managed to cut their emissions, global emissions continued to grow, from 26 to 36 Gigatons (Gt) during the period. This growth was largely due to increasing production-based and household emissions in China (69%), India (12%) and Rest of the World (32%).
Perhaps more surprisingly, the same countries accounted for a very large share of the growth in global emissions from a consumption perspective, with China’s growth in CBA accounting for 60% of the global increase in emissions, India’s for 11%, and RoW for 35%. In fact, nearly 50% of the total increase in global emissions during the period was related to increased domestic production for domestic final demand in China.
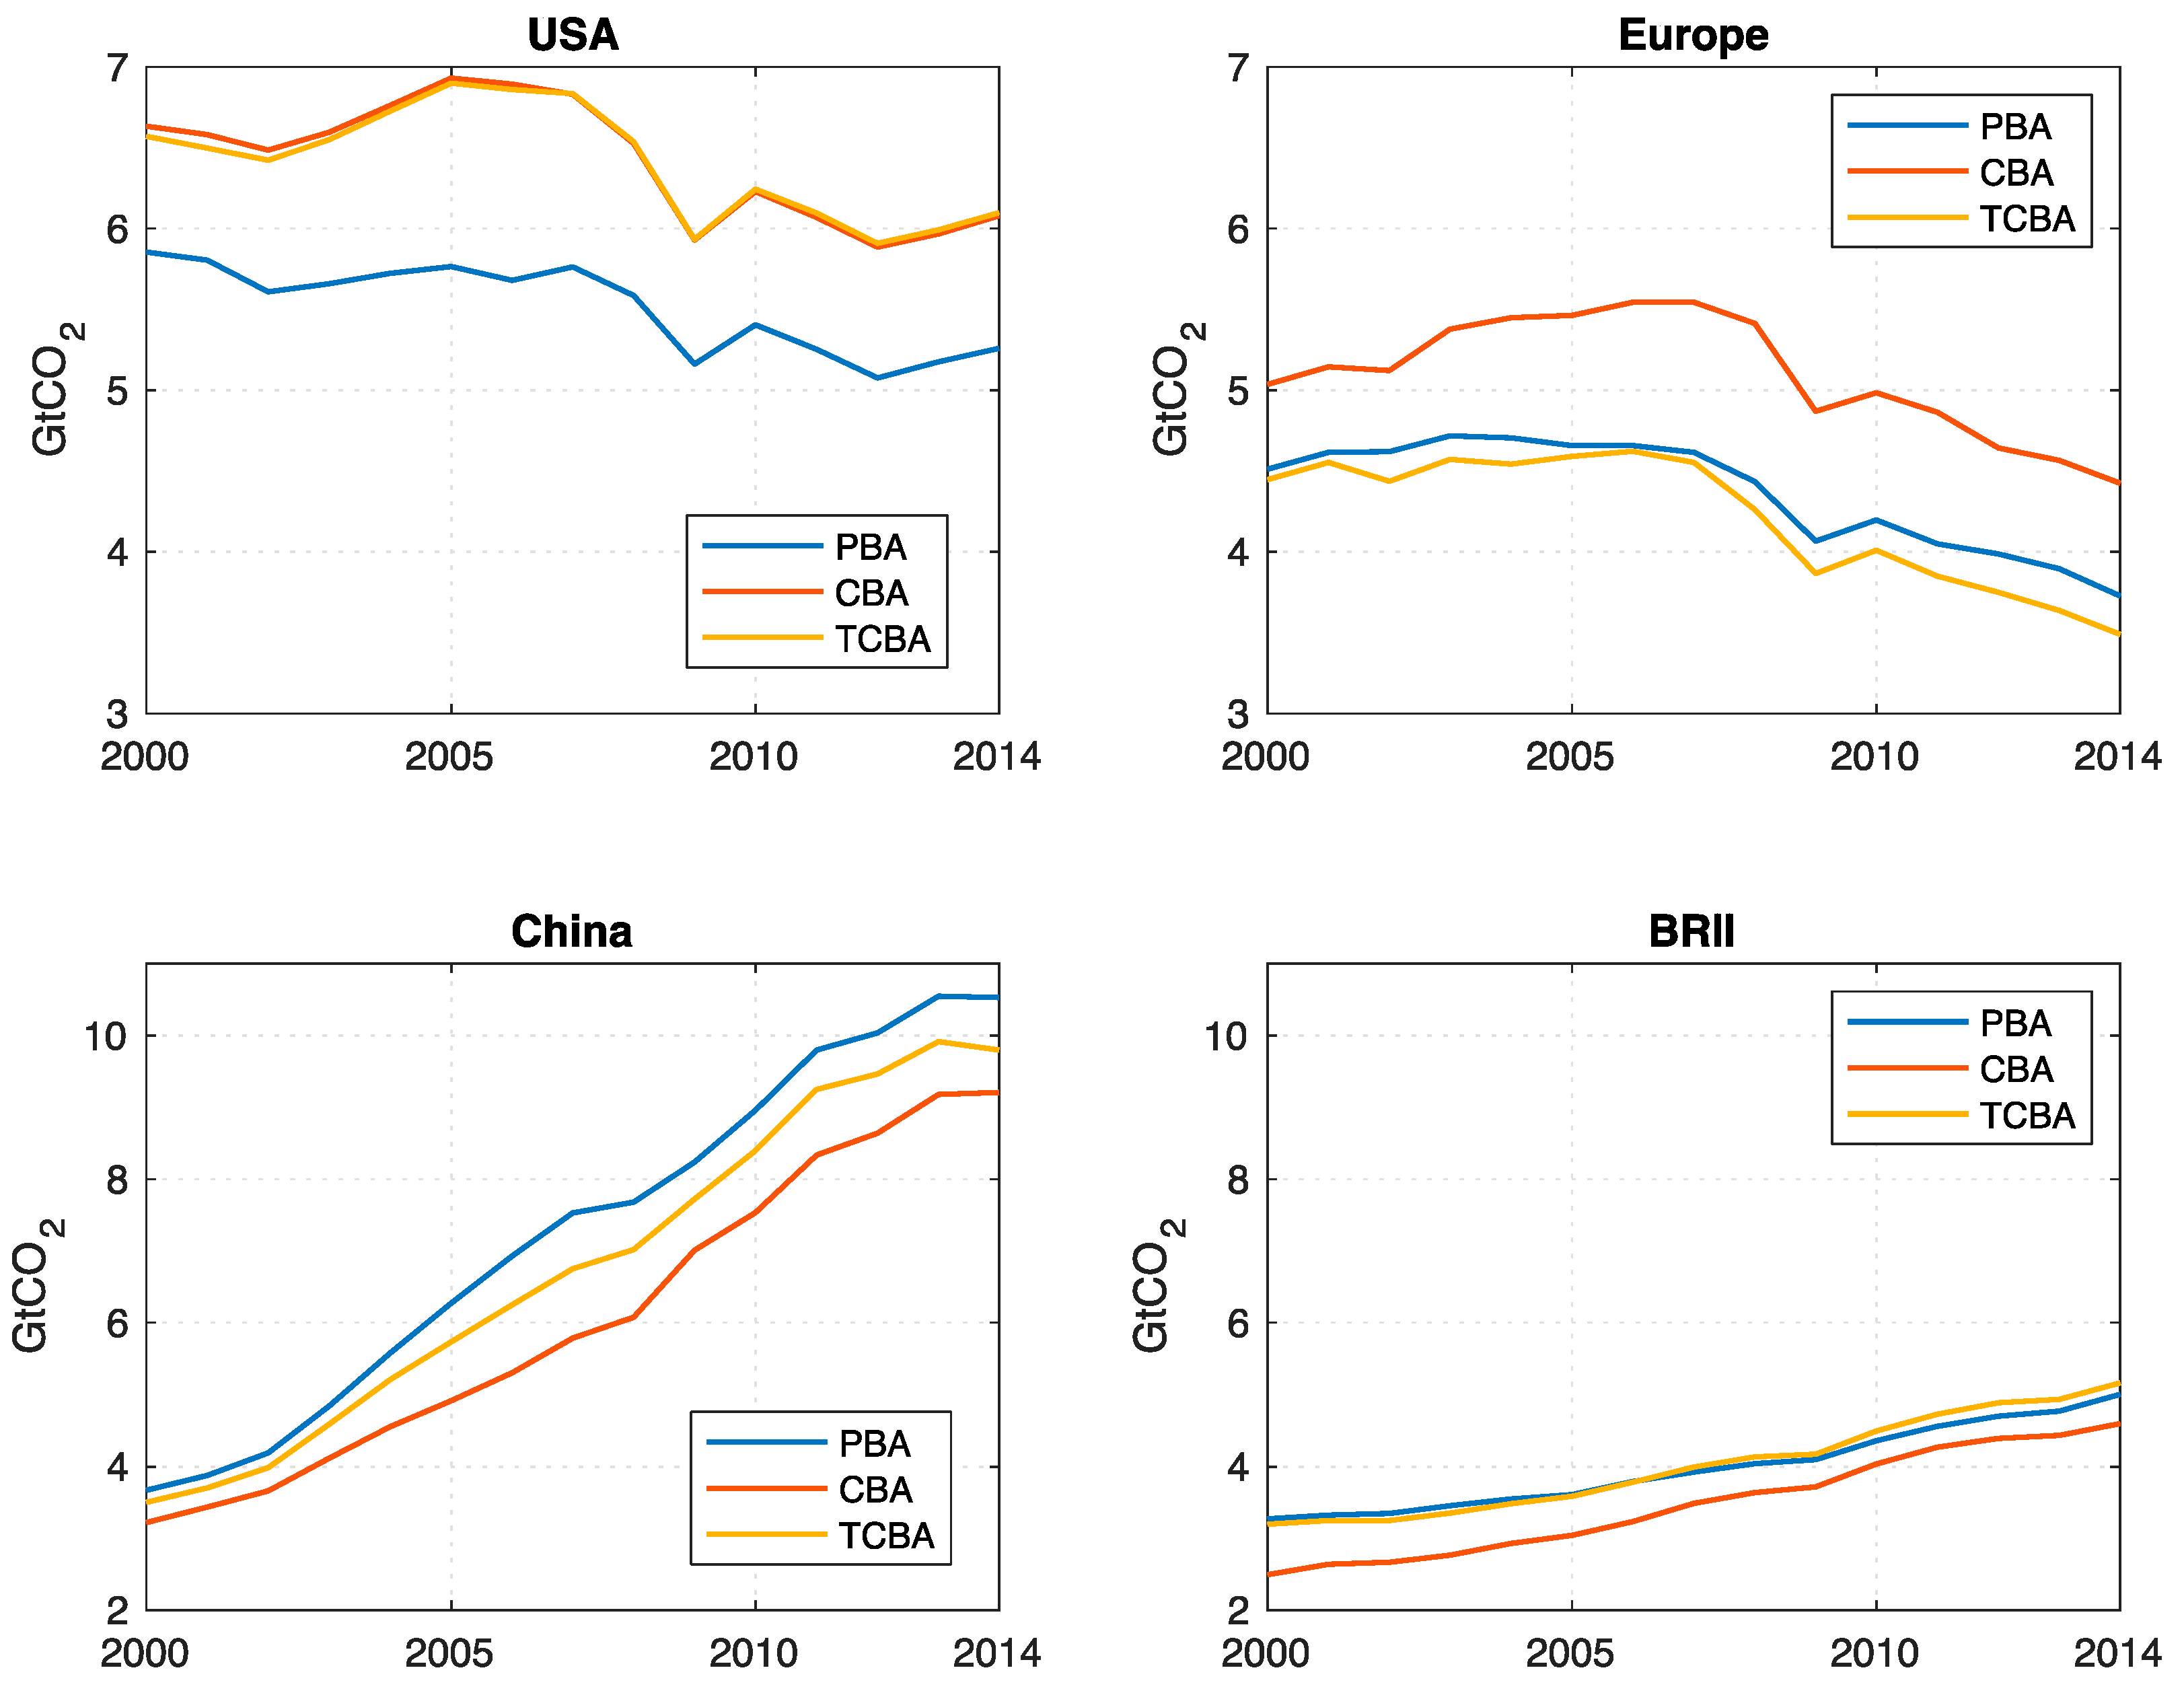
Figure 2 presents the development of PBA, CBA, TCBA over the period for four major economies, the US, Europe (EU28 plus Switzerland and Norway), China and India.
The drop in emissions in the US and the European countries starts with the financial crisis in 2008. In the US as well as the European countries, consumption-based and production-based emissions dropped 12%–15% between 2007 and 2009. In the US, they then stabilized around that level, whereas in the European countries, emissions continued to decrease throughout the period.
For China and other BRIIC countries (Brazil, Russia, India and Indonesia) emissions increased continuously over the period, on all three measures, but flattened out for China between 2013 and 2014. It is not possible to determine from the data available for this study whether this is a trend or just a temporary dent in the curve, but from other sources we know that, after three years of seeming stabilization, China’s production-based carbon emissions continued to grow and amounted to 10.9 Gt, equal to 29% of global emissions in 2017 [29]. According to recent projections emissions in China are expected to peak at 13–16 GtO2/yr between 2021 and 2025 approximately 5–10 years ahead of the current Paris target of 2030 [30]. Contrary to this positive assessment of China’s future performance, recent news report that between January 2018 and June 2019 China increased its coal-fired power generation capacity by 42.9 GW despite a global move towards cleaner energy sources [31]. So, firm conclusions about China’s future carbon trajectory seem difficult to draw.
For all four countries or country groups, trends look the same regardless of measure used, although levels differ between the measures. For the European countries and the US, consumption-based emissions, CBA, are significantly larger than production-based emissions, PBA. For China and the other BRIIC countries, the situation is the opposite.
For China and the other BRIIC countries, TCBA is larger than CBA, indicating that carbon intensities in export industries are higher than world average for the same industrial sectors. For the European countries, the situation is the opposite, with CBA significantly larger than TCBA, indicating that export industries are less carbon intensive than the world average for the same sectors. In this respect, the European countries differs from the US, where CBA and TCBA are roughly identical. This result is a very similar to what was found in previous studies for the period 1995–2009 [14].
3.2. SDA Results
Table 1 shows the results for global emissions and for some relevant components of emissions for four countries or country groups, the US, European countries, China, and BRII countries (Brazil, Russia, India and Indonesia). DOM is emissions from domestic production for domestic final demand, EEI is emissions embodied in imports, EEE is emissions embodied in exports, and EEEwa is technology-adjusted emissions embodied in exports, i.e., calculated with world average emissions factors for the relevant sectors. Results for all countries in WIOD are found in the Supplementary Materials.
For China, growth in domestic final demand has been huge; increasing domestic final demand added 7.7 Gt to China’s consumption-based emissions (DOM + EEI) during the period, corresponding to nearly 75% of the total growth in global emissions, and nearly 25% of total global emissions in 2014. At the same time, changes in the composition and sourcing of intermediate goods in Chinese production added 1.8 Gt/yr to China’s production-based emissions (DOM+ EEE), while improved carbon efficiency of Chinese production contributed to reducing emissions by 4.1 Gt/yr.
The net effect on global emissions of changes in consumption and technology in China—i.e., the net effect of changes occurring within China (cf. [23])—was a 5.5 Gt/yr increase.
The fact that contributed four times more to reducing emissions embodied in exports with Chinese domestic technology factors (EEE) than with world average technology factors (EEEwa), indicates that Chinese technology in export industries improved much faster during the period than the world average in the same sectors.
For the US, increasing domestic final demand added 1.4 Gt/yr to US consumption-based emissions, whereas changes in the mix of and sourcing of goods for final demand reduced emissions slightly. The observed net reduction in US consumption-based emissions is mainly explained by improvements in composition and sourcing of intermediate goods in US production (−1.3 Gt/yr) and improved technology factors in imports, whereas changes in domestic technology factors only contributed modestly to reducing emissions. The net effect on global emissions of changes in consumption and technology in the US was a 0.2 Gt/yr reduction.
Unlike China, US technology factors in export industries improved slower than the world average in the same sectors. This is shown by contributing more to reducing emissions embodied for EEEwa than for EEE.
For the European countries (i.e., EU28 plus Norway and Switzerland) as well, growing consumption levels contributed to increased domestic and imported emissions and, like the US, changes in the structure and sourcing of consumption contributed to a slight decrease. Unlike the US, however, the main driver of emissions reductions was improvements in domestic technology. Technology changes in the European countries reduced its production-based emissions by 1.4 Gt/yr, and the net effect on global emissions of changes in consumption and technology in Europe was a 1 Gt/yr reduction. Like China, and unlike the US, technology factors in European export industries on average improved faster than world average, which is shown by being larger for EEE than for EEEwa.
For the BRII countries, i.e., Brazil, Russia, India and Indonesia, increasing consumption added 2.5 Gt to domestic and imported emissions, whereas changes in the composition and sourcing of final demand had a slightly negative impact. Improvements in domestic technology factors and in composition and sourcing of domestic production reduced emissions by 0.8 Gt. The net effect on global emissions of changes in consumption and technology in BRII countries, was a 1.7 Gt/yr increase.
The Rest of the World is an artificial region consisting of all countries that are not accounted for individually in WIOD, to a large extent developing countries. There is not much point in analyzing trends in this broad spectrum of countries, but it should be noted that increasing consumption in these countries accounted for over 3 Gt/yr, or 30% of the total increase in global emissions. Although each RoW country accounts for a fairly small share of the global economy and emissions, collectively they are playing an increasingly important role for global emission trends.
By comparing the contribution of changes in technology for emissions embodied in trade with domestic and world average emissions factors (i.e., the factor for EEE and EEEwa), we can see whether a country has improved carbon efficiency in export sectors faster or slower than the world average. Figure 3 shows the value of (EEE)/(EEEwa) for all countries that have improved their technology factors. A value larger than 0 means that the total change in domestic emissions factors for export sectors was faster than the change in world average factors for the same sectors. As can be seen, the countries that have improved fastest are Malta, Greece, Taiwan, Bulgaria, Romania, Poland and China.
Most countries in Western Europe have improved their domestic emissions factors in export industries slower than world average for the same sectors. This is not very surprising, since carbon intensities in these countries were lower at the start. Still, it indicates a significant convergence of technology taking place.
4. Discussion
The study reveals some important shifts in global emission trends compared to studies of the period before 2009. First, a number of developed countries, including 18 of 28 EU-countries and the US, have reduced their emissions regardless of measure used.
This contrasts with the previous period, when consumption-based emissions in most developed countries were still growing, while production-based emissions in the same countries declined, giving rise to the suspicion that, instead of making real progress, developed countries were merely outsourcing the effects on emissions of their increased consumption to other countries. Although studies of technology-adjusted measures moderated this picture, showing that for some—but not all—developed countries, the gap between CBA and PBA was largely due to differences in the carbon efficiency of energy and production rather than outsourcing of emissions intensive production, the overall picture was still mixed.
In the present study, trends are much clearer, and provide no support for the suggestion that observed reductions in territorial emissions in most developed countries are largely explained by outsourcing of emissions. Most developed countries in this study have reduced consumption-based as well as production-based emissions, and for some European countries, the reduction in consumption-based emissions exceeds that in production-based emissions. With adjustments for technology differences between countries, i.e., when reductions in TCBA are compared with reductions in PBA, this is the case for 20 European countries. The developed countries that do not fit with this story are mainly Canada and Australia, which have increased emissions on all accounting schemes.
The significance of this result is not so much the emissions reductions themselves. These are fairly modest, and by far outweighed by increased emissions in China, other BRIIC countries and Rest of the World, resulting in a huge net increase in global emissions during the period.
The result is important because it answers a key question for sustainable development, namely whether economic growth is possible without increased carbon emissions. Since at least 18 developed countries reduced their emissions on all measures while maintaining economic growth, the study provides clear evidence of absolute but quite modest decoupling (i.e., growth in GDP at the same time as emissions go down).
A second important result is that the growth of global emissions during the studied period was more or less entirely driven by increasing consumption in emerging and developing economies. Increasing consumption in emerging and developing countries was the main driver of the growth of global emissions also for the previous period, 1995–2008 [23], but it has become much more pronounced in the more recent period, with a larger increase in consumption-based emissions in emerging and developing countries, and a change from net increase to decrease in developed countries.
The point of stressing this result is not to shift moral responsibility from developed to developing countries. It should be remembered that per capita emissions are still much lower in most developing countries than in developed ones, and that economic growth—and hence growth in demand—is needed to achieve sustainable development goals. Still, for some rapidly emerging economies like China, emission levels per capita are already at or above the average European level.
The point is that the result has implications for what needs to be the focus of climate policy. Reducing consumption-based emissions in developed economies is necessary, but the scale of the potential increase in emissions resulting from growing consumption in developing and emerging economies is so large that it would more than outweigh any possible reductions in emissions due to reduced consumption in developed countries, unless future development can be pushed into a different, non-fossil, path.
In fact, only the increase in consumption-based emissions between 2000 and 2014 in the BRIIC countries amounted to nearly 90% of the total consumption-based emissions in EU 28 and the US together. With adjustment for differences in technology between countries, i.e., TCBA, the increase in BRIIC countries equals total emissions in the EU and the US.
A third important result is that technology improvements in Chinese export industries had three times more impact on global emissions than the corresponding improvements in the European countries and the US taken together.
This does not mean that improving technology or reducing consumption-based emissions in rich and developed countries is unimportant. But it means that it is the development in China and other rapidly growing economies that will determine whether international efforts to halt the growth of global emissions will be successful or not. The focus of climate policy in the EU and other developed countries should, therefore, be on transformative solutions that can be disseminated and implemented on a large scale to support a fossil-free development path for countries that are still in great need of economic growth.
5. Conclusions
The main drivers behind the increase in global carbon emissions 2000–2014 was increasing consumption and production in developing and rapidly growing economies. The majority of developed countries decreased their emissions—albeit modestly and from a high per capita level—from a consumption as well as a production perspective, and with or without adjustment for technology differences. This result is hopeful as well as worrying. Hopeful, because it demonstrates that sustained economic growth is possible without increased emissions. Worrying, first because emission reductions in developed countries are too slow. Second, it also demonstrates that reducing emissions in countries that are already industrialized will be far from enough. Policies that aim at mitigating existing emission sources in developed countries must be speeded up and complemented with strategies to facilitate low carbon pathways to much needed economic progress in today’s developing countries.
Supplementary Materials
The following are available online at https://www.mdpi.com/1996-1073/13/2/339/s1: Table S1: Drivers of change in emissions 2000–2014.
Author Contributions
Conceptualization, M.J., V.K. and A.K.; Data curation, V.K.; Formal analysis, M.J., V.K. and A.K.; Methodology, M.J., V.K. and A.K.; Visualization, V.K.; Writing–original draft, M.J.; Writing–review and editing, V.K. and A.K. All authors have read and agreed to the published version of the manuscript.
Funding
This research was funded by the Swedish Energy Agency, grant number 37645-2.
Conflicts of Interest
The authors declare no conflict of interest. The funders had no role in the design of the study; in the collection, analyses, or interpretation of data; in the writing of the manuscript; or in the decision to publish the results.
References
- Afionis, S.; Sakai, M.; Scott, K.; Barrett, J.; Gouldson, A. Consumption-based carbon accounting: Does it have a future? Wiley Interdiscip. Rev. Clim. Chang. 2017, 8, e438. [Google Scholar] [CrossRef]
- Davis, S.J.; Caldeira, K. Consumption-based accounting of CO2 emissions. Proc. Natl. Acad. Sci. USA 2010, 107, 5687–5692. [Google Scholar] [CrossRef] [PubMed] [Green Version]
- Peters, G.P. From production-based to consumption-based national emission inventories. Ecol. Econ. 2008, 65, 13–23. [Google Scholar] [CrossRef]
- Peters, G.P.; Hertwich, E.G. CO2 embodied in international trade with implications for global climate policy. Environ. Sci. Technol. 2008, 42, 1401–1407. [Google Scholar] [CrossRef] [PubMed] [Green Version]
- Peters, G.P.; Minx, J.C.; Weber, C.L.; Edenhofer, O. Growth in emission transfers via international trade from 1990 to 2008. Proc. Natl. Acad. Sci. USA 2011, 108, 8903–8908. [Google Scholar] [CrossRef] [Green Version]
- Wiedmann, T.; Lenzen, M. Environmental and social footprints of international trade. Nat. Geosci. 2018, 11, 314–321. [Google Scholar] [CrossRef]
- Wood, R.; Moran, D.; Stadler, K.; Ivanova, D.; Steen-Olsen, K.; Tisserant, A.; Hertwich, E.G. Prioritizing Consumption-Based Carbon Policy Based on the Evaluation of Mitigation Potential Using Input-Output Methods. J. Ind. Ecol. 2018, 22, 540–552. [Google Scholar] [CrossRef] [Green Version]
- Hoekstra, R.; Michel, B.; Suh, S. The emission cost of international sourcing: Using structural decomposition analysis to calculate the contribution of international sourcing to CO2-emission growth. Econ. Syst. Res. 2016, 28, 151–167. [Google Scholar] [CrossRef] [Green Version]
- Wood, R.; Moran, D.; Rodrigues, J.F.D.; Stadler, K. Variation in trends of consumption based carbon accounts. Sci. Data 2019, 6, 99. [Google Scholar] [CrossRef]
- Jiborn, M.; Kander, A.; Kulionis, V.; Nielsen, H.; Moran, D. Decoupling or delusion? Measuring emissions displacement in foreign trade. Glob. Environ. Chang. 2018, 49, 27–34. [Google Scholar] [CrossRef]
- Jakob, M.; Marschinski, R. Interpreting trade-related CO2 emission transfers. Nat. Clim. Chang. 2013, 3, 19–23. [Google Scholar] [CrossRef]
- Jakob, M.; Steckel, J.C.; Edenhofer, O. Consumption-versus production-based emission policies. Annu. Rev. Resour. Econ. 2014, 6, 297–318. [Google Scholar] [CrossRef]
- Baumert, N.; Kander, A.; Jiborn, M.; Kulionis, V.; Nielsen, T. Global outsourcing of carbon emissions 1995–2009: A reassessment. Environ. Sci. Policy 2019, 92, 228–236. [Google Scholar] [CrossRef]
- Kander, A.; Jiborn, M.; Moran, D.; Wiedmann, T. National greenhouse-gas accounting for effective climate policy on international trade. Nat. Clim. Chang. 2015, 5, 431–435. [Google Scholar] [CrossRef]
- Kander, A.; Jiborn, M.; Moran, D.; Wiedmann, T. Reply to ‘Consistency of technology-adjusted consumption-based accounting’. Nat. Clim. Chang. 2016, 6, 730. [Google Scholar] [CrossRef] [Green Version]
- Domingos, T.; Zafrilla, J.E.; Lopez, L.A. Consistency of technology-adjusted consumption-based accounting. Nat. Clim. Chang. 2016, 6, 729. [Google Scholar] [CrossRef]
- Kanemoto, K.; Moran, D.; Lenzen, M.; Geschke, A. International trade undermines national emission reduction targets: New evidence from air pollution. Glob. Environ. Chang. 2014, 24, 52–59. [Google Scholar] [CrossRef]
- Munksgaard, J.; Pedersen, K.A. CO2 accounts for open economies: Producer or consumer responsibility? Energy Policy 2001, 29, 327–334. [Google Scholar] [CrossRef]
- Hagbert, P.; Finnveden, G.; Fuehrer, P.; Svenfelt, Å.; Alfredsson, E.; Aretun, Å.; Bradley, K.; Callmer, Å.; Fauré, E.; Gunnarsson-Östling, U.; et al. Futures Beyond GDP Growth: Final report from the research program Beyond GDP Growth: Scenarios for sustainable building and planning. KTH Sch. Archit. Built Environ. Available online: https://tinyurl.com/yfspzmdk (accessed on 28 November 2019).
- Corsatea, T.D.; Lindner, S.; Arto, I.; Román, M.V.; Rueda-Cantuche, J.M.; Velázquez Afonso, J.M.; Amores, A.F.; Neuwah, F. World Input-Output Database Environmental Accounts Update 2000–2016; Publications Office of the European Union: Brussels, Belgium, 2019. [Google Scholar]
- Kulionis, V. Energy Embodied in Trade, 1970–2014; Department of Economic History, School of Economics and Management: Lund, Sweden, 2019. [Google Scholar]
- Karstensen, J.; Peters, G.P.; Andrew, R.M. Trends of the EU’s territorial and consumption-based emissions from 1990 to 2016. Clim. Chang. 2018, 151, 131–142. [Google Scholar] [CrossRef]
- Arto, I.; Dietzenbacher, E. Drivers of the Growth in Global Greenhouse Gas Emissions. Environ. Sci. Technol. 2014, 48, 5388–5394. [Google Scholar] [CrossRef]
- Dietzenbacher, E.; Los, B.; Stehrer, R.; Timmer, M.; de Vries, G. The Construction of World Input-Output Tables in the World Project. Econ. Syst. Res. 2013, 25, 71–98. [Google Scholar] [CrossRef]
- Timmer, M.P.; Dietzenbacher, E.; Los, B.; Stehrer, R.; de Vries, G. An Illustrated User Guide to the World Input-Output Database: The Case of Global Automotive Production. Rev. Int. Econ. 2015, 23, 575–605. [Google Scholar] [CrossRef]
- Leontief, W. Environmental Repercussions and the Economic Structure: An Input-Output Approach. Rev. Econ. Stat. 1970, 52, 262–271. [Google Scholar] [CrossRef]
- Miller, R.E.; Blair, P.D. Input-Output Analysis: Foundations and Extensions, 2nd ed.; Cambridge University Press: Cambridge, UK, 2009. [Google Scholar]
- Dietzenbacher, E.; Los, B. Structural decomposition techniques: Sense and sensitivity. Econ. Syst. Res. 1998, 10, 307. [Google Scholar] [CrossRef]
- Muntean, M.; Guizzardi, D.; Schaaf, E.; Crippa, M.; Solazzo, E.; Olivier, J. Fossil CO2 Emissions of All World Coutries; Publications Office of the European Union: Brussels, Belgium, 2011. [Google Scholar]
- Wang, H.; Lu, X.; Deng, Y.; Sun, Y.; Nielsen, C.P.; Liu, Y.; Zhu, G.; Bu, M.; Bi, J.; McElroy, M.B. China’s CO2 peak before 2030 implied from characteristics and growth of cities. Nat. Sustain. 2019, 2, 748–754. [Google Scholar] [CrossRef]
- Ambrose, J. China’s appetite for coal power returns despite climate pledge. Guardian 2019. Available online: https://www.theguardian.com/world/2019/nov/20/china-appetite-for-coal-power-stations-returns-despite-climate-pledge-capacity (accessed on 27 November 2019).
Figure 1.
Changes in production-based accounting (PBA), consumption-based accounting (CBA) and technology-adjusted consumption-based accounting (TCBA) 2000–2014.
Figure 1.
Changes in production-based accounting (PBA), consumption-based accounting (CBA) and technology-adjusted consumption-based accounting (TCBA) 2000–2014.

Figure 2.
Development of PBA, CBA and TCBA 2000–2014 for the US, China, Europe (EU28 plus Norway and Switzerland), China and BRII countries (Brazil, Russia, India and Indonesia).
Figure 2.
Development of PBA, CBA and TCBA 2000–2014 for the US, China, Europe (EU28 plus Norway and Switzerland), China and BRII countries (Brazil, Russia, India and Indonesia).

Figure 3.
Emissions reductions due to technology changes with domestic emission factors compared to world average, [(EEE)/ (EEEwa)] – 1.
Figure 3.
Emissions reductions due to technology changes with domestic emission factors compared to world average, [(EEE)/ (EEEwa)] – 1.


Table 1.
Drivers of change in emissions, globally and in some major economies and country groups. Gigatons Gt of CO2. Results for all countries are found in the SI.
Table 1.
Drivers of change in emissions, globally and in some major economies and country groups. Gigatons Gt of CO2. Results for all countries are found in the SI.
| q | L | M | d | Total | |
|---|---|---|---|---|---|
| Global | −8.19 | 1.23 | 0.91 | 16.87 | 10.82 |
| USA | |||||
| DOM | −0.09 | −1.13 | −0.36 | 1.07 | −0.51 |
| EEE | −0.06 | −0.16 | −0.04 | 0.18 | −0.08 |
| EEI | −0.46 | 0.27 | 0.24 | 0.30 | 0.35 |
| EEEwa | −0.08 | −0.14 | −0.04 | 0.19 | −0.08 |
| China | |||||
| DOM | −3.13 | 0.90 | 0.34 | 7.07 | 5.18 |
| EEE | −1.00 | 0.94 | 1.08 | 0.65 | 1.68 |
| EEI | −0.13 | −0.02 | 0.04 | 0.66 | 0.55 |
| EEEwa | −0.24 | 0.55 | 0.63 | 0.40 | 1.34 |
| European countries | |||||
| DOM | −0.79 | 0.00 | −0.25 | 0.31 | −0.74 |
| EEE | −0.63 | 0.06 | 0.03 | 0.48 | −0.07 |
| EEI | −0.70 | 0.35 | 0.16 | 0.29 | 0.11 |
| EEEwa | −0.42 | 0.09 | −0.03 | 0.75 | 0.39 |
| BRII | |||||
| DOM | −0.23 | −0.36 | −0.10 | 2.13 | 1.44 |
| EEE | −0.14 | −0.08 | 0.07 | 0.45 | 0.30 |
| EEI | −0.19 | 0.15 | 0.09 | 0.39 | 0.44 |
| EEEwa | −0.10 | 0.01 | 0.03 | 0.22 | 0.16 |
Note: represents changes in CO2 intensity (technology), consist of changes in the composition and sourcing of intermediate goods, contains changes in the composition and sourcing of final demand, captures changes in the level of final demand (“consumption”). Direct emissions by households are included in DOM part effect. European countries consist of EU28 plus Norway and Switzerland.
© 2020 by the authors. Licensee MDPI, Basel, Switzerland. This article is an open access article distributed under the terms and conditions of the Creative Commons Attribution (CC BY) license (http://creativecommons.org/licenses/by/4.0/).
Share and Cite
MDPI and ACS Style
Jiborn, M.; Kulionis, V.; Kander, A. Consumption versus Technology: Drivers of Global Carbon Emissions 2000–2014. Energies 2020, 13, 339. https://doi.org/10.3390/en13020339
AMA Style
Jiborn M, Kulionis V, Kander A. Consumption versus Technology: Drivers of Global Carbon Emissions 2000–2014. Energies. 2020; 13(2):339. https://doi.org/10.3390/en13020339
Chicago/Turabian StyleJiborn, Magnus, Viktoras Kulionis, and Astrid Kander. 2020. "Consumption versus Technology: Drivers of Global Carbon Emissions 2000–2014" Energies 13, no. 2: 339. https://doi.org/10.3390/en13020339
Note that from the first issue of 2016, this journal uses article numbers instead of page numbers. See further details here.