Analysis of the Flow Distribution in a Particle Bed Reactor for Nuclear Thermal Propulsion


Institute of Nuclear and New Energy Technology, Collaborative Innovation Center of Advanced Nuclear Energy Technology, Key Laboratory of Advanced Reactor Engineering and Safety of Ministry of Education, Tsinghua University, Beijing 100084, China
*
Author to whom correspondence should be addressed.
Energies 2019, 12(19), 3590; https://doi.org/10.3390/en12193590
Submission received: 29 August 2019
/
Revised: 16 September 2019
/
Accepted: 19 September 2019
/
Published: 20 September 2019
(This article belongs to the Special Issue Renewable Energy and High Efficiency Energy Systems Applied to Aerospace Vehicles and Facilities)
Abstract
:Nuclear thermal propulsion (NTP) is regarded as the preferred option for the upcoming crewed interstellar exploration due to its excellent performance compared to the current most advanced chemical propulsion systems. Over the past several decades, many novel concepts have been proposed, among which the particle bed reactor (PBR) is the most efficient, compact, and lightweight method. Its unique features, such as the extremely high power density and the radial flow path of coolant in the fuel region, introduce many challengeable issues to the thermal hydraulic design of PBR, with the flow distribution being representative. In this work, the flow distribution process within the core is analyzed based on the understanding of the axial pressure profile in a dummy PBR. A “flow shift” phenomenon leading to the hot spot in the core is introduced first, and three methods, i.e., decreasing the pressure drop within the hot gas channel, increasing the flow resistance on the cold frit or hot frit, and changing the flow pattern from “Z” to “U”, are proposed to reduce the “flow shift” and the consequent temperature mal-distribution. The pros and cons of using cold frit or hot frit to distribute the coolant are also discussed. Finally, by using three numerical examples, these analyses are demonstrated. The findings here may provide technical support for PBR design.
1. Introduction
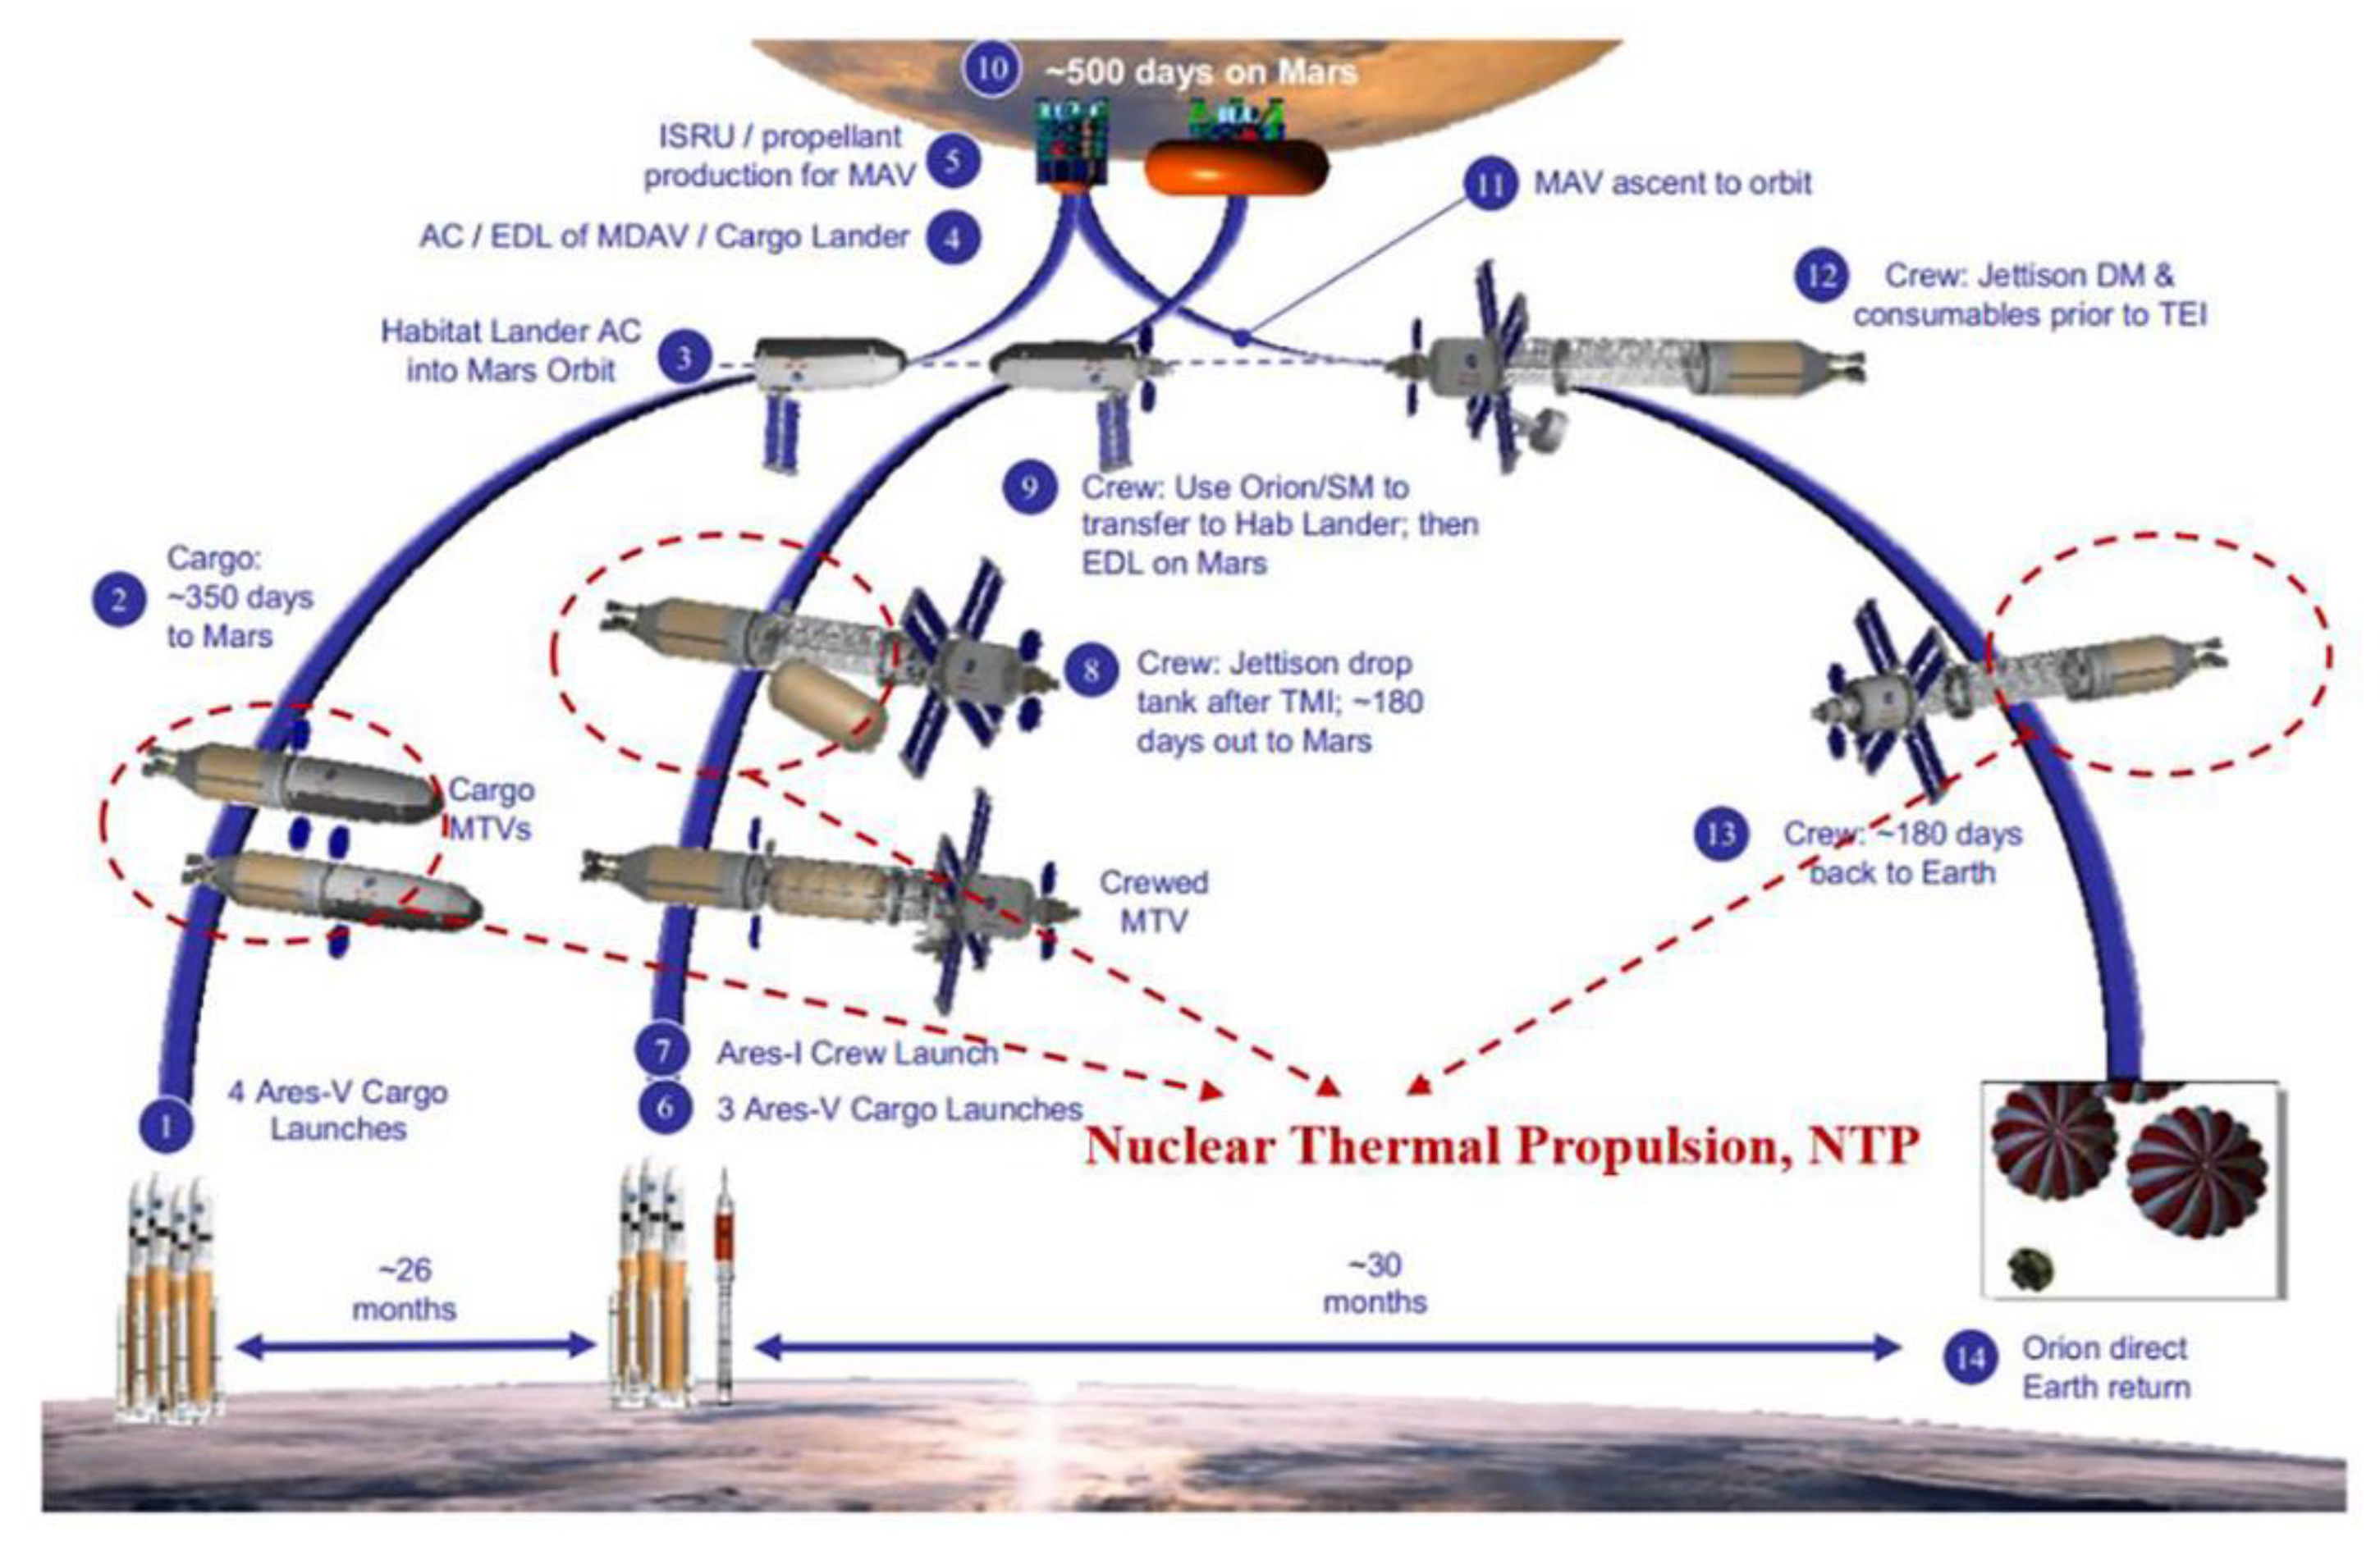
Interplanetary exploration and deep space activities have attracted enormous attention over the past several decades. However, these projects are expensive even for developed countries or mature space technology organizations. Also, long-term space explorations impose many challenges and risks to astronauts, who suffer more cosmic ray exposure and bone loss. Therefore, a new, trustworthy technique is in great demand to reduce the mission duration, risk, and cost for future space exploration [1,2,3]. The nuclear thermal propulsion (NTP) system is a promising technology, which uses nuclear fission energy rather than the traditional chemical reactions to heat liquid hydrogen [4,5], thus its specific impulse shows significant improvement over chemical rockets due to the lower molecular weight of propellant. The specific impulse represents the efficiency of the rocket engines. More specifically, it is the change in momentum per unit mass for fuels, or rather how much more push accumulates as the fuel is used [6]. Increasing the specific impulse means less propellant is used for same mission or a heavier payload is achieved at the same propellant consumption [7]. Furthermore, NTP has a higher thrust (even up to 100 tons) and a longer lifetime than any other current in-space propulsion systems, which ensures a faster transmit procedure and longer traveling distance on space missions [8,9]. Because of its excellent transportation performance, NTP broadens the launch window of space missions (to months instead of days) [10], and is capable of returning to Earth at any time within three months of Earth departure burn, which increases the mission robustness and allows for potential abort scenarios. National Aeronautics and Space Administration (NASA) has anticipated that NTP could be the preferred option in outer space, especially for manned Mars exploration activities programmed in the Mars Design Reference Architecture 5.0 (DRA 5.0) in 2009 [11], as shown in Figure 1. In this sequence, the NTP system will be equipped on the cargo Mars transfer vehicles (MTVs) and crewed MTV. It will also be applied to the return journey of the crew to Earth. According to the architecture, the initial mass in low earth orbit (IMLEO) reduces by 33%, while the traveling time in space decreases by 40% when using NTP instead of a conventional chemical stage [10].
NTP has been studied for several decades. It was first conceived in 1940s and 1950s, and aggressively developed in the 1960s and the early 1970s. The principal research was carried out in the United States of America (USA) and the Union of Soviet Socialist Republics (USSR) [12]. In the USA, the most representative effort is the “Rover” project and the later Nuclear Engine for Rocket Engine Application (NERVA) [13]. During the projects, more than 20 different reactors were built, and numerous key technologies, including fuel fabrication and testing, were realized. The projects demonstrated that NTP could be a feasible and reliable tool to explore space, and the latest NERVA engine, the XE, was qualified for a human mission to Mars. Meanwhile, the USSR claimed to build the most developed prototype nuclear engine, RD-0410, which had a slightly better performance than NERVA. Regrettably, no nuclear thermal propulsion system has been launched into space yet. The NERVA project was terminated in 1973 due to non-technical reasons, but research still proceeded in some institutions. In the 1980s, a more efficient, compact, and lightweight design, namely the particle bed reactor (PBR), was proposed based on the knowledge derived from NERVA, which further enhanced exploration capabilities [14]. However, PBR is much more immature than NERVA in terms of the technology due to many inherent technical challenges.
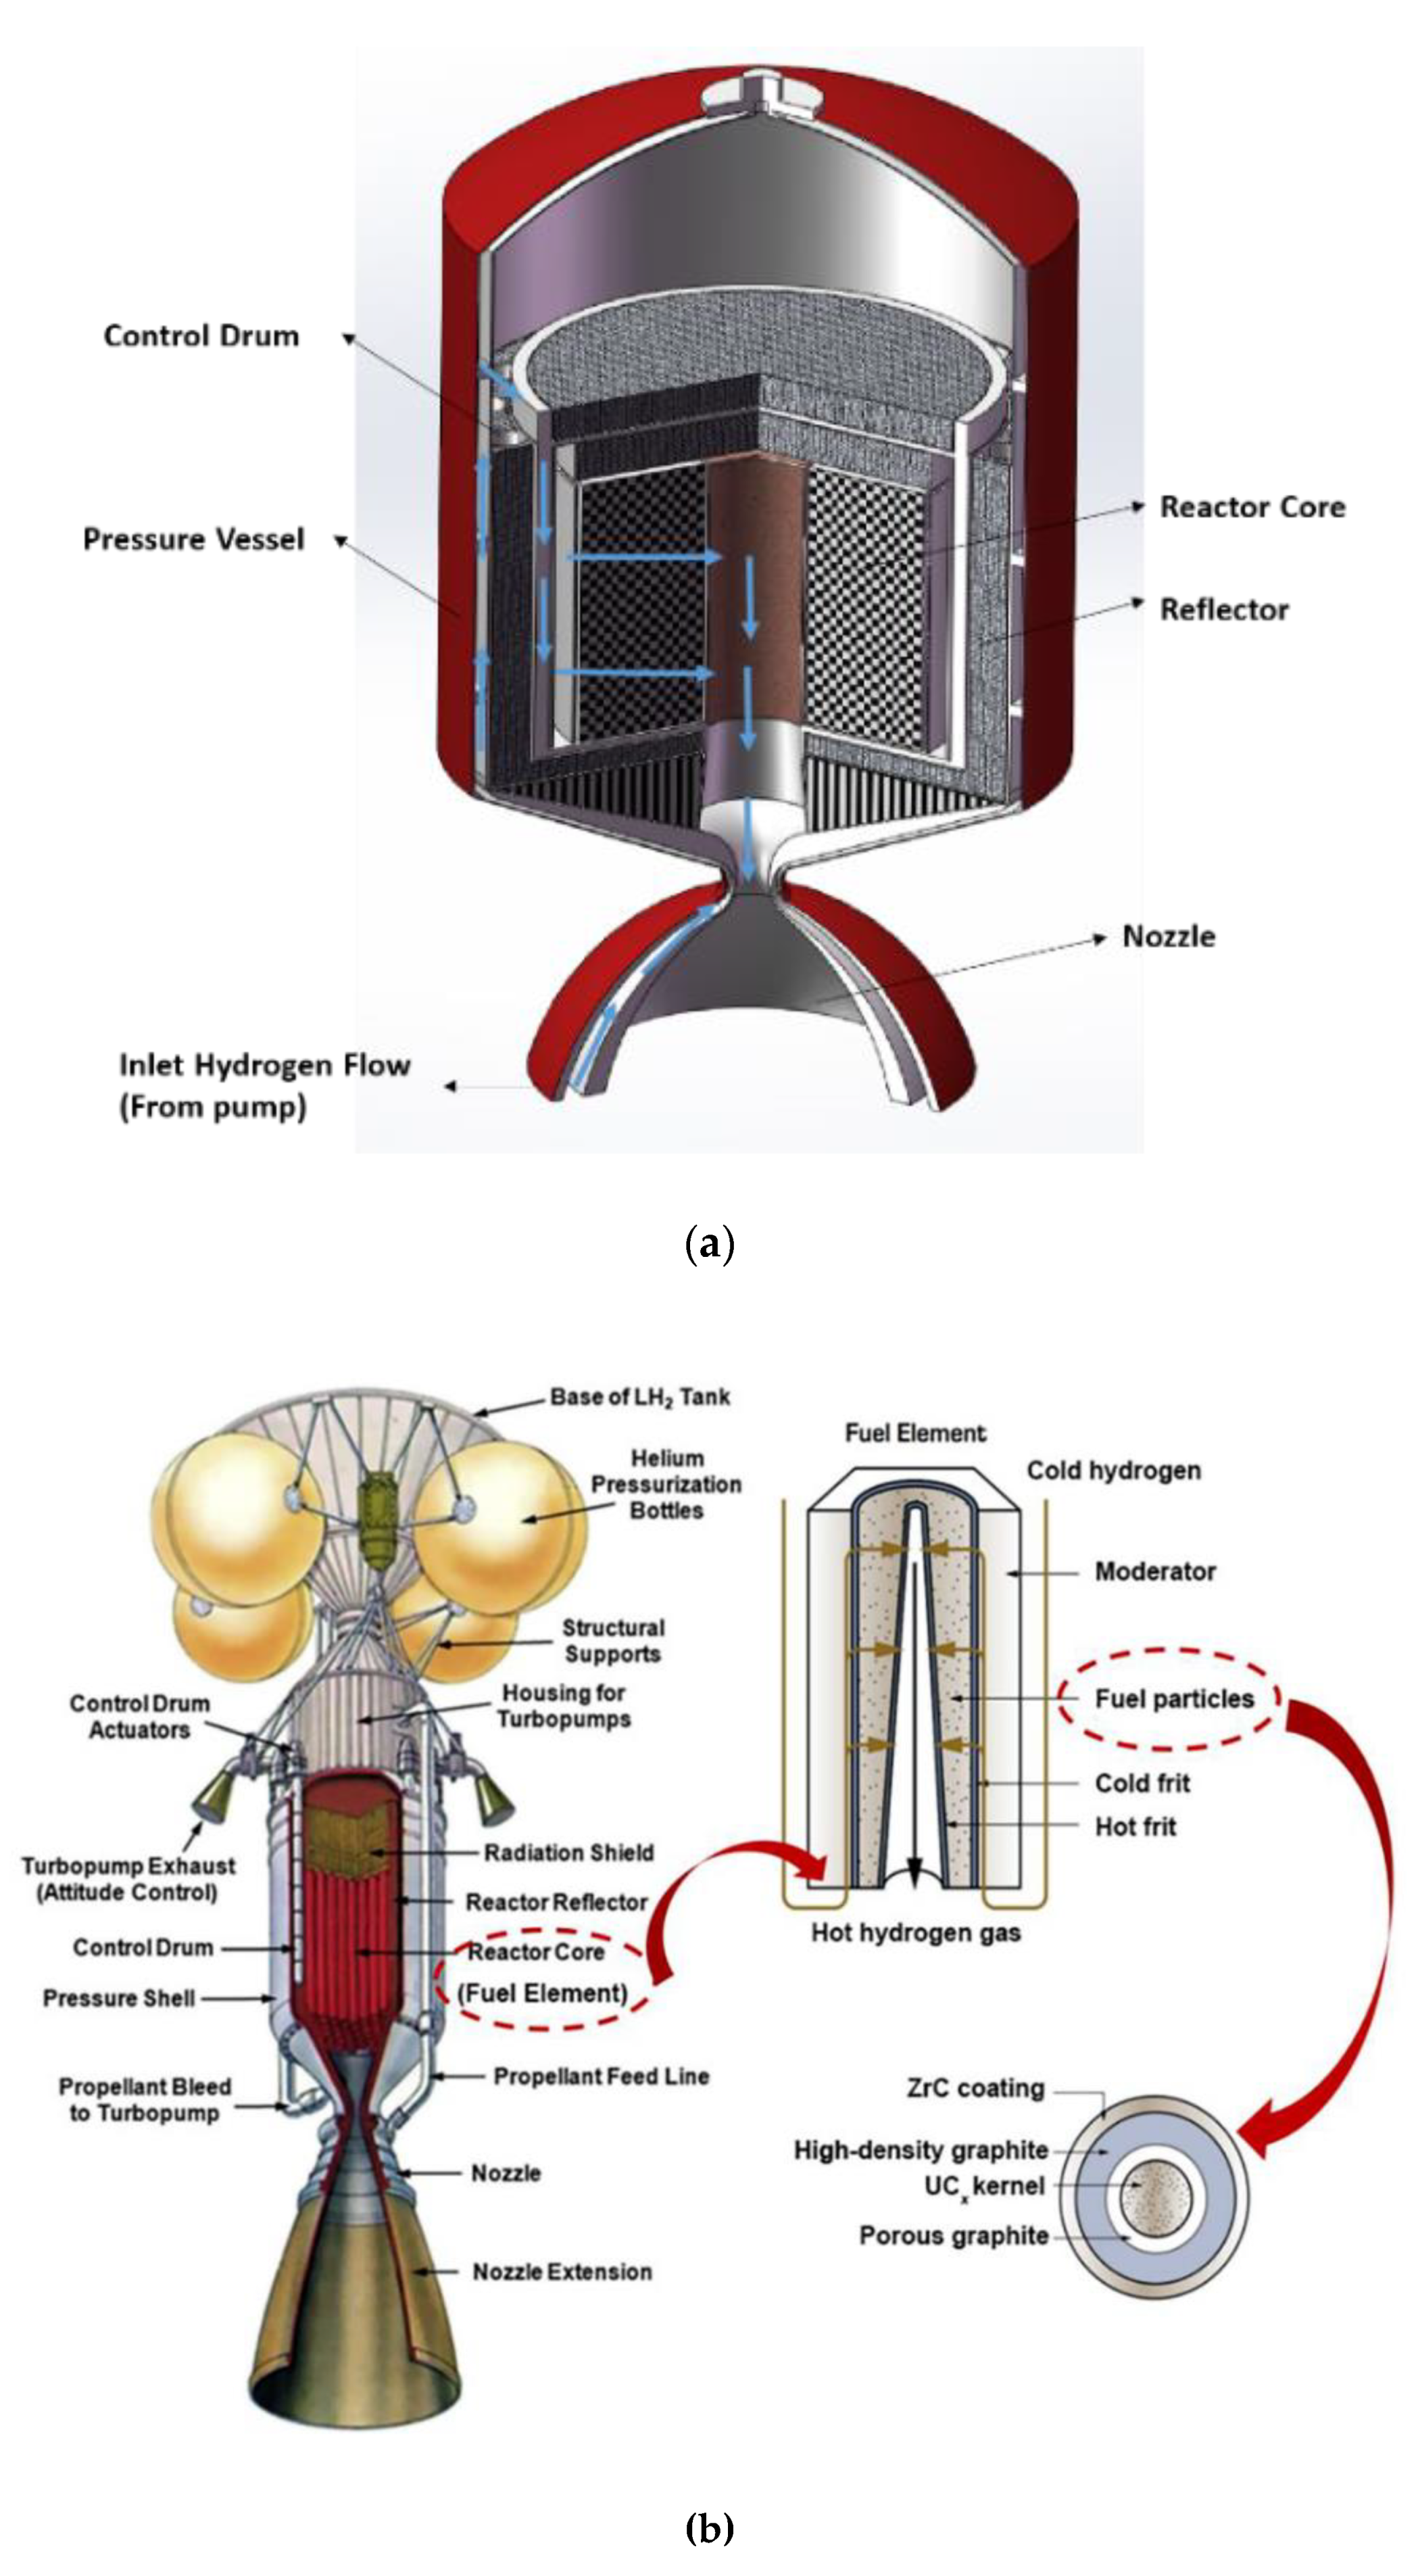
A typical PBR mainly consists of a reactor core, a shield, a control system, a liquid hydrogen (LH2) tank, a turbo-pump, and a nozzle, and it can be divided into two types according to the core layout, i.e., individual PBR (Figure 2a) and fuel elements-assembled PBR (Figure 2b). In the individual PBR, fuel pebbles (particles) are packed randomly in an annular region between two orifices called cold frit and hot frit, respectively. In the fuel elements-assembled PBR, the size of the fuel particles is reduced to that of a grain of sand and the thickness of the fuel region decreases as well; together with the moderator base, a hexagonal fuel element is formed, and several similar elements are assembled to form the core. When the propulsion system runs, cryogenic hydrogen is extracted from the liquid tank and pumped up to a higher pressure. After that, the pressurized hydrogen is preheated by cooling the regenerative channel of the nozzle, the reactor reflector, the control drums, and other important components. Subsequently, a portion of the preheated hydrogen expands in the turbo to drive the pump and the exhausted hydrogen flows into the reactor core. In the core, the coolant flows radially inward to the particle bed to cool the fuel particles, and then flows axially toward the thrust chamber through a hot gas channel. Finally, the high-temperature coolant is ejected from a convergent–divergent nozzle to generate thrust [15]. The partial flow path of the hydrogen is shown in Figure 2.
The particles increase the interfacial heat transfer area between the fuel and the coolant, which enhances the heat transfer capability in PBR. Thus, the power density of the reactor core is raised to an extremely high level, even more than 40 MW/L in the fuel elements, which requires an excellent thermal hydraulic design to avoid the hot spot. However, the flow distribution of coolant in the core is a challenging issue. In PBR, especially in the fuel elements-assembled PBR, the coolant is reasonably distributed among the fuel elements first, and then the coolant is distributed along the axis to match the heat-release profile in each fuel element. The first part does not present a problem, as the flow distribution occurs in the prism-type reactor and can be directly achieved by using orifices. The second part is more difficult, and there are only a few pieces of research that have reported the relative information.
Morley et al. [16] investigated the flow distribution in a critical pellet (pebble) bed reactor using an in-house code, NUTHAM-S, which is based on a two-dimensional thermal hydraulic model for calculating pressure, flow, and temperature. According to their findings, the hot frit contributed to control the amount of coolant flowing in any particular region of the reactor core, while the cold frit was inefficient in the distribution of flow through the core. Hence, the porosity profile on the hot frit was optimized to make the axial temperature in the region adjacent to the hot frit as uniform as possible. However, in another thermal hydraulic analysis performed by Benenati et al. [17], the conclusion was drawn that the cold frit porosity was an important factor which significantly affected the flow distribution in the core. Moreover, they also found that the hot gas channel diameter majorly affected the convective heat transfer process in the core. Tuddenham [18] developed a code to investigate the flow distribution and the thermal hydraulic characteristics in a fuel element of a packed bed nuclear reactor, where the cold frit was designated to control the coolant flow. They observed some significant axial flow in the fuel region, which led to a great variation in temperature along the hot gas channel. Ludwig et al. [14] presented a detailed introduction of three fuel elements-assembled PBRs, which consisted of 19, 37, and 61 fuel elements, respectively. In their work, the flow distribution in the fuel elements was mainly realized by the cold frit. It was also addressed that an optimized porosity profile on the cold frit was beneficial in terms of a better thermal hydraulic design, which was demonstrated through the work performed by Ji et al. [19], where the non-dominated sorting genetic algorithm with elitisms approach (NSGA-II) was adopted to optimize the porosity profile on the cold frit; the thermal performance was exactly improved after this optimization.
From the literature review above, it is noted that there was no consensus regarding the use of cold frit or hot frit to control coolant flow. In addition, the effects of other factors on the flow distribution have not been discussed yet. Therefore, in this paper, the typical axial pressure profile of a dummy PBR was analyzed, based on which, the flow distribution was studied and several approaches, including decreasing the pressure drop within the hot gas channel, increasing the pressure drop across the cold or hot frits, and changing the flow pattern, were proposed to improve the flow distribution and reduce temperature mal-distribution in the PBR core. Moreover, the pros and cons of using cold frit or hot frit for flow distribution were also analyzed. Following this, a computational model was developed and some numerical examples were applied to verify the analyses.
2. Flow Distribution in the PBR Core
2.1. Flow Shift Phenomenon
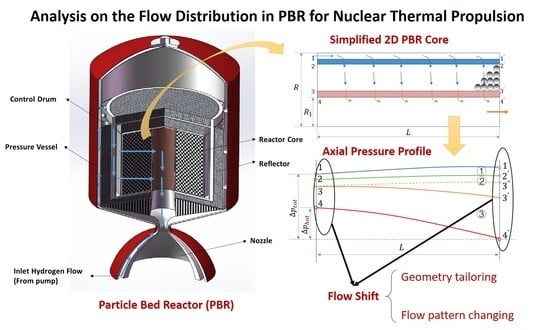
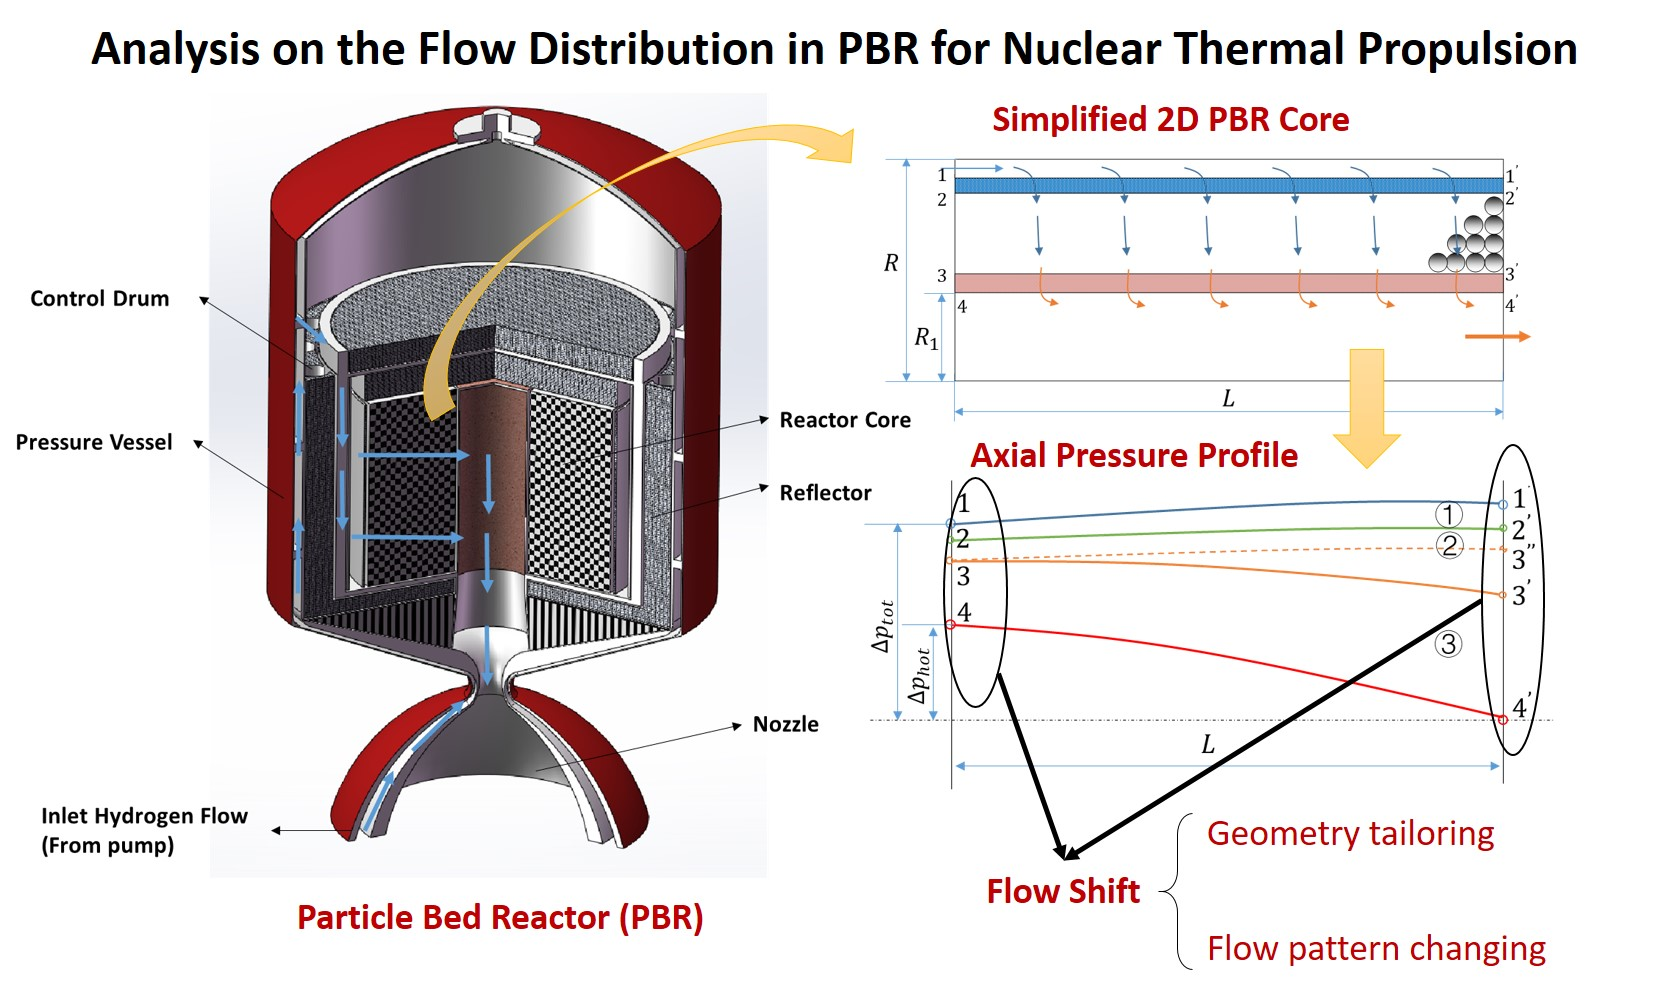
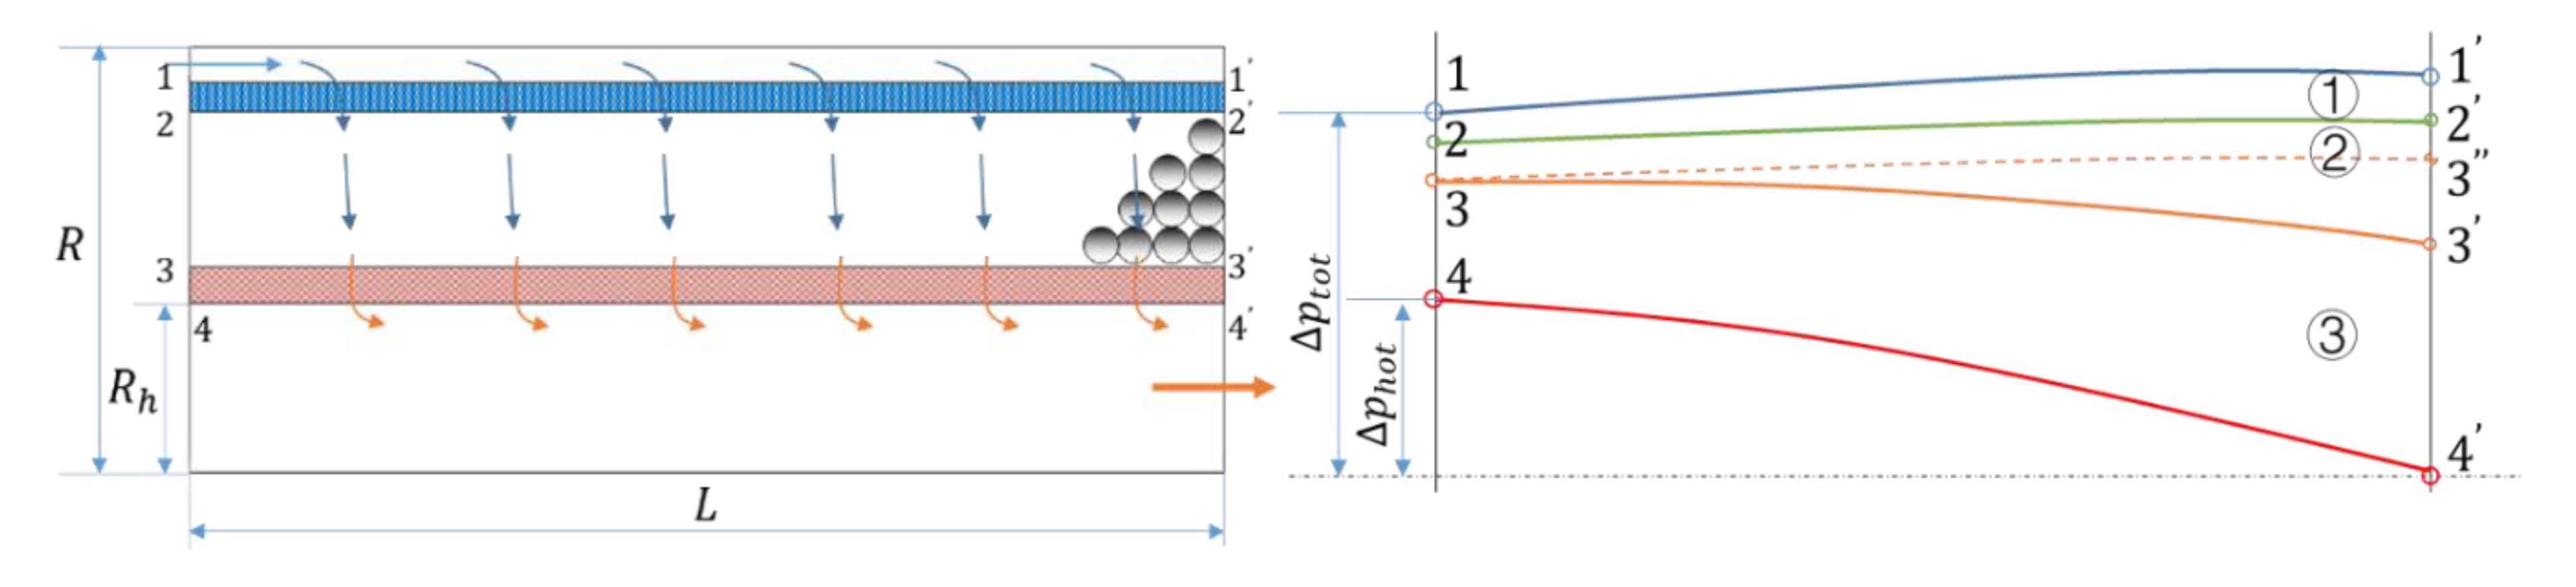
In an effort to avoid the tedious expression, the individual PBR core and the fuel elements in the assembled PBR core are collectively called the PBR core in the following analyses due to their similar geometry. The simplified view of the PBR core, including the inlet plenum, the cold frit, the particle bed, the hot frit, and the hot gas channel, is shown in Figure 3. From the figure, the coolant flows axially into the reactor core through an inlet plenum, and then turns its direction to flow radially across the cold frit, the particle bed, and the hot frit, and finally flows axially again out of the reactor from the hot gas channel. Therefore, reasonable distribution of the coolant along the axial direction in the PBR core is required to ensure efficient heat transfer. For convenience of analysis, a dummy reactor of uniform power, uniform porosity on both cold and hot frits, and uniform porosity in the fuel region was adopted to analyze the flow process; the conclusions could also be applied to a PBR of non-uniform profiles.
As is known to us all, flow is determined by the pressure difference. Hence, a pressure analysis is the base of the flow distribution in PBR. A schematic diagram of a typical axial pressure profile at several important radial locations, including the outer cold frit interface 1-1′, inner cold frit interface 2-2′, outer hot frit interface 3-3′, and inner hot frit interface 4-4′, is depicted in Figure 3. The pressure drop across the cold frit, the particle bed, and the hot frit is represented by ①, ②, and ③, respectively. The ideal pressure profile at the outer hot interface is depicted by 3-3″, which represents an equal pressure drop through the particle bed along the axial direction and a uniform flow distribution within the particle bed. However, the pressure decreases a lot within the hot gas channel (4-4′) due to frictional resistance to high speed flow and acceleration [16], while increases slightly (1-1′) due to the conversion of dynamic pressure to static pressure in the inlet plenum [20]. Thus, the pressure difference on the left side of the PBR is less than that on the right side. The mal-distribution of the pressure leads to more coolant always flowing toward the right side, which is called the “flow shift” phenomenon. Consequently, the real pressure drop across the fuel bed majorly deviates from the ideal, and the hot spot occurs on the left side of the particle bed due to insufficient cooling there, which negatively affects the thermal hydraulic performance of the PBR.
2.2. Methods to Reduce Flow Shift
There are three methods which use geometry tailoring or flow pattern change to reduce the negative effect of flow shift on the thermal hydraulic characteristics. Detailed information regarding these methods is discussed below.
2.2.1. Decreasing the Pressure Drop within the Hot Gas Channel
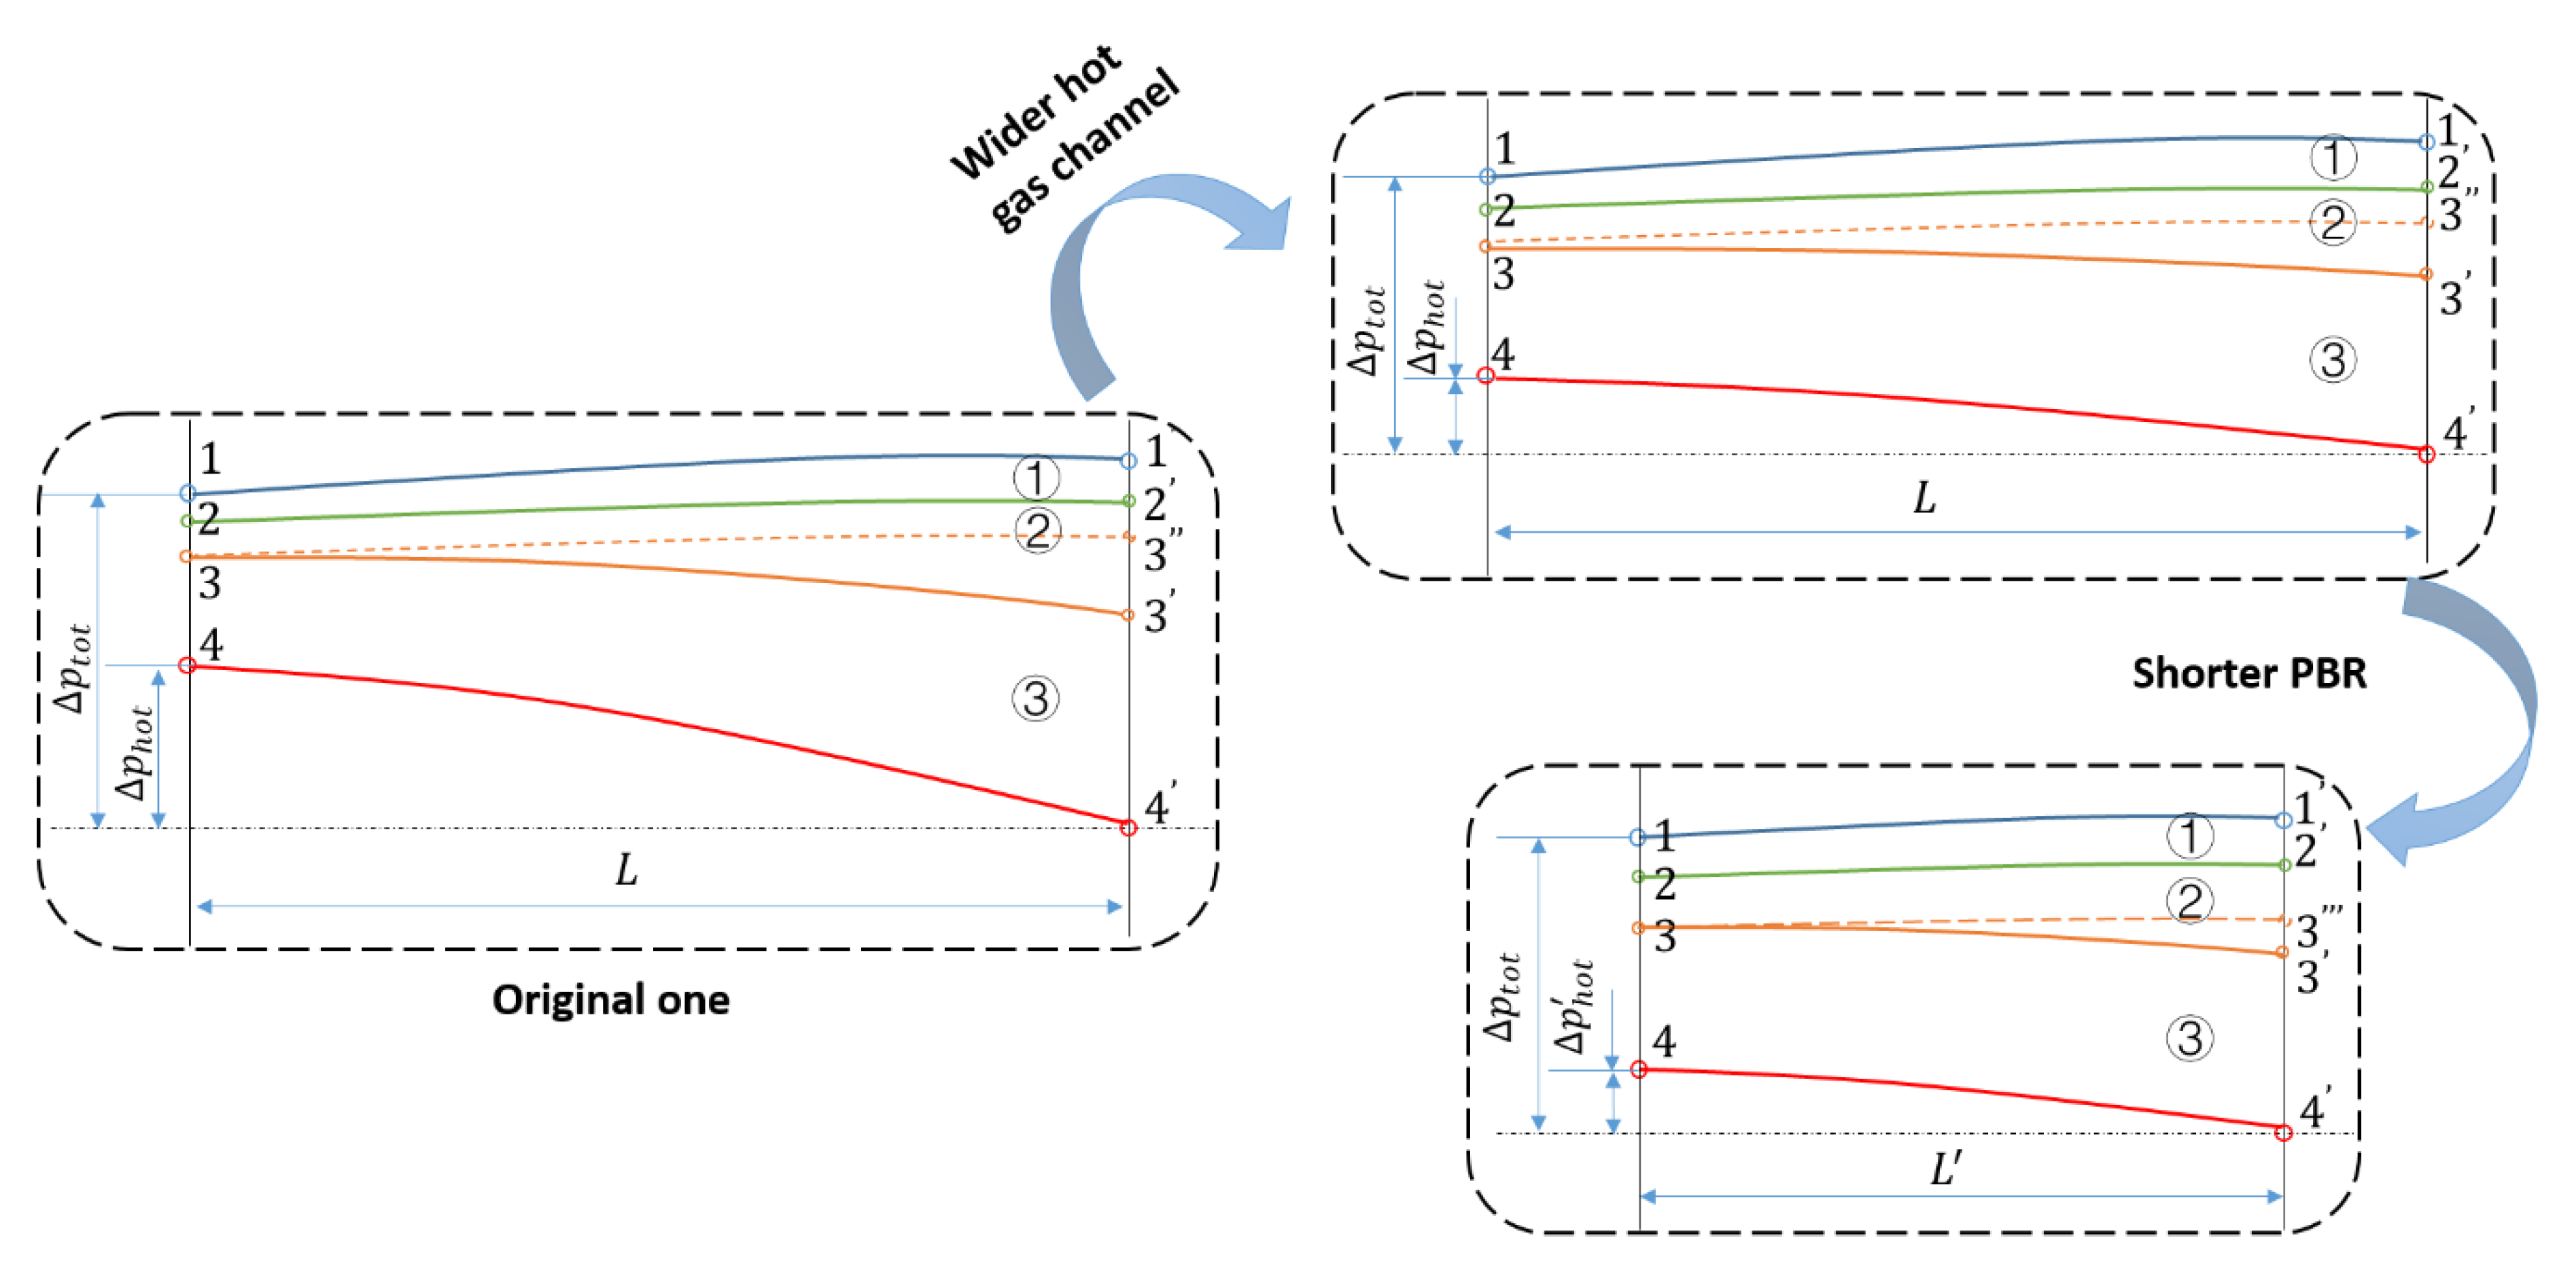
According to the previous introduction, flow shift is mainly caused by significant pressure variation within the hot gas channel, thus, the most direct approach is to decrease the pressure drop there. This can be achieved by increasing the diameter of the hot gas channel to decelerate the hydrogen flow, which was also addressed in the work by Benenati et al. [17]. This way, the pressure drop shows a smaller difference between the left side (p4 − p1) and the right side (p4′ − p1′), and the real pressure profile (3-3′) is closer to the ideal one (3-3″) when compared to the original one. The pressure drop in the hot gas channel can be further decreased to by reducing the length of the reactor core, e.g., from L to L′. In this case, the difference in pressure drop between the left side and the right side reduces further and the pressure profile (3-3′) approaches the ideal pressure profile (3-3‴) much more, which contributes to the uniform flow distribution and even temperature fields in the reactor. These changes are all shown in Figure 4. However, increasing the diameter of the hot gas channel or decreasing the length of the PBR leads to increased size and weight, meaning the system is more expensive and difficult to control. The size of rockets in particular may limit the effects of this approach in some cases.
2.2.2. Increasing the Pressure Drop across the Cold or Hot Frits
As introduced previously, increasing the diameter of the hot gas channel or decreasing the length of the reactor are beneficial in the reduction of flow shift, but this method is usually limited by other physical requirements. Increasing the pressure drop across the cold or hot frits is another indirect approach and is not limited by these requirements significantly. This can be easily implemented by tailoring the pore size or porosity, and is effective in PBR design. Through this approach, the percentage of the pressure drop within the hot gas channel accounting for the total pressure drop reduces, and the relative discrepancy between the pressure drop on the left side and the right side reduces as well. The PBR of increased pressure drop across a hot frit is called a hot frit-dominated design, while the PBR of increased pressure drop across a cold frit is called a cold frit-dominated design. The choice of a hot frit-dominated design or a cold frit-dominated design is a controversial issue, as illustrated in Section 1, and should be analyzed in detail. In this work, the discussion is carried out from the viewpoint of power density levels in PBR core.
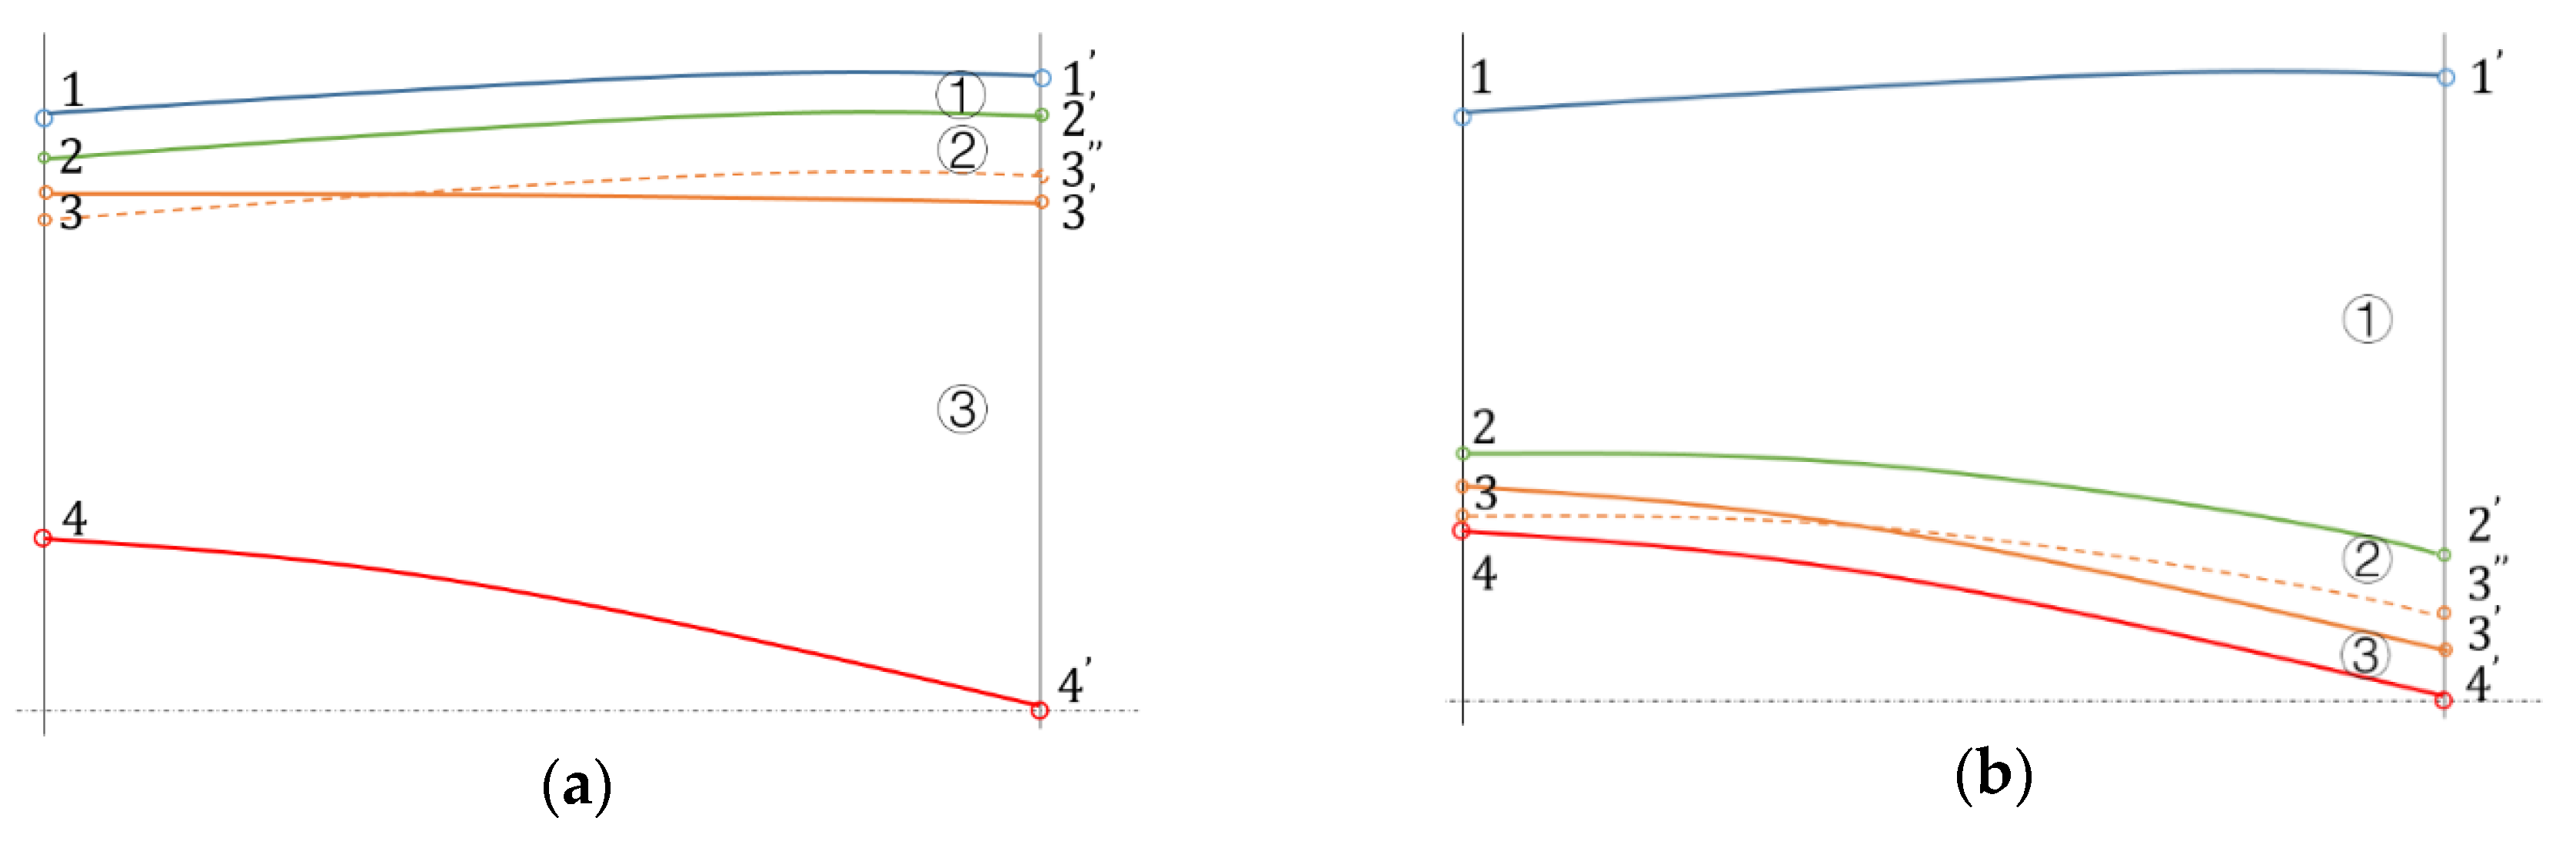
For a PBR of low power density, the fuel particles are usually of large size. Here, a cold frit-dominated design and a hot frit-dominated design are both feasible to distribute the coolant more uniformly within the reactor core. Specifically, if the design is cold frit-dominated, the flow is distributed directly before the cold frit, but some flow redistribution occurs in the fuel region due to the large particle size; even axial flow cannot introduce much additional pressure drop in this case. The flow redistribution may cause a slightly negative effect on the thermal performance of the core [18]. If the design is hot frit-dominated, the coolant flow still adjusts itself before the hot frit, which positively affects the thermal performance of the PBR. Figure 5 shows a schematic diagram of the pressure profile along the axial direction at several radial positions for a hot frit-dominated design and a cold frit-dominated design under such conditions. For both designs, the real pressure profile on the inner hot frit interface (3-3′) approaches the ideal (3-3″), which is marked as a dashed line in the figure.
For a PBR of high power density, small fuel particles (~500 μm) are required to increase the interfacial area and ensure efficient heat transfer from fuel to the coolant. Hence, the pore size of the cold and hot frits must be reduced as well. Under this condition, if cold frit-dominated is the selected method, flow redistribution will be restricted in the fuel region, otherwise a large additional pressure drop is introduced into the core. However, if a hot-dominated design is adopted, a severe hot spot occurs, which can be explained by the Ergun equation [21]:
where dp is the pore size, ε is the porosity on the frits, μ is the viscosity, ρ is the density, and u is the superficial velocity of the fluid. The first term on the right hand in Equation (1) is the viscous effect, while the second term is the inertia effect. If the pore size on the hot frit is reduced to ~100 μm and the hydrogen is raised to 2800 K, the pressure drop due to viscous effect is much more important than the inertia effect, thus, the flow is viscous-dominated. In this case, less coolant flows toward the hot region due to the increased viscosity of the hydrogen gas with increasing temperature, which is a flow instability phenomenon. This flow instability leads to a severe hot spot and damages the PBR core.
2.2.3. Changing Flow Pattern
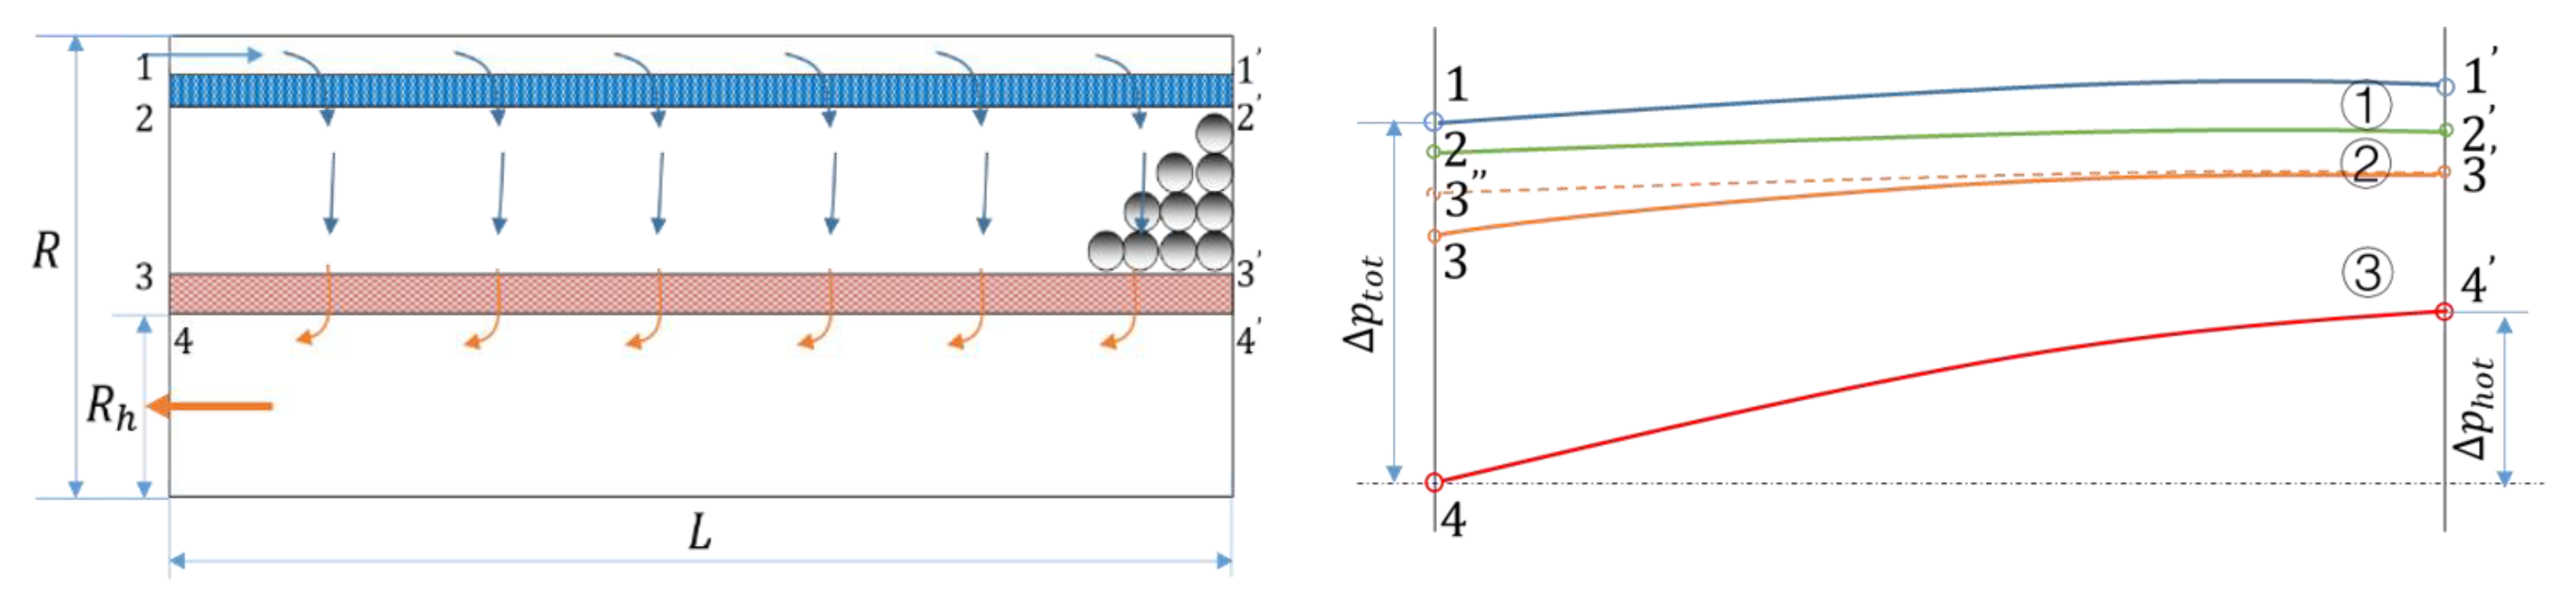
In addition to geometry tailoring, flow shift can be also reduced by changing the flow pattern. In the previous introduction, the inlet and the outlet were set on different sides, and coolant flowed co-currently in the inlet plenum and the hot gas channel. In this section, the flow pattern involves the inlet and outlet set on the same side. The coolant flows counter-currently in the inlet plenum and the hot gas channel. The former is called the “Z” flow pattern, while the latter is called the “U” flow pattern. Figure 6 shows a schematic diagram of the pressure profile along the axial direction at several radial positions in under “U” flow pattern conditions. In the figure, the difference between the pressure drop on the left side and that on the right side decreases compared to the “Z” flow pattern, which was shown in the Figure 3. Therefore, the mal-distribution of the coolant is reduced, and the peak temperature moves to the right side of the PBR core. However, the effect of this approach on flow shift reduction is limited to the slight pressure variation in the inlet plenum. For a design of a significant pressure increase in the inlet plenum, changing the flow pattern from “Z” to “U” may be more effective.
3. Numerical Demonstrations
3.1. Numerical Approach
To verify the analyses in the previous section, some numerical examples based on the computational fluid dynamics (CFD) are presented in this section. The investigated domain consisted of an inlet plenum, a cold frit, a particle bed, a hot frit, and a hot gas channel, similar to the simplified view of a PBR as shown in Figure 3. The wall connecting the inlet plenum and radial reflector was set as adiabatic. The cold frit, the particle bed, and the hot frit were regarded as porous media. The flow within the inlet plenum and hot gas channel were both turbulent flows. Generally, the thermal hydraulic characteristics in PBR were investigated by solving the compressible steady Navier–Stokes equation numerically, and the averaged governing equations for conservation of mass and momentum were written as [22]:
where S is the source term of momentum equation and should be considered carefully for the porous media flow, U is the mean superficial velocity of the fluid, and μeff is effective viscosity, which is determined by the realizable k-ε model for the flow in the inlet plenum and the hot gas channel, while remaining equal to the molecular viscosity due to turbulence suppression in the particle bed and the cold and hot frits, according to the porous media model. In addition, the non-equilibrium thermal model was adopted to evaluate the heat transfer in the particle bed, and the energy equations for the fluid and solid matrixes were expressed as [23]:
where Hf is the enthalpy of the fluid, α is the porosity of the particle bed equaling to 0.38, λf is the thermal conductivity of the fluid, λs is the thermal conductivity of the solid, Tf is the temperature of fluid, Ts is the temperature of solid, Q is the power density in the fuel region, hsf is the heat transfer coefficient between coolant and solid, and Asf is the interfacial area density. Asf was determined by:
where dp is the diameter of fuel particle. According to the Safety Standard of the Nuclear Safety Standard Commission (KTA) 3102 “Reactor Core Design for High-Temperature Gas-Cooled Reactors”, the source term S for the momentum equation was calculated as [24]:
where is the mass flow rate, A is flow area, and f is the coefficient evaluating pressure loss in the particle bed,
and Re/(1 − α) is the equivalent Reynolds number. Similarly, the heat transfer coefficient was determined by the following relationships [25]:
For the porous media flow across the cold and hot frit, the pressure loss was determined by the Ergun model instead, as Equation (1) shows.
To describe the variation of the thermo-physical and transport properties of the coolant, the real gas Peng–Robinson equation was applied to relate the pressure, the specific volume, and the temperature of hydrogen, through which the density could be directly determined [26]. By combining the thermodynamic differential relationships and properties of ideal hydrogen, the specific heat capacity of real gas hydrogen could also be calculated [27]. The molecular viscosity and the thermal conductivity could be both determined by semi-empirical correlations, which included the dilute gas contribution and the excess contribution, due to the effects of two-body interactions and many-body collisions of molecules [28,29].
All numerical simulations were performed using ANSYS FLUENT v19.2. Due to the simplified 2D geometry, the grid systems of quadrilateral cells were constructed easily using the computational domain. These cells were all orthogonal without skewness. In the simulation, the SIMPLEC algorithm was employed for pressure–velocity coupling. The second order upwind scheme was used to discretize the governing equations of continuity, momentum, and energy, while the first order upwind scheme was used for discretization of governing equations with regard to turbulence. Furthermore, the calculation was considered to be converged only when the two criteria were met simultaneously, i.e., (1) when the residual for solving energy equation was less than 10−8, while the residuals for other solutions were no greater than 10−5, and (2) when the mass-averaged temperature at the outlet, the area-averaged pressure at the inlet, and the maximum temperature within the computational domain were all nearly unchanged with iterations.
3.2. Verification and Validation of the Numerical Approach
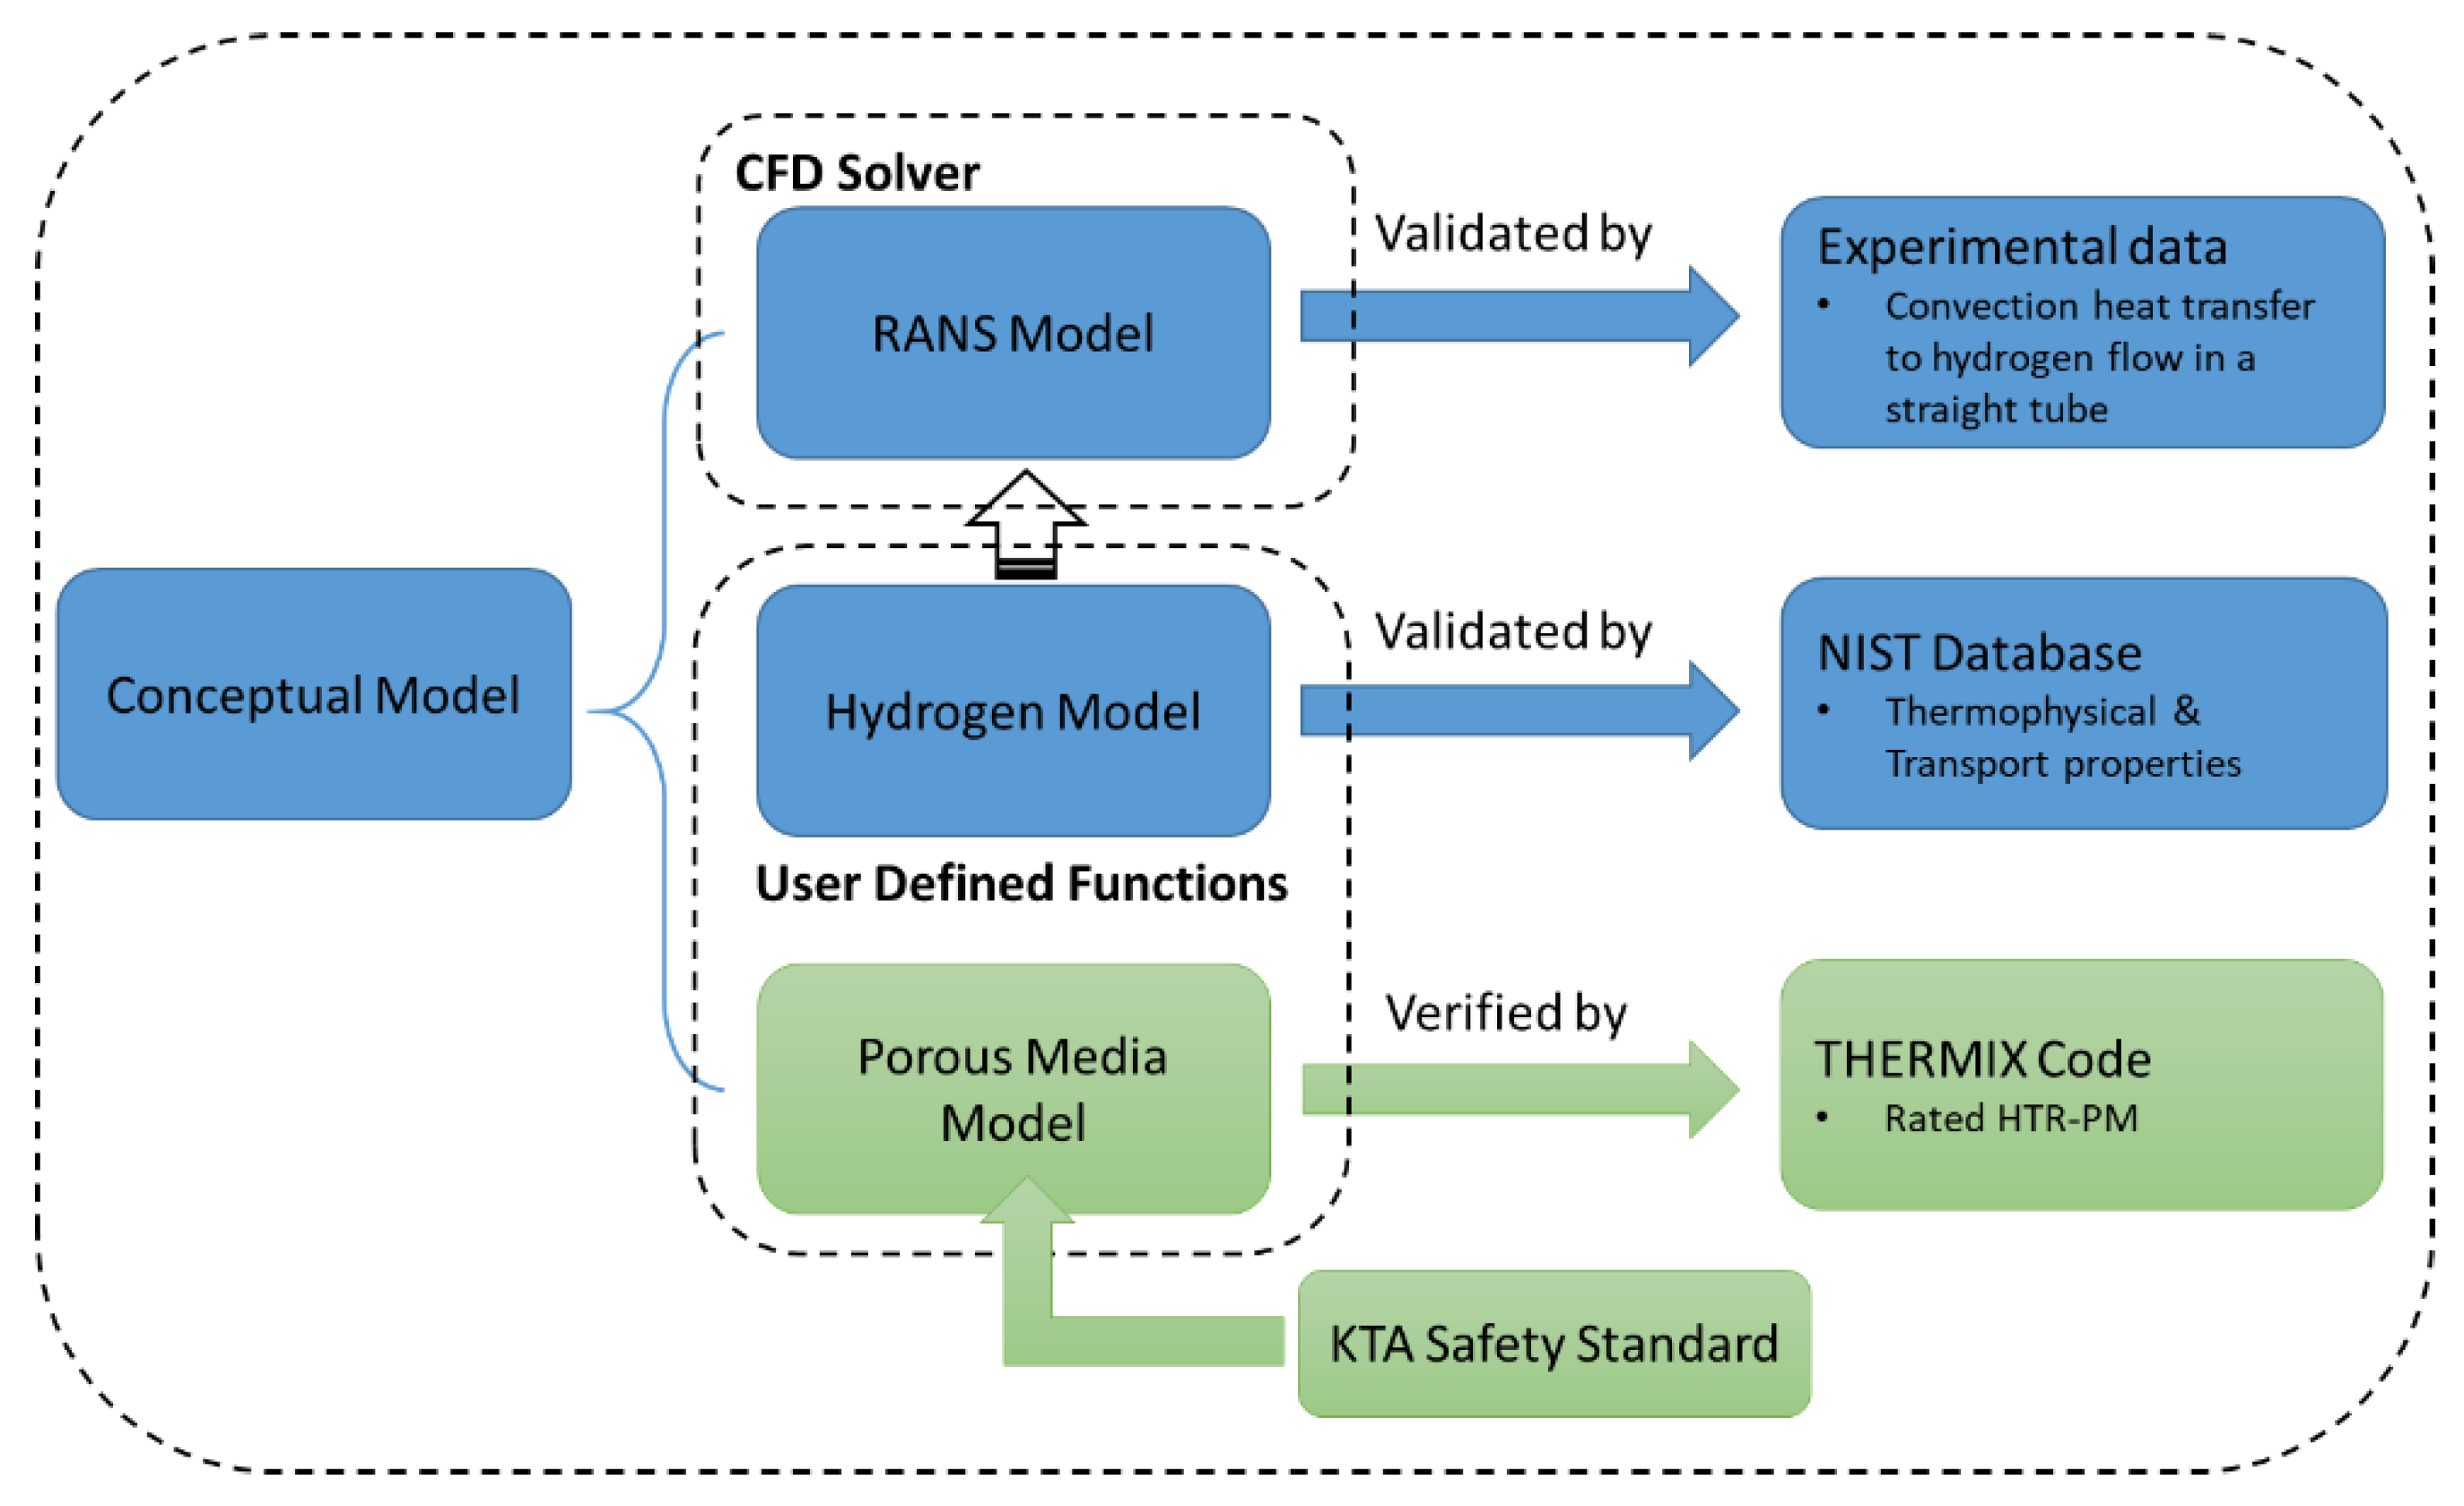
Before the demonstrations, the numerical approach was verified and validated. According to the previous introduction, the conceptual model mainly consisted of three parts, i.e., the Reynolds Averaged Navier-Stokes (RANS) turbulence model, the hydrogen model, and the porous media model. The hydrogen model and the porous media model were embedded into the Computational Fluid Dynamics (CFD) solver through user-defined functions (UDFs). The partial validation of the numerical approach is shown in Figure 7.
Firstly, the hydrogen model was directly validated by the database from National Institute of Standards and Technology (NIST), and it was found that there was only some deviation near the pseudo-critical temperature [30]. In the thermal hydraulic design of PBR, the minimum temperature was not lower than 150 K, hence the hydrogen model was considered feasible. Detailed information regarding this can be found in [15,30].
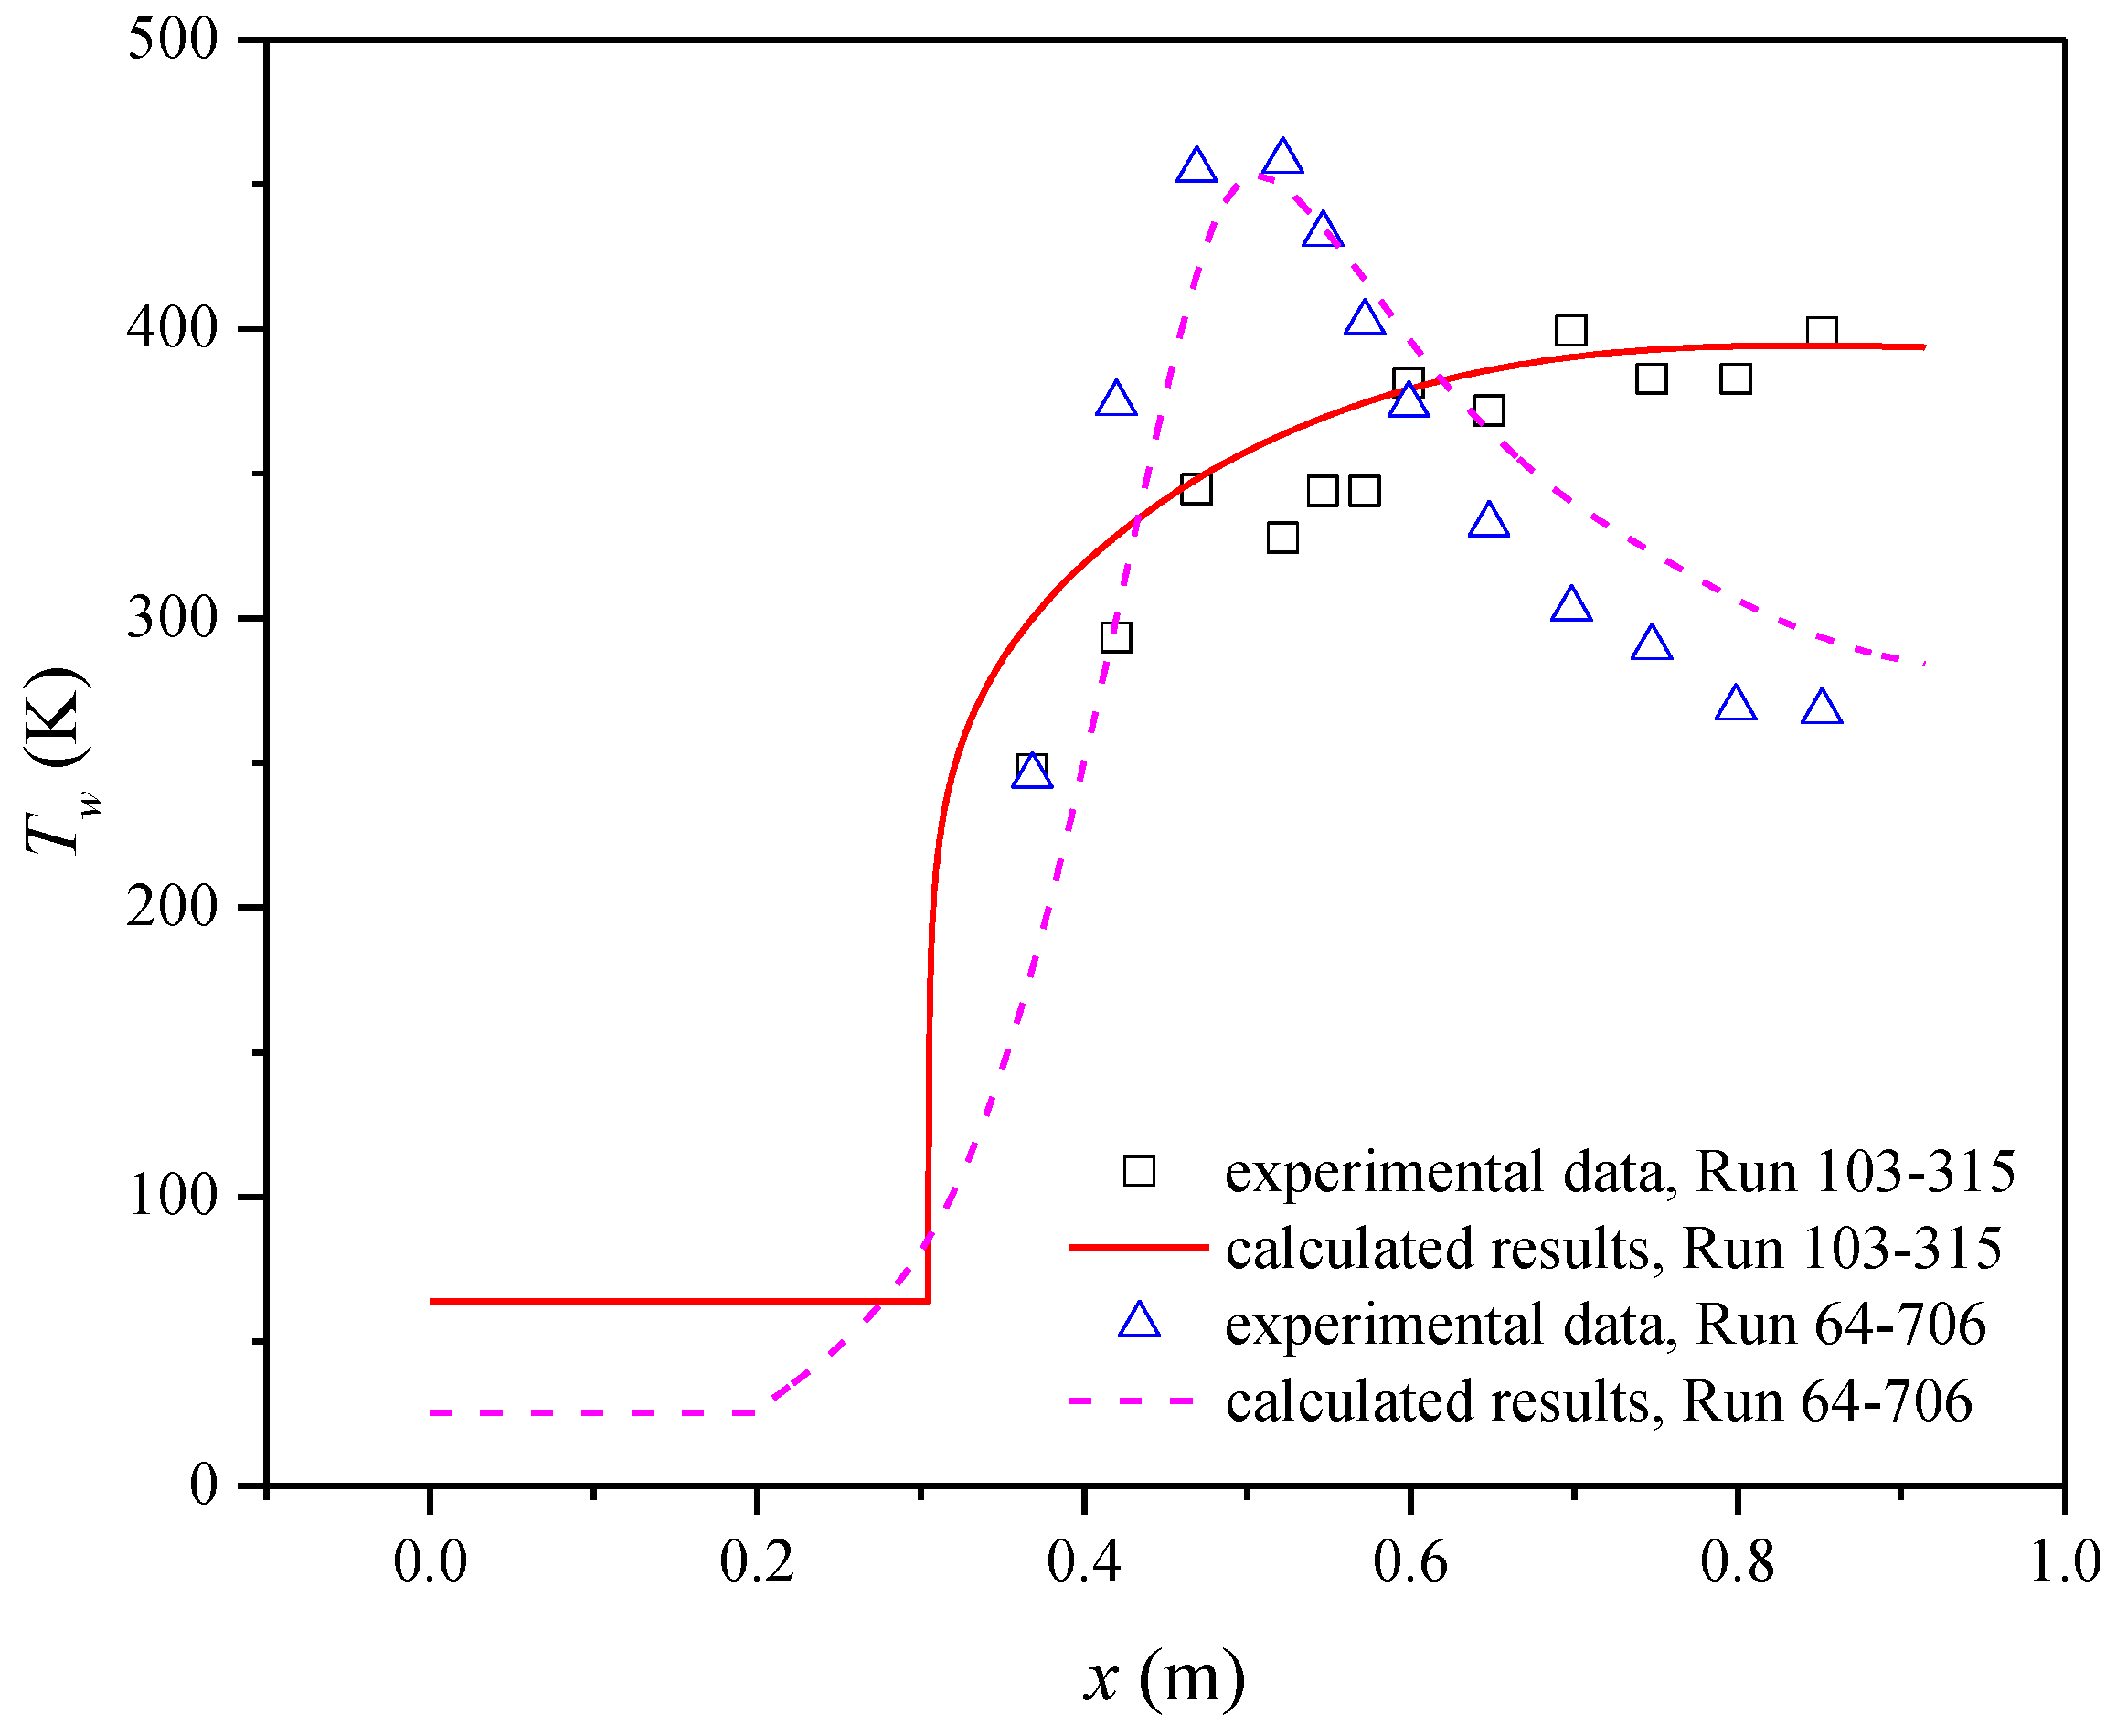
Subsequently, the RANS model, accurately the k-ε model, was validated by the experimental data obtained by Hendricks et al. [31,32]. These experiments investigated the convection heat transfer of hydrogen flow in a straight tube, where various high heat fluxes were imposed on the tube wall and the properties of hydrogen varied violently due to strong heating. In these simulations, the NIST data of hydrogen were used to exclude possible discrepancies resulting from the user-defined hydrogen model. Two typical experimental conditions, i.e., the trans-critical flow Run 64-706 and the fully supercritical flow Run 103-315 were selected for validation. It is known that the most difficult thing in modeling supercritical flow is the simulation of flow near a pseudo-critical temperature through a numerical approach. In both Run 64-706 and Run 103-315, the reduced inlet temperature Tr,in, i.e., Tin/Tc, was less than 2, which means that the hydrogen deviated the ideal gas significantly. Hence, it was aggressively inferred that the numerical model was sufficient to reproduce real flow if the derived results agreed well with the measured data in experiments Run 64-706 and Run 103-315. Figure 8 shows the comparison of the computed wall temperature and experimental data, and it can be seen that the calculated results agreed well with the experimental data regarding both tendency and peak temperature. As for the absolute results, the maximum errors were −27.12% and 21.03% for Run 64-706 and Run 103-315, respectively, corresponding to the first measured point. In the other points, the calculated results agreed to within ±10%, which was fairly good regarding the modeling of the convection heat transfer to supercritical flow. Detailed information regarding this is included in Appendix A.
Regarding the porous media model, no experimental or direct numerical simulation investigations have been performed to study hydrogen flow through the heated particle bed. The most well-accepted models are semi-empirical relations in the KTA Safety Standard [24,25], which are widely used in the design and evaluation of high-temperature gas-cooled reactors. In this work, it was assumed that the KTA standard was still viable, and the major objective was to verify the implementation of these models into the CFD solver. The verification was performed by comparing the results of rated High Temperature gas-cooled Reactor-Pebble Module (HTR-PM) [33] from CFD and THERMIX [34], which was a dedicated code for analyzing the thermal performance of the high-temperature gas-cooled reactor. Comparisons of the predicted results using these two codes are listed in Table 1. Through these strong agreements, the implementation of the porous media model was verified.
3.3. Numerical Examlpes and Discussions
3.3.1. Example A: Effects of the Flow Pattern
A particle bed reactor, which was similar to the concept of the critical reactor proposed at the University of New Mexico’s Institute for Space Nuclear Power Studies (ISNPS), was selected [16]. The reactor was a hydrogen-cooled fast reactor. The fuel particles, which were 6 mm in diameter, were packed randomly in an annular region between the hot frit and the cold frit. The pore sizes of the cold and hot frits were 4 mm. The fuel bed, the cold frit, and the hot frit were all treated as porous media of uniform porosity, and the averaged porosities were 0.38, 0.1, and 0.2 respectively. The main geometrical parameters are listed in Table 2.
The thermal hydraulic characteristics in the reactor core were assumed indifferently along the circumference, thus the computational model was simplified to a two-dimensional axis-symmetric model. The heat deposition was assumed to be uniform in the core and the total thermal power was 1000 MW, thus, the mean power density was 1.938 MW/L. The inlet temperature of hydrogen was 200 K, while the mass flow rate of hydrogen at the inlet boundary was 21 kg/s to ensure the exhaust gas approached 2800 K. The operating pressure for the whole reactor was 8.0 MPa. Before the demonstration, a grid independence check was performed on three grids which consisted of 33,120, 13,2480, and 480,800 cells, respectively. These cells were uniformly spaced along the axial direction and non-uniformly spaced along the radial direction. For the inlet plenum and the hot gas channel in particular, the height of the cell adjacent to the wall or interface needed to be small enough for resolution of the boundary layer. The computed results showed that grid 2, with 132,480 cells, was the best regarding both the accuracy and the computational cost; thus, this grid was selected for the following investigations.
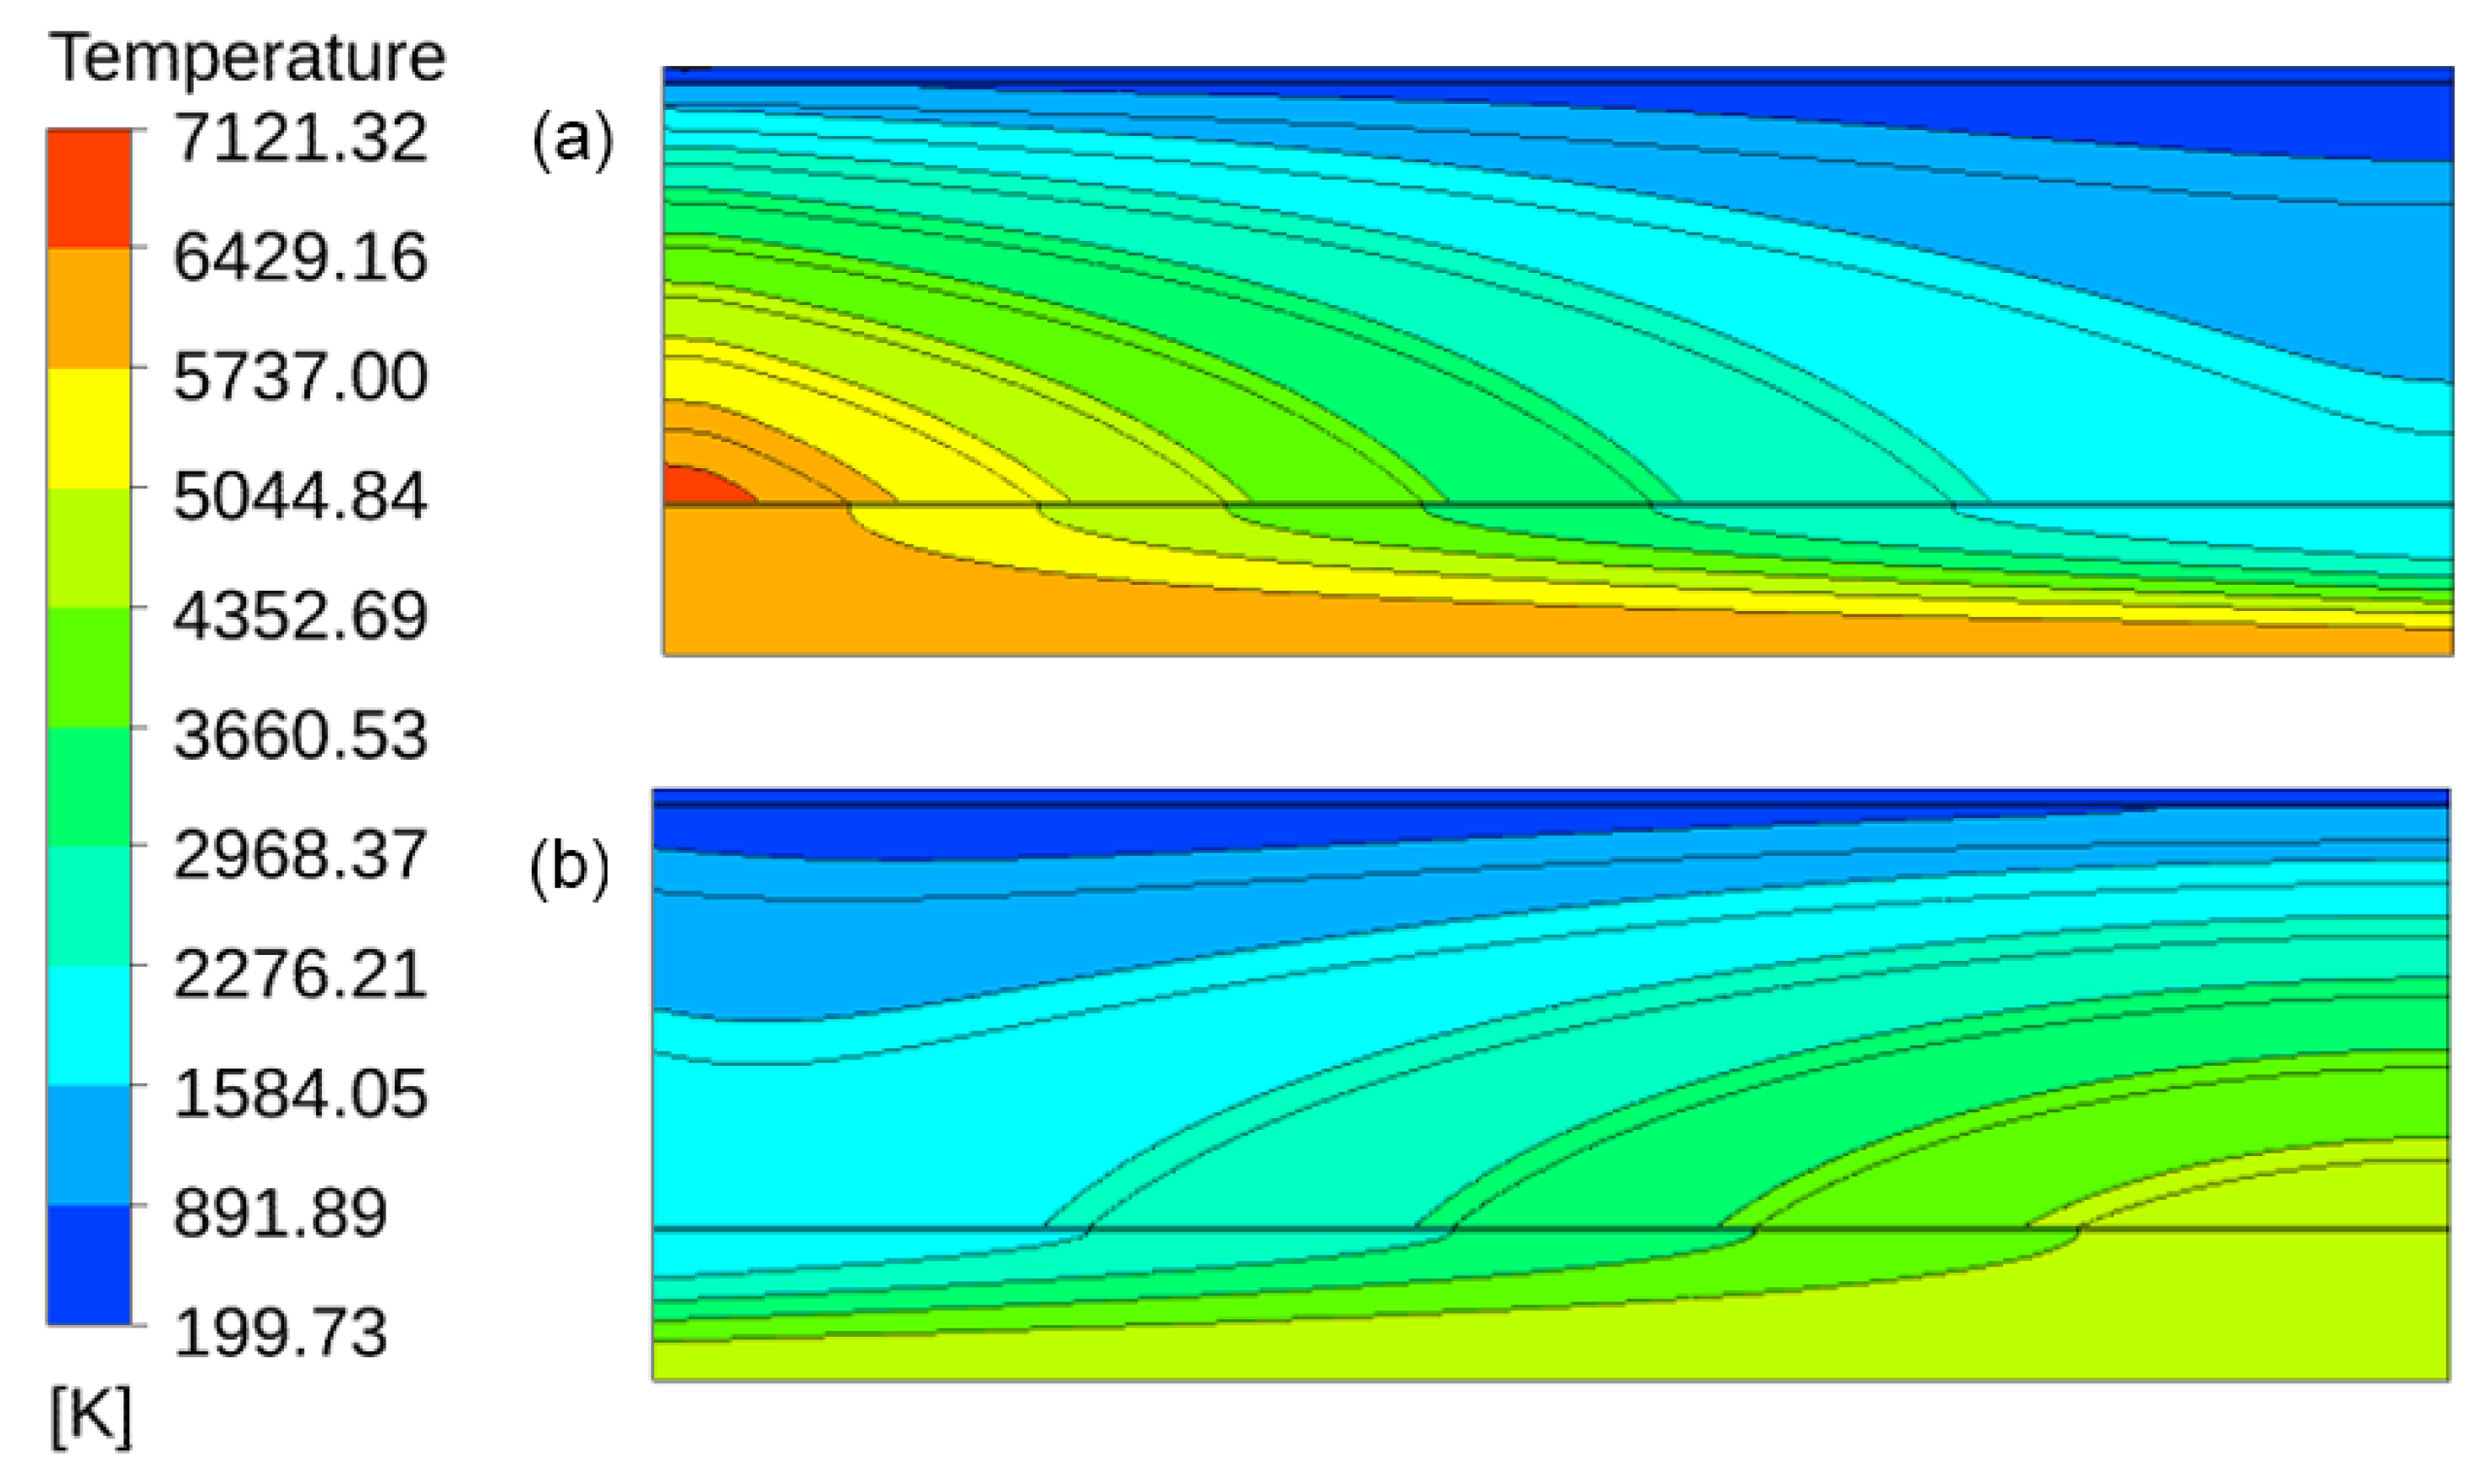
Figure 9 shows the temperature field in the PBR of two different flow patterns, i.e., the “Z” flow pattern and the “U” flow pattern. Form the figure, the maximum temperature within the fuel bed changed from the bottom left corner to the bottom right corner when the flow pattern changed from “Z” to “U”. The maximum temperature also significantly decreased. The temperature field was more uniform as the flow pattern changed. Table 3 lists the total pressure drop in the PBR, the outlet temperature of coolant and the maximum temperature in the fuel bed. The hot spot was found to be reduced without any significant negative effects regarding the pressure drop and the outlet temperature when the flow pattern changed from “Z” to “U”. That is to say, the coolant was distributed more uniformly and the thermal hydraulic performance of the “U” flow pattern was better than that of the “Z” flow pattern, which coincided with the analyses in Section 2.2.3.
3.3.2. Example B: Effects of the Core Height
Using the previous PBR as a baseline, the effects of the core height were investigated by reducing the core height to 100 cm and 80 cm. The remaining geometry parameters and the power density were unchanged. The mass flow rates at the inlet boundary decreased to 17.5 kg/s and 14 kg/s, respectively, to keep the ratio of total power output to the mass flow rate constant. In addition, to characterize the influence of reducing core height on the flow distribution in the fuel bed, parameter β was defined as the ratio of the maximum pressure drop to the minimum pressure drop through the particle bed, i.e.,
This parameter was directly related to the mal-distribution of coolant. The greater the value of the parameter was, the more severe the mal-distribution of coolant was. Table 4 lists the thermal hydraulic characteristics in three PBRs of various core heights. As shown in the table, the pressure drop through the whole PBR reduced as the core height decreased. This was mainly due to the significant reduction of the pressure drop within the hot gas channel, as shown in Figure 10. The table also indicates that β was reduced, meaning the coolant was distributed more uniformly, which decreased the maximum temperature in the fuel bed from 6940.4 K to 4161.2 K when L decreased from 120 cm to 80 cm. Therefore, reducing the core height contributed to the improvement of the thermal hydraulic performance in PBR, which was in accordance with the analyses discussed in Section 2.2.1.
3.3.3. Example C: Effects of Cold and Hot Frit Resistance
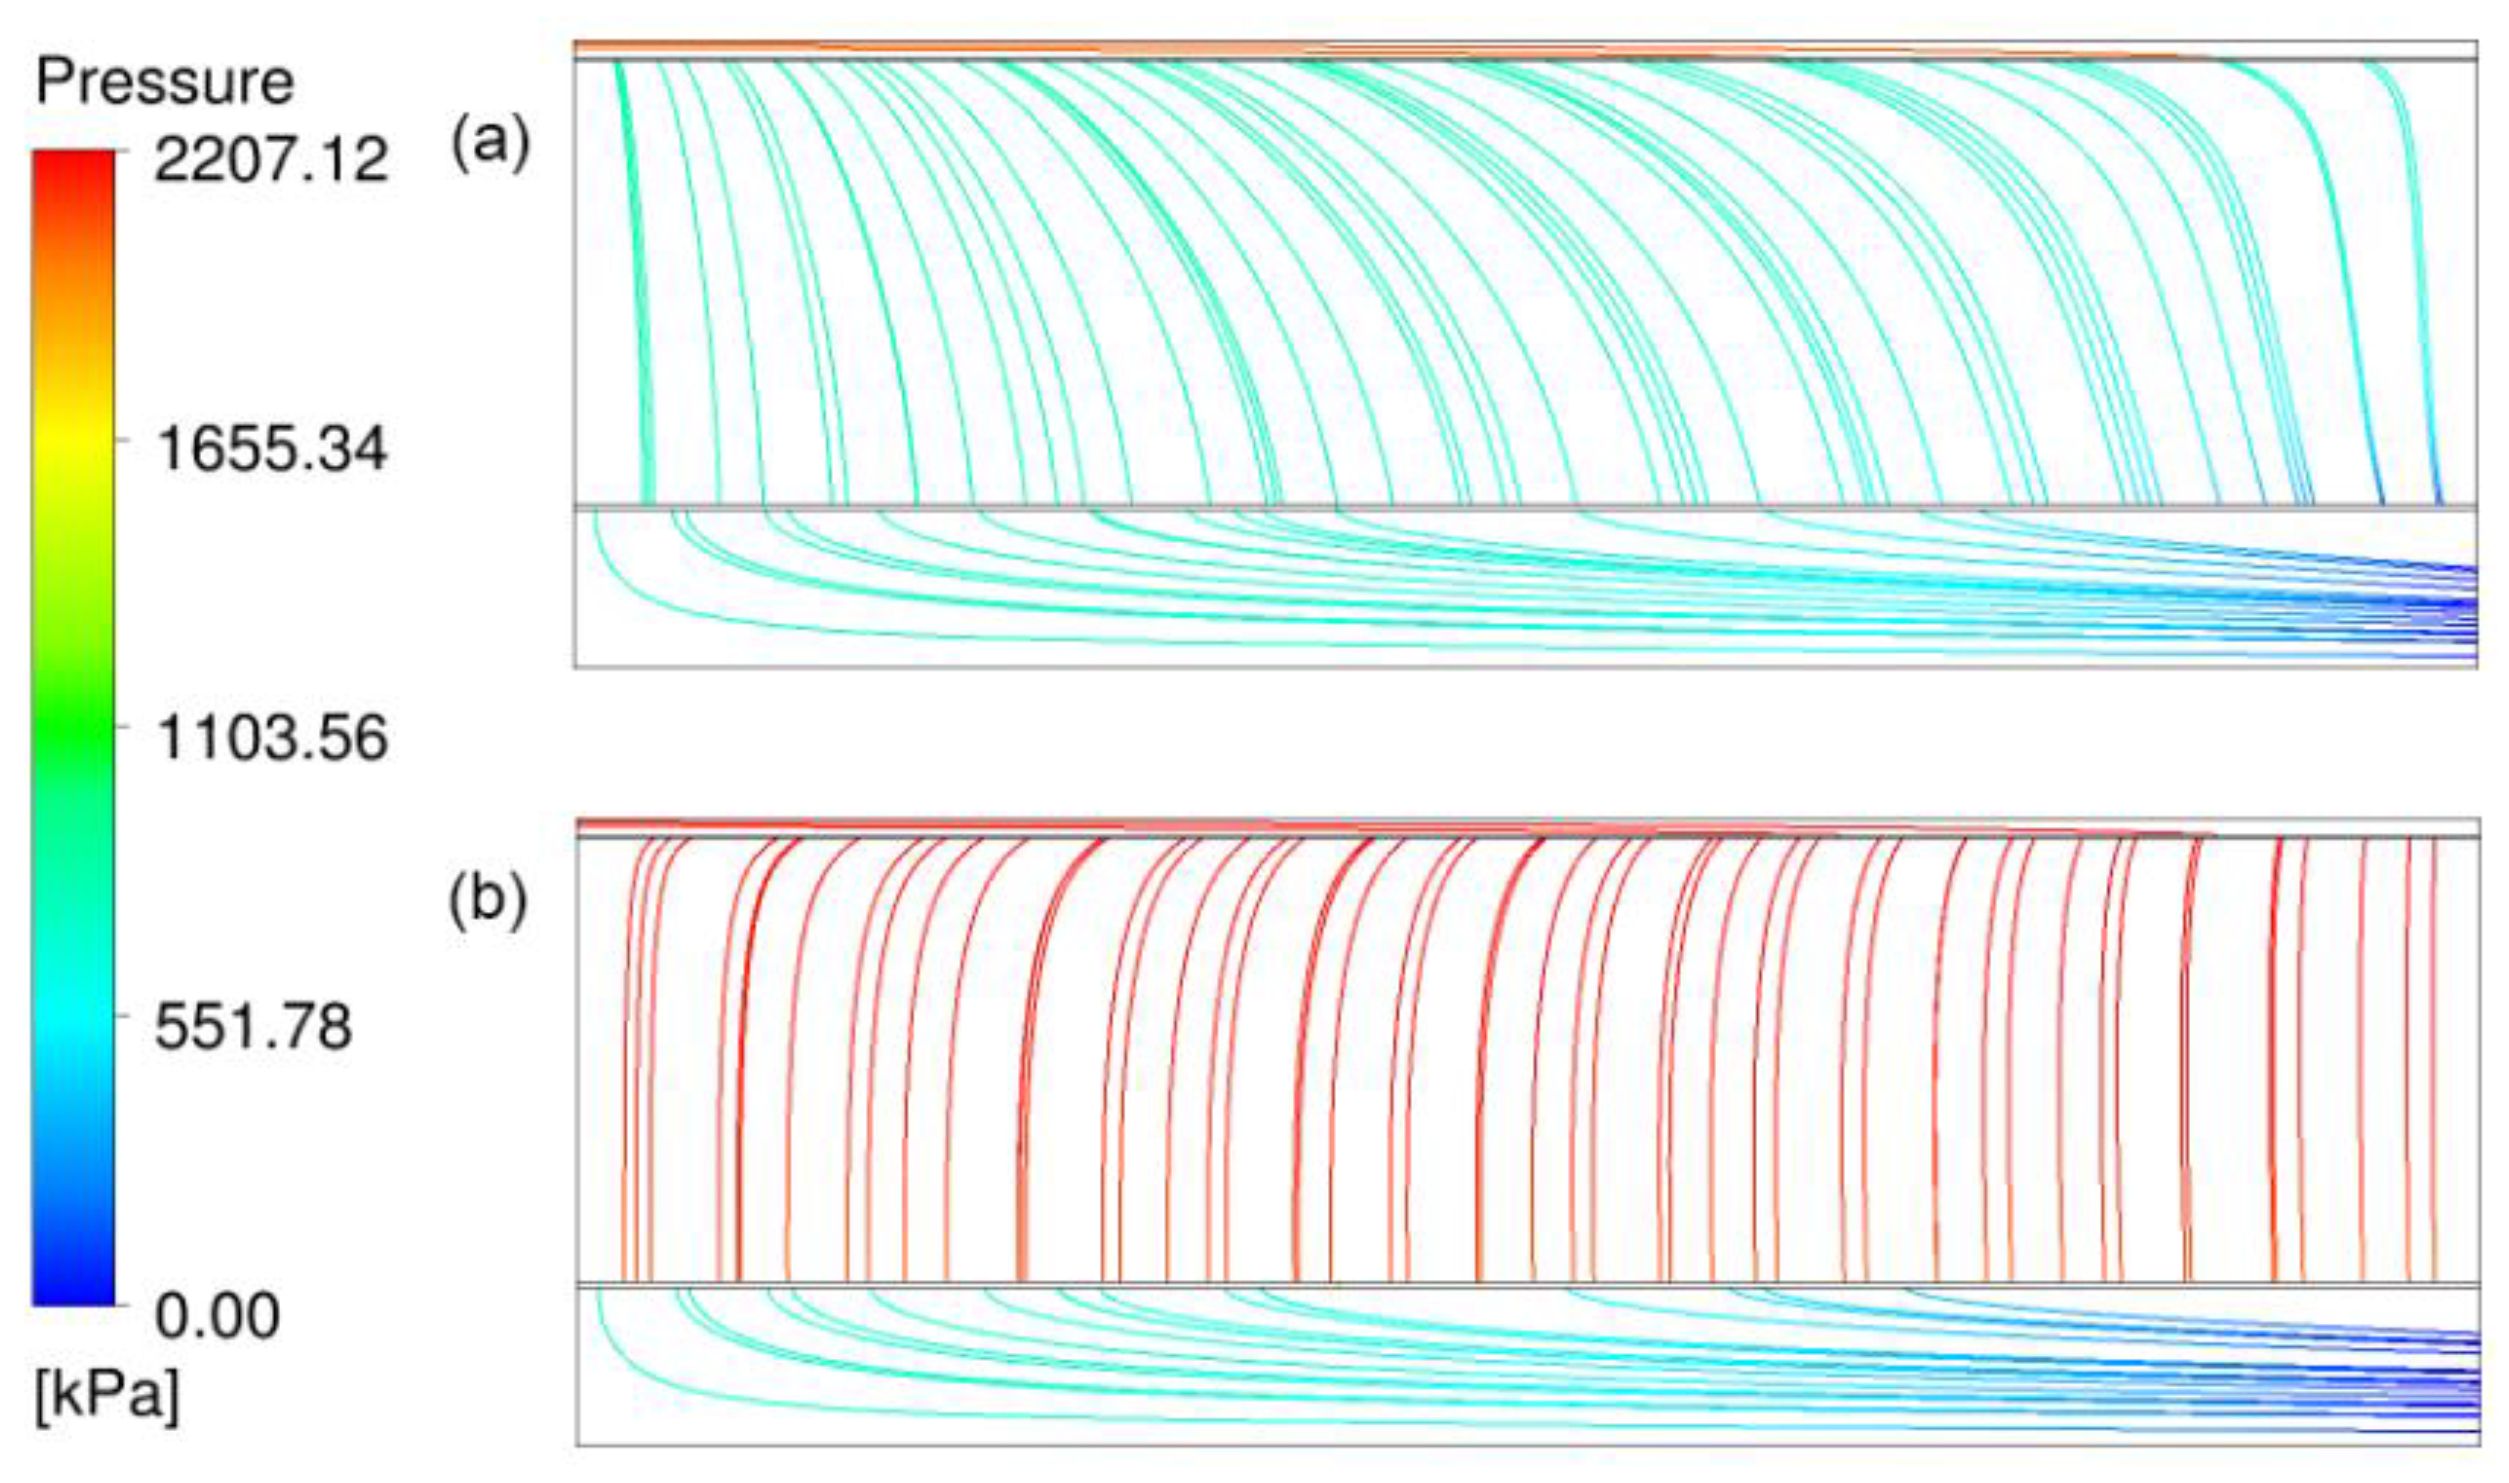
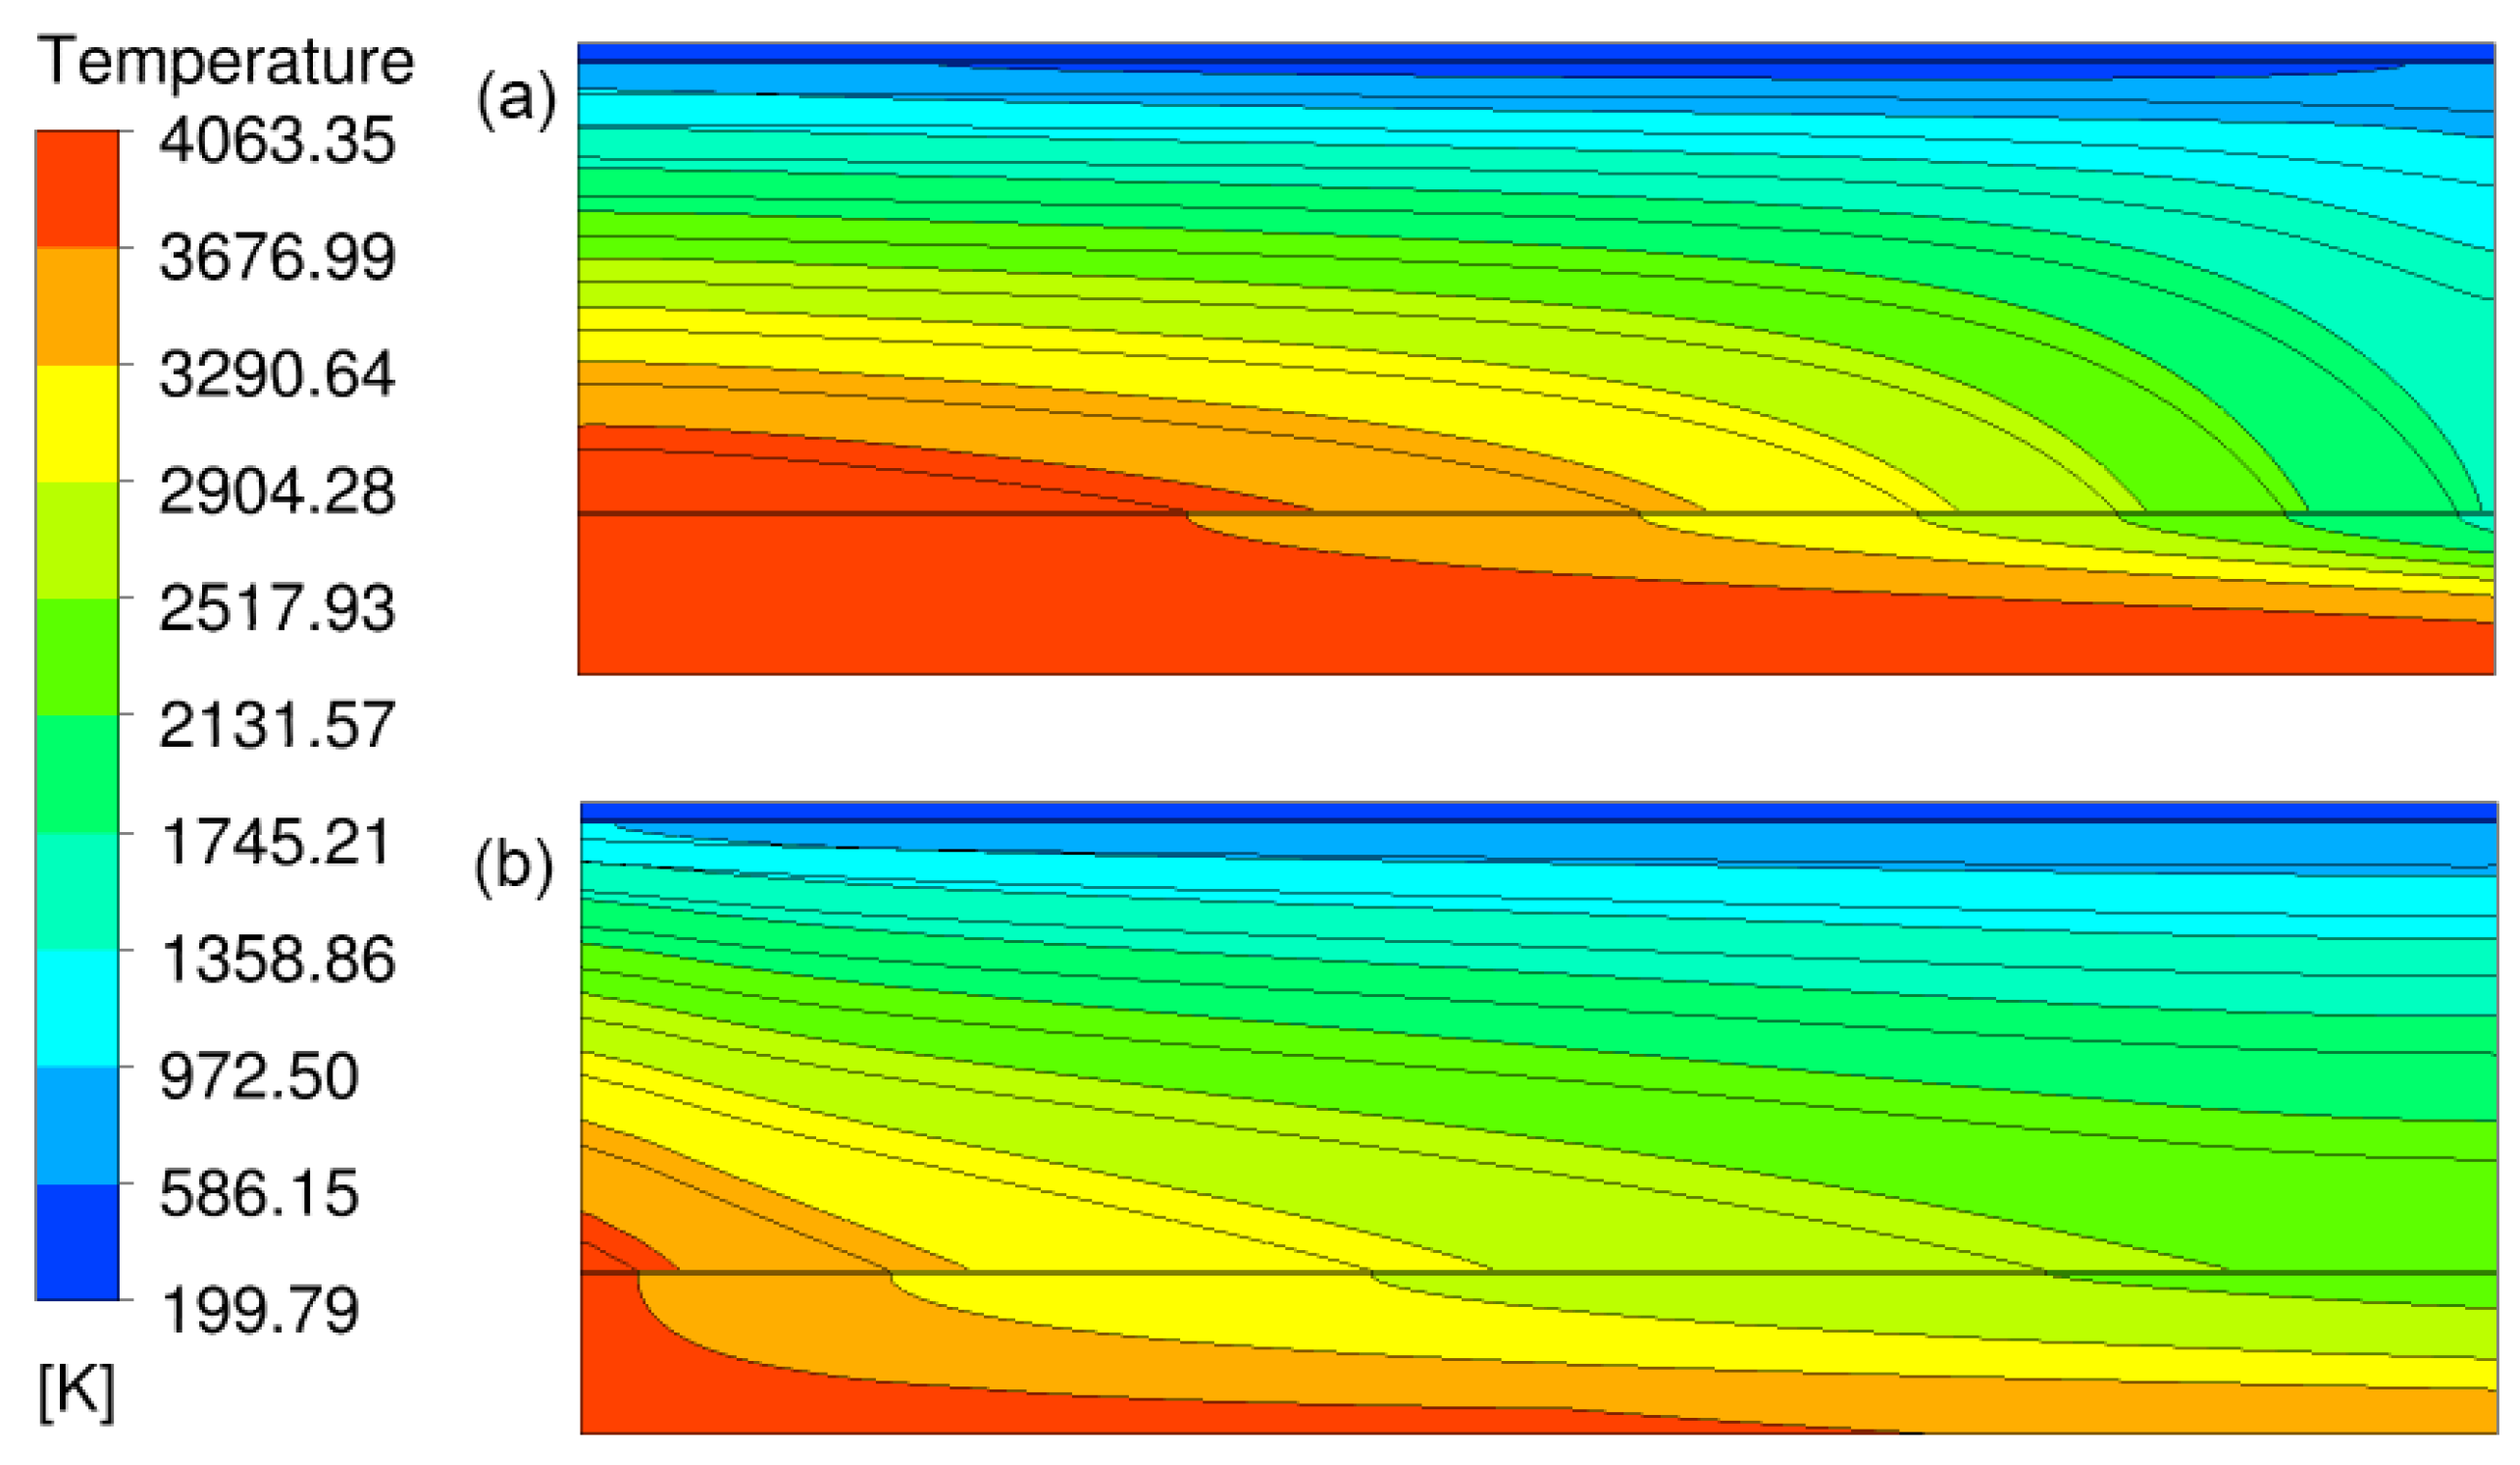
Based on the previous baseline design, a cold frit-dominated PBR was achieved by increasing the resistance of the cold frit and decreasing the resistance of the hot frit. In this design, the pore size of the cold frit was reduced to 10 μm and the porosity of the cold frit was increased to 0.2. Using this PBR to establish a computational model, the pressure profile, streamline, and temperature field were derived, which are shown in Figure 11a and Figure 12a, respectively. Similarly, through the reduction of the pore size of the hot frit to 400 μm, a hot frit-dominated design was derived as well. By performing the CFD calculation, the pressure profile, streamline, and temperature field were obtained; these are shown in Figure 11b and Figure 12b. The maximum temperatures of both the cold frit-dominated PBR and the hot frit-dominated PBR were reduced compared to the previous baseline design from Figure 12 and Figure 9, meaning that the coolant was distributed more uniformly than before. The results confirm the analyses regarding the PBR of the low power density in Section 2.2.2.
Although these two evolutions both show improvement in the temperature profiles compared to the baseline design in the previous section, the hot frit-dominated design was slightly superior to cold frit-dominated design due to a lower peak temperature and more uniform temperature distribution. Figure 11 displays why this was the case. In the cold frit-dominated design, the coolant was redistributed in the fuel bed, especially in the region near the cold frit, where the flow rate was low. This redistribution did not introduce much of an additional pressure drop to the PBR due to the large fuel particle size, but did lead to a significant temperature variation along the hot gas channel. This result was in accordance with the phenomenon observed by Tuddenham [18] and Morley et al. [16]. In the hot-dominated design, a lower magnitude of flow redistribution was observed and the flow was almost fully radial in the fuel region. Logically, the coolant in the hot frit-dominated system was distributed more uniformly than in the cold frit-dominated system.
In addition to the PBR above, another design of higher power density was also selected to demonstrate the effect of increasing resistance of cold or hot frits. This design included a fuel element in an assembled PBR, which was similar to the design of Ludwig et al. in Brookhaven National Laboratory [13]. The main geometrical parameters are listed in Table 5. Besides these parameters, the power density was raised to 30 MW/L and the mass flow rate was 0.396 kg/s to ensure high outlet temperatures approaching 3000 K.
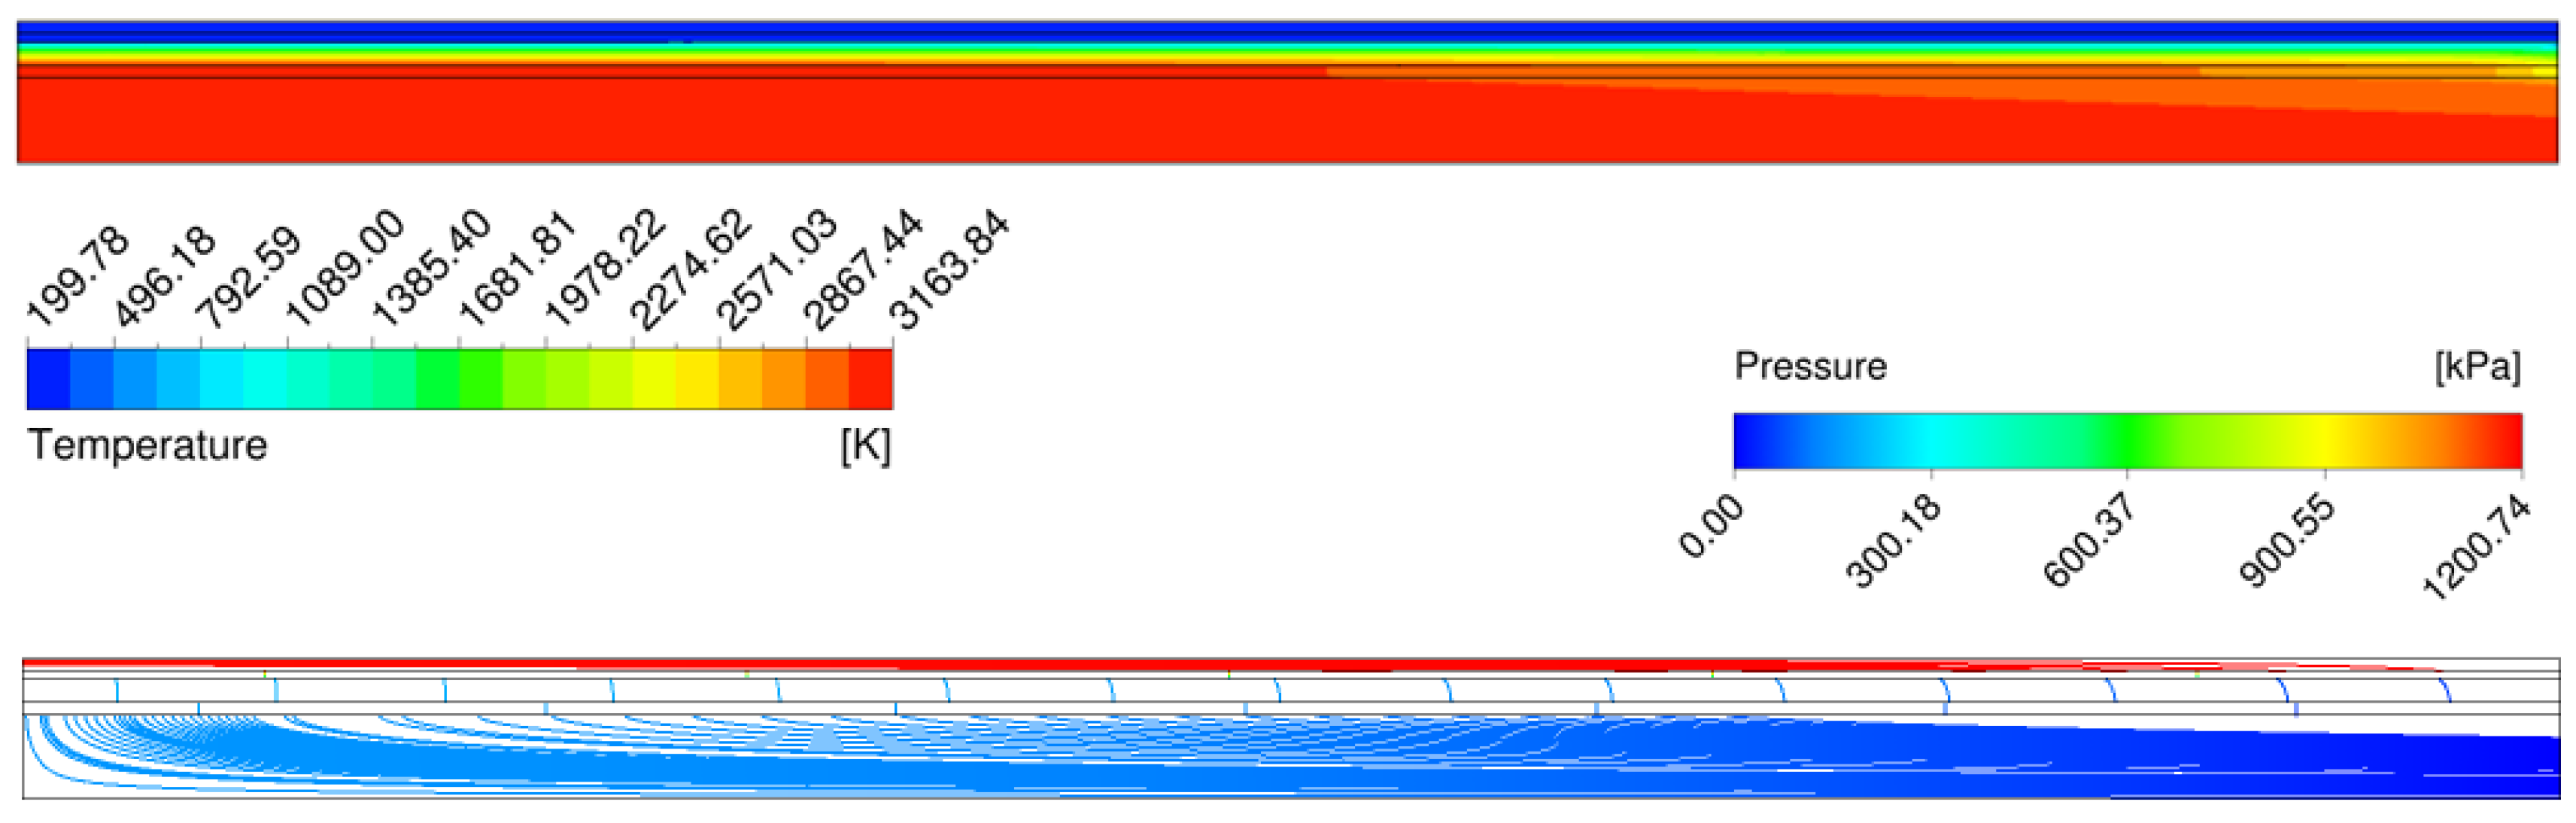
Firstly, the pore sizes of the cold and hot frits of this fuel element were designated as 0.002 mm and 0.1 mm, respectively, and the porosities of the cold and hot frits were 0.4 and 0.5, respectively. In this way, the fuel element was a cold frit-dominated system. Using the CFD calculation, the temperature field, the pressure profile, and the streamline of this cold frit-dominated fuel element were determined, and these values are shown in Figure 13. A seen in the figure, the temperature was rather uniform, and the maximum temperature was 3163.8 K. The total pressure drop was 1189.2 kPa, which was calculated from the CFD results. According to the streamline, the flow redistribution was much weaker than that of the previous cold frit-dominated PBR due to smaller fuel particle sizes; any axial flow led to a significant increase in pressure drop throughout the whole fuel element. However, when the fuel element was designed as a hot frit-dominated one, the CFD calculation diverged, meaning that flow instability occurred. Under this condition, the maximum temperature exceeded 8000 K (8000 K is the pre-defined temperature limit in the CFD calculation), and the PBR core was damaged. Therefore, only the cold frit-dominated design was feasible to distribute the coolant in the fuel element of high power density and small particles, thereby demonstrating the analyses discussed in Section 2.2.2. and accounting for why the cold frit were adopted to control coolant flow in the work by Ludwig et al. [14] and Ji et al. [19].
4. Conclusions and Further Considerations
The particle bed reactor (PBR) is the most efficient, compact, and lightweight method among all current nuclear thermal propulsion (NTP) concepts, but the thermal hydraulic design is a challenging issue, where the flow distribution of coolant is an important component. Based on the understanding of the axial pressure profile in the PBR core, this paper thoroughly analyzed the flow process of coolant in a dummy design. The analyses revealed that more coolant always flows toward one side in this dummy PBR, which was called a “flow shift” phenomenon. This phenomenon was mainly caused by a significant pressure drop within the hot gas channel and led to a hot spot in the core. The stronger the flow shift was, the higher the maximum temperature in the core was. Three approaches, i.e., decreasing the pressure drop in the hot gas channel directly, increasing the resistance of cold or hot frits to reduce the percentage of pressure drop within the hot gas channel accounting for the total pressure drop, and changing the flow pattern from a “Z” to a “U” pattern were proposed to reduce flow shift. In particular, the pros and cons of using a cold frit-dominated design or a hot frit-dominated design were discussed. To restrict flow redistribution and avoid flow instability, the use cold frit is recommended in PBRs of high power density, while the use hot frit is recommended in PBRs of relatively low density to distribute the coolant. All analyses were demonstrated by numerical simulations.
Overall, this work is beneficial to understanding of the flow distribution in PBRs. However, these qualitative analyses are only part of the puzzle. In future work, more studies emphasizing the quantitative relationship of these geometry parameters, power density, and flow variables should be performed. In addition, almost all of work presented here was based on uniform heat release, hence, further analyses should be carried out based on the non-uniform power profile.
Author Contributions
Conceptualization, Y.J. and J.S.; data curation, Y.J. and Z.L.; funding acquisition, J.S.; project administration, L.S.; software, Y.J.; supervision, L.S.; visualization, Z.L.; writing—original draft, Y.J. and Z.L.; writing—review and editing, Y.J., J.S., and L.S. All authors read and approved the final manuscript.
Funding
This work was supported by the National S&T Major Project (Grant No. ZX06901) of China, CNSA program (D010501) and Tsinghua University Initiative Scientific Research Program (20197050014).
Conflicts of Interest
The authors declare no conflict of interest.
Nomenclature
| Asf | interfacial area density, m−1 |
| d | diameter, m |
| f | coefficient of pressure loss in pebble bed |
| h | heat transfer coefficient, Wm2K−1 |
| m | mass flow rate, kgm2s−1 |
| Nu | Nusselt number, = hd/λ |
| Pr | Prandtl number, = μcp/λ |
| Re | Reynolds number, = ρUd/μ |
| S | source term of momentum equation, Pam−1 |
| T | temperature, K |
| u | velocity, ms−1 |
| z | axial location in coordinates, m |
| Greek letters | |
| α | porosity of porous media |
| β | ratio of maximum pressure drop to minimum pressure drop through the bed |
| λ | thermal conductivity, Wm−1K−1 |
| μ | dynamic viscosity, kgm−1s−1 |
| Subscripts and superscripts | |
| eff | effect properties |
| f | fluid |
| max | maximum value |
| p | particle |
| s | solid |
| sf | between solid and fluid |
| Abbreviation | |
| CFD | computational fluid dynamics |
| NERVA | nuclear engine for rocket engine application |
| NIST | National Institute of Standards and Technology |
| NTP | nuclear thermal propulsion |
| PBR | particle bed reactor |
Appendix A
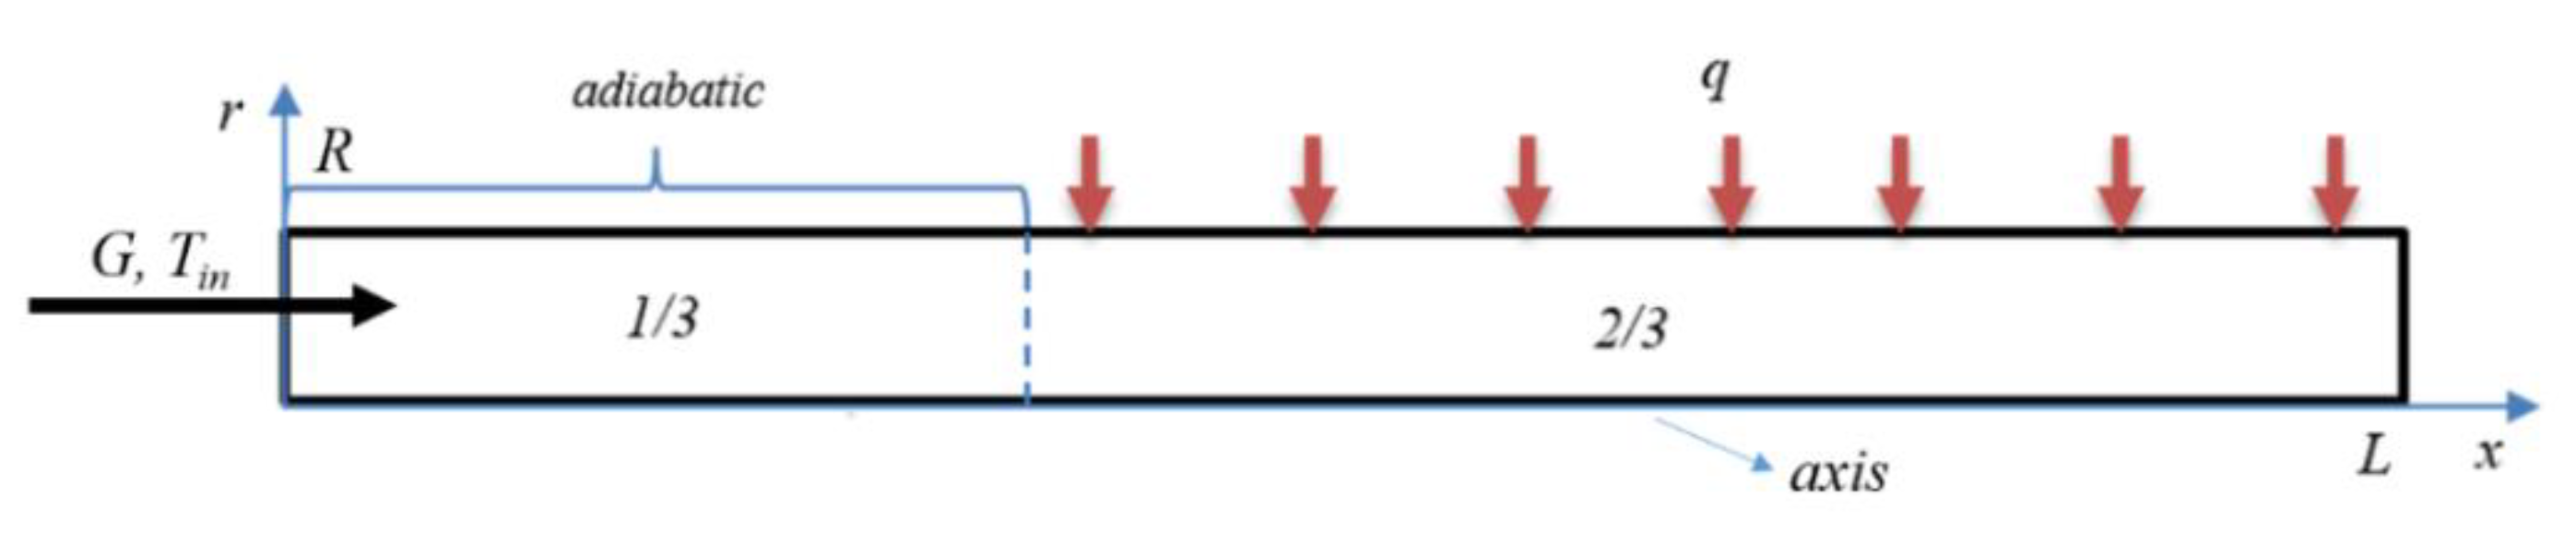
A vertically upward tube was constructed. The computational domain was simplified from a 3D to a 2D axisymmetric model to save the computational cost. Figure A1 shows the schematic view of the model, where the total length of the tube was 914.4 mm and the inner diameter was 8.51 mm. The left third of the tube was adiabatic to fully develop turbulent flow before heating, while the remaining part was enforced with heat flux of various magnitudes and profiles.
Figure A1.
Schematic diagram of the 2D axisymmetric model.

Two experimental conditions were selected, i.e., the boundary conditions and main parameters, including the mass flux G, the inlet temperature Tin, the operating pressure pop, and the heat flux q, which are listed in Table A1. The heat flux profiles were derived through the polynomial correlation of measured points in the experimental conditions, as shown in Table A2. In the experiments, all measurements were simultaneously checked by at least two sources to eliminate error, and the measurement methods and their errors or uncertainties of all related parameters are shown in Table A3. The error for power measurement was greater than other errors, but still less than 5%. Hence, the measured parameters were considered sufficient to reproduce the real physical test in the numerical simulation. Detailed information with regards to the spatial discretization, grid independence check, and others of the numerical simulation can be found in [15].

Table A1.
Main parameters of two experimental conditions, Run 64-706 and Run 103-315.
| Conditions No. | G (kg/m2 s) | Tin (K) | pop (MPa) | q (W/m2) | Mean q (W/m2) |
|---|---|---|---|---|---|
| Run 64-706 | 1385.0 | 25.3 | 4.947 | q1(x) | 2.355 × 10⁶ |
| Run 103-315 | 231.2 | 64.1 | 1.410 | q2(x) | 8.985 × 10⁵ |
Table A2.
Measured heat flux on the tube wall for Run 64-706 and Run 103-315.
| Axial Location x (m) | q1 for Run 64-706 (W/m2) | q2 for Run 103-315 (W/m2) |
|---|---|---|
| 0.3683 | 1.931 × 10⁶ | 7.528 × 10⁵ |
| 0.4191 | 2.275 × 10⁶ | 8.183 × 10⁵ |
| 0.4699 | 2.504 × 10⁶ | 8.347 × 10⁵ |
| 0.5207 | 2.504 × 10⁶ | 9.001 × 10⁵ |
| 0.5461 | 2.439 × 10⁶ | 8.674 × 10⁵ |
| 0.5715 | 2.357 × 10⁶ | 9.001 × 10⁵ |
| 0.5969 | 2.275 × 10⁶ | 9.001 × 10⁵ |
| 0.6477 | 2.160 × 10⁶ | 9.492 × 10⁵ |
| 0.6985 | 2.078 × 10⁶ | 9.329 × 10⁵ |
| 0.7493 | 2.046 × 10⁶ | 9.820 × 10⁵ |
| 0.8001 | 1.980 × 10⁶ | 9.656 × 10⁵ |
| 0.8509 | 1.980 × 10⁶ | 9.820 × 10⁵ |
Table A3.
The measurements and their errors or uncertainties of the parameters in the experiments.
| Parameters | Measurements | Error or Uncertainty |
|---|---|---|
| Mass flow | 2 venturi and 1 orifice | 3% |
| Bulk temperature | Carbon and platinum thermometers | ±1.11 K at the inlet, ±5.56 K at the outlet |
| Pressure | Several differential-pressure meters | 1% in the absolute static pressure |
| Wall temperature | Thermo-couples | ±5.56 K |
| Power | Dual sets of voltmeters and ammeters | 5% |
References
- Nam, S.H.; Venneri, P.; Kim, Y.; Lee, J.I.; Chang, S.H.; Jeong, Y.H. Innovative concept for an ultra-small nuclear thermal rocket utilizing a new moderated reactor. Nucl. Eng. Technol. 2015, 47, 678–699. [Google Scholar] [CrossRef] [Green Version]
- Fan, S.; Li, M.; Li, S.; Zhou, T.; Hu, Y.; Wu, S. Thermodynamic analysis and optimization of a Stirling cycle for lunar surface nuclear power system. Appl. Therm. Eng. 2017, 111, 60–67. [Google Scholar] [CrossRef]
- Ribeiro, G.B.; Braz Filho, F.A.; Guimarães, L.N.F. Thermodynamic analysis and optimization of a Closed Regenerative Brayton Cycle for nuclear space power systems. Appl. Therm. Eng. 2015, 90, 250–257. [Google Scholar] [CrossRef]
- Nam, S.H.; Venneri, P.; Kim, Y.; Chang, S.H.; Jeong, Y.H. Preliminary conceptual design of a new moderated reactor utilizing an LEU fuel for space nuclear thermal propulsion. Prog. Nucl. Energy 2016, 91, 183–207. [Google Scholar] [CrossRef]
- Borowski, S.; Corban, R.; McGuire, M.; Beke, E. Nuclear thermal rocket/vehicle design options for future NASA missions to the Moon and Mars. In Space Programs and Technologies Conference and Exhibit; National Aeronautics and Space Administration: Huntsville, AL, USA, 1995; p. 4170. [Google Scholar]
- Labib, S.; King, J. Design and analysis of a single stage to orbit nuclear thermal rocket reactor engine. Nucl. Eng. Des. 2015, 287, 36–47. [Google Scholar] [CrossRef]
- Clark, J.S.; Mcdaniel, P.; Howe, S.; Helms, I.; Stanley, M. Nuclear Thermal Propulsion Technology: Results of An Interagency Panel in FY 1991; NASA Technical Memorandum 105711; NASA: Washington, DC, USA, 1993.
- Ji, Y.; Sun, J.; Li, Z.; Lang, M.; Shi, L. Preliminary investigation of thermal-hydraulic characteristics in pellet bed reactor for nuclear thermal propulsion. In Nuclear and Emerging Technologies for Space 2018; American Nuclear Society: Las Vegas, NV, USA, 2018; pp. 114–117. [Google Scholar]
- Ji, Y.; Yang, X.; Sun, J.; Li, Z.; Lang, M.; Shi, L. Parametric Study on Thermal Hydraulics Characteristics of A Particle Bed Reactor for Nuclear Thermal Propulsion. In Nuclear and Emerging Technologies for Space 2019; American Nuclear Society: Richland, WA, USA, 2019. [Google Scholar]
- Houts, M.; Mitchell, S. Development and Utilization of Nuclear Thermal Propulsion. In Nuclear and Emerging Technologies for Space 2016; American Nuclear Society: Huntsville, AL, USA, 2016. [Google Scholar]
- Drake, B.G.; Hoffman, S.J.; Beaty, D.W. Human exploration of Mars, design reference architecture 5.0. In Proceedings of the Aerospace Conference, Montana, MT, USA, 6–13 March 2010; IEEE: Piscataway, NJ, USA, 2010; pp. 1–24. [Google Scholar]
- Zakirov, V.; Pavshook, V. Russian nuclear rocket engine design for Mars exploration. Tsinghua Sci. Technol. 2007, 12, 256–260. [Google Scholar]
- Robbins, W. An historical perspective of the NERVA nuclear rocket engine technology program. In Proceedings of the Conference on Advanced SEI Technologies, Cleveland, OH, USA, 4–6 September 1991; p. 3451. [Google Scholar]
- Ludewig, H.; Powell, J.R.; Todosow, M.; Maise, G.; Barletta, R.; Schweitzer, D.G. Design of particle bed reactors for the space nuclear thermal propulsion program. Prog. Nucl. Energy 1996, 30, 1–65. [Google Scholar] [CrossRef]
- Ji, Y.; Sun, J.; Shi, L. Numerical Investigation of Convective Heat Transfer to Supercritical Pressure Hydrogen in a Straight Tube. J. Nucl. Eng. Radiat. Sci. 2018, 4, 031012. [Google Scholar] [CrossRef]
- Morley, N.J.; El-Genk, M.S. Thermal-hydraulic analysis of the pellet bed reactor for nuclear thermal propulsion. Nucl. Eng. Des. 1994, 149, 387–400. [Google Scholar] [CrossRef]
- Benenati, R.; Araj, K.J.; Horn, F.L. Thermal-Hydraulic Considerations for Particle Bed Reactors; Brookhaven National Lab.: Upton, NY, USA, 1987.
- Tuddenham, R.S. Thermal Hydraulic Analysis of a Packed Bed Reactor Fuel Element. Master’ Thesis, Science in Nuclear Engineering, Massachusetts Institute of Technology, Cambridge, MA, USA, 1989. [Google Scholar]
- Ji, Y.; Zhang, H.; Sun, J.; Shi, L. Thermal performance optimization of a fuel element in particle bed reactors for nuclear thermal propulsion. Nucl. Eng. Des. 2019, 355, 110316. [Google Scholar] [CrossRef]
- Wang, J. Theory of flow distribution in manifolds. Chem. Eng. J. 2011, 168, 1331–1345. [Google Scholar] [CrossRef]
- Ergun, S. Fluid flow through packed columns. Chem. Eng. Prog. 1952, 48, 89–94. [Google Scholar]
- ANSYS Inc. FLUENT 14.0: Theory Guide; Fluent Inc.: Pittsburgh, PA, USA, 2012. [Google Scholar]
- Vafai, K.; Sozen, M. Analysis of Energy and Momentum Transport for Fluid Flow Through a Porous Bed. J. Heat Transf. 1990, 112, 690–699. [Google Scholar] [CrossRef]
- Geschäftsstelle des Kerntechnischen Ausschusses beim Bundesamt für Strahlenschutz. Reactor Core Design of High-Temperature Gas-Cooled Reactors Part 3: Loss of Pressure through Friction in Pebble Bed Cores; KTA 3102.3; Nuclear Safety Standards Commission (KTA): Salzgitter, Germany, 1981. [Google Scholar]
- Geschäftsstelle des Kerntechnischen Ausschusses beim Bundesamt für Strahlenschutz. Reactor Core Design of High-Temperature Gas-Cooled Reactors Part 2: Heat Transfer in Spherical Fuel Elements; KTA 3102.2; Nuclear Safety Standards Commission (KTA): Salzgitter, Germany, 1983. [Google Scholar]
- Peng, D.; Robinson, D.B. A new two-constant equation of state. Ind. Eng. Chem. Fundam. 1976, 15, 59–64. [Google Scholar] [CrossRef]
- Leachman, J.W.; Jacobsen, R.T.; Penoncello, S.G.; Lemmon, E.W. Fundamental equations of state for parahydrogen, normal hydrogen, and orthohydrogen. J. Phys. Chem. Ref. Data 2009, 38, 721–748. [Google Scholar] [CrossRef]
- Diller, D.E. Measurements of the Viscosity of Parahydrogen. J. Chem. Phys. 1965, 42, 2089–2100. [Google Scholar] [CrossRef]
- Assael, M.J.; Assael, J.; Huber, M.L.; Perkins, R.A.; Takata, Y. Correlation of the Thermal Conductivity of Normal and Parahydrogen from the Triple Point to 1000 K and up to 100 MPa. J. Phys. Chem. Ref. Data 2011, 40, 033101. [Google Scholar] [CrossRef] [Green Version]
- Ji, Y.; Shi, L.; Sun, J. Numerical investigation of convective heat transfer to supercritical hydrogen in a straight tube. In Proceedings of the International Conference on Nuclear Engineering, Shanghai, China, 2–6 July 2017. [Google Scholar]
- Hendricks, R.C.; Graham, R.W.; Hsu, Y.Y.; Friedman, R. Experimental Heat Transfer Results for Cryogenic Hydrogen Flowing in Tubes at Subcritical and Supercritical Pressures to 800 Pounds Per Square Inch Absolute; Lewis Research Center, NASA: Cleveland, OH, USA, 1966.
- Hendricks, R.C.; Simoneau, R.J.; Friedman, R. Heat Transfer Characteristics of Cryogenic Hydrogen from 1000 to 2500 Psia Flowing Upwards in Uniformly Heated Straight Tubes; Lewis Research Center, NASA: Cleveland, OH, USA, 1965.
- Zhang, Z.; Dong, Y.; Li, F.; Zhang, Z.; Wang, H.; Huang, X.; Li, H.; Liu, B.; Wu, X.; Wang, H.; et al. The Shandong Shidao Bay 200 MW e High-Temperature Gas-Cooled Reactor Pebble-Bed Module (HTR-PM) Demonstration Power Plant: An Engineering and Technological Innovation. Engineering 2016, 2, 112–118. [Google Scholar] [CrossRef] [Green Version]
- Cleveand, J.C.; Greene, S.R. Application of THERMIX-KONVEK Code to Accident Analysis of Modular Pebble Bed High Temperature Reactors (HTRs); Oak Ridge National Lab.: Oak Ridge, TN, USA, 1986.
Figure 1.
Nuclear thermal propulsion (NTP) reference sequence of a human exploration mission to Mars [11].
Figure 1.
Nuclear thermal propulsion (NTP) reference sequence of a human exploration mission to Mars [11].

Figure 2.
Schematic view of a particle bed reactor (PBR) for propulsion. (a) Individual PBR core; (b) fuel elements-assembled PBR core [10].
Figure 2.
Schematic view of a particle bed reactor (PBR) for propulsion. (a) Individual PBR core; (b) fuel elements-assembled PBR core [10].

Figure 3.
A simplified view of the PBR core and a schematic diagram of the pressure profile along the axial direction in PBR at several radial positions. 1-1′, outer cold frit interface; 2-2′, inner cold frit interface; 3-3′, outer hot frit interface; 4-4′, inner hot frit interface; R, radius of the bare core; Rh, radius of the hot gas channel; , total pressure drop; , pressure drop within hot gas channel; L, length of the core.

Figure 4.
Schematic diagram of the pressure profile along the axial direction at several radial positions under decreased pressure drop conditions within the hot gas channel. 1-1′, outer cold frit interface; 2-2′, inner cold frit interface; 3-3′, outer hot frit interface; 4-4′, inner hot frit interface.

Figure 5.
Schematic diagram of the pressure profile along the axial direction at several radial positions under conditions with increased total pressure drop. (a) Hot frit-dominated design; (b) cold frit-dominated design.
Figure 5.
Schematic diagram of the pressure profile along the axial direction at several radial positions under conditions with increased total pressure drop. (a) Hot frit-dominated design; (b) cold frit-dominated design.

Figure 6.
Schematic diagram of the pressure profile along the axial direction at several radial positions under “U” flow pattern conditions. 1-1′, outer cold frit interface; 2-2′, inner cold frit interface; 3-3′, outer hot frit interface; 4-4′, inner hot frit interface.
Figure 6.
Schematic diagram of the pressure profile along the axial direction at several radial positions under “U” flow pattern conditions. 1-1′, outer cold frit interface; 2-2′, inner cold frit interface; 3-3′, outer hot frit interface; 4-4′, inner hot frit interface.

Figure 7.
Partial validation of the numerical approach.

Figure 8.
Comparison of the calculated wall temperature with experimental data.

Figure 9.
Temperature field of the two PBRs using different flow patterns. (a) “Z” flow pattern; (b) “U” flow pattern.
Figure 9.
Temperature field of the two PBRs using different flow patterns. (a) “Z” flow pattern; (b) “U” flow pattern.

Figure 10.
Pressure profile within the hot gas channel along the axial direction in the PBRs of various core heights.
Figure 10.
Pressure profile within the hot gas channel along the axial direction in the PBRs of various core heights.

Figure 11.
Pressure profile and streamline in PBRs of increased resistance of cold frit or hot frit. (a) Cold frit-dominated PBR; (b) hot frit-dominated PBR.
Figure 11.
Pressure profile and streamline in PBRs of increased resistance of cold frit or hot frit. (a) Cold frit-dominated PBR; (b) hot frit-dominated PBR.

Figure 12.
Temperature field in PBRs of increased resistance of cold frit or hot frit. (a) Cold frit-dominated PBR; (b) hot frit-dominated PBR.
Figure 12.
Temperature field in PBRs of increased resistance of cold frit or hot frit. (a) Cold frit-dominated PBR; (b) hot frit-dominated PBR.

Figure 13.
Temperature field, pressure profile, and streamline in a cold frit-dominated fuel element of PBR.
Figure 13.
Temperature field, pressure profile, and streamline in a cold frit-dominated fuel element of PBR.

Table 1.
Comparisons of the results from CFD and THERMIX.
| Parameters | CFD | THERMIX | Discrepancy |
|---|---|---|---|
| Mass flow rate, kg/s | 90.49 | 96.2 × 94% * | - |
| Inlet temperature of helium, K | 523 | 523 | - |
| Outlet temperature of helium, K | 1055 | 1059 | (−4.0) 0.5% |
| Pressure drop through core, kPa | 80.0 | 76.7 | (+3.3) 4.3% |
| Maximum temperature of helium, K | 1210 | 1170 | (+40) 4.5% |
| Maximum temperature of fuel surface, K | 1215 | 1178 | (+37) 4.1% |
* 96.2 kg/s is the total mass flow rate at the inlet of core, in which 94% of coolant flows into the core, while the other 6% is by-pass or leaks.
Table 2.
Main geometrical parameters of the PBR.
| Parameters | Value |
|---|---|
| Radius of the core R, mm | 507 |
| Length of the core L, mm | 1200 |
| Radius of the hot gas channel Rh, mm | 100 |
| Thickness of the hot frit δh, mm | 3 |
| Thickness of the fuel bed δb, mm | 281 |
| Thickness of the cold frit δc, mm | 2 |
| Thickness of the inlet plenum δin, mm | 10 |
| Thickness of radial reflector δr, mm | 111 |
Table 3.
Thermal hydraulic characteristics of the two PBRs using different flow patterns.
| Flow Pattern | Δp (kPa) | Tout (K) | Tmax (K) |
|---|---|---|---|
| “Z” | 872.4 | 2772.2 | 7121.3 |
| “U” | 867.4 | 2775.6 | 4833.0 |
Table 4.
Thermal hydraulic characteristics in three PBRs of various core heights.
| Heights | Δp (kPa) | Tout (K) | Tmax (K) | β |
|---|---|---|---|---|
| L = 80 cm | 551.8 | 2799.1 | 4161.2 | 2.3345 |
| L = 100 cm | 693.0 | 2786.2 | 5119.6 | 3.5258 |
| L = 120 cm | 865.7 | 2773.9 | 6940.4 | 5.4813 |
Table 5.
Main geometrical parameters of the PBR.
| Parameters | Value |
|---|---|
| Length of the fuel element L, mm | 639.20 |
| Radius of the hot gas channel Rh, mm | 21.29 |
| Thickness of the hot frit δh, mm | 3.00 |
| Thickness of the fuel bed δb, mm | 6.15 |
| Thickness of the cold frit δc, mm | 2.00 |
| Thickness of the inlet plenum δin, mm | 3.00 |
| Fuel particle diameter dp, mm | 0.5 |
| Fuel bed porosity, - | 0.38 |
© 2019 by the authors. Licensee MDPI, Basel, Switzerland. This article is an open access article distributed under the terms and conditions of the Creative Commons Attribution (CC BY) license (http://creativecommons.org/licenses/by/4.0/).
Share and Cite
MDPI and ACS Style
Ji, Y.; Liu, Z.; Sun, J.; Shi, L. Analysis of the Flow Distribution in a Particle Bed Reactor for Nuclear Thermal Propulsion. Energies 2019, 12, 3590. https://doi.org/10.3390/en12193590
AMA Style
Ji Y, Liu Z, Sun J, Shi L. Analysis of the Flow Distribution in a Particle Bed Reactor for Nuclear Thermal Propulsion. Energies. 2019; 12(19):3590. https://doi.org/10.3390/en12193590
Chicago/Turabian StyleJi, Yu, Ziping Liu, Jun Sun, and Lei Shi. 2019. "Analysis of the Flow Distribution in a Particle Bed Reactor for Nuclear Thermal Propulsion" Energies 12, no. 19: 3590. https://doi.org/10.3390/en12193590
Note that from the first issue of 2016, this journal uses article numbers instead of page numbers. See further details here.