Article

Sustainable Groundwater Exploitation Aiming at the Reduction of Water Vulnerability in the Brazilian Semi-Arid Region

by
Roberto Gomes Cavalcante Júnior
1,2,*,
Marcos Aurélio Vasconcelos Freitas
2,3,
Neilton Fidelis da Silva
1,2,3 and
Franklin Rocha de Azevedo Filho
4
1
Institute of Education, Science and Technology (IFRN), Natal 59015-000, Brazil
2
Energy Planning Program (PPE/UFRJ), Rio de Janeiro 21941-914, Brazil
3
International Virtual Institute of Global Changes, Rio de Janeiro 21941-909, Brazil
4
Ministry of the Environment of Brazil, Brasília 70000-000, Brazil
*
Author to whom correspondence should be addressed.
Energies 2019, 12(5), 904; https://doi.org/10.3390/en12050904
Submission received: 30 January 2019 / Revised: 19 February 2019 / Accepted: 4 March 2019 / Published: 8 March 2019
(This article belongs to the Section A: Sustainable Energy)

Abstract

:
Semi-arid regions have historically suffered from low water availability. In addition, the increasing frequency and intensity of extreme weather events credited to global climate change has made it increasingly clear that among the challenges faced by society water resource management is extremely necessary. In this context, desalination based on renewable energy resources integrated with production systems that make use of the waste resulting from this process becomes a socio-environmentally indicated alternative to expand existing supply strategies and sustainable water use in isolated locations, and/or areas distant from large urban centers, thus addressing local potential and reducing environmental impacts. This study assesses the use of Photovoltaic Solar Power Plants (PSPPs), as well as of residues generated in a Brackish Water Reverse Osmosis System (BWRO), in productive units linked to fish and family farming. This is as an alternative way to reduce water vulnerability in the Brazilian semi-arid area (BS), adhering to climate change adaptation measures in the light of Brazilian public policies through the Freshwater Program (Programa Água Doce—PAD), which aims to promote access to good quality water to approximately 500 thousand people in the Brazilian semi-arid region.

1. Introduction

Significant increases in water and energy demands are expected due to the estimated global population increase to 9.7 billion by 2050. In contrast, the total available amount of water on the planet remains approximately constant, at about 1.4 billion km3, with less than 1% of freshwater available for human consumption. In addition, accessible freshwater resources also suffer negative impacts from anthropogenic actions, as well as damage from extreme weather events, which are potentially aggravated by global climate change. In this context, the Intergovernmental Panel on Climate Change (IPCC) estimates that vulnerable populations due to increased water stress can reach up to 2 billion people by 2040 [1,2,3,4].
In Brazil, the surface water availability of around 78,600 m3/s, 30% of the average water flow, estimated at about 260,000 m3/s. Of this total, the Amazon region, where around 80% of the average water flow is concentrated, contributing 83% of the surface water availability in the country, is where the smallest portion of the population lives (8.72%), consequently it displays the lowest water demand, while the northeastern region, on the other hand, contributes 3.52% and 2.65%, respectively [5]. Arid and semi-arid areas comprise about 36% of the Earth’s land surface [6]. In Brazil, 87.8% of the northeastern region is located in a semi-arid area, demanding special attention regarding water supplies, in contrast to other regions in the country. The Brazilian semi-arid region (BS) usually presents a more critical and prolonged dry period in relation to other regions in the country, as well as natural characteristics such as high temperatures, low thermal amplitudes, strong insolation, high evapotranspiration rates and, finally, low rainfall rates, which leads to low water availability from rivers [7].
This is not a recently identified situation, as water scarcity and water stress at BS is a permanent feature, and so marked that the literature emphasizes the drought and misery of the Brazilian backwoods as a consequence of the “adverse” local climate, in which the nature of the semi-arid boosts the backwoods to accompany this natural cycle, limiting economic alternatives dependent on the annual rainfall regime [8]. Natural characteristics and historical factors with unequal investments between Brazilian regions have contributed to a local economy unstructured by sustainable activities, and, thus, the degree of development of this region has been lower compared to other regions of the country [9]. In 2015, the Gross Domestic Product (GDP) per capita of BS was of less than US $2000 per year, well below the Brazilian GDP per capita of US $8500.00 [10].
The same natural characteristics that contribute to water scarcity also highlight the energy potential of the semi-arid, such as wind and solar sources. This potential can be used to mitigate possible damages due to the increased frequency and intensity of climate events credited to the climate change phenomenon.
Ensuring the availability of water resources on a regular basis and the use of good quality water without threats to public health will continue to be a comprehensive challenge for BS and other semi-arid regions worldwide where water scarcity is a reality.
Alternatives that consider a balanced and harmonious relationship with the environment contribute in generating positive water management impacts [11]. Thus, the use of technologies that mitigate drought effects, such as the desalination of water supply systems considering the use of renewable energy resources establishes a relation that values local powers in the connection between the water supply and its required energy, thereby improving the environmental relations established in this context [12,13]. Desalination consists in removing salts dissolved in either marine or brackish water, leading to decreased salinity of many water sources and the production of fresh water [14].
In this sense, the application of less energy-intensive processes and the adoption of strategies that apply renewable energy sources in water treatment technologies, aiming at promoting sustainability in the socio-economic and environmental spectra, have become a prominent research and development topic in the water resource field [15,16]. This work advocates that the use of the BWRO desalination technology integrated with the use of solar energy resources, including when analyzing the destination of the residue (concentrate) produced in productive units, is a socio-environmentally indicated alternative to expand the existing supply strategies. This study, therefore, aims to evaluate the use of Photovoltaic Solar Systems (PVSSs) and the waste generated by the BWRO desalination technology in productive units linked to fish and family farming as an alternative way to reduce water vulnerability in the Brazilian semi-arid region, adhering to climate change adaptation measures in the light of Brazilian public policy through the Freshwater Program (Programa Água Doce—PAD), which aims to promote access to good quality water to approximately 500,000 people in the Brazilian semi-arid region.

2. Materials and Methods

In order to achieve the objectives of the study, a review of pertinent bibliography was carried out, including scientific articles, official documents from different Brazilian federative entities and reports from national and international agencies, among others. In addition to secondary data, visits were made to the community served by the PAD in order to collect primary data through semi-structured interviews with the leaders and technicians involved, to assess how the reality experienced by community members adheres to what is informed in official documents. This study initially provides a characterization of the semiarid region and an overview of the constraints of water vulnerability at BS. The local solar energy potential confronted with the projection for the water sector in the region until the end of the century is also described. Subsequent sections discuss desalination at BS, highlighting the PAD and providing a comprehensive review of the desalination process integrated to the use of renewable energy, highlighting the opportunity for integration between the BWRO system and PVSSs. A simulation for an RO membrane design was also carried out, using the WinFlow version 3.3.2 software developed by the GE Water & Power company, to compare the costs of the water m3 with a water supply strategy using tank trucks. In the subsequent sections, the pilot project of a PSPP/BWRO system, the demonstration unit for environmental impact mitigation through production systems and the installed PVSS power required to supply the energy demands based on estimated water demands and average energy consumption of the BWRO process in the PAD are investigated.

Photovoltaic Array

At the end of this paper, the estimated installed power for PVSS use in order to meet the electric demand for the operation of the PAD desalination systems is projected, considering water demand scenarios.
Initially the energy demands were assessed as WH, expressed as:
W H = D × K
Subsequently, the output powers (Ppv) of a standard photovoltaic module (320 Wp) were dimensioned, according to [17], expressed as:
Ppv = PPV , STC ƒ PV ( G G S T C ) [ 1 + α p ( Tc Tc , stc ) ]
The temperature varies according to local conditions, and BS is characterized by low climatic variability, so for this study, the considered temperatures are available in [18]. The calculation of the amount of required modules was assessed as NP, expressed as:
N P = W H P p v
Table 1 displays the data considered for the sizing of the installed PVSS power.

3. The Brazilian Semiarid Region: Renewable Energy Appeal and the Effects of Climate Change on Water Resources

According to UNESCO [20], semi-arid areas are characterized by annual average rainfalls between 300–400 mm during winter and 700–800 mm in the summer, with relatively low interannual variability. Areas presenting a perennial grass cover sustain pastures, as well as the possibility of dry-land agriculture for drought-tolerant crops. In China, the semi-arid northern area accounts for 11% of the country’s arable land [21], while in Iran, over 50% of the territory is located in both arid and semi-arid areas [22]. Spain is the most semi-arid country in the European Union, displaying constant regional conflicts over water resources [23]. In Brazil, the semi-arid region comprises 1.03 million km2, about 12% of the total country’s area, and is one of the most populous semi-arid regions in the world, with approximately 27 million people (12% of Brazil’s entire population), surpassing the number of inhabitants of countries presenting similar climatic characteristics in parts of their territory, such as Israel (8 million) and Australia (25 million). The BS comprises 1262 cities, of which 85 are located in the northern part of the state of Minas Gerais (MG) and the rest in the Northeast (NE), in the states of Alagoas (AL), Bahia (BA), Ceará (CE), Maranhão (MA), Paraíba (PB,) Pernambuco (PE), Piauí (PI), Rio Grande do Norte (RN) and Sergipe (SE).
The criteria for BS delimitation comprise an average annual rainfall of 800 mm or less, a Thornthwaite Aridity Index equal to or less than 0.50 and daily percentage of water deficit equal to or greater than 60%, considering all days of the year [24]. In addition to low rainfall indices, the BS is characterized by high temperatures throughout the year, low thermal amplitudes, high insolation and high evapotranspiration rates, which usually exceed 2000 mm per year and total rainfall irregularities, setting negative water balance rates [25]. Droughts have had a significant influence on all life aspects in the region, due to climatic causes. This, alongside the shallow soils located on a crystalline base in much of the semiarid region, results in intermittent rivers [26].
The International Atomic Energy Agency (IAEA) estimates that most groundwater in semi-arid regions presents high salinity. This is due to the presence of high rates of terrestrial materials, such as mineral soils and rocks, as well as high evapotranspiration rates associated to low rainfall, without adequate leaching to remove salts, leading to increased soil salinity. This renders water unsuitable for human consumption, characterized by low primary porosity and permeability, while the water from the crystalline base is predominantly sodium chlorate. These constraints are translated into significant social, economic and environmental impacts that are often neglected on a larger or smaller scale [27,28,29].
Water scarcity, low precipitation and brackish water induce the need for the implementations of strategies to coexist with drought. Historically, the usually adopted options include (i) construction of reservoirs presenting different capacities to store and attend to various water uses, whether for consumption or not [25]; (ii) the construction of infrastructure, such as conduits and integration channels [30], which are susceptible to variability and climate change scenarios [31]. This makes it imperative to rethink these strategies, therefore requiring the adoption of alternatives, such as desalination, which is less vulnerable to evapotranspiration and surface runoff and can reduce the required demand for reservoirs, being the only feasible solution in areas where freshwater availability is limited [32].

3.1. The Problem Is Not Drought, but the Local Structural Basis

Drought, as a characteristic associated to BS, cannot be used as a justification for the low socioeconomic development in the region, as this condition is the result of a historical-structural formation related to an asymmetric process, at the national level, of the adoption of new techniques and technologies prioritizing the south and southeast regions. In order to be overcome, regional interventions are required, reinterpreting the current spatial and social structures and their trends and combining them with Brazil’s economic, social and political objectives [33]. In this perspective, the adoption of technologies adequate to permanent BS characteristics, through investments and federal subsidies, contributes in the reduction of regional inequalities.
In this context, in order to deal with groundwater sources containing high dissolved solid concentrations, as occurs in BS, non-traditional technologies such as desalination and membrane and thermal processes should be considered [34]. These technologies, when associated to the renewable energy potential of the region, can contribute to reduce water vulnerability and socioeconomic inequalities.

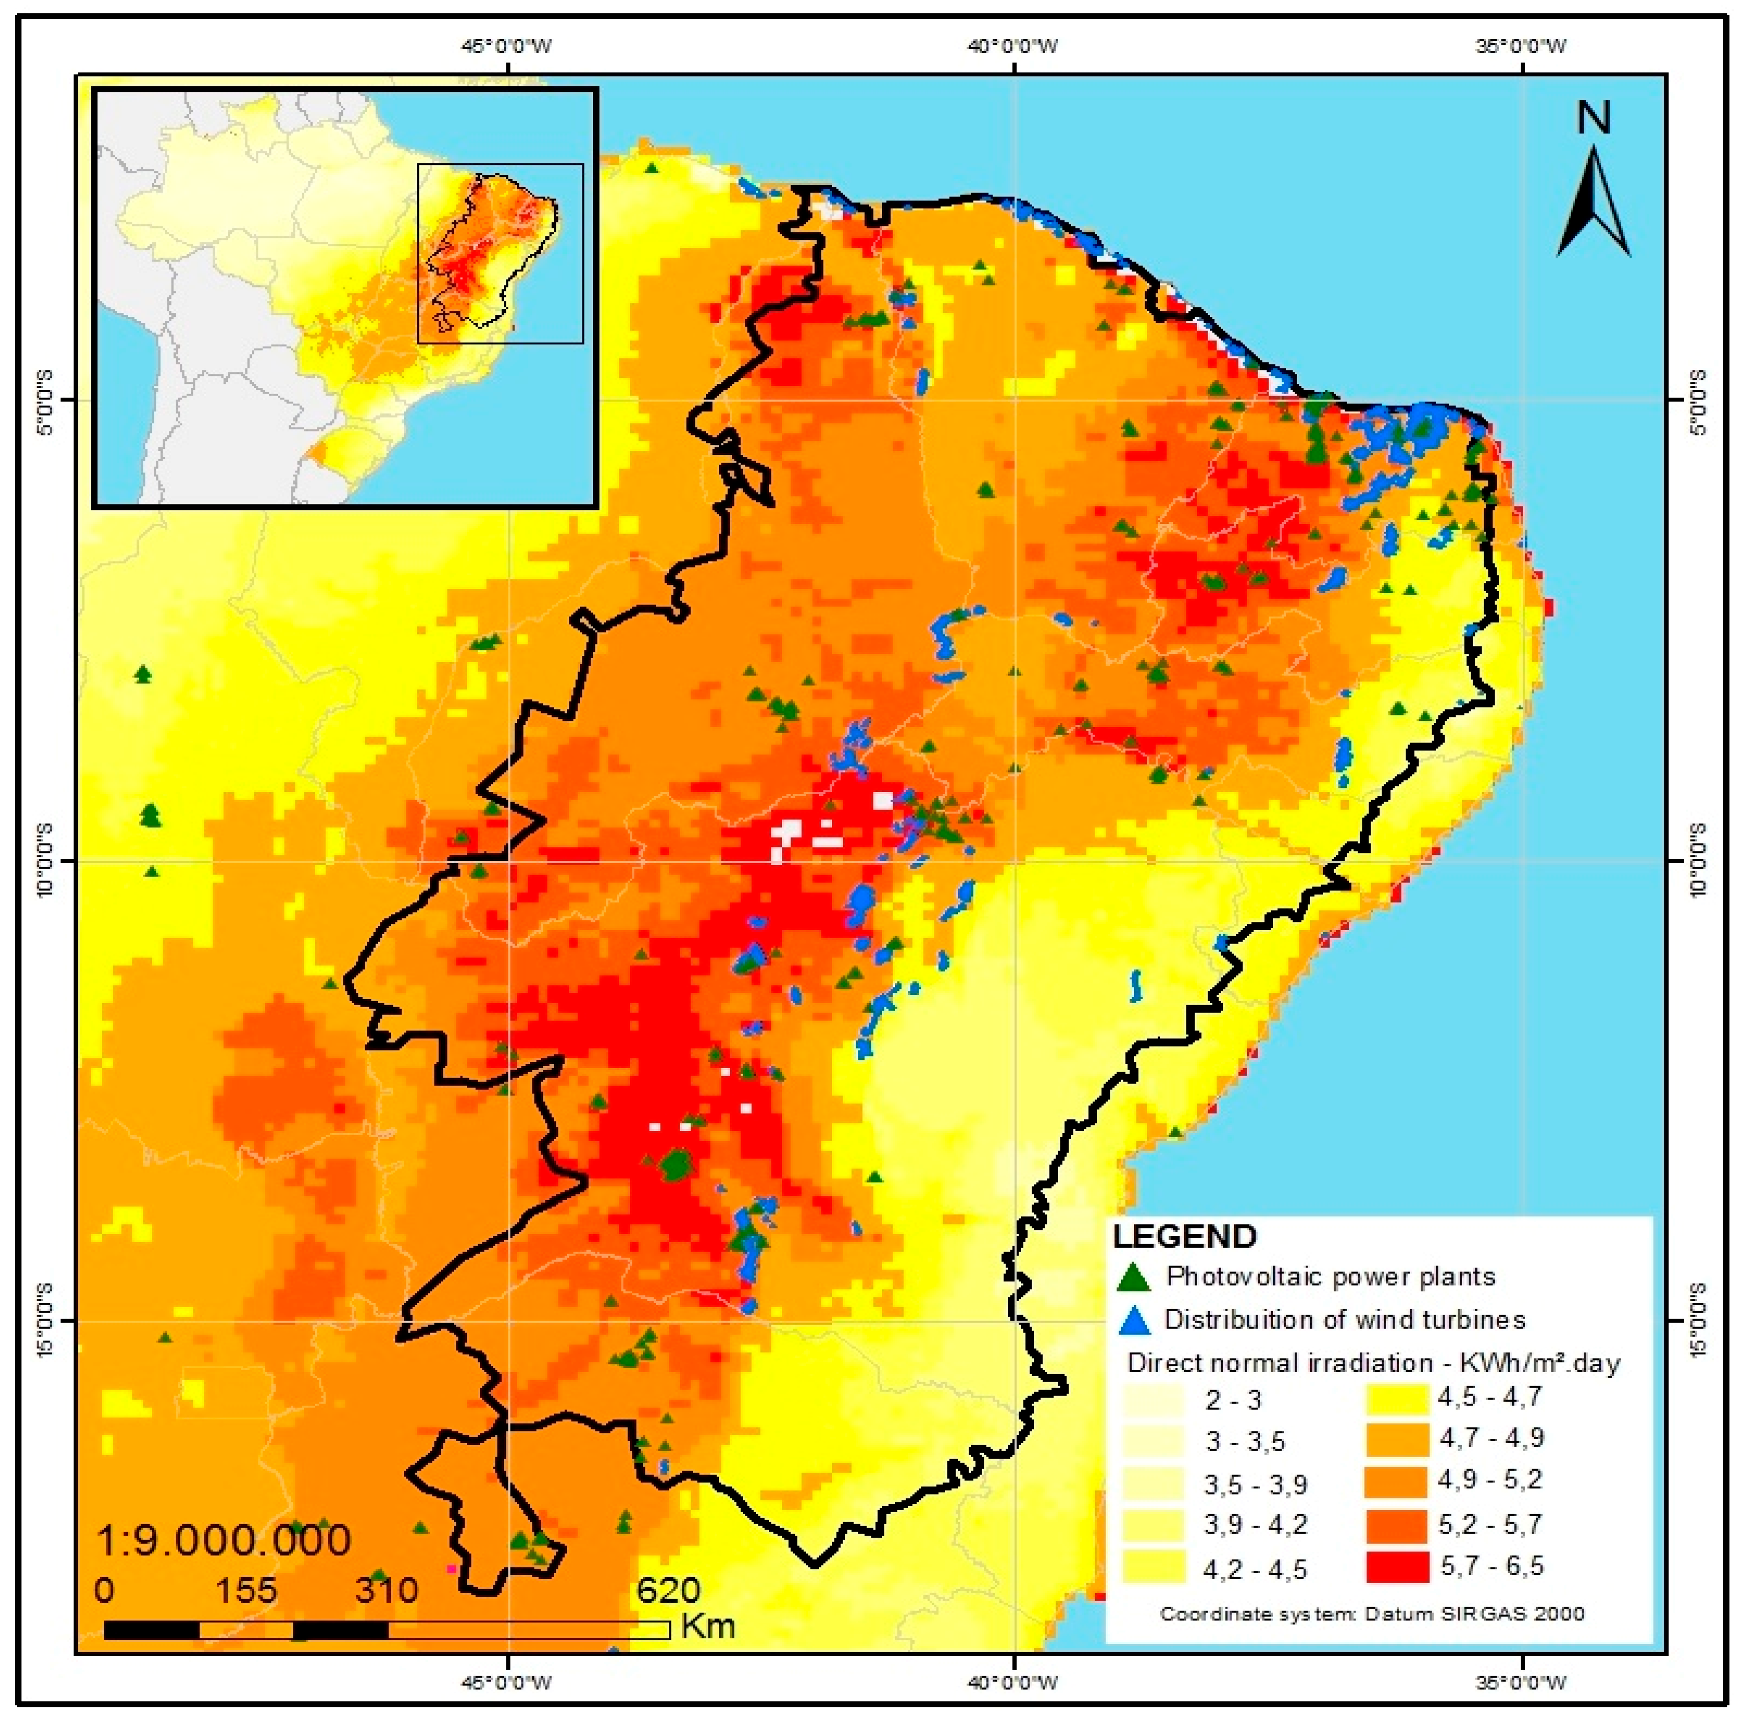
3.2. The Appeal of Renewable Energetic Sources in the Brazilian Semi-Arid

Figure 1 displays the average daily direct irradiance, PVSSs and wind farm distribution in BS. In 2018, the installed PVSS capacity for the region was of 848,585 KW/year, distributed throughout eight states. BA recorded the highest installed capacity of 428,428 KW/year, followed by PI, at 270,000 KW/year. BS solar irradiation is among the highest in the country, easily exceeding 6 KWh/m2·day and 2000 kWh/m2·year in certain areas.
In this perspective, the Brazilian Northeast, which concentrates almost 90% of the semi-arid region, displays the lowest interannual daily total global horizontal irradiation variability in the country, surpassing Iberian countries in terms of monthly average solar irradiation. In addition to the potential use of solar energy, BS also presents an enormous extension of degraded areas and areas presenting low economic value. This highlights the possibility of a socioeconomic population transformation through micro- and mini- PVSSs generation, distributed both on- and off-grid, which can become a reality through new public policies for the promotion of regional economic development and social inclusion, such as the use of PVSSs for desalination and water pumping [39].
It is important to point out that, in Brazil, solar energy competes for investments with other renewable sources, where the base of the electric energy matrix is water, at 60% of installed capacity, while biomass and wind energy contributed with 8.65% and 8.09%, respectively in 2018 [40]. Solar energy contributes with 1%, totaling 1.6 GW of installed capacity, with BS concentrating 70% of this capacity [40]. Investments in this source, displaying significant increases in installed capacity from 2017 [41], signal that this is an expanding source. Regarding wind energy, the NE region, where BS is located, was responsible for over 80% of all electricity generated in the country from 2017 through this means [41], and several wind farms are present at BS (Figure 1).

3.3. Climate Change and Water Resource Effects

Climate change can be defined as a statistically significant variation in a medium climatic parameter that persists over an extended period of time. It can be caused by natural processes, although recent changes have been credited to human activities [42].
This definition reflects the difficulty of separating the effects of human activities on natural climate variability [25]. Adapting to climate change is one of the greatest challenges faced by humanity. Currently (2018), it is estimated that 3.6 billion people live in areas with the potential for water scarcity for at least one month a year, with 1.8 billion people affected by degradation and/or desertification and drought, which makes this “natural disaster” category the most significant, based on mortality rates and socioeconomic impacts relative to per capita GDP [11].
A projection for Brazil of an increase of 45 million city inhabitants and a 28% increase in the average demand of the urban water supply by 2025 has been proposed, emphasizing that this context can be aggravated by climatic changes, both in terms of demand and water resource supplies [43].
From this perspective, unfavorable expectations have been recorded in scenarios assessing climate change impacts on BS water resources [44,45], pointing to worsening of the water restriction situation and intensification of arid conditions until the end of the century. The ratio of total annual water withdrawal to average long-term annual outflow indicates a significantly critical situation for the region. The possibility of desertification in parts of the BS area may result in food shortages, negative impacts on biomass production, and even limitation of available water for the hydroelectric plants located in the NE region, where the projected decrease in rainfall rates, alongside higher temperatures and increases in irrigation, could lead to a 60% reduction in the average annual hydroelectric generation of the São Francisco River by 2030. This projection reinforces the importance of the exploration other renewable energy sources, such as wind and solar energy [46,47,48].
In this context, desalination associated with renewable sources aiming to increase the water supply and improve water quality in semi-arid areas, which present water deficits and are more sensitive to extreme climatic events, is an environmentally and socially adequate response to face the inherent risks of drought scenarios.

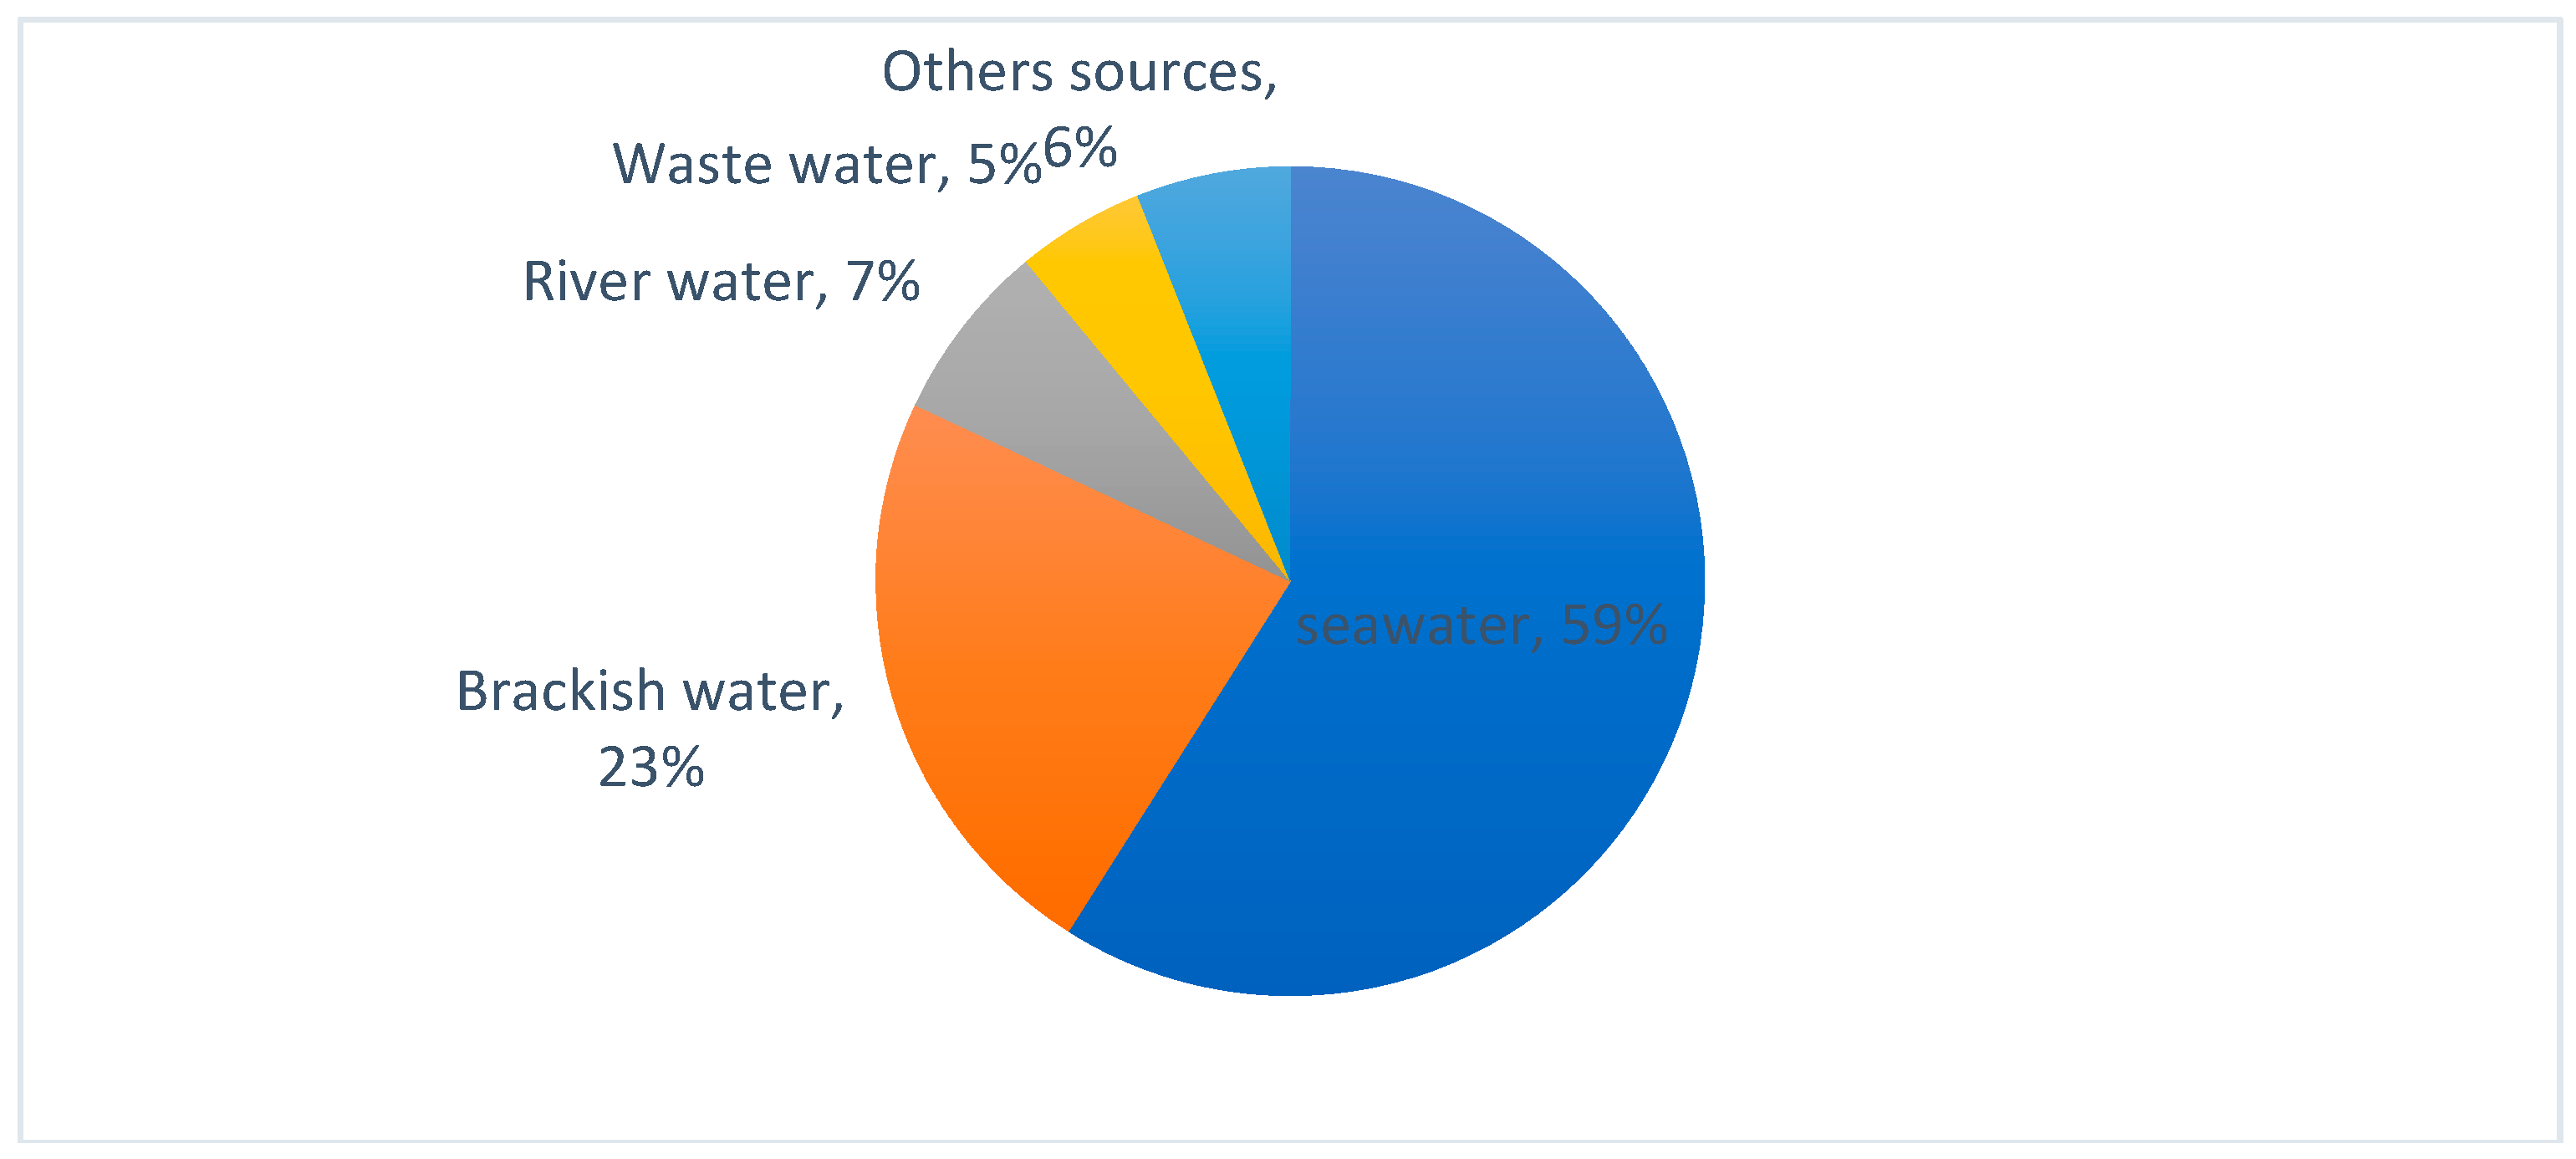
4. Desalination in the Brazilian Semi-Arid and the Use of Renewable Energy Resources

Brazil has no record of significant potential freshwater availability from operating desalination processes. The experience with this technology began in the 1990s, when the federal government and certain state governments implemented small desalination plants in the Brazilian semi-arid, but the equipment was installed without proper design and maintenance planning, as well as lack of training programs for technical personnel to operate the equipment and no environmental precautions, at any level. Aware of this situation, the National Secretariat of Water Resources and Environmental Quality, part of the Ministry of the Environment, addressed these issues and, as a result of the evaluations, launched the PAD to respond to these difficulties. The PAD is a permanent public policy of access to good quality water for human consumption. It promotes and manages the implementation of desalinators to serve low-income populations in diffuse semi-arid communities, prioritizing the most critical municipalities regarding water access conditions, based on the Water Access Condition Index (ICAA), which compiles various social and environmental indicators. These include the Municipal Human Development Index—HDI-M, rainfall rates, infant mortality rates, poverty intensity and the presence of salts in underground water resources. These aspects have led public authorities to consider more technically based approaches, rather than those based on the regional political influence configuration [49]. The desalination systems used in the PAD are small scale, comprising a 3-membrane process to produce fresh water from the brackish water pumped from wells, according to Figure 2.
This option is important to improve the quality of life of people in the semi-arid region, offering different ways of dealing with the vulnerabilities to which they are subjected to, influenced by climatic variability [50]. To promote the sustainable use of groundwater, the PAD provides drinking water for human consumption through the Reverse Osmosis Technique (RO) for freshwater production from available underground brackish water. The reference of the program for a home water supply is of 40 L of water per day per family, and the quality of the desalinated water is regulated by the Brazilian Ministry of Health Ordinance No. 2914/2011 (which provides for control of the water potability standard from individual alternative supply solutions) [51]. This control contributes to reducing risks inherent to water-related diseases. In 2018, 5759 of the installed desalination systems in Brazil were in operation, totaling 47% of the updated target, which aims at the operation of 1209 systems in the region by the end of 2019 [50]. This will benefit around 500,000 inhabitants, or 100,000 families, considering the proportion of five members per family, i.e., almost 2% of the population residing in BS.
Compared to other supply strategies in the BS area, such as reservoirs and dams and water distribution by tank trucks for water transport, the PAD is less sensitive to climatic variability, since, unlike the aforementioned strategies, it makes use of groundwater, which suffers less influence from high temperatures and high solar irradiation and is, consequently, less susceptible to evapotranspiration. The PAD is also thought to be shielded from interventions that prioritize political privileges over choices based on socioeconomic indicators that best characterize reality.
A simulation for an RO membrane design was performed using the WinFlow version 3.3.2 software according to the data presented in Table 2, indicating a total operating cost of the system of US $1.69/m3, according to Figure 3, and an energy consumption of 3.39 KWh/m3, considering a 20-year shelf life, which is lower than the cost of the cubic meter in 2018 compared to the contracting of specialized water transport services through tank trucks, which ranges from US $6.85 to US $14.86 m3. This difference is justified by the different physical and traffic highway conditions, in addition to the distances involved in the water transport. The data considered for the simulation and the operating costs are presented in Table 2 and Figure 3.
These processes become more competitive with increasing water demands and the implementation of rapid technological advances that reduce desalination costs [53,54,55,56]. In terms of participation of the distribution of water sources in the desalination process, sea water accounts for 59%, followed by ground brackish water, at 23%, according to Figure 4.
The main desalination technologies consist of Thermal Processes (TPs), which use thermal energy, and Membrane-based Processes (MPs) [59,60], although hybrid processes are also available [61]. Thermal processes involve heating brackish water for the production of water vapor, which then condenses to form distilled water. The options for this process are highlighted in [62]. MPs use selective semipermeable membranes that act as physical barriers, separating dissolved salts and other impurities, and are classified as Electrodialysis (ED) and Reverse Osmosis (RO) processes.
RO processes represent the major part of production from brackish water [63], with high recovery rates of over 50%, as well as high salt rejection, of over 90%, with low specific energy consumption. RO membranes, however, are susceptible to scaling, requiring pretreatment which results in increased maintenance costs [64,65].
In most cases, negative externalities with strong socioenvironmental effects resulting from the expansion of desalination processes from the use of non-renewable sources of energy have been ignored. The energy demand of these processes could be supplied by renewable sources [66]. It is also noteworthy that the use of technologies that use renewable resources are experiencing decreasing costs [60]. According to [67], a case study centered on the short-term energy transition with a large share of variable renewable energy is presented, in which the energy system based on these sources resulted in a similar economic cost in comparison to fossil fuel-bases systems. The association between renewable energy and desalination is beneficial, as this becomes a sustainable and challenging option for the future [32], and the right combination of renewable energy sources and desalination technology can be the key to economically adjusting energy and water demands in an efficient and environmentally friendly way.
Desalination systems using renewable energy sources can be classified into three categories: wind, solar and geothermal energy [16]. Currently, renewable energy-powered desalination plants produce only 1% of the world’s desalinated water, with PVSS leading at 43%, followed by solar thermal 27%, wind turbine 20% and hybrid 10% sources [59].
Comparing fossil fuel-based conventional desalination plants, the cost of producing water from solar-based desalination processes is still relatively high due to solar module and collector costs [66]. These costs can, however, be offset by environmental benefits. Table 3 summarizes freshwater costs when the desalination systems are fed by conventional and renewable energy sources. The use of RO membrane technology integrated with solar energy brings costs closer to those of conventional desalination processes [16].
In this context, PSPP-RO is considered one of the most promising forms of desalination applying renewable energy, especially when it is used in remote areas where brackish water has a lower osmotic pressure than sea water, thus requiring less energy [64,68].
One of the barriers to PVSS expansion is the availability of the area required for installation. As a general rule, to operate a small BWRO plant with a capacity of 1 m3/day, with a total specific energy consumption of 8 KWh/m3, the PSPP installation requires a 26.5–28 m2 area [16]. Studies such as [69] present RO solar desalination systems, with off-grid PVSSs, as a viable techno-economical and sustainable solution for drinking water supply.
A hybrid system using solar and wind energy in the supply of energy to the desalination processes is evaluated in [70]. The system has a very flexible design and allows users to adjust the ratio between the wind machine size (diameter) and solar still, depending on climate conditions. This system has the appeal of operating day and night, with an efficiency that can be three to four-fold greater than conventional solar distillers. According to [71,72,73]. This option of combining more than one renewable energy source to exploit the strengths of one technology and to cover the weaknesses of another is more advisable and reliable, improving the economic and environmental aspects of desalination plants, and reducing intermittence effects [74]. For hybrid systems, where one of the sources is the PVSS, the choice of an on-grid/inverter option is the best alternative for energy generation during the desalination process, compared to the generator/battery system, where the possibility of surrendering excess electricity to the grid by means of some compensation is also noted [17].
Regarding energy consumption for the desalination process, the water industry consumes about 2% to 3% of the global energy demand [75], which seriously influences water costs during the process [76].
By 2018, over 150 countries will produce 38 billion cubic meters of desalinated water per year from 18,000 desalination units. By 2030, this output is expected to grow by 54 billion cubic meters per year, consuming 0.4% of global electricity, i.e., 75.2 TWh per year, and the main factors of this increase in demand are population growth and economic development [77]. The Middle East leads in desalination capacity, at 52%, followed by North America (16%), Europe (13%), Asia (12%), Africa (4%), Central America (3%) and Australia (0.3%) [78]. Desalination plants are expected to grow by 12–20% per year, with energy consumption being the main hurdle, accounting for 50–60% of the total costs [79].
The energy demand resulting from the desalination processes ranges from 2 to 6 kWh/m3, depending on the salinity level of the water to be processed [78]. RO technology presents energy consumption between 2–5 kWh/m3 and has the largest installed desalination capacity, of around 65% of the world’s share [80]. For a sea water RO plant, the demand for electric power is on the order of 3.5 kWh/m3, while in smaller installations and remote locations energy consumption can increase to 3–7 kWh/m3. For the BWRO system, consumption drops to below 2.5 kWh/m3. This is due to the lower salinity, which allows less pressure to be applied, with higher water recovery [76,81,82,83].
Desalination of brackish water by RO is a viable alternative for BS. However, it is imperative to advance knowledge on brine management, as this is one of the main challenges in this process. Conventional methods for brine management in systems that do not use ocean waters include: (i) brine disposal, including surface water discharges, domestic sewage disposal and deep well injections; (ii) use in the irrigation of crops adapted to brackish water; (iii) use of brine treatment techniques for storage and disposal, (iv) the zero liquid discharge technique (ZLD), which completely avoids liquid waste emissions and allows for water and salt recoveries [84], (v) thermally driven evaporation systems and crystallization (a solid-liquid separation technique from the formation of solid crystals through a homogeneous solution) [34,76].
The RO technique will probably prevail over others, especially due to the current low energy cost and ongoing technological changes. In future terms, the energy consumption for medium and large desalination plants expected for 2021 ranges from 2.8 to 3.2 KWh/m3 [76].

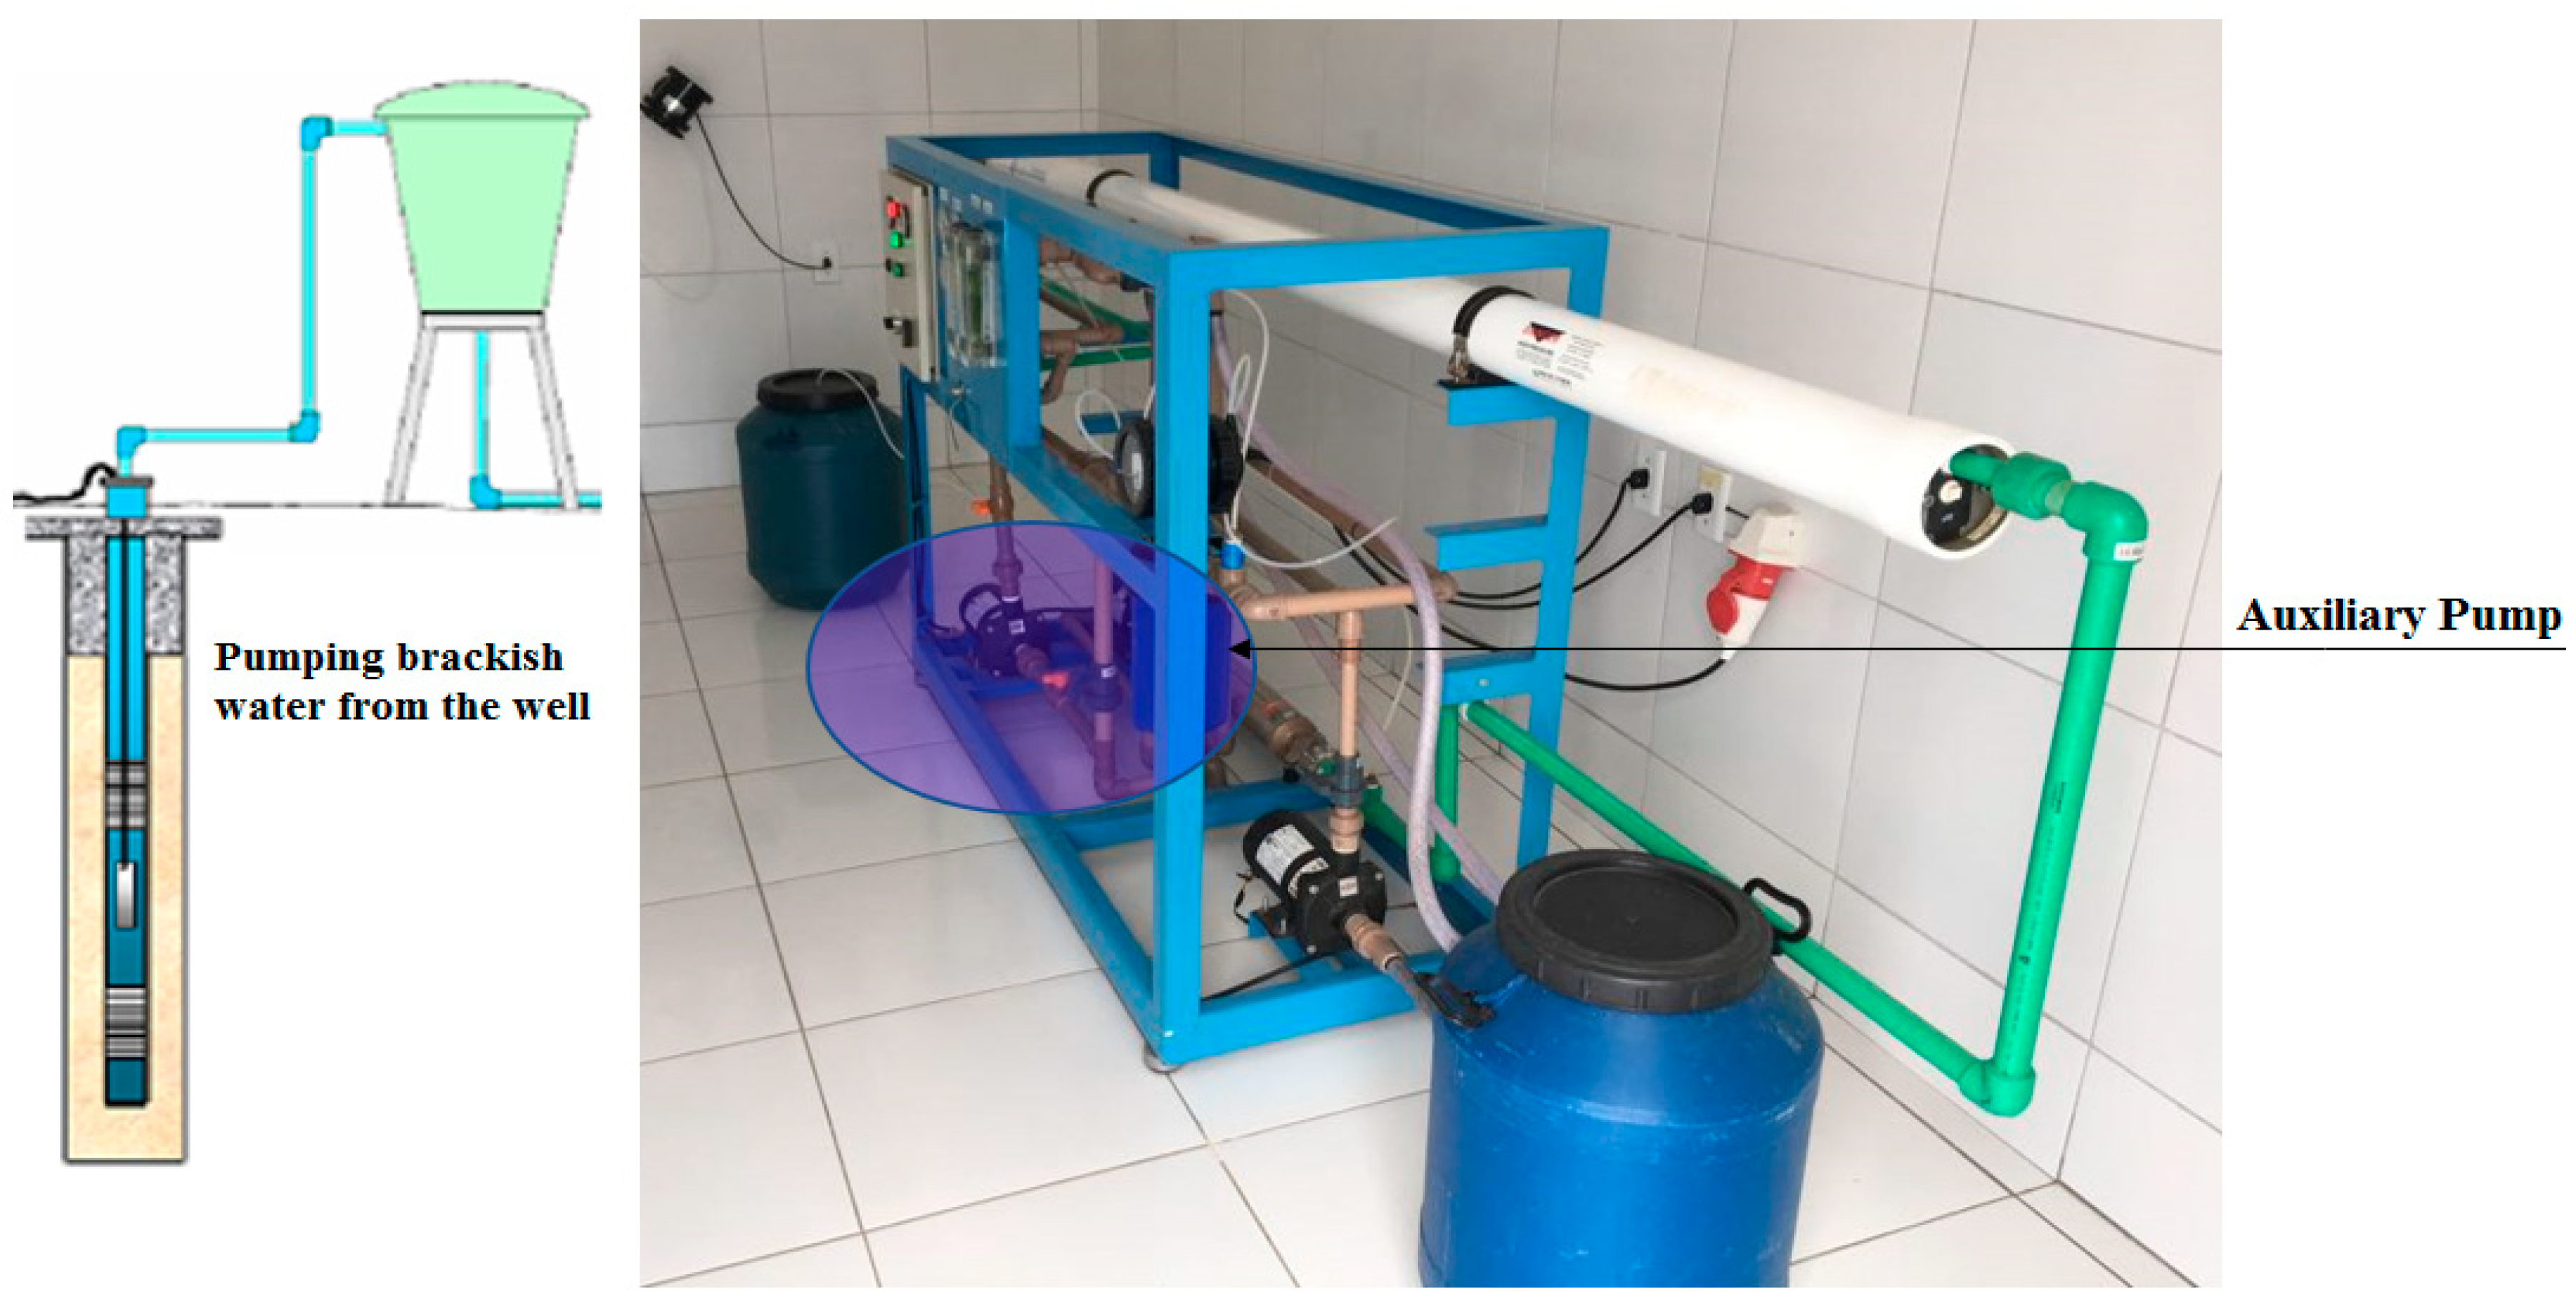
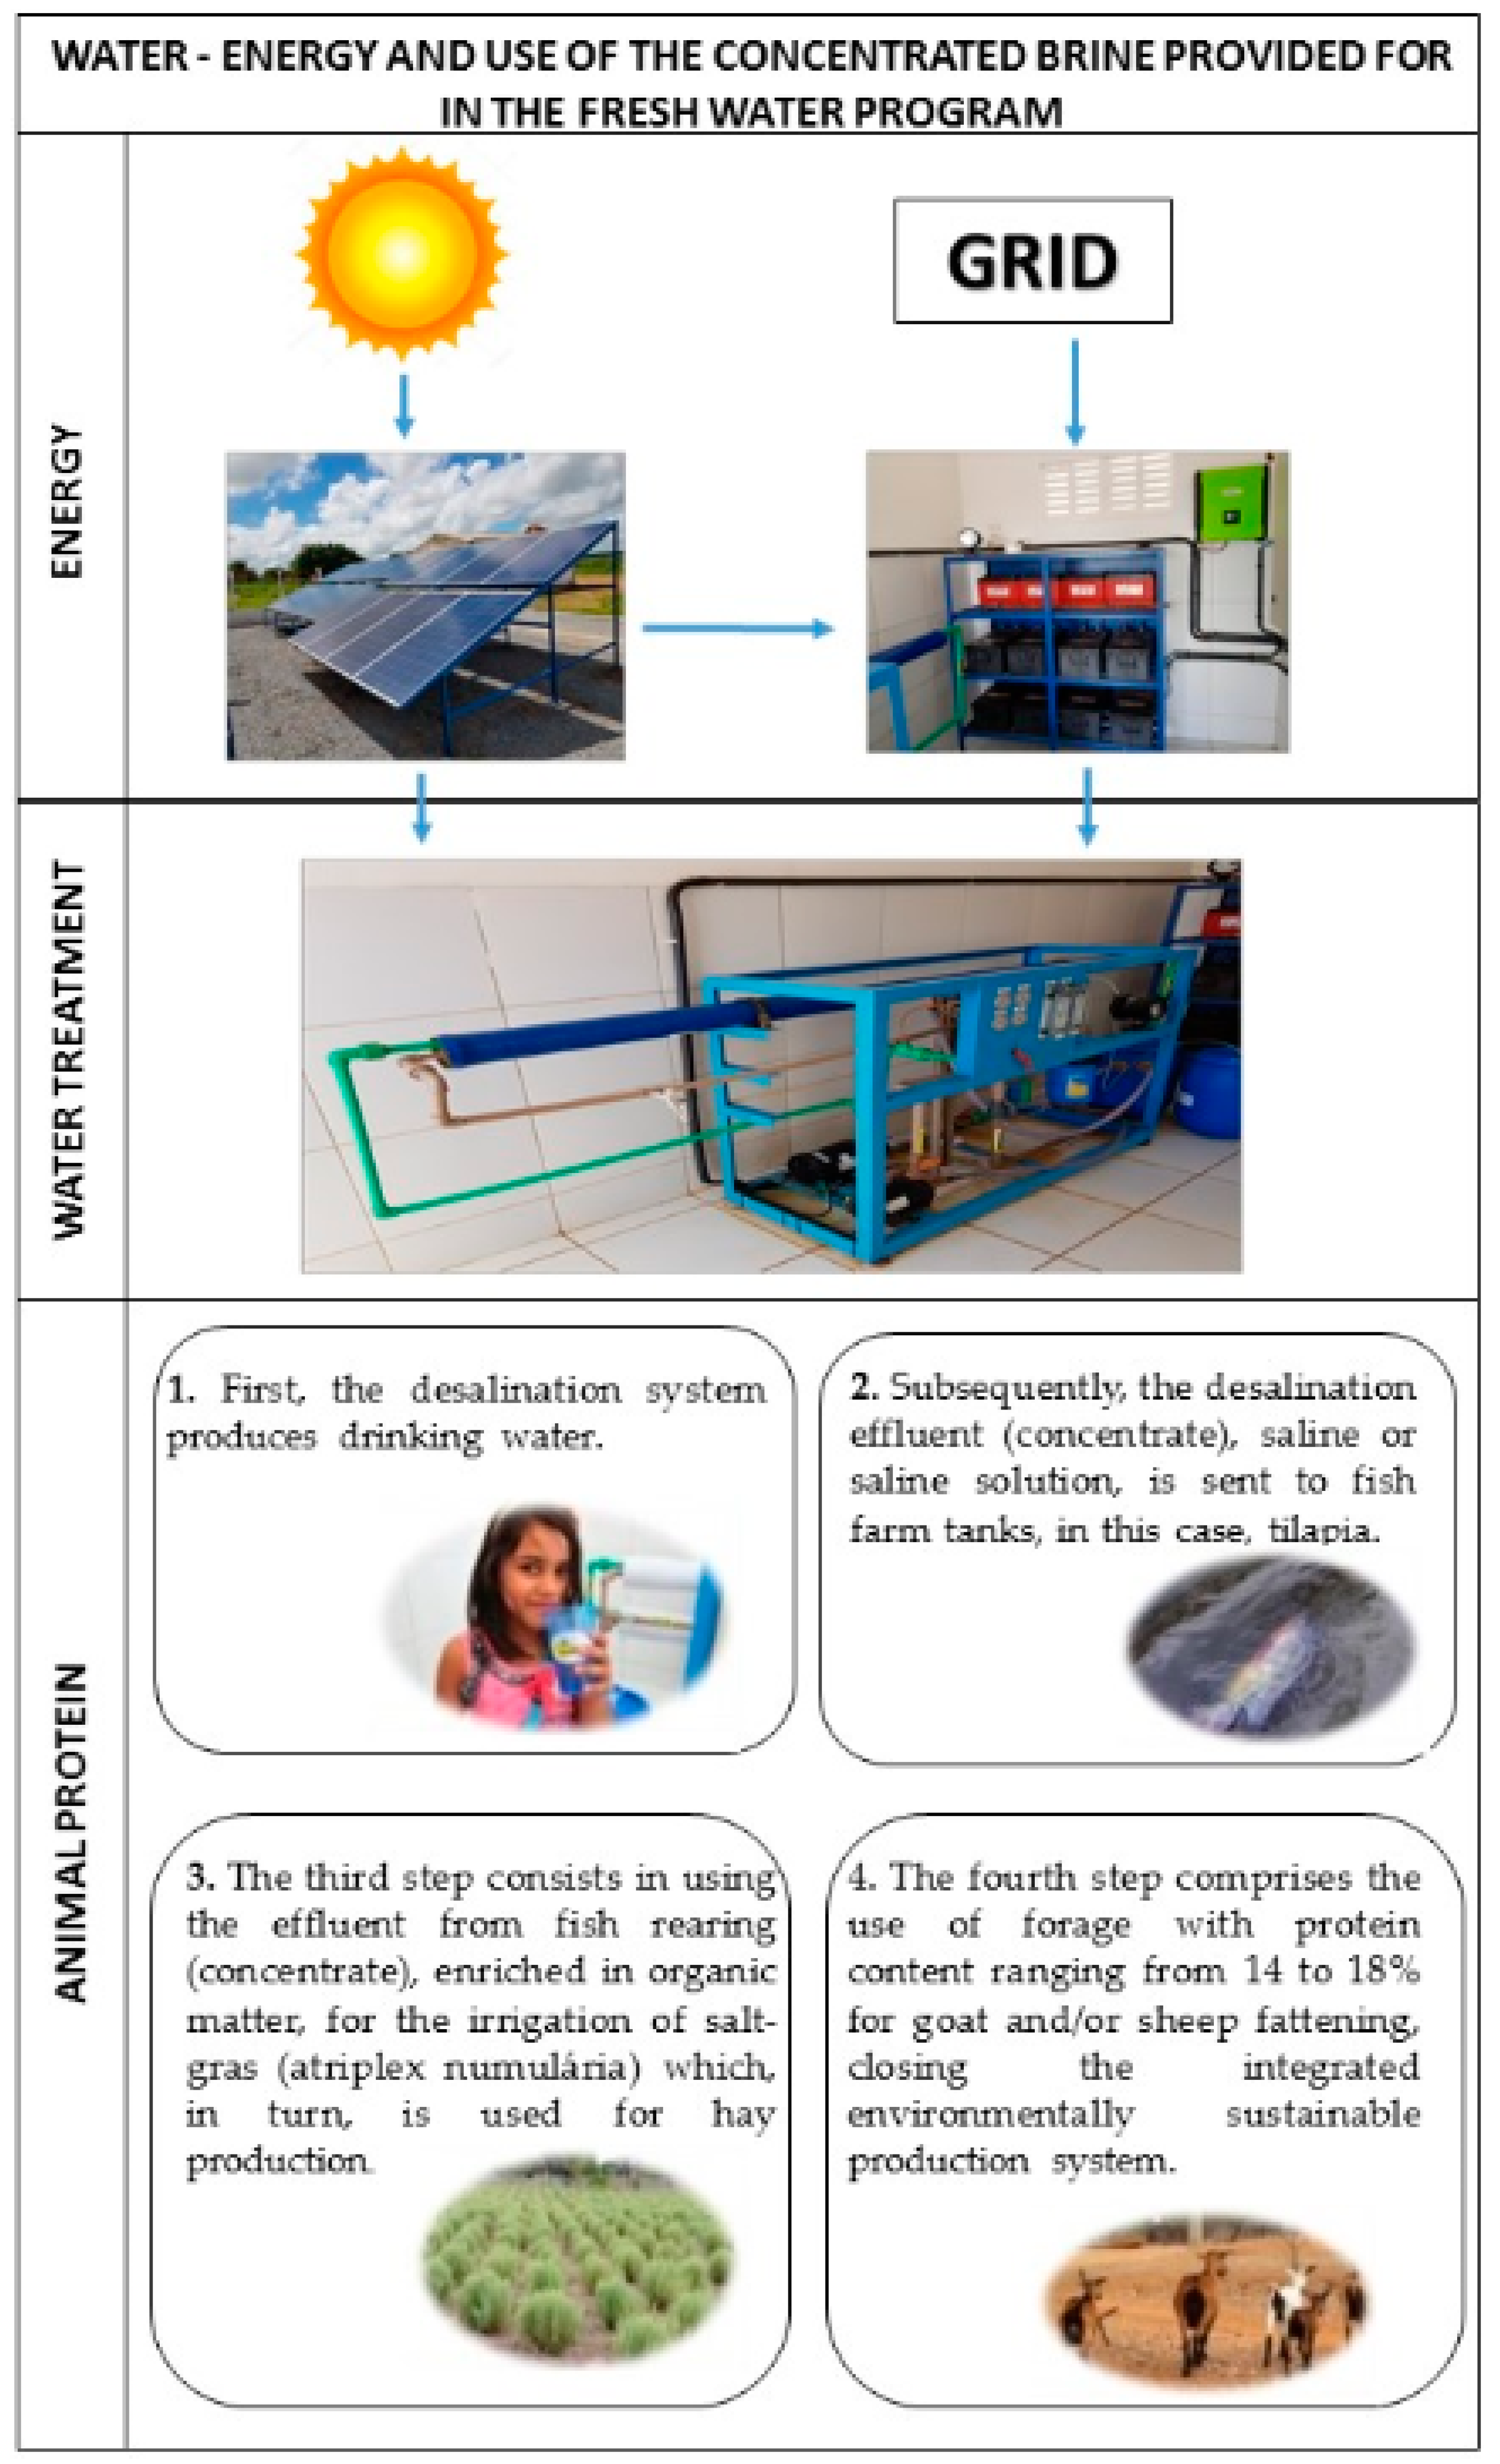
5. Desalination System in the PAD: Use of Solar Energy and Productive Units for Concentrate Use

The energy demanded for water production by desalination must be offered sustainably, thus guaranteeing the reduction of possible environmental impacts [85]. Because of this, the water-energy nexus points to the use of renewable sources available in local areas, as well as the efficient management of the generated waste (concentrate). Water and energy consumption cannot be disconnected, since they display a direct dependence [86]. From this perspective, the analysis of these links should be able to: (i) identify ideal locations for desalination use; (ii) consider infrastructure investments, accounting for existing assets and (iii) assess the best allocation of water and energy investments [87].
Considering that the PAD is located in a region with high, low variability, solar irradiation, a determining characteristic for a better integration of PVSS potential for desalination systems, and contradictorily, its structure does not register the use of renewable energy sources, efforts must be carried out so as not to neglect the importance and attractiveness of using the solar photovoltaic potential of the region. This is so decisive that a pilot project was implemented within the PAD to serve as a learning model in the adoption of renewable energy sources to meet the electric demand of desalination systems at the Maria da Paz community, located in the municipality of João Câmara, in the state of Rio Grande do Norte, according to data displayed in Table 4.
The PAD pilot project includes the installation of a PSPP/BWRO system, with an installed power of 5.46 KW, to promote water access to 45 families in this community. To meet the energy consumption and the demand of 1.8 m3/day, the required area is of 35.2 m2—a 19.5 m2 per cubic meter ratio of water for human consumption, lower than those reported in [16]. The PSPP system can be connected to the grid (on-grid) it be used in isolation (off-grid), with a set of batteries for energy storage. In addition, a power selector switch is available which, in the case of prolonged rains, overcast weather, generation system defects or other situations that make it impossible to use the photovoltaic generation system, changes the power of the system or conects it to the electric distribution network of the concessionaire [52].
The PAD pilot project is more comprehensive than the options evaluated by [17] as, besides contemplating the PSPP/on-grid/inverter system, it also consists in a battery pack, so that it also works off-grid, being able to complement 100% of the demanded energy during 10 h. However, the existence of a grid access could eliminate the need to contemplate the use of batteries in the process, which would reduce costs.
Regarding the desalination process, weighted concerns comprise the possibility of increasing the salinity of the wells that supply water to BWRO systems [88], which, in case the correct disposal of the effluent (concentrate) does not happen, will be rendered unproductive. In this context, another point to be highlighted, this time foreseen in the PAD design, is the use of effluents in a productive system contemplating fish farming and farming. This action minimizes environmental impacts while at the same time contributing to food security and income generation to cover operating and maintenance system costs. To apply this practice, the program structured a model with a Production Demonstration Unit [50]. In this model, the concentrate is stored in a reservoir to be sent to fish farming nurseries and containment tanks for animal drinking as well as for the irrigation of agricultural crops for animal fattening. The process takes place as follows:
(1)
Drinking water is produced by the desalinator;
(2)
The residue from the desalination process is used in tiapia-rearing tanks;
(3)
The pisciculture residue is used in Atriplex cultivation;
(4)
The fodder produced during the process is used for sheep and goat feeding.
Productive tilapia cycles are aimed at supplying protein to the community and generating income in order to maintain the system. A Demonstration Unit to serve as a model for concentrate use in the aforementioned productive activities was installed at the Caatinga Grande settlement, located in the municipality of São José do Seridó, in the state of Rio Grande do Norte. In 2018, this Demonstration Unit guaranteed a water supply of 4 m3/day, benefiting about 87 families. The unit also provides for two fish farming tanks, with a total production capacity of 1.5 tons per cycle, as displayed in Table 5, which presents data from the Caatinga Grande demonstration unit.
A total of 1.2 tons of tilapia were sold during the first productive fish cycle, recorded in 2018, resulting in the amount of US $1483.92, of which 75% were applied in a reserve fund to maintain the system, while the remaining amount was divided among the participants involved in the process. In this context, the use of desalinator effluent in fish farming performed well. Because it is rich in nutrients, such as potassium, nitrogen and phosphorus, originated from well water, the effluent may also be used in agricultural activities in substitution of fertilization, in the form of fertigation [89]. Figure 5 displays the interaction of the PAD with a solar source through PSPP and the destination of the desalination process residue in productive units.

6. PSPP System for Electric Demands

Based on the experience of the Maria da Paz pilot project, which makes use of PSPP, the power installed at the PSPP required to meet the electrical demands for desalination system operations within the PAD scope was calculated, considering two scenarios: (i) an installed demand supply in the PAD in September 2017 of 5 MWh/m3·day, totaling 460 systems and a 1500 m3 supply [10]; (ii) the total installed demand for the DBP, 13.5 MWh/m3, or 1209 systems and an offer of 4000 m3.
The values for the energy temperature coefficient, PV module temperature and module temperature under STC were weighed according to the requirements stipulated by the Secretariat of Environment and Water Resources [18]. Other data considered the following:
  • Median average solar irradiance in an inclined plane with an angle equal to the latitude detected in the stations closest to the communities already contemplated by the PAD, at a value of 5.54 KWh/m2·day [19];
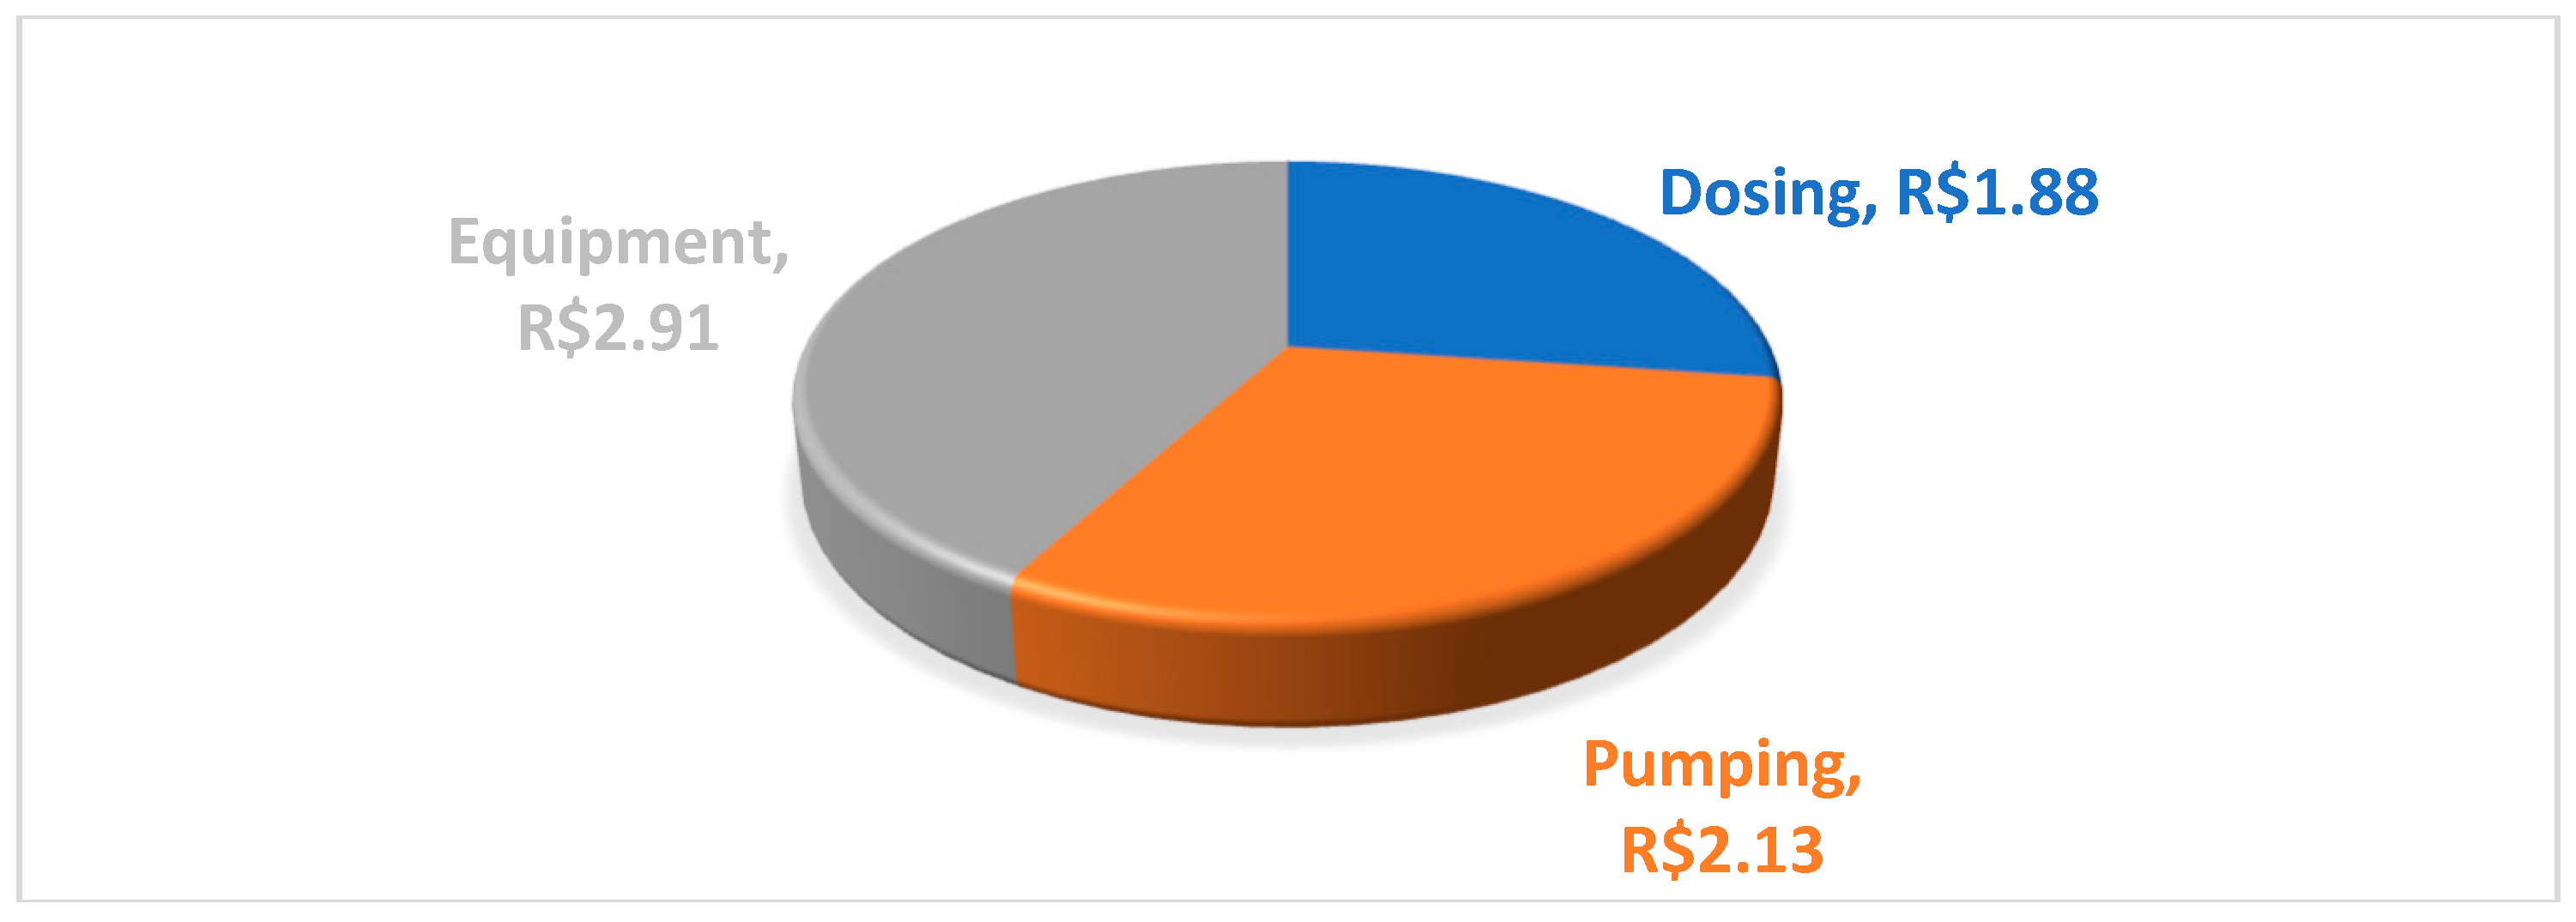
  • An average energy consumption of 3.39 Kwh/m3 was considered in the simulation, by using the WinFlow software, from the total operating cost of the PAD desalination system and within the range presented by [76] for smaller BWRO system installations;
  • A system efficiency loss of 0.5% per year over a span of 25 years;
  • 320 Wp power modules without tracking systems;
  • Concerning the total PAD demand, a universe of 500 thousand people was considered, i.e., approximately 100 thousand families, and a daily water consumption of 40 L per family.
By using the constant equation in [17] to determine the power to supply a demand of approximately 5 MWh/m3·day and 13.5 MWh/m3·day for current and future consumption in the PAD context, respectively. The estimate of this installed power PSPP reached approximately 3.4 MW and 9.06 MW, or 10,625 and 28,313,320 Wp panels, respectively, with an average power of approximately 7.38 KW and 7.54 KW per desalination system, respectively.
Compared to another federal government initiative, the São Francisco River integration project, the largest water infrastructure project in the country, the PAD is able to reach more states and anticipate an initial cost per lower beneficiary per inhabitant, according to Table 6.

7. Discussion

The feasibility of using the waste generated in the BWRO System in fish breeding and Atriplex cultivation productive units through the PAD also allows for mitigation of the environmental impacts attributed to this waste, an animal protein supply for the community and important for increasing feed safety. This model can be taken to other semi-arid regions, since the Atriplex adapts easily to arid and semi-arid environments, while tilapia are easily grown in different salinity environments. It should be noted that adoption of this productive model should be evaluated in the face of possible adverse impacts, which can be derived from increased soil salinity, reducing the agricultural cultivation areas and those destined for livestock. In the case of the systems evaluated herein, due to the size of the growing area and the sizes of the herds involved, these possible damages are minimized to the point where they are not considered. The applied plant species mitigate soil salinization in the long term. During cultivation, the mineral salts levels in the soil are reduced.
Regarding the water-energy nexus, the PAD has begun making efforts in order not to neglect the appeal of using the solar photovoltaic potential of the Brazilian semi-arid region through the pilot project installed at the Maria da Paz community with an on-grid PSPP integrated to a set of batteries, with installed power of 5.46 KW for a water demand of 1.8 m3/day.
The origin the PSPPs requires care, as the PAD imported plants from China and Malaysia, countries that present high emission factors in their electrical matrix. Promoting sustainable development by encouraging the use of photovoltaic systems should prioritize the importation from countries whose electric matrix present low emission factors in terms of greenhouse gas (GHG) concentration impacts, in order to avoid indirect imports of significant amounts of embedded carbon [92]. Another point is the use of batteries; as the PAD provides access to the grid for desalination system installation, their use to store energy could be waived, which would reduce costs. On the other hand, batteries could be used for the PAD to also reach off-grid communities, expanding its area coverage. The BS region has high solar irradiation, according to Figure 1, where PVSSs can be integrated alongside strategies to supply the electrical demands of the region associated to the operation of all the PAD desalination systems.
In addition to the use of solar energy for brackish water desalination, other potentials may also be highlighted regarding improvements in the water supply at BS. In areas near the coastal zone, the use of seawater desalination through reverse osmosis membrane technology (SWRO) may be attractive, for example. In addition, a high wind potential is observed in the northeast coast, with greater emphasis on the coasts of Ceará and Rio Grande do Norte, where an alternative could comprise SWRO integration with wind power sources [93].
In terms of sea water use in the RO desalination processes, the total electricity generation from wind power in the Brazilian Northeast in 2017 was of 35,629 GWh (84% of the total generated in the country), exceeding the sum of the total annual energy demand of some of the large SWRO plants installed in other countries, such as Israel, USA (California), Australia and Spain, displayed in Table 7.
These countries have similar climatic characteristics, with part of their territories presenting a semi-arid climate and low water availability. In other regions of the planet, such as China, seawater desalination is now being highly encouraged and is becoming a critical water supply alternative for cities suffering from serious water scarcity [99]. In south-eastern Spain, the importance and role of non-conventional water resources, such as desalination, was important in achieving territories that are more resilient to climate change and less vulnerable to drought, not only during dry periods but also as an available resource to take into account during normal rainfall years [100]. Desalination has not only become a strategic water resource of vital importance during drought situations, but it is increasingly configured as an ordinary urban supply source in coastal areas of the European Mediterranean [101]. In Low Population Wadi Communities, the Kingdom of Saudi Arabia, [102] presents an economic analysis of water supplying through the use of managed aquifer recharge (MAR) for storage and a polishing treatment of highly treated domestic wastewater as a significant method to minimize costs of safe drinking supplies and irrigation water to rural areas in arid lands.
Desalination is considered a technique with high water supply potential and can be an emerging alternative as a freshwater supply in Brazil. The increase of the capacity also increases energy consumption and greenhouse gas (GHG) emissions and, in this context, new studies can investigate energy efficiency, the biological and physical effects of brine discharges and GHG emissions in the desalination processes.

8. Conclusions

The availability of quality water to all populations has been one of the greatest global challenges faced by national states in this century. In poor countries or emerging economies such as Brazil, this challenge is even more relevant, since access to clean water is not universalized. The present study agrees that the socioeconomic BS problem does not result from droughts, but is in fact the result of a historical-structural formation related to an asymmetric process at the national level, comprising the adoption of new techniques and technologies prioritizing the Brazilian South and Southeast, which that can only be overcome by structural transformations, in which investments to improve water supply can stimulate regional socioeconomic development and reduce inequalities. In this context, the adoption of techniques and/or technologies that allow the use of other water sources, such as brackish water in the crithotinal basement, becomes of national interest.
The paper, as a contribution of its authors, investigates whether the evaluated model (BWRO) associated to renewable energy sources, alongside the prediction of the waste (concentrate) destination to productive units, promotes the sustainable use of water, the reduction of water vulnerability in semi-arid areas.
The evaluated alternative technology favors the establishment of a relationship that values the connection between the water supply and its required energy, allowed for the promotion of the integrated use of resources and the improvement of the environmental relations established in this context. This option, in addition to being a measure of adaptation to climate change, is also in line with the United Nations World Report on Water Resources Development 2018. Thus, this article is based on the hypothesis that the use of the Reverse Fresh Water Osmosis System (BWRO) associated to renewable energy sources, alongside the prediction of the waste (concentrate) destination to productive units, is a socio-environmentally adequate alternative to diversify existing supply strategies.
This study reports on the PAD, a permanent public good-quality water access policy for human consumption through the BWRO system, to serve low income populations in diffuse semi-arid communities. The PAD contemplates a pilot project to serve as a learning model for the efficient and sustainable management of energy and water at the Maria da Paz community in the municipality of João Câmara in the state of Rio Grande do Norte, Brazil, with an on-grid PSPP integrated to a set of batteries. It also predicts the use of residues generated in the BWRO system in productive units for tilapia farming and Atriplex use for fattening animals. The first demonstration unit was implemented at the Caatinga Grande community, located in the municipality of São José do Seridó in the state of Rio Grande do Norte.
The installed power required to use the PVSS technology was proposed herein, aiming to supply the electric demand for the operation of the PAD desalination systems, considering two scenarios: (i) 460 systems and a 1500 m3 supply; and (ii) 1200 systems and a 4000 m3 supply, with estimated PVSS power capacity reaching approximately 3.4 MW and 9.06 MW, respectively. The PVSS technology is aligned with the use of the BS solar energy appeal, as the region presents one the highest solar irradiations in the country, which can exceed 6 KWh/m2·day and 2000 kWh/m2·year in part of the territory, a natural characteristic that highlight the energy potential of the region.

Author Contributions

Data curation, investigation, and methodology, R.G.C.J. Supervision, M.A.V.F. Writing—original draft, R.G.C.J. Writing—review and editing, N.F.d.S. and F.R.d.A.F.

Funding

This research received no external funding.

Acknowledgments

The authors would like to thank the SEMARH—Secretary of State for Environment and Water Resources of Rio Grande do Norte and Fresh Water Program, belonging to the Brazilian Ministry of the Environment.

Conflicts of Interest

The authors declare no conflict of interest.

References

  1. UN-WWAP. The United Nations World Water Development Report 2015: Water for a Sustainable World; UN-WWAP: Perugia, Italy, 2015; ISBN 978-9-23-100071-3. [Google Scholar]
  2. Melorose, J.; Perroy, R.; Careas, S. World Population Prospects; United Nations: San Francisco, CA, USA, 2015; Volume 1, pp. 587–592. [Google Scholar]
  3. IEA. World Energy Outlook 2015; IEA: Paris, France, 2015; ISBN 978-9-26-424366-8. [Google Scholar]
  4. IPCC. AR5 Climate Change 2014: Impacts, Adptation, and Vulnerability. Available online: https://www.ipcc.ch/report/ar5/wg2/ (accessed on 15 June 2017).
  5. ANA—Agência Nacional de Águas. Conjuntura dos recursos hídricos no Brasil 2017: Relatório pleno. Conjunt. Recur. Hídricos Bras. 2017, 2017, 169. [Google Scholar]
  6. Yang, X.; Williams, M. Landforms and processes in arid and semi-arid environments. Catena 2015, 134, 1–3. [Google Scholar] [CrossRef]
  7. ANA—Agência Nacional de Águas. Superintendência de Planejamento de Recursos Hídricos Conjuntura dos Recursos Hídricos no Brasil—Informe 2014—Encarte Especial sobre a Crise Hídrica; ANA: Brasília, Brasil, 2015; Volume 30. [Google Scholar]
  8. Buriti, C.; Aguiar, J. O Tempo e a Cultura da Natureza: Uma análise das sensibilidades dos escritores regionais em relação ao semiárido do Nordeste brasileiro. Histórica Rev. Eletrônica Arq. Público Estado São Paulo 2009, 38. Available online: http://www.historica.arquivoestado.sp.gov.br/materias/anteriores/edicao38/materia05/ (accessed on 15 June 2017).
  9. Araujo, T. Economia do semiárido nordestino: A crise corno oportunidade. Revista coletiva 2012, 6, 1–4. [Google Scholar]
  10. Samuel, A.S.; Felipe, C.R.; Hermes, C.; Moura, A.; Henrique, L.; Ferreira, R.S.; Ll, B. Sustainable Desalination Process: Fresh Water Program; International Desalination Association: São Paulo, Brazil, 2017. [Google Scholar]
  11. Wwap, World Water Assessment Proframme. The United Nations World Water Development Report 2018: Nature-Based Solutions for Water; United Nations: Paris, France, 2018. [Google Scholar]
  12. Nair, S.; George, B.; Malano, H.M.; Arora, M.; Nawarathna, B. Water-energy-greenhouse gas nexus of urban water systems: Review of concepts, state-of-art and methods. Resour. Conserv. Recycl. 2014, 89, 1–10. [Google Scholar] [CrossRef]
  13. Franchini, G.; Perdichizzi, A. Modeling of a solar driven HD (humidification-dehumidification) desalination system. Energy Procedia 2014, 45, 588–597. [Google Scholar] [CrossRef]
  14. California Department of Water Resources. California Water Plan Volume 3—Resource Management Strategies Desalination (Brackish and Sea Water); California Department of Water Resources: Sacramento, CA, USA, 2013; Volume 3.
  15. Balaban, N. Desalination 1966–2016, The origins, evolution and role of the Desalination Journal. Desalination 2017, 401, xvi–xx. [Google Scholar]
  16. Shatat, M.; Worall, M.; Riffat, S. Opportunities for solar water desalination worldwide: Review. Sustain. Cities Soc. 2013, 9, 67–80. [Google Scholar] [CrossRef]
  17. Ghenai, C.; Merabet, A.; Salameh, T.; Pigem, E.C. Grid-tied and stand-alone hybrid solar power system for desalination plant. Desalination 2018, 435, 172–180. [Google Scholar] [CrossRef]
  18. SEMARH—Secretaria de Meio Ambiente e Recursos Hídricos do Rio Grande Norte. Pregão Eletrônico N.o 02/2017; SEMARH: Natal, Brazil, 2017; pp. 1–63.
  19. CEPEL—Centro de Pesquisas de Energia Elétrica. Centro de referência para Energia Solar e Eólica Sérgio Brito. 2018. Available online: http://www.cresesb.cepel.br/ (accessed on 30 September 2018).
  20. UNEP—United Nations Environment Management Group. Global Drylands: A UM System-Wide Response; United Nations Environment Management Group: Geneva, Switzerland, 2011. [Google Scholar]
  21. Zhang, J.; Ren, W.; An, P.; Pan, Z.; Wang, L.; Dong, Z.; He, D.; Yang, J.; Pan, S.; Tian, H. Responses of crop water use efficiency to climate change and agronomic measures in the semiarid area of Northern China. PLoS ONE 2015, 10, e0137409. [Google Scholar] [CrossRef]
  22. Maleki, S.; Khormali, F.; Bodaghabadi, M.B.; Mohammadi, J.; Kehl, M. Geological controlling soil organic carbon and nitrogen density in a hillslope landscape, semiarid area of Golestan province, Iran. Desert 2017, 2, 221–228. [Google Scholar]
  23. Lopez-Gunn, E.; Zorrilla, P.; Prieto, F.; Llamas, M.R. Lost in translation? Water efficiency in Spanish agriculture. Agric. Water Manag. 2012, 108, 83–95. [Google Scholar] [CrossRef]
  24. Brasil, Ministério do Desenvolvimento Regional. Delimitação do semiárido. Available online: http://sudene.gov.br/planejamento-regional/delimitacao-do-semiarido (accessed on 15 June 2017).
  25. ANA—Agência Nacional de Águas. Mudanças Climáticas E Recursos Hídricos—Avaliações E Diretrizes Para Adaptação; Gges, G.G., Ed.; Agência Nacional de Águas: Brasília, Brazil, 2016; Volume 1, ISBN 978-8-57-811079-6.
  26. De Nys, E.; Engle, N.L.; Magalhães, A.R. Secas no Brasil: Política e Gestão Proativas; Centro de Gestão e Estudos Estratégicos-CGEE: Brasília, Brazil, 2016; ISBN 978-8-55-569115-7.
  27. Rodriguez, R.D.G.; Pruski, F.F.; Singh, V.P. Estimated Per Capita Water Usage Associated with Different Levels of Water Scarcity Risk in Arid and Semiarid Regions. Water Resour. Manag. 2016, 30, 1311–1324. [Google Scholar] [CrossRef]
  28. Williams, W.D. Salinisation: A major threat to water resources in the arid and semi-arid regions of the world. Lakes Reserv. Res. Manag. 1999, 4, 85–91. [Google Scholar] [CrossRef]
  29. Scanlon, B.R.; Keese, K.E.; Flint, A.L.; Flint, L.E.; Gaye, C.B.; Edmunds, W.M.; Simmers, I. Global synthesis of groundwater recharge in semiarid and arid regions. Hydrol. Process. 2006, 20, 3335–3370. [Google Scholar] [CrossRef]
  30. Oliveira, M.A.; Barbosa, E.M.; Dantas Neto, J. Gestão de recursos hídricos no rio grande do norte: Uma análise da implementação da política hídrica. HOLOS 2013, 1, 3–27. [Google Scholar] [CrossRef]
  31. PBMC. Impactos, Vulnerabilidades e Adaptação: Primeiro Relatório de Avaliação Nacional—Volume 2; Painel Brasileiro de Mudanças Climáticas: Rio de Janeiro, Brazil, 2014. [Google Scholar]
  32. Franzitta, V.; Curto, D.; Milone, D.; Viola, A. The Desalination Process Driven by Wave Energy: A Challenge for the Future. Energies 2016, 9, 1032. [Google Scholar] [CrossRef]
  33. Diniz, C.C. Celso Furtado e o desenvolvimento regional. Nova Econ. 2009, 19, 227–249. [Google Scholar] [CrossRef] [Green Version]
  34. Gude, V.G. Desalination and water reuse to address global water scarcity. Rev. Environ. Sci. Biotechnol. 2017, 16, 591–609. [Google Scholar] [CrossRef]
  35. INPE—Instituto Nacional de Pesquisas Espaciais. Laboratório de Modelagem e Estudos de Recursos Renováveis. Available online: http://labren.ccst.inpe.br/ (accessed on 10 October 2018).
  36. IBGE—Instituto Brasileiro de Geografia e Estatística. Available online: https://www.ibge.gov.br/ (accessed on 10 October 2018).
  37. ANEEL—Agência Nacional de Energia Elétrica. Available online: http://www.aneel.gov.br/ (accessed on 10 October 2018).
  38. INSA—Instituto Nacional do Semiárido. Sistema de Gestão da Informação e do Conheicmento do Semiárido Brasileiro. Available online: http://sigsab.insa.gov.br/ (accessed on 10 October 2018).
  39. Pereira, E.B.; Martins, F.R.; De Abreu, S.L.; Rüther, R. Atlas Brasileiro de Energia Solar; Inpe: São José dos Campos, Brazil, 2017. [Google Scholar]
  40. ANEEL—Agência Nacional de Energia Elétrica. Banco de Informação de Geração. Available online: http://www2.aneel.gov.br/aplicacoes/capacidadebrasil/capacidadebrasil.cfm (accessed on 10 October 2018).
  41. ONS—Operador Nacional do Sistema. Histórico de operação. Available online: http://ons.org.br/ (accessed on 11 November 2018).
  42. IPCC. Climate Change 2014 Synthesis Report Summary Chapter for Policymakers; IPCC: Geneva, Switzerland, 2014; Volume 31. [Google Scholar]
  43. PBMC. Mudanças Climáticas e Cidades; Painel Brasileiro de Mudanças Climáticas: Rio de Janeiro, Brazil, 2016. [Google Scholar]
  44. Delgado, E.; Fortes, A.; Massaru, A.; Pavão, E.; Pellegrino, G.; Monteiro, J.E. Impactos e Vulnerabilidades da Agricultura Brasileira às Mudanças Climáticas; Ministério da Ciência, Tecnologia e Inovação: Brasília, Brazil, 2016; ISBN 978-8-58-806330-3.
  45. CGEE—Centro de Gestão e Estudos Estratégicos. Estudos Relativos às Mudanças Climáticas e Recursos Hídricos para Embasar o Plano Climáticas. Eixo 1—Cenários de Mudanças para Estudos de Adaptação no Setor de Recursos Hídricos; CGEE: Fortaleza, Brazil, 2014. [Google Scholar]
  46. Marengo, J.A. Mudanças Climáticas Globais e seus Efeitos sobre a Biodiversidade: Caracterização do Clima Atual e Definição das Alterações Climáticas para o Território Brasileiro ao Longo do Século XXI. Série Biodivers. 2007, 26, 212. [Google Scholar]
  47. Marengo, J.A.; Torres, R.R.; Alves, L.M. Drought in Northeast Brazil—Past, present, and future. Theor. Appl. Climatol. 2017, 129, 1189–1200. [Google Scholar] [CrossRef]
  48. De Jong, P.; Tanajura, C.A.S.; Sánchez, A.S.; Dargaville, R.; Kiperstok, A.; Torres, E.A. Hydroelectric production from Brazil’s São Francisco River could cease due to climate change and inter-annual variability. Sci. Total Environ. 2018, 634, 1540–1553. [Google Scholar] [CrossRef] [PubMed]
  49. Brasil, Ministério do Meio Ambiente. Programa Água Doce: Documento base; MMA: Brasília, Brazil, 2012; Volume 324.
  50. Brasil, Ministério do Meio Ambiente. Available online: http://www.mma.gov.br/ (accessed on 11 November 2018).
  51. Brasil, Ministéria da Saúde. Portaria 2914/2011. Diário União 2011, 2011, 1–16. Available online: http://bvsms.saude.gov.br/bvs/saudelegis/gm/2011/prt2914_12_12_2011.html (accessed on 11 November 2018).
  52. SEMARH—Secretaria de Meio Ambiente e Recursos Hídricos do Rio Grande Norte. Available online: www.semarh.rn.gov.br (accessed on 10 October 2018).
  53. Hanasaki, N.; Yoshikawa, S.; Kakinuma, K.; Kanae, S. A seawater desalination scheme for global hydrological models. Hydrol. Earth Syst. Sci. 2016, 20, 4143–4157. [Google Scholar] [CrossRef]
  54. Bremere, I.; Kennedy, M.; Stikker, A.; Schippers, J. How water scarcity will effect the growth in the desalination market in the coming 25 years. Desalination 2001, 138, 7–15. [Google Scholar] [CrossRef]
  55. Ghaffour, N.; Reddy, V.K.; Abu-Arabi, M. Technology development and application of solar energy in desalination: MEDRC contribution. Renew. Sustain. Energy Rev. 2011, 15, 4410–4415. [Google Scholar] [CrossRef]
  56. Ziolkowska, J.R. Is Desalination Affordable?—Regional Cost and Price Analysis. Water Resour. Manag. 2014, 29, 1385–1397. [Google Scholar] [CrossRef]
  57. Eltawil, M.A.; Zhao, Z. Renewable Energy Powered Desalination Systems: Technologies and Economics-State of the Art. In Proceedings of the Twelfth International Water Technology Conference, Alexandria, Egypt, 27–30 March 2008; pp. 1–38. [Google Scholar]
  58. Mabrouk, A.N.; Fath, H.E.S. Technoeconomic study of a novel integrated thermal MSF-MED desalination technology. Desalination 2015, 371, 115–125. [Google Scholar] [CrossRef]
  59. Shahzad, M.W.; Burhan, M.; Ang, L.; Ng, K.C. Energy-water-environment nexus underpinning future desalination sustainability. Desalination 2017, 413, 52–64. [Google Scholar] [CrossRef]
  60. Isaka, M. Water Desalination Using Renewable Energy. Int. Renew. Energy Agency 2012, l12, 1–3. [Google Scholar]
  61. Gude, V.G.; Nirmalakhandan, N.; Deng, S. Renewable and sustainable approaches for desalination. Renew. Sustain. Energy Rev. 2010, 14, 2641–2654. [Google Scholar] [CrossRef]
  62. Manju, S.; Sagar, N. Renewable energy integrated desalination: A sustainable solution to overcome future fresh-water scarcity in India. Renew. Sustain. Energy Rev. 2017, 73, 594–609. [Google Scholar] [CrossRef]
  63. Gude, V.G. Desalination and sustainability—An appraisal and current perspective. Water Res. 2016, 89, 87–106. [Google Scholar] [CrossRef] [PubMed]
  64. Al-Karaghouli, A.A.; Kazmerski, L. Renewable Energy Opportunities in Water Desalination. In Desalation Trends Technologies; IntechOpen: London, UK, 2011; pp. 149–194. [Google Scholar]
  65. Ali, M.T.; Fath, H.E.S.; Armstrong, P.R. A comprehensive techno-economical review of indirect solar desalination. Renew. Sustain. Energy Rev. 2011, 15, 4187–4199. [Google Scholar] [CrossRef]
  66. Zhang, Y.; Sivakumar, M.; Yang, S.; Enever, K.; Ramezanianpour, M. Application of solar energy in water treatment processes: A review. Desalination 2018, 428, 116–145. [Google Scholar] [CrossRef]
  67. Dominkovic, D.F.; Stark, G.; Hodge, B.M.; Pedersen, A.S. Integrated energy planning with a high share of variable renewable energy sources for a Caribbean Island. Energies 2018, 11, 2193. [Google Scholar] [CrossRef]
  68. Fiorenza, G.; Sharma, V.K.; Braccio, G. Techno-economic evaluation of a solar powered water desalination plant. Energy Convers. Manag. 2003, 44, 2217–2240. [Google Scholar] [CrossRef]
  69. Mostafaeipour, A.; Qolipour, M.; Rezaei, M.; Babaee-Tirkolaee, E. Investigation of off-grid photovoltaic systems for a reverse osmosis desalination system: A case study. Desalination 2019, 454, 91–103. [Google Scholar] [CrossRef]
  70. Al-Nimr, M.A.; Kiwan, S.M.; Talafha, S. Hybrid solar-wind water distillation system. Desalination 2016, 395, 33–40. [Google Scholar] [CrossRef]
  71. Abdelkareem, M.A.; El Haj Assad, M.; Sayed, E.T.; Soudan, B. Recent progress in the use of renewable energy sources to power water desalination plants. Desalination 2018, 435, 97–113. [Google Scholar] [CrossRef]
  72. Bajpai, P.; Dash, V. Hybrid renewable energy systems for power generation in stand-alone applications: A review. Renew. Sustain. Energy Rev. 2012, 16, 2926–2939. [Google Scholar] [CrossRef]
  73. Zoulias, E.I.; Lymberopoulos, N. Techno-economic analysis of the integration of hydrogen energy technologies in renewable energy-based stand-alone power systems. Renew. Energy 2007, 32, 680–696. [Google Scholar] [CrossRef]
  74. Tafech, A.; Milani, D.; Abbas, A. Water storage instead of energy storage for desalination powered by renewable energy—King Island case study. Energies 2016, 9, 839. [Google Scholar] [CrossRef]
  75. USAID. Watergy: Taking advantage of untapped energy and water efficiency opportunities in municipal water systems. Alliance Save Energy 2002, 11, 140. [Google Scholar]
  76. Shemer, H.; Semiat, R. Sustainable RO desalination—Energy demand and environmental impact. Desalination 2017, 424, 10–16. [Google Scholar] [CrossRef]
  77. Ng, K.C.; Shahzad, M.W. Sustainable desalination using ocean thermocline energy. Renew. Sustain. Energy Rev. 2018, 82, 240–246. [Google Scholar] [CrossRef]
  78. Khan, Z.; Linares, P.; García-González, J. Integrating water and energy models for policy driven applications. A review of contemporary work and recommendations for future developments. Renew. Sustain. Energy Rev. 2017, 67, 1123–1138. [Google Scholar] [CrossRef]
  79. Zarzo, D.; Prats, D. Desalination and energy consumption. What can we expect in the near future? Desalination 2018, 427, 1–9. [Google Scholar] [CrossRef]
  80. Burn, S.; Hoang, M.; Zarzo, D.; Olewniak, F.; Campos, E.; Bolto, B.; Barron, O. Desalination techniques—A review of the opportunities for desalination in agriculture. Desalination 2015, 364, 2–16. [Google Scholar] [CrossRef]
  81. Tenne, A. Sea Water Desalination in Israel: Planning, coping with difficulties, and economic aspects of long-term risks. Isr. Water Auth. Minist. Infrastruct. 2010, October, 1–13. [Google Scholar]
  82. Ghaffour, N.; Missimer, T.M.; Amy, G.L. Technical review and evaluation of the economics of water desalination: Current and future challenges for better water supply sustainability. Desalination 2013, 309, 197–207. [Google Scholar] [CrossRef] [Green Version]
  83. Alkaisi, A.; Mossad, R.; Sharifian-Barforoush, A. A Review of the Water Desalination Systems Integrated with Renewable Energy. Energy Procedia 2017, 110, 268–274. [Google Scholar] [CrossRef]
  84. Semblante, G.U.; Lee, J.Z.; Lee, L.Y.; Ong, S.L.; Ng, H.Y. Brine pre-treatment technologies for zero liquid discharge systems. Desalination 2018, 441, 96–111. [Google Scholar] [CrossRef]
  85. Vakilifard, N.; Anda, M.; Bahri, P.A.; Ho, G. The role of water-energy nexus in optimising water supply systems—Review of techniques and approaches. Renew. Sustain. Energy Rev. 2017, 82, 1424–1432. [Google Scholar] [CrossRef]
  86. Lee, S.W.; Sarp, S.; Jeon, D.J.; Kim, J.H. Smart water grid: The future water management platform. Desalin. Water Treat. 2015, 55, 339–346. [Google Scholar] [CrossRef]
  87. Ishimatsu, T.; Doufene, A.; Alawad, A.; de Weck, O. Desalination network model driven decision support system: A case study of Saudi Arabia. Desalination 2017, 423, 65–78. [Google Scholar] [CrossRef]
  88. Drendel, R.; Kinzli, K.D.; Koebel, A.; Missimer, T.M. Management of BWRO systems using long-term monitoring of feed water quality to avoid future membrane process failure. Desalin. Water Treat. 2016, 57, 16209–16219. [Google Scholar] [CrossRef]
  89. Grilo, J.A.; Braga, C.C.; do Vale, M.B.; de Oliveira, J.K.S.; Bezerra, R.D. Avaliação do Efluente do Dessalinizador e da Tilapicultura em São José do Seridó-Rn. HOLOS 2016, 7, 194–208. [Google Scholar] [CrossRef]
  90. Brasil, Ministério do Meio Ambiente. Available online: http://www.mma.gov.br/agua/agua-doce (accessed on 10 October 2018).
  91. Brasil, Ministério da Integração Nacional. Projeto de Integração do Rio São Francisco; Ministério da INtegração Nacional: Brasília, Brazil, 2014; Volume 8.
  92. Constantino, G.; Freitas, M.; Fidelis, N.; Pereira, M.G. Adoption of photovoltaic systems along a sure path: A life-cycle assessment (LCA) study applied to the analysis of GHG emission impacts. Energies 2018, 11, 2806. [Google Scholar] [CrossRef]
  93. Amarante, O.A.; Brower, M.; Zack, J.; Eolica, C.S.; Solutions, T. Atlas do Potencial Eólico Brasileiro; Ministerio de Minas e Energia: Brasília, Brazil, 2001. [Google Scholar]
  94. IDA. IDA Desalination Yearbook 2016–2017; IDA: Cardiff, UK, 2017. [Google Scholar]
  95. Water Technology. Available online: chttps://www.water-technology.net/ (accessed on 10 October 2018).
  96. Lambert, M. Got Desalination in Your Water Portfolio? IDE Technologies: Houston, TX, USA, 2016. [Google Scholar]
  97. Aguas Antofagasta. VI Proceso Tarifario de Concesiones de Servicios Sanitarios, II Región de Antofagasta, Período 2016–2021; ECOAGUA: Madrid, Spain, 2016. [Google Scholar]
  98. Zheng, X.; Chen, D.; Wang, Q.; Zhang, Z. Seawater desalination in China: Retrospect and prospect. Chem. Eng. J. 2014, 242, 404–413. [Google Scholar] [CrossRef]
  99. Jia, X.; Klemeš, J.; Varbanov, P.; Wan Alwi, S. Analyzing the Energy Consumption, GHG Emission, and Cost of Seawater Desalination in China. Energies 2019, 12, 463. [Google Scholar] [CrossRef]
  100. Morote, Á.-F.; Olcina, J.; Hernández, M. The Use of Non-Conventional Water Resources as a Means of Adaptation to Drought and Climate Change in Semi-Arid Regions: South-Eastern Spain. Water 2019, 11, 93. [Google Scholar] [CrossRef]
  101. Morote, Á.F.; Rico, A.M.; Moltó, E. Critical review of desalination in Spain: A resource for the future? Geogr. Res. 2017, 55, 412–423. [Google Scholar] [CrossRef]
  102. Missimer, T.M.; Maliva, R.G.; Ghaffour, N.; Leiknes, T.O.; Amy, G.L. Managed aquifer recharge (MAR) economics for wastewater reuse in low population wadi communities, Kingdom of Saudi Arabia. Water 2014, 6, 2322–2338. [Google Scholar] [CrossRef]
Figure 1. Normal direct solar irradiation and distribution of photovoltaic plants and wind farms in the Brazilian semi-arid region. Source: The Datum Sirgas 2000 coordinate system, with data sourced from [35,36,37,38].
Energies 12 00904 g001
Figure 2. Desalination system used by the PAD.
Energies 12 00904 g002
Figure 3. Total operating cost/m3. Data sourced from [52].
Energies 12 00904 g003
Figure 4. Participation of water sources in desalination processes. Data sourced from [57,58].
Energies 12 00904 g004
Figure 5. Illustration of the desalination system model operating with solar photovoltaic technology and integrated to a productive fish farming unit and irrigated forage.
Energies 12 00904 g005
Table 1. Parameters required to calculate PVSS provision.
FBenefitted families
DWater demand (m3)
LDaily water consumption per family
KConsumption (wh/m3)
WHSum of power consumption
PpvModule output power
PPV, STCPower output under standard test conditions (STC)
1ƒPVPV reduction factor
2 GIrradiation
3 GSTCSTC irradiation
4αpEnergy temperature coefficient
5T cTemperature of the photovoltaic module
6Tc,stcTemperature of the module under STC
NPNumber of required modules
1 The considered PV reduction factor is presented in [18]. 2 Average daily solar irradiance on an inclined plane with angle equal to latitude [19]. 3 1000 W/m2 was adopted herein. 4,5,6 According to the SEMARH licitation [18].
Table 2. Data for the RO membrane 1 design simulation 2 based on PAD-proposed parameters.
Raw Feed (L/h)1.525Product flow (m3/h)0.64
Product Flow (L/h)640Annual operating time (days)208
Concentrate (L/h)884Energy consumption (Kwh/m3)3.39
Membrane3Total cost42,778.19
Raw Feed TDS (mg/L)1.193Membrane cost (U$/m3)1102.94
Product TDS (mg/L)105Vessel cost (U$/m3)1225.49
Product TDS (mg/L)1.980System cost (U$/m3)40,441.18
System Recovery0.42Other costs8.58
1 Membrane with a 6-year shelf life. 2 System with a 20-year operating lifespan.
Table 3. Type of supplied energy and water production cost.
Type of Input WaterType of EnergyWater Cost (US$/m3)
Brackish waterConventional fuel0.27–1.38
Photovoltaic cells5.85–13.42
Geothermal2.6
SeawaterConventional fuel0.46–3.5
Wind energy1.3–6.5
Solar collectors4.55–10.40
Photovoltaic cells4.08–11.7
Source: Data sourced from [16].
Table 4. PSPP/BWRO System installed at the Maria DA PAZ Community.
Total Module Area (m2)35.2Fresh Water Production (L/day)1.800
1 Photovoltaic Solar Panels (245 Wp and 1.64 m2)12Electrical Energy Consumption (KWh)3
2 Photovoltaic Solar Panels (315 Wp and 1.94 m2)8Flow (m3/h)0.55
Installed Capacity (KWp)5.46Water recovery33%
Desalinization Capacity (L/H)500Operation time (days)208
Processed Raw Water (L/day)5400Operation costs (US$/m3)0.49
1 Energy Efficiency of 14.9%. 2 Energy Efficiency of 16.2%. Data sourced from [52].
Table 5. Caatinga Grande settlement PAD productive system data for 2018.
Concentrated brine Production (L/day)10,000Production cycle (month)6
Fresh Water Production (L/day)4000Nursery capacity (t)1.5
Families87Fish weight (Kg)0.5–0.7
Nurseries (tanks)2Atriplex cultivation area (m2)10,000
Data sourced from [52].
Table 6. Federal government initiatives for the water sector.
InitiativesBudgetBeneficiariesStatesPer Capita
São Francisco River Integration ProjectR$ 8,200,000,000.0012,000,0004R$ 683.33
1 US$ 368.94
Freshwater ProgramR$ 254,000,000.00500,00010R$ 508.00
2 US$ 296.09
1 Average dollar price for the second half of 2007. 2 Average dollar price for the second half of 2011. Data sourced from [90,91].
Table 7. SWRO Large-scale desalination plants.
PlantsLocalProductionEnergy Consumption
m3/daym3/yearKWh/m3GWh/year
ETP LlobregatBarcelona, Spain200.00060.000.003180
The Perth Seawater DesalinationKwinana, Australia250.00045.000.004–6270
Carlsbad DesalinationCarlsbad, USA204.39069.000.002.75–3,3228
Sorek DesalinationSorek, Israel624.000290.000.03.3957
Hadera DesalinationHadera, Israel525.000127.000.03.35425
TOTAL:1.803.39--2.060
Sources: [94,95,96,97,98].

