1. Introduction
Three-phase power electronics converters are essential building blocks of AC microgrids. They are used for interfacing distributed resources, such as photovoltaic generators, fuel cells and wind generators, electrical energy storage and electrical loads of various types. A conceptual AC microgrid formed by renewable generation, conventional synchronous generator, local DC and AC loads, energy storage and possibility for grid connection, is illustrated in
Figure 1. The complexity of the microgrid increases when more sources and loads are replaced by the power electronics interfaces. Microgrids based solely on power electronic converters can be already found on ships, airplanes and tractions systems [
1,
2,
3]. To reach power system with 100 percent renewable energy generation, the power system should rely on grid-forming converters to regulate AC voltage and frequency [
4]. The presence of many different converters, from various manufacturers and with different internal control parameters, complicates model-based stability and power quality studies of the AC microgrid. Power-hardware-in-the-loop (PHIL) has been proven to be an effective method to study systems that are difficult to analyze using analytical or numerical models [
5].
Power quality and stability problems caused by the interaction between the converters and the grid impedance is currently gaining significant amount of attention in industry and academia [
6,
7,
8]. The converter–grid interface suffers from resonance if the ratio of converter and grid impedance does not satisfy the Nyquist stability criterion [
9,
10,
11]. Moreover, the control performance and stability margin of a grid-forming converter can be significantly reduced by the load impedance seen at its output terminals [
12]. The most challenging load impedances are RLC-resonant passive load and other power converters, such as grid-following inverters and active front-ends.
Dynamics of the AC microgrid can be studied using different simulation software, hardware-in-the-loop (HIL) or power-hardware-in-the-loop (PHIL) simulations and experimental tests on real equipment. HIL and controller-in-the-loop (CIL) simulations are effective methods to eliminate critical programming and hardware errors from the power converter control platform before actual prototype implementation [
13]. PHIL tests have gained a lot of attention recently due to the fact that real converters can be tested in realistic conditions that are also well defined and repeatable. PHIL tests are no longer restricted to testing scaled-down prototypes since power amplifiers with a rating of several megawatts are available [
14]. Moreover, the equipment in the PHIL test setup can be oversized to withstand large over-currents and over-voltages to enable reliable and fast protection and to avoid physical damage to converter under test.
Many papers have studied the use of the PHIL-concept to emulate the impedance of the power system in order to have an accurate electrical equivalent for the transmission line in order to test the performance of grid-following inverters [
15]. The real grid impedance varies over time, which makes its emulation using a set of passive components impractical [
16]. A three-phase back-to-back converter is used to emulate transient behavior and different load characteristics of an induction motor in [
17], with a further extension covering saturation effects and experimental results in [
18]. The emulation of an induction machine is considered in [
19] using a combination of real-time digital simulator and back-to-back converter. In [
20], a three-phase inverter is used to emulate passive RLC loads, including the possibility to emulate asymmetrical loading conditions. Furthermore, electrical emulation of AC loads has been demonstrated recently by several authors [
21,
22,
23,
24]. A PHIL test bench is presented in [
25] to emulate an RLC-load impedance for unintentional islanding tests. Furthermore, the impedance behavior of the RLC load is considered and experimental impedance measurements up to 3 kHz are provided.
A vast amount of literature discusses impedance emulation of different components of the AC microgrid. However, a grid-following converter is an essential component in AC microgrid as it can be used as the DC-AC interface between various renewable source or energy storage and the AC microgrid. To allow reliable studies of dynamic phenomena of the AC microgrid, the PHIL-setup should be able to represent the small-signal impedance of the loads and sources as accurately as possible. Several studies have shown how electrical machines, dynamic RLC loads, battery storages and photovoltaic and wind generators can be emulated in a PHIL setup. However, there are no studies showing how a three-phase grid-following power converter with its control functions, such as AC current control, grid-voltage-feedforward and grid synchronization, should be emulated. One could naturally use a real inverter prototype to represent such dynamic load. However, practical implementation of a real three-phase converter is challenging and requires special knowledge on, e.g., the characteristics of the semiconductor switches, signal conditioning, over-current and over-voltage protection, auxiliary power circuitry design and electrical safety. Therefore, this paper shows how a standard laboratory voltage amplifier can be turned into a three-phase power converter, requiring only a passive AC filter to represent the passive parts of the converter impedance and a real-time simulator for implementing the control functions to represent the active parts of the converter impedance.
This paper discusses the control design and implementation of a power-hardware-in-the-loop (PHIL) setup based on a four-quadrant voltage amplifier to emulate the small-signal behavior of three-phase grid-following converter. The output impedance of the emulator is validated by frequency response measurements, which is shown to capture the small-signal dynamics caused by AC current control, grid-voltage feedforward and grid synchronization accurately. Therefore, the proposed PHIL setup can be applied to study stability and power quality problems caused by dynamic anomalies, such as harmonic resonance in a AC microgrid with a complex structure, as shown in
Figure 1.
The main contributions of this paper are summarized as:
It is shown how a standard voltage amplifier can be configured to represent a three-phase grid-following converter in an AC microgrid PHIL test setup.
The output impedance of the emulator concept is verified by frequency response measurements.
The emulator is able to represent the effects of current control, phase-locked-loop and grid voltage feedforward in its output impedance behavior.
It is demonstrated how the internal dynamics of the voltage amplifier can be merged numerically to the dynamic model of the emulator, to necessitate accurate design of control loops and to develop the small-signal impedance model for validation of the frequency response measurements.
Section 2 describes the implementation and control design of the PHIL setup.
Section 3 derives the small-signal impedance model, which is used for validation.
Section 4 shows that the impedance emulator can replicate accurately the effects of phase-locked-loop, current control and grid voltage feedforward. Conclusions are derived in
Section 5.
2. Emulating Converters Using a Laboratory Voltage Amplifier
Practical tests were carried out in the Flex Power Grid laboratory of DNV-GL, located in Arnhem, the Netherlands. The laboratory is equipped with a 16-channel voltage/current amplifier. The amplifier has several output stages, which were configured in groups of three, as illustrated in
Figure 2. Each amplifier can operate in four quadrants, thus each can generate or absorb real and reactive power.
The exact parameters and internal control functions of the amplifiers were not known. Therefore, dynamic characterization had to be carried out before attempting to emulate the impedance of a grid-following converter. The output stages Out-1A to Out-1C were used to emulate the output terminals of a three-phase grid-following converter and output stages Out-2A to Out-2C were configured to emulate a three-phase current/voltage sink to generate the nominal loading conditions for the emulator. The rated power of a single amplifier was 35 kVA. Thus, the maximum power of the emulator was 105 kVA.
The closed-loop frequency response of amplifier group 1 was first identified, over which the control loops, mimicking inverter control dynamics, were later designed. A synchronous reference frame was realized using a real-time simulator from OPAL-RT. Transformation between the natural (abc) reference frame and the synchronous (dq0) reference frames was achieved using the transformation matrices defined in Equations (
1) and (
2). The principle of the measurement setup is shown in
Figure 3. The frequency response of the lower amplifier group was measured by injecting a sine-sweep perturbation to its reference voltage vector
and by using a frequency response analyzer to extract the frequency response from the reference to the actual amplifier output voltage vector
. The amplifier was loaded by amplifier group 2, which was configured to act as a current sink. The phase-to-ground voltage was set to 230
and grid frequency to 50 Hz.
Figure 4 shows the measured frequency response from the reference values to actual voltages produced by the amplifier as solid lines. According to the manufacturer, the amplification stays within
dB up to 5 kHz and the gain experiences its largest magnitude (4 dB) at 17 kHz. However, under loaded condition, the +1.5 dB point was located roughly at 2.5 kHz and the maximum measured amplification was 9.3 dB. Thus, rather than rely on the declared characteristics, it is important to measure the amplifier frequency response in the actual test setup, since the operating point may alter the final response. Otherwise, the designed control loops of the inverter emulator will be erroneous. Moreover, the actual bandwidth may differ because the amplifiers were used in a three-phase configuration. The bandwidth of the amplifier was considered sufficient since grid-following converters usually employ current control with bandwidth of less than 1 kHz. As a comparison, the 2 kHz current control bandwidth of the induction motor emulator in [
18] was considered sufficient.
Figure 4 shows the measured cross-coupling frequency responses as dashed lines, i.e., from reference of the d-component to produced q-component and reference of the q-component to produced d-component. The magnitude of both cross-coupling frequency responses was roughly −30 decibels. Thus, the amplifier itself can be considered not to cause significant cross-couplings between the d and q components. The measured frequency responses were later used to design control loops to necessitate accurate emulation of a grid-feeding converter. That is, the frequency responses in
Figure 4 were transformed into numerical frequency response vectors and used in solving the dynamic model of the impedance emulator.
The main objective of this study was to use the voltage amplifier to emulate a grid-following three-phase converter. A 2 mH three-phase inductor was connected to the output of the amplifier, as illustrated in
Figure 5. The inductor was needed to emulate the passive impedance properties caused by a real AC filter. Moreover, the inductor served as a decoupling impedance since both amplifier groups were internally controlled as voltage sources. The secondary purpose of the decoupling impedance was also to avoid over-currents during turn-on of the voltage amplifiers. The reference voltages for amplifier group 1 can be interpreted as three-phase switch control signals of the emulated inverter and reference voltages for amplifier group 2 as grid voltages.
The output current of the emulator can be derived in the synchronous reference frame, assuming ideal voltage sources, and given as in Equation (
3), where
is the resistance of the inductor and
is the fundamental frequency of the AC microgrid.
Dynamic model of the voltage amplifier can be represented in dq-domain using the measured frequency responses of
Figure 4 and given as a transfer matrix according to Equation (
4).
Since Equation (
3) is linear, the dynamics of the voltage amplifier in Equation (
4) can be substituted into Equation (
3) to obtain the linearized state-space of the PHIL setup. Inductor currents
and
were selected as state variables, reference values of amplifier 1
and
were selected as control variables, voltages produced by voltage amplifier
and
2 were considered as grid voltages and inductor currents were selected as output variables.
s denotes the derivative operator in the frequency domain. It should be noted that the amplifier dynamics are substituted into the state space model as numerical frd-type data vectors.
Transfer function matrix can be solved from Equations (
5) and (
6) according to the well known formula,
, where the matrix
is zero. The result is a 2 × 4 matrix that contains the frequency responses of the emulator at open-loop according to Equation (
7). It should be noted that the transfer functions are essentially in numerical form, since the actual measured frequency responses were embedded in the state-space in Equation (
5).
Current control is implemented in the synchronous reference frame using two PI-controllers. The overall control block diagram is shown in
Figure 6 where it is evident that the control dynamics of d- and q-component are coupled. Two loop gains can be solved from the block diagram and given as in Equations (
8) and (
9), where
and
are the controller transfer functions and
is a first-order low-pass filter. Control design was done using loop-shaping method due to the fact that the transfer functions exist only in numerical form [
26]. Control parameters are collected in
Table 1.
The blue curve in
Figure 7 shows the measured control loop gain of the current d-component
compared with the numerical frequency response solved from Equation (
8). The behavior of the q-component is essentially the same and not shown here. The control loop has crossover frequency of 500 Hz and phase margin of 59 degrees. During the measurement, the amplifier was connected to a second group of amplifiers, which were used to form stable grid voltages as in
Figure 5. The measured loop gain matches with the frequency response derived in Equation (
8). Thus, the emulator can be used to accurately capture the dynamics from AC current control of the grid-following inverter.
Three-phase converters synchronize their output currents with the grid voltages, thus a phase-locked-loop is implemented.
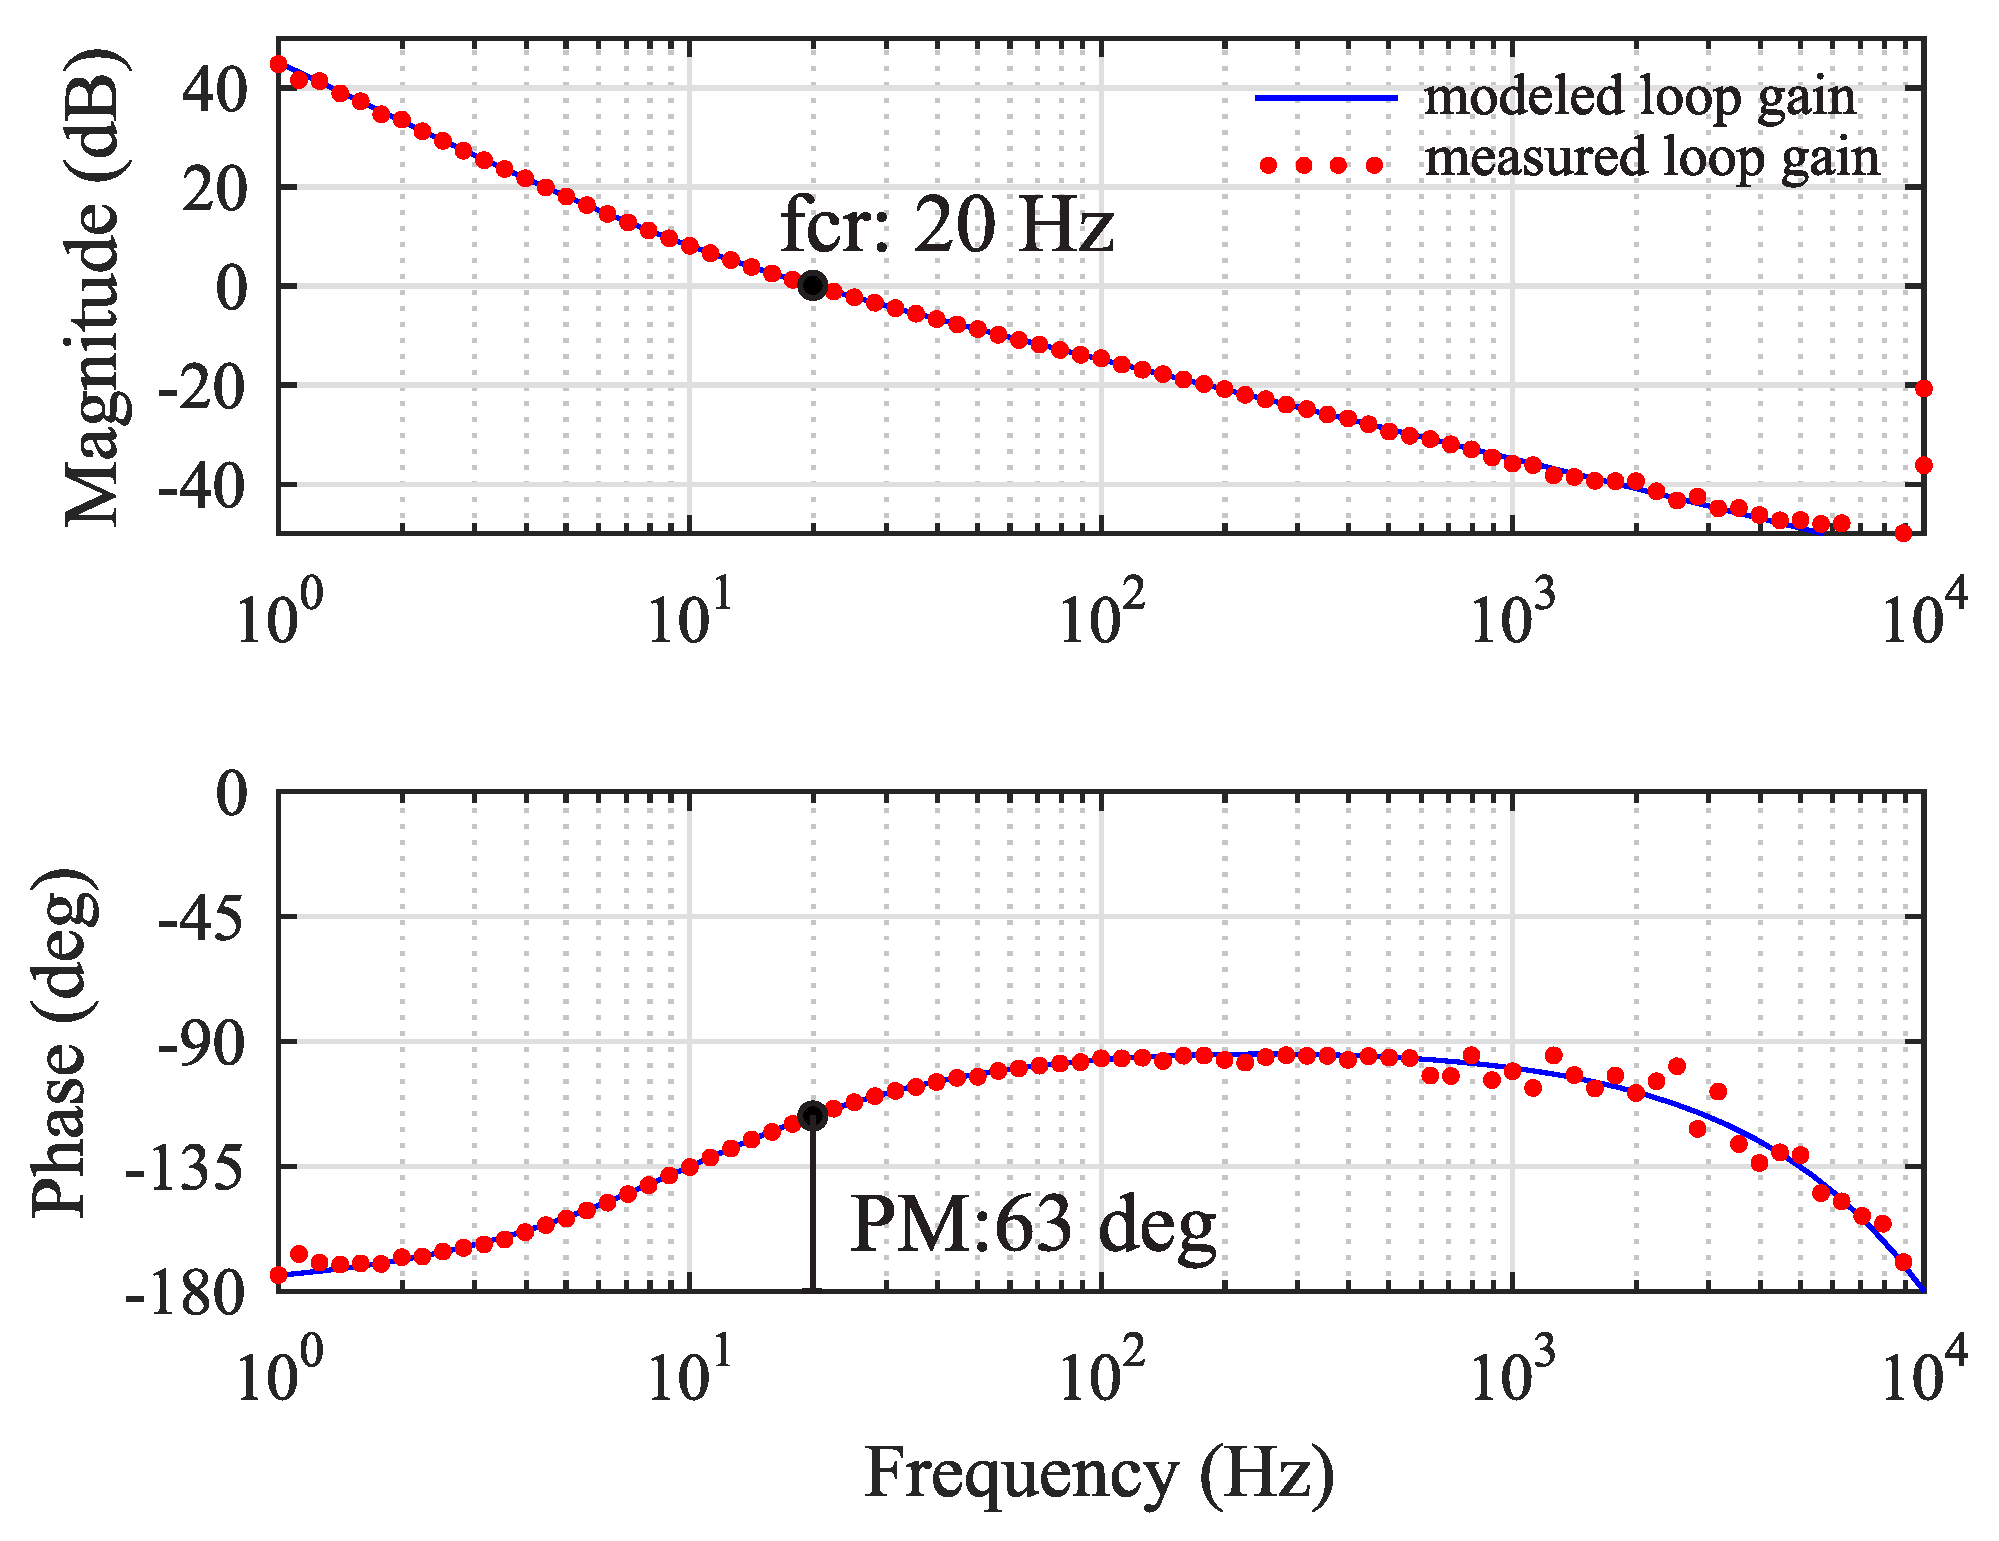
Figure 8 shows the measured loop gain of the PLL and the numerical frequency response obtained from Equation (
10), where
is a third-order Pade-approximation of the control system delay
. The designed crossover frequency was 20 Hz and phase margin 65 degrees. The measured PLL loop gain follows exactly the analytical model and, thus, the emulator can be used to emulate the effects of different grid synchronization algorithms.
Figure 9 shows the response of AC currents to a symmetrical voltage dip of 25 percent. The currents are well regulated with a peak value of 50 A, which indicates that the system is not susceptible to transients and can be safely operated. A special note should be made regarding the small DC current flowing between the different amplifier groups. The DC current flow is caused by the fact that at DC there are two voltage sources in parallel with very small resistance in between. Thus, even small DC offset between the amplifier reference value may produce large DC current. In [
19], an isolation transformer is used to cut the path of circulating DC current. However, in this work, the main goal was to find how accurately the grid-following converter impedance can be emulated, without the effect of transformers, cabling, etc. Moreover, for the used hardware, the DC component presents no problem, since each amplifier group can operate at nominal apparent power in all four quadrants at DC. For future application of these results, it is advised that an isolation transformer (or step-up transformer) is connected between the impedance emulator and the rest of the PHIL setup.
Performance of the current control was compared to a case where current control was intentionally deteriorated by reducing the crossover frequency and phase margin, corresponding to the loop gain illustrated in
Figure 7 in red.
Figure 10 shows the two cases where reference of the current d-component was suddenly changed from 10 to 50 A. It is evident that the voltage amplifier can reproduce the waveforms that are characteristic of sufficient and insufficient phase margin in the current control. Poorly damped oscillation in the step response is a symptom of low phase margin in the current control loop gain (35 degrees).
3. Small-Signal Admittance Model and Verification of the Emulator
A grid-following converter is operated under AC-current control mode. From the point-of-view of circuit analysis, the converter should be modeled as a Norton-equivalent current source (or sink depending on the direction of power flow). Thus, in this section, the output admittance model is derived and the output admittance of the emulator is measured. However, the admittance can be easily understood as the inverse of impedance, i.e., for an ideal current source its output impedance is infinite and admittance is zero.
The current dynamics can be written using transfer matrices and vector-notation as in Equation (
11) or, in short, as in Equation (
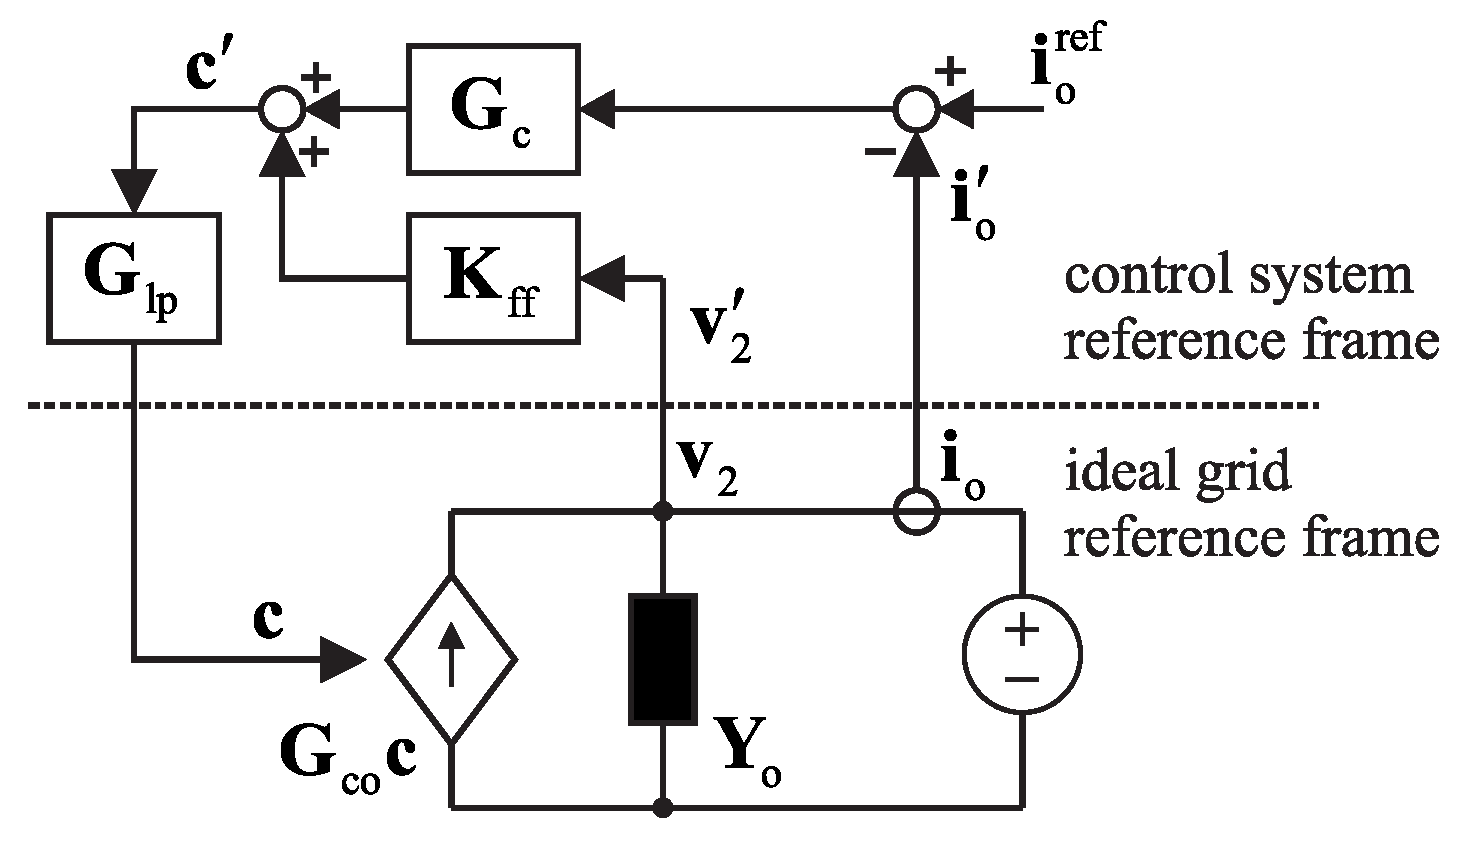
12). Accordingly, a linear equivalent circuit can be drawn as in
Figure 11. The control variable
can be given in the control system reference frame by including the grid voltage feedforward and by taking into account the effect of the phase-locked-loop according to the small-signal relations in Equation (
13) or by using transfer matrices as in Equation (
14) [
27].
The control variable can be given in the control system reference frame as in Equation (
15), where the controller transfer matrix and feedforward gain matrix can be given as in Equations (
16) and (
17), respectively.
By applying Equation (
13) for each variable, the control variable
can be given in the ideal grid reference frame according to Equation (
18).
Substituting the control variable in Equation (
12) and solving the admittance yields in Equation (
19), where the matrices
,
and
include the steady-state operating point of AC current and voltage on both sides of the inductor. The matrices are required for transforming the variables between the ideal grid reference frame and the control system reference frame, and are given in the
Appendix A. The emulated inverter was controlled at unity power factor, the reference value of the current d-component was 50 A and for the q-component was zero. However, it was observed that small amount of reactive power was flowing between the amplifiers and the actual steady-state value for current q-component was −2 A. The small reactive power exchange was presumably due to the internal capacitor of the voltage amplifier.
Figure 12 shows the admittance components given by the analytical model in blue solid line and the actual measured admittance in red dots. Moreover, the black line represents admittance identified from a switching model of a three-phase inverter with equivalent electrical and control parameters. The switching model was implemented using the SimScape software package in MATLAB Simulink. Thus, the black line represents the admittance that would be expected from a real converter. The cross-coupling admittance terms
and
are order of magnitude smaller than the direct and quadrature components
and
. Therefore, their effect on stability and power quality are minor and the deviation in the accuracy is irrelevant [
28]. In the following, the accuracy of the emulator is determined by examining the d- and q-components.
The emulated admittance follows the expected value very precisely up to 500 Hz, which, not by coincidence, places about the crossover frequency of the current control, as shown in
Figure 7. The PHIL setup can emulate all the admittance components precisely, including the cross-coupling terms. However, at frequencies higher than 1 kHz, there is a deviation between the expected admittance and the measured admittance. This is likely caused by the unknown output filter and internal active damping or feedforward control of the voltage amplifier. In fact, it is natural to expect the voltage amplifier to reduce the output impedance (increase admittance) outside the emulated control bandwidth. However, the PHIL setup can be concluded to replicate the admittance precisely up to the current control crossover, which is enough to characterize most of the impedance-based interactions, i.e., those caused by grid synchronization, grid voltage feedforward and current control.
4. Effect of Different Control Functions
The phase-locked-loop (PLL) has been shown to make the q-component of inverter impedance resemble a negative resistor below the PLL crossover frequency [
27].
Figure 13 shows the measured admittance q-component with different PLL crossover frequencies. In each case, the PLL was tuned for a phase margin of approximately 65 degrees. The measured admittance in solid line gives precisely the same frequency response as the model, which is shown as the dotted line. Thus, the PHIL setup emulates the behavior of the PLL very precisely and the negative resistance region is extended with the increasing PLL crossover frequency. Thus, the PHIL is suitable for studying low-frequency instability caused by grid synchronization, such as the instability in weak grid condition or interaction between several parallel inverters.
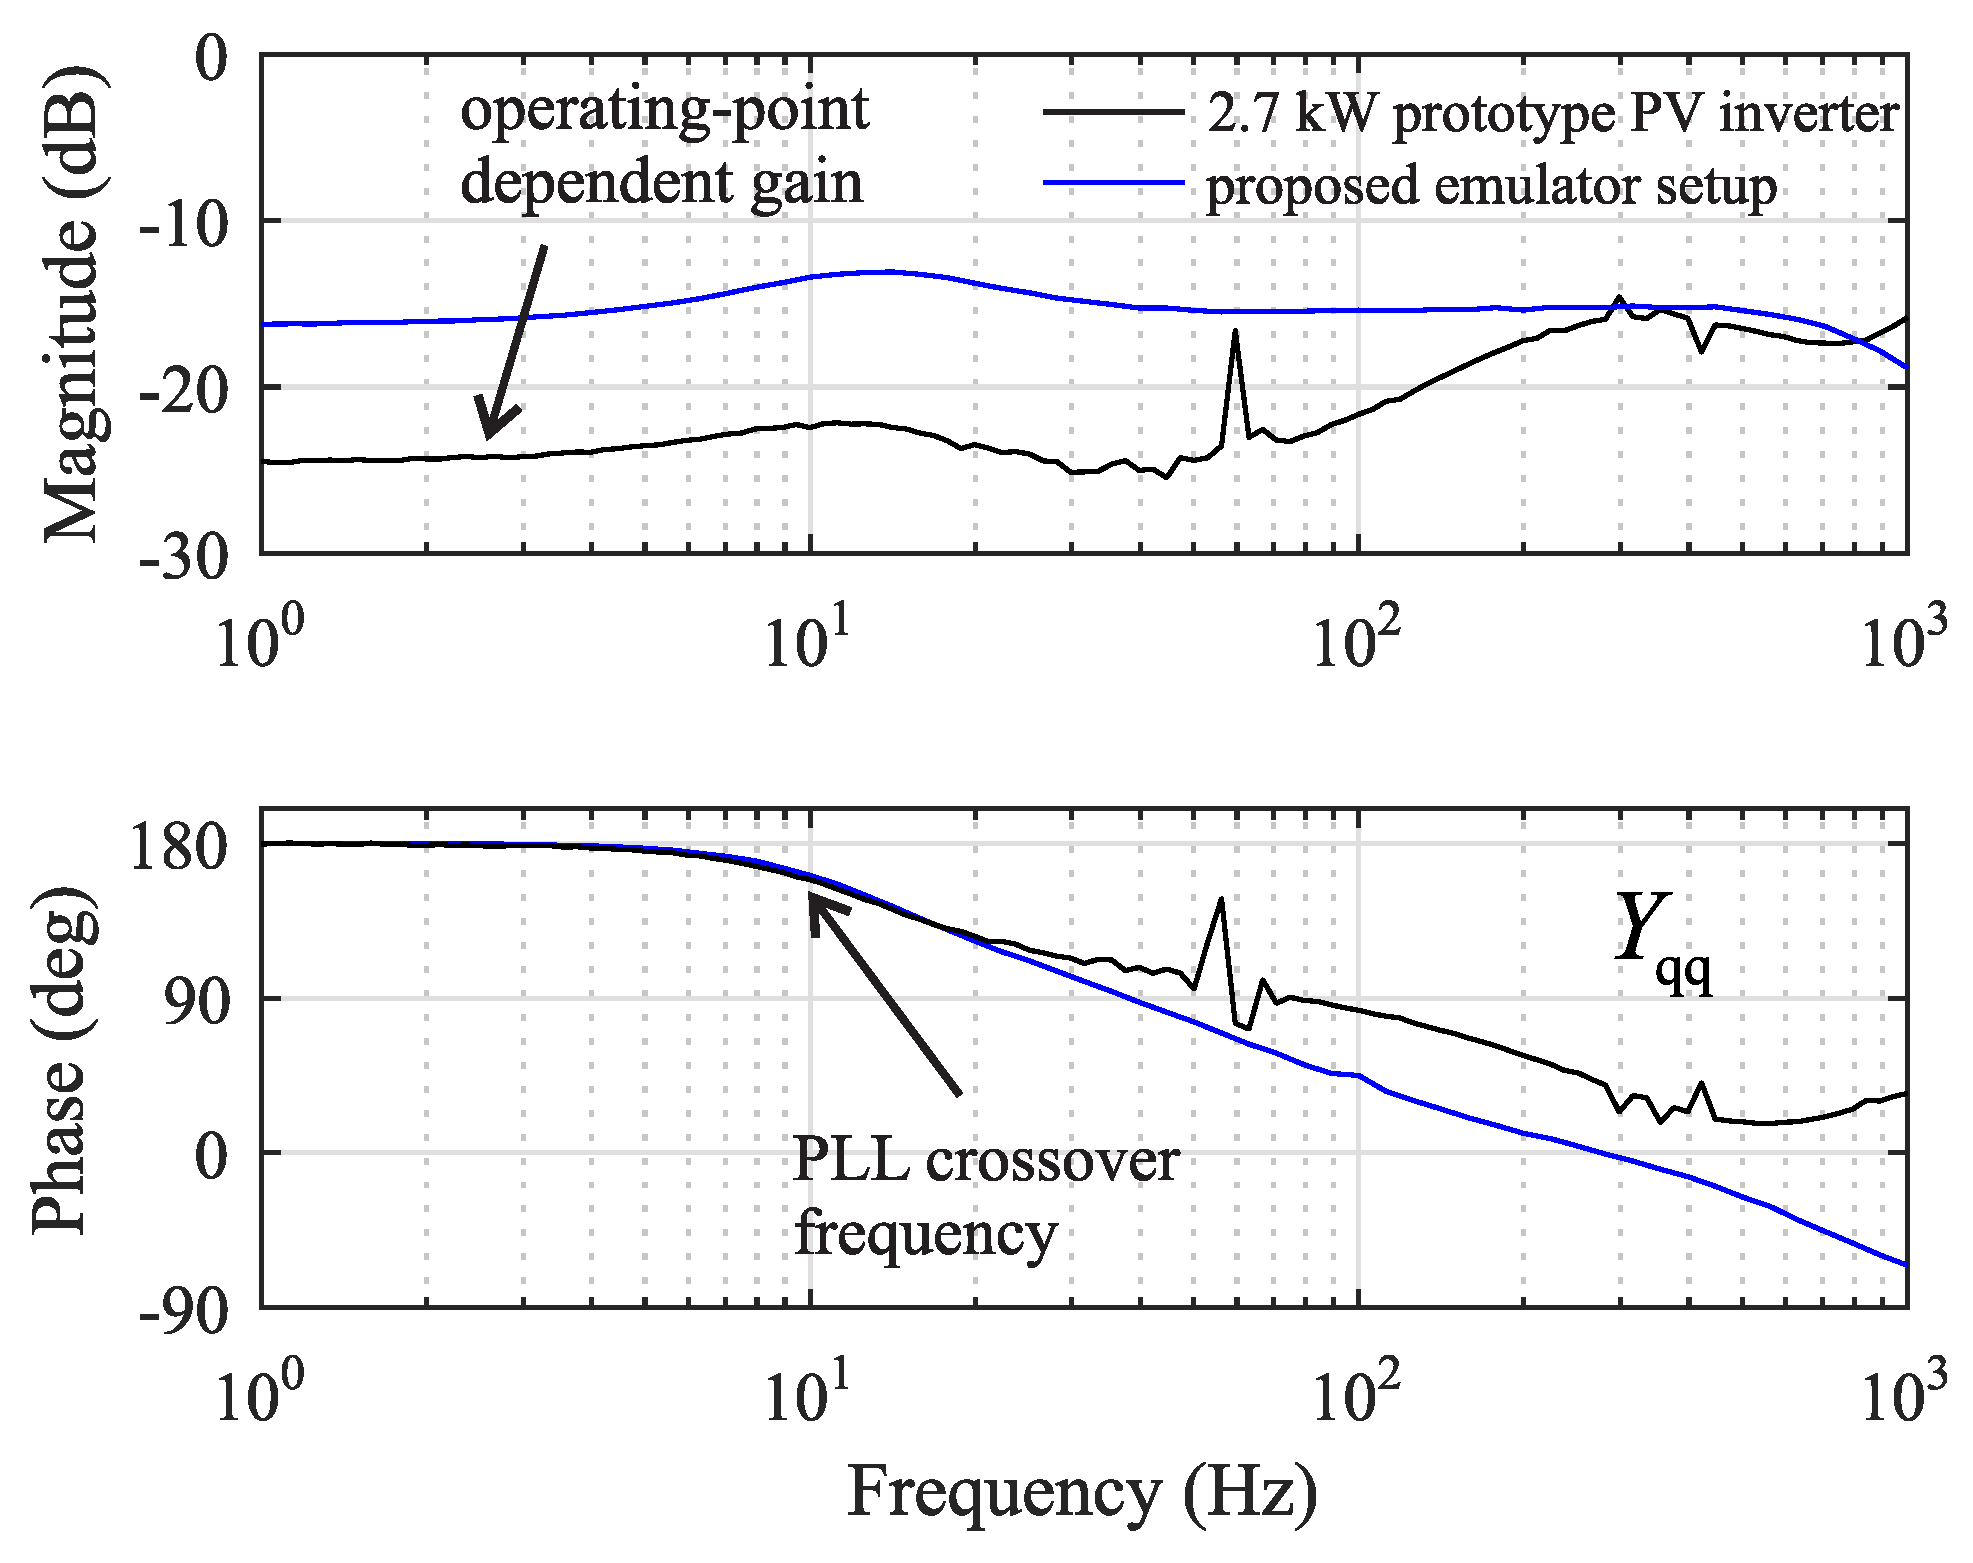
To further demonstrate that the emulator represents the effect of the phase-locked-loop correctly, measurements from a low-power photovoltaic inverter prototype are provided in
Figure 14. The prototype includes an LCL-type filter and is discussed further in [
29]. The phase-locked-loop causes a negative conductance part to the admittance term, which can be seen at frequencies below the bandwidth of the PLL as a constant magnitude and 180-degree phase shift. Moreover, the magnitude of low-frequency admittance is given by the ratio of d-components of the current and voltage, which at the unity power factor is approximately
. Both the admittance measured from the proposed emulator setup and admittance measured from a real inverter have these properties, as summarized in the figure. The difference in magnitude at low frequencies can be explained by different power rating and at high frequencies the prototype differs in current control parameters and AC filter design. However, the effect of the PLL is identical in both cases, since the PLL crossover is set to 20 Hz.
The AC current control aims to make the inverter resemble more closely an ideal current source. In practice, the current control decreases the inverter output admittance below the crossover frequency, by introducing a parallel capacitive output admittance [
26].
Figure 15 shows the measured admittance with three different current control crossover frequencies, with identical phase margin. It is evident that increasing the current control crossover frequency makes the admittance smaller, thus making the inverter to behave more closely as an ideal current source. The PHIL setup can, therefore, be used to characterize problems caused by low-bandwidth current control.
Grid voltage feedforward is often used to further decrease the inverter output admittance to mitigate the effect of background harmonics.
Figure 16 and
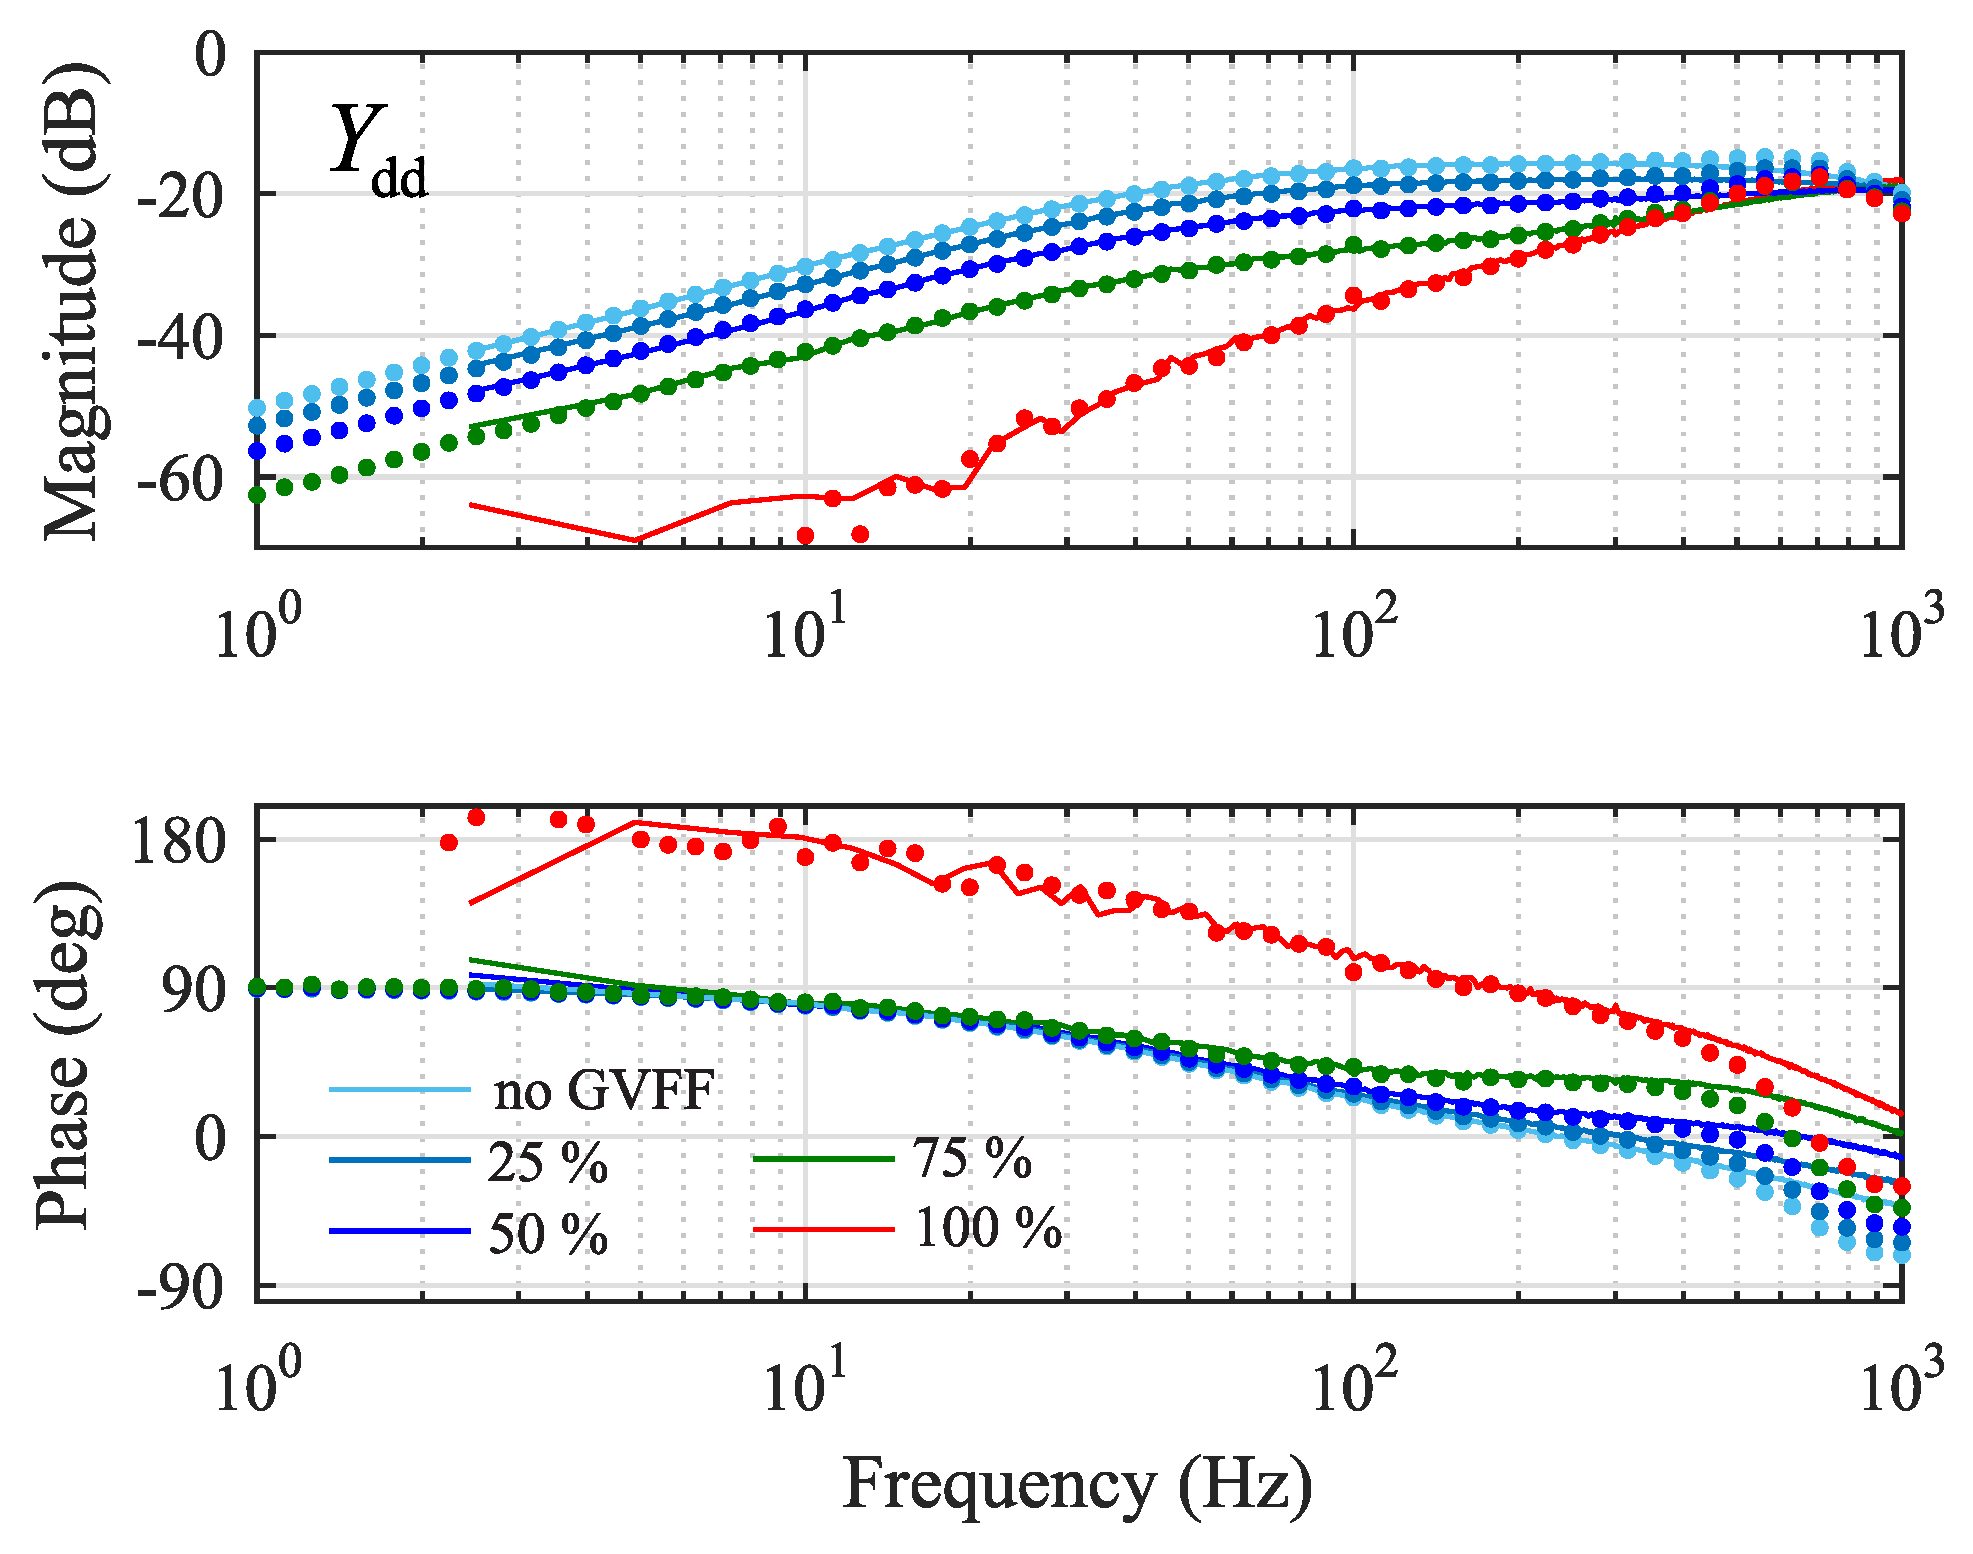
Figure 17 show the measured admittance d- and q-component with different values of feedforward gain. Ideally the proportional feedforward gain of a three-phase two-level inverter would be selected as the inverse of DC side voltage, which in the figures is referred as the 100-percent gain. As can be seen in
Figure 16, the admittance d-component decreases with increasing feedforward gain as in a real inverter. However, using high gain can make the admittance lose its passive characteristics, as indicated by the red curve, which is why the value of feedforward gain is usually limited. That is, the admittance is determined passive only at the frequencies where the phase-curve stays within ± 90 degrees.
As can be seen in
Figure 17, the feedforward does not affect the admittance q-component at low frequencies, where the PLL dominates the admittance behavior. The effect of increasing the feedforward gain on the admittance q-component can be clearly seen in
Figure 17 around few hundred hertz, where the admittance decreases when the feedforward gain approaches the nominal value. However, with the nominal value, i.e., 100 percent, the admittance loses its passive characteristics over a much wider bandwidth than what is caused by the PLL, since the phase curve rises above 90 degrees around 100 Hz. This happens regardless of the fact that PLL crossover is only 20 Hz.
To further validate the ability of the emulator setup to replicate the effect of grid voltage feedforward, measured admittance q-component is compared to measurements from the 2.7 kW prototype PV inverter. The admittances are shown in
Figure 18 for the emulator setup on the left and for the PV inverter on the right. Even though the admittances cannot be directly compared due to different sizing and parameters of the PV inverter, it is clear that the grid voltage feedforward decreases the magnitude of the admittance at frequencies higher than the PLL crossover frequency. Thus, the emulator setup correctly replicates this effect.
Based on the frequency response measurements, the power-hardware-in-the-loop can be effectively used to emulate the most important features of inverter admittance, including the effect of current control, phase-locked-loop and grid-voltage feedforward. Therefore, the PHIL setup is an attractive approach for stability and power quality analysis of future power systems with ever-increasing complexity, such as the AC microgrids. The steps to configure a voltage amplifier to emulate the small-signal impedance of a grid-connected converter can be summarized as:
Characterize the internal small-signal dynamics of the amplifier, i.e., the transfer function from reference voltages to the actual voltages, and transform the measured frequency responses as frd-type data vectors as in Equation (
4).
Select and appropriate L or LCL-type AC filter to necessitate current control and to decouple the voltage amplifier from the rest of the AC system, i.e., to prevent hazardous over currents during turn-on.
Include the measured frequency responses
,
,
and
in the state space representation in Equation (
5) and solve numerically the open-loop transfer functions as in Equation (
7).
Tune the PI-controllers to regulate AC current d- and q-component to have the intended phase margin and crossover frequency using Equations (
8) and (
9).
Tune the phase-locked-loop based on the loop gain transfer function in Equation (
10).
5. Conclusions
AC microgrids are becoming more common to energize local loads due to increased availability of distributed generation. AC microgrids conceptually comprise several grid-forming and grid-following power converters, renewable sources, energy storages and local loads. Power-hardware-in-the-loop (PHIL)-based studies have gained a lot of interest recently since they allow effortless dynamic tests of AC microgrids with full penetration of renewable energy generation. In a PHIL setup, different components of the microgrid exist as real devices or electrical emulators, or can be simulated using real-time simulators. An example of a PHIL-based simulator is an electrical photovoltaic emulator based on a linear amplifier or switching DC-DC converter. For accurate, reliable and repeatable results, the PHIL-setup should be able to represent the dynamics of the microgrid loads and sources as accurately as possible. Several studies have shown how electrical machines, dynamic RLC loads, battery storages and photovoltaic and wind generators should be emulated in a PHIL setup. However, there are no studies showing how a three-phase grid-following power converter with its internal control functions should be emulated. One could naturally use a real inverter prototype to represent such dynamic load. However, practical implementation of a real three-phase converter is much more challenging and requires special knowledge on, e.g., the characteristics of the semiconductor switches, signal conditioning, over-current and over-voltage protection and auxiliary power circuitry design. Therefore, this paper shows how a commercial laboratory voltage amplifier can be turned into a three-phase power converter, requiring only a passive AC filter and real-time simulator. Thus, researchers without special knowledge on design of inverters can study the dynamics caused by grid-following inverter-type loads in AC microgrids.
This paper discusses the control design and implementation of a power-hardware-in-the-loop (PHIL) setup based on a four-quadrant voltage amplifier to emulate the small-signal behavior of three-phase converter. It is shown by frequency domain measurements that the admittance of the PHIL-emulator follows precisely the expected impedance value within the current control bandwidth. Therefore, the PHIL setup can be applied to study stability and power quality problems in an AC microgrid. The effect of various control functions on the impedance, such as current control, grid synchronization and grid voltage feedforward, are successfully demonstrated.

 ,
, 


