Article

Evaluation of the Adaptability of the Ukrainian Economy to Changes in Prices for Energy Carriers and to Energy Market Risks

1
Department of Business Economics and Investment, Institute of Economics and Management, Lviv Polytechnic National University, 5 Metropolian Andrey str., Building 4, 79005 Lviv, Ukraine
2
Department of Pharmaceutical, Organic and Boorganic Chemistry, DanyloHalytskyLviv National Medical University, Pekarska 69, 79010 Lviv, Ukraine
3
Department of Public Health, Dietetics and Lifestyle Disorders, Faculty of Medicine, University of Information Technology and Management in Rzeszow, Sucharskiego 2, 35-225 Rzeszow, Poland
*
Author to whom correspondence should be addressed.
Energies 2018, 11(12), 3529; https://doi.org/10.3390/en11123529
Submission received: 23 November 2018 / Revised: 10 December 2018 / Accepted: 14 December 2018 / Published: 18 December 2018

Abstract

:
The methodological framework for assessing adaptability of the economy to changes in energy prices and risks to energy markets was developed. The study proposes indicators for assessing the level of adaptability of the economic sectors to changes in prices for energy carriers and to risks of energy markets. The model of decomposition of adaptability level of the economy sectors to changes in energy prices has been developed. The theoretical and empirical analysis of the influence of energy prices on adaptability level of enterprises and households is carried out. Based on the empirical analysis, it was found that adaptability level of the sectors of Ukrainian economy significantly differs both in the years of the investigated period and in sectors of the economy. At the same time, most indicators of the level of adaptability vary from 0.4 to 0.7. Consequently, the actual decline in the profit of enterprises was 40–70% lower than the potentially possible decrease in the profit of these enterprises due to the prices rising for energy carriers. Moreover sectors which are less vulnerable to the growth of prices show higher adaptability level.The possibility of using the obtained results in developing a state energy saving strategy is substantiated.

1. Introduction

The modern economy is characterized by energy priceinstability. This instability causes constant changes in the conditions of activity for enterprises and households. As a result, different changes are taking place in a variety of economic indicators, in particular, in gross domestic product (GDP) [1], in energy consumption [2], in investment [3], in volume of budget revenues [4], in unemployment rate [5], etc. [6,7]. However, the economic impact of changes in price for energy carriers varies considerably between different enterprises, industries and countries [8]. These differences are due to the current level of energy consumption. This level is characterized by the energy intensity of production, the ratio between the volumes of different types of used energy resources, the total amount of their consumption, etc. At the same time, enterprises that consume certain types of energy resources try to adapt to the changes of their prices. The purpose of this adaptation is to reduce the negative effects of changing prices for energy resources when these prices increase, or strengthening the positive effects if energy prices decrease.
Taking into account the above, it is important to know how powerful the possibilities of adaptation of certain enterprises, sectors of economy and countries to changes in prices for energy carriersare. In particular, it is necessary to find out if the properly organized mechanism of such adaptation can compensate for losses of enterprises consuming certain types of energy carriers from rising prices for them. In order to address these issues, it is necessary to establish indicators and identify factors of adaptability of enterprises to changes in prices for energy carriers. It is also important to know how the level of adaptation of enterprises to energy price changes can change depending on the magnitude of these changes. In addition, we should take into consideration the fact that adaptation may occur not only to the changes in prices for energy carriers that have already actually happened but also to those changes that may occur in the future. Therefore, it is necessary to study the peculiarities of adaptation of enterprises to the risks of energy markets [9,10].
We should note that during the last decade the prices for energy resources, in particular, spot and futures prices for crude oil [11] can be characterized by trends both in their increase and their decrease [12,13]. However, the tendency of growth of these prices prevails in recent times and some forecasts assert that this trend will continue. This naturally leads to increasing difficulties in countries importing energy resources, especially if these countries are characterized by high energy intensity of their GDP. Ukraine also belongs to such countries, whose demand for crude oil is almost fully provided by its imports [14], as well as volumes of import of natural gas are significant [15,16]. In addition, the economic situation in Ukraine is substantially complicated because of the military-political conflict, which began in 2014 and continues to this day [17,18]. As a result of the conflict, the Ukrainian government temporarily lost control over the territories where coal-mining enterprises were located and they produced more than a third of the country’s total volume of coal. Significant deposits of natural gas have also been lost. At the same time, Ukraine’s economy is characterized by high level of riskiness of its energy sector. There is a danger of not receiving the necessary volumes of import of energy resources (primarily due to the forced suspension of their import from Russian Federation). The transit potential of Ukraine is also under threat as a result of the planned construction of the main gas pipeline “Nord stream 2”.
Under such conditions, the issues of adaptation of economy to changes in prices for energy carriers and risks of energy markets are extremely relevant for Ukraine. It should be noted that Government of Ukraine is taking appropriate measures aimed at such adaptation [19]. Governmental structures develop and implement different energy conservation programs [20] and programs for increase the share of renewable energy sources in order to achieve Ukraine’s energy independence [21,22]. The EU countries, international financial institutions [23,24] and individual countries provide significant assistance in financing these programs [25,26]. At the same time, Ukrainian government is trying to use the positive experience of EU countries in promoting energy saving and ensuring energy security [27].
However, the problem of adaptation of Ukrainian economy to new trends in energy markets is still far from solution. In our opinion, in-depth study of the mechanisms of adaptation of economy to changes in prices for energy resources and risks of energy markets can help to solve this problem.
The main goal of our research was to develop the methodological principles for assessing adaptability of economy to changes in prices for energy carriers and risks of energy markets, with further use of these principles on the example of Ukrainian economy. While we achieved the goal of the study, we had received several results that have a scientific novelty.
Firstly, a number of indicators have been proposed for assessing the level of adaptability of economy to changes in prices for energy carriers. In particular, the authors proposed to determine the potential losses or lack of profit of energy consumers, assuming that there is no complete mechanism for adaptation to changes in prices for these resources. Then, the actual level of consumer adaptation to rise in energy prices can be determined by the share of their potential losses that could be avoided due to the adaptation to such growth, in the total value of these losses.
Secondly, the authors developed the model of decomposition of the level of adaptability of sectors of the economy to the changes in prices for energy carriers that allows to evaluate the influence of different ways of adaptation on the level of adaptability. In addition, the authors realized the modeling of sustainability of sectors of the economy to the changes in prices for energy carriers, depending on the sensitivity of the enterprises of these sectors to these changes and the level of adaptability to them. The role played by technological flexibility of enterprises in the process of their adaptation to changes in prices for energy carriers is also established.
Thirdly, the modeling of the influence of energy prices on the level of adaptation of enterprises and households to the changes in prices for energy resources is realized. The authors proved existence certain range of prices for energy carriers, for which the level of adaptation to them is the highest. The necessity of taking into account this range in the development of the state energy saving strategy is substantiated.
Fourthly, the regularities of adaptation of energy resources consumers to the risks of energy markets are investigated. The concept of the price of such adaptation is introduced and it can be understood as additional volumes of investments that should be invested by energy consumers in order to adapt to the risks of energy markets. The factors that influence the price of adaptation of energy resources consumers to possible increase of their prices are determined. The importance of determining the price of adaptation in substantiating measures to ensure the state energy security is indicated.
The achievement of indicated goal has determined the necessity of addressing a number of tasks that are solved in the relevant parts of the work. Thus, in Section 2, the authors realized a review of literature on the topic of research. Section 3 presents the methodological principles for assessing adaptability of the economy to changes in prices for energy carriers and risks in energy markets. In Section 4, an empirical analysis of the issues was conducted on the example of Ukraine. In Section 5 the results are discussed. Section 6 presents limitations and prospects for further research. In Section 7 the authors summarize the results of the research.

2. Literature Review

The problem of establishing regularities of adaptation of enterprises to the changes occurring in their external environment has been the subject of many scientific studies. Thus, in [28], ad aptation is considered as a reaction of the system which counteracts the actual or possible reduction of the efficiency of its functioning. In [29] the enterprise’s adaptation is explained as its ability to interpret and transferthe signals of the environment into new behavioral responses. A similar approach to the interpretation of the essence of adaptation is also presented in [30], where the authors investigate the regularities of adaptation in the context of the possibilities of purposeful change of the system awaiting external stimuli or in response to them. Thereby, the scientists closely associate the process of adaptation with the mechanism of homeostasis of complex systems. The scientific literature also addresses such aspects of enterprise adaptation as the causal link between adaptation and survival of the firm [31], the role of adaptation in production management [32] and the impact of adaptation of enterprises on their sustainability [33]. At the same time, a special emphasis is placed on the fact that the system can and must adapt not only to the changes that have taken place, but also to those changes that may only occur in the future.
It is indisputable that the price of resources that are used in production processis the most important and volatile indicator among the indicators of the environment of enterprises. In this regard, the issue of forecasting and modeling resource prices is extremely important. In particular, it refers to the prices for energy resources. The results of modeling [34,35] and forecasting prices for energy carriers [36], primarily for oil [37,38], are presented in a large number of scientific works. These results are characterized by sufficiently high analytical and predictive properties, although the geopolitical factors, which recently strongly affect the cost of energy resources, are not always fully taken into account.
It is important to note that the forecasting of prices for energy carriers can be considered as an intermediate stage in the development of forecasts of various macroeconomic indicators, in particular, gross domestic product and budget revenues. In modern scientific literature, there are some fundamental researches of the impact of changes in prices for energy carriers on macroeconomic indicators at the level of individual countries as well as several countries [4,39]. The results show significant differences in the impact of changes in prices for energy carriers on the macroeconomic indicators for different countries. Thus, in [39], the negative impact of rising oil prices on the Chinese economy is noted. In [40], the positive impact of such growth on the stock market of Vietnam is described. At the same time, the significant influence of the growth of energy prices on the Lithuanian economy was not detected at all [41]. In explaining the causes of these differences the researchers give important role to indicators of volumes of exports and imports by countries of different types of energy resources, energy intensity of GDP of investigated countries, etc. However, despite the undeniable value of these studies, the factor of adaptation of economy and its individual sectors to the change in prices for energy resources is not allocated separately or not considered in full measure in these studies.
The analysis of regularities of adaptation of country’s economy to changes in prices for energy carriers should include the study of the impact of changes in prices for energy carriers on changes in their consumption. A number of scientific works devoted to this issue exist in economic literature [42,43]. In these researches the authors trying to establish the extent of impact of changes in prices for different types of energy carriers on the volume of their usage by commercial customers and households [44,45]. However, it is necessary to note the existence of significant disagreements among different authors regarding their received results. For example, the results of various scientists differ greatly in relation to the analysis of impact of electricity prices on the volume of its consumption by households. In particular, in [42] did not establish the presence of such an effect, and in [43] it was found. The specific features of different countries that determine the needs of their economies in energy resources can be one of the reasons for these divergences. In addition, the fact that the consumption of energy carriers is influenced not only by their prices but also by other factors should be also taken into account [46,47]. In particular, some scientists include the income level of the population to these factors analyzing the impact of energy prices [48,49].
For specifying the processes of adaptation of enterprises, sectors of economy and households to changes in prices for energy carriers, it is necessary to highlight the factors that cause the change in volumes of their consumption. The change in production volumes and changes in its energy intensity are such factors for the enterprises [50]. Investigation of regularities of influence of these factors on the volume of consumption is considered, in particular, in [51,52]. At the same time, many authors focus on impact of technological changes on the reduction of consumption of energy resources in conditions of raising their prices [53,54,55]. Also, in [56] states that consumers can in some way stimulate enterprises to implement energy-saving measures.
In general, the regularities of technological changes in the economy are sufficiently researched in the scientific literature [57,58]. In particular, the factors that determine these changes [59] and their regularities are investigated in some scientific works [60,61]. At the same time, the scientists give considerable attention to energy-saving technological changes, their influence on the rates and proportions of economic growth [62]. A separate group of scientific publications is devoted to technological changes, which provide replacing of one type of energy carriers with other. First of all, it concerns the replacement of non-renewable energy sources with renewable ones. In particular, the peculiarities of such a transition were analyzed on the example of Mexico [63], Azerbaijan [64], Saudi Arabia [65], Libya [66], Australia [67], Nigeria [68], and others. Also, the importance of hydrogen as an energy carrier was indicated, which may soon substantially change the structure of energy consumption [69]. However, the introduction of energy-saving technologies is often complicated by certain barriers, as a result price increases for energy carriers does not always sufficiently stimulate the introduction of energy-saving technologies [70] and realization of other energy-saving measures [71,72]. Among the barriers that impede the introduction of energy-saving technologies at enterprises, first of all, it is necessary to highlight the need for investment, which requires thorough assessment of economic efficiency [73,74] and justification of the feasibility of implementing the relevant investment projects [75].
According to the results of research carried out by different authors, in significant number of cases the increase in prices for energy is a reason for a certain reduction in consumption of energy resources. However, the scientists believe in the existence of factors that can weaken this tendency. On the other hand, the possible is a situation in which the reduction of consumption of energy resources in the economy occurs even in condition of constant or lower prices for energy resources. In particular, this can occur in case of significant risks in the markets of energy resources [76], first of all, the risks of rising prices for these resources in the future.
In general, a large number of scientific works are devoted to the issue of risk assessment and risk management in energy resource markets. In these works, the nature of these risks is considered [77,78], the regularities of their influence on the activity of enterprises are analyzed [79,80], the methods of estimation and management of this type of economic risks are justified [81,82]. We should also pay attention to the existence of close connection between the issues of minimizing energy risks and the problem of ensuring energy security and energy independence of countries [83]. This connection is caused by the fact that reducing energy risks is one of the main tasks of ensuring energy security of individual enterprises and sectors of the economy as well as countries in general.
Consequently, there are many publications in modern scientific literature devoted to certain aspects of the adaptation of economies to changes in prices for energy carriers and risks of energy markets. However, only a few studies try to provide an integrated approach to studying the regularities of such adaptation. In particular, the study of the adaptability of the economy to the change in the prices of crude oil by the example of Taiwan [84], the USA [85], China [86], Malaysia [87] and other countries [8] are of considerable interest for scientists. It is important to note that in certain works [84,85] results are presented according to the branches of the economy. At the same time, in our opinion, the methodical approaches to quantitative assessment of the level of adaptation of the economies to changes in energy prices and to risks of energy markets require further development. Systematization of the factors affecting this level and further investigation of the regularities of this influence is also necessary. The results of such studies may be useful in developing energy strategies for individual enterprises and countries in general.

3. Methodology

This section presents the methodological principles for assessing the adaptability of the economy to changes in prices for energy carriers and risks in energy markets. First, we highlight the main ways of adapting enterprises to changes in prices for energy carriers. The following are indicators of the adaptability of the economy to changes in prices for energy carriers and the justification of the method of decomposition of these indicators. In the Section 3.3, the modeling of the relationship between stability, sensitivity and adaptability of the economic sectors to the rise in energy prices is carried out. Then a modeling the impact of energy-saving technological changes on the level of adaptability of the economy to rising energy prices is presented. Section 3.5 presents indicators of adaptability of the economy to the risks of energy markets.

3.1. Selection of the Main Methods of Enterprises Adaptation to Changes in Prices for Energy Carriers

It is advisable to consider the regularities of adaptation of the economy to changes in prices for energy carriers at the level of individual enterprises. Enterprises and households are the first who adopt and implement appropriate decisions for the realization of any adaptation. At the same time, it is necessary to distinguish the resulting indicators and parameters of adaptation of enterprises to changes in energy prices. The changes of the resulting indicators characterize the results of this adaptation and the changes of the adaptation parameters reflect the process of its implementation.
The resulting indicators of adaptation of enterprises to change in energy prices include their operating or net profit and value added. All these indicators are calculated over a certain period, for example, per year. Therefore, for assessing the adaptability of enterprises to changing energy prices it is necessary to pre-select certain duration of the adaptation period. This choice depends on the objectives of the study and the length of implementation of the methods of adaptation that are dominant in a particular economy or its branch. Thus, in the study of the medium-term effects of adaptation, the adaptation period may be one year. In the study of the long-term effects of adaptation, the adaptation period may be significantly greater, depending on the length of the adaptive lag.
Indicators of the cost of different types of energy resources per unit of output can be considered as an example of the parameters of adaptation of enterprises to change in energy prices. In general, the adaptation parameters correspond to different ways of adaptation. In particular, in the case of rising prices for energy resources, the enterprises that consume these resources can apply a variety of organizational, technical and technological measures aimed at energy saving. However, it is possible to identify the main directions of adaptation of enterprises to changes in prices for energy resources. In order to realize this, it is necessary to consider the case of a particular type of product, for the manufacture of which the enterprise uses a certain type of energy carriers. In this case, there are only two main directions of adaptation to the change in price of energy resources, namely:
(1)
change in prices of products manufactured using this energy resource. This change may affect the demand for these products and, accordingly, the volumes of its sales. At the same time, the force of such influence depends, in particular, on the price elasticity of this product;
(2)
changes in the cost of energy resource per unit of output.
Now let’s suppose that the enterprise produces (or can produce) simultaneously several types of products and it uses (or can use) several types of energy carriers for this purpose. Then there are two possible directions of adaptation of the enterprise to change in prices of energy resources:
(1)
changes in the structure of the product range;
(2)
changes in the structure of energy resources that are used for production.
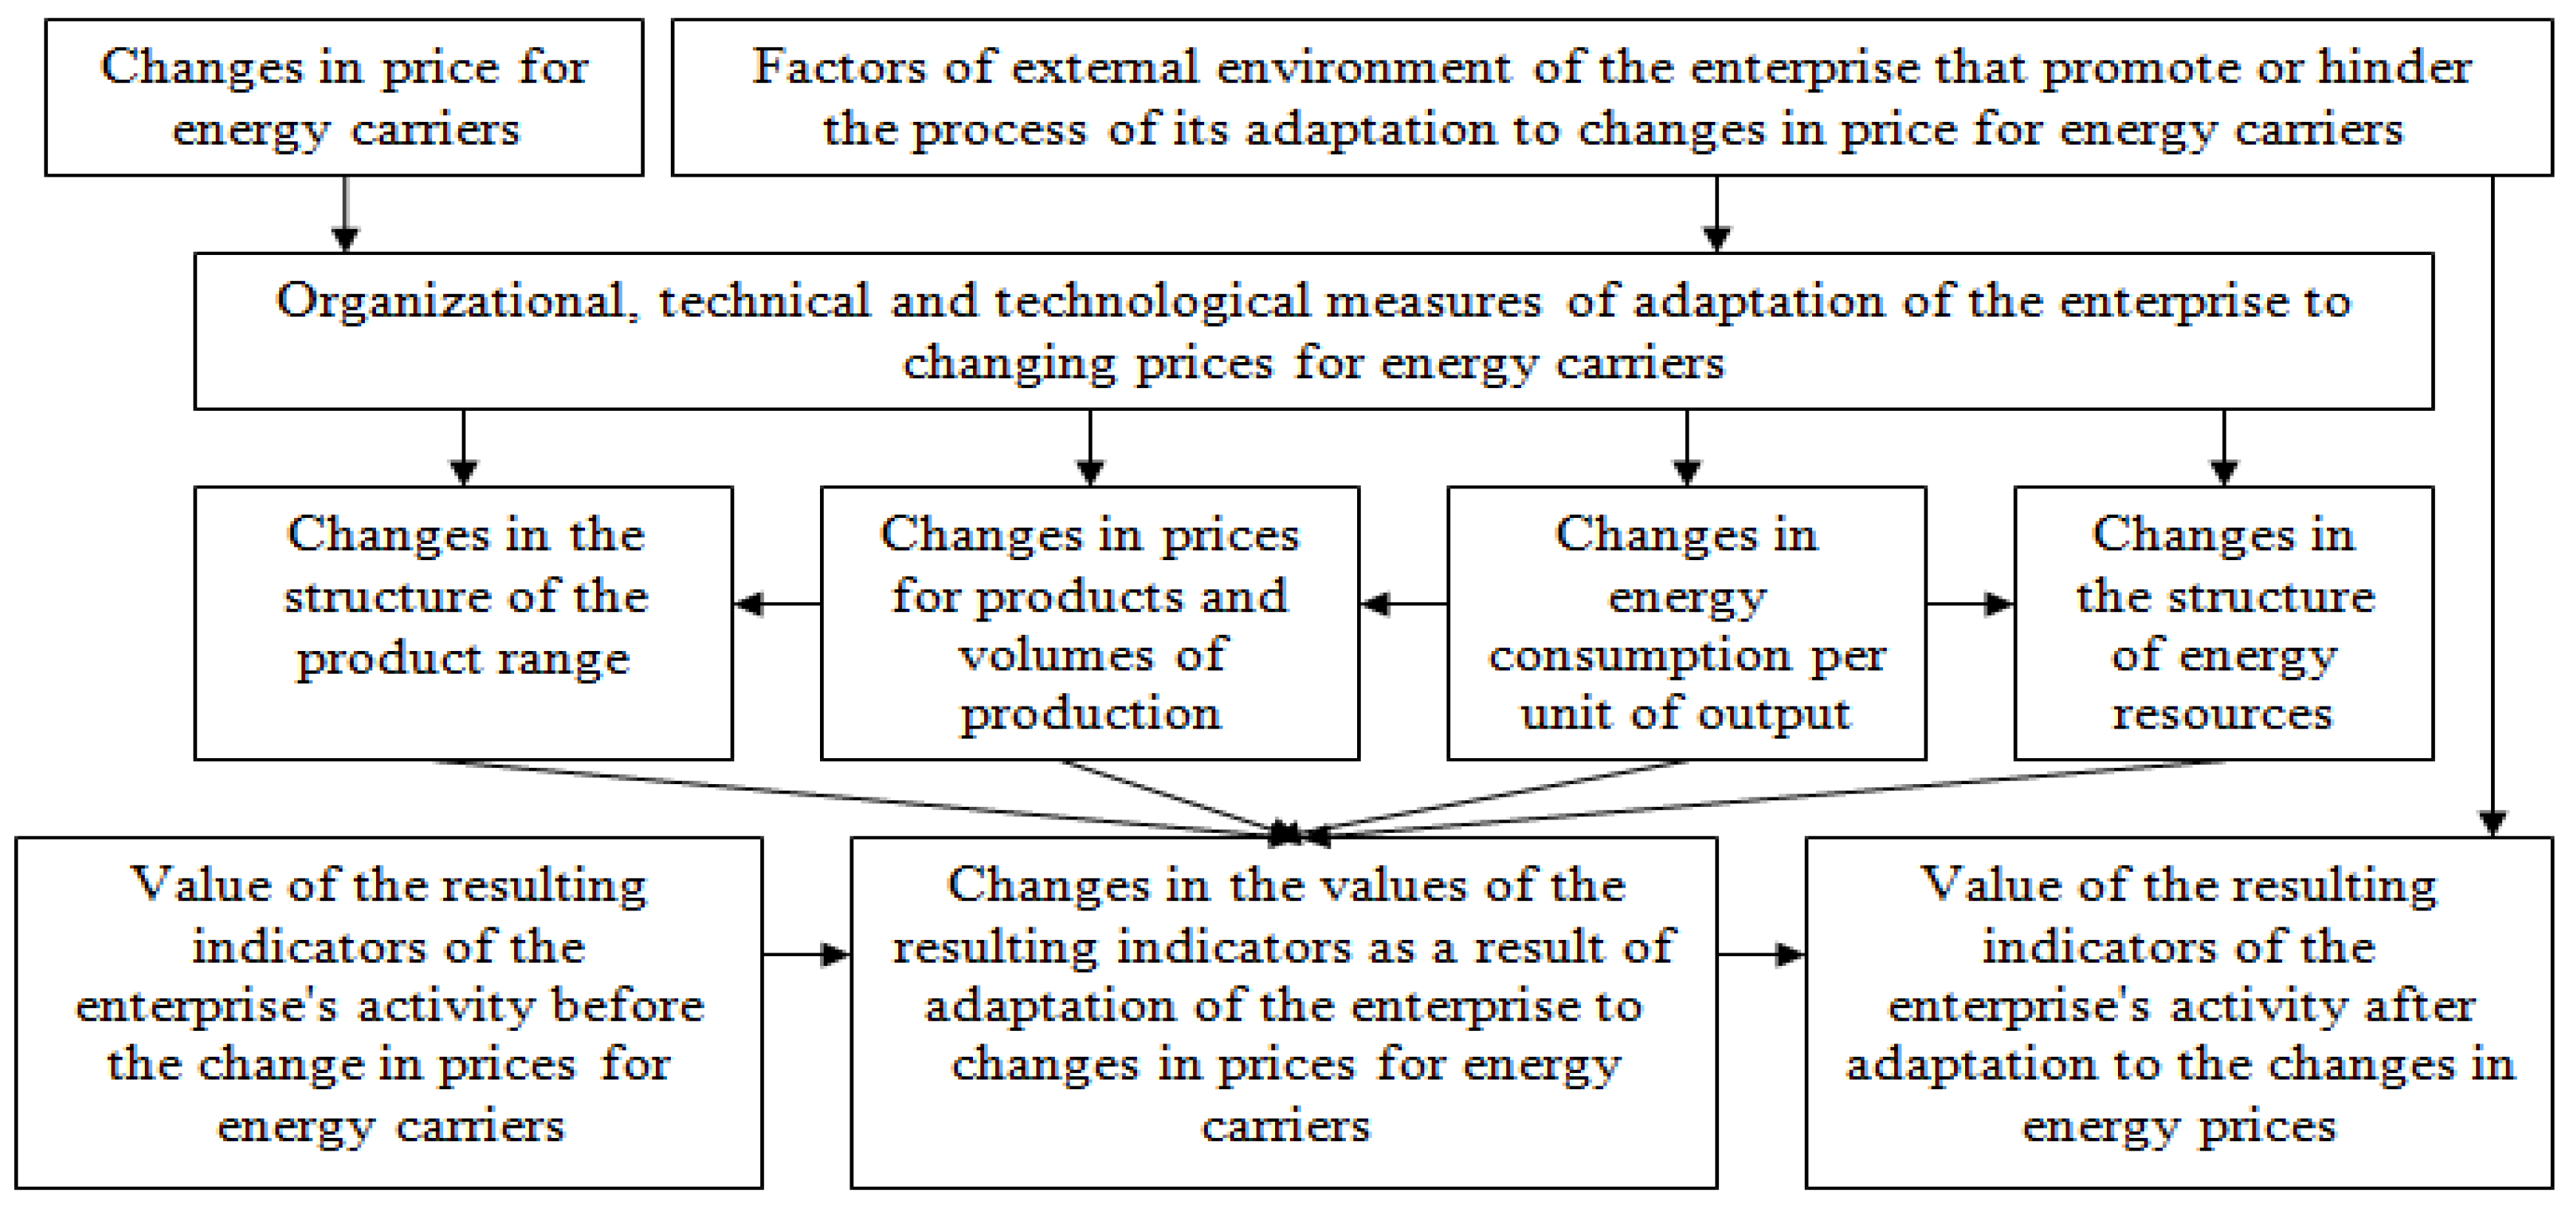
Consequently, we can include the following indicators to the main parameters of adaptation of enterprises to changes in energy prices: the prices and volumes of sales of products, energy consumption per unit of output, the structure of product range and the structure of energy resources used for production. In view of the above, Figure 1 presents a general model of enterprise adaptation to energy price changes.
Consequently, we can identify four types of adaptation of enterprises to changes in energy prices, depending on the ways of such adaptation. However, the grouping of types of such adaptation can be done based on other features. It is important to divide the types of adaptation of enterprises to change in energy prices for internal and general adaptation. Internal adaptation is a certain idealized process, because it assumes that there are no changes in the external environment of the enterprise, except the changes in energy prices. General adaptation takes into account the influence of other environmental factors that promote or hinder this adaptation.
For studying the regularities of adaptation of enterprises to change in energy prices it is necessary to select one of the resulting indicator that the enterprise will try to maximize. This indicator will be called the main resulting indicator. Operational or net profit can be an example of this main resulting indicator. Let us consider the case of adaptation of the enterprise when it consumes energy resources and the prices for energy resources increases on the market. We can assume that the enterprise was in its optimal state and it reached the maximum possible value of the main resulting indicator before energy price increases. However, considering that the enterprise is a consumer of energy resources, the growth of prices for them will lead to decrease in the value of the main resulting indicator at any values of the parameters of adaptation. It is possible to express the following statement: under the conditions of internal adaptation, the value of the resulting indicator cannot exceed its level, which was before the rise in energy prices.
These considerations are important in terms of establishing the limits of opportunities of negative effects compensation of rising prices for energy resources for enterprises that consume energy resources because of the application of adaptation mechanisms.

3.2. Choice of Indicators of Adaptability of the Economy to Changes in Prices for Energy Carriers and Justification of the Method of Decomposition of These Indicators

The proposed approach to construct indicators of adaptability of the economy to changes in energy prices should be explained by the example of an individual enterprise that consumes a certain type of energy resources. We choose two consecutive time intervals–base and reporting. We suppose that the price for this type of energy resource has a tendency to increase. Then, the enterprise’s costs for this energy resource would increase in proportion to the increase in its prices in the situation when the value of all other indicators of the internal and external environment of the enterprise remained at the basic level in the reporting period. Accordingly, its operating profit would decrease by the same value that we would name “the potential losses of the enterprise”. Decrease of operating profit to a lesser extent or even its increase would indicate a certain adaptation of the enterprise to the growth of prices for this energy resource. Under such conditions, the level of this adaptation could be estimated by the ratio of potential loss of profits that the enterprise avoided thanks to adaptation to the overall volume of these potential losses:
I a p = C e ( P 0 P 1 ) C e = 1 P 0 P 1 C e ,
where Iap—the indicator of adaptability of the enterprise to rising prices for a certain type of energy resources by operating profit, share of unit; Ce—potential value of the enterprise’s losses due to rising prices for this type of energy resources, monetary units; P1, P0—value of enterprise operating profit in the reporting and the base period, monetary units.
Considering this, it is possible to carry out a qualitative assessment of the level of adaptability of the enterprise to rise of prices for energy carriers by grading the values of the indicator (1). In particular, if the value of this indicator is less than zero, then this will indicate a negative adaptation. If the value of the indicator (1) exceeds one, then this is a sign of hyperadaptation. There is no adaptation if the value of the indicator (1) is zero. In addition, by dividing the numerical gap from zero to one into three equal parts, we can identify the sets of values of the indicator (1) that correspond to the low, average and high level of adaptability of the enterprise to the rise in energy prices.
We need to note that the indicator (1) refers to the case when price of energy resource used by the enterprise which acts as the consumer of this energy resource rise. If the price for energy resources in the reporting period is lower than in the base one, the indicator of adaptability of the enterprise for this case can be submitted in the form of the following formula:
I a p = P 1 P 0 P e 1 ,
where I a p r —the indicator of the adaptability of an enterprise that consumes a certain energy resource, to a decreasein its prices for operating profit, share of unit; Pe—the potential value of an enterprise’s profit growth due to a decrease in prices for this type of energy resources, monetary units.
It should be noted that the adaptability indicators, which are similar to indicators (1) and (2), can be constructed also for those enterprises which produce energy resources.
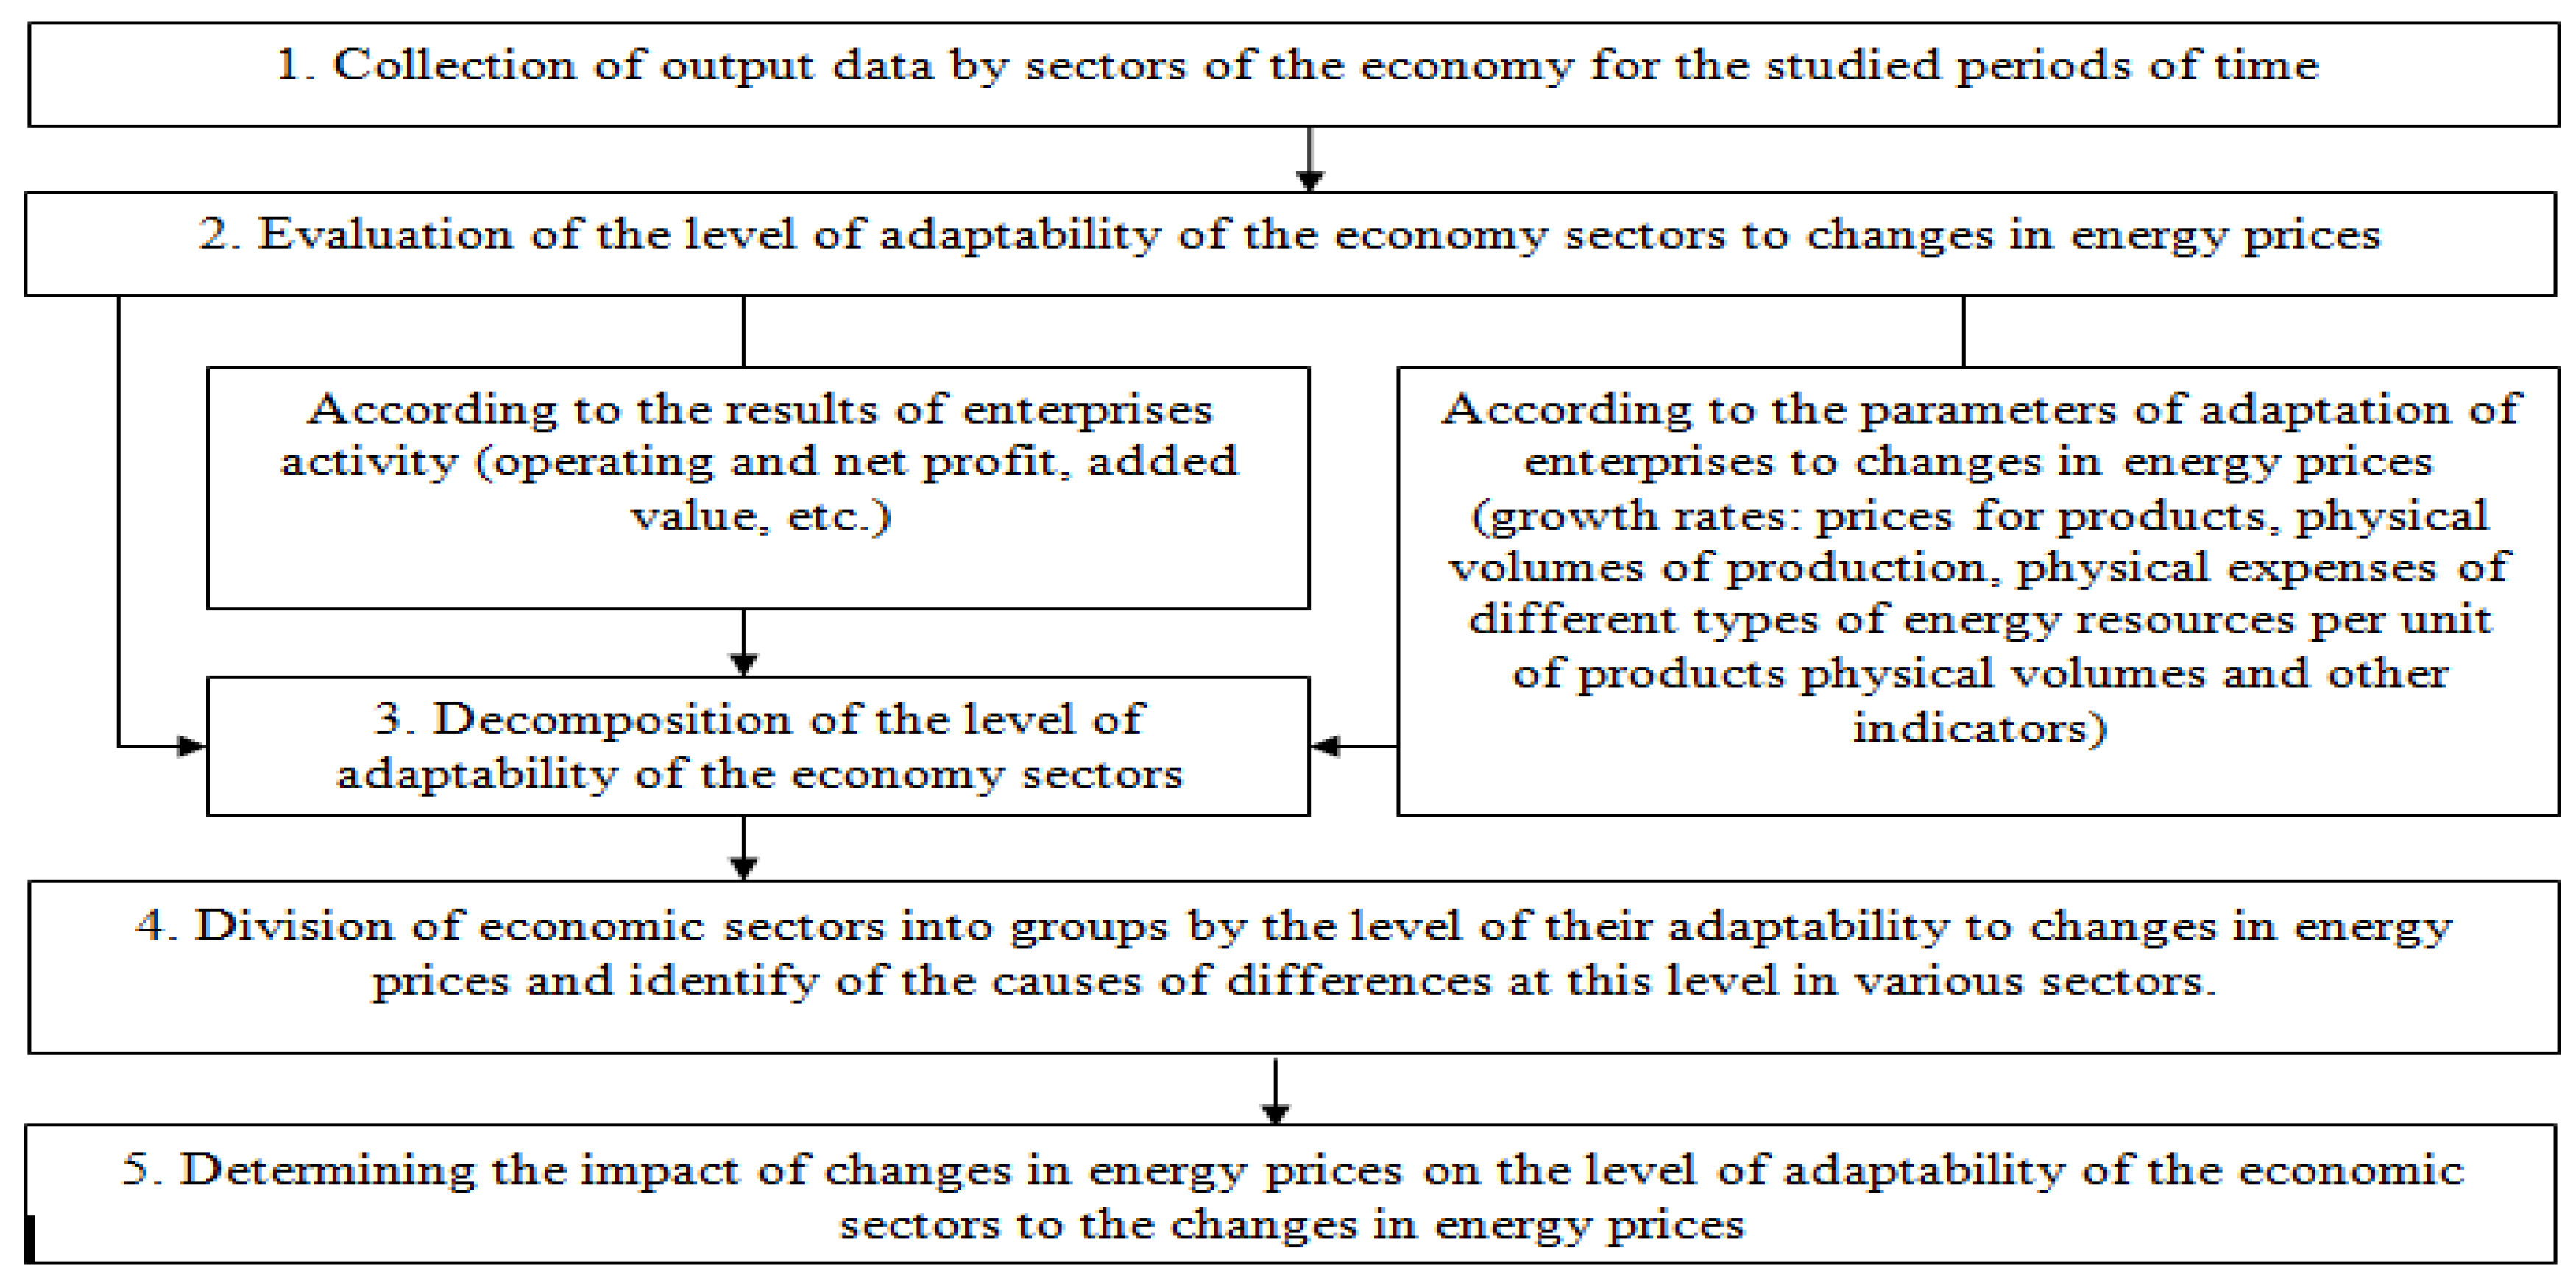
In general, indicators (1) and (2) can describe the level of adaptability to changes in energy prices not only for individual enterprises but also for the economic sectors. At the same time, along with these indicators, the level of such adaptability will be characterized by more partial indicators that meet certain parameters of adaptation. Given this, Figure 2 presents the sequence of the process of assessing adaptability of the economy to changes in prices for energy carriers.
As we can see from the formulas for the calculation of indicators (1) and (2), the value of these indicators depends on the magnitude of the change in enterprise’s profits in the reporting period compared with the base period. At the same time, the value of the change in profit is determined by changes in other indicators. In order to evaluate the effect of these changes on the values of indicators (1) and (2), a method of decomposition of these indicators can be used. To do this, the values of the indicators (1) and (2) should be presented as the sum of several numbers, each of which corresponds to a certain factor, which affects the values of these indicators.
For most economic sectors, production of a large number of different types of products is inherent. Therefore, in the process of decomposition of the values of indicators (1) and (2), the indices of those indicators, the influence of which causes these values, should be used. For example, the indicator (1) can be presented by following formula:
I a p = 1 + P 1 P 0 C e = 1 + R 1 C 1 E 1 ( R 0 C 0 E 0 ) C e ,
where R1, R0—the income (revenue) from sales of products by economic sectors without indirect taxes in the reporting and base periods, monetary units; C1, C0—general operating expenses of enterprises of the economy sector, except the energy costs, in the reporting and base periods, monetary units; E1, E0—energy costs of enterprises in the economy sector in the reporting and base periods, monetary units.
Using the indices of the corresponding indicators, expression (3) can be presented in following formula:
I a p = 1 + R 0 I p I v + C 0 I v I c + E 0 I p e I v I e ( R 0 C 0 E 0 ) E 0 ( I p e 1 ) ,
economy sector; Iυ—index of physical volumes of sales of products (Iυ = R1/(R0Ip)); Ic—index of operating expenses, except energy costs, calculated per unit of physical volume of production (Ic = C1/(C0Iυ)); Ipe—energy resources price index; Ie—the index of physical volumes of energy consumption per unit of physical output (Ie = E1/(E0IpeIυ)).
Note that the presented method for calculating the Iv index is based on the fact that the income (revenue) from sales of products (i.e., R1/R0) is the multiplication of Ip and Iv. Also note that all used indexes are dimensionless values.
Consequently, the indicator (4) can be calculated directly from empirical data.Further, to determine the effect of individual factors on the indicator (4), it is expedient to decompose this indicator. Then the indicator (4) can be submitted as the sum of its five components, namely:
I a p = I a p 1 + I a p 2 + I a p 3 + I a p 4 + I a p 5 ,
where Iap1—the part of the value of the indicator (4), which is due to changes in prices for products; Iap2—the part of the value of the indicator (4), which is due to changes in physical volumes of sales of products; Iap3—the part of the value of the indicator (4), which is due to changes in operating costs, except for energy costs, calculated per unit of physical output; Iap4—the part of the value of the indicator (4), which is due to changes in the physical volumes of energy consumption per unit of physical output; Iap5—the residual value of the indicator (4), which is due to the joint effect of the listed changes (Iap5 = Iap − (Iap1 + Iap2 + Iap3 + Iap4)).
In turn, the listed components of the indicator (5) can be calculated according to the formulas:
I a p 1 = R 0 ( I p 1 ) E 0 ( I p e 1 ) = I p 1 a 0 ( I p e 1 ) ,
I a p 2 = ( R 0 C 0 E 0 ) ( I v 1 ) E 0 ( I p e 1 ) = b 0 ( I v 1 ) a 0 ( I p e 1 ) ,
I a p 3 = C 0 ( I c 1 ) E 0 ( I p e 1 ) = I c 1 c 0 ( I p e 1 ) ,
I a p 4 = ( I e 1 ) / ( I p e 1 ) ,
where a0—the energy intensity of products of the economic sector in the base period (a0 = E0/R0); b0—the share of operating profit in the income of enterprise in the base period (b0 = (R0C0E0)/R0); c0—the ratio between energy costs and other types of operating costs in the base period (c0 = E0/C0).
It should be noted that for the calculating the index of physical volumes of sales of products Iv contained in Formulas (4) and (7), the prices of products are the weights. More accurate results can be obtained if, in calculating the values of the index, which in the Formula (4) are index factors and, the weights would be not prices for products, and the corresponding monetary costs for its unit.
It is possible to obtain more accurate results. In order to do this, the weights in Formula (4) for calculating the values of the index Iv can be changed from prices for products to the corresponding monetary costs per unit of production. Then in Equation (4), where the index Iv is used three times, its values would be somewhat different all three. Accordingly, Equation (7) would be slightly modified. It is advisable to consider these particularities if the level of an individual enterprise is investigated and, accordingly, there is a sufficient array of necessary information. However, at the level of national statistics, at least for the case of Ukraine, the sectored values of the index of physical volumes of sales can only be obtained through the use of price weights.
It should also be noted that the use of aggregated indices greatly complicates the assessment of the impact of changes in the product assortment structure and changes in the structure of energy resources on the level of adaptability of the industries. In fact, the influence of these factors as if “dissolves” in these indices, in particular, in the energy resources price index. It is much easier to evaluate the impact of these factors at the level of individual companies, since there is a larger body of necessary information. In general, you can calculate the energy resources price index twice: in the base and reporting structure of the product assortment and energy resources. If the second value of the energy resources price index is smaller than the first one, the effect of the change in structure is positive. However, despite the objective disadvantages of aggregated indices, the decomposition of the indicators of adaptability of the economic sectors gives an opportunity to get a general idea on the extent of the influence of factors on the values of these indicators.

3.3. Modeling the Relationship between Stability, Sensitivity and Adaptability of the Economic Sectors to the Rise in Energy Prices

The high level of adaptability of a particular enterprise or economic sector to the change in prices for energy resources is undoubtedly a positive phenomenon. However, there may be a situation where the level of such adaptability is not very high; however, the change in energy prices does not significantly affect the change in the profit of a particular enterprise or economic sector. This case is possible, for example, when the share of energy costs in the total cost of production is small. Accordingly, the enterprise or industry has a low sensitivity to changes in energy prices and it is resistant to these changes.
In view of this, it is advisable to investigate the relationship between the stability, sensitivity and adaptability of the economic sectors to changes in energy prices. The stability of the economy will be measured by its operating profit. The following indicator can be used for this purpose:
S = ( P 0 Δ P ) / P 0 = P 1 / P 0 ,
where S—the level of stability of a certain sector of the economy by the size of operating profit, share of unit; P0, P1—the base and new value of operating profit, monetary units; ΔP—change in operating profit, monetary units.
With regard to the sensitivity of a particular economy sector to the change in energy prices, the relative level of this sensitivity can be estimated by the expected share of the change in operating profit. At the same time, we assume that there is no effect of adaptation of the enterprises of the economy sector to changes in energy prices. The relative sensitivity level of a particular economy sector to the change in energy prices will be directly proportional to the magnitude of such a change:
S e n ( d ) = E 0 d / P 0 ,
where Sen(d)—the relative level of sensitivity of a certain sector of the economy to the change in energy prices, share of unit; E0—the basic value of energy costs in analyzed sector of the economy, monetary units; d—average relative increase of prices by types of energy carriers, share of unit.
Note that the index d in Equation (11) is calculated by subtracting a unit from the energy resources price index, which appears in Equation (4), that is, d = Ipe − 1.
Let us consider now in more detail the case when energy prices tend to increase, and enterprises of a certain sector of the economy act as consumers of these energy carriers. Under such conditions, the sensitivity of the economic sector to changes in energy prices can be identified with the vulnerability of the enterprises of this economic sector to these changes. In this case, the indicator (10) can be applied as follows:
S = P 1 P 0 = 1 P 0 P 1 P 0 = 1 P 0 P 1 E 0 d E 0 d P 0 ,
According to Equation (1), the following equality is fair:
( P 0 P 1 ) / ( E 0 d ) = 1 I a p ,
Based on Equations (12) and (13) we obtain a formula that describes the relationship between the stability, sensitivity and adaptability of the economy in relation to the growth of energy prices:
S = 1 ( 1 I a p ) S e n ( d ) ,
There is some interest in the question of how the sensitivity of a certain economic sector to the rise in prices for energy carriers after adaptation to such growth will change. To quantify this change, it can be used the following indicator:
I s e n = S e n 1 ( d ) S e n 0 ( d ) = ( E 1 d P 1 ) / ( E 0 d P 0 ) = T e S ,
where Isen—the growth rate of sensitivity (vulnerability) of the economy to the increase in energy prices in the reporting period compared with the previous period; Sen1, Sen0—the relative level of sensitivity of a particular sector of the economy to the change in energy prices, respectively, in the reporting and previous periods, the share of unit; E1—amount of energy resources expenditures in the reporting period, monetary units; Te—the growth rate of aggregate energy carriers costs in terms of value in the reporting period in comparison with the previous period (Te = E1/E0).
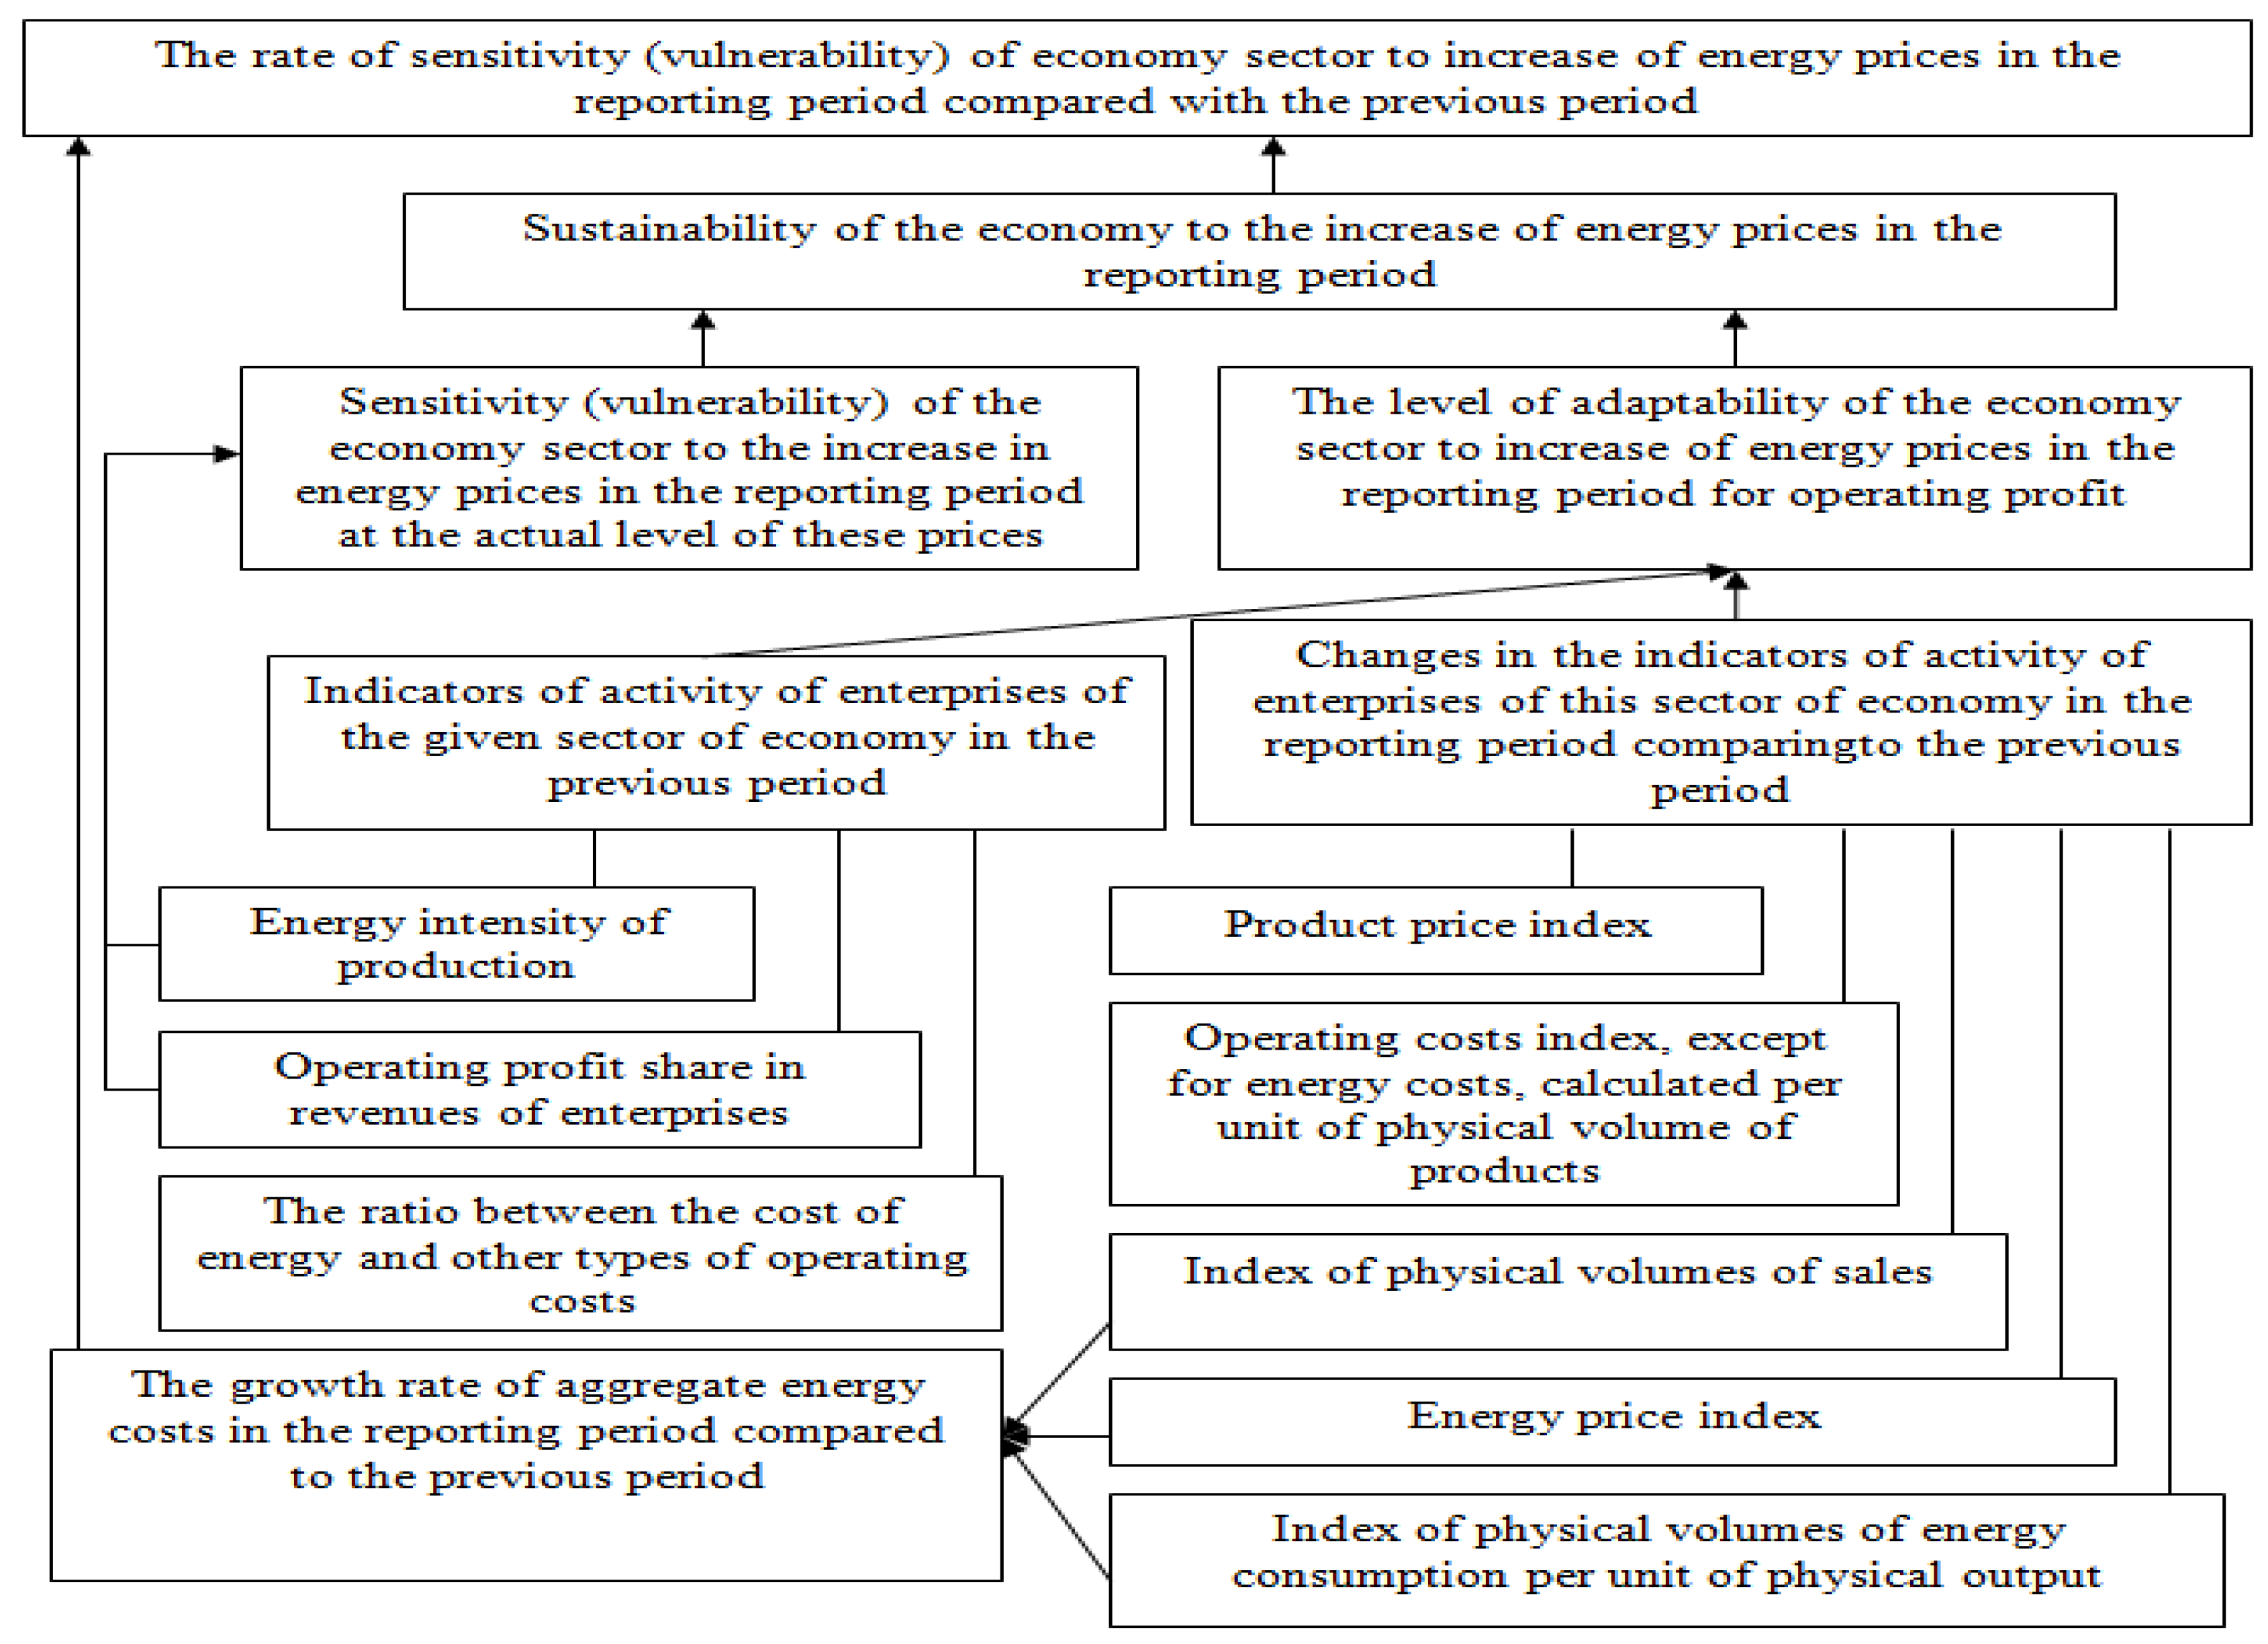
Based on the results obtained above, it is possible to construct a model for the relationship between the sustainability, sensitivity and adaptability of the economy to the increase in energy prices. This model is presented in Figure 3. From this model, in particular, we can see the fact that the sensitivity and adaptability of the economy to the increase in energy prices cannot be considered as completely independent of each other characteristics.

3.4. Modeling the Impact of Energy-Saving Technological Changes on the Level of Adaptability of the Economy to Rising Energy Prices

The implementation of energy-saving technologies is one of the main ways of adaptation of the economy to increasing energy prices. Hence, the rising energy prices can be seen as an incentive for enterprises to introduce energy-saving technologies, and such an introduction, in turn, will act as an instrument for adapting the economy to increasing energy prices.
We simulate the situation when there is a gradual increase in prices for a certain type of energy resources. Suppose that the enterprise that uses this type of energy resource implements technology that reduces energy costs per unit of output. At the same time, physical volumes of production and prices for it remain unchanged at any level of prices for energy resources. Then the difference between the size of the enterprise’s profit before the rise in energy prices and the size of the enterprise’s profit after such growth will be described by the following formula:
Δ P e = P e 0 P e 1 = ( R e 0 C e 0 E e 0 ) ( R e 0 C e 0 E e 0 T f e T p e C e t ) = E e 0 ( T f e T p e 1 ) + C e t
where ΔP—the difference between the size of profit of the enterprise before the rise in energy prices and after the rise in energy prices, provided that the enterprise implemented energy-saving technology, monetary units; Pe0, Pe1—profit of the enterprise before the rise in energy prices and after the rise in energy prices, monetary units; Re0—the revenues from sales of enterprise without indirect taxes, monetary units; Ce0—operating expenses of the enterprise, except the cost of purchasing this energy resource, before the energy price growth, monetary units;Ee0—the costs of the enterprise to purchase this energy resource before the increase its prices, monetary units; Tfe—rate of reduction of physical volume of energy consumption per unit of output after the implementation of energy-saving technology; Tpe—rate of growth of prices for this type of energy resources; Cet—additional operating costs of the enterprise related to the implementation of energy-saving technologies, in particular, the cost of paying interest on the loan, if this implementation is financed by the loan, monetary units.
Let’s substitute expression (16) in Equation (1) instead of P1P0. It should be noted that in this case Ce from Equation (1) is Ee0·(Tpe − 1). Taking into account these considerations we obtain:
I a p e = 1 E e 0 ( T f e T p e 1 ) + C e t E e 0 ( T p e 1 ) ,
where 
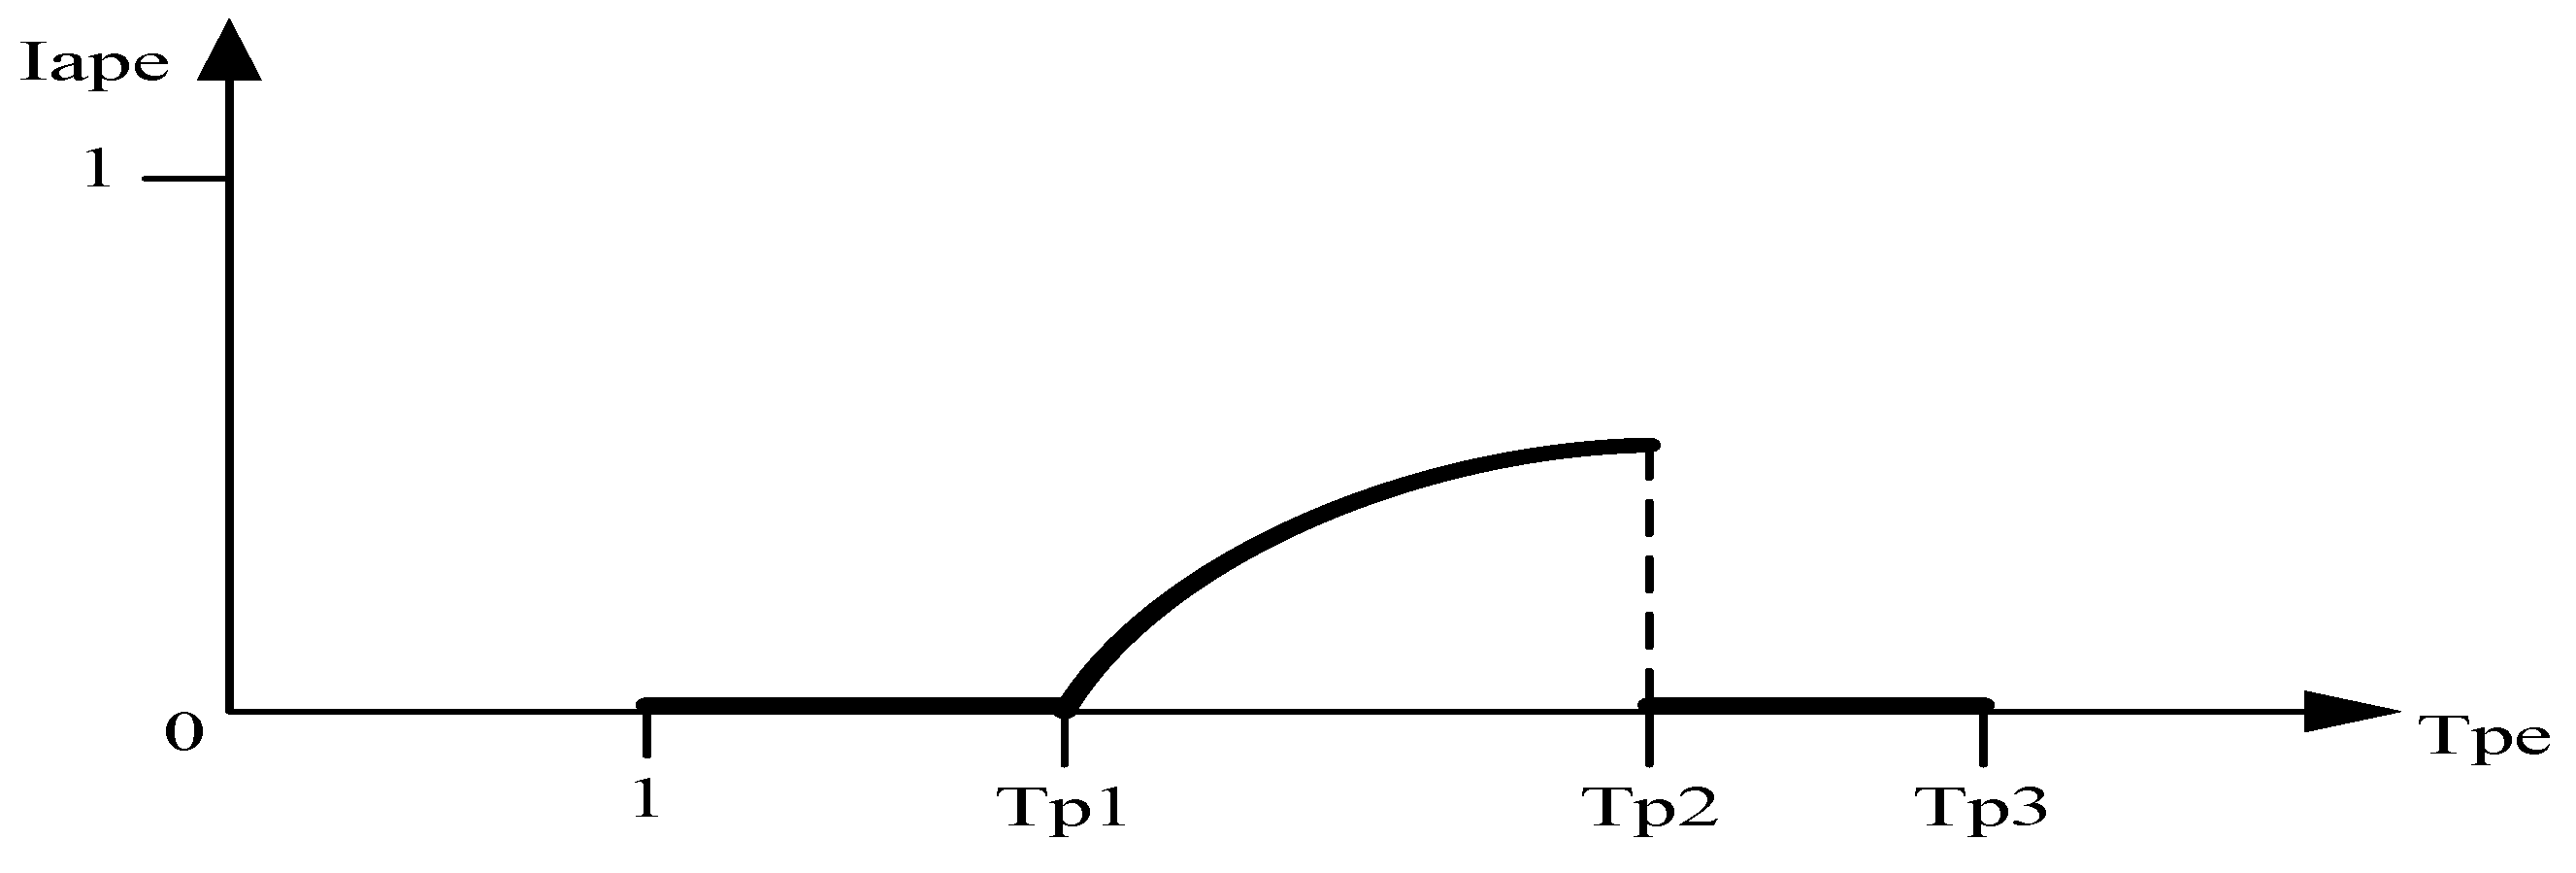
Iape—the indicator of adaptability of the enterprise to the increase of prices for a certain type of energy resources due to the implementation of energy-saving technology, share of unit.
The mathematical analysis of the indicator (17) as a function of Tpe shows that this dependence is increasing and it has a limit of growth that is equal to 1 − Tfe. At the same time, the indicator Iape takes negative values to a certain value of the growth rate of energy prices. We can see an example of negative adaptation. However, this analysis does not set the maximum limit for a possible increase in energy prices, shows that it is expedient for an enterprise to implement energy-saving technology. However, it is obvious that this limit always exists under conditions of constant prices for products manufactured by the enterprise. Also, we should take into account the possible limitations on the financial resources available for the enterprise.
Suppose that currently the company does not have its own funds to finance the project of implementation of the energy-saving technology, which is why this enterprise will use a bank loan. Then the implementation of energy-saving technology would be appropriate if the expected increase in the profit from such an implementation would be no less than the amount of paid interest on the loan. Therefore, the minimum possible rate of growth of prices for this type of energy resources, in which the implementation of energy-saving technology becomes appropriate, can be determined from the following equation:
( E e 0 E e 0 T f e ) T p e 1 = C i n r ,
where Tpe1—the required minimum possible value of the growth rate of energy prices at which the implementation of energy-saving technologies is appropriate; Cin—needed investment in implementing energy-saving technologies, monetary units; r—interest rate, share of unit.
In order to simplify the above models, it is assumed that, besides the expenses of loan servicing, the enterprise has no other current expenses associated with the implementation of energy-saving technology. If such costs exist, then they should be added to the cost of loan servicing.
From Equation (18) we obtain:
T p e 1 = C i n r E e 0 ( 1 T f e ) ,
On the other hand, the maximum possible value of the growth rate of energy prices, in which the enterprise can fully pay interest and repay the principal amount of a loan, can be determined from the following equation:
E e 0 T f e T p e 2 = P 0 + E e 0 C b ,
where Tpe2—the required maximum possible growth rate of energy prices, in which the enterprise can fully pay interest and repay the principal amount of the loan; Cb—total value of interest and principal amount of the loan taken to finance the implementation of energy saving technology for a certain period of time, for example, for a year, with a uniform method of its return, monetary units.
Equation (20) follows from the fact that the cost of purchasing energy resources should not exceed the amount of initial profit and costs of purchasing energy resources before the increase its prices minus interest and principal amount of the loan. This assertion follows from proposed condition that physical volumes of production and prices on it remain unchanged at any level of energy prices. From Equation (20) we obtain:
T p e 2 = P 0 + E e 0 C b E e 0 T f e ,
Suppose now that the company will not introduce energy-saving technology. Then the maximum possible rate of growth of prices for energy resources, which will ensure the break-even activity of the enterprise, will be determined from the following equation:
E e 0 T p e 3 = P 0 + E e 0 ,
where Tpe3—the required maximum possible growth rate of energy prices, in which the enterprise can provide break-even activity without the implementation of energy-saving technology.
Equation (22) follows from the fact that the cost of purchasing energy resource at a certain level of prices for this energy resource should not exceed the amount of initial profit and the cost of purchasing energy resources before increase its. From Equation (22) we obtain:
T p e 3 = 1 + P 0 / E e 0 ,
Thus, with the growth rate of energy prices from 1 to Tpe1 and from Tpe2 to Tpe3 the replacement of existing technology with energy-saving technology is inappropriate. Accordingly, in these intervals of growth rate of energy prices the level of adaptability of the enterprise to changes in prices for energy resources will be zero. At the same time, in the interval between the values of the growth rate of energy prices from Tpe1 to Tpe2 the replacement of existing technology is appropriate. Accordingly, the level of adaptability of the enterprise to changes in energy prices in this gap will be a growing function of the rate of these changes (Figure 4).
Thus, the process of adaptation of the enterprise to the increase of energy prices due to implementation of energy-saving technologies can take place only at a certain range of these prices. At the same time, this conclusion applies not only to enterprises, but also to households, state and local authorities. The difference relates only to initial profit indicator Peo, which appears in the formulas above. In the case of households, the indicator of maximum possible income of a particular household which can be spend on paying for the energy resources should be considered instead of initial profit indicator Peo. For the authorities, the maximum possible amount of revenues of the state or municipal budgets, which can be spend on purchasing energy resources, should be considered instead of the indicator Peo.
In particular, consider the case of borrowing households for the thermo-modernization of housing. The urgency of the problem of reducing the consumption of natural gas in the residential sector of Ukraine is due to the fact that a significant increase in prices for natural gas is almost inevitable in the near future. The growth of prices for natural gas is one of the conditions under which the International Monetary Fund agrees to continue lending to Ukraine.
In order for a particular household to be interested in taking a loan for the implementation of measures for thermo-modernization, two following conditions must be fulfilled. Firstly, the amount of savings on the cost of paying for thermal energy should be no less than the amount of interest on the loan. Secondly, households should have sufficient income to pay the loan and interest thereon. Taking into account the factor of growth of prices for natural gas, these two conditions can be formalized as follows:
E g 0 γ T p g C i g ( 1 β ) r ,
C b g ( 1 β ) R h E g 0 ( 1 γ ) T p g ,
where Eg0—annual household expenses for the payment of thermal energy at the basic level of gas prices, monetary units; γ—share of reducing the cost of thermal energy after the implementation of a certain measure of thermo-modernization; Tpg—rate of increase in gas prices relative to the base level of prices; Cig—investment expenditures necessary for the implementation of a certain measure of thermo-modernization, monetary units; β—share of these expenditures, which is reimbursed by the state; r—annual interest rate, share of unit; Cbg—annual expenses for servicing and repayment of the borrowed loan, provided that the state does not compensate part of the expenditures of households for thermo-modernization, monetary units; Rh—the maximum possible part of the household income that it can use to pay for heat energy and for servicing and repayment of the loan, monetary units.
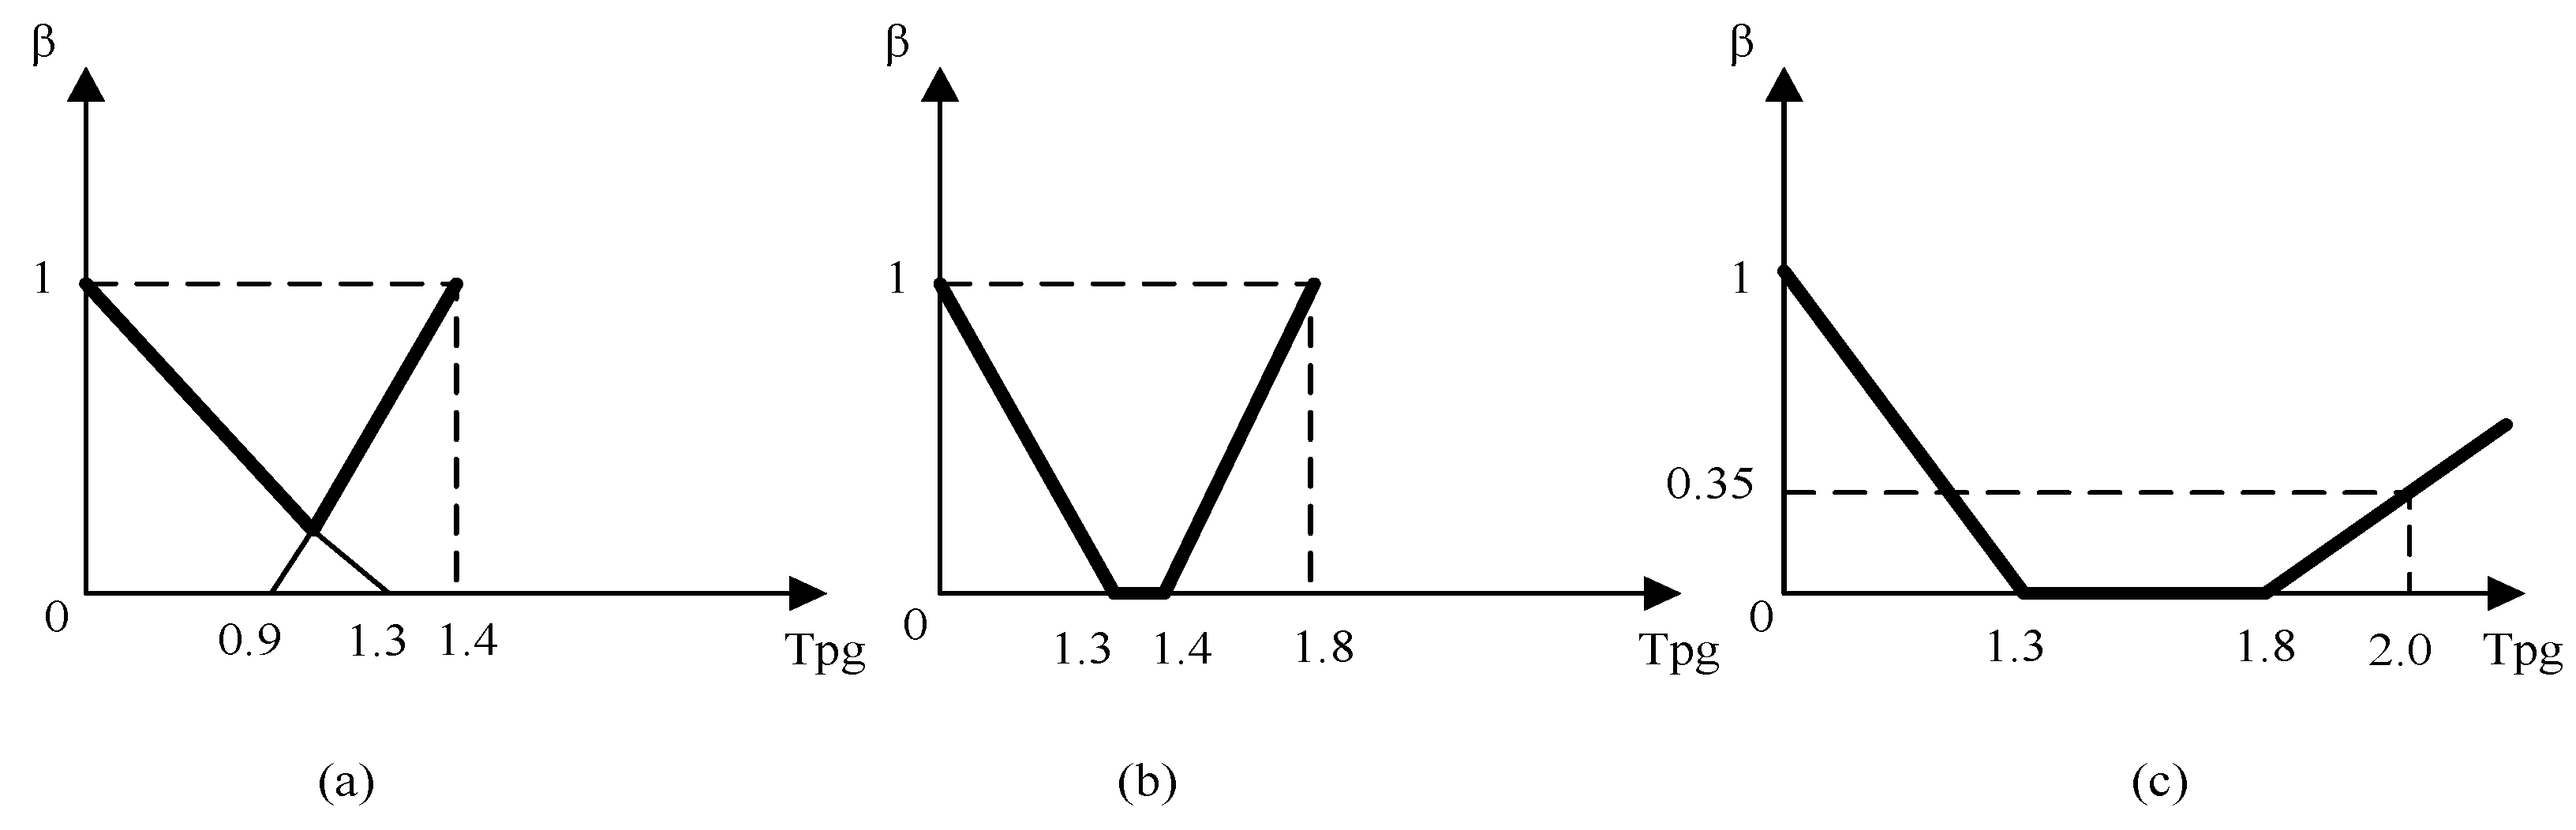
From the expressions (24) and (25) we obtain:
β min 1 ( T p g ) = 1 ( E g 0 γ T p g ) / ( C i g γ ) = 1 e g T p g / γ ,
β min 2 ( T p g ) = 1 R h E g 0 ( 1 γ ) T p g C b g = 1 E g 0 v E g 0 ( 1 γ ) T p g C i g w = 1 e g ( v ( 1 γ ) T p g ) w γ ,
where βmin1(Tpg)—the minimum possible value β, at which the inequality (25) is performed as a function of Tpg, share of unit; eg—the efficiency of investing in a particular measure of thermo-modernization at the basic level of gas prices, share of unit (eg = Eg0·γ/Cig); βmin2(Tpg)—the minimum possible value β, at which the inequality (25) is performed as a function of Tpg, share of unit; ν—the ratio of the part of the household’s income that it can use to pay for heat energy and for servicing and repaying the loan to the cost of paying for heat energy at the base level of gas price, times (ν = Rh/Eg0); w—the ratio of annual household expenses to servicing and repaying the loan to its initial value (w = Cbg/Cig).
Considering that the indicator β cannot be negative, we finally get:
β min ( T p g ) = max { 0 ; β min 1 ( T p g ) ; β min 2 ( T p g ) } ,
where βmin(Tpg)—the minimum share of investment expenditures for a certain measure of thermo-modernization, which is reimbursed by the state, at which the household will be able to use the program of crediting these measures, as a function of Tpg.
In the future, we will call the indicator v from the Equation (27) the coefficient of household expenditure coverage. The proposed models (24)–(28) will be used in conducting an empirical analysis in Section 4.4.

3.5. Justification of Indicators of Adaptability of the Economy to Risks of Energy Markets

Among the various types of energy markets risks, the most important risks from the point of view of consumers of a particular type of energy resources are the following: threat of rising prices for energy resource and threat of insufficient supply volumes of energy resource. The first type of risk relates primarily to enterprises and households. The management of the second type of energy market risk is the responsibility of the governments of countries when developing state strategies of energy security.
Firstly, let us consider the methodological approaches to assessment of the level of adaptability of economic sectors and certain enterprises to the risk of rising prices for energy carriers. The indicators P0 and P1 represent the profit of economic sector or individual enterprise in the previous and reporting periods. It is best to consider operating profit or profit before tax. The indicators Ee0 and Ee1 represent the expenses of the economic sector or individual enterprise for the purchase of certain energy resource in the previous and reporting periods. Finally, the indicators Pe0 and Pe1 mean the average purchase price of this energy resource in the previous and reporting periods.
Then the maximum possible value of the price for analyzed type of energy resources, which will provide the break-even activity, according to data of previous period will be determined from the following equation:
E e 0 p e m 0 / p e 0 = E 0 + P 0 ,
where pem0—the maximum possible value of the price for analyzed type of energy resources, which will provide the break-even activity of economic sector or individual enterprise in the previous period, monetary units.
From Equation (29) we obtain:
p e m 0 = p e 0 ( 1 + P 0 / E 0 ) ,
For the reporting period Equation (30) is transformed into:
p e m 1 = p e 1 ( 1 + P 1 / E 1 ) ,
where pem1—the maximum possible value of the price for analyzed type of energy resources, which will provide the break-even activity of economic sector or individual enterprise in reporting period, monetary units.
Thus, the comparison of indicators (31) and (30) is one of the possible ways of assessing the adaptability of the economic sector or individual enterprise to the risk of rising prices for a particular type of energy resources:
I a p r = p e m 1 p e m 0 = p e 1 p e 0 ( 1 + P 1 / E 1 ) ( 1 + P 0 / E 0 ) = T p e 0 1 ( 1 + P 1 / E 1 ) ( 1 + P 0 / E 0 ) ,
where Iapr—the level of adaptability of the economic sector or individual enterprise to the risk of rising prices for a particular type of energy resources; T p e 0 1 —the rate of growth of prices for a certain type of energy resources in reporting period compared with previous period.
In the case where the value of the indicator (32) exceeds one, this indicates an improvement in the adaptation of the economic sector or individual enterprise to the risk of rising prices for a particular type of energy resource. Indicator (32) refers to one type of energy resources. However, this indicator can be also applied to the totality of energy resources used by particular economic sector or enterprise. In this case, indicators Ee0 and Ee1 will represent the expenses of the economic sector or individual enterprise for the purchase of all kinds of energy resources. Instead of indicator T p e 0 1 it is necessary to use the index of prices for these energy resources. However, the indicator (32) has a significant disadvantage: using this indicator does not take into account the possibility of the economic sector or enterprise to adaptation to the increase in energy prices. However, the direct consideration of this circumstance is an extremely difficult task. This is due to the need to predict the adaptability level of the economic sector or enterprise to change in price for energy resources, depending on the magnitude of this change. However, the reverse statement of the problem is possible when a certain high value of prices for energy resource is set.
Then we can determine the minimum level of adaptation to this value, which will ensure the break-even activity of a particular economic sector or enterprise. This minimum level of adaptability can be determined using the following formula:
I a p 0 ( p e d ) = 1 P 0 E 0 ( p e d / p e 0 1 ) ,
where Iap0(Ped)—the minimum level of adaptability of the economic sector or individual enterprise in the previous period to a certain price for energy resource Ped provided the breakeven activity of this economic sector or enterprise.
Note that Equation (33) is obtained from expression (1) provided that indicator P1 is zero. This condition stems from the task of ensuring the break-even activity of a certain sector of the economy or a certain enterprise. Then the indicator of adaptability of the economic sector or individual enterprise to the risk of rising prices for energy resources to indicator Ped will be the following:
I a p r ( p e d ) = I a p 1 ( p e d ) I a p 0 ( p e d ) = ( 1 P 1 E 1 ( p e d / p e 1 1 ) / ( 1 P 0 E 0 ( p e d / p e 0 1 ) ) ,
where I a p r (Ped)—the level of adaptability of the economic sector or individual enterprise to the risk of rising prices for a particular type of energy resource, taking into account the possibility of adaptation of this economic sector or enterprise to such growth. The indicator Iap1(Ped) is a similar indicator (30), but it is calculated according to the data of the reporting period.
In the case where the value of the indicator (34) is less than one, this indicates an improvement in the adaptation of the economic sector or individual enterprise to the risk of rising prices for a particular type of energy resource. However, the indicator (34) relates to a separate type of energy resources. In order to use this indicator for the entire aggregate of energy resources used by the economic sector or enterprise, it is necessary to set a certain value of the index of growth of prices for these energy resources.
Considering the regularities of adaptation of enterprises to the increase of prices for energy resources, it is necessary to distinguish the case when the measures of such adaptation do not provide sufficient profitability for enterprise at the existing prices for these energy resources. However, the profitability of these measures becomes quite high with the increase in energy prices. This case concerns adaptation, which requires the investments in its implementation. In such conditions, the enterprises invest excessive amounts of money in realization of measures for adaptation to the growth of these prices. Such excessive investments can be called the cost of adaptation of energy consumers to the risks of energy markets.
The concept of the price of adaptation to energy risks is important in developing a state strategy for managing these risks. The issue of compensating the price of adaptation for the consumers of energy resources by the state or municipal budgets can be considered in the state strategy. This is especially necessary for consumers of imported energy resources. The reducing the consumption of such type of energy resources is one of the main areas of management of the risk of insufficient supply of energy resources.
One of the possible approaches to assess the level of adaptability of the economy to the risks of insufficient supply of energy resources is to compare the amount of net imports of a particular type of energy resources during the reporting period with the magnitude of this import in the previous period. It is also possible to compare the magnitude of imports of energy resources by sources of supply, which are divided by their degree of reliability.
Consequently, the assessment of the level of adaptability of the economy to the risks of energy markets should provide the comparison of the values of certain indicators for the reporting period with their values for the previous period. The result of such comparison should make possible to conclude about the nature of the change in the level of adaptation of sectors of the economy or individual enterprises to the risks of energy markets.

4. Empirical Analysis

This section introduces the general characteristics of adaptation process of Ukrainian economy to changes in energy prices.Then, an estimation of adaptability level ofcertain sectors of the economy of Ukraine to changes in energy prices is conducted.In the Section 4.3, the estimation of adaptability of certain sectors of the economy of Ukraine is carried out to risks of energy markets.In the Section 4.4, the estimation of stimulation possibilities of measures on thermo-modernization of buildings by increasing prices for gas is evaluated.To perform the empirical analysis, Microsoft Excel was used. Data charts were prepared in R 3.4.1 using the ggplot2 visualization package.

4.1. General Characteristics of the Process of Adaptation of Ukrainian Economy to Changes in Energy Prices

The peculiarities of the process of adaptation of Ukrainian economy to changes in prices for energy carriers are largely due to the structure of energy consumption and the volumes of import and export of certain types of energy resources. As follows from the data (Figure 5), consumption of coal and peat (32.4%) and natural gas (27.9%) had the biggest share in volume of primary energy consumption of the Ukrainian economy in 2016. At the same time, the share of renewable energy sources was very low (about 4%). In this regard, renewable energy sources currently do not have a significant impact on the potential of Ukrainian economy to adapt to rising energy prices.
It should be noted that for the Ukrainian economy there is a steady tendency towards the growth of energy prices during the last decade. Figure 6 shows the dynamics of such price growth for certain types of energy resources of respective years in the national currency of Ukraine. As it follows from this figure, the price of natural gas for commercial consumers increased by 11.25 times from 2007 to 2016, the price of electricity increased by 4.93 times and the price for imported crude oil by 3.09 times. At the same time, in 2015–2016 the Ukrainian economy was characterized by rather strong inflation. Therefore, price for crude oil in the national currency of Ukraine tended to moderate growth in spite of the general tendency to decrease the world prices for it during this period.
It should also be noted that prices for energy resources in Ukraine are set predominantly by the government or its authorized bodies. This feature of energy pricing is one of the reasons for significant differences in the dynamics of prices for various types of energy resources consumed by the Ukrainian economy.
The process of adaptation of the Ukrainian economy to changes in energy prices and to risks of energy markets is complicated because of the high level of energy intensity of Ukraine’s gross domestic product (GDP). From the data presented in Figure 7, this level was approximately two times higher than the world average level in 2016 and three times higher than the average energy intensity of the EU’s GDP. We also note that the level of energy intensity of Ukraine’s GDP is significantly higher compared to such economically developed countries as the US and Germany or as China and Poland, which are developing rapidly. High energy consumption of housing and communal services of Ukraine, significant level of amortization and depreciation of fixed assets of enterprises, insufficient rates of implementation of energy-saving technologies and other factors are the causes of this phenomenon.
However, as can be seen from Figure 7, there is a general tendency to reduce the energy intensity of Ukraine’s GDP. This tendency is one of the signs of adaptation of the Ukrainian economy to increase in energy prices. Also, the decline in the energy intensity of Ukraine’s GDP naturally causes an increase in the adaptability of its economy to the risks of energy markets.
The change in the energy intensity of Ukraine’s GDP for 2007–2016 years is illustrated in Figure 8. This figure also shows the dynamics of some other indicators that characterize the process of adaptation of the Ukrainian economy to changes in prices for energy carriers and to the risks of energy markets. For this dynamics the volumes of energy consumption were measured in tons of oil equivalent. According to the data presented in Figure 8, the energy intensity of Ukraine’s GDP decreased by 20% from 2007 to 2016, the total energy consumption decreased by 34%, the volume of energy imports decreased by 55%, and the share of import in total energy consumption decreased by 32%. Instead, the consumption of renewable energy sources increased by 52% over the studied period, while the share of renewable energy in total energy consumption increased by 2.31 times.
In relation to other aspects of the Ukrainian economy’s adaptation to the increase in energy prices, it should be noted, in particular, that the share of natural gas in total energy consumption also reduced (Figure 9). We can also note a decrease in the share of industrial energy consumption and an increase in the share of domestic energy consumption in the total volume of energy consumption (Figure 10). This trend is largely due to the change in the volume of natural gas consumption. In particular, the volume of natural gas consumption by industrial consumers decreased by three times in 2016 (compared with 2007). At the same time, natural gas consumption by households, heat generating companies and budget institutions decreased by less than 50% over this period [88]. In this regard, the reduction of natural gas consumption in housing and communal services is one of the main tasks that the Government of Ukraine has set in the development of the Energy Strategy of Ukraine for the period up to 2035 [19].
The Energy Strategy of Ukraine envisages the achievement of an appropriate level of Ukraine’s energy security, thereby increasing the level of adaptability of its economy to the risks of energy markets. In particular, it is envisaged to significantly increase the share of renewable energy sources in the structure of total energy consumption—up to 25% in 2035. It is also planned to reduce the level of energy intensity of Ukraine’s GDP to 0.13 tons of oil equivalent per 1 US dollar.
Implementation of the state energy saving policy is carried out in Ukraine by a special government body—State Agency on Energy Efficiency and Energy Saving of Ukraine. According to this agency, more than 6.5 million individual homes and 88 thousand multi-apartment buildings require energy efficiency measures. At the same time, the estimated need for investment in the implementation of these measures is from 50 to 85 billion US dollars, and the expected reduction in natural gas consumption is 8 billion cubic meters [90].
In order to implement energy efficiency measures in residential buildings in recent years, Ukraine has implemented programs to finance these activities. In particular, partial compensation of household expenses for the purchase of energy-efficient materials and equipment is foreseen by Ukrainian government [22,24]. This compensation is financed from the state and local budgets of Ukraine, as well as from funds of international financial institutions. The Energy Efficiency Fund established in 2017 by Ukrainian government will play an important role in this compensation.
The gradual transition of individual households to solar energy consumption is also happening in Ukraine. In particular, during last three years the number of households in Ukraine that have installed private solar power stations has increased by about ten times [90]. This growth was facilitated by the establishment of preferential tariffs for the sale of surplus electricity generated by these power stations. These tariffs will be valid until at least 2030. Thus, the adaptation of the Ukrainian economy to the increase in prices for energy carriers is definitely happening. However, a quantitative assessment of the extent of this process requires additional research at the level of individual sectors of the economy.

4.2. Estimation of the Level of Adaptability of Certain Sectors of the Economy of Ukraine to Changes in Energy Prices

In order to assess the level of adaptability of certain sectors of the economy of Ukraine to changes in energy prices we selected twelve sectors of the economy. The choice of these industries was made by two main reasons. Firstly, these industries are profitable, while many sectors of the Ukrainian economy in recent years have suffered losses. It is important to assess the ability of these sectors of the economy to undertake profitable activities under rising energy price conditions because they have a significant impact on tax revenues in the state and municipal budgets. Secondly, the selected sectors of the economy consume quite large volumes of energy resources, and some of them are characterized by high energy intensity of production.
Estimation of the adaptability level of selected sectors of the Ukrainian economy to the growth of energy prices realized by operating profit indicator. For the estimation of this level we used Formula (1) taking into account the simultaneous consumption of several types of energy resources by the enterprises. The research was carried out on the basis of the information provided in [91,92] about the amount of operating profit of selected sectors of the economy, the physical volumes of consumption of different types of energy carriers and the price of these energy sources (Table 1).
As the data in Table 1 shows, the level of adaptability of the sectors of economy of Ukraine to the rise of prices for energy carriers differs significantly both in the years of the investigated period and in the sectors of the economy. However, it should be noted that none of the values presented in Table 1 is negative. This means that all sectors of the economy, which were selected for the study showed a certain positive level of their adaptability to the rise of prices for energy resources. At the same time, most indicators of the level of adaptability vary from 0.4 to 0.7. Consequently, the actual decline in the profit of enterprises of sectors of the economy with such adaptability levels was, on average, 40–70% lower than the potentially possible decrease in the profit of these enterprises due to the prices rising for energy carriers. At the same time, for certain sectors of the economy in some years, the level of adaptability even exceeded value one. In particular, it concerns agriculture and hunting, which at present is one of the main export-oriented sector of the Ukrainian economy.
Let us consider now the influence of individual factors on the level of adaptability of sectors of Ukrainian economy to the rise of prices for energy carriers. For this purpose, we use the proposed above method of decomposition of level of adaptability. The results of the decomposition of this level of sectors of the Ukrainian economy to the increase of prices for energy carriers in 2015 comparatively with 2014 are presented in Table 2. These results are obtained using Equations (5)–(9). Herewith, 2015 year was chosen as the reporting period due to the fact that the growth of prices for energy carriers in 2015 compared to 2014 was much stronger than in 2016 compared to 2015.
According to the data presented in Table 2, for the most sectors of the Ukrainian economy which are under consideration, the increase in prices for products of enterprises was the main factor influencing their level of adaptability to the growth of prices for energy carriers in 2015. At the same time, the change in the physical volumes of spending of energy resources per unit of physical volume of the production (output) made a significantly lower impact on the level of adaptability. For some sectors of the economy the impact of changes in physical volumes of products sales on the level of adaptability was positive, and for other sectors, this impact was negative. This difference is due to the fact that some sectors in 2015, compared with the previous year, increased the physical volumes of sales of their products, while the other ones reduced them.
It should also be noted that according to the data presented in Table 2, the level of adaptability of sectors of the Ukrainian economy to the increase of prices for energy carriers in 2015 varied considerably in different sectors. Therefore, it is possible to carry out a qualitative gradation of the economic sectors by the level of their adaptability, as presented in Table 3.
Thus, according to the data presented in Table 3, the vast majority of analyzed sectors of the Ukrainian economy in 2015 were characterized by an average level of adaptation to the growth of prices for energy carriers. At the same time, among the factors that contributed to the difference in the level of adaptability of various sectors of the economy of Ukraine to the increase of prices for energy carriers, the most influential were the following: the energy intensity of products and the price index for products. This conclusion is supported by the data presented in Table 4. In particular, as it follows from these data, the sectors with low energy intensity of products and a higher price index were mainly characterized by a higher degree of adaptability.
Table 5 provides information on these indicators for 2015 in order to determine the extent of the connection between the individual indicators and the level of adaptability of the sectors of Ukrainian economy to the increase of prices for energy carriers. In particular, Table 5 shows the value of the ratio of costs on energy carriers to the operating profit of enterprises. The choice of this indicator is due to the fact that according to Equation (11), it uniquely characterizes the relative level of vulnerability of sectors of the economy to the growth of prices for energy carriers.
Based on the data presented in Table 5, the regression analysis showed that there is a rather close connection between the rate of income growth and the level of adaptability (the determination coefficient is 0.907 at the value of the F-criterion, which is 97.59). At the same time, the index of physical volumes of costs of energy resources per unit of physical volume of production does not significantly affect the level of adaptability (the determination coefficient is 0.13 at the value of the F-criterion, which is 1.5). Herewith, the value of this index for most sectors is only slightly lower than one, what can be explained by the lack of technological flexibility of enterprises. Eventually, there is a fairly tight connection between the indicator of the ratio of spending on energy carriers to the operating profit of enterprises and the level of adaptability. This connection is characterized by the determination coefficient that is 0.89 at the value of the F-criterion, which is 86.66. Thus, sectors of the economy which are less vulnerable to the growth of prices for energy carriers show a higher level of adaptability to such growth.

4.3. Estimation of Adaptability of Certain Sectors of the Economy of Ukraine to Risks of Energy Markets

In order to assess the level of adaptability of certain sectors of the economy of Ukraine to the risk of rising prices for energy carriers, we will use Equation (32), taking into account the simultaneous consumption by enterprises of several types of energy resources. The results of the performed calculations are presented in Table 6. In most years of the period under review, the level of adaptability of economic sectors of Ukraine to the risk of rising energy prices exceeded the unit, which is a positive phenomenon.
We need to assess now the level of adaptability of the economic sectors of Ukraine to the risk of rising energy prices by Equation (34). We accept the index of possible increase in energy prices that is equal to 1.7 in relation to actual energy prices in 2014.
As follows from the data in Table 7, for the most sectors of the economy, their level of adaptability to the risk of rising energy prices is less than one. In calculating Equation (34) it is evidence of an increasing degree of adaptation of the relevant industries to such risk. In other words, in 2015 compared to 2014, enterprises in most industries would have had to make less effort to adapt to rising energy prices, if the index of such growth was 1.7. Moreover, those industries in which the minimum level of adaptability to the risk of rising energy prices by 70% was negative, even without adaptation, would remain profitable.
Let us now assess the adaptability of the Ukrainian economy to the risks of insufficient supply of energy resources on an example of natural gas. The relevant indicators for this assessment are presented in Table 8.
As it follows from the data (Table 8), we can see the tendency towards a general reduction of natural gas consumption by the Ukrainian economy and a reduction of gas consumption per 1 billion dollars US of GDP in 2011–2013. However, in 2015–2016 this trend has stopped. At the same time, the share of imported gas in the total volume of consumption remains high enough. Thus, it is possible to note the insufficiently high level of adaptability of the Ukrainian economy to the threat of insufficient supply of natural gas.

4.4. Estimation of Possibilities of Stimulation of Measures on Thermo-Modernization of Buildings by Increasing Prices for Gas

The low thermal insulation of most residential buildings and the inefficient use of thermal (heat) energy are the main reasons for the high consumption of natural gas in the residential sector of Ukraine. At the same time, the vast majority of households in Ukraine do not have enough own funds to implement thermo-modernization measures. In this regard, the Government of Ukraine has introduced a system of crediting household expenditures for the implementation of measures of thermo-modernization [20,24]. The state must compensate certain percentage of household expenditures for these measures.
Based on the information provided in [93] about the progress of the implementation of the state lending program for individual measures of the thermo-modernization of residential buildings in Ukraine, Table 9 presents the averaged indicators that characterize these measures. According to these data, the effectiveness of investing in these measures at the base level of prices for natural gas is lower than the interest rate. Thus, by partially lending these measures, the state thus transfers the costs of adaptation to the risks of energy markets on its own expenses.
Let us consider now the consequences for the further realization of the state program of crediting measures for thermo-modernization with the possible increase of the price for natural gas by 50%. It should be taken into account that the average share of state compensation for these measures in Ukraine is 35%. According to the data of Table 9, with an increase in natural gas prices by 50%, the efficiency of investing in thermo-modernization measures will exceed the interest rate, that is, inequality (27) will be fulfilled. Then we assume that the values of the indicators in expression (27) are: βmin2(Tpg) = 0.35; Tpg = 1.5, and all other values except the indicator ν are taken from Table 9. Having solved the obtained equation relative to the indicator ν, we find its value for each measure of thermo-modernization and we enter these values in line 6 of Table 9. The calculated values of the indicator ν exceed its actual value. Consequently, with a 1.5-fold increase in natural gas prices, most Ukrainian households will not be able to fully service and repay loans taken to implement thermo-modernization measures. In general, the actual value of the coefficient of coverage of household expenditures substantially affects adaptability of households to the increase in prices for natural gas. This statement is partly illustrated by the Figure 11.
Thus, as it follows from Figure 11, with the growth of the coefficient of coverage of household expenditure, the range of prices for natural gas increases and the share of expenditures which is reimbursed by the state is zero. Accordingly, in this gas price range the households will not need state aid in the implementation of the considered measure on thermo-modernization.

5. Discussion

When choosing an indicator of the adaptability assessment of a particular industry or enterprise to changing energy prices, two key factors should be taken into account. First, it is necessary to take into account the dynamics of prices for energy carriers, i.e., whether prices are rising or falling. Secondly, it is necessary to take into account the specifics of the activity of a particular economic sector or enterprise, i.e., who they prefer to represent—consumers or producers of energy resources. In particular, there is an important situation when a certain industry or enterprise is a consumer of energy resources and energy prices are rising. Then adaptability assessment can be carried out by the indicator of the share of potential loss of profit from the increase in energy prices that were avoided due to adaptation in the total value of these losses. The value of this indicator cannot exceed one if the parameters of adaptation to the price increase become optimal, and the adaptation has only an internal nature. It is possible to decompose the value of this indicator of adaptability, expanding it into five parts, due to the influence of following factors: change in prices for products; change in physical volumes of product sales; change in operating costs, except for energy costs, calculated per unit of physical output; change in physical volumes of energy consumption per unit of physical output; the common influence of the listed changes.
The construction and analysis of economical and mathematical models of the process of energy-saving technological changes at the enterprise showed that the process of adaptation of the enterprise to the increase of energy prices due to introduction of energy saving technologies can take place only in a certain range of these prices. It should be noted that this conclusion concerns not only enterprises, but also households and state and local authorities.
In order to assess the level of adaptability of the economic sectors to the risks of rising energy prices it is expedient to apply two main approaches. The first approach provides establishing the maximum possible energy prices that sector of the economy or enterprise can withstand, providing break-even activity. The second approach takes into account the factor of adaptation to the growth of energy prices. It involves calculating the values of the adaptation index to a predetermined level of energy prices, which ensures the break-even activity of the economic sector or enterprise. At the same time, both approaches involve comparing the results of calculations at successive intervals.
It should be noted that if an adaptation to energy market risks requires investment, the enterprise or household may be forced to pay the price of such an adaptation. This price should be understood as the amount of additional investment in the implementation of adaptation measures in comparison with their economically justified volume. At the same time, the price of adaptation is that smaller, the higher is the profitability of these measures at this level of energy prices. Also, the price of adaptation is linearly decreasing with the rise in energy prices.
Empirical analysis in this paper was performed on the example of Ukraine. There is a steady tendency towards rising energy prices for Ukraine during the last decade, if these prices are reflected in the national currency. At the same time, certain processes of economy adaptation to the growth of energy prices are taking place. In particular, during 2007–2016, the energy intensity of Ukraine’s GDP decreased by 20%, total energy consumption decreased by 34%, energy imports decreased by 55%, and the share of imports in the total volume of energy consumption decreased by 32%.
The results of the calculations showed that the level of adaptability of the Ukrainian economy to the growth of energy prices during 2011–2016 significantly differs both by the years of the investigated period and by the sectors of the economy. However, it can be noted that none of the values of the adaptability indicator is negative. This means that all selected sectors of economy showed a certain positive level of their adaptability to the rise in energy prices. At the same time, most indicators of the level of adaptability varies from 0.4 to 0.7. Consequently, the actual decline in the profit of enterprises of the economic sectors with such adaptability levels was, on average, 40–70% lower than the potentially possible decrease in the profit of these enterprises as a result of rising energy prices. Meanwhile, among the factors that contributed to the difference in the level of adaptability of various sectors of the economy of Ukraine to the increase in energy prices, the energy intensity of products and the index of prices for products were the most influential.
The level of sustainability of a particular economic sector or enterprise to the change in energy prices is unambiguously determined by two factors, namely, the sensitivity to such changes and the level of adaptability to changes in energy prices. An empirical study conducted on the example of the Ukrainian economy has shown that there is also a connection between sensitivity and adaptability. At the same time, the index of physical volumes of energy consumption per unit of physical output did not significantly affect the level of adaptability. Meanwhile, the value of this index for most industries is only a bit lower, which means the low level of technological flexibility of enterprises. Authors also made an assessment of the level of adaptability of Ukrainian economic sectors to the risk of rising energy prices during 2011–2016. In most of the years of this period, the level of adaptability of Ukrainian economic sectors to the risk of rising energy prices exceeded one. This is a positive phenomenon and it means that the relevant sectors of the economy have improved the ability to provide break-even activity in the context of rising energy prices.
The results obtained from the conducted research can be used in practice by state, local government and enterprises. In particular, by estimating the level of adaptability of different sectors of the economy to energy price changes, it is possible to extrapolate some results for future periods. This can be useful in developing forecasts of the impact of expected changes in energy prices on profits and other economic indicators. Additionally, the decomposition of the level of adaptability makes it possible to identify the ways to increase this level in the future.
The results of the assessment of the adaptability of the economy to the changes in energy prices can be used for the economies of those countries which depend heavily on energy imports and have a relatively high energy intensity of products. These countries include Belarus, Hungary, Slovakia, Lithuania, Latvia, Estonia, etc. Ukraine also belongs to such countries. The conducted study showed that the increase in prices for natural gas will negatively affect the scale of implementation of measures for building thermo-modernization. Therefore, in order to compensate this negative impact, the share of state or municipal government reimbursement of households’ expenditures for the measures of thermo-modernization should be increased. The increase in the length of time for which loans are granted is another effective way to compensate these households’ expenditures.
The question of compensation of the price of adaptation to the risks of rising energy prices may be applied by government not only to households but also to commercial consumers. In particular, if the share of adaptation prices in the amount of necessary investments in the implementation of energy saving technologies is relatively small, then the cost of adaptation can be offset by granting enterprises tax privileges. However, at present time there are almost no such privileges in Ukraine.
It is also necessary to note the insufficiently level of adaptation of the Ukrainian economy to the threat of insufficient supply of natural gas. This situation exacerbates the problem of ensuring Ukraine’s energy security. Solving this problem requires both a decrease in gas consumption per unit of GDP and an increase in the volume of own gas production. In turn, such growth requires an increase in the profitability of gas extraction. This will be facilitated both by an increase in the price of it and a reduction in rental payments.

6. Limits and Prospects for Further Research

The indicators of adaptability of the economy sectors to the change in energy prices and the method of their decomposition proposed in this research provide the most reliable results if the adaptation to the change in energy prices is mainly internal. If there are significant exogenous influences, the use of suggested indicators may be complicated. Therefore, it is important to develop effective methods of isolating the internal component of adaptation processes. It should also be noted that in this study the impact of individual factors on the level of adaptability was evaluated, but authors paid less attention to the study of the correlation between these factors. The study of this issue can also be considered as s perspective for further research. In addition, in this paper, the indirect effect of the increase in energy prices on the profit of enterprises due to the possible increase in prices for materials used by these enterprises was not considered. There is also a need to establish more precise rules for defining the adaptation period and to take into account the impact of changes in the structure of the product assortment and structure of energy resources on the adaptability of the economic sectors to the increase in energy prices. Finally, there is a certain interest in assessing the level of adaptability of the economy to the risks of energy markets on the basis of identifying several scenarios of future, each of which has a certain probability of occurrence.

7. Conclusions

In conditions of instability of prices for energy carriers, the ability of the economy to adapt to these changes becomes important. This adaptability is significantly noticeable at the level of enterprises and households. At the same time, it is necessary to distinguish the resulting indicators and parameters of adaptation of enterprises to changes in energy prices. Changes of resulting indicators characterize the results of this adaptation, while changes of parameters of adaptation reflect the process of its implementation. The main parameters of adaptation of enterprises to changes in prices for energy resources are the following: prices and volumes of sales of products, energy consumption per unit of output, product range structure and structure of used energy resources. In order to achieve this goal, the indicators of adaptability of the economy were proposed and a number of economic and mathematical models were developed. Based on these models, a decomposition of the level of adaptability of the branches of the economy to changes in energy prices has been made. The simulation of the correlation between the stability, sensitivity and adaptability of the economic sectors to the increase in energy prices has been performed. An empirical analysis on the example of the Ukrainian economy showed that the indicators and models proposed in this paper can adequately describe the laws of adaptation of the economy to changes in energy prices and risks to energy markets. These indicators and models can contribute to the development of managerial decisions in state regulation of the energy sector and energy markets.

Author Contributions

O.Y., T.P. and R.L. conceived and designed the research; A.S. and T.P. provided theoretical guidance; A.S. interpreted and discussed the data; R.L. and L.L. analyzed the quantitative data; O.Y. and L.L. wrote the paper. All authors read and approved the final manuscript.

Funding

This research received no external funding.

Conflicts of Interest

The authors declare no conflict of interest.

References

  1. Ju, K.; Su, B.; Zhou, D.; Liu, L. Macroeconomic performance of oil price shocks: Outlier evidence from nineteen major oil-related countries/regions. Energy Econ. 2016, 60, 325–332. [Google Scholar] [CrossRef]
  2. He, L.; Ding, Z.; Yin, F.; Wu, M. The impact of relative energy prices on industrial energy consumption in China: A consideration of inflation costs. Springerplus 2016, 5, 1001. [Google Scholar] [CrossRef] [PubMed]
  3. Bretschger, L. Energy prices, growth, and the channels in between: Theory and evidence. Resour. Energy Econ. 2015, 39, 29–52. [Google Scholar] [CrossRef] [Green Version]
  4. Vandyck, T.; Kitous, A.; Saveyn, B.; Keramidas, K.; Los Santos, L.R.; Wojtowicz, K. Economic Exposure to Oil Price Shocks and the Fragility of Oil-Exporting Countries. Energies 2018, 11, 827. [Google Scholar] [CrossRef]
  5. Trang, N.T.N.; Tho, T.N.; Hong, D.T.T. The Impact of Oil Price on the Growth, Inflation, Unemployment and Budget Deficit of Vietnam. Int. J. Energy Econ. Policy 2017, 7, 42–49. Available online: http://www.econjournals.com (accessed on 27 October 2018).
  6. Mahmoodi, A. Oil price reduction impacts on the Iranian economy. Zbornik Radova Ekonomskog Fakulteta u Rijeci 2017, 35, 353–374. [Google Scholar] [CrossRef]
  7. Wang, Q.; Li, R. Impact of Cheaper Oil on Economic System and Climate Change: A SWOT Analysis. Renew. Sustain. Energy Rev. 2016, 54, 925–931. [Google Scholar] [CrossRef]
  8. Brown, S.P.; Yücel, M.K. Energy prices and aggregate economic activity: An interpretative survey. Q. Rev. Econ. Financ. 2002, 42, 193–208. [Google Scholar] [CrossRef]
  9. Denton, M.; Palmer, A.; Masiello, R.; Skantze, P. Managing Market Risk in Energy. IEEE Trans. Power Syst. 2003, 18, 494–502. [Google Scholar] [CrossRef]
  10. Kolos, S.P.; Ronn, E.I. Estimating the commodity market price of risk for energy prices. Energy Econ. 2008, 30, 621–641. [Google Scholar] [CrossRef] [Green Version]
  11. Wurzel, E.; Willard, L.; Ollivaud, P. Recent Oil Price Movements: Forces and Policy Issues; OECD Economics Department Working Papers; OECD Publishing: Paris, France, 2009; Volume 737. [Google Scholar]
  12. Baumeister, C.; Kilian, L. Understanding the Decline in the Price of Oil since June 2014. J. Assoc. Environ. Resour. Econ. 2016, 3, 3131–3158. [Google Scholar] [CrossRef]
  13. Hirth, L. What Caused the Drop in European Electricity Prices? A Factor Decomposition Analysis. Energy J. 2018, 39, 143–157. [Google Scholar] [CrossRef]
  14. Antonenko, A.; Nitsovych, R.; Pavlenko, O.; Takac, K. Reforming Ukraines Energy Sector: Critical Unfinished Business. 2018. Available online: http://carnegieeurope.eu/2018/02/06/reforming-ukraine-s-energy-sector-critical-unfinished-business-pub-75449 (accessed on 26 October 2018).
  15. Rozwałka, P.; Tordengren, H. The Ukrainian Residential Gas Sector: A Market Untapped; OiesPapar: NG 109; Oxford Institute for Energy Studies, 2016; ISBN1 978-1-78467-060-3. ISBN2 978-1-78467-060-3. Available online: https://www.oxfordenergy.org/wpcms/wp-content/uploads/2016/07/The-Ukrainian-residential-gas-sector-a-market-untapped-NG-109.pdf (accessed on 26 October 2018).
  16. Semenenko, I. Energy Security of Ukraine in the Context of Its Sustainable Development. Equilibrium. Q. J. Econ. Econ. Policy 2016, 11, 537–555. [Google Scholar] [CrossRef]
  17. Mandel, D. The conflict in Ukraine. J. Contemp. Cent. East. Eur. 2016, 42, 83–88. [Google Scholar] [CrossRef]
  18. Roman, N.; Wanta, W.; Buniak, I. Information wars: Eastern Ukraine military conflict coverage in the Russian, Ukrainian and U.S. newscasts. Int. Commun. Gazette 2017, 79, 357–378. [Google Scholar] [CrossRef]
  19. Ukraine. Energy Strategy of Ukraine till 2035: Security, Efficiency, Competitiveness. 2017. Available online: www.kmu.gov.ua/control/uk/cardnpd?docid=250250456 (accessed on 27 October 2018).
  20. Warm Loans. Privatbank. Available online: https://privatbank.ua/teplyje-kredity-uteplajems-a-vmeste (accessed on 27 October 2018).
  21. Law of Ukraine “On Energy Saving” from 16.10.2012 No 5463-VI. Available online: http://zakon2.rada.gov.ua (accessed on 27 October 2018).
  22. National Institute of Strategic Studies. Energy Efficiency at Regional Terms. Problems and Prospects. Available online: http://www.niss.gov.ua/content/articles/files/energoefekt-b40dc.pdf (accessed on 27 October 2018).
  23. Donastorg, A.; Renukappa, S.; Suresh, S. Financing Renewable Energy Projects in Developing Countries: A Critical Review. In Proceedings of the 2nd International Conference on Green Energy Technology (ICGET 2017), Rome, Italy, 18–20 July 2017; Volume 83. [Google Scholar] [CrossRef]
  24. Mechanism for Financing Energy Efficiency Measures in Ukraine. Available online: http://www.minregion.gov.ua/wp-content/uploads/2017/03/Mehanizmi-finansuvannya-zahodiv-energoefektivnosti-v-Ukrai--ni.pdf (accessed on 27 October 2018).
  25. IQ Energy. Available online: http://www.iqenergy.org.ua (accessed on 27 October 2018).
  26. USAID Project “Municipal Energy Reform in Ukraine”. Available online: http://www.merp.org.ua/index.php?option=com_content&view=article&id=71&Itemid=1046&lang=uk (accessed on 27 October 2018).
  27. Aalto, P.; KorkmazTemel, D. European Energy Security: Natural Gas and the Integration Process. J. Common Mark. Stud. 2014, 52, 758–774. [Google Scholar] [CrossRef]
  28. Ackoff, R.L.; Magidson, J.; Addison, H.J. Idealized Design: How to Dissolve Tomorrow’s Crisis...Today; Wharton School Publishing: Philadelphia, PA, USA, 2006; 336р, ISBN 0137071116. [Google Scholar]
  29. Daft, R.; Lane, P. Management, 9th ed.; Cengage Learning: Boston, MA, USA, 2010; 699p. [Google Scholar]
  30. Nelson, D.; Adger, W.N.; Brown, K. Adaptation to Environmental Change: Contributions of a Resilience Framework. Annu. Rev. Environ. Resour. 2007, 32, 395–419. [Google Scholar] [CrossRef]
  31. Hodgson, G.; Stephen, H.; Dollimore, D. Adaptability and survival in small- and medium-sized firms. Ind. Corp. Chang. 2017. [Google Scholar] [CrossRef]
  32. Katayama, P.; Bennett, D. Agility, Adaptability and Leanness: A Comparison of Concepts and a Study of Practice. Int. J. Prod. Econ. 1999, 60–61, 43–51. [Google Scholar] [CrossRef]
  33. Erol, O.; Sauser, B.J.; Mansouri, M. A framework for investigation into extended enterprise resilience. Enterp. Inf. Syst. 2010, 4, 111–136. [Google Scholar] [CrossRef]
  34. Contreras, J.; Espinola, R.; Nogales, F.J.; Conejo, A.J. ARIMA models to predict next-day electricity prices. IEEE Trans. Power Syst. 2003, 18, 1014–1020. [Google Scholar] [CrossRef] [Green Version]
  35. Escribano, A.; Ignacio Peña, J.; Villaplana, P. Modelling Electricity Prices: International Evidence. Oxf. Bull. Econ. Stat. 2011, 73, 622–650. [Google Scholar] [CrossRef]
  36. Weron, R. Electricity price forecasting: A review of the state-of-the-art with a look into the future. Int. J. Forecast. 2014, 30, 1030–1081. [Google Scholar] [CrossRef]
  37. Baumeister, C.; Kilian, L. What central bankers need no know about forecasting oil prices. Int. Econ. Rev. 2014, 55, 869–889. [Google Scholar] [CrossRef]
  38. Yu, L.; Wang, S.; Lai, K.K. Forecasting crude oil price with an EMD-based neural network ensemble learning paradigm. Energy Econ. 2008, 30, 2623–2635. [Google Scholar] [CrossRef]
  39. Zhao, L.; Zhang, X.; Wang, S.; Xu, S. The effects of oil price shocks on output and inflation in China. Energy Econ. 2016, 53, 101–110. [Google Scholar] [CrossRef]
  40. Narayan, P.; Narayan, S. Modelling the impact of oil prices on Vietnam’s stock prices. Appl. Energy 2010, 87, 356–361. [Google Scholar] [CrossRef]
  41. Korsakienė, R.; Tvaronavičienė, M.; Smaliukienė, R. Impact of Energy Prices on Industrial Sector Development and Export: Lithuania in the Context of Baltic States. Procedia Soc. Behav. Sci. 2014, 110, 461–469. [Google Scholar] [CrossRef]
  42. Chen, Y.-T. The Factors Affecting Electricity Consumption and the Consumption Characteristics in the Residential Sector—A Case Example of Taiwan. Sustainability 2017, 9, 1484. [Google Scholar] [CrossRef]
  43. Nesbakken, R. Price sensitivity of residential energy consumption in Norway. Energy Econ. 1999, 21, 493–515. [Google Scholar] [CrossRef]
  44. Jamil, F.; Ahmad, E. The relationship between electricity consumption, electricity prices and GDP in Pakistan. Energy Policy 2010, 38, 6016–6025. [Google Scholar] [CrossRef]
  45. Sarwar, S.; Chen, W.; Waheed, R. Electricity consumption, oil price and economic growth: Global perspective. Renew. Sustain. Energy Rev. 2017, 76, 9–18. [Google Scholar] [CrossRef]
  46. Bouznit, M.; Pablo-Romero, M.P.; Sánchez-Braza, A. Residential Electricity Consumption and Economic Growth in Algeria. Energies 2018, 11, 1656. [Google Scholar] [CrossRef]
  47. Holtedahl, P.; Joutz, F.L. Residential electricity demand in Taiwan. Energy Econ. 2003, 26, 201–224. [Google Scholar] [CrossRef]
  48. Hondroyiannis, G. Estimating residential demand for electricity in Greece. Energy Econ. 2004, 26, 319–334. [Google Scholar] [CrossRef]
  49. Narayan, P.K.; Smyth, R. The residential demand for electricity in Australia: An application of the boundstesting approach to cointegration. Energy Policy 2005, 33, 467–474. [Google Scholar] [CrossRef]
  50. Destais, G.; Fouquau, J.; Hurlin, C. Economic Development and Energy Intensity: A Panel Data Analysis. In The Econometrics of Energy Systems; Keppler, J.H., Bourbonnais, R., Girod, J., Eds.; Palgrave Macmillan: New York, NY, USA, 2007; pp. 98–120. [Google Scholar]
  51. Sorrell, S. Reducing energy demand: A review of issues, challenges and approaches. Renew. Sustain. Energy Rev. 2015, 47, 74–82. [Google Scholar] [CrossRef]
  52. La Rue du Can, S.; Leventis, G.; Phadke, A.; Gopal, A. Design of incentive programs for accelerating penetration of energy-efficient appliances. Energy Policy 2014, 72, 56–66. [Google Scholar] [CrossRef]
  53. Cantore, N.; Calì, M.; Velde, D.W. Does energy efficiency improve technological change and economic growth in developing countries? Energy Policy 2016, 92, 279–285. [Google Scholar] [CrossRef]
  54. Hassler, J.; Krusell, P.; Olovsson, C. Energy-Saving Technical Change; NBER Working Paper, No. 18456; NBER: Cambridge, MA, USA, 2012. [Google Scholar] [CrossRef]
  55. Jin, L.; Duan, K.; Tang, X. What Is the Relationship between Technological Innovation and Energy Consumption? Empirical Analysis Based on Provincial Panel Data from China. Sustainability 2018, 10, 145. [Google Scholar] [CrossRef]
  56. Ozolin, L.; Roša, M. The consumer’s role in energy efficiency promotion in Latvian manufacturing industry. Manag. Environ. Qual. 2013, 24, 330–340. [Google Scholar] [CrossRef]
  57. Yemelyanov, O.; Symak, A.; Petrushka, T.; Lesyk, R.; Lesyk, L. Assessment of the technological changes impact on the sustainability of state security system of Ukraine. Sustainability 2018, 10, 1186. [Google Scholar] [CrossRef]
  58. Piva, M.; Vivarelli, M. Technological change and employment: Is Europe ready for the challenge? Eurasian Bus. Rev. 2018, 1–20. [Google Scholar] [CrossRef]
  59. Caliscan, H.K. Technological change and economic growth. Procedia Soc. Behav. Sci. 2015, 195, 649–654. [Google Scholar] [CrossRef]
  60. Sredojecic, D.; Cvetanovic, S.; Boskovic, G. Technological changes in economic growth theory: Neoclassical, endogenous, and evolutionary-institutional approach. Econ. Themes 2016, 54, 177–194. [Google Scholar] [CrossRef]
  61. Hritonenko, N.; Yatsenko, Y. Modeling of Technological Change. In Mathematical Modeling in Economics, Ecology and the Environment. Applied Optimization; Springer: Boston, MA, USA, 2007; Volume 3, pp. 41–52. ISBN 978-1-4419-4821-1. [Google Scholar]
  62. Tang, C.F.; Tan, E.C. Exploring the nexus of electricity consumption, economic growth, energy prices and technology innovation in Malaysia. Appl. Energy 2013, 104, 297–305. [Google Scholar] [CrossRef]
  63. Vidal-Amaro, J.J.; Ostergaard, P.A.; Sheinbaum-Pardo, C. Optimal Energy Mix for transitioning from Fossil Fuels to Renewable Energy Sources—The Case of the Mexican Electricity System. Appl. Energy 2015, 150, 80–96. [Google Scholar] [CrossRef]
  64. Vidadili, N.; Suleymanov, E.; Bulut, C.; Mahmudlu, C. Transition to renewable energy and sustainable energy development in Azerbaijan. Renew. Sustain. Energy Rev. 2017, 80, 1153–1161. [Google Scholar] [CrossRef]
  65. Salam, A.M.; Khan, S.A. Transition towards sustainable energy production—A review of the progress for solar energy in Saudi Arabia. Energy Explor. Exploit. 2017, 36, 3–27. [Google Scholar] [CrossRef]
  66. Khalil, A.; Rajab, Z.; Amhammed, M.; Asheibi, A. The benefits of the transition from fossil fuel to solar energy in Libya: A street lighting system case study. Appl. Sol. Energy 2017, 53, 138–151. [Google Scholar] [CrossRef]
  67. Byrnes, L.; Brown, C.; Foster, J.; Wagner, L.D. Australian Renewable Energy Policy: Barriers and Challenges. Renew. Energy 2013, 60, 711–721. [Google Scholar] [CrossRef]
  68. Oyedepo, S.O. Energy and sustainable development in Nigeria: The way forward. Energy Sustain. Soc. 2012, 2, 15. [Google Scholar] [CrossRef]
  69. Mazloomi, K.; Gomes, C. Hydrogen as an energy carrier: Prospects and challenges. Renew. Sustain. Energy Rev. Econ. 2012, 16, 3024–3033. [Google Scholar] [CrossRef]
  70. De Canio, S. The efficiency paradox: Bureaucratic and organizational barriers to profitable energy-saving investments. Energy Policy 1998, 26, 441–454. [Google Scholar] [CrossRef]
  71. De Groot, H.L.F.; Verhoef, E.T.; Nijkamp, P. Energy saving by firms: Decision-making, barriers and policies. Energy Econ. 2001, 23, 717–740. [Google Scholar] [CrossRef]
  72. Sardianou, E. Barriers to industrial energy efficiency investments in Greece. J. Clean. Prod. 2008, 16, 1416–1423. [Google Scholar] [CrossRef]
  73. Yingjian, L.; Abakr, Y.A.; Qi, Q.; Xinkui, Y.; Jiping, Z. Energy efficiency assessment of fixed asset investment projects—A case study of a Shenzhen combined-cycle power plant. Renew. Sustain. Energy Rev. 2016, 59, 1195–1208. [Google Scholar] [CrossRef]
  74. Terziev, V.; Enimaneva, S.; Filipov, S. Economic Efficiency and Investment Implementation in Energy Saving Projects. J. Innov. Sustain. 2017, 3. Available online: https://ssrn.com/abstract=3139964 (accessed on 17 November 2018).
  75. Tyazhkorob, V. Innovative-ivestment projects energy-savingss are in system of strategic plans of development of region. Financ. Credit Act. Probl. Theory Pract. 2015, 2. [Google Scholar] [CrossRef]
  76. Pierret, D. The Systemic Risk of Energy Markets. SSRN Electron. J. 2013. [Google Scholar] [CrossRef] [Green Version]
  77. Balcılar, M.; Demirer, R.; Hammoudeh, S.; Nguyen, D.K. Risk spillovers across the energy and carbon markets and hedging strategies for carbon risk. Energy Econ. 2016, 54, 159–172. [Google Scholar] [CrossRef] [Green Version]
  78. Mulhall, R.A.; Bryson, J.R. Energy price risk and the sustainability of demand side supply chains. Appl.Energy 2014, 123, 327–334. [Google Scholar] [CrossRef]
  79. Park, J.; Ratti, R.A. Oil price shocks and stock markets in the U.S. and 13 European countries. Energy Econ. 2008, 30, 2587–2608. [Google Scholar] [CrossRef]
  80. Batten, J.A.; Kinateder, H.; Szilagyi, P.; Wagner, N. Can stock market investors hedge energy risk? Evidence from Asia. Energy Econ. 2017, 66, 559–570. [Google Scholar] [CrossRef]
  81. Shen, Y.; Shi, X.; PadinjareVariam, H.M. Risk Transmission Mechanism between Energy Markets: A VAR for VaR Approach. Energy Econ. 2018, 75, 377–388. [Google Scholar] [CrossRef]
  82. Deng, S.J.; Oren, S.S. Electricity derivatives and risk management. Energy 2006, 31, 940–953. [Google Scholar] [CrossRef]
  83. Ang, B.W.; Choong, W.L.; Ng, T.S. Energy security: Definitions, dimensions and indexes. Renew. Sustain. Energy Rev. 2015, 42, 1077–1093. [Google Scholar] [CrossRef]
  84. Huang, C.-H.; Su, H.-P.; Yang, C.-W.; Hong, C.-Y.; Li, J.-F. Adaptability to Energy, Production Efficiency and the Crude Oil Price: Evidence from a Small Open Economy. Energy Sustain. VI 2015, 195, 173–184. [Google Scholar] [CrossRef]
  85. Kerschner, C.; Prell, C.; Feng, K.; Hubacek, K. Economic vulnerability to Peak Oil. Glob. Environ. Chang. 2013, 23, 1424–1433. [Google Scholar] [CrossRef] [Green Version]
  86. Chai, J.; Cao, P.; Zhou, X.; Lai, K.K.; Chen, X.; Su, S.S. The Conductive and Predictive Effect of Oil Price Fluctuations on China’s Industry Development Based on Mixed-Frequency Data. Energies 2018, 11, 1372. [Google Scholar] [CrossRef]
  87. Chandran, V.; Sharma, S.; Madhavan, K. Electricity consumption-growth nexus: The case of Malaysia. Energy Policy 2010, 38, 606–612. [Google Scholar] [CrossRef]
  88. State Statistic Service of Ukraine. Economic Statistics/Economic Activity/Energy. Available online: http://www.ukrstat.gov.ua/ (accessed on 17 November 2018).
  89. Energy Efficiency Trends and Policies in Industry. Available online: http://www.odyssee-mure.eu/publications/br/energy-efficiency-in-industry.html (accessed on 17 November 2018).
  90. State Agency on Energy Efficiency and Energy Saving of Ukraine. Available online: http://saee.gov.ua/en (accessed on 17 November 2018).
  91. Activity of Economic Entities. Statistical Collection 2016. Available online: http://www.ukrstat.gov.ua/druk/publicat/kat_u/publ9_u.htm (accessed on 17 November 2018).
  92. Ukrstat.org—State Statistics Service of Ukraine Documents Publishing. Available online: https://ukrstat.org/en (accessed on 17 November 2018).
  93. Complex Study of Results and Economic Efficiency of the State Program of Energy Efficiency and Development Sphere of Production of Energy with Restored Source of Energy and Alternative Fuels for 2010–2020 Years by Results of Examination of Participants in 2016–2017. Available online: http://saee.gov.ua/sites/default/files/Ocinka.pdf (accessed on 17 November 2018). (In Ukrainian)
Figure 1. The general model of enterprise adaptation to changes in prices for energy carriers.
Energies 11 03529 g001
Figure 2. The sequence of assessing the adaptability of the economy to the changes in energy prices.
Energies 11 03529 g002
Figure 3. Model of the relationship between the sustainability, sensitivity and adaptability of the economy to the increase in energy prices.
Energies 11 03529 g003
Figure 4. Schematic representation of dependence of the indicator of adaptability of the enterprise to the increase of prices for a certain type of energy resources Iape from the growth rate Tpe.
Energies 11 03529 g004
Figure 5. The structure of energy consumption of Ukrainian economy in 2016. Source: [88].
Energies 11 03529 g005
Figure 6. Growth rate of prices for certain types of energy resources for commercial energy consumers in Ukraine in the national currency relative to 2007. Source of information: [88].
Energies 11 03529 g006
Figure 7. Dynamics of the level of energy intensity of GDP in 2000–2016 in kg of oil equivalent per 1 USD per purchasing power parity of 2005. Source of information: [89].
Energies 11 03529 g007
Figure 8. The rate of change in individual indicators that characterize the process of adaptation of the Ukrainian economy to changes in energy prices and to risks of energy markets, relative to 2007: 1—energy intensity of GDP; 2—total energy consumption; 3—volume of import of energy; 4—share of import in the total energy consumption; 5—volume of renewable energy sources; 6—share of renewable energy in total energy consumption. Source of information: [88].
Energies 11 03529 g008
Figure 9. Dynamics of the structure of energy consumption in Ukraine by types of energy resources in percentages. Source of information: [88].
Energies 11 03529 g009
Figure 10. Dynamics of the final energy consumption structure in Ukraine by consumers types (%). Source of information: [88].
Energies 11 03529 g010
Figure 11. The dependence of the share of expenditures on installation of heat-saving windows and balcony doors, which is reimbursed by the state from the rate of growth of prices for natural gas, provided that the value of the coefficient of coverage of household expenditures is: (a) ν = 1.2; (b) ν = 1.6; (c) ν = 2 (the graphs are based on the expression (28) according to Table 9).
Energies 11 03529 g011
Table 1. The level of adaptability of sectors of the Ukrainian economy to the rise of prices for energy carriers (2011–2016), shares of unit.
Sectors of the Economy201120122013201420152016
1. Agriculture and hunting0.6290.6531.1381.0071.0951.054
2. Forestry and logging0.4860.5761.4451.0270.8240.652
3. Production of food products0.8461.5921.2951.3030.8810.710
4. Production of beverages0.5540.4450.7240.8860.5200.664
5. Manufacture of clothes0.5120.5190.3020.7090.5030.497
6. Manufacture of footwear0.6660.5040.7990.5870.6340.588
7. Wood processing0.5130.4210.6020.7570.8430.549
8. Manufacture of leather and leather products0.4720.7030.7240.7800.5240.441
9. Manufacture of paper and paper products0.5710.4240.6030.7470.6640.516
10. Production of agrochemical products0.5550.5120.6970.6480.3160.595
11. Manufacture of pharmaceutical products and preparations0.5790.4810.4300.6550.6550.424
12. Engineering0.6120.6730.6260.5980.4760.629
Table 2. The results of the decomposition of the level of adaptability of the sectors of the Ukrainian economy to the rise of prices for energy carriers in 2015 comparatively with 2014.
Sectors of the EconomyAdaptability Level, Share of UnitPart of the Level of Adaptability that is Due to
Changes of Prices for ProductsChange in the Physical Volumes of Sales of ProductsChange in Operating Expenses, except of Spending on Energy Carriers, Per Unit of OutputChange in the Physical Volumes of Spending on Energy Carriers, Per Unit of OutputThe Combined Effect of Listed Changes
1. Agriculture and hunting1.0951.2120.065−0.1580.076−0.100
2. Forestry and logging0.8240.7070.061−0.1360.0890.102
3. Production of food products0.8811.0080.054−0.1630.067−0.084
4. Production of beverages0.5200.5000.003−0.0310.100−0.053
5. Manufacture of clothes0.5030.2200.009−0.0080.0840.197
6. Manufacture of footwear0.6340.6280.008−0.0370.060−0.025
7. Wood processing0.8430.8150.051−0.1250.0470.055
8. Manufacture of leather and leather products0.5240.483−0.002−0.0190.136−0.074
9. Manufacture of paper and paper products0.6640.602−0.0120.0370.071−0.035
10. Production of agrochemical products0.3160.186−0.0100.0910.067−0.017
11. Manufacture of pharmaceutical products and preparations0.6550.5900.005−0.0150.0480.027
12. Engineering0.4760.497−0.004−0.0200.107−0.103
Table 3. The division of sectors of the economy of Ukraine in terms of their adaptability to the rise of prices for energy carriers in 2015.
Levels of AdaptabilityIntervals of Values of Adaptation LevelSectors of Economy
LowFrom 0 to 0.33Production of agrochemical products
MediumFrom 0.33 to 0.67Production of beverages; manufacture of clothes; manufacture of clothes; manufacture of leather and leather products; manufacture of paper and paper products; manufacture of pharmaceutical products and preparations; engineering
HighFrom 0.67 to 1.00Forestry and logging; production of food products; wood processing
Hyper adaptabilityMore than 1.00Agriculture and hunting
Table 4. The division of sectors of the economy of Ukraine in terms of energy intensity of products and the price index for products.
The Level of Energy Intensivity of Products of Sectors 1Price Index for Products of Sectors of the Economy
LowMediumHigh
Low-Manufacture of clothes; manufacture of footwearAgriculture and hunting; forestry and logging
MediumEngineeringProduction of beverages; manufacture of leather and leather products; manufacture of paper and paper products; manufacture of pharmaceutical products and preparationsProduction of food products; wood processing
HighProduction of agrochemical products--
1 Energy intensity of products was estimated for 2014 and the price index for products was taken for 2015 compared with 2014.
Table 5. Separate indicators that characterize or determine the level of adaptability of sectors of the Ukrainian economy to the prices increase for energy carriers in 2015 comparatively to 2014.
Sectors of the EconomyAdaptability Level, Shares of UnitThe Growth Rate of Revenue from Sales of Products, TimesIndex of Physical Volumes of Costs of Energy Resources Per Unit of Physical Output, TimesThe Ratio of Spending/Costs of Energy Resources to Operating Profit of Enterprises, Times
1. Agriculture and hunting1.0951.0700.9750.61
2. Forestry and logging0.8241.0610.9670.51
3. Production of food products0.8811.0690.9780.49
4. Production of beverages0.5201.0260.9620.37
5. Manufacture of clothes0.5031.0200.9680.33
6. Manufacture of footwear0.6341.0310.9790.40
7. Wood processing0.8431.0590.9830.48
8. Manufacture of leather and leather products0.5241.0210.0470.34
9. Manufacture of paper and paper products0.6641.0250.9680.33
10. Production of agrochemical products0.3161.0040.9760.25
11. Manufacture of pharmaceutical products and preparations0.6551.0300.9850.46
12. Engineering0.4761.0210.9640.28
Table 6. The level of adaptability of sectors of the Ukrainian economy to the rise of prices for energy carriers (2011–2016) 1.
Sectors of the EconomyThe Adaptability Level of Sectors of the Economy of Ukraine to the Risk of Rising Prices for Energy Carriers by the Years, Share of Unit
201120122013201420152016
1. Agriculture and hunting1.2371.0151.3461.3021.2211.039
2. Forestry and logging1.0670.9851.3781.3211.1981.107
3. Production of food products1.1231.0691.4151.4871.1921.112
4. Production of beverages1.0760.9781.2421.4441.4291.089
5. Manufacture of clothes1.0580.9871.1981.1381.1461.066
6. Manufacture of footwear1.0611.0791.2731.1561.1611.045
7. Wood processing1.1521.0411.2121.2051.1991.083
8. Manufacture of leather and leather products1.0721.1151.2351.3291.1591.044
9. Manufacture of paper and paper products1.1231.0541.1841.2831.2311.074
10. Production of agrochemical products1.1151.1111.1861.2991.0911.082
11. Manufacture of pharmaceutical products and preparations1.0931.1061.1881.2121.1421.058
12. Engineering1.1461.0751.2181.2851.1301.090
1 Information sources: [91,92].
Table 7. Results of the assessment of the level of adaptability of Ukrainian economic sectors to the risk of rising energy prices by 70% in 2014–2015.
Sectors of the EconomyThe Minimum Level of Adaptability to the Risk of Rising Energy Prices by 70%, which Provides a Break-Even Activity of Economic SectorsThe Level of Adaptability of Economic Sectors to the Risk of Rising Energy Prices by 70%
20142015
1. Agriculture and hunting0.133−0.708−5.322
2. Forestry and logging0.265−0.349−1.315
3. Production of food products0.307−0.190−0.619
4. Production of beverages0.4780.4080.854
5. Manufacture of clothes0.5280.5481.038
6. Manufacture of footwear0.4230.2000.474
7. Wood processing0.313−0.255−0.718
8. Manufacture of leather and leather products0.5070.4570.900
9. Manufacture of paper and paper products0.5250.2390.456
10. Production of agrochemical products0.6380.9791.533
11. Manufacture of pharmaceutical products and preparations0.3420.0820.240
12. Engineering0.6040.7131.180
Table 8. Indicators for assessing the adaptability of the Ukrainian economy to the risks of insufficient supply of natural gas.
IndicatorsIndicator Values by Years
201120122013201420152016
1. GDP in 2011 prices, billioninternational dollars378.5379.4379.3354.5319.8327.2
2. Volume of gas consumption, billion cubic meters53.749.641.040.631.832.0
3. Volume of gas consumption, billion m3 for 1 billion international dollars of GDP0.1420.1310.1080.1150.0990.098
4. Volumes of gas imports, billion cubic meters44.832.928.019.416.410.9
5. The growth rate of gas imports in relation to the previous year, times------
6. Share of imported gas in the total volume of its consumption, share of unit0.8340.6640.6820.4790.5170.341
7. Gas consumption per 1 billion dollars of GDP, billion m30.1420.1310.1080.1150.0990.098
8. Increase in the share of imported gas relative to the previous year, share of unit------
Including due to changes in:-−0.1700.018−0.2030.038−0.176
8.1. Volume of own gas production-−0.1440.073−0.1980.143−0.180
8.2. Gross Domestic Product-0.0000.000−0.022−0.0570.011
8.3. Gas consumption per 1 billion dollars of GDP-−0.026−0.0550.017−0.048−0.007
Table 9. Averaged values of the indicators characterizing individual measures of thermo-modernization of residential buildings in Ukraine.
Indicator NameAveraged Values of Indicators for Individual Measures of the Thermo-Modernization of Residential Buildings
Installation of Heat-Saving windows on Balcony DoorsInsulation of External Walls of BuildingsInstallation of Air Temperature ControllersInstallation of Heat Recuperators of Ventilation Air
1. The share of reducing the cost of heat energy after the implementation of the measure0.130.160.190.15
2. Annual interest rate0.180.180.180.18
3. The coverage ratio of household expenditures1.351.351.351.35
4. The ratio of annual household expenses to servicing and repaying the loan to its original value0.430.430.430.43
5. Efficiency of investing in the measure:----
5.1. At the basic level of gas prices0.140.130.150.14
5.2. With an increase in the base price of gas by 1.5 times0.210.1950.2250.21
6. The minimum possible value of coefficient of coverage of household expenditures, at which they will be able to repay a loan with the rise in base price of gas by 1.5 times1.5651.6041.5691.574

