Article

Anaerobic Co-Digestion of Sludge and Organic Food Waste—Performance, Inhibition, and Impact on the Microbial Community

1
Vatten & Miljö i Väst AB, P.O. Box 110, SE-311 22 Falkenberg, Sweden
2
Water Resources Engineering, Faculty of Engineering, Lund University, P.O. Box 118, SE-221 00 Lund, Sweden
3
Advanced Water Management Centre, The University of Queensland, Brisbane 4072, QLD, Australia
4
Department of Biomedical Engineering (BME), Division of Industrial Electrical Engineering and Automation (IEA), Lund University, P.O. Box 118, SE-221 00 Lund, Sweden
5
RISE Research Institutes of Sweden, Gjuterigatan 1D, SE-582 73 Linköping, Sweden
*
Author to whom correspondence should be addressed.
Energies 2018, 11(9), 2325; https://doi.org/10.3390/en11092325
Submission received: 13 August 2018 / Revised: 29 August 2018 / Accepted: 31 August 2018 / Published: 3 September 2018
(This article belongs to the Section A: Sustainable Energy)

Abstract

:
Anaerobic co-digestion allows for under-utilised digesters to increase biomethane production. The organic fraction of municipal solid waste (OFMSW), i.e., food waste, is an abundant substrate with high degradability and gas potential. This paper investigates the co-digestion of mixed sludge from wastewater treatment plants and OFMSW, through batch and continuous lab-scale experiments, modelling, and microbial population analysis. The results show a rapid adaptation of the process, and an increase of the biomethane production by 20% to 40%, when co-digesting mixed sludge with OFMSW at a ratio of 1:1, based on the volatile solids (VS) content. The introduction of OFMSW also has an impact on the microbial community. With 50% co-substrate and constant loading conditions (1 kg VS/m3/d) the methanogenic activity increases and adapts towards acetate degradation, while the community in the reference reactor, without a co-substrate, remains unaffected. An elevated load (2 kg VS/m3/d) increases the methanogenic activity in both reactors, but the composition of the methanogenic population remains constant for the reference reactor. The modelling shows that ammonium inhibition increases at elevated organic loads, and that intermittent feeding causes fluctuations in the digester performance, due to varying inhibition. The paper demonstrates how modelling can be used for designing feed strategies and experimental set-ups for anaerobic co-digestion.

1. Introduction

In anaerobic digestion (AD), organic material is biologically degraded. In the process, the organic material is stabilised, thereby minimizing further biological activity, and energy-rich biogas (a mixture of mainly biomethane, CH4, and carbon dioxide, CO2) is produced. AD is commonly used at wastewater treatment plants (WWTPs) for stabilizing mixed sludge (primary and secondary waste sludge). The produced biomethane could be used internally for the production of electrical power and heat, or even up-graded to vehicle fuel quality for sale. Following the strong focus on energy efficiency and climate change issues, WWTPs have started to valorise and optimise their biomethane production [1,2]. Many digesters at WWTPs are oversized, leaving redundant capacity for treating additional organic material, i.e., anaerobic co-digestion (AcoD) [3,4]. In AcoD organic substrates, such as industrial or agricultural wastes, are fed to the digester in addition to the primary substrate, e.g., sewage sludge [5].
Co-substrate characteristics and applicability have been extensively reviewed by Mata-Alvarez et al. (2014) [6]. Ideal co-substrates have a high methane potential, a high degradable fraction, and a low nutrient content, since there is sufficient nitrogen (N) and phosphorus (P) in the sewage sludge. Local substrate availability and transport costs will constrain options for individual plants. One substrate of interest, due to its availability and characteristics, is the organic fraction of municipal solid waste (OFMSW) [7]. This waste is source-separated food waste from households and restaurants, which is collected separately. The AcoD of OFMSW and sewage sludge has a high potential to increase gas production at WWTPs [8,9,10,11,12,13,14]. A key concern is the high nitrogen content, which leads to an increase of the internal load to the water treatment, and can even cause inhibition in the digester [15,16]. The practical aspects of co-digestion of OFMSW at WWTPs, such as biogas production and sludge production, have been extensively reviewed. Process stability is a common problem leading to low organic loading in full-scale plants [17]. However, only limited studies exist on the implementation (start-up, load increase, etc.) and impact on the AD process by AcoD of these substrates [13,18].
AD processes are difficult to monitor on-line or with short sampling intervals. To assess in-reactor performance, mathematical modelling has been used [19,20]. Mechanistic models, such as Anaerobic Digestion Model No. 1 (ADM1) [21], contain a detailed description of the different microbial processes in the reactor, i.e., hydrolysis, acidogenesis, acetogenesis, and methanogenesis. The growth and decay of the different microorganisms and their consumption of substrates, including growth rates, substrate limitations, and common inhibitions, are modelled using a combination of differential and algebraic equations [21,22]. Modelling and simulation enhance the understanding of the processes, and are also valuable tools for virtual testing and scenario analysis [23].
Recent developments for analysis of microbial populations offer a further opportunity for understanding the dynamics in these biological processes [24]. With gene probes or DNA analysis, the microorganisms in the reactor can be identified and quantified [25]. This knowledge is critical for understanding how different substrates, feed strategies, and operational modes impact the process.
In this paper, implementation of AcoD for sewage sludge and OFMSW at WWTPs is investigated. Inhibitions and feeding strategies for AcoD are evaluated through batch and continuous lab-scale experiments, mathematical modelling, and microbial population analysis. The experimental design and process performance are assessed by mathematical modelling and simulation of the processes.

2. Materials and Methods

In this study, experimental work in batch and continuous reactors has been combined with modelling and simulation to assess the performance of AcoD. The methodology is illustrated in Figure 1. Physico-chemical analysis and biomethane potential (BMP) tests were carried out for the characterisation of the substrates used for the modelling and design of the continuous experiments. The model was calibrated based on the results from the continuous reactors, and it was further analysed for a deeper understanding of the process. Furthermore, a population analysis of methanogenic organisms was performed on the anaerobic sludge.

2.1. Experimental Methods

2.1.1. Substrate Characterisation

Two substrates were used for co-digestion in this study: (1) Mixed sludge (pre-thickened primary and secondary sludge) from the WWTP Getteröverket in Varberg, Sweden and (2) OFMSW collected from households in Varberg, Sweden. The food waste was sorted daily, by the households, in paper bags, and collected in dust-bins every second week. In order to make sure that the bags contained only OFMSW, and to determine the food waste composition, the contents were examined and weighed prior to homogenization. The composition of the OFMSW was determined as: dough-based products, 25.28 wt %, vegetables, 42.72 wt %, animal products, 14.46 wt % and fruits, 17.54 wt %. After sampling, batches of both substrates were mixed and stored in a freezer (−20 ℃), and recovered for each experiment and feeding. The OFMSW was additionally homogenised in a mixer to reduce the particle size to less than 1 mm. The following physico-chemical analyses were performed for each substrate: dry solids (DS, SS-EN 12880:2000), chemical oxygen demand (CODCr, ISO 15705:2002(E)), COD filtered (LCK 114), VS (SS-EN 12879:2000), Kjeldahl nitrogen (SS-EN 13342), total nitrogen (TN, LCK 338), fat (NMKL 131), ammonium (NH4-N, LCK 302), and volatile fatty acids (VFA, LCK 365). The inoculum for all experiments was retrieved from the mesophilic full-scale AD reactor at Getteröverket WWTP.

2.1.2. Biomethane Potential Tests

The biomethane potential (BMP) test is an analytic method for determining the methane potential of different organic substrates. The method is frequently used and well documented in scientific literature [26,27]. BMP is performed by mixing the substrate with the active anaerobic inoculum in anaerobic lab-scale batch digesters. When analysing the BMP results, several factors should be considered. The most significant ones are: pre-treatment and handling of the sample and inoculum, inoculum-to-substrate ratio, temperature, mixing, the particle size of the substrate, and the number of replicates and blanks. The BMP tests in the trials were executed using the Automatic Methane Potential Test System (AMPTS) II (version 1.7, Bioprocess Control, Lund, Sweden, 2014). The AMPTS II equipment is thoroughly described in the Supplementary Information.
The batch experiments lasted for 30 days. Before the trials were initiated, the amounts of dry and volatile solids of the substrates and the inoculum were determined. The inoculum-to-substrate ratio used for the experiments was 2 to 1, based on the volatile solids (VS) content, for all substrates. Several studies suggest that the optimal methane yield for batch tests is reached when the inoculum-to-substrate ratio is 2 to 1 [28]. After mixing the inoculum and the different substrates, the test bottles were filled with 400 mL (head space 200 mL) and operated at 37 ℃. All BMP tests were performed in triplicates for each substrate–inoculum combination. Heating and mixing of each reactor, as well as the colour of the pH indicator in the CO2 fixing unit, were monitored daily. Also, the temperature and the water level of the enclosing container of the AMPTS were checked daily.

2.1.3. Continuous Experiments

Two parallel five litre continuous-stirred tank reactors (CSTRs) were operated at mesophilic conditions with a hydraulic retention time (HRT) of 22 days, fed once a day throughout the experiment. Reactor 1 (R1) was fed with a blend of mixed sludge and OFMSW with a ratio of 1 to 1, based on the VS content of the substrates. As a reference, Reactor 2 (R2) was fed only with mixed sludge taken from a pre-thickener at Getteröverket WWTP, where both primary sludge from the pre-sedimentation basins and secondary sludge from the activated sludge process were simultaneously pre-thickened. The reactors were filled with 5 liters of inoculum from the full-scale WWTP digesters at the start of the experiment, and initially operated at an organic loading rate (OLR) of 1.0 kg/m3/d for 33 days, i.e., 1.5 HRTs. After 33 d, the OLRs were increased in both reactors to 2.0 kg/m3/d, keeping the same substrate ratio. The amount of water for dilution was adjusted to maintain a constant HRT of 22 d throughout the experiment.
During the tests, the biogas production was monitored continuously from each reactor using a µ-flow on-line instrument, a flow meter for ultra-low gas flow detection, which includes real-time temperature and pressure compensation for the normalization of gas flow rate and volume measurement at 0 degrees Celsius, and 1 standard atmosphere (atm). The biogas produced was collected separately for each reactor, and the methane and carbon dioxide contents were measured daily. For monitoring purposes, weekly samples were also taken to determine the concentrations of VFAs, bicarbonate alkalinity (BA), total alkalinity (TA), DS and VS [29]. The samples were analysed by an accredited laboratory using methods as follows: pH (SS-EN ISO 10523), VS (SS-EN 12879), DS (SS-EN 12880), VFA (LCK 365), total alkalinity (titration with 0.05 M HCl to pH 4.0), and bicarbonate alkalinity (titration with 0.05 M HCl to pH 5.75).

2.1.4. Identification and Quantification of Methanogenic Archaea

Identification and quantification of methanogenic archaea were carried out using fluorescence in situ hybridization (FISH) [30] in five anaerobic sludge samples, stabilised 1:1 (v/v) with ethanol (absolute). The general content of methanogenic archaea was analysed using a FISH test kit with standardised methodology and prepared solutions (VIT® Methanogenic archaea, Vermicon AG, Germany). The test kit detects methanogens that are affiliated with Euryarchaeota, which cover the range of Archaea that are reported to be responsible for methanogenesis [25]. In situ hybridization was performed in accordance with the manual of the VIT® Methanogenic archaea test kit. In addition, a set of specific oligonucleotide probes was used to differentiate the methanogens in the same samples based on their order (Methanomicrobiales, Methanobacteriales and Methanosarcinales) and family level (Methanospirillaceae, Methanocorpusculaceae, Methanosaetaceae and Methanococcaceae) [31]. The total number of viable cells was determined by hybridizing the specific oligonucleotide probes for methanogens, together with a mixture of oligonucleotide probes specific for the domains Bacteria and Archaea [32,33].
Hybridised cells were excited and examined using a fluorescence microscope (Zeiss Axiostar plus). The relative area covered with target methanogenic archaea in relation to all viable cells was analysed in more than 10 randomly selected captured fields, and the average percentage of the population was calculated.

2.2. Modelling Anaerobic Digestion Processes

The model used for simulations in the study was the IWA Anaerobic Digestion Model No. 1 (ADM1) [21]. ADM1 describes the main biological reactions in the digester, including hydrolysis, acidogenesis, acetogenesis, and methanogenesis (aceticlastic and hydrogenotrophic). The model calculates the 26 state variables of the model using 19 biological reactions, i.e., ordinary differential equations. The model has about 50 kinetic parameters (e.g., growth rates, saturation constants and decay rates) and functions for the inhibition of pH, free ammonia, and hydrogen. Furthermore, the model implementation used in this study was expanded with the inhibition of long-chain fatty acids (LCFA), as described in Arnell et al. (2016) [34].
The modelling methodology of Arnell et al. (2016) [34] for AcoD was used. It provides a procedure for characterisation of substrates. The two-step procedure with (1) the determination of hydrolysis rate (khyd) and biodegradable fraction of COD (fd) from BMP tests and (2) the fractionation of COD and nitrogen into model state variables, was used for both substrates. Following the procedure, particulate COD was fractionated as carbohydrates (Xch), proteins (Xpr), lipids (Xli), and inerts (Xi) rather than composite material (Xc). This omits the disintegration process for substrates in the ADM1, and assumes the hydrolysis of particulate COD as the rate-limiting step [23]. For the substrate characterisation, BMP test results (the total gas flow and the methane content analysis) were used, along with the stipulated physico-chemical analyses [34]. For OFMSW, the analysed total COD content was found to be an underestimation, because the resulting methane production exceeded this; see Section 3 and Supplementary Information, Table S1. The total COD concentration of OFMSW was instead estimated to 235 kg/m3, based on the DS content of the sample, and values from literature [20,35,36].
Initially, the model structure proposed by Zaher et al. (2009) and applied in Arnell et al. (2016) was tested [20,34]. However, due to the fundamental model construction (i.e., virtually separated hydrolysis reactions) the structure gave rise to hydraulic delays and erroneous results in dynamic simulations. Instead, the ADM1 was modified, introducing three new state variables (Xch2, Xpr2, and Xli2) and three new processes (first-order hydrolysis of Xch2, Xpr2, and Xli2) with separate hydrolysis processes (in this case, using a common hydrolysis rate). Thereby, the mixed sludge and OFMSW could be characterised individually, and the hydrolysis was separated with individual rates for the two substrates. The model structure for the extended hydrolysis processes is illustrated in Figure S1 in the Supplementary Information.
All modelling and data analysis in this study was performed using the MatLab/Simulink software package with toolboxes (MatLab 8.3, The Mathworks Inc., Natick, MA, USA, 2014).
The BMP tests of inoculum (blanks), mixed sludge and OFMSW were modelled using the full ADM1. Parameter estimation was performed based on non-linear optimisation. The results, i.e., parameters and substrate fractionation, obtained from modelling the BMPs were then used for modelling the two continuous experiments. The true reactor volumes, feed stock and feeding patterns were used to model all the experiments.

3. Results and Discussions

3.1. Biomethane Potential Tests and Substrate Characterisation

The substrate characterisation and modelling of BMP tests for mixed sludge and OFMSW resulted in the state variables and estimates of biogas potential and hydrolysis rates are shown in Table 1. The methane production curves are displayed in Figure 2. The estimated ultimate gas production was 475 m3 CH4/t VS for OFMSW, which was 66% higher than for the mixed sludge. These values were in the same range as in the literature [12]. Also, the estimated hydrolysis rates were in the same range as previously reported [16]. For the BMP curves, the model fit to the data was generally good. Two discrepancies could be seen. For the modelled BMP of mixed sludge, the methane production decreased slightly towards the end of the test (Figure 2b, bottom). This was not a correct behaviour for a cumulative curve. The explanation was that the inoculum in the model produced more gas than in the experiments. In turn, this was explained by the fact that not enough data was available to accurately characterise the actual inoculum that was used in the experiments. Instead, the standard WWTP inoculum composition from Gernaey et al. (2014) was used [23]. Furthermore, the BMP curve for OFMSW (Figure 2a) shows an S-shaped profile at the beginning of the test. This lag indicates that the inoculum needs to adapt to the new substrate at high loading rates. In the ADM1, this time lag for adaptation was not included. However, the characterisation of, and the estimation of hydrolysis rate for the substrate was considered acceptable. For the substrate characteristics, it can be noted that the estimated lipid content was relatively high, but within the range of what has been previously reported [12,37], for both substrates. Selected data from measurements on the substrates are found in Table 1. A comprehensive list of raw measurement data is provided in the Supplementary Information, Table S1.

3.2. Continuous Reactors

The simulated gas production from the CSTR experiments is shown together with data in Figure 3. As expected from the higher methane yield in the BMP tests, reactor R1 (applying AcoD) had higher gas production than the reference reactor (R2). The average measured gas production with a load of 1 kg/m3/d was 340 L CH4/m3 VAD/d for R1, which was 42% more than for R2 (240 L CH4/m3 VAD/d). With a load of 2 kg/m3/d, the average gas production increased to 620 L CH4/m3 VAD/d for R1 compared to 510 L CH4/m3 VAD/d for R2, a difference of 22%. The smaller difference at the higher loading rate reflects that the specific biomethane production (L CH4/kg VS) decreased for R1 and increased for R2. For both reactors, the simulated gas production generally showed a good fit with the data. The correlation of simulated and measured gas production was evaluated with a paired t-test. The difference was significant for neither reactor. The simulation results were obtained using the parameters and substrate fractionation retrieved from the modelling of the BMP tests, which shows that the procedure for substrate fractionation and parameter estimation based on BMP test data is applicable for calibrating a model describing continuous experiments. Previous simulation studies have proven the transferability of lab-scale results to full-scale plants [38]. The gas production profile was stable from the start of the experiment. At day 33, when the load is gradually increased from 1 to 2 kg/m3/d, the monitored gas production increased instantly in both reactors. This indicates that very little adaptation is required by the microorganisms to utilise the substrates, both mixed sludge and OFMSW at these loading rates.
The increased gas production and limited need for adaptation is reflected by the quantitative measurements of methanogenic archaea. The identified Methanosaetaceae and Methanomicrobiales returned strong fluorescent signals, indicating high physiological activity (see Figures S4 and S5 in the Supplementary Information). It can be seen from the population analysis data in Table 2 that for R1, the methanogens started to increase from the very start of the experiment when the reactor was fed a combination of sludge and OFMSW. The same increase was not detected in R2, which was fed only sludge (i.e., the same substrate and similar OLR that the inoculum was already adapted to). A further increase in methanogens was seen after the load increase to 2 kg/m3/d, and again, only short-term adaptation was required. The increase in methanogens was mainly seen by Methanosarcinales. This means that changes in the degradation processes occur at this load. The process shifted significantly towards acetate. Also, in reactor R2, the methanogens increased significantly when the load was doubled. However, in this case, the composition of the community did not change. The ratio between Methanosarcinales and Methanomicrobiales remained constant, at approximately 1. The different behaviour for the two reactors (methanogens increasing already at OLR 1 kg/m3/d for R1, and less at an increase to OLR 2 kg/m3/d in contrary to R2, where the methanogens increased first as the load is increased) explains the reduced difference in specific biomethane production at the higher load. The quantified species did not fully comply with and did not cover all the microorganisms of the ADM1 model. Therefore, the activity data cannot be used directly for model calibration. However, the model inoculum was acclimatised to realistic initial levels by simulating a WWTP AD process to steady state at the same operating conditions as for the Getteröverket WWTP.
The few physico-chemical analyses on the biosolids from R1 and R2 (see Table 3) showed a decreasing trend for three-quarters of the duration of the experiment, and only a slight increase towards the end (individual measurements not presented). This indicates that the time for the experiment (3 HRTs with a load increase after 1.5 HRTs) was too short for the reactors to fully stabilise.
The simulation outputs for reactors R1 and R2 were analysed for the inhibition of the anaerobic degradation processes with the same set of conditions as the continuous experiments. Out of the inhibitions included in the model, only ammonium inhibition (IIN) was found to be active at any point (i.e., I < 1) in the simulated experiments. In Figure 4, IIN is shown for R1. The ammonium inhibition was active (value around 0.87) already when the experiment started (Figure 4a), but it increases at higher OLR. This was considered to be limited inhibition, although there was some variation during the course of a day. When feeding was activated, ammonium inhibition was first reduced (IIN increases) but then it increased again to a similar level. In the model, this was explained by the following causal chain of reactions. The inorganic nitrogen (causing inhibition in the model) was mineralised, as protein in the substrates were first hydrolysed to amino acids, which in turn were degraded, upon which the nitrogen was released. So, at feeding, the SIN concentration was first diluted, but it later increased again, following the degradation of the fresh substrate. However, IIN did not return to its original value before the next feeding started, and it did not seem to stabilise within the 1.5 HRTs after the load increase. This detailed information could be used in the design of feeding strategies in both the lab-scale and full-scale anaerobic digestions. The results show that continuously feeding strategies are preferable, in order to avoid instantaneous inhibition caused by intermittent feeding.

4. Conclusions

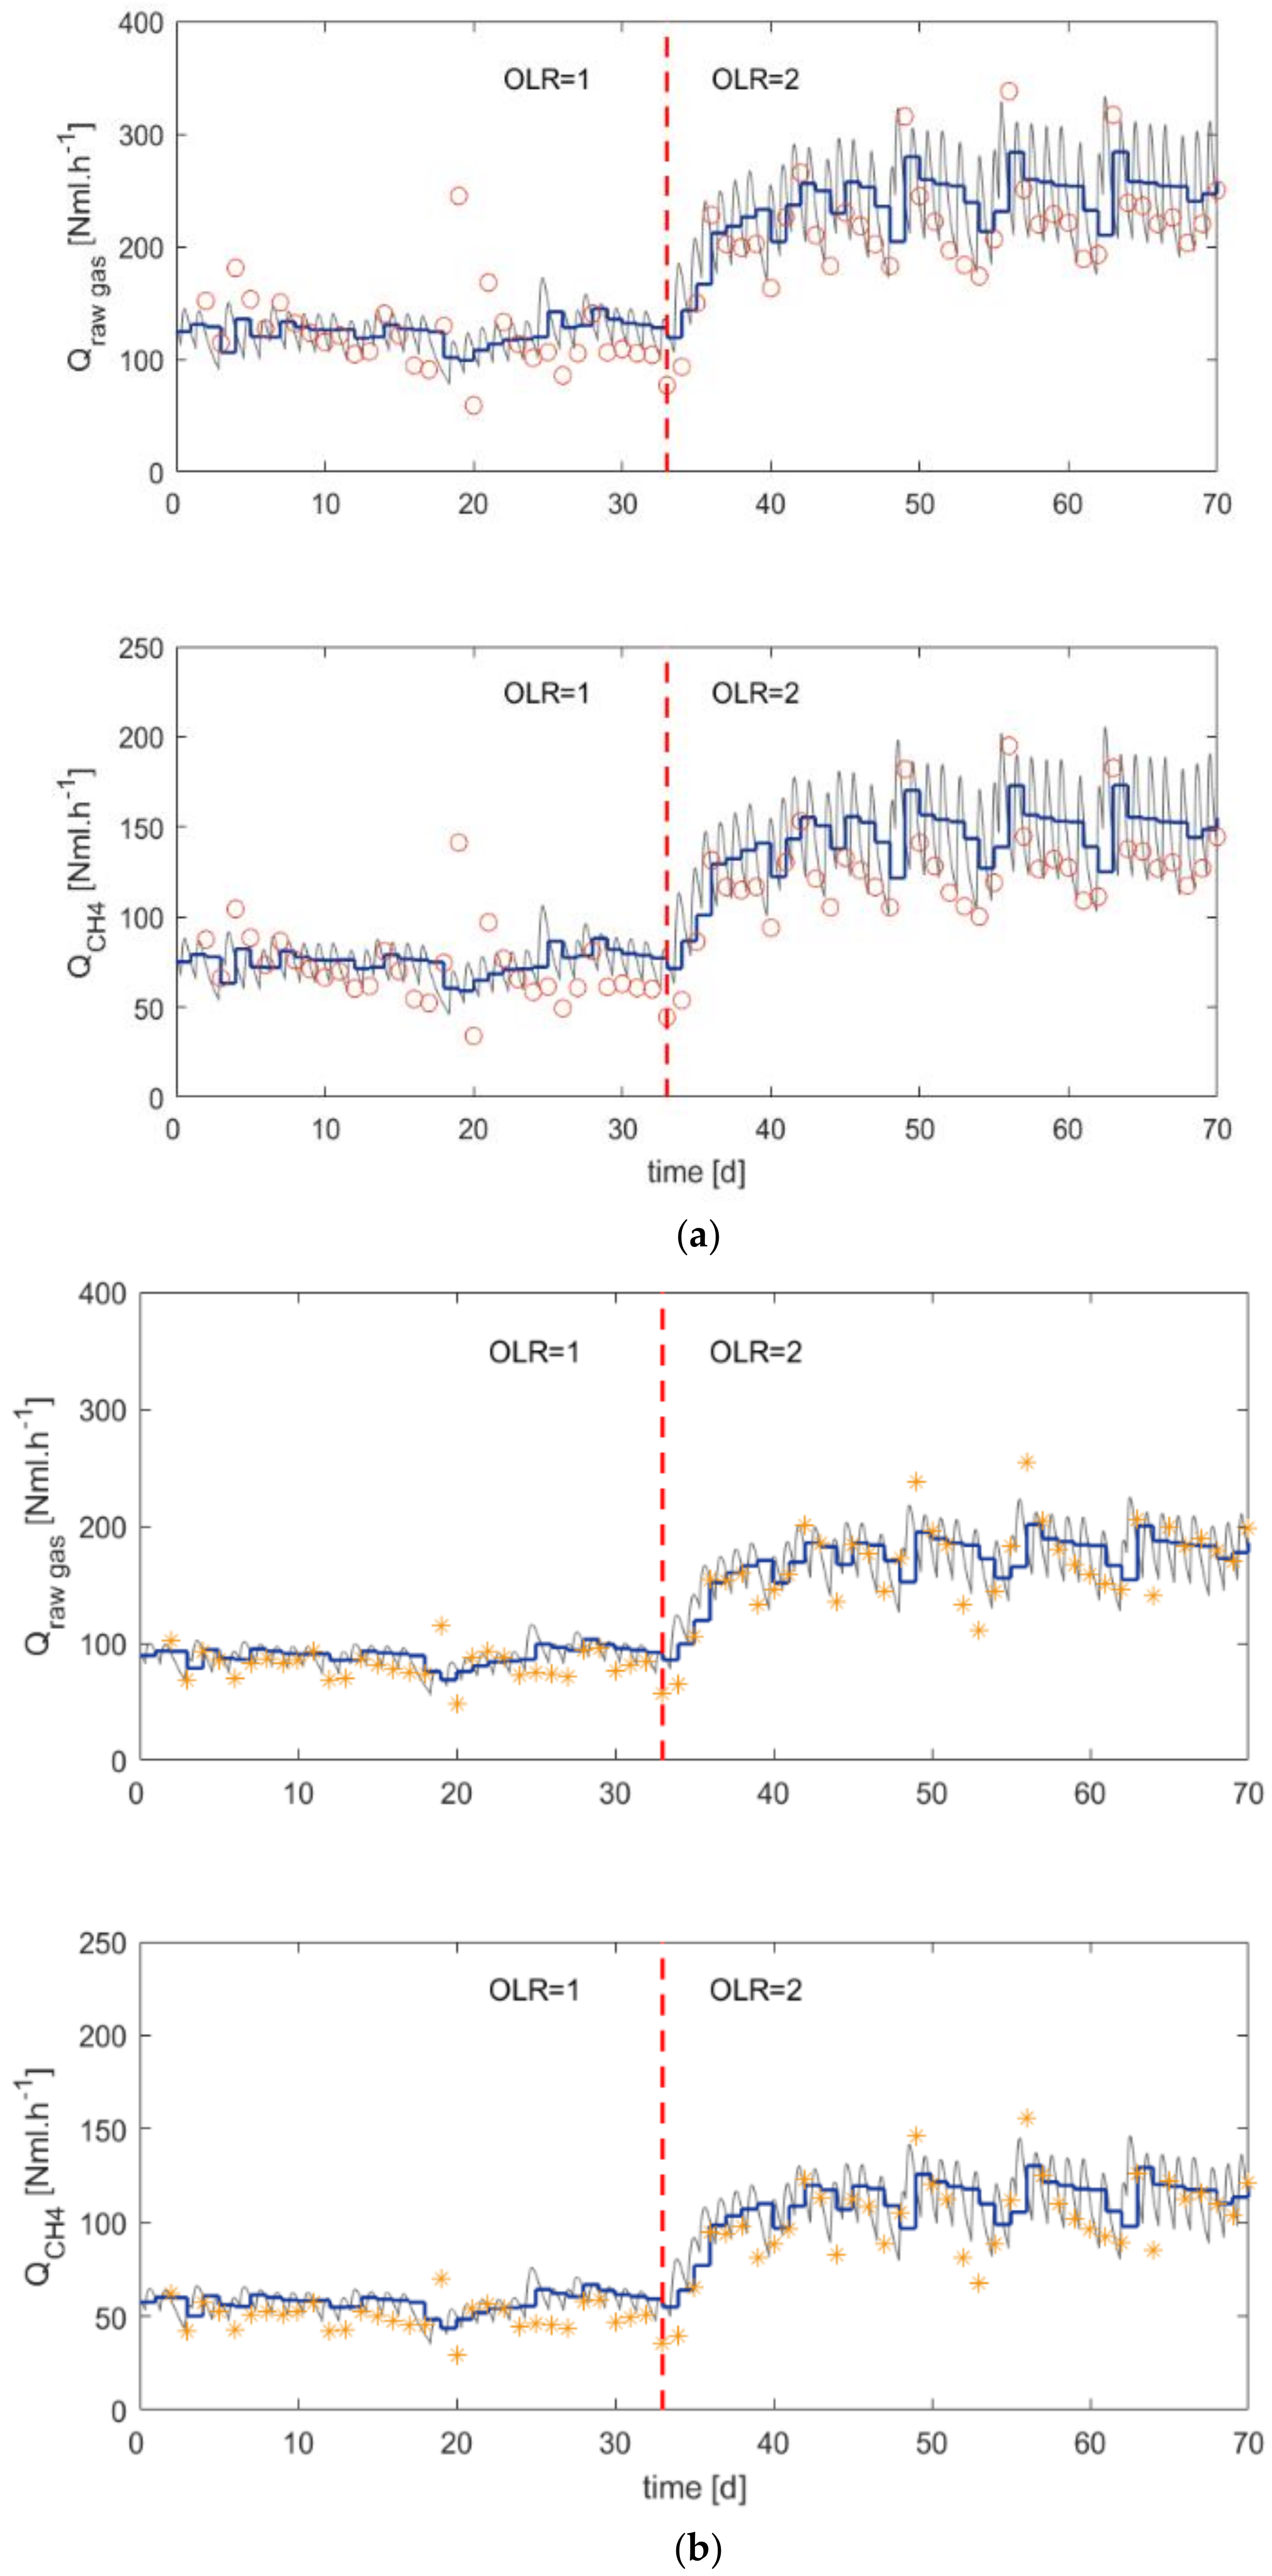
  • Applying anaerobic co-digestion (AcoD) with organic fractions of municipal solid waste (OFMSW) and mixed sludge increases the gas production at equivalent loads. With a feed composition 50/50% of the two substrates, the experiments show 22–42% more biogas production than for a reference reactor fed with only mixed sludge.
  • Implementation of co-digestion of the sewage sludge and OFMSW shows rapid adaptation. In the biomethane potential tests (i.e., high substrate to inoculum ratio) a short lag, indicating adaptation, appears. However, in continuous lab-scale experiments at reasonable loading rates (1 to 2 kg/m3/d of VS) the response in gas production was immediate, showing that no adaptation was needed. This conclusion is supported by the equally rapid increase in methanogenic microbial population when co-digesting sludge and OFMSW.
  • The organic loading rate and substrate composition have an impact on the composition of the microbial community in the reactor. The methanogenic microbial population increases when commencing co-digestion of sewage sludge and OFMSW on a WWTP inoculum. This effect is further pronounced at an increased load, which also promotes a change in the methanogenic microorganisms towards the acetate production pathway.
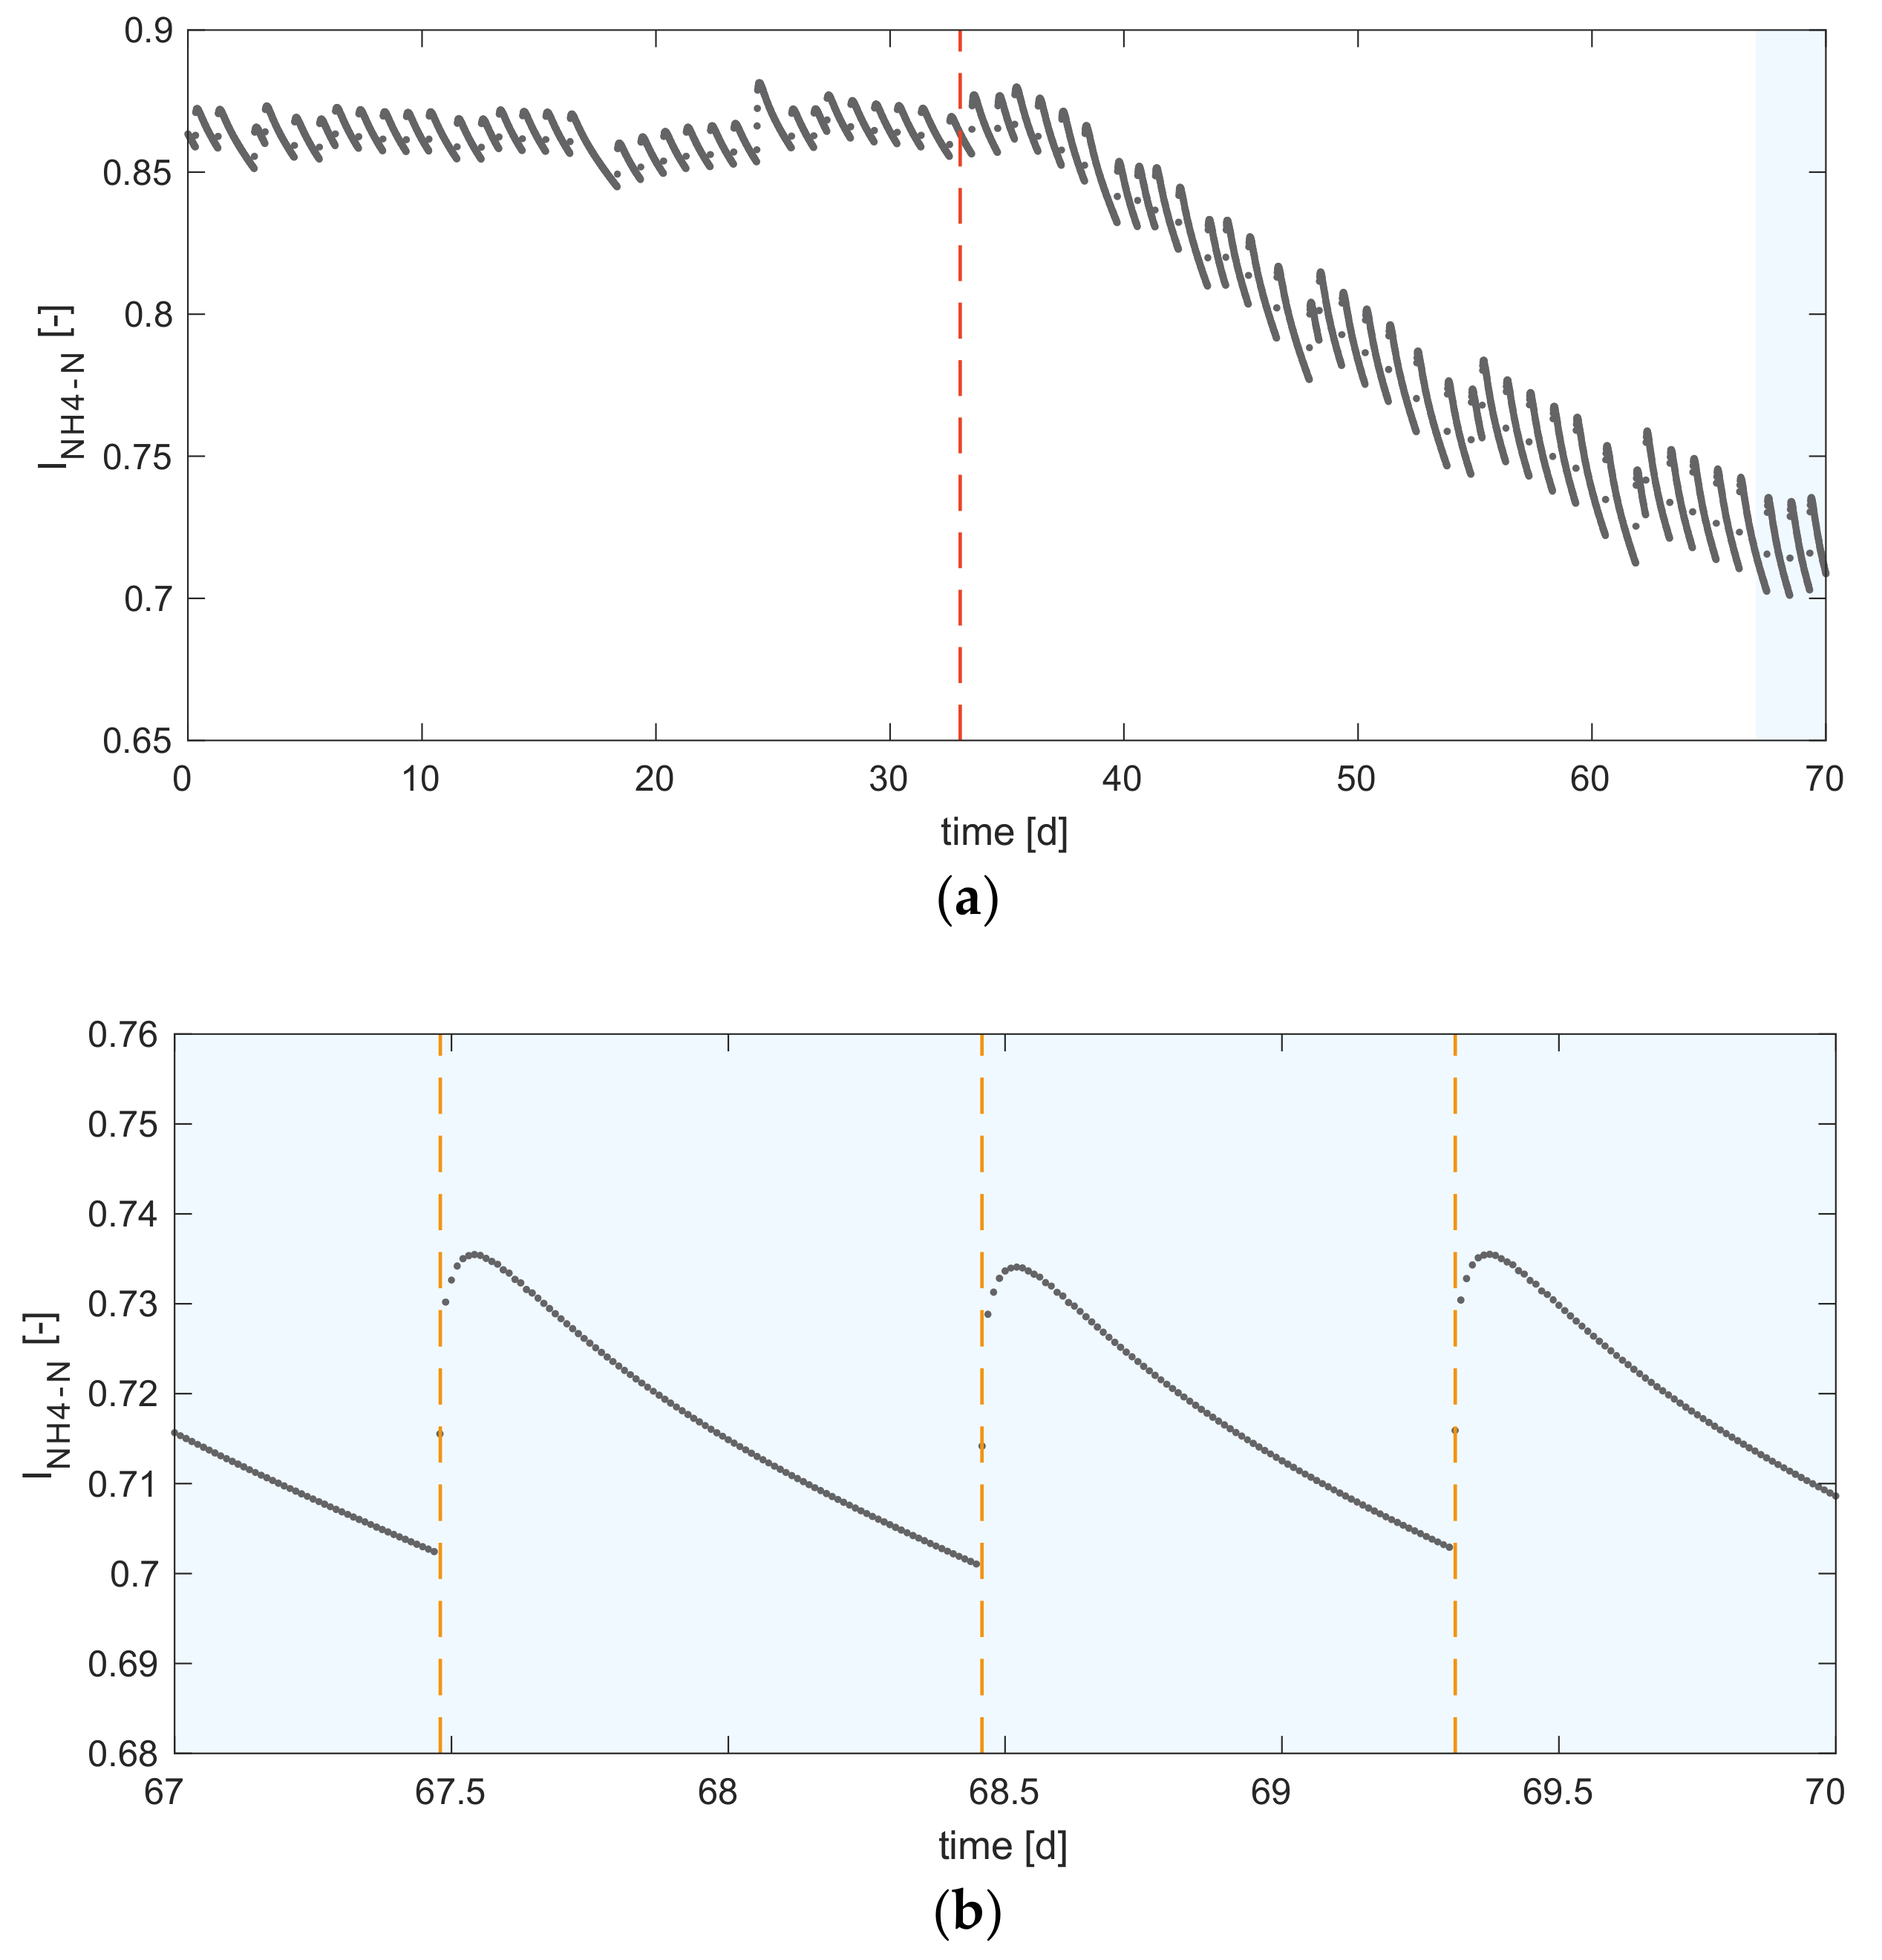
  • The feeding strategy of continuous lab-scale digestion experiments has an impact on the instantaneous digester performance. The simulation results show that intermittent feeding leads to short-term ammonium inhibition of the process.
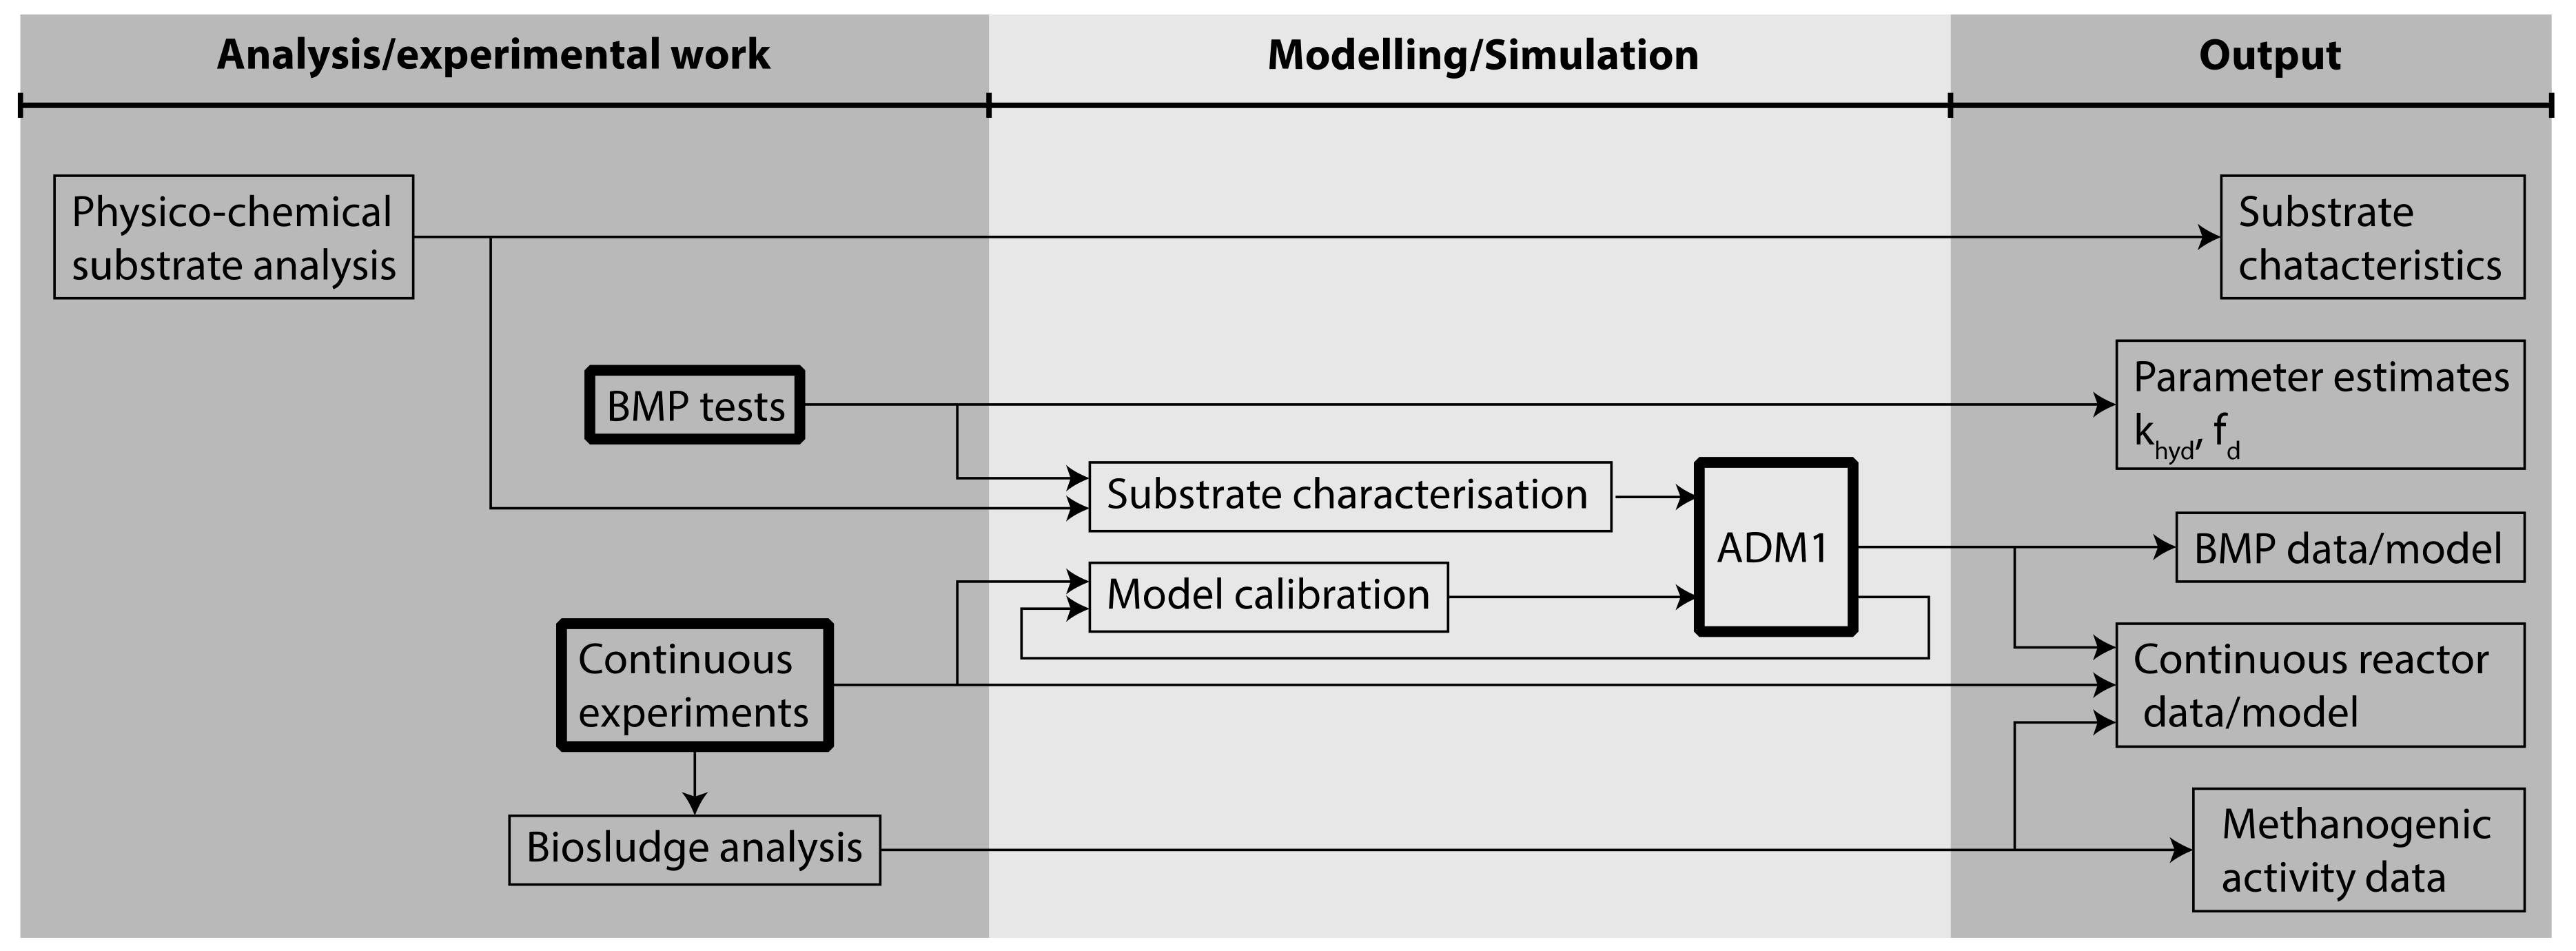
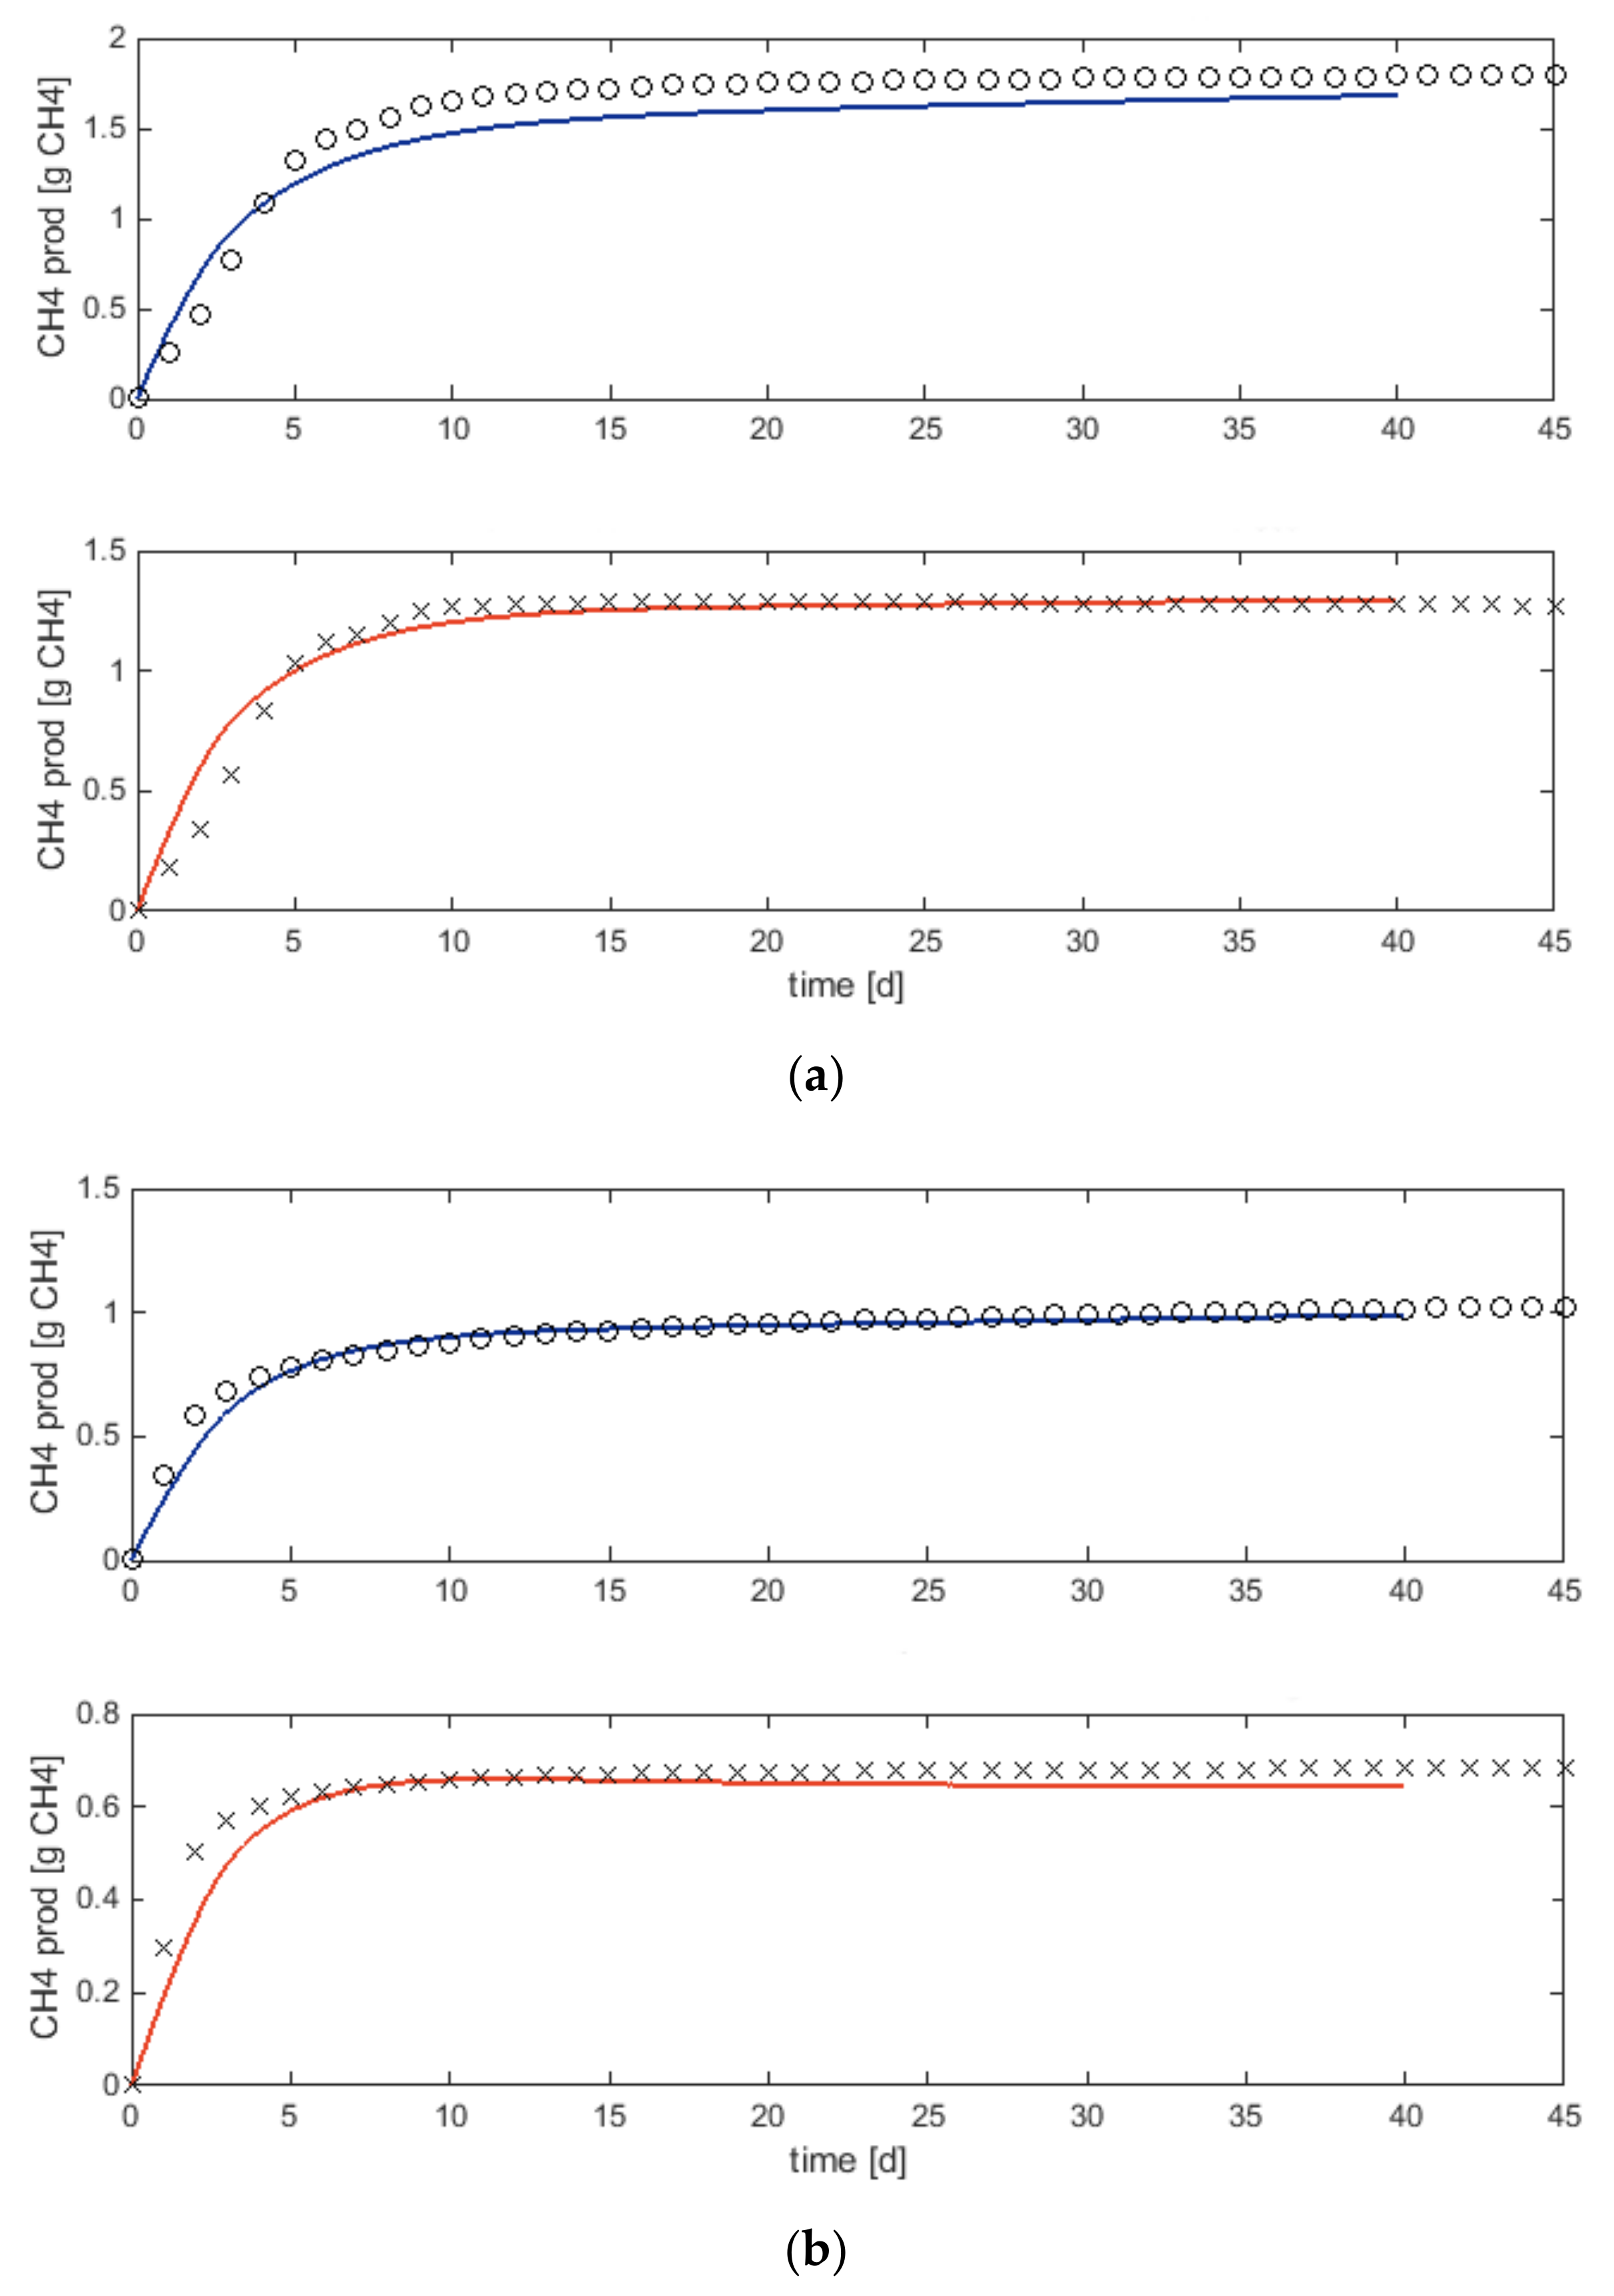
  • Modelling is a suitable tool to evaluate the experimental design of AD. The BMP tests of the substrates were simulated using ADM1, and a characterisation procedure featuring both influent fractionation and parameter estimation was used. The estimated input fractions and parameters were successfully used also for modelling continuous experiments. It can be concluded that model characterisation based on BMP data is applicable for modelling continuous reactors. Furthermore, the study shows that modelling provides insights into inhibition phenomena which cannot be observed in the continuous experimental results.

Supplementary Materials

Supplementary materials are available online at https://www.mdpi.com/1996-1073/11/9/2325/s1.

Author Contributions

Conceptualization, M.A., M.H., and A.K.; Methodology, M.A., M.H., and A.K.; Software, M.A., and U.J.; Validation, M.A., M.H., and A.K.; Formal Analysis, M.A. and M.H.; Investigation, M.A. and M.H.; Resources, A.K.; Data Curation, M.A.; Writing—Original Draft Preparation, M.A.; Writing—Review & Editing, U.J., and D.B.; Visualization, M.A.; Supervision, A.K.; Project Administration, A.K.; Funding Acquisition, A.K.

Funding

This research received no external funding.

Acknowledgments

The authors acknowledge the financial support from Vatten & Miljö i Väst AB, which funded the experimental work, including analysis and mathematical modelling. Furthermore, the authors express gratitude to the IWA Task Group on Benchmarking of Control Strategies for Wastewater Treatment Plants for sharing the MatLab/Simulink implementation of IWA Anaerobic Digestion Model No. 1 that was used as a basis for the modelling performed in this study.

Conflicts of Interest

The authors declare no conflict of interest.

Nomenclature

AcoDAnaerobic co-digestion
ADAnaerobic digestion
ADM1Anaerobic Digestion Model No. 1
AMPTSAutomatic methane potential test system
BMPBiomethane potential
CODChemical oxygen demand (g COD/m3)
CSTRContinuous stirred tank reactor
DSDry solids (%)
fdModel parameter for biodegradable fraction of COD (-)
HRTHydraulic retention time (d)
IINModel variable for ammonium inhibition (-)
khydModel parameter for hydrolysis rate (d−1)
LCFALong-chain fatty acids
OFMSWOrganic fraction of municipal solid waste
OLROrganic loading rate (kg/m3/d)
SINModel state variable for inorganic nitrogen (mol N/l)
TNTotal nitrogen (g N/m3)
VADReactor volume for anaerobic digestion
VFAVolatile fatty acids (g COD/m3)
VSVolatile solids (%)
WWTPWastewater treatment plant
XchModel state variable for carbohydrates (g COD/m3)
XprModel state variable for proteins (g COD/m3)
XliModel state variable for lipids (g COD/m3)

References

  1. Olsson, G. Water and Energy: Threats and Opportunities; IWA Publishing: London, UK, 2012. [Google Scholar]
  2. Batstone, D.J.; Virdis, B. The role of anaerobic digestion in the emerging energy economy. Curr. Opion. Biotechnol. 2014, 27, 142–149. [Google Scholar] [CrossRef] [PubMed]
  3. Krupp, M.; Schubert, J.; Widmann, R. Feasibility study for Co-Digestion of Sewage Sludge with OFMSW on Two Wastewater Treatment Plants in Germany. Waste Manag. 2005, 25, 393–399. [Google Scholar] [CrossRef] [PubMed]
  4. Lundkvist, M. Energieffektivisering–Rapport till möte med Energimyndigheten; Report Sweco Report 2005-01-14T; Sweco Viak AB: Halmstad, Sweden, 2005. (In Swedish) [Google Scholar]
  5. Mata-Alvarez, J.; Dosta, J.; Macé, S.; Astals, S. Codigestion of solid wastes: A review of its uses and perspectives including modeling. Crit. Rev. Biotechnol. 2011, 31, 99–111. [Google Scholar] [CrossRef] [PubMed]
  6. Mata-Alvarez, J.; Dosta, J.; Romero-Güiza, M.S.; Fonoll, X.; Peces, M.; Astals, S. A critical review on anaerobic co-digestion achievements between 2010 and 2013. Renew. Sustain. Energy Rev. 2014, 36, 412–427. [Google Scholar] [CrossRef]
  7. Ren, Y.Y.; Yu, M.; Wu, C.F.; Wang, Q.H.; Gao, M.; Huang, Q.Q.; Liu, Y.A. Comprehensive review on food waste anaerobic digestion: Research updates and tendencies. Bioresour. Technol. 2018, 247, 1069–1076. [Google Scholar] [CrossRef] [PubMed]
  8. Sosnowski, P.; Wieczorek, A.; Ledakowicz, S. Anaerobic co-digestion of sewage sludge and organic fraction of municipal solid wastes. Adv. Environ. Res. 2003, 7, 609–616. [Google Scholar] [CrossRef]
  9. Bolzonella, D.; Battistoni, P.; Susini, C.; Cecchi, F. Anaerobic codigestion of waste activated sludge and ofmsw: The experiences of viareggio and treviso plants (Italy). Water Sci. Technol. 2006, 53, 203–211. [Google Scholar] [CrossRef] [PubMed]
  10. Gómez, X.; Cuetos, M.J.; Cara, J.; Morán, A.; García, A.I. Anaerobic co-digestion of primary sludge and the fruit and vegetable fraction of the municipal solid wastes. Renew. Energy 2006, 31, 2017–2024. [Google Scholar] [CrossRef]
  11. Zhang, R.H.; El-Mashad, H.M.; Hartman, K.; Wang, F.Y.; Liu, G.Q.; Choate, C.; Gamble, P. Characterization of food waste as feedstock for anaerobic digestion. Bioresour. Technol. 2007, 98, 929–935. [Google Scholar] [CrossRef] [PubMed]
  12. Iacovidou, E.; Ohandja, D.-G.; Voulvoulis, N. Food waste co-digestion with sewage sludge–Realising its potential in the UK. J. Environ. Manag. 2012, 112, 267–274. [Google Scholar] [CrossRef] [PubMed]
  13. Fonoll, X.; Astals, S.; Dosta, J.; Mata-Alvarez, J. Anaerobic co-digestion of sewage sludge and fruit wastes: Evaluation of the transitory states when the co-substrate is changed. Chem. Eng. J. 2015, 262, 1268–1274. [Google Scholar] [CrossRef]
  14. Breunig, H.M.; Jin, L.; Robinson, A.; Scown, C.D. Bioenergy potential from food waste in California. Environ. Sci. Technol. 2017, 51, 1120–1128. [Google Scholar] [CrossRef] [PubMed]
  15. Yenigun, O.; Demirel, B. Ammonia inhibition in anaerobic digestion: A review. Process. Biochem. 2013, 48, 901–911. [Google Scholar] [CrossRef]
  16. Arnell, M. Performance Assessment of Wastewater Treatment Plants-Multi-Objective Analysis Using Plant-Wide Models. Ph.D. Thesis, Lund University, Lund, Sweden, 16 December 2016. [Google Scholar]
  17. Li, L.; Peng, X.Y.; Wang, X.M.; Di Wu, D. Anaerobic digestion of food waste: A review focusing on process stability. Bioresour. Technol. 2018, 248, 20–28. [Google Scholar] [CrossRef] [PubMed]
  18. Gou, C.L.; Yang, Z.H.; Huang, J.; Wang, H.L.; Xu, H.Y.; Wang, L.K. Effects of temperature and organic loading rate on the performance and microbial community of anaerobic co-digestion of waste activated sludge and food waste. Chemosphere 2014, 105, 146–151. [Google Scholar] [CrossRef] [PubMed]
  19. Derbal, K.; Bencheikh-Iehocine, M.; Cecchi, F.; Meniai, A.H.; Pavan, P. Application of the IWA ADM1 model to simulate anaerobic co-digestion of organic waste with waste activated sludge in mesophilic condition. Bioresour. Technol. 2009, 100, 1539–1543. [Google Scholar] [CrossRef] [PubMed]
  20. Zaher, U.; Li, R.; Jeppsson, U.; Steyer, J.P.; Chen, S. GISCOD: General integrated solid waste co-digestion model. Water Res. 2009, 43, 2717–2727. [Google Scholar] [CrossRef] [PubMed]
  21. Batstone, D.J.; Keller, J.; Angelidaki, R.I.; Kalyuzhnyi, S.V.; Pavlostathis, S.G.; Rozzi, A.; Sanders, W.T.M.; Siegrist, H.; Vavilin, V.A. Anaerobic Digestion Model No. 1 (ADM1); IWA Publishing: London, UK, 2002. [Google Scholar]
  22. Rosen, C.; Jeppsson, U. Aspects on ADM1 Implementation within the BSM2 Framework. Department of Industrial Electrical Engineering and Automation. Available online: http://portal.research.lu.se/ws/files/5715450/588082.pdf (accessed on 13 August 2018).
  23. Gernaey, K.V.; Jeppsson, U.; Vanrolleghem, P.A.; Copp, J.B. Benchmarking of Control Strategies for Wastewater Treatment Plants; IWA Publishing: London, UK, 2014. [Google Scholar]
  24. Wang, P.; Wang, H.T.; Qiu, Y.Q.; Ren, L.H.; Jiang, B. Microbial characteristics in anaerobic digestion process of food waste for methane production–A review. Bioresour. Technol. 2017, 248, 29–36. [Google Scholar] [CrossRef] [PubMed]
  25. Liu, Y.; Whitman, W.B. Metabolic, phylogenetic, and ecological diversity of the methanogenic archaea. Ann. N. Y. Acad. Sci. 2008, 1125, 171–189. [Google Scholar] [CrossRef] [PubMed]
  26. Angelidaki, I.; Alves, M.; Bolzonella, D.; Borzacconi, L.; Campos, J.L.; Guwy, A.J.; Kalyuzhnyi, S.; Jenicek, P.; van Lier, J.B. Defining the biomethane potential (bmp) of solid organic wastes and energy crops: a proposed protocol for batch assays. Water Sci. Technol. 2009, 59, 927. [Google Scholar] [CrossRef] [PubMed] [Green Version]
  27. Holliger, C.; Alves, M.; Andrade, D.; Angelidaki, I.; Astals, S.; Baier, U.; Bougrier, C.; Buffiere, P.; Carballa, M.; De Wilde, V.; et al. Towards a standardization of biomethane potential tests. Water Sci. Technol. 2016, 74, 2515–2522. [Google Scholar] [CrossRef] [PubMed] [Green Version]
  28. Carlsson, M.; Schnürer, A. Handbook Methane Potential. Available online: http://sgc.camero.se/ckfinder/userfiles/files/SGC237.pdf (accessed on 13 August 2018).
  29. Forgács, G.; Pourbafrani, M.; Niklasson, C.; Taherzadeh, M.J.; Hováth, I.S. Methane production from citrus wastes: process development and cost estimation. J. Chem. Technol. Biotechnol. 2011, 87, 250–255. [Google Scholar] [CrossRef]
  30. Snaidr, J.; Amann, R.; Huber, I.; Ludwig, W.; Schleifer, K.H. Phylogenetic analysis and in situ identification of bacteria in activated sludge. Appl. Environ. Microbiol. 1997, 63, 2884–2896. [Google Scholar] [PubMed]
  31. Raskin, L.; Stromley, J.M.; Rittmann, B.E.; Stahl, D.A. Group-specific 16s rRNA hybridization probes to describe natural communities of methanogens. Appl. Environ. Microbiol. 1994, 60, 1232–1240. [Google Scholar] [PubMed]
  32. Amann, R.I.; Ludwig, W.; Schleifer, K.H. Phylogenetic identification and in-situ detection of individual microbial-cells without cultivation. Microbiol. Rev. 1995, 59, 143–169. [Google Scholar] [PubMed]
  33. Daims, H.; Brühl, A.; Amann, R.; Schleifer, K.-H.; Wagner, M. The Domain-Specific Probe EUB338 is Insufficient for the Detection of all Bacteria: Development and Evaluation of a More Comprehensive Probe Set. Syst. Appl. Microbiol. 1999, 22, 434–444. [Google Scholar] [CrossRef]
  34. Arnell, M.; Astals, S.; Åmand, L.; Batstone, D.J.; Jensen, P.D.; Jeppsson, U. Modelling anaerobic co-digestion in benchmark simulation model No. 2: Parameter estimation, substrate characterisation and plant-wide integration. Water Res. 2016, 98, 138–146. [Google Scholar] [CrossRef] [PubMed]
  35. Neves, L.; Oliveira, R.; Alves, M.M. Co-digestion of cow manure, food waste and intermittent input of fat. Bioresour. Technol. 2009, 100, 1957–1962. [Google Scholar] [CrossRef] [PubMed] [Green Version]
  36. Li, R.; Chen, S.; Li, X. Biogas production from anaerobic co-digestion of food waste with dairy manure in a two-phase digestion system. Appl. Biochem. Biotechnol. 2009, 160, 643–654. [Google Scholar] [CrossRef] [PubMed]
  37. La Cour Jansen, J.; Gruvberger, C.; Hanner, N.; Aspegren, H.; Svard, A. Digestion of sludge and organic waste in the sustainability concept for Malmo, Sweden. Water Sci. Technol. 2004, 49, 163–169. [Google Scholar] [CrossRef] [PubMed]
  38. Angelidaki, I.; Ellegaard, L.; Ahring, B.K. A comprehensive model of anaerobic bioconversion of complex substrates to biogas. Biotechnol. Bioeng. 1999, 63, 363–372. [Google Scholar] [CrossRef]
Figure 1. Work flow diagram describing the applied methodology.
Energies 11 02325 g001
Figure 2. (a) Cumulative methane production from the biomethane potential tests of the organic fraction of municipal solid waste (OFMSW); (b) Cumulative methane production from mixed sludge. For each substrate, the total biomethane production (top) is displayed, as well as the net production corrected for inoculum (bottom). Markers represent data and lines show model results (ADM1).
Energies 11 02325 g002
Figure 3. (a) Gas production for the continuous lab-scale reactor R1; (b) Gas production for the reference reactor R2. Total gas flow (top) and methane flow (bottom). Markers represent the data for daily gas production, grey lines represent the modelled instantaneous gas production, and blue lines show the modelled average daily gas production. The red dashed lines mark the time for load increase.
Energies 11 02325 g003
Figure 4. (a) Modelled ammonium inhibition for reactor R1. Simulation period of 70 days and (b) three-day selection. The red dashed line marks the time for load increase. Yellow dashed lines mark the time for feeding.
Energies 11 02325 g004
Table 1. Substrate characteristics. Selected measured values, estimated parameters and model state variables.
MeasurementsMixed SludgeOFMSW
DS (kg DS/t)73.6186
VS (kg VS/t)59.6173
COD (g/L)57.2235*
NH4 (mg/L)99.8 511.2
TN (mg/L)3 3205 184
VFA (mg/L)1 59710 040
Raw protein (N × 6.25) (% of DS)2120
Raw lipids (g/100 g)1.24 2.98
Estimated model parameters and state variables
Hydrolysis rate (khyd) (d−1)0.340.25
Carbohydrates (Xch) (kg COD/m3)2.6069.9
Protein (Xpr) (kg COD/m3)20.256.7
Lipids (Xli) (kg COD/m3)24.685.6
Ultimate methane potential (B0) (m3 CH4/t VS)287475
Estimated value, see Section 2.2 for motivation. Raw measurement data are provided in the Supplementary Information, Table S1.
Table 2. Quantitative measurements of methanogenic archaea in continuous lab-scale reactors R1 treating mixed sludge (MS) and food waste (OFMSW) and R2 treating the mixed sludge only, both at an OLR of 1 kg/m3/d and 2 kg/m3/d (n.d., not detected).
Percentage of Taxonomic Group
Orders and Families of Methanogenic ArchaeaInoculum and Start Point of both ReactorsR1
OLR 1.0
R2
OLR 1.0
R1
OLR 2.0
R2
OLR 2.0
Methanomicrobiales total81291215
Thereof: Methanocorpusculaceaen.d.n.d.n.d.n.d.n.d.
Thereof: Methanospirillaceaen.d.n.d.n.d.21
Methanobacterialesn.d.n.d.n.d.n.d.n.d.
Methanosarcinales total815102015
Thereof: Methanosaetaceae 815102015
Methanococcaceaen.d.n.d.n.d.n.d.n.d.
All methanogenic archaea1627193230
Table 3. Analysis of effluent biosolids from reactor R1.
MeasurementsAverage Day 0–30Average Day 50–70
DataModelDataModel
VFA (g/L)181108121220
Alkalinity (mg/L)3420299026283890
NH4-N (mg/L)1100700794880

