1. Introduction
Non-renewable energy sources, represented by fossil fuels, cannot meet the growing demand for energy in the future, not only because of its limited supply but also because it significantly disrupts the ecosystem [
1]. For this reason, there has been growing interest in renewable energy sources. In particular, solar energy, which is the most abundant energy on Earth, is expected to be one of the most suitable renewable energy sources to replace conventional fossil fuels [
2]. A solar updraft tower (SUT) power plant is one means to convert solar energy into electrical energy generated by buoyancy-driven air flow [
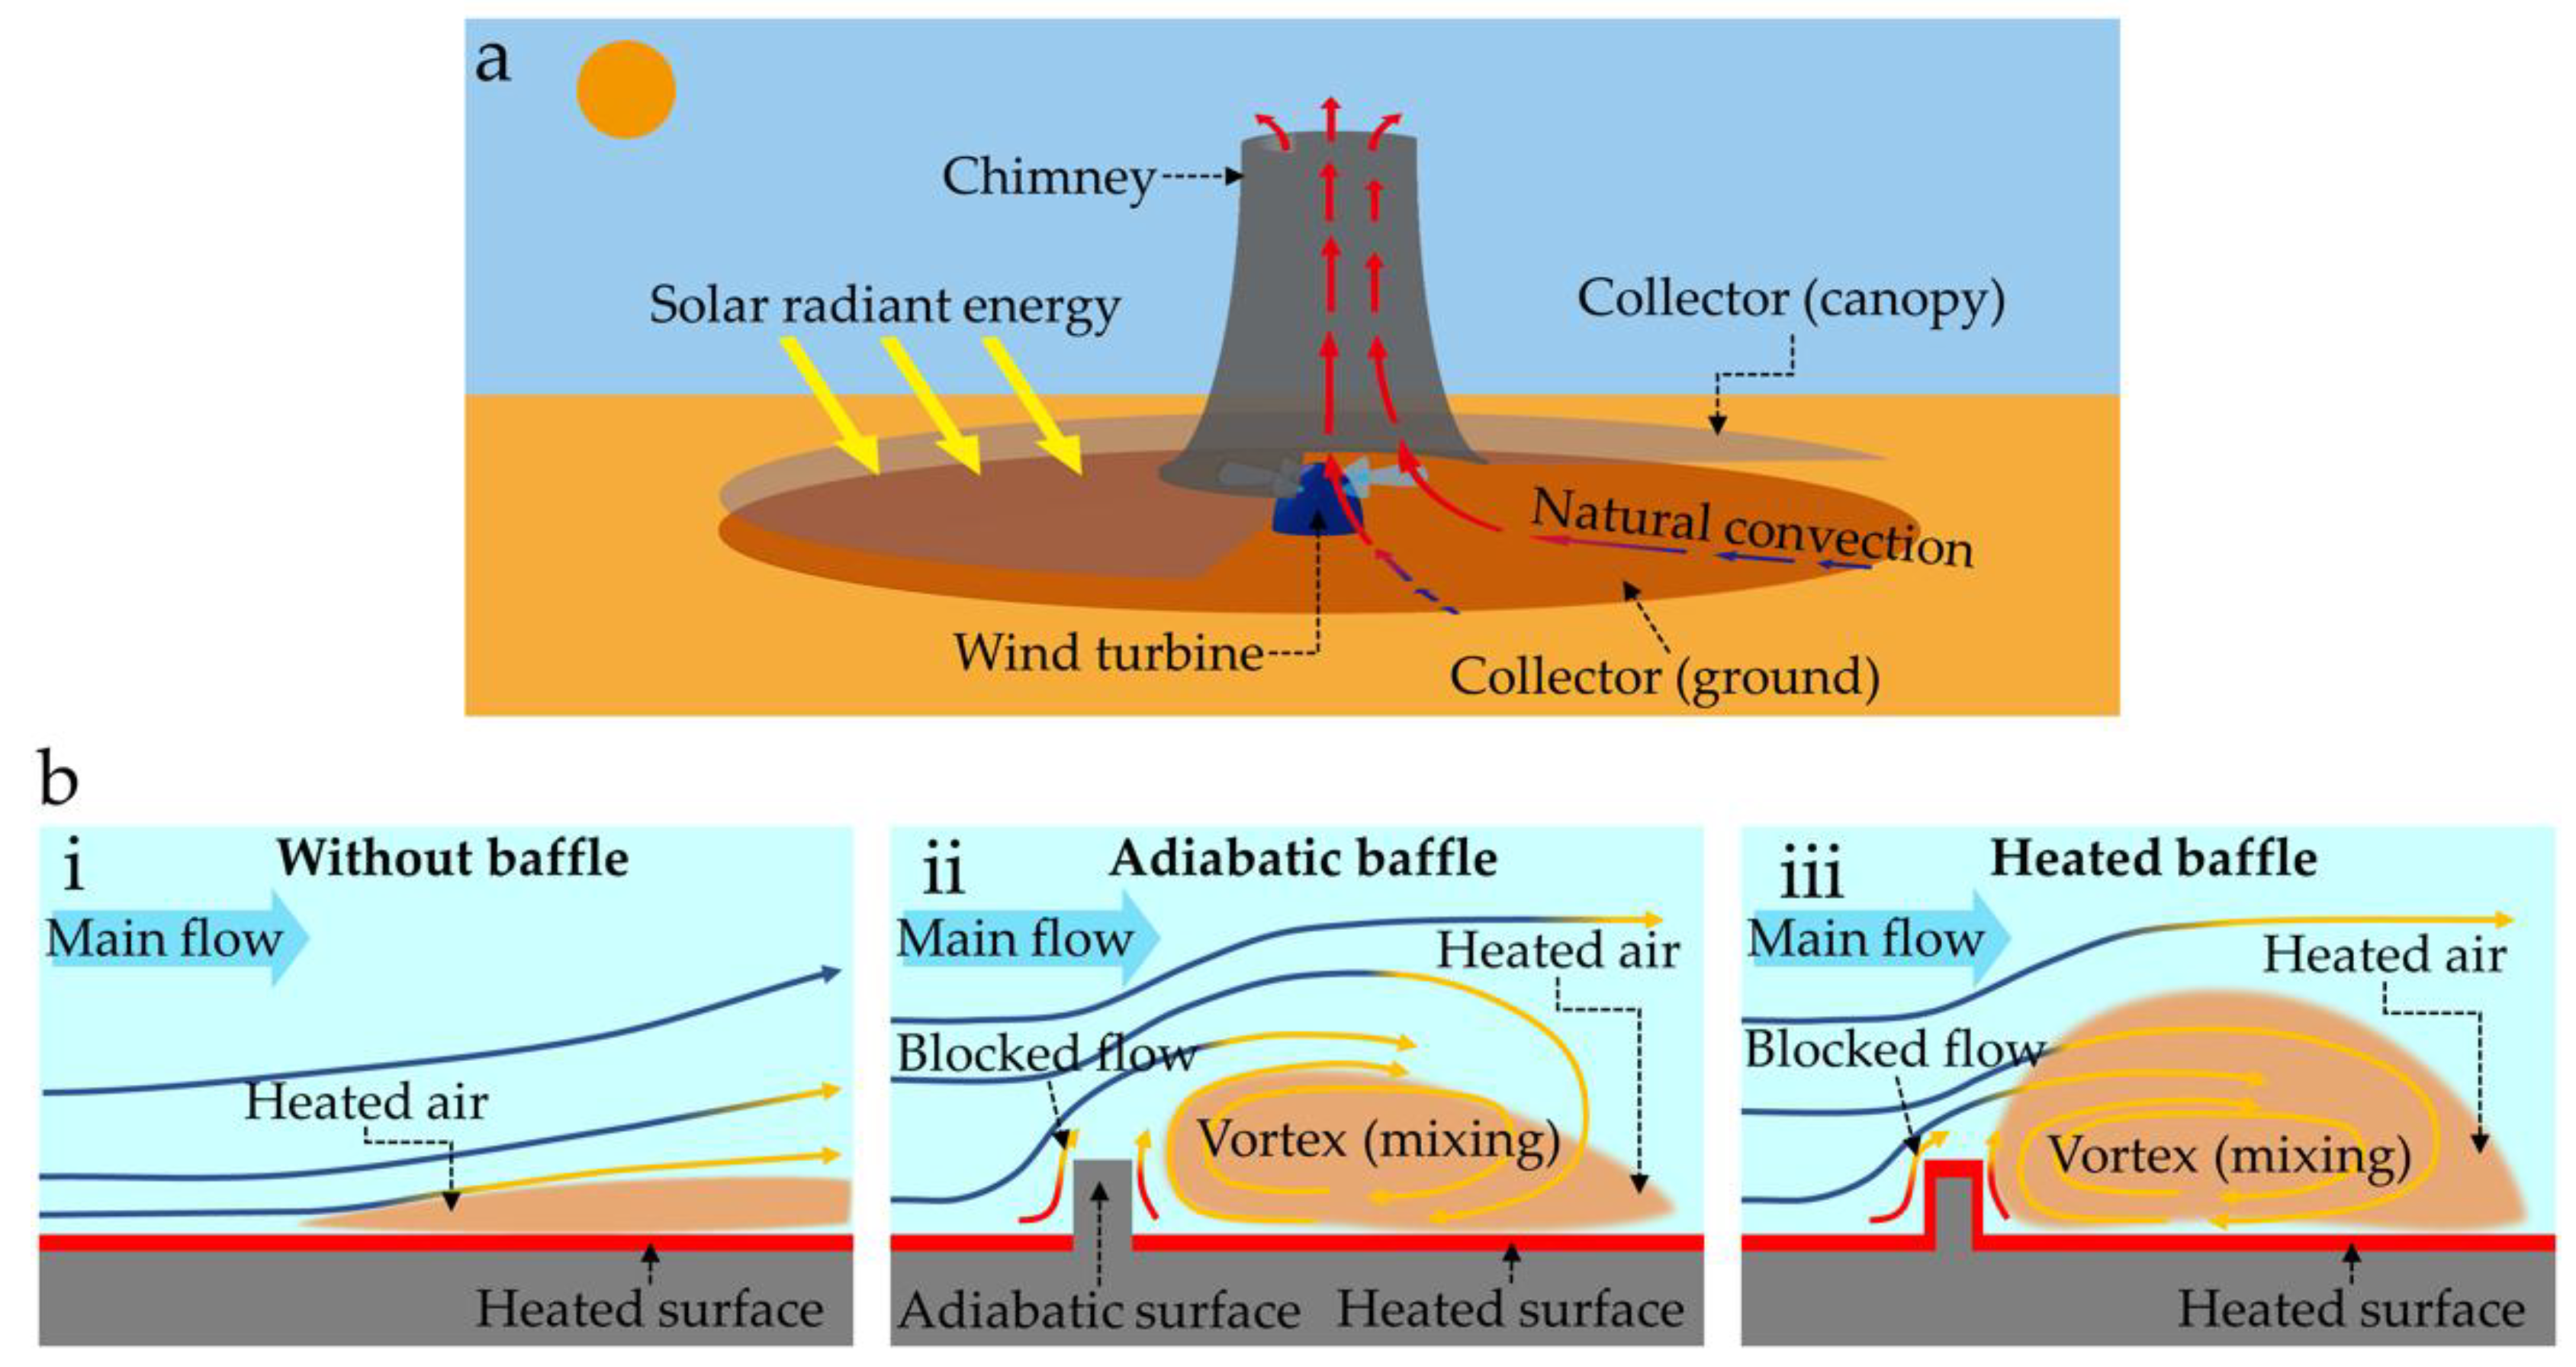
3]. An SUT power plant consists of three main parts: a collector, chimney and wind turbine (
Figure 1a). In the collector, thermal energy from solar radiant energy transfers heat to the ground. The air near the ground is heated and density differences in the flow occur due to temperature gradients, which is a natural convection phenomenon. The buoyancy force due to the density differences acts as a driving force to generate the flow in the SUT. The kinetic power of this air flow is converted into electric energy by the wind turbine mounted inside the SUT.
SUTs have been developed and discussed as a type of large-scale power plant [
3,
4,
5,
6]. Since the first prototype was built in 1982 [
7,
8,
9], research on SUTs has been more actively pursued [
3]. To improve SUT performance, several studies on the application of aerodynamic design have been carried out. Some of these studies have shown that the performance of SUTs varies according to their geometric parameters. The effect of the height and diameter of the collector outlet and chimney throat diameter on SUT performance has been reported to determine the aerodynamically optimized design [
10,
11,
12]. An analytical and numerical study to optimize the collector inlet and chimney height showed that the influence of the chimney diameter is greater than that of the chimney height [
13]. Five design parameters (collector radius, collector inlet height, collector outlet height, chimney height and diameter) that affect system performance were simultaneously optimized for the system efficiency, power output and system expenditure [
14]. Numerical investigations on canopy slopes and chimney geometries (heights and angles) have been conducted [
15,
16,
17]. Five canopy shapes including new geometries (segmented and stepped profile) were studied to confirm the aerodynamic performance of each design [
18]. Some other studies have attempted to increase efficiency by applying a diffuser-shaped chimney to the SUT to create lower static pressure regions near the chimney outlet in order to the increase the pressure difference and thus the flow rate [
10,
16,
19].
In a broad perspective, the abovementioned studies have focused on increasing the flow of the SUT by improving the general SUT shape, which serves as a casing for the internal flow. At the same time, compared with the overall design of the SUT, microperspective research has been performed to improve SUT performance through local thermal-fluidic improvement. Some studies have focused on aerodynamic devices and components in the flow paths of SUTs. There have been studies on the inlet guide vane, an aerodynamic component already used in turbomachinery, to guide the flow into the wind turbine at the transition region of the chimney and collector of an SUT [
20,
21,
22]. The guide wall, located in the collector-to-chimney transition region like the inlet guide vane, was studied by considering the mechanical functions of mounting the wind turbine and guiding/directing the air flowing horizontally in the collector toward the vertical direction in the chimney [
23].
Additionally, we noted a previous study of an obstacle placed at the SUT collector ground to interfere with the flow in the SUT [
24]. The study reported that the obstacle (baffle) improved SUT performance due to the enhanced mixing caused by the vortex that formed downstream of the obstacle. It should be noted that this principle is frequently considered in industrial heat exchanger designs using various shapes, such as fin, baffle, vortex generator and so forth, to increase heat transfer efficiency [
25,
26,
27,
28,
29,
30,
31,
32,
33,
34]. The key point in this heat exchanger design is to take into consideration both the negative aspect of increased flow resistance that arises from the installation of the obstacle and the positive aspect of heat transfer enhancement to the vortex as mentioned above. As a result, the in-depth analysis of the above-mentioned positive and negative aspects of obstacle installation is required. However, few studies on the SUT have explored this concept/method.
In this work, we used a numerical method to investigate the effects of diverse baffle geometries on SUT performance. In an SUT collector with a baffle, higher temperature distribution was observed compared with that of a conventional SUT (Conv_SUT) without a baffle, which resulted in increased kinetic power of the SUT. We focused on two baffle effects: the influence of heat transfer area increased by the area of the baffle and the flow formation due to the presence of a baffle (the reduction of collector cross-section of the flow path and the vortex downstream of the baffle). Three types of SUTs were considered to observe the effects of baffles (
Figure 1b). In the Conv_SUT without a baffle, simple flow was created by natural convection without the interference of a baffle (
Figure 1b–i). In the SUT with an adiabatic baffle, a negative effect due to the decreased cross-section of the flow path and a positive effect of the mixing of heated air and the main flow due to the vortex that occurred downstream of baffle, were observed (
Figure 1b–ii). In an SUT with a heated baffle, another advantage is the additional heat surface area of the baffle that increases the heat supply to the main flow (
Figure 1b–iii). For these three examples, a case study of baffle height and width was performed to confirm the effect of baffle size. An analysis was conducted through observation of the streamline and temperature distribution and the kinetic power of these cases was also compared.
2. Materials and Methods
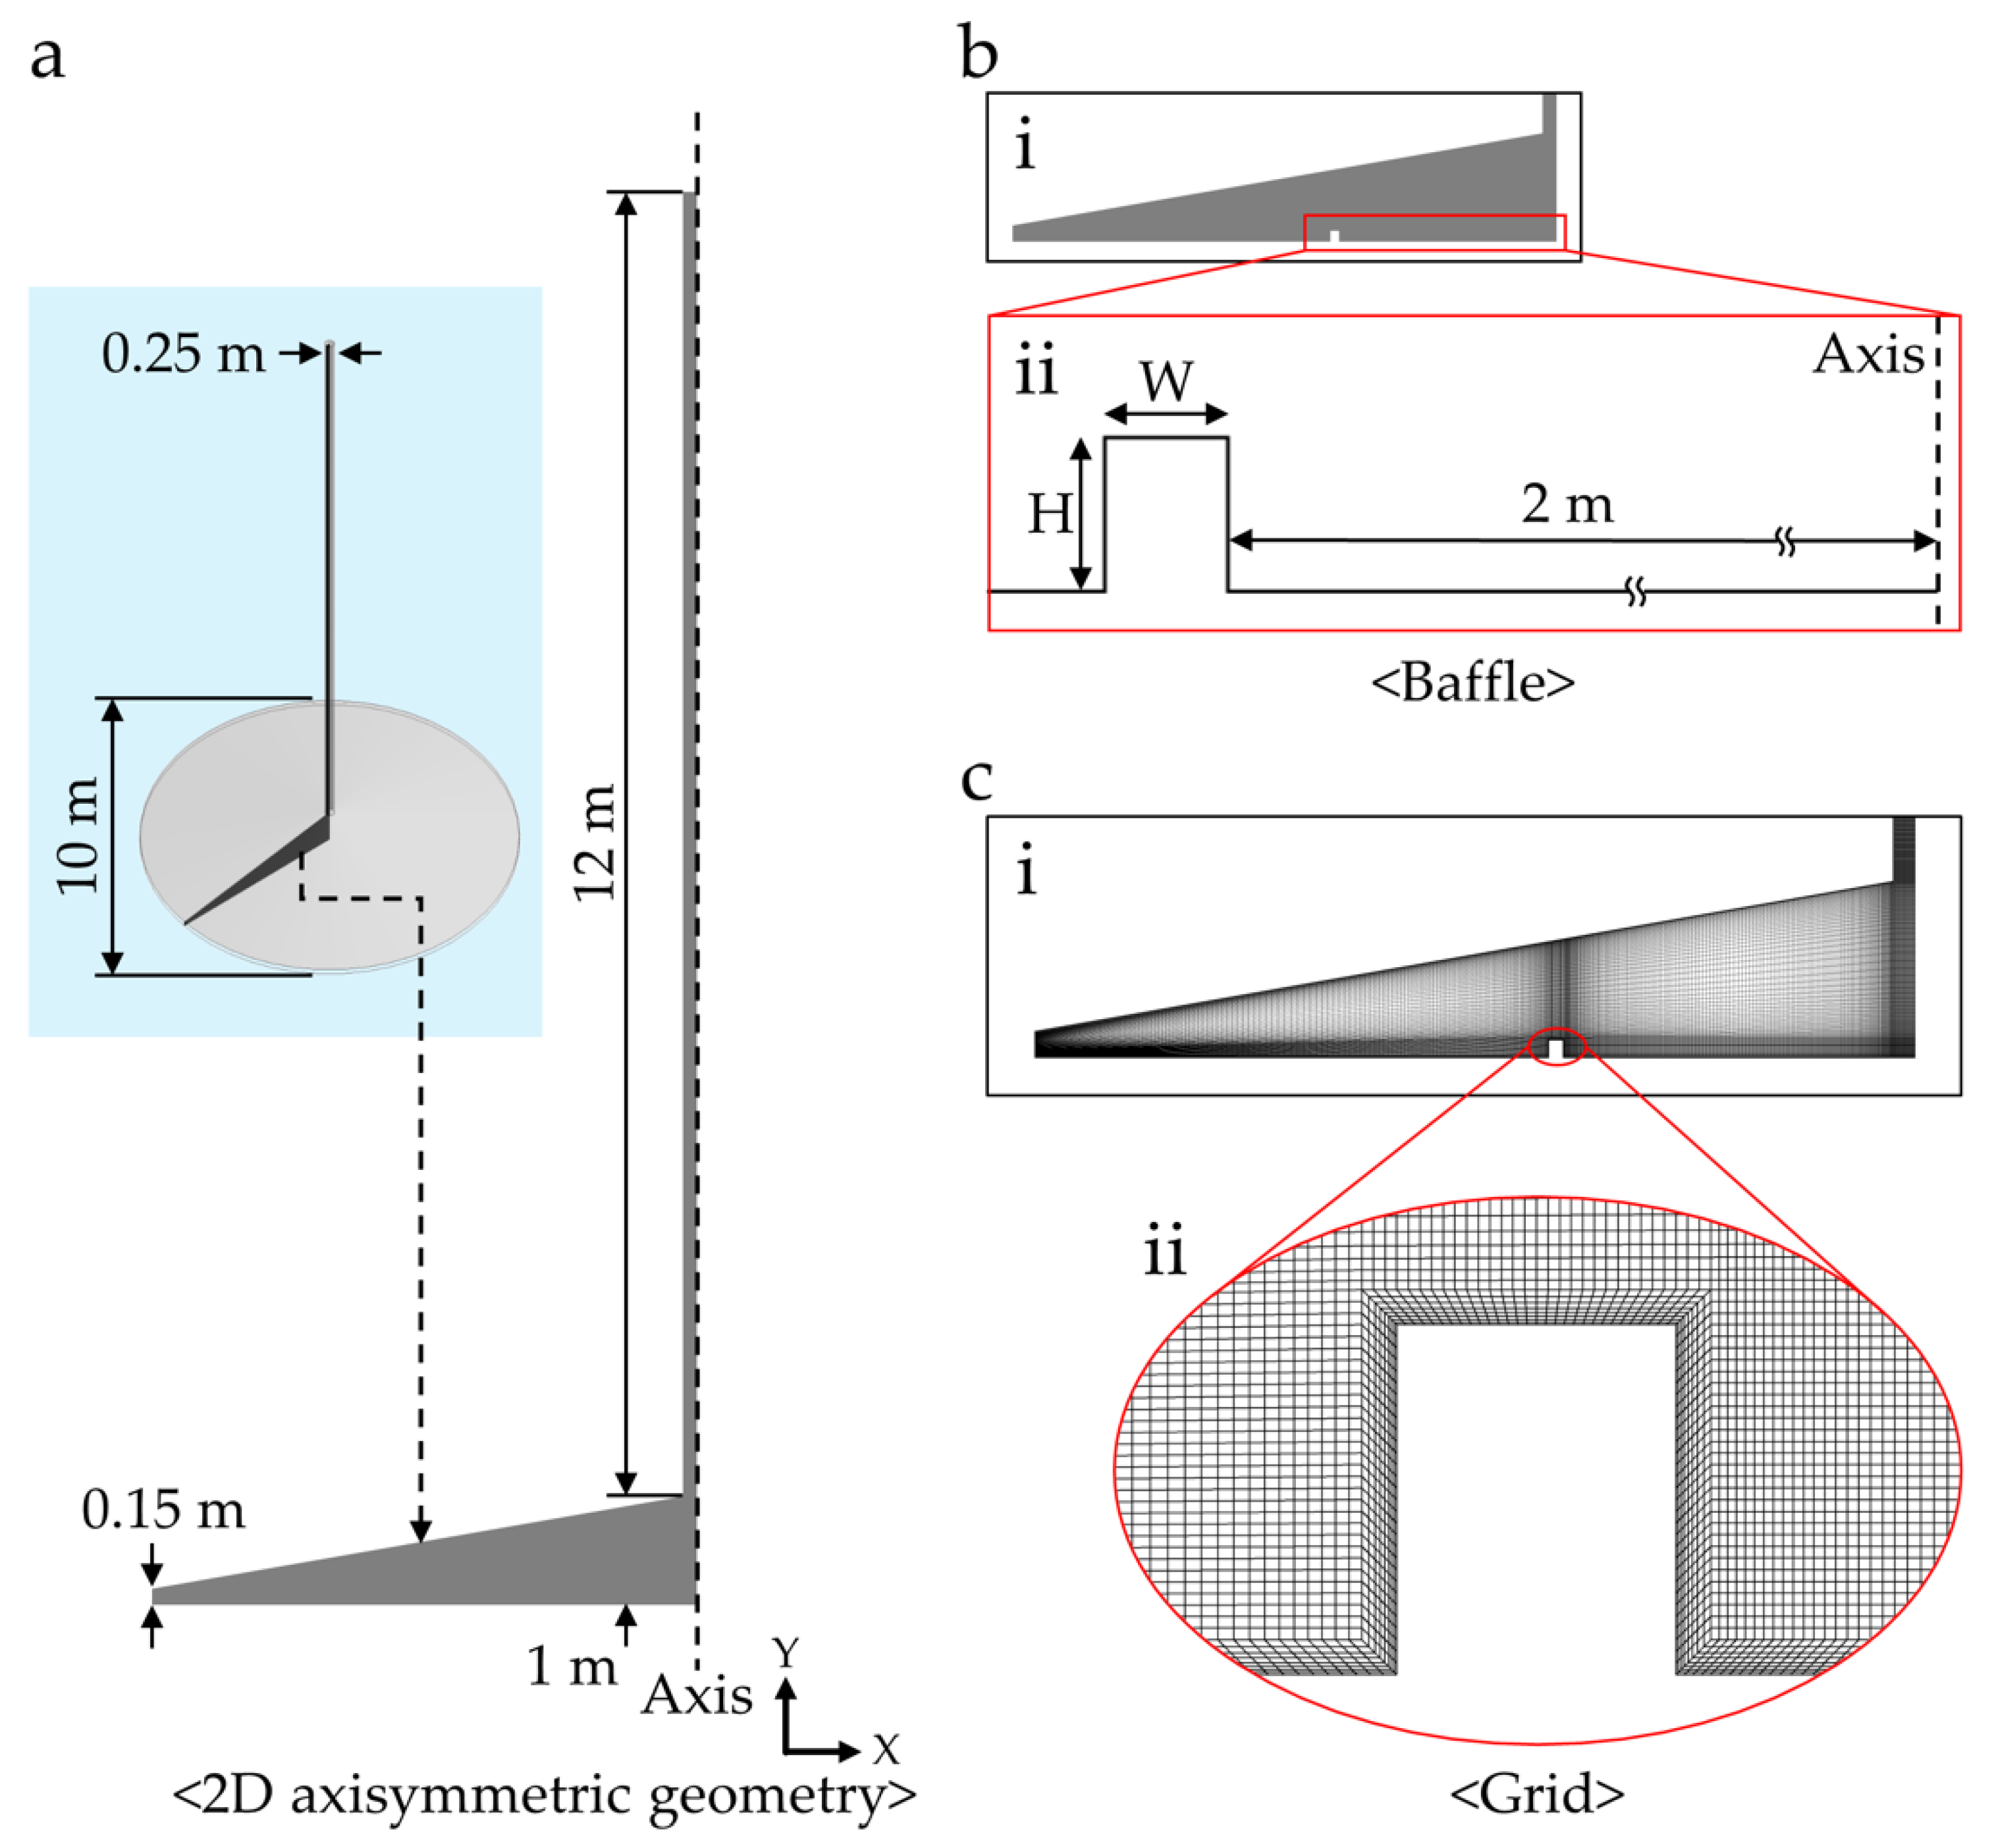
In the simulations, the collector radius of the SUT, total height, collector inlet height and chimney exit diameter were 5 m, 13 m, 0.15 m and 0.25 m, respectively (
Figure 2a), for which 2D axisymmetric geometry was applied for computation. The baffle was located at the bottom of the SUT (
Figure 2b–i). The position of the baffle was 2 m from the axis and the case study was conducted to predict the baffle effect according to the height (H) and width (W) (
Figure 2b–ii). A total of 10 models were constructed using nine different combinations of baffle heights and widths and thermal conditions (adiabatic or heated surface). The Conv_SUT without a baffle was used as a control. The smallest baffle, which was 0.1 m in height and 0.08 m in width, was called H10. Based on this model, other models with 1.5, 2 and 2.5 times the baffle height and width were used in the case study (
Table 1). Flow field and temperature distribution analysis of the SUTs was performed using ANSYS Fluent 17.0 (ANSYS, Inc., Canonsburg, PA, US), a commercial computational fluid dynamics (CFD) package.
Our computational models assumed steady-state turbulent flow for which the standard k-ε model was used because of its proven accuracy in predicting the temperature profile of the SUT collectors in earlier studies [
35,
36,
37,
38]. In addition, the enhanced wall treatment was applied to resolve the laminar sublayer near the wall [
39]. See the ‘
Supplementary Materials’ for further detailed description on the flow dynamics model used in this study. Air was used as the working fluid and the density and thermal expansion coefficient of air are 1.1543 kg/m
3 and 3.2805 × 10
−3 K
-1, respectively. To realize natural convection, the Boussinesq model was applied [
40]. In the process of calculating the buoyancy force, which is the driving force of natural convection, this Boussinesq model treats the density as a constant value in the governing equations except for the buoyancy term of the momentum equation. Because of the simplicity of density calculations, this method provides better convergence than using an ideal gas model or incompressible ideal gas model. The density of the buoyancy term in the momentum equation is determined by followed equation:
where
ρ0 is the constant density of the working fluid,
β is the thermal expansion coefficient and
T0 is the operating temperature. The inlet boundary condition is a pressure inlet condition of 1 atm with temperature of 300 K. The outlet boundary condition is a pressure outlet condition of 1 atm with temperature of 300 K. For the thermal boundary conditions, the heat emitted from the ground collector due to solar heat was assumed to be 13 W/m
2 and the walls of the canopy of the collector and chimney were assumed to be adiabatic. The operating conditions 1 atm (101,325 Pa) and 288.16 K were used. The abovementioned numerical methods and conditions are summarized in
Table 2.
Quadrilateral grids were applied to all geometries (
Figure 2c–i) and an inflation layer was used to predict the boundary layer profile near the wall and baffle (
Figure 2c–ii). The values of
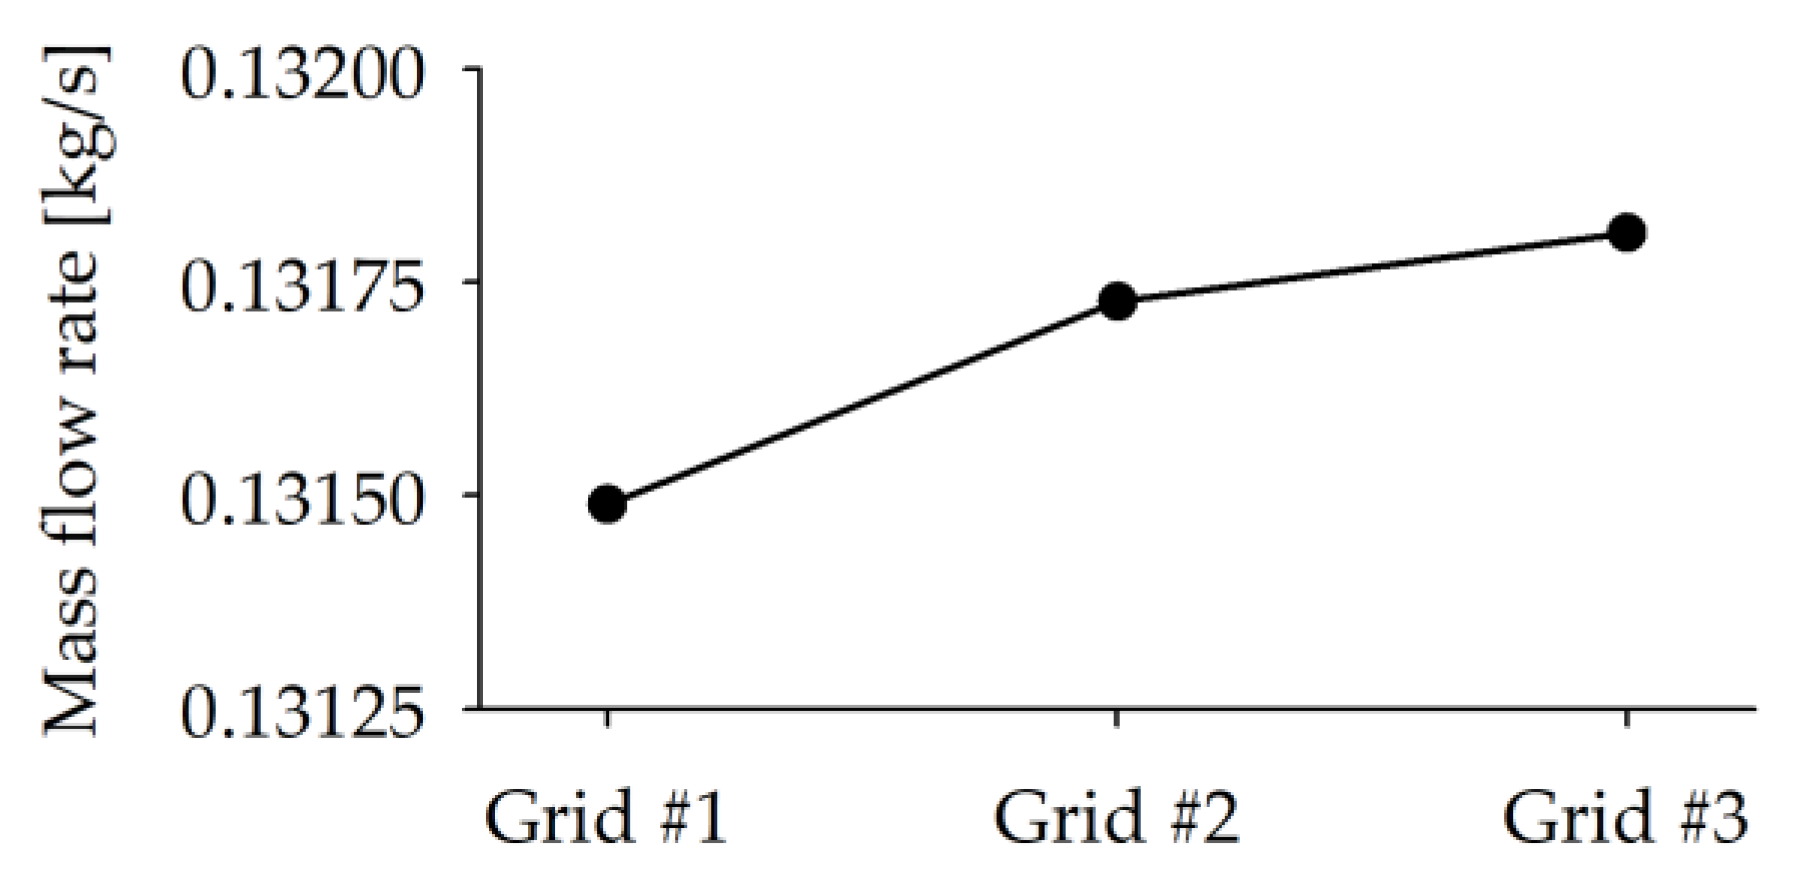
y+ are <5 for all geometries to ensure accurate prediction of the boundary layer. The grid density was determined by a grid independence test, in which the mass flow rate of the outlet was observed in relation to the number of grids (
Figure 3). The grid independence test was performed with three different grid densities with 62,880 (Grid #1) to 123,720 (Grid #2) and 200,720 (Grid #3) grid numbers. The outlet mass flow rates of Grids #1 and #2 were 0.24% and 0.06% different from that of Grid #3, the densest grid, respectively. Therefore, to use computational power efficiently, for all cases in this study, a grid with the density similar to that of Grid #2 was used.
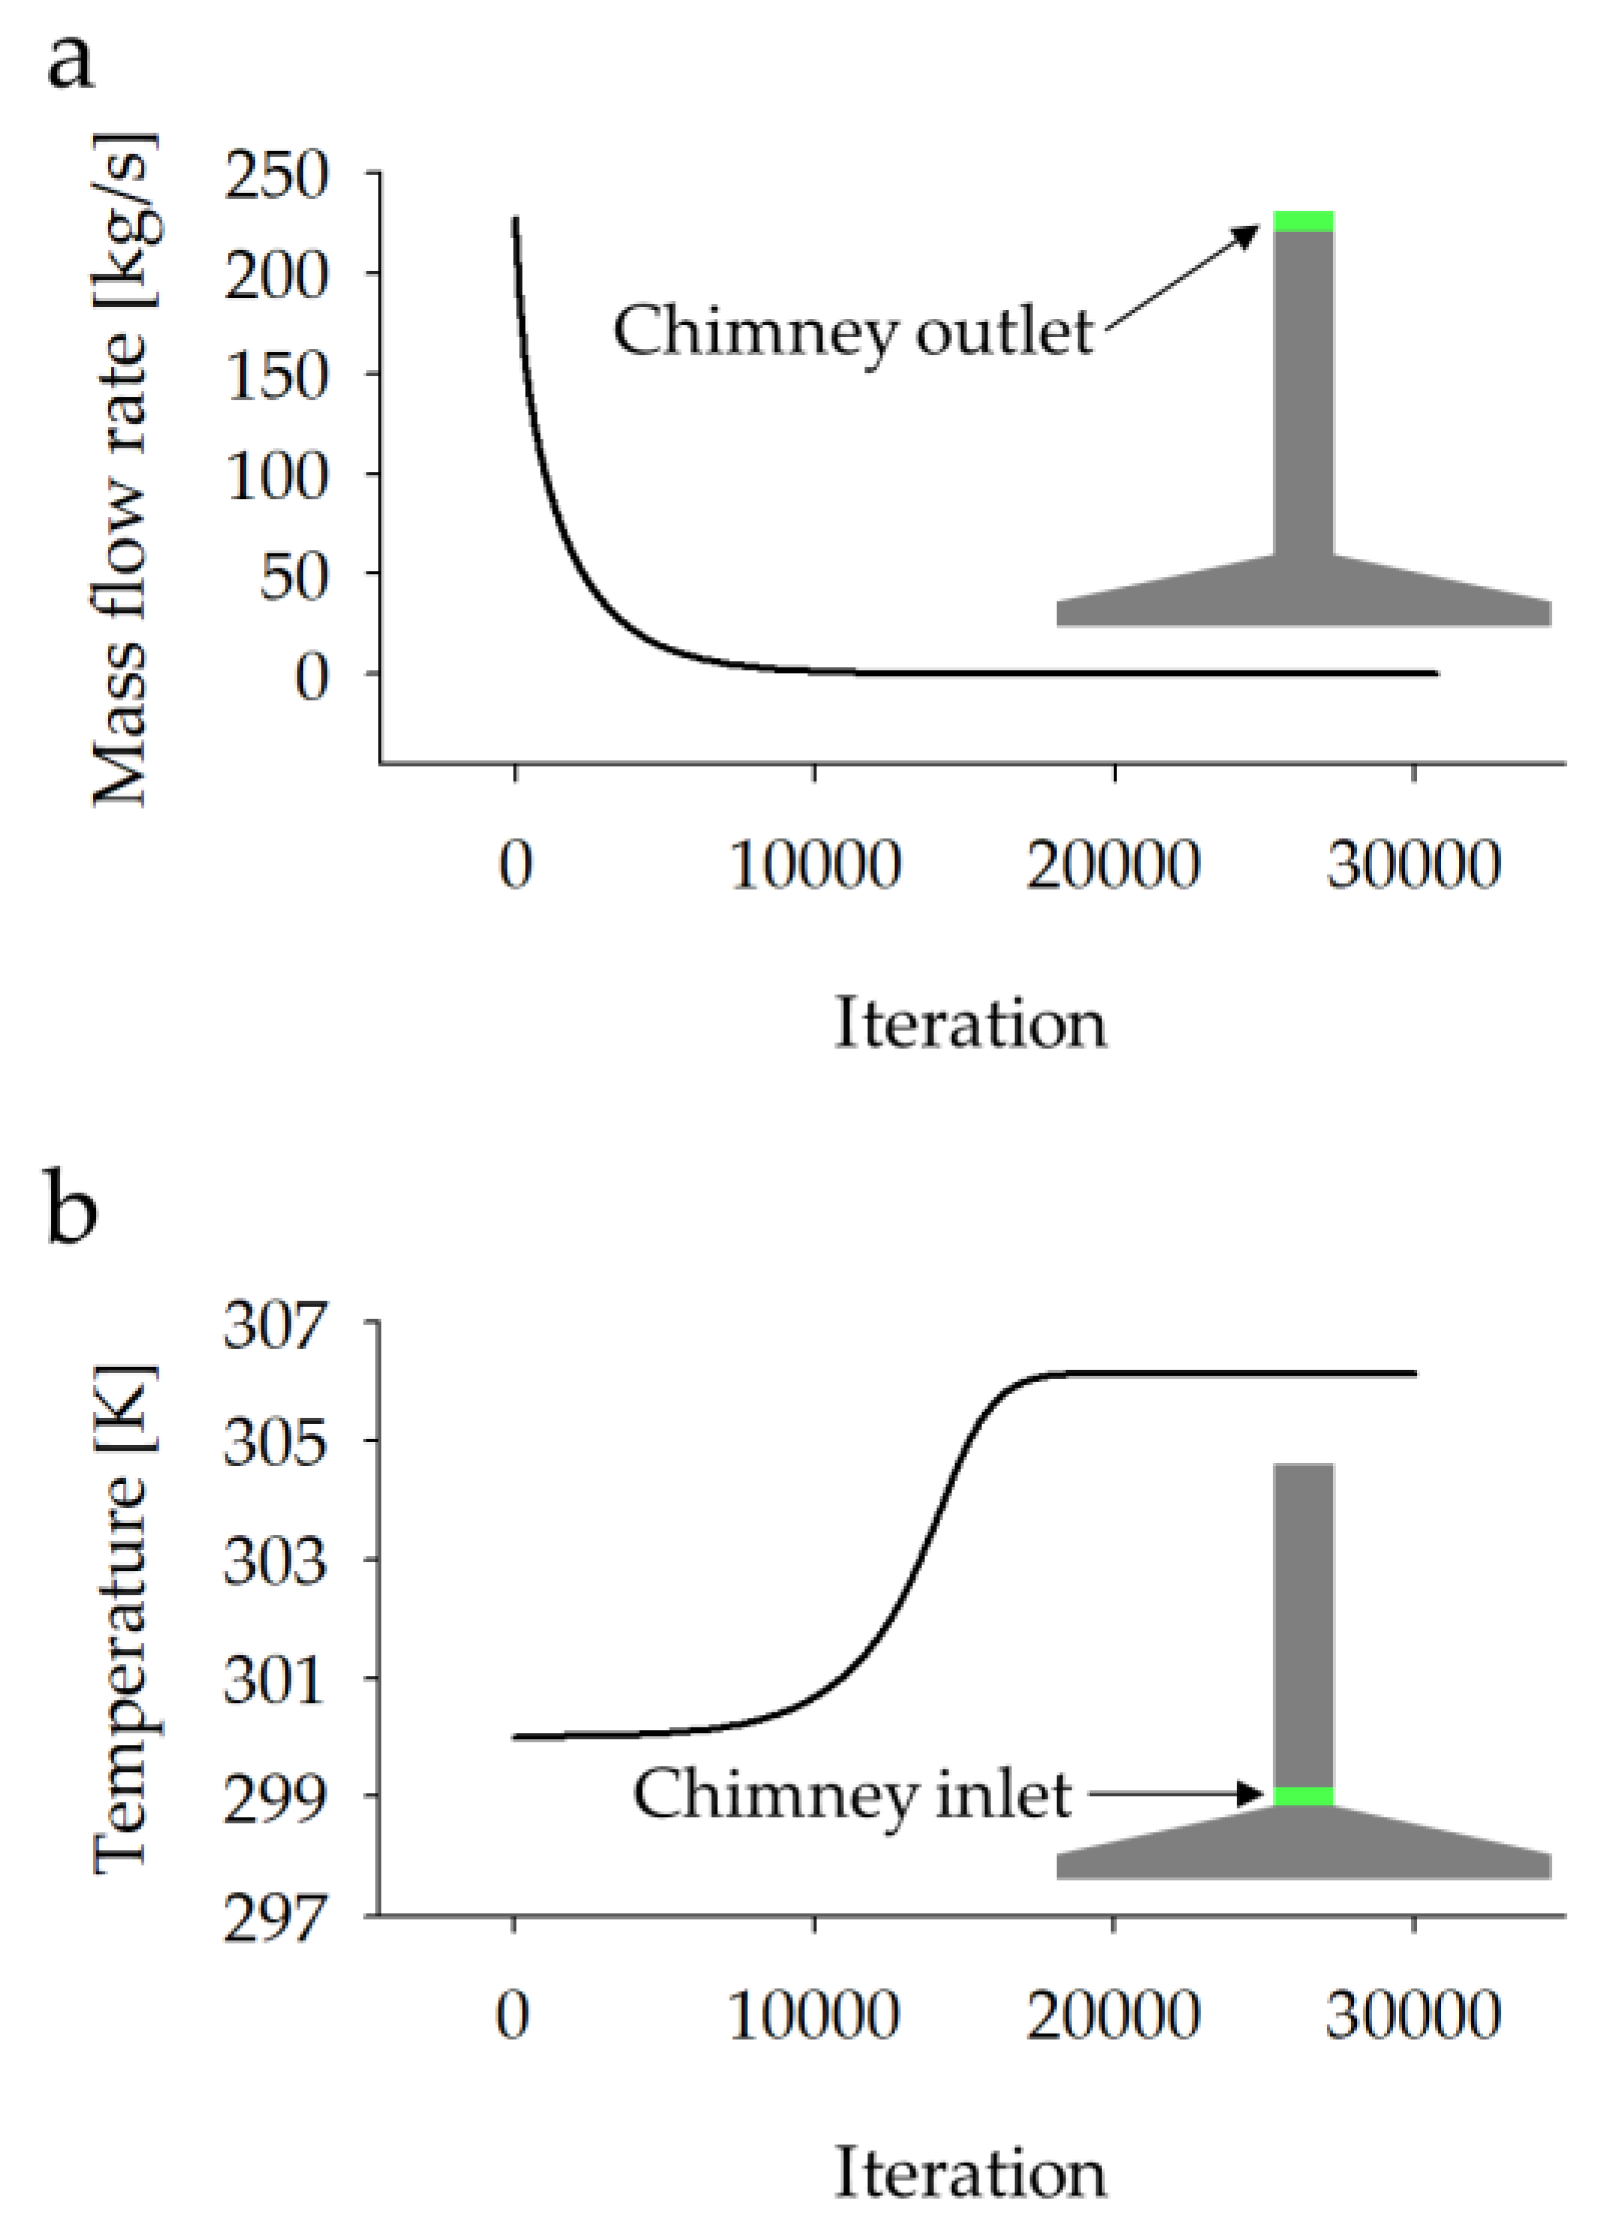
The convergence of the CFD model was determined by monitoring of the temperature and mass flow rate, which are important parameters for analysis (
Figure 4). The mass flow rate monitored in the outlet was stable after the 10,000th iteration; the stable mass flow rate was measured as 0.1317 kg/s (
Figure 4a). To confirm whether the temperature profile inside the SUT was fully developed, the average temperature in the SUT chimney inlet (green colored line in
Figure 4b) was monitored. The temperature was found to be stable after the 10,000th iteration (
Figure 4b). The converged value of the average temperature was 306.13 K. The computational result after 30,000 iterations, when the mass flow rate and temperature were sufficiently stabilized, was used for the analysis.
3. Results and Discussion
Our CFD model was validated by comparison with experimental results [
24] in terms of the temperature profile on the ground (blue colored arrow in
Figure 5). In the experimental results, this temperature gradually increased as it approached the center axis (5 m in the x-coordinate, ground radius) on the ground; this tendency also appeared with our CFD model (red solid line,
Figure 5). The temperature profile difference between the CFD and experimental results [
24] was less than 3.2% (based on absolute temperature); the maximum error was calculated near the SUT inlet (at 0.25 m in the ground radius,
Figure 5). This discrepancy can be explained as follows. Unlike the actual uneven heat flux emitted from the SUT ground, constant heat flux release was assumed in our CFD model. However, the fact that the error was less than 3.2% of the temperature prediction suggests that our CFD model is sufficiently useful to simulate the natural convection in an SUT.
Increased height of the baffle is beneficial for improved heat transfer; however, it has the negative effect of blocking the flow. Therefore, we tested three different baffle heights (
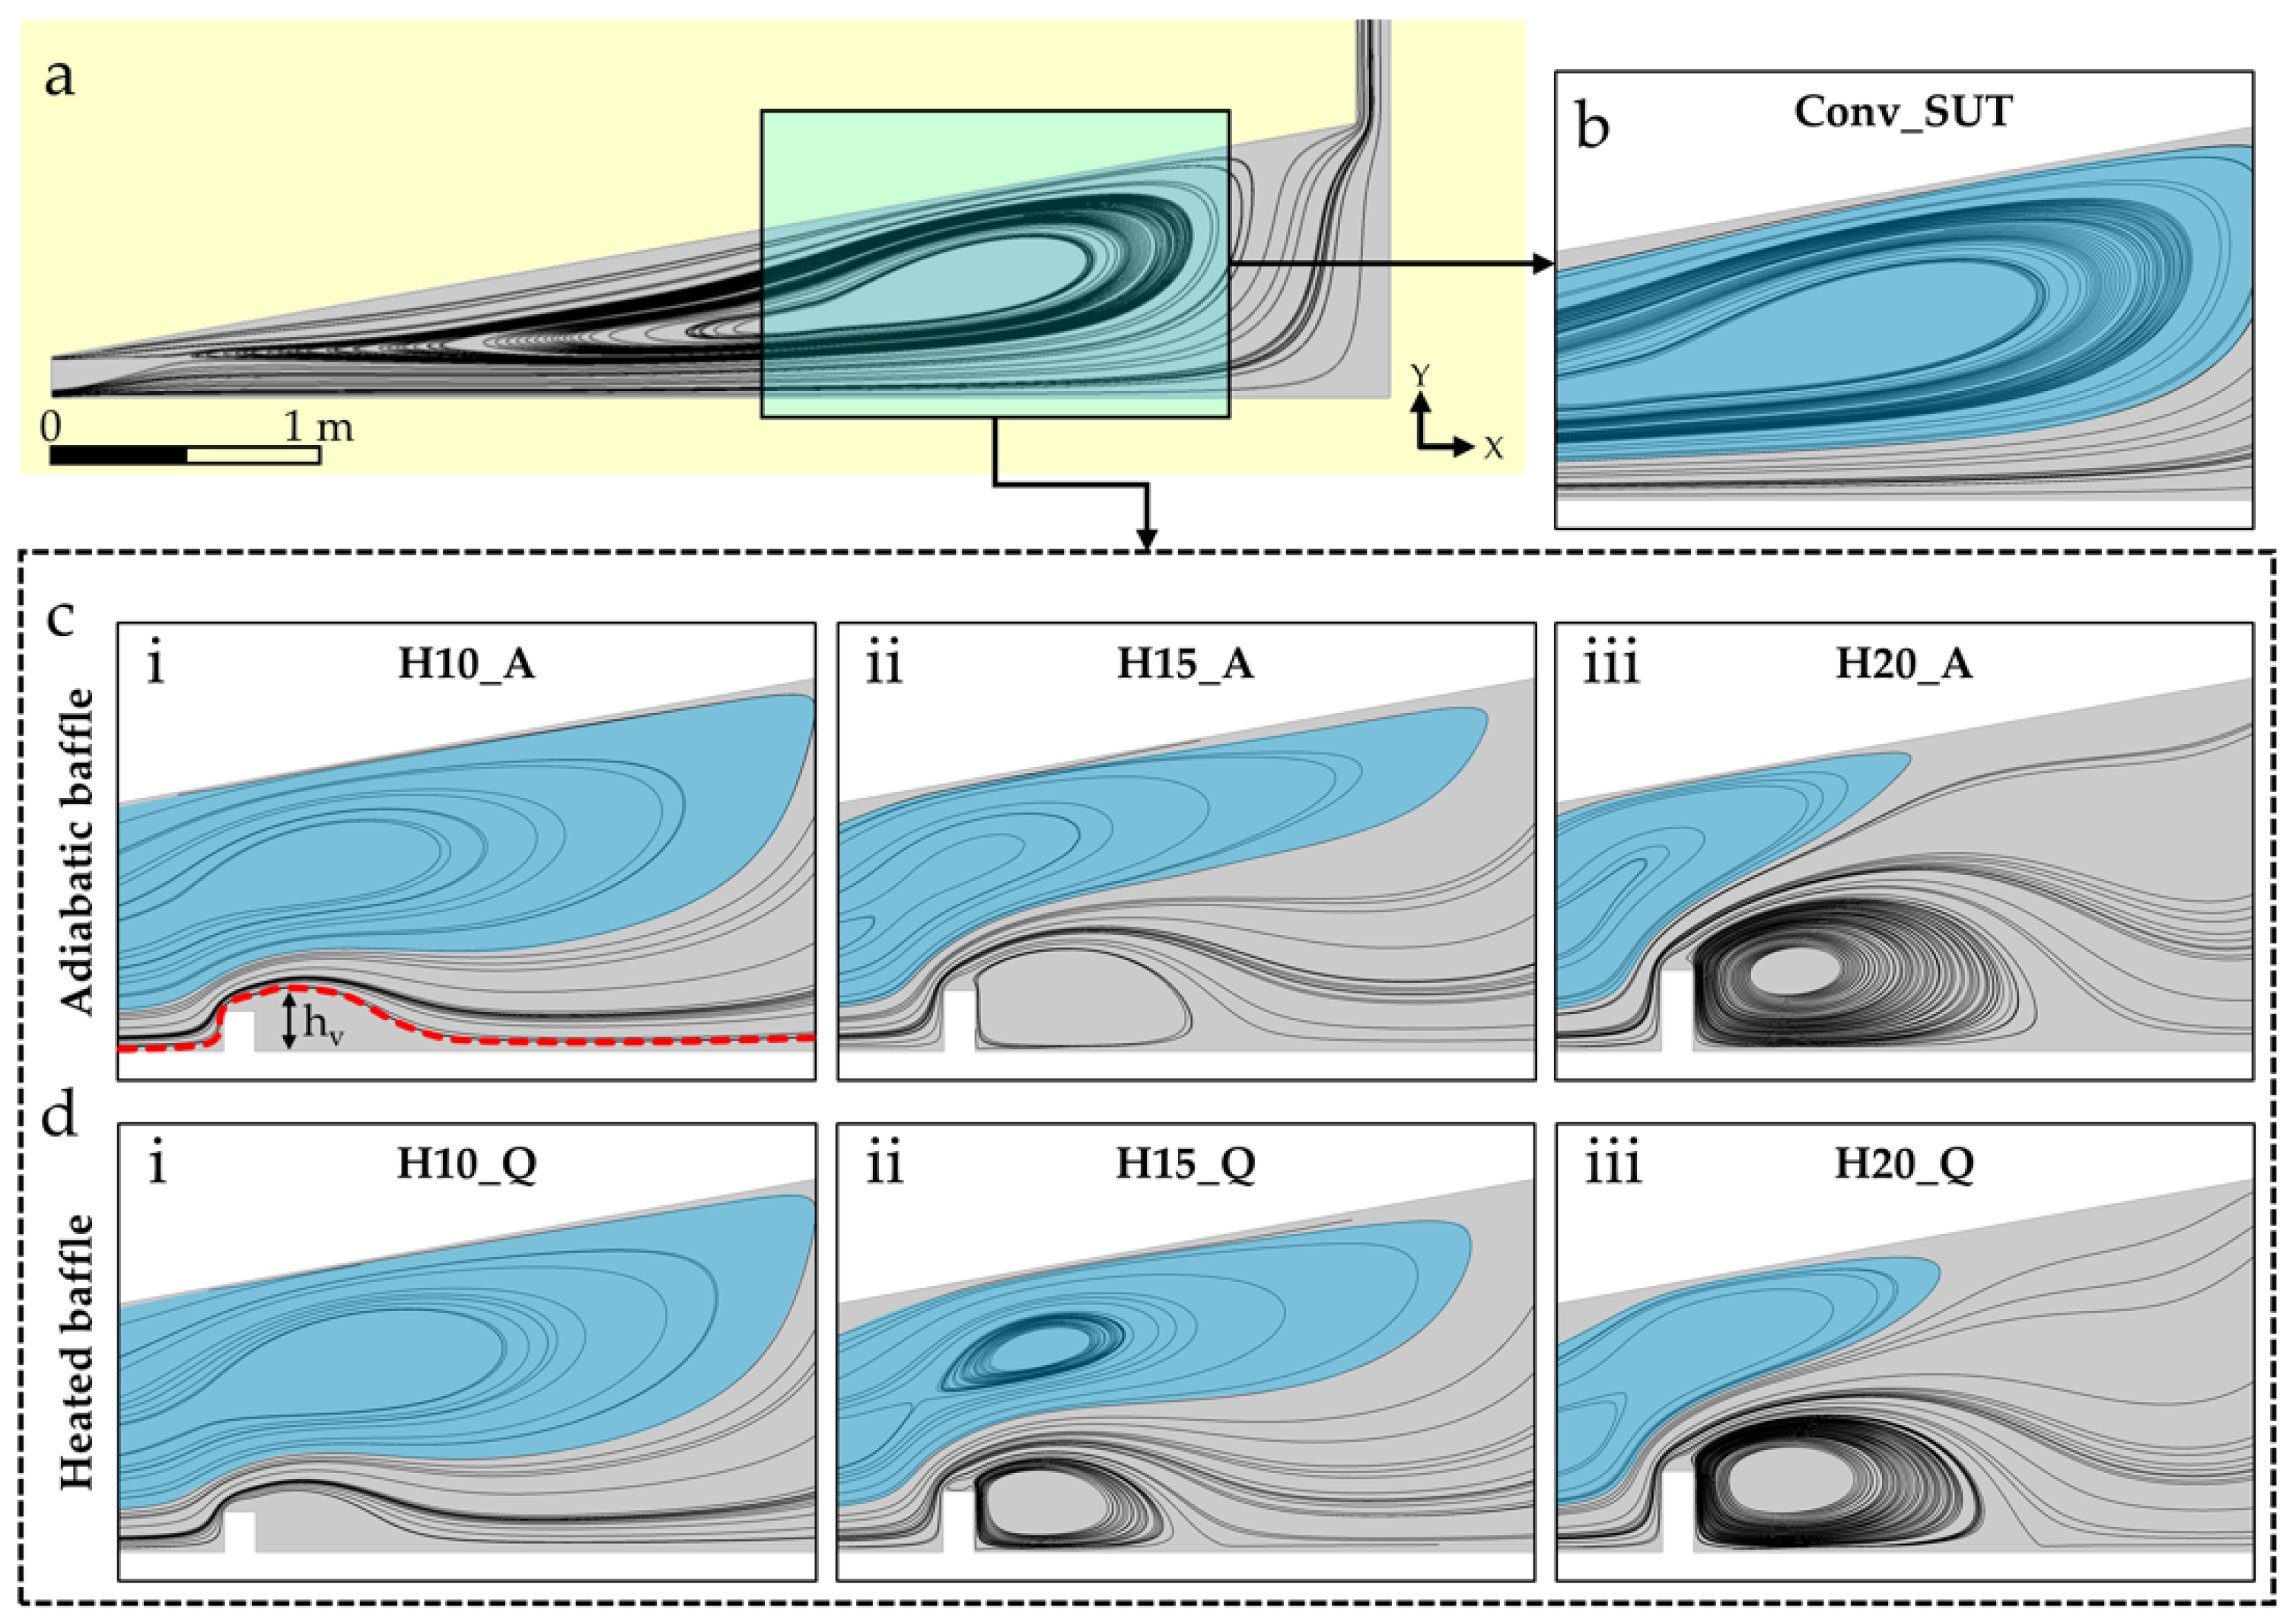
Table 1) to observe the tendency of the flow and temperature profiles formed for each model. First, the flow fields (visualized as streamlines) of the SUT models were compared (
Figure 6). In the Conv_SUT (the model without a baffle), two major flows were observed; one flow was the circulating streamlines in the collector of the SUT and the other was the streamlines flowing into the chimney (
Figure 6a). The area of the circulation region (blue in
Figure 6b,c), that is, a flow circulating in the collector by natural convection, was formed differently for each model with different heights. In comparison with the circulation region in the Conv_SUT (
Figure 6b), the circulation regions in the SUT models with baffles were narrower (
Figure 6c,d) owing to the baffle geometry; the higher the baffle, the narrower the circulation region. This tendency, which was observed regardless of the thermal boundary conditions of the baffle (adiabatic condition or heat flux condition), shows the negative effect of the baffle, that is, it reduces the cross-section, thus hindering the flow.
However, regarding heat transfer, a baffle also has the positive effect of generating a vortex downstream of the baffle, enhancing the flow and thermal mixing. Through the streamlines shown in
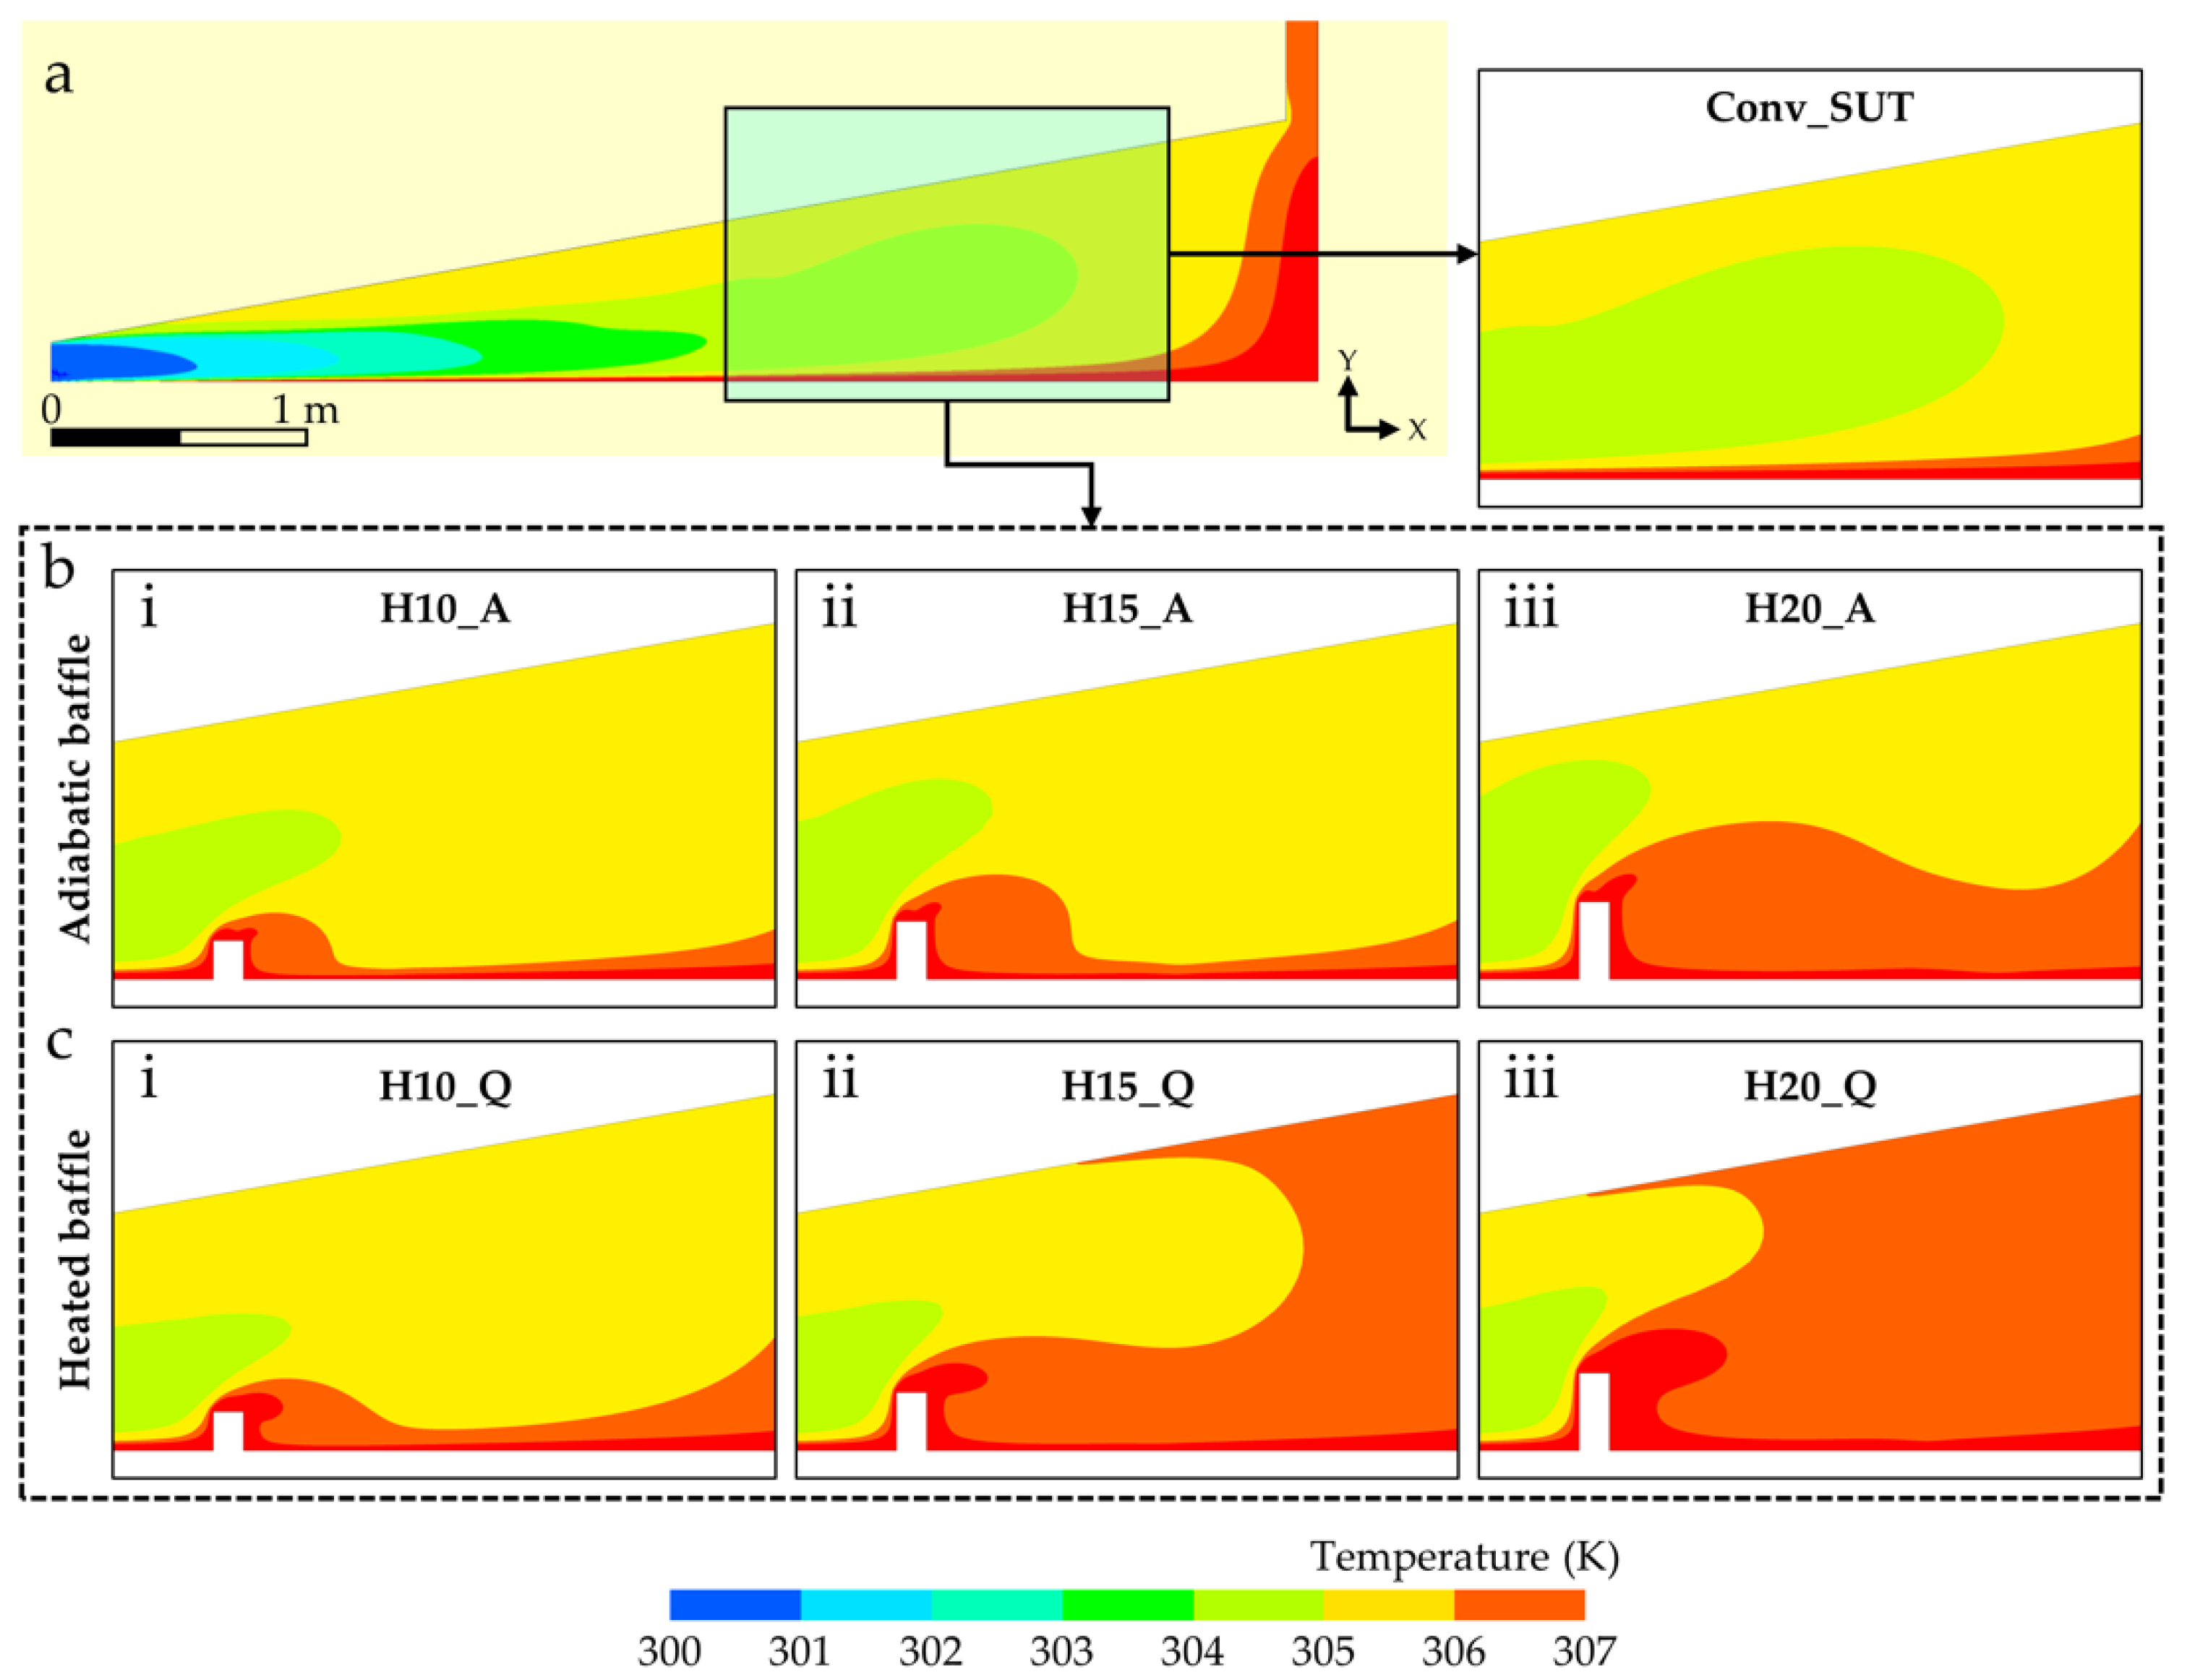
Figure 6c and d, it was observed that the size of the vortex was determined by the height of the baffle; the higher the baffle, the larger the vortex formed regardless of the thermal boundary conditions (adiabatic or heat flux conditions) of the baffle. The temperature contours show the effect of vortex size on the temperature distribution in the collector (
Figure 7). In the Conv_SUT, in most areas, the temperature was under 306 K except near the ground (
Figure 7a). In all SUT models with baffles (
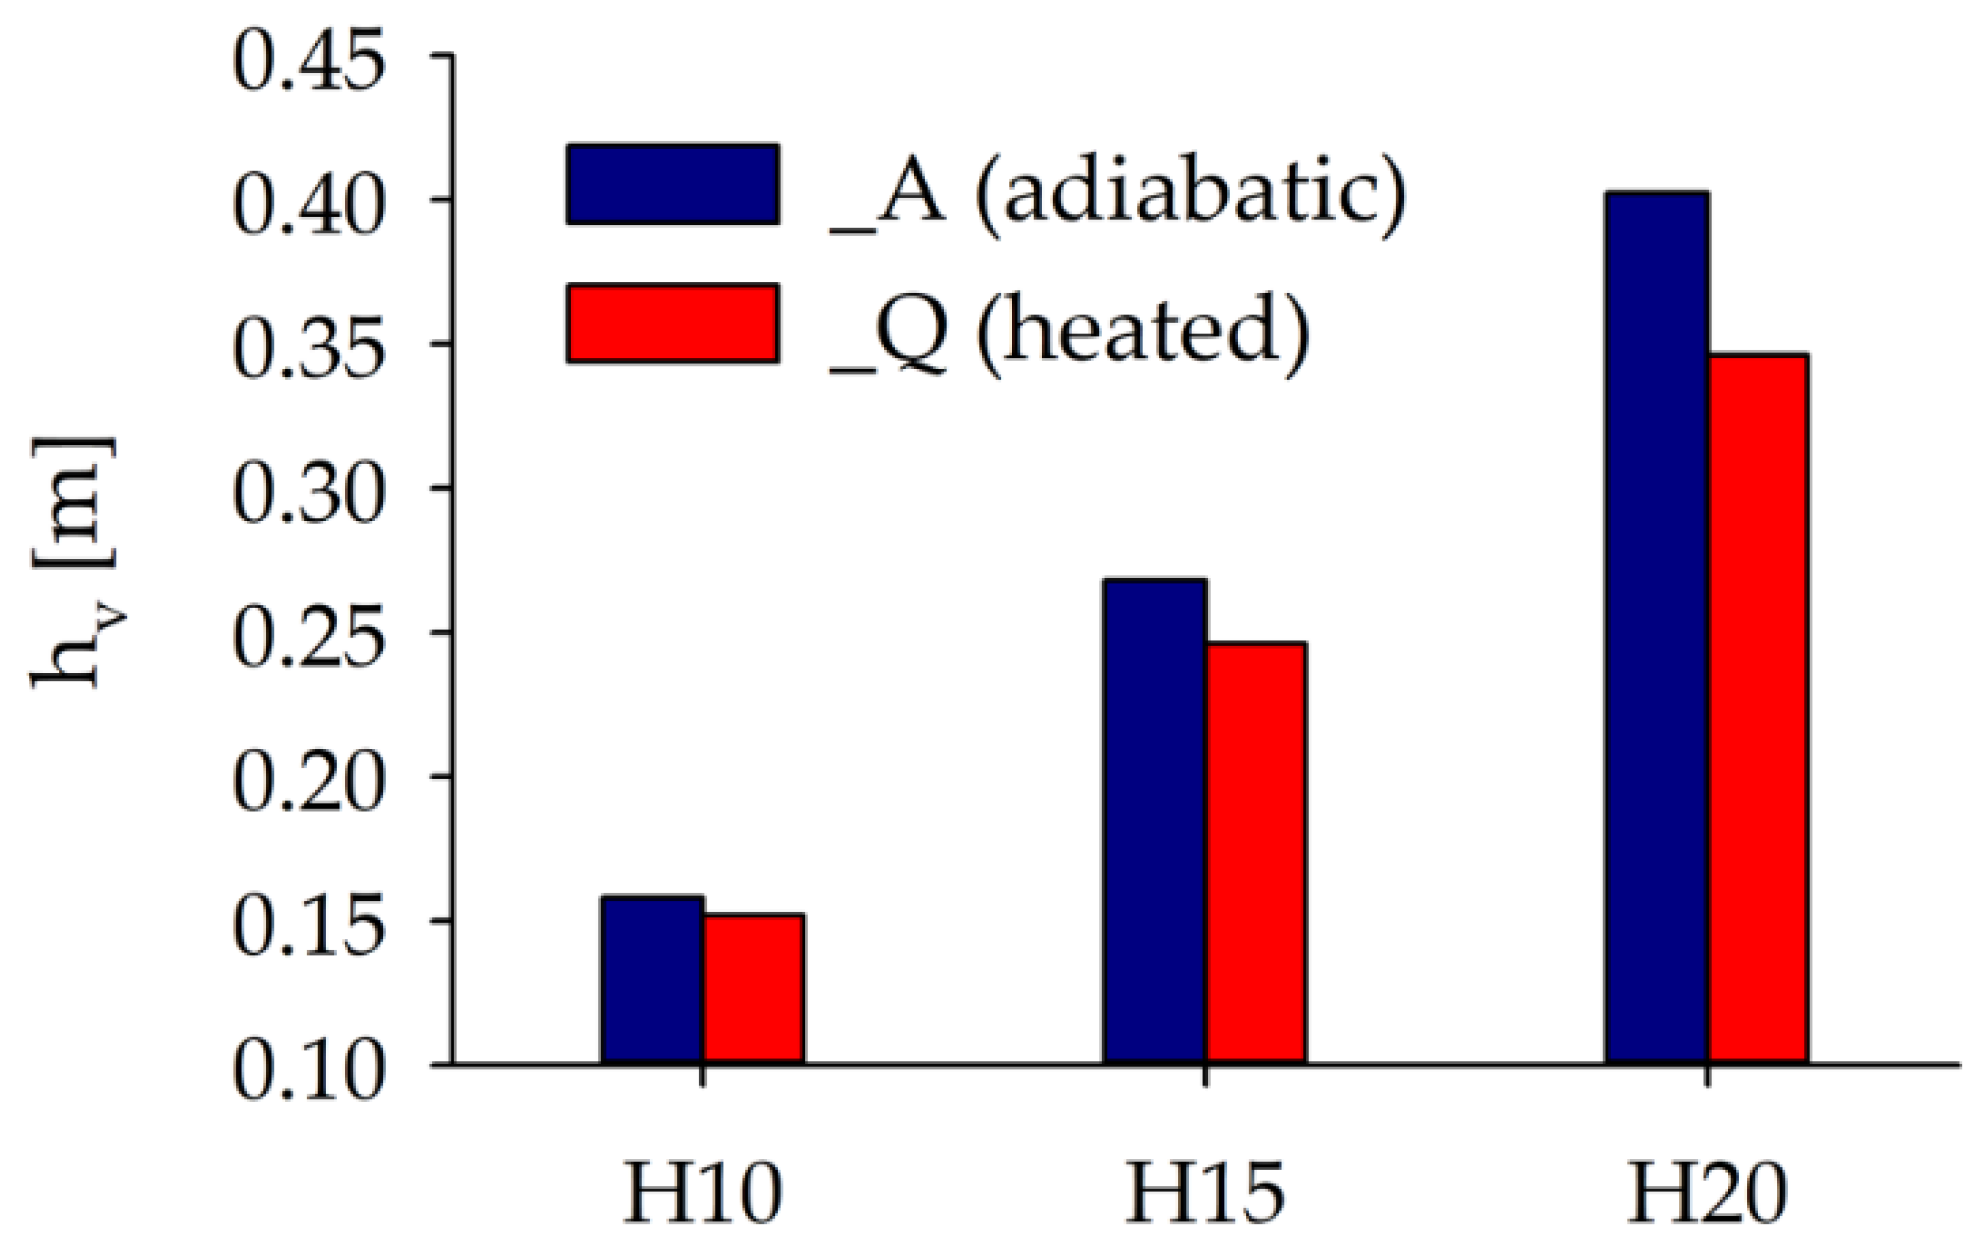
Figure 7b,c), the high-temperature region (>306 K) was widely distributed downstream of the baffle and this region was more widely distributed as the height of the baffle increased. Therefore, vortex size is important in determining the thermal distribution and the vortex size is again dependent on the baffle height. To quantify the vortex size in each model, the maximum height (h
v in
Figure 6c–i) of the streamline (red dashed line in
Figure 6c–i) that passed over the baffle was measured and compared. Understandably, the vortex size (h
v) is proportional to the baffle height (
Figure 8). First, in the models with adiabatic condition (blue bars,
Figure 8, corresponding to the streamline results from
Figure 6c), h
v of the H10_A was 0.158 m and h
v of H15_A and H20_A were 69.6% (0.268 m) and 154.4% (0.402 m) larger, respectively. Second, in the models with heat flux condition, h
v of H10_Q was 0.152 m and h
v of H15_Q and H20_Q were 61.8% (0.246 m) and 127.6% (0.346 m) larger, respectively (red bars,
Figure 8, corresponding to the streamline results from
Figure 6d). In addition, it was found that the h
v of models with an adiabatic baffle was larger than that of models with a heated baffle and the difference increased with increasing baffle height (up to 13.9% for H20 models) (
Figure 8). This is because h
v is inversely proportional to the velocity of the flow that passes over the baffle; in other words, a higher velocity over the baffle suppresses vortex growth and vice versa. In the SUT with an adiabatic baffle (
Figure 7b), the enhanced mixing of the heated air and the main flow was only due to the effect of the vortex, which means that the heat transfer efficiency was increased by the vortex only. On the other hand, in the SUT with a heated baffle, overall higher temperature distributions compared with those of the adiabatic baffle models were observed owing to the additional heat flux emitted from the baffle surface (
Figure 7c). The results derived from the two antithetical assumptions of thermal condition show the range of possible phenomena in an actual situation, which is a compromise of these results shown in
Figure 6b,c and
Figure 7b,c.
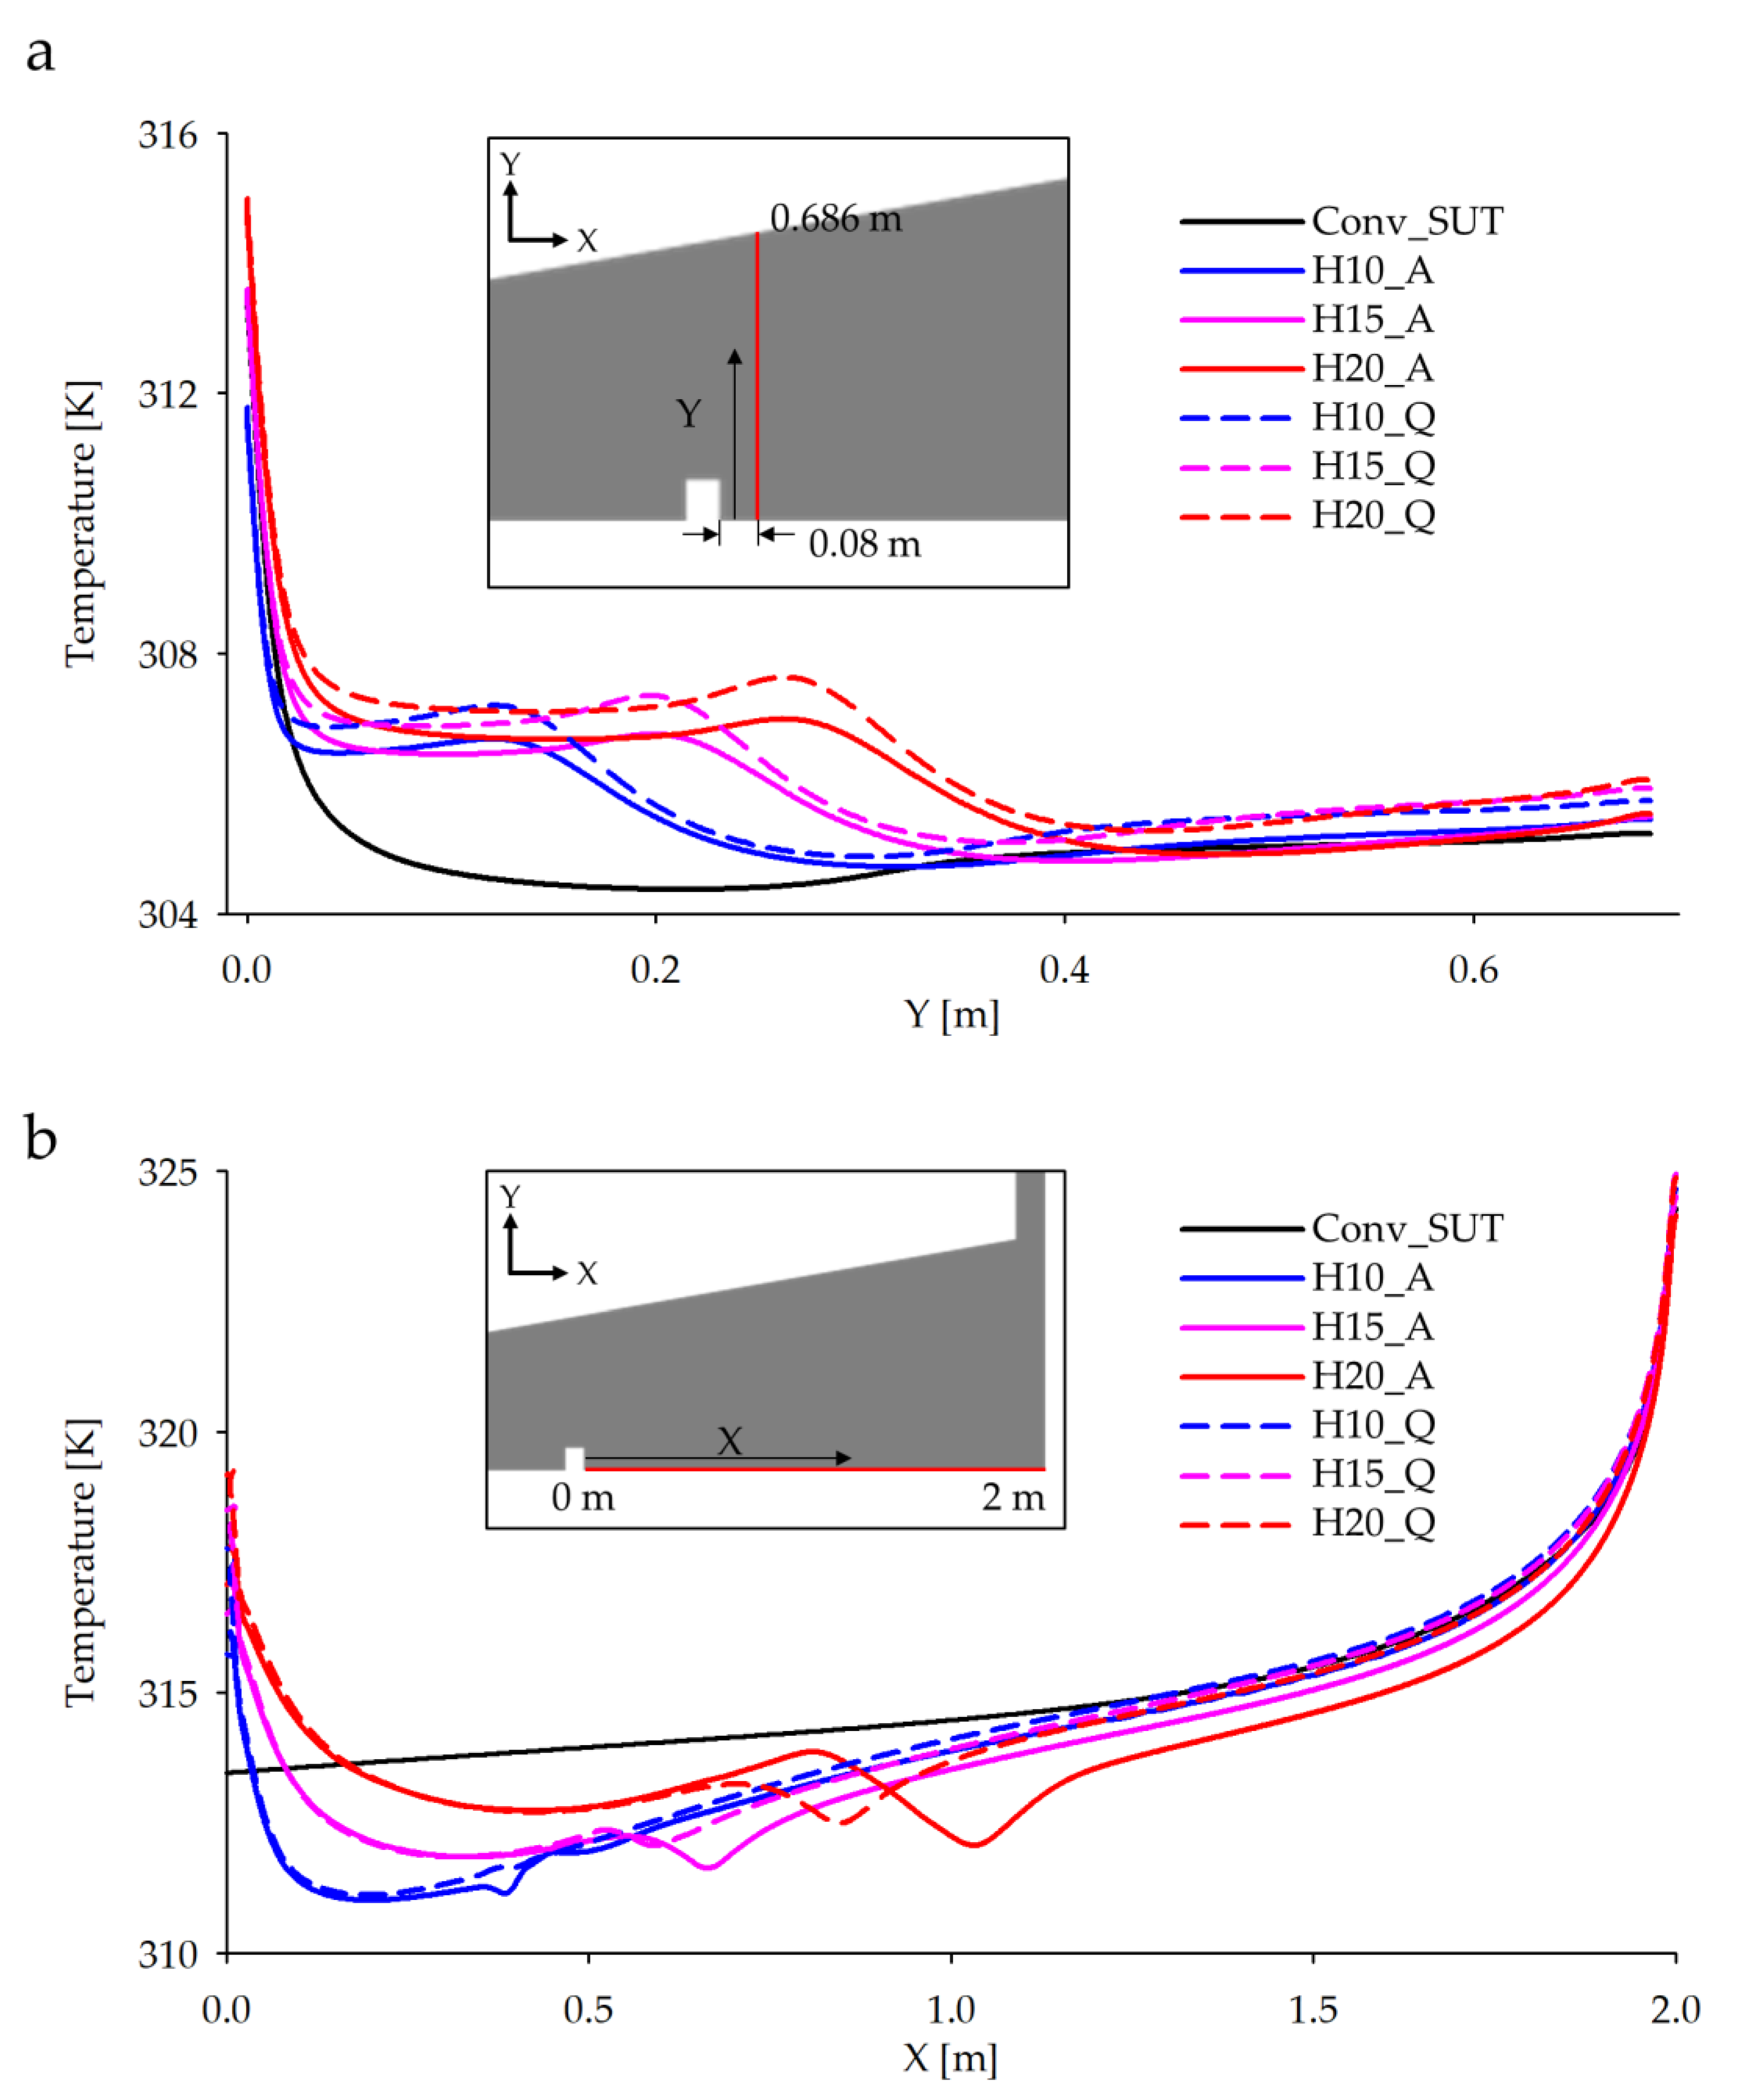
It is necessary to quantify how much the heat transfer from the ground to the main flow is enhanced by the vortex generated by the baffles with different heights. For this purpose, the temperature profiles were analyzed. The y-direction temperature profiles, along with the red line located 0.08 m downstream from the baffle, were derived for the seven models with various heights (
Figure 9a). The characteristics of the temperature field can be summarized in the following three ways. First, the temperature profiles for the SUTs with baffles were generally higher than that for the Conv_SUT (black solid line,
Figure 9a). Second, it was found that the higher the baffles, the higher the temperature profiles. Finally, the temperature distributions of the heated models were higher than those of the adiabatic models with the same heights (
Figure 9a). The y-position of the peak temperature moved from 0.12 m (for H10) to 0.2 m (for H15) and 0.26 m (for H20)) regardless of the thermal boundary conditions and the high-temperature region became wider in proportion to this position of peak temperature. The expansion of the high-temperature region led to an increased temperature difference with the air of the chimney outlet and strengthened the buoyancy, which is the driving force of an SUT. On the ground of the SUTs with baffles, the overall temperature profiles of these models were lower than that of the Conv_SUT and the general trend of the temperature profiles of all models increased as they approached the center of the SUT (X = 2 m in
Figure 9b) with a few distinguishing features (
Figure 9b). By the vortex flows (
Figure 6c,d), the upper flow with lower temperature was dragged down to the ground and lower temperatures were found at this corresponding ground location (on the x-axis). This sudden decrease in temperature was observed as downward peaks of the temperature profile, as shown in
Figure 9b. This location is determined by the size of the vortex identified via streamlines shown in
Figure 6c,d. In the vortex region (shown in
Figure 6c,d), the reverse-direction flow at the vortex bottom increases the temperature near the baffle (X = 0 m in
Figure 9b) because this flow collects the heat transferred from the ground. The heat contained in the reverse-direction flow (generated by the vortex) is transferred to the main flow owing to the guidance of the baffle structure (see upper arrows, blocked flow, in
Figure 1b–ii,iii). This is the mechanism by which the vortex contributes to the heat transfer of the SUT. The tendency of the temperature profiles in
Figure 9a,b shows that the heat transfer in the SUT collector can be enhanced by modification of the baffle height.
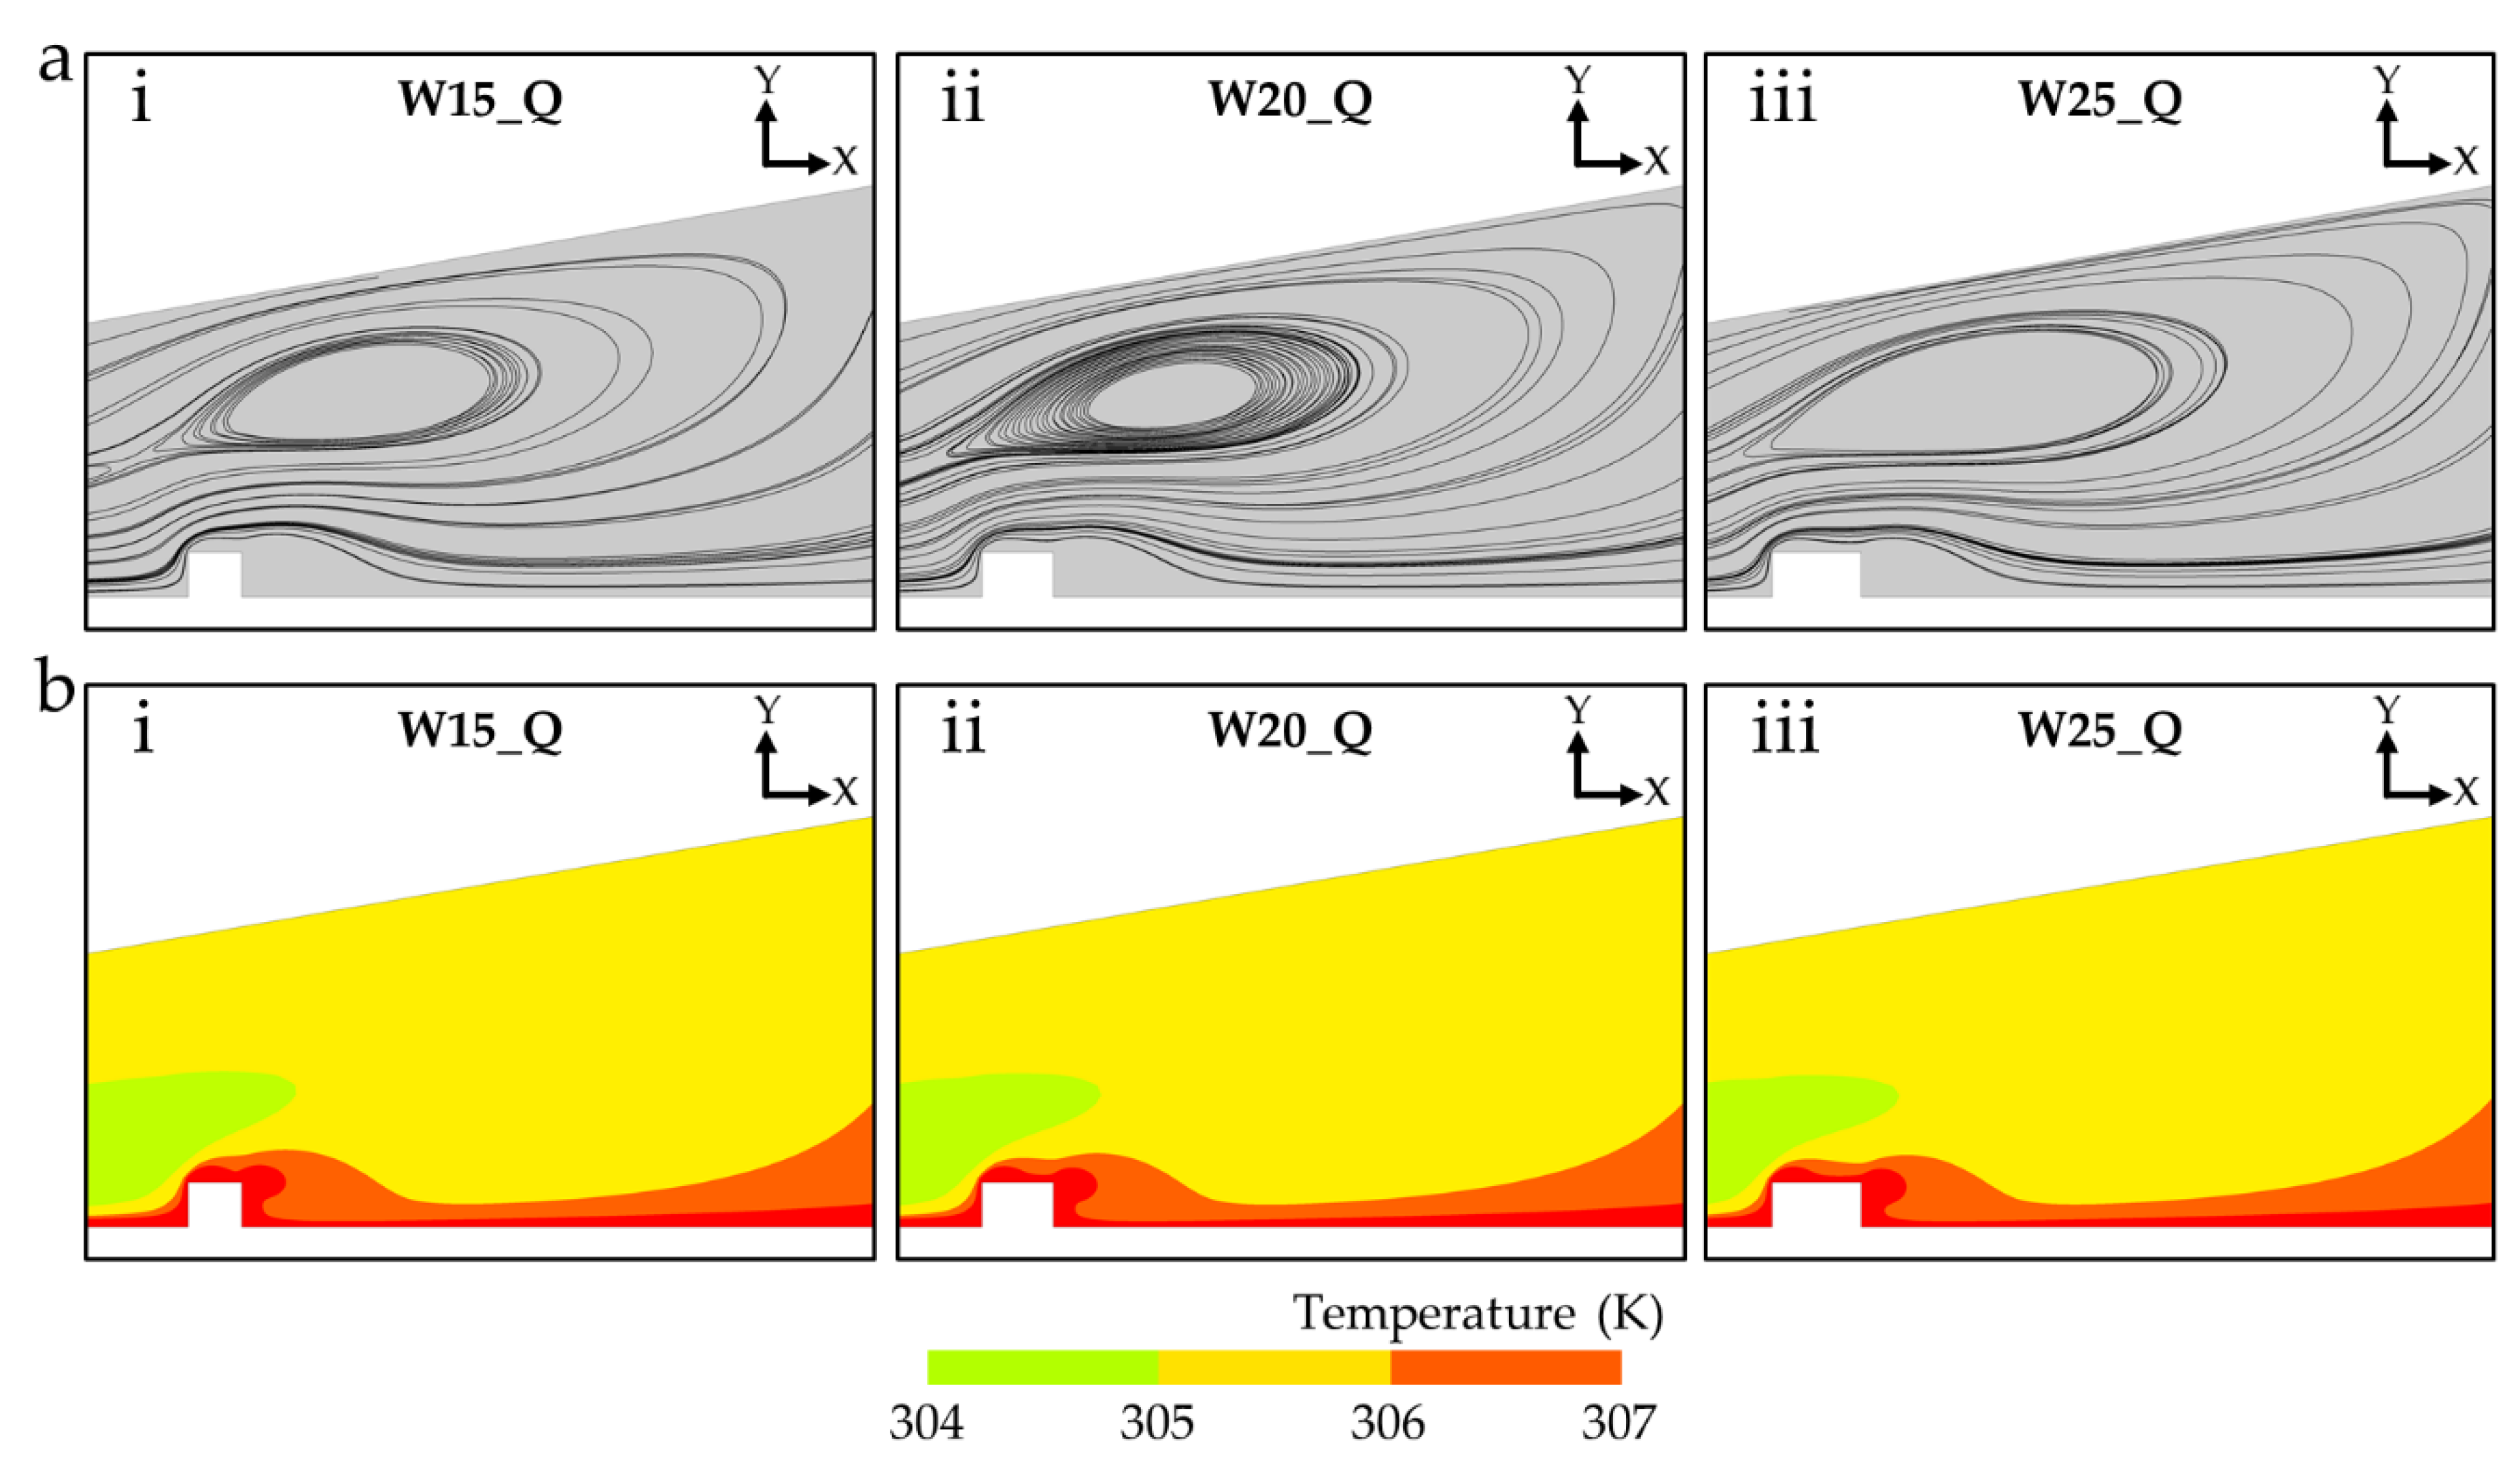
In addition, we scrutinized the effects of various baffle widths and found that the baffle width had less influence on the flow field and temperature distribution than the baffle height. To confirm this, three more models (
Table 1) were simulated and their streamlines and temperature contours in relation to variations of baffle width were compared (
Figure 10). Despite the variations of baffle width, the vortex size downstream of the baffle was not significantly different. Therefore, the streamlines of W15_Q, W20_Q and W25_Q were similar to one another (
Figure 10a). On the other hand, similar temperature contours were observed for each model (
Figure 10b) because the vortex size, which is a parameter that determines the temperature distribution in the models, was similar. Thus, we concluded that the temperature distribution and flow field are mainly determined by the baffle height rather than the width.
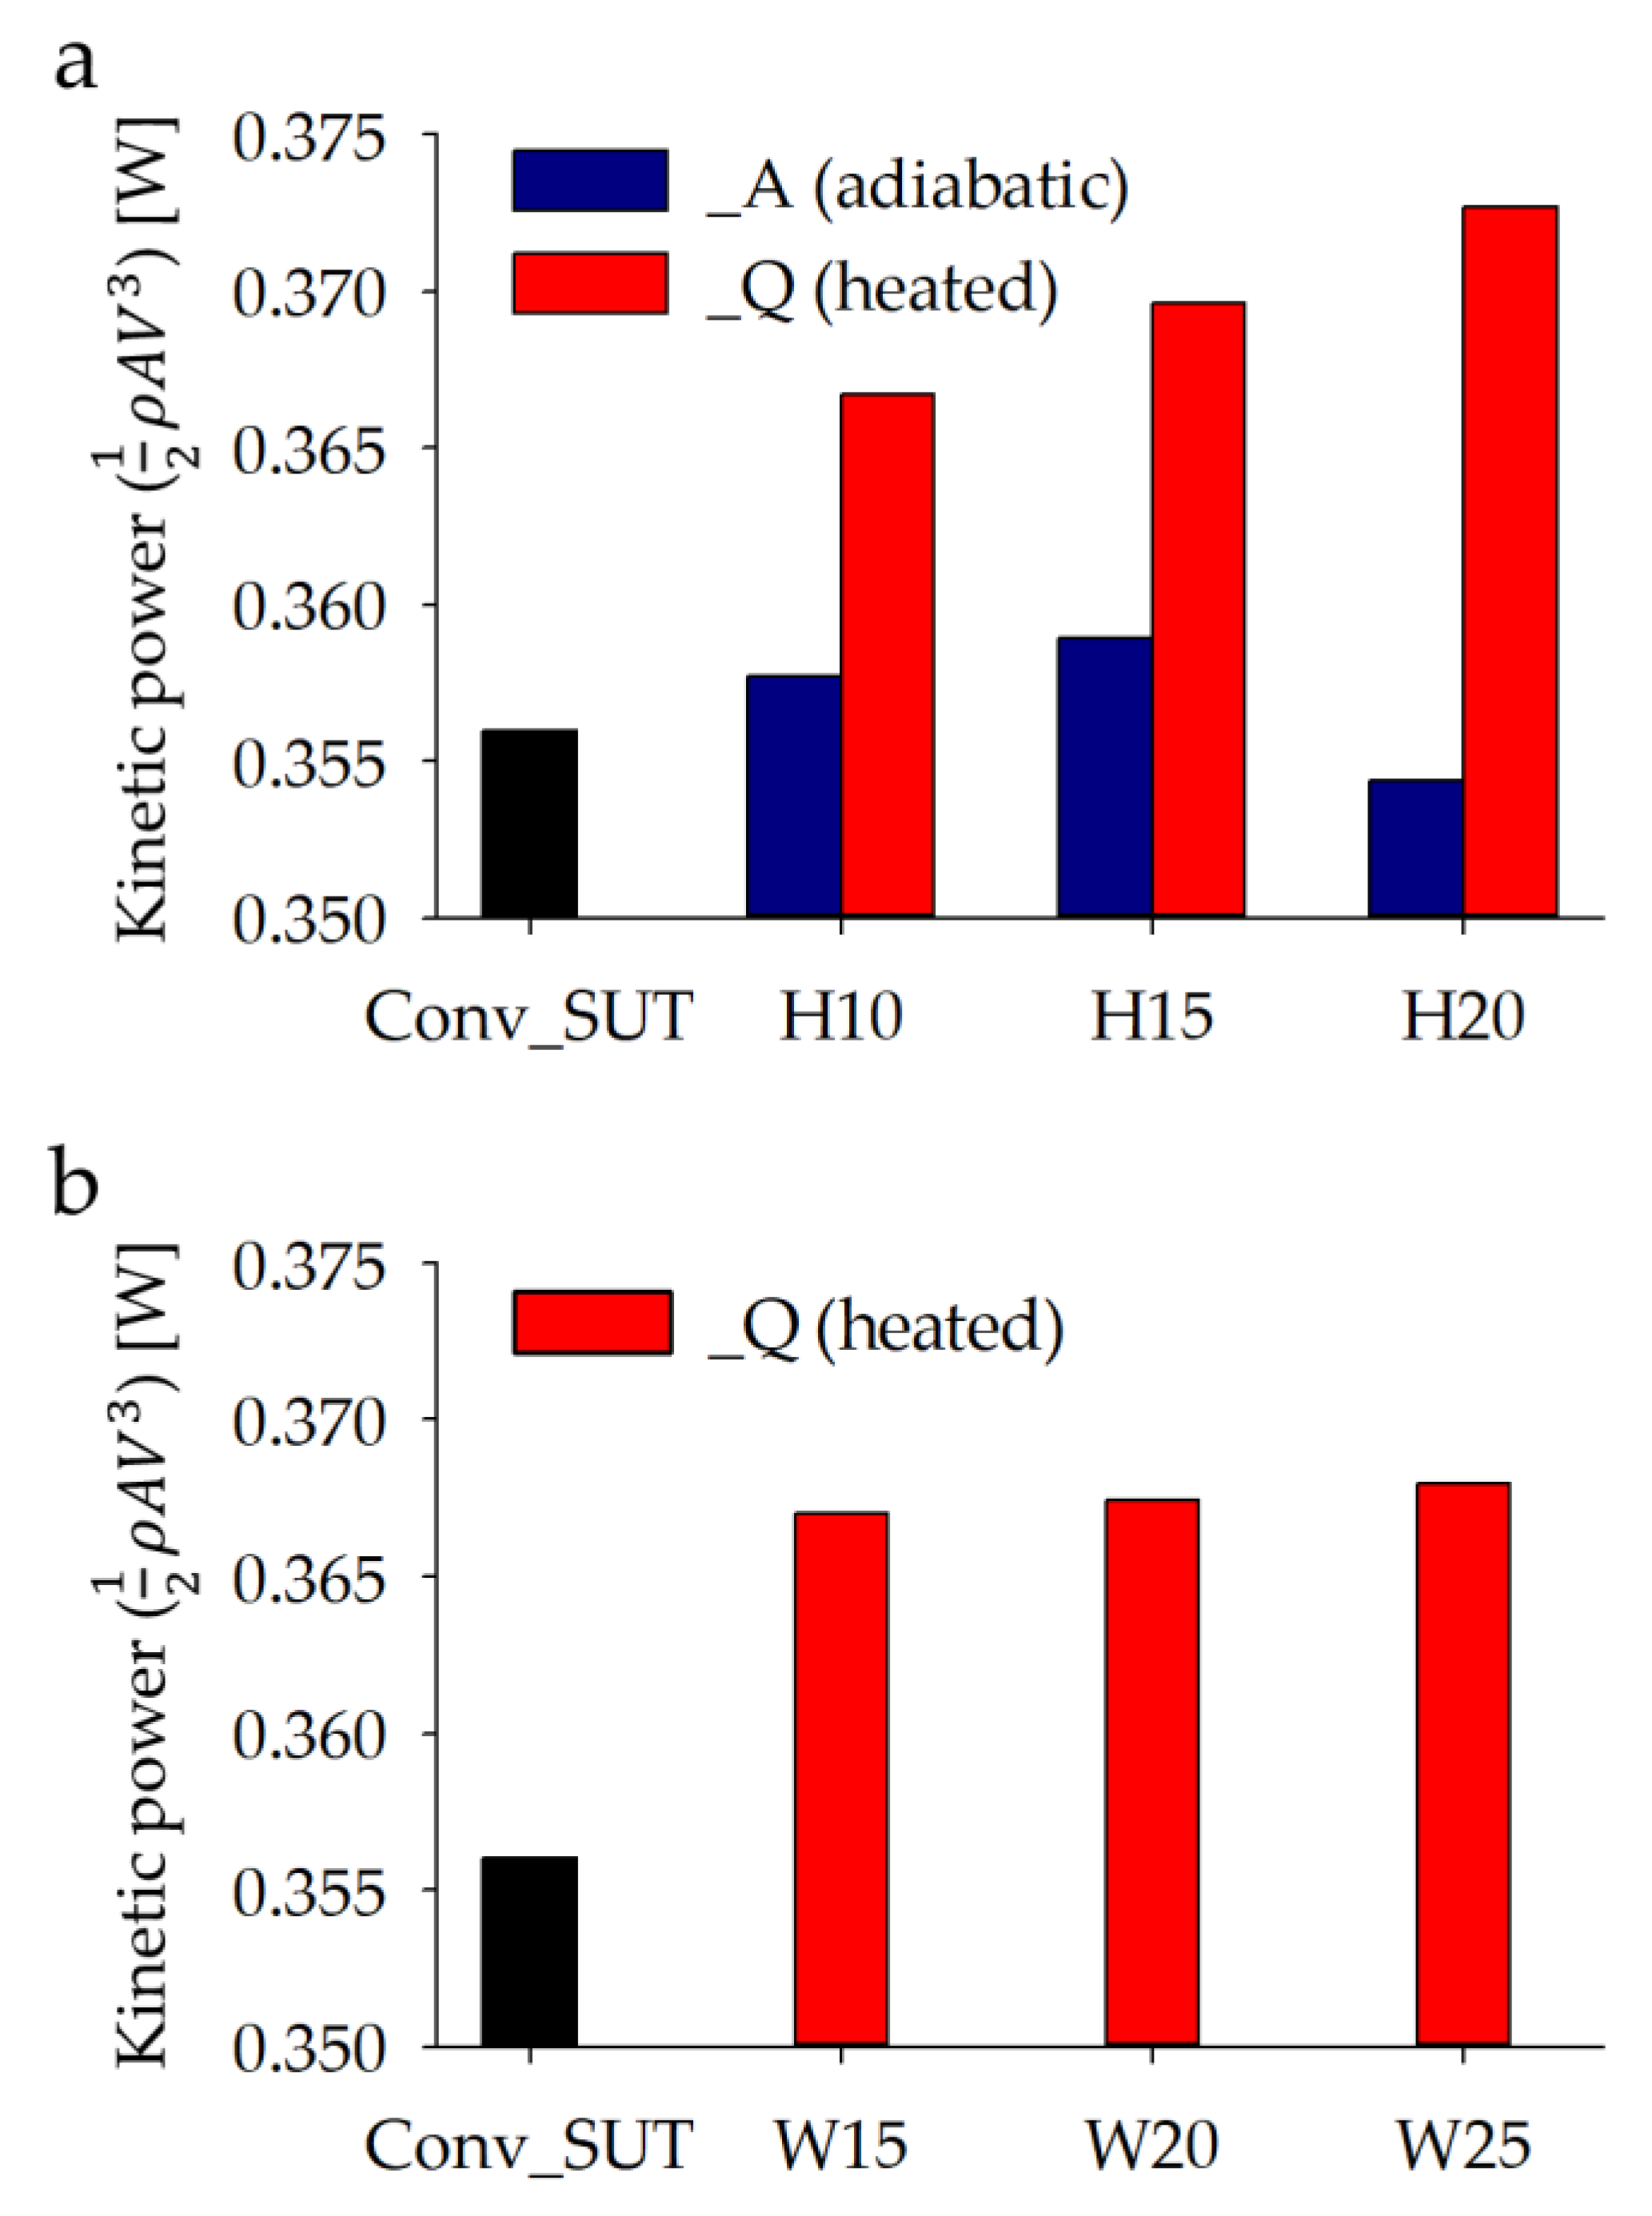
The overall effect of various phenomena caused by baffles on SUT performance was analyzed by calculating kinetic power (
Figure 11). The turbine output power is proportional to the kinetic energy of the wind passing through the chimney [
3]. The available kinetic power (
P) is calculated as
where
ρ is the density of air,
A is the area of the cross-section through which the air passes and
V is the velocity of the flow. The average velocities in the chimney inlet of all models (
Table 1) were used to calculate the kinetic power of each model (
Figure 11). In the baffle models of heat flux condition, the kinetic power increased linearly with baffle height (red bars in
Figure 11a); the kinetic power increased by 3.01%, 3.83% and 4.69% in H10_Q, H15_Q and H20_Q, respectively, compared with that of the Conv_SUT. This increase in kinetic power is due to the additional heat transfer area created by the baffles as well as the vortex-based thermal-flow effect. Thus, it is necessary to compare it with the adiabatic baffle models to further investigate the benefits of baffle installation. The models with adiabatic baffles (blue bars in
Figure 11a) showed less efficiency in terms of kinetic power. The kinetic power efficiency of H10_A and H15_A increased by 0.48% and 0.83%, respectively but decreased when the height of the baffle further increased to 0.2 m (H20_A). This is because the advantage of enhanced heat transfer generated by the vortex is offset by the disadvantage of the higher flow resistance caused by the baffle. In summary, baffles have two opposite effects; the positive/favorable effect is the increase in heat transfer by the vortex mechanism and the negative/unfavorable effect is the increase in flow resistance by narrowing the flow path in the collector. Thus, it is necessary to find the optimum baffle height to maximize the overall positive effect. Finally, the dependence of kinetic power on the baffle width was tested. As the baffle width increased (with heat flux condition), the kinetic power increased significantly compared with that of the Conv_SUT; however, the change in width resulted in a minimal increase in kinetic power (from 3.1% at W15_Q to 3.36% at W25_Q;
Figure 11b). Note that the vortexes formed in the models with width change were almost the same as those in models with various widths. This implies that the beneficial effect of vortexes on heat transfer is the same for all models. Moreover, increased baffle width is less effective in increasing the overall heat transfer area compared with increased baffle height, showing that the more efficient control parameter for determining the heat transfer area is the baffle height.
It should be noted that the two thermal boundary conditions for the baffle (adiabatic and heat flux conditions) are idealized conditions. In a real situation, the tradeoff between these two extreme situations must be examined carefully and applied appropriately to the design in order to achieve the optimal SUT systems under given thermo-fluid dynamic conditions.


