Article

Local Energy Management and Optimization: A Novel Energy Universal Service Bus System Based on Energy Internet Technologies

1
School of Electric Power, South China University of Technology, Guangzhou 510640, China
2
Guangdong Key Laboratory of Clean Energy Technology, Guangzhou 510640, China
*
Authors to whom correspondence should be addressed.
Energies 2018, 11(5), 1160; https://doi.org/10.3390/en11051160
Submission received: 8 April 2018 / Revised: 21 April 2018 / Accepted: 28 April 2018 / Published: 6 May 2018
(This article belongs to the Section F: Electrical Engineering)

Abstract

:
This paper develops a novel energy universal service bus system (EUSBS) based on emerging energy Internet (E-net) technologies. This EUSBS is a unified identification and plug-and-play interface platform to which high penetration distributed energy and equipment (DEE), including photovoltaic (PV), fans, electric vehicle charging stations (EVCSs), energy storage equipment (ESE), and commercial and residential users (CRUs), can access in a coordinated control and optimized utilization mode. First, the functions design, overall framework and topology architecture design of the EUSBS are expounded, among which the EUSBS is mainly composed of a hardware system and a software platform. Moreover, several future application scenarios are presented. Then, the hardware part of EUSBS is designed and developed, including the framework design of this hardware subsystem, and development of the hardware equipment for PV access, fans access, EVCS access, ESE access, and CRU access. The hardware subsystem consists of smart socket, and household/floor/building concentrators. Based on this, the prototypes development of EUSBS hardware equipment is completely demonstrated. Third, the software part of the EUSBS is developed as a cloud service platform for electricity use data analysis of DEE. This software subsystem contains the power quality & energy efficiency analysis module, optimization control module, information and service module, and data monitoring and electricity behavior analysis module. Based on this design, the software interfaces are developed. Finally, an application study on energy management and optimization of a smart commercial building is conducted to evaluate the functions and practicality of this EUSBS. The EUSBS developed in this paper is able to overcome difficulties in big data collection and utilization on sides of distribution network and electricity utilization, and eventually implement a deep information-energy fusion and a friendly supply-demand interaction between the grid and users. This contribution presents a detailed and systematic development scheme of the EUSBS, and moreover, the laboratory prototypes of the hardware and software subsystems have been developed based on E-net technologies. This paper can provide some thoughts and suggestions for the research of active distribution network and comprehensive energy management and optimization in power systems, as well as references and guidance for researchers to carry out research regarding energy management, optimization and coordinated control of the smart buildings.

1. Introduction

Electric power is widely used in all areas of our daily life and production. With the rapid development of economy and society, the electricity demand in many countries is continuously increasing. The efficiency of electricity production, transmission, and utilization has an important impact on the sustainable development of the economy and environmental protection. In the actual use of electricity, there is often a lot of power waste. To this end, the United States and some European countries began in the 1970s research on the home energy management system (HEMS) concept, which can effectively improve the effectively of electricity use and achieve the purpose of energy conservation and emission reduction [1].
Since then, the research on energy management systems has received extensive attention from the academic community and progress has been made. Currently, the subsystems of integrated energy management (IEM) have clear boundaries. IEM and intelligent electricity use management are gradually integrated with traditional power distribution networks, in which a large number of key technologies have been combined. In the integration, the IEM is mainly based on distributed power supply, micro-grid, and combined cooling heating and power, and the intelligent electricity use management is mainly based on the demand side. Traditional distribution automation systems, demand-side management systems, and distributed generation connection and control systems have been employed to solve the issues of distribution network power supply, electricity consumption of users, and new energy utilization, respectively, to varying degrees. However, currently, there is a lack of practical IEM systems.
In China, after the innovation of the electric power system and open of the electricity marketing side, both the social energy consumption model and the power grid operating model will undergo profound changes. In terms of grid companies, their profit models have changed, and they are gradually turning into public utilities. In addition, the control mode of power grids has gradually shifted from traditional generation-side management to demand-side management. For the electricity selling corporations, their profit model will be transformed from the traditional model of electricity sales to a new model via providing comprehensive energy utilization services. As for power consumption users, they have shifted to actively participate in power demand-side management. All these changes took place in the context of the continuous improvement of smart grid technologies and the launch of the energy interconnection, making it of great significance to carry out research on IEM systems facing the distribution network side and demand side of the energy interconnection.
Moreover, the depletion of energy resources and environmental damage are becoming increasingly serious due to a large-scale exploration and utilization of fossil energy [1]. Human survival is facing severe challenges, which drives people to dramatically focus on the new-type IEM systems and models. As of 2013, the remaining recoverable reserves of coal, oil and natural gas in the world were estimated at 891.5 billion tons, 238.2 billion tons and 186 trillion cubic meters respectively, which were totally equivalent to 1.2 trillion tons of standard coal. Of these, the coal accounts for 52.0%, oil 27.8% and natural gas 20.2%. More critically, according to the current average mining intensity around the world, the global coal, oil and natural gas can be mined for 113 years, 53 years and 55 years, respectively [2].
With the rapid development of renewable energy utilization technologies and Internet technologies, based on smart grid technologies, Rifkin, a famous American scholar, first put forth a vision of E-net in his latest book The Third Industrial Revolution [3], in which, an E-net is interconnected by some energy local area networks (ELANs) [1,2,3,4]. The ELAN is composed of energy routers, power generation equipment, energy storage equipment (ESE), and AC/DC loads, and able to work in parallel or in an off-line independent operation mode. The energy router [5,6] is composed of solid-state transformers and intelligent IEM systems, for the latter, they make decisions for energy control, depending on information collections and analysis of DG access equipment, ESE and loads in ELAN, and then send the control commands to solid-state transformers for execution, including the intelligent energy management and control of information-flow and energy-flow and the control of solid-state transformers. To ensure a reliable and safe operating mode for E-net, the upper-level bus-bar of ELAN is required to have an intelligent fault management function, providing a real-time detection of E-net faults and their fast isolation. Compared with conventional power grids and new-type smart grids, the E-net has four prominent features [4,7,8,9]: (a) the renewable energy is principally treated as a primary energy source; (b) to support super-large scale access of DG systems and distributed energy storage systems; and (c) to support electrification of transportation systems.
Taking China as an example, as stated earlier, after far-reaching reforms of electricity market in China and the opening of the electricity marketing side, the energy consumption mode of the whole society, as well as the mode of grid operation will both be dramatically changed. In particular, the state grid corporations, the electricity selling enterprises, and the electricity consumption users will all play a changed role in the whole operation and consumption of electric power and energy. The major three types of stakeholders will be changed as follows:
For the state grid corporations, their profit mode will be gradually shifted to a public utility, while simultaneously, their control mode will be changed from conventional generation side management to demand side management (DSM) [10,11].
For the electricity selling enterprises, their profit pattern will be transformed from a traditional payoff mode to a new-type mode via providing comprehensive energy utilization services [12,13].
For the electricity users, they will take the initiatives to join power DSM [14,15,16,17], which is similar to the operating mode of the active distribution network, thus the users have the intentions to positively in power consumption based on the time-of-use electricity pricing and automated demand response.
All of these changes described above will occur in the context of E-net. Since the concept of E-net was proposed, a large number of relevant findings have been presented internationally. The Future Renewable Electric Energy Delivery and Management (FREEDM) research center first outlined a development vision of E-net, and developed some E-net prototype systems [18]. On 29 May 2012, Antonio Tajani, the vice chairman of the European Commission, made it clear that [19] “the core of the third industrial revolution is the energy Internet … our 2020 strategy has allowed us to walk on the right path, but we must now speed up”. Germany pioneered the E-Energy Program [20], trying to build a new energy network and achieve digital interconnection, computer control and monitoring in an entire energy supply system. At the beginning of 2015, the government work reports of China [21] proposed an ‘Internet+’ action plan, and pointed out that China will promote energy revolution in the energy field, and accelerate a high level integration of artificial intelligence, mobile internet, cloud computing, big data, and internet of things with modern manufacturing. Besides, on 14 May 2017, Chinese chairman Xi, at the opening ceremony of the Belt and Road Forum for International Cooperation [22], emphasized a further construction of global energy interconnections and the practice of the new concept of green development, to jointly achieve the 2030 sustainable development goals.
In the latest academic researches on E-net, a relatively simple E-net framework was proposed based on distributed renewable energy generation [23], which enabled the real-time, high-speed, and bi-directional access of electric power data and the grid-paralleling of renewable energy sources; besides, the scholars have presented some detailed and deep discussions on the key technologies in development of future E-net, which are shown in Table 1.
Moreover, there has been discussion on the business models and market mechanisms of E-net [41,42,43]. As we know, energy is core in the E-net, especially for the issues of integrated energy management and distributed renewable energy utilization, aimed at which, a review [44] was made regarding the steady-state analysis of typical regional integrated energy systems against the background of the E-net and a research idea based on the concept of energy hub and the notion of the multi-energy complementarity of an integrated energy system was proposed. Obviously, more and more scholars now focus on the framework construction and key technologies of future development of the E-net, while there are a few studies regarding the construction of a practical E-net system or subsystem which is applied and as a unified identification and plug-and-play for access to DEE and a friendly energy-information interaction between the power grid and DEE.
Based on the E-net technologies, more and more investigations now have been focused on new and intelligent energy management, including smart buildings and smart city energy management [45,46], autonomous demand response and DSM [47,48], smart home energy management [49,50], and energy management of large-scale massive distributed power supply, renewable energy sources and equipment, etc. Among these investigations, aiming at energy management of smart buildings, Beccali et al. [45] introduced a new multi-objective demand control of smart buildings, in which a three-phase multi-objective autonomous/automated intelligent load control strategy is designed, which can deal with design of a real-time and versatile yet simple control and management strategy for provision of adaptive and intelligent demand response for buildings. This designed strategy offers numerous advantages such as autonomous and automatic load control and grid frequency regulation, centralized regulation signal-based demand control and grid support, and continuous/adaptive power control of critical and non-critical AC loads, DC loads, HVAC systems, and BESSs and PEVs. On demand response in EMS, Brusco et al. [47] developed a fundamental device in demand response program at customer level, named energy box, which can allow interactions between customers and the aggregator. This energy box is a low-cost laboratory prototype, which is suitable for cloud-based architectures for autonomous demand response of prosumers and prosumages. In addition, Pop et al. [48] have investigated the use of decentralized blockchain mechanisms for delivering transparent, secure, reliable, and timely energy flexibility to all the stakeholders involved in the flexibility markets such as distributed system operators primarily, retailers and aggregators. On home energy management, Martinzez et al. [49] presented a smart multiconverter system for residential/housing sector with a Hybrid Energy Storage System (HESS), based on the smart community concept in energy resource hubs. This proposed system is composed of supercapacitor and battery, and with local photovoltaic energy source integration. This developed device can receive active power set-points provided by a smart community EMS that is central and responsible for managing the active energy flows between the electricity grid, renewable energy sources, storage equipment and loads existing in the community. In order to reduce the consumption of energy, Godina et al. [50] compared the ON/OFF, proportional-integral-derivative and model predictive control methods of an air conditioning of a room, in order to investigate the energy management model of a house which has a PV domestic generation. In this model, a model predictive control-based home energy management and optimization strategy with demand response is addressed.
In addition, based on E-net technologies, the topic of net zero energy buildings (nZEB) has received increasing attention in recent years [51,52,53,54,55,56], and now it has become part of the energy policy in several countries. The EU Directive on Energy Performance of Buildings (EPBD) specified that all new buildings shall be nearly zero energy buildings by the end of 2020 [57]. In [51], it is pointed out that the sole satisfaction of an annual balance is not sufficient to fully characterize nZEB, thus it presented a consistent framework for setting nZEB definitions, in which the balance concept is central and two major types of balance are identified, namely the import/export balance and the load/generation balance. Hence, a nZEB operates in connection with an energy infrastructure such as the power grid [52], and it can be determined either from the balance between delivered and exported energy on weighted supply side or between load and generation on weighted demand side [51,52].
It is very important to effectively improve the energy flow control in energy management of buildings. Therefore, this paper develops a complete energy universal service bus system (EUSBS) based on E-net technologies, which enables the access of PV, fans, electric vehicle charging stations (EVCS) and commercial and residential users (CRU). From the perspective of the function of this designed EUSBS, EUSBS will play an important role in energy flow control, which is very important to reach the goal of zero energy building in the concept of nZEB. EUSBS as a local energy management system can increase the on-site use of renewable energy. In the nZEBs, the function of EUSBS is designed as a unified interface platform for all types of distributed equipment and electric vehicles, thus it possesses the abilities to support the plug-and-play of various distributed equipment, the communication with various types of electricity use information collection terminals such as smart meters, smart sockets, and environmental sensors. In addition to identification of the types and identities of distributed equipment, it is also able to achieve data aggregation and data transfer, and support integration with various intelligent power consumption information acquisition terminals, thus it has stronger scalability. EUSBS can be seen as an important link in the zero energy buildings. Addressed concretely, on the demand side, EUSBS supports user-side energy management to realize peak shaving and load leveling, weakens the intermittency of renewable energy sources, and performs distributed control and communication functions. On power supply side, EUSBS is able to support the optimized operation of relevant energy systems, which can effectively improve the reliability of the power supply services of the system.
On this basis, for the application of the EUSBS designed in this paper in energy management of nZEBs, we can imagine the following application scenarios: (1) identification and differentiated billing of electrical equipment; (2) energy monitoring and control of small- and medium-sized business users and smart buildings; (3) precise load forecasting and modeling for small-sized building distribution systems; (4) peak shaving and load leveling for small-sized building distribution systems.
Hence, EUSBS has potential benefits, such as the peak load shifting benefits, time-of-use benefits, energy efficiency improvement benefits, energy-saving and loss-reducing benefits, and electricity use behaviors optimization benefits. In the future, the business scheme behind the EUSBS shall be developed, which will contribute to penetrate the market for a wide diffusion.
In this paper, the EUSBS is designed to contain a hardware system and a software platform, and make full use of E-net technologies to achieve a fast identification and plug-and-play for DEE access, and further to change the original modes of centralized fossil energy utilization into that of new-type distributed renewable energy utilization. EUSBS achieves a deep fusion of information and energy, overcomes the difficulties of big data collection and utilization involving electricity of distributing and utilizing, and eventually implements a true coordinated control and optimum use in power grid, distributed power supply, and distributed electrical equipment.
The rest of the paper is structured as follows: a brief review of E-net is provided in Section 1. Section 2 introduces the functions of EUSBS, and for which, gives an overall topology design, introduces the main functional components and provides several application scenarios. Section 3 and Section 4 give the concrete development schema of the hardware system and software platform respectively. Practical case study is carried out in Section 5. At last, Section 6 concludes the paper.

2. Function Design and Schematic Design of EUSBS

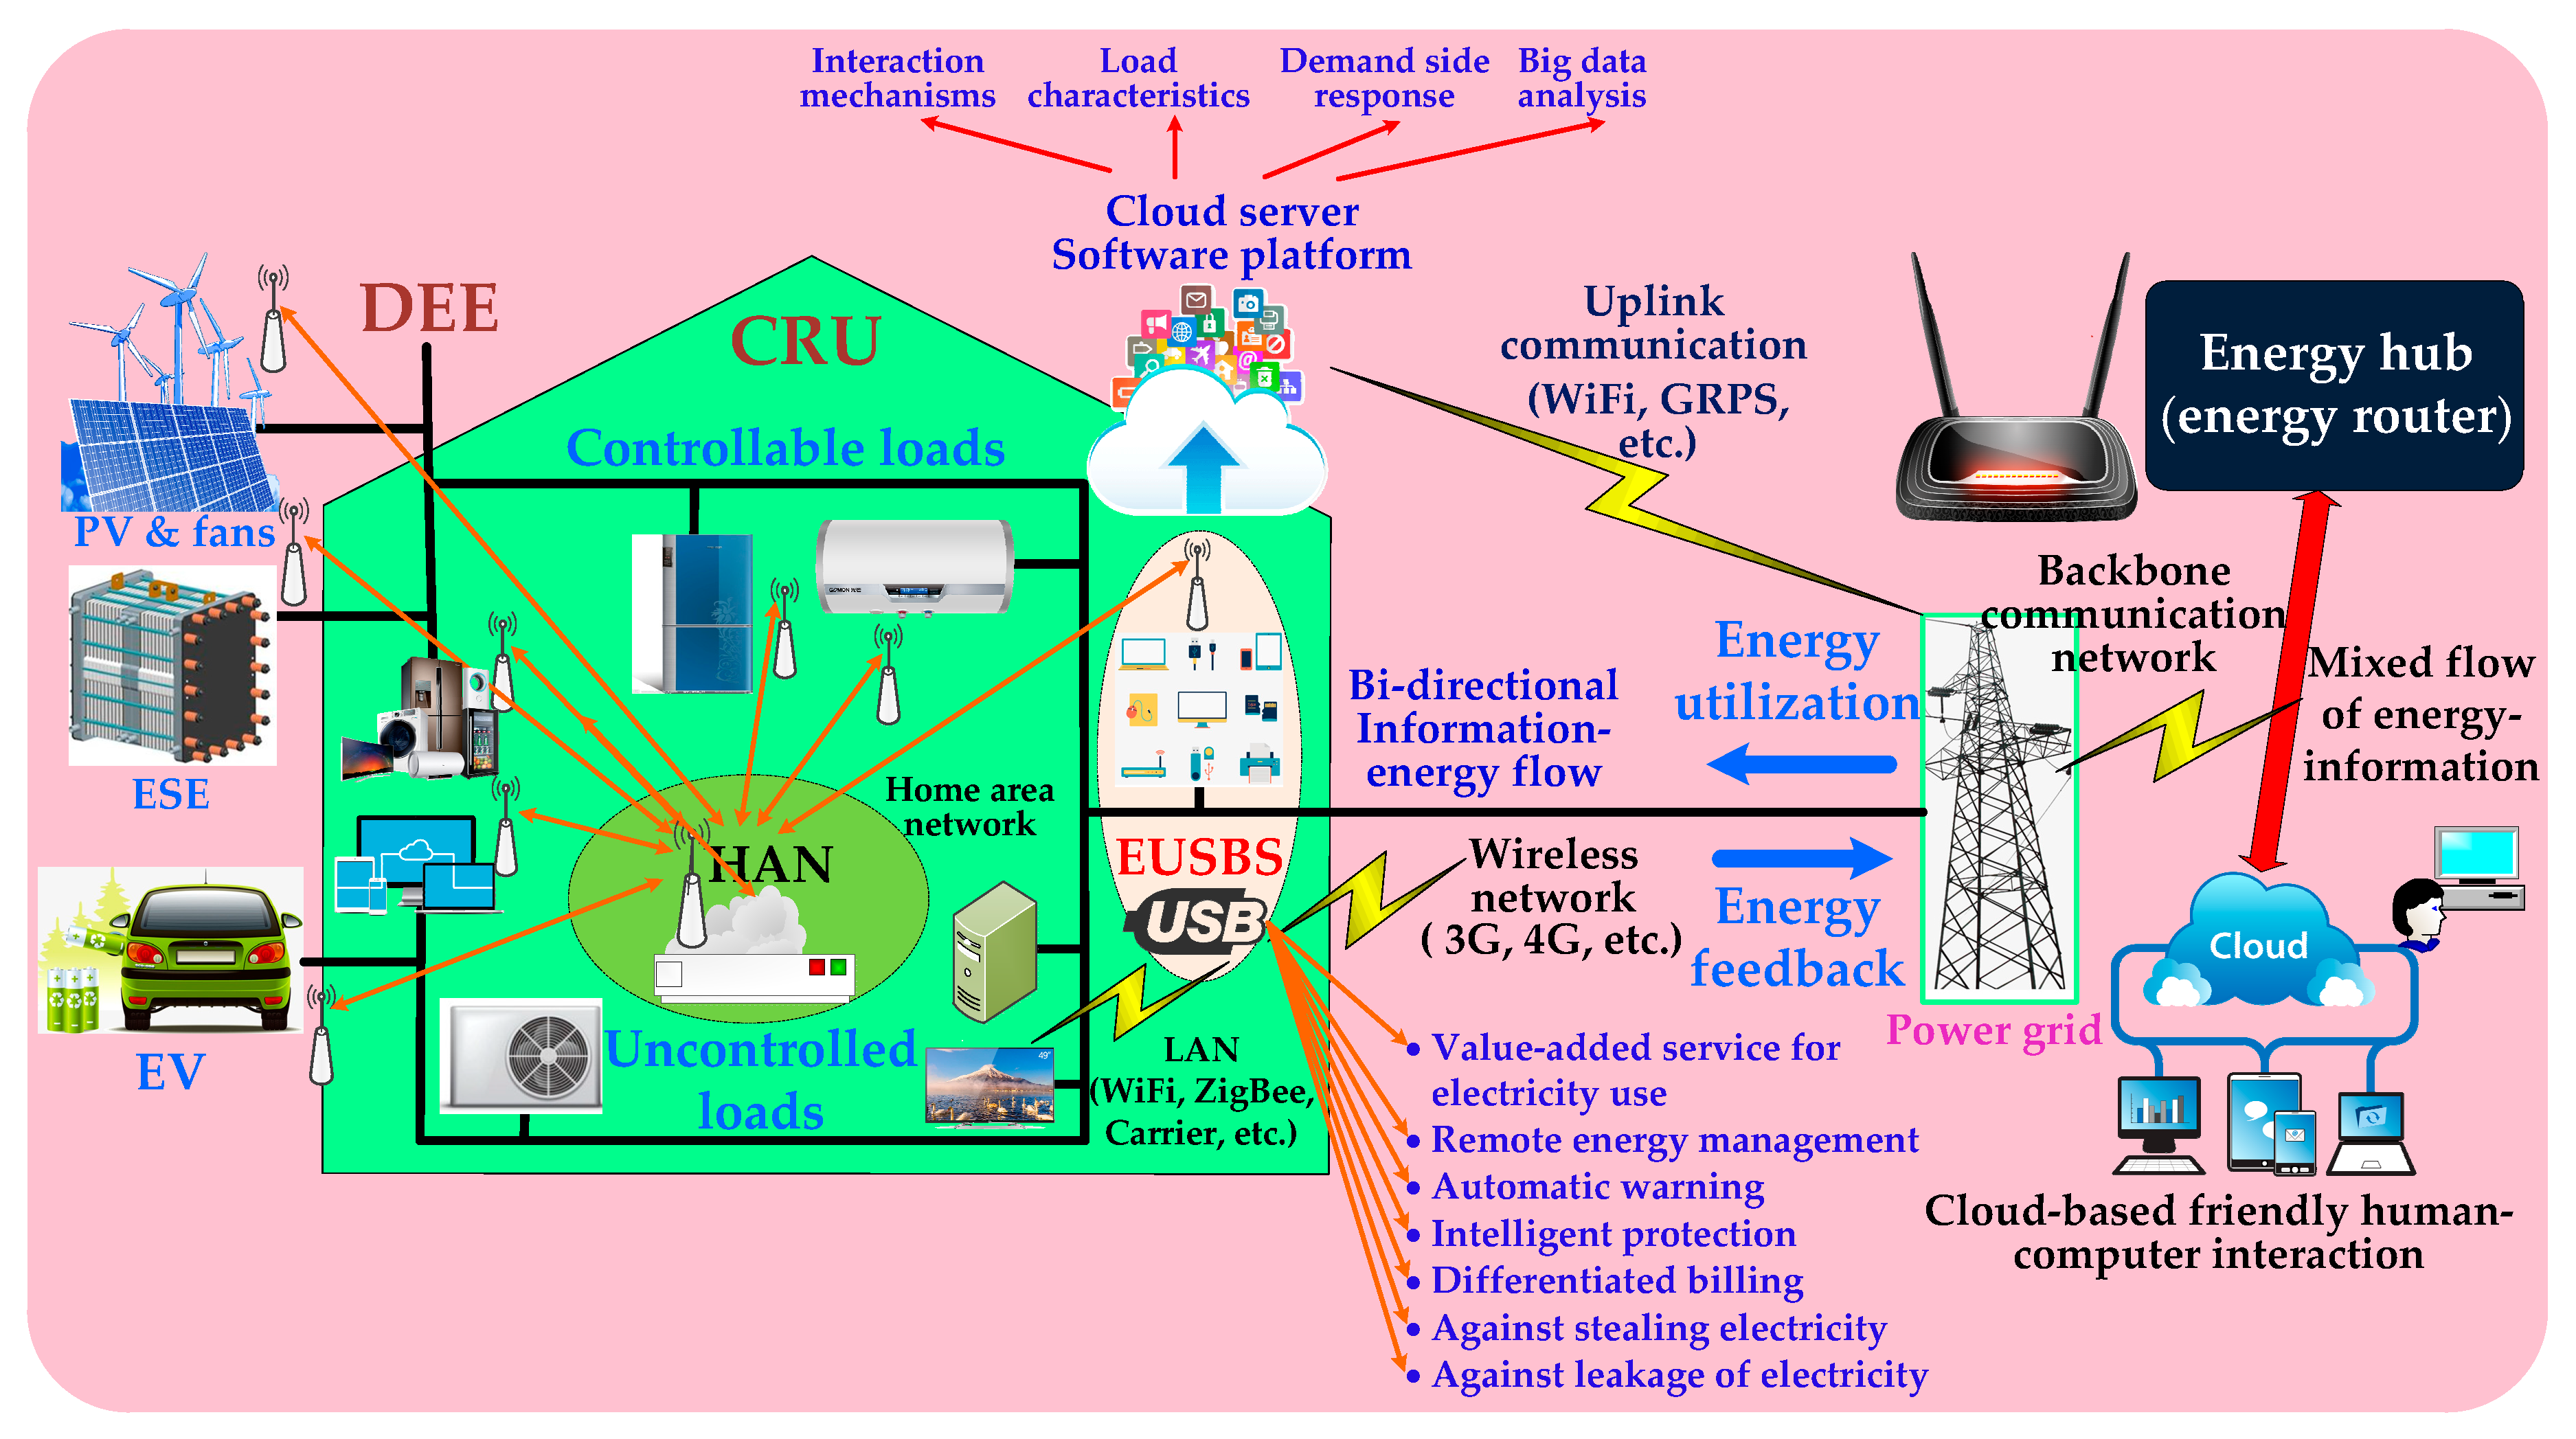
2.1. Functions Design

The EUSBS is composed of a hardware system and a software platform. The hardware system contains different kinds of access interfaces which are called EUSBS hardware equipment. All EUSBS hardware equipment combined with the software platform constitute an entire EUSBS that is one of the most critical parts in an E-net. EUSBS is designed as a unified interface access platform for a plug-and-play of DEE and an IEM system for a deep information-energy interaction analysis between DEE and power grid. The meaning of plug-and-play has three technical aspects [58,59,60,61]: (a) it is similar to the USB computer interface protocol and has a rapid perception and description ability for the load equipment, energy storage and power generation, etc.; (b) it has an open hardware platform and is easy to connect with the current power grids; (c) it can automatically and rapidly access or disconnect from the energy flow and information flow under the circumstances the DEE are in access or in disconnection status, respectively. The hardware part of EUSBS contains a variety of electricity information collection terminals, such as smart meters, smart sockets, concentrators and ambient sensors, which completes data aggregation, data transfer, classified management, classified storage, real-time uploading and comparative analysis. EUSBS is not only a home energy management system (HEMS), it has a stronger scalability to support integration with the above mentioned terminals; moreover, EUSBS, as an information-energy carrier tool and information processing terminal system, possesses a variety of smart grid functions, for example, supporting DEE access and user-side management, peak load shifting, intermittence control for renewable energy, distributed control and various communications. Therefore, the EUSBS can realize the goals of supporting optimal operation of closely related power energy and effective reliability improvement of the service quality of power supply of grid. The interconnection and interaction principle of EUSBS with other wide-area DEE is shown in Figure 1.
Figure 1 shows that EUSBS is networked with upper-level generation nodes via the wireless network, such as the current 3G and 4G technologies, and even 5G technology in the future. Under grid smart interaction modes, the EUSBS provides user-side information including electricity loads and DEE for the power grid corporations, who can encourage users to change their traditional electricity utilization modes and actively participate in grid operation; moreover, users spontaneously upload electricity utilization information to the grid via EUSBS, and selectively respond to the price and stimulation.
Besides, we can implement DEE management by acquiring the topology of all DEE depending on internal connections of EUSBS and the connection forms between DEE and EUSBS. The EUSBS shown in Figure 1 achieves the following targets:
  • As a unified interface platform for access of distributed controllable and uncontrolled loads and DEE;
  • Communicates with various information collection terminals, such as smart meters and environmental sensors;
  • Completes identification for DEE access, data aggregation, data transfer, data comparison, classified management, classified storage, real-time uploading and smart analysis;
  • Has a strong scalability of integration with various smart electricity information collection devices;
  • Supports various smart grid functions as a carrier tool and information terminal;
  • Supports DSM, peak load shifting, intermittence control of renewable energy, distributed control, various communications;
  • Compatible with a variety of familiar communication protocols for achieving a bi-directional and friendly supply-demand interaction between DEE and power grid;
  • Deep big data analysis and cloud computing for user electricity utilization behavior and energy efficiency, effectively coordinates the accessed power and loads based on the built-in energy management, and formulates optimization and control strategies for electricity utilization.

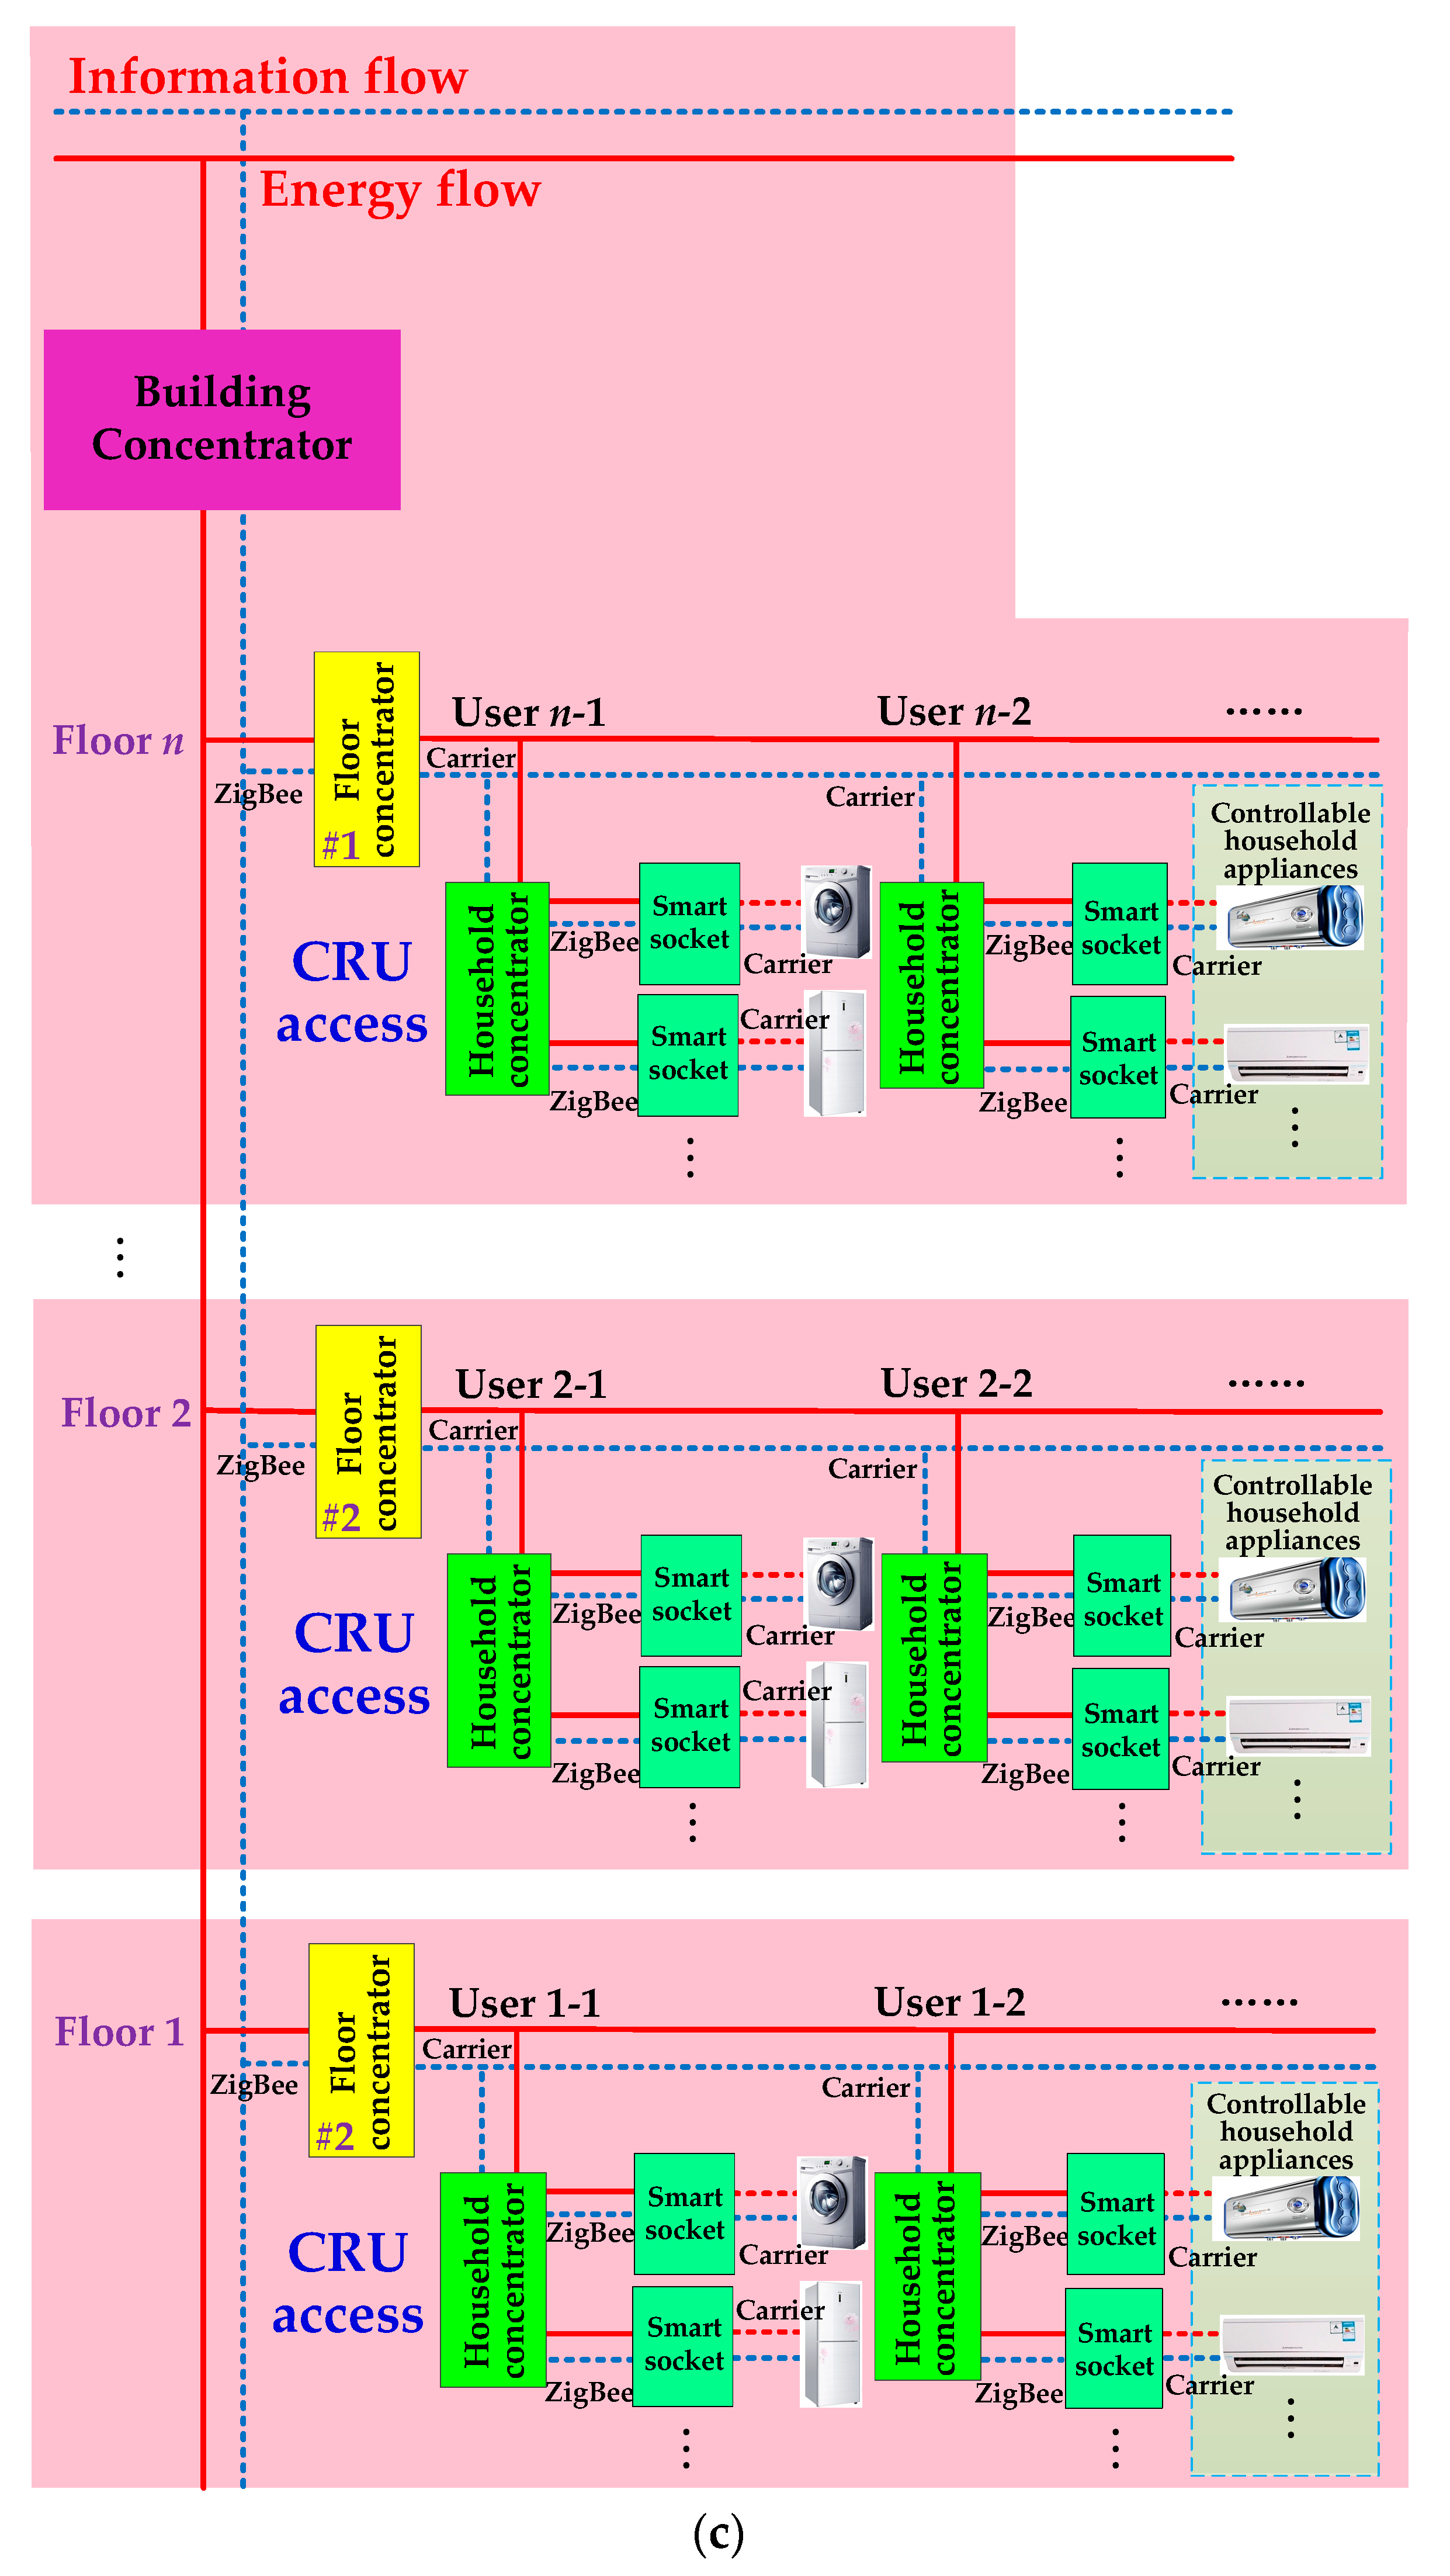
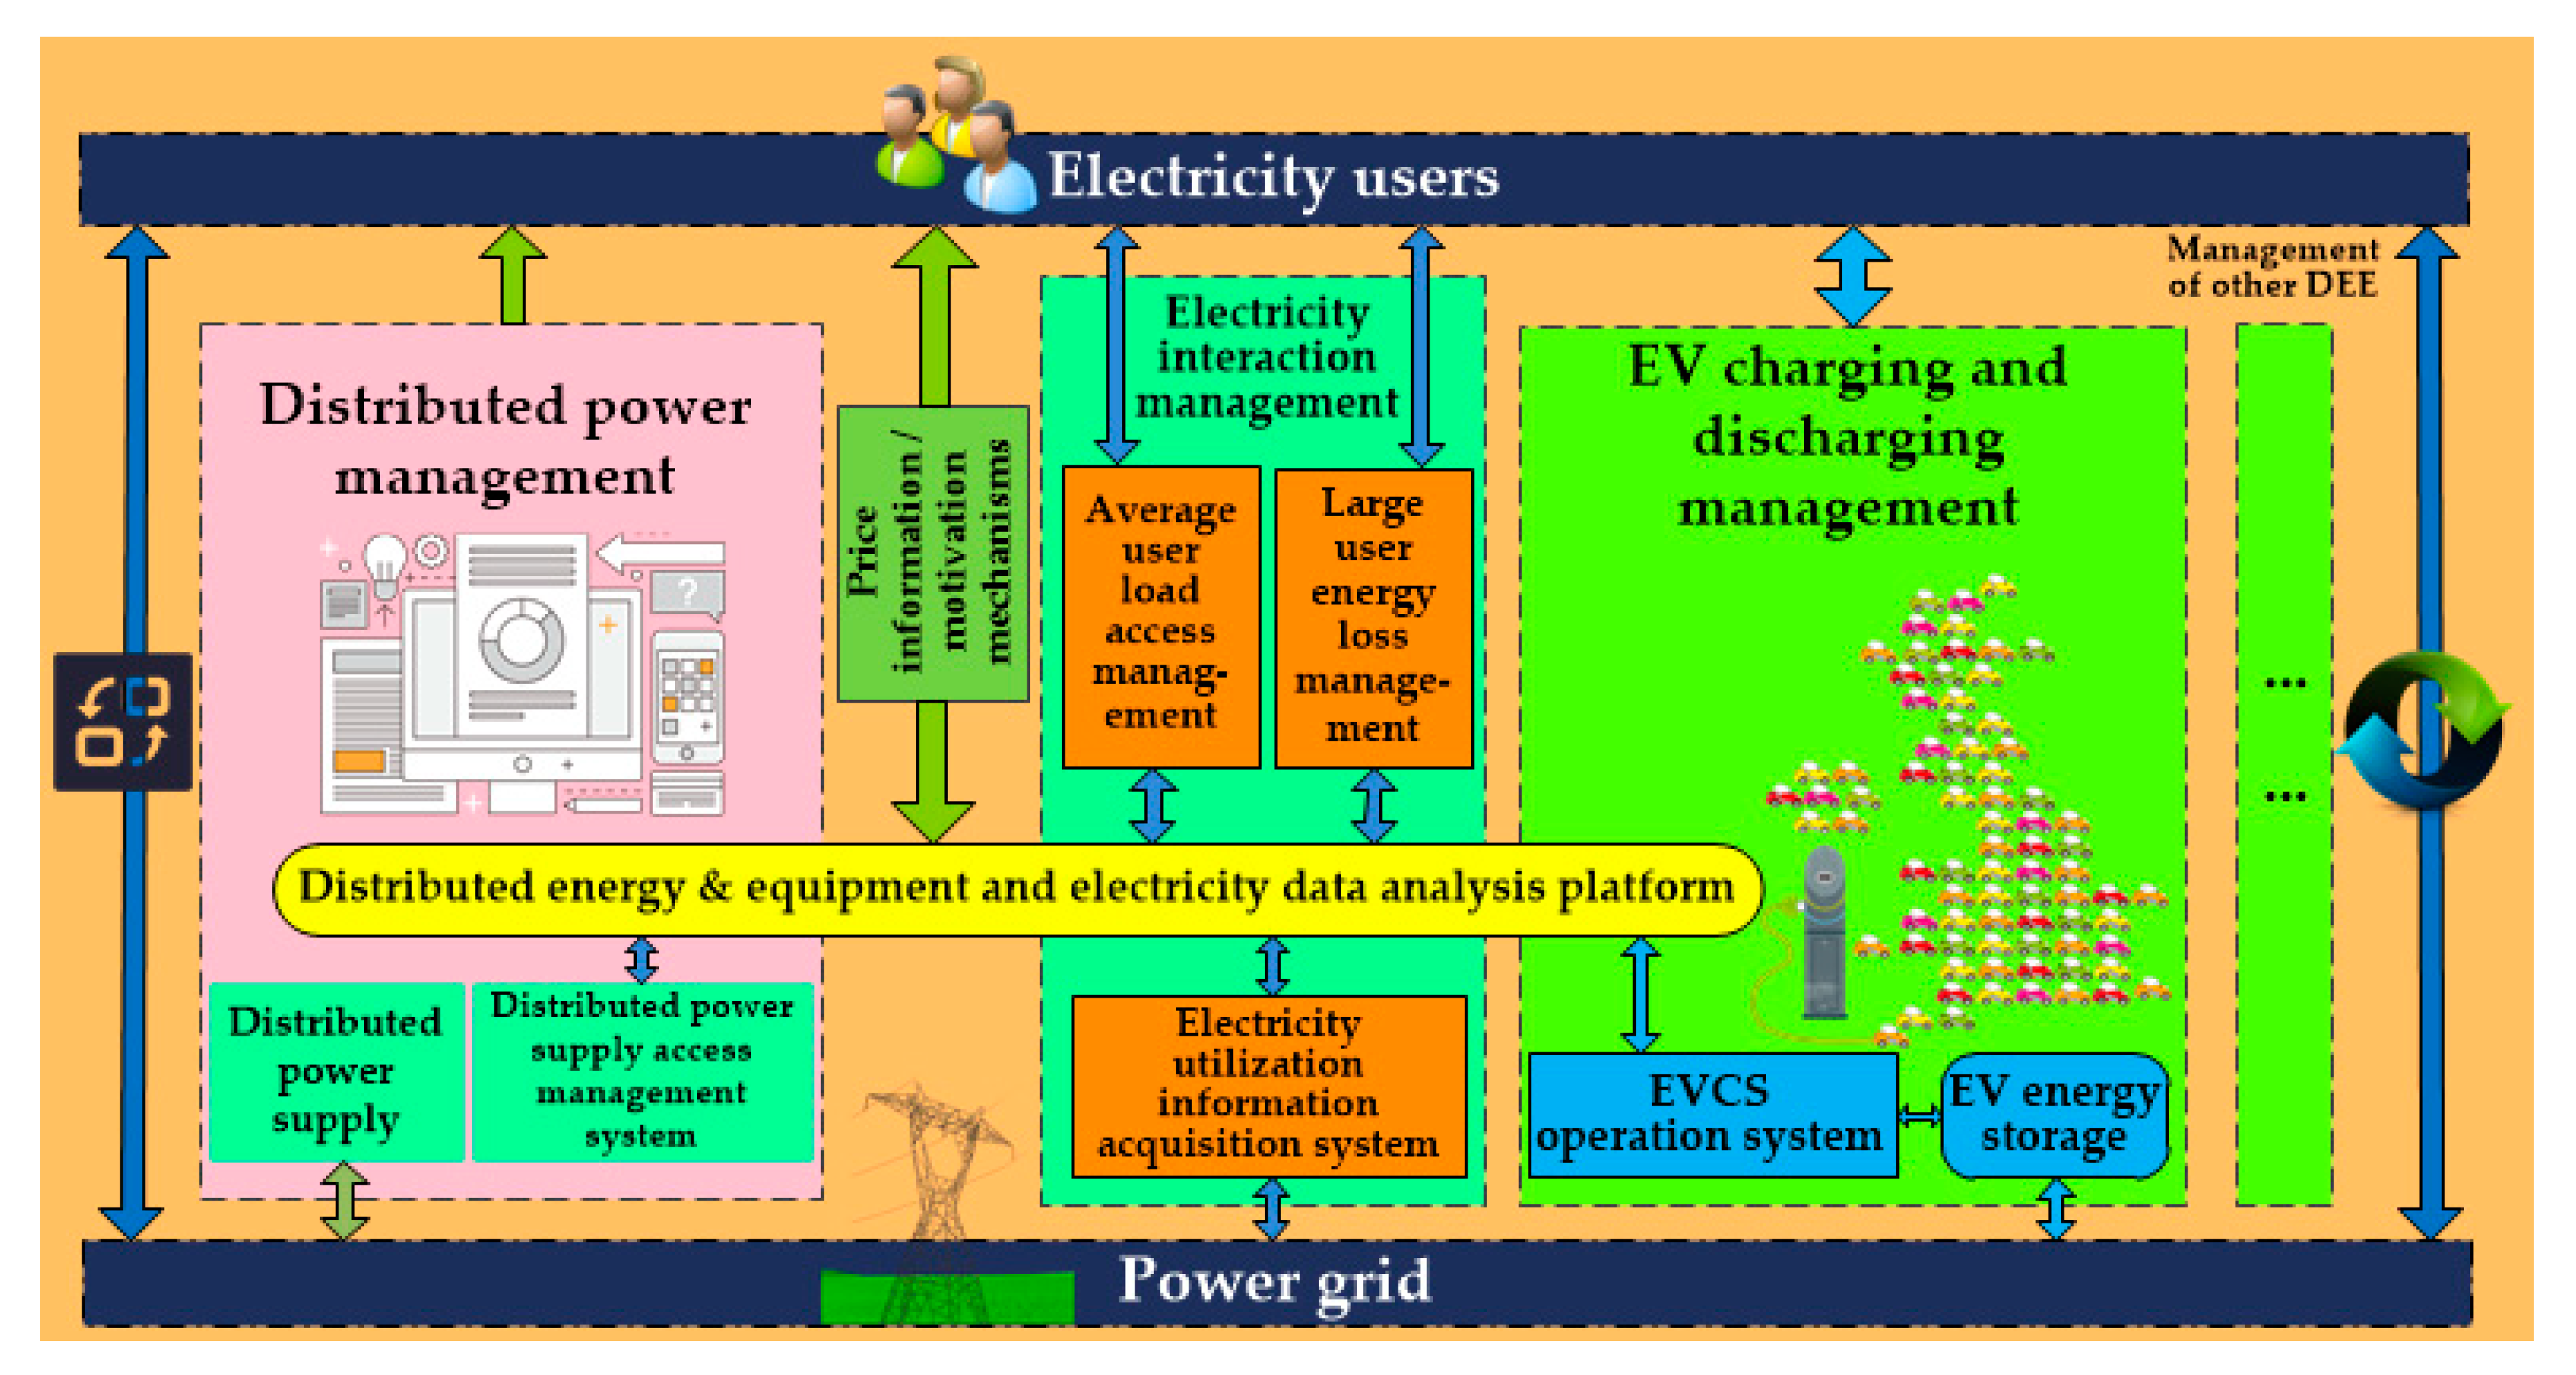
2.2. Overall Framework and Topology Architecture Design

Based on the functions of EUSBS shown in Figure 1, the EUSBS, as a home energy management center, is a multi-level and hierarchical system, which achieves a deep information-energy fusion and is classified as DEE-oriented EUSBS and CRU-oriented EUSBS. The DEE-oriented EUSBS is used for access of PV, fans, EVCS and ESE, and the CRU-oriented EUSBS is for access of family appliances as a EUSBS hardware system, including multiple categories of devices in different levels and hierarchies, such as the smart sockets and household/floor/building concentrators, so the entire framework of EUSBS is designed as shown in Figure 2a, the topology application architecture of the buildings is represented graphically as in Figure 2b, and the topology application architecture of the floors in each building is illustrated in Figure 2c.
Figure 2b designs a kind of application topology of EUSBS in some buildings, where a number of CRU live on each floor of each building. The equipment access to EUSBS including PV, fans, EVCS, ESE, and controllable household appliances, such that the hardware part of EUSBS is composed of five parts as follows:
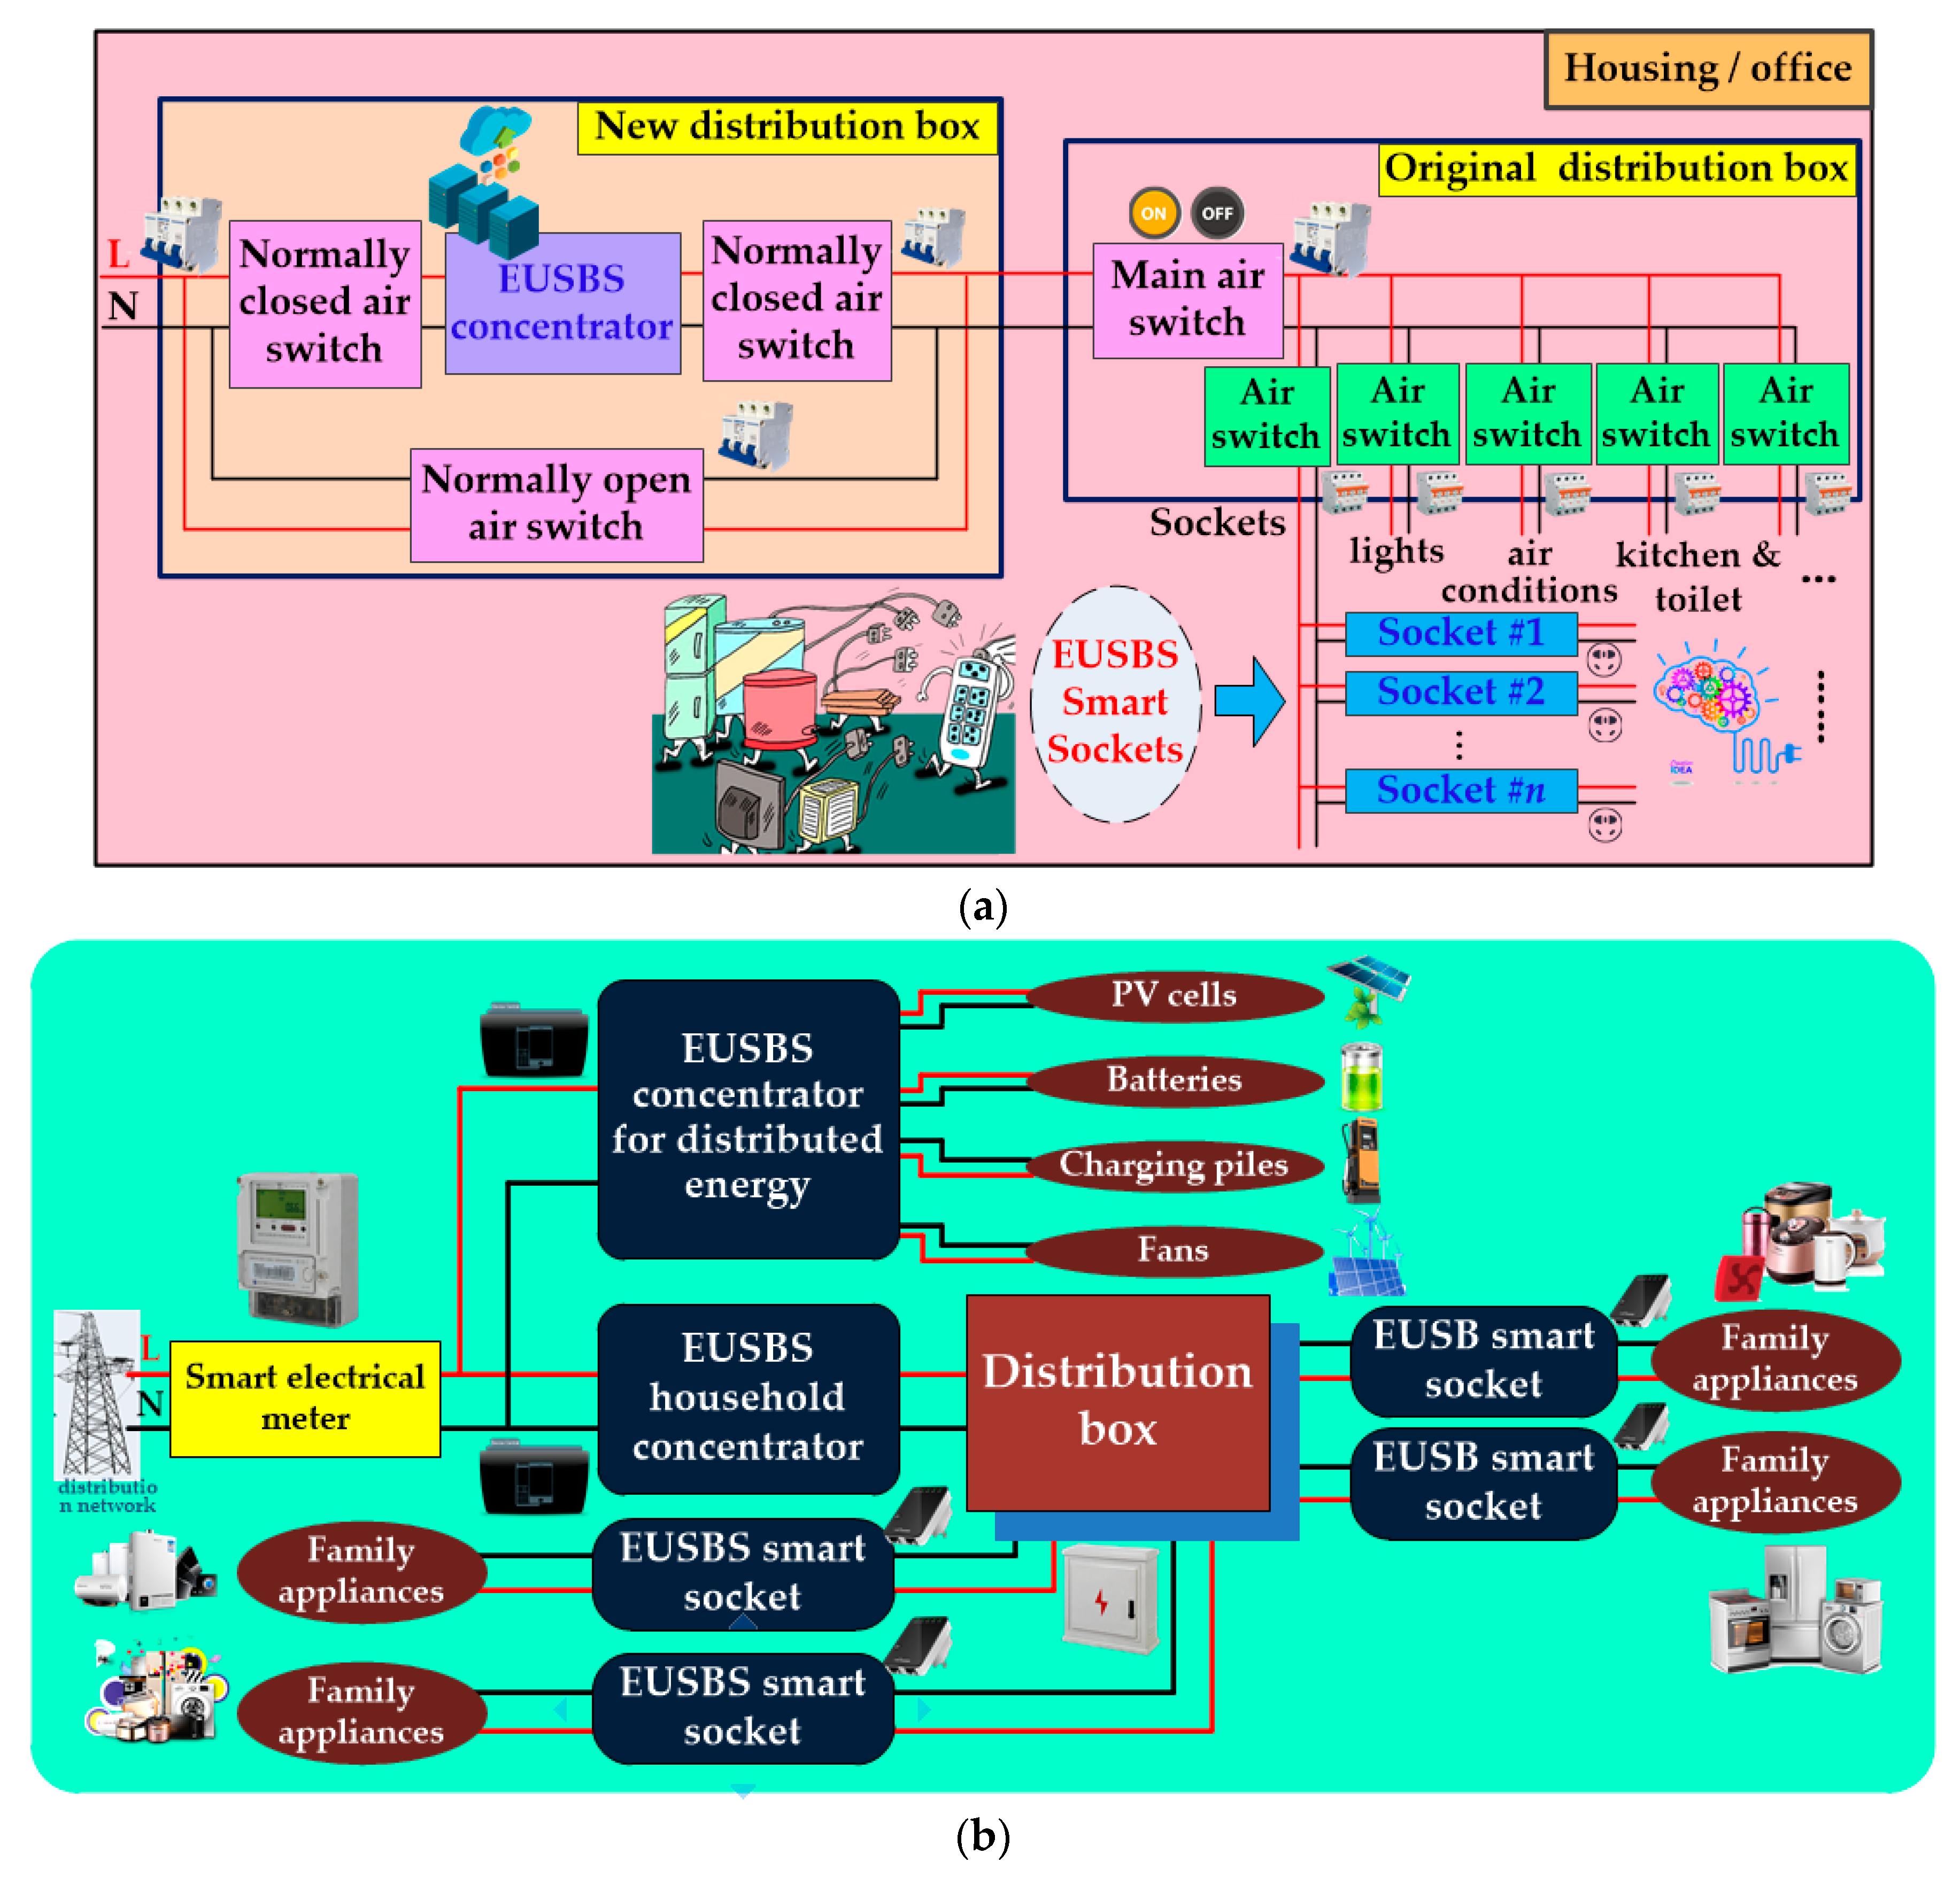
  • The equipment for access of PV, fans, ESE and EVCS. They are designed as the unified electrical interfaces for those distributed pieces of equipment according to their electrical features, so that a function of plug-and-play for them can be realized.
  • The smart sockets. They belong to the bottom-layer of hardware system, which conduct real-time monitoring and interruption for those controllable household appliances access to them, and record some basic electricity parameters, for example, Usingle, Isingle, P, PF, Tam, Ham and PMam;
  • The household concentrators. They are core of the hardware system, which complete electrical data acquisition, information communication, user interaction, and local user electricity utilization behavior analysis;
  • The floor concentrators. They are system-level devices which enable electrical data acquisition and information interaction via the downlink and uplink communication modes;
  • The building concentrators. They are building-level devices which provide electrical data collection and information interaction for the whole building.

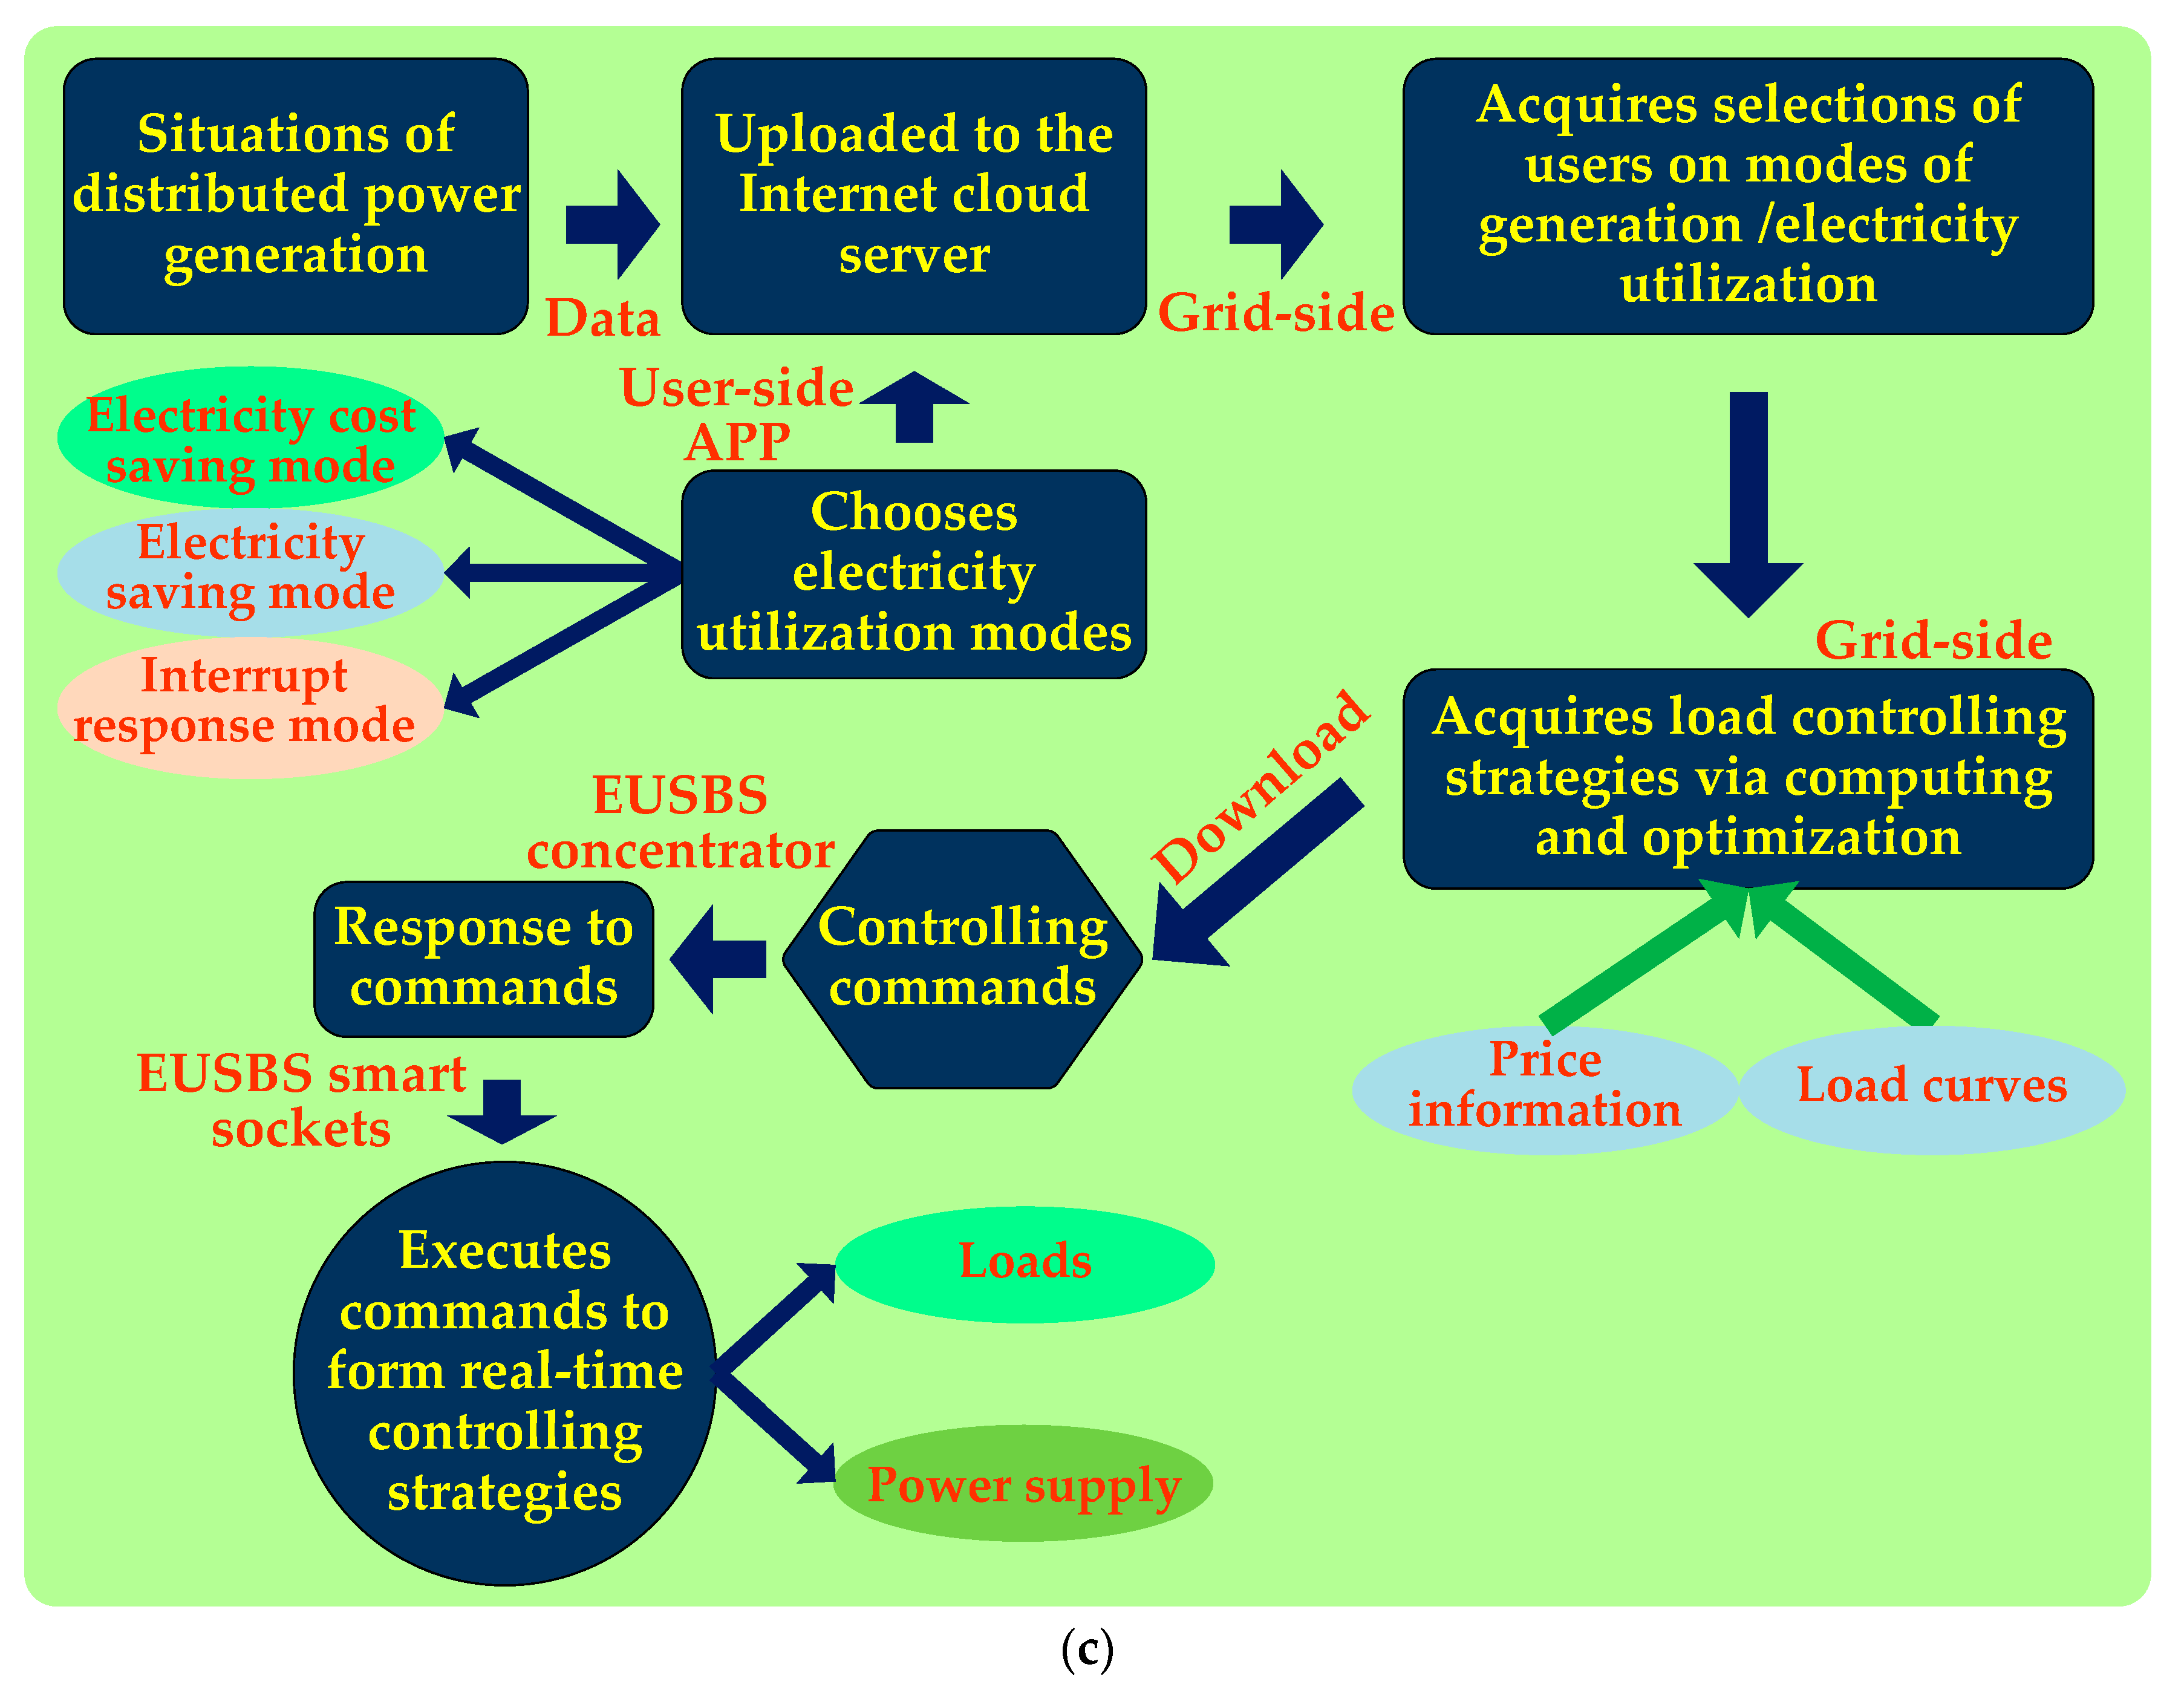
2.3. Several Application Scenarios

We propose an application scenario of EUSBS in which the demonstration site is selected an eco-friendly town of a certain city, and the number of homes for EUSBS installation is not less than 70. The application scenario is shown in Figure 3, where the EUSBS, as a unified processor, uses the uplink communication mode via Ethernet to interact with the demonstration site and share data with the distribution automation system and metering system, making it convenient to capture identifications and electrical topologies of all accessed DEE, and eventually achieves the meticulous management of DEE. Meanwhile, the EUSBS interfaces, based on the embedded system and encryption technologies, complete downlink communication with the smart mobile terminals via WiFi, ZigBee, Bluetooth, low-voltage power line carrier, etc. There are several possible application scenarios of EUSBS in the future, including:
  • Identification of distributed equipment and differentiated charging. For example, when an EV has access to a charging pile with functions of EUSBS via the charging plug, simultaneously the charging pile of EUSBS completes a spontaneous expense deduction and recognizes some important information of EV, such as its number, type and batteries; moreover, for the DG equipment and ESE that may deliver energy back to grid, the charging pile of EUSBS will carry out an automatic deduction based on the identifications of them;
  • Energy monitoring and coordinated control of such small- and medium-size industrial and commercial users and smart buildings. At the moment EUSBS collects detailed electricity information in equipment level and then reports them to the upper system, further based on the controlling signals from upper system, EUSBS remotely breaks the electricity equipment access to it when necessary;
  • Precise load forecasting and modeling for small-size distribution systems. When EUSBSs are widely installed in a small-size distribution system, then we will use the EUSBS to acquire the information of equipment and the electrical topologies to complete a precise load forecasting and modeling combining with the background big data analysis based on the Hadoop distributed file system (HDFS), a software framework for distributed processing of big data with good fault-tolerance, stable performance and high-speed storage capability;
  • Peak load shifting of small-size distribution systems. Under the supporting of background coordinated control system for DEE, a large number of EUSBSs will enable peak load shifting and inhibit intermittence of renewable energy system through controlling of electricity equipment.

3. Development of Hardware Part of EUSBS

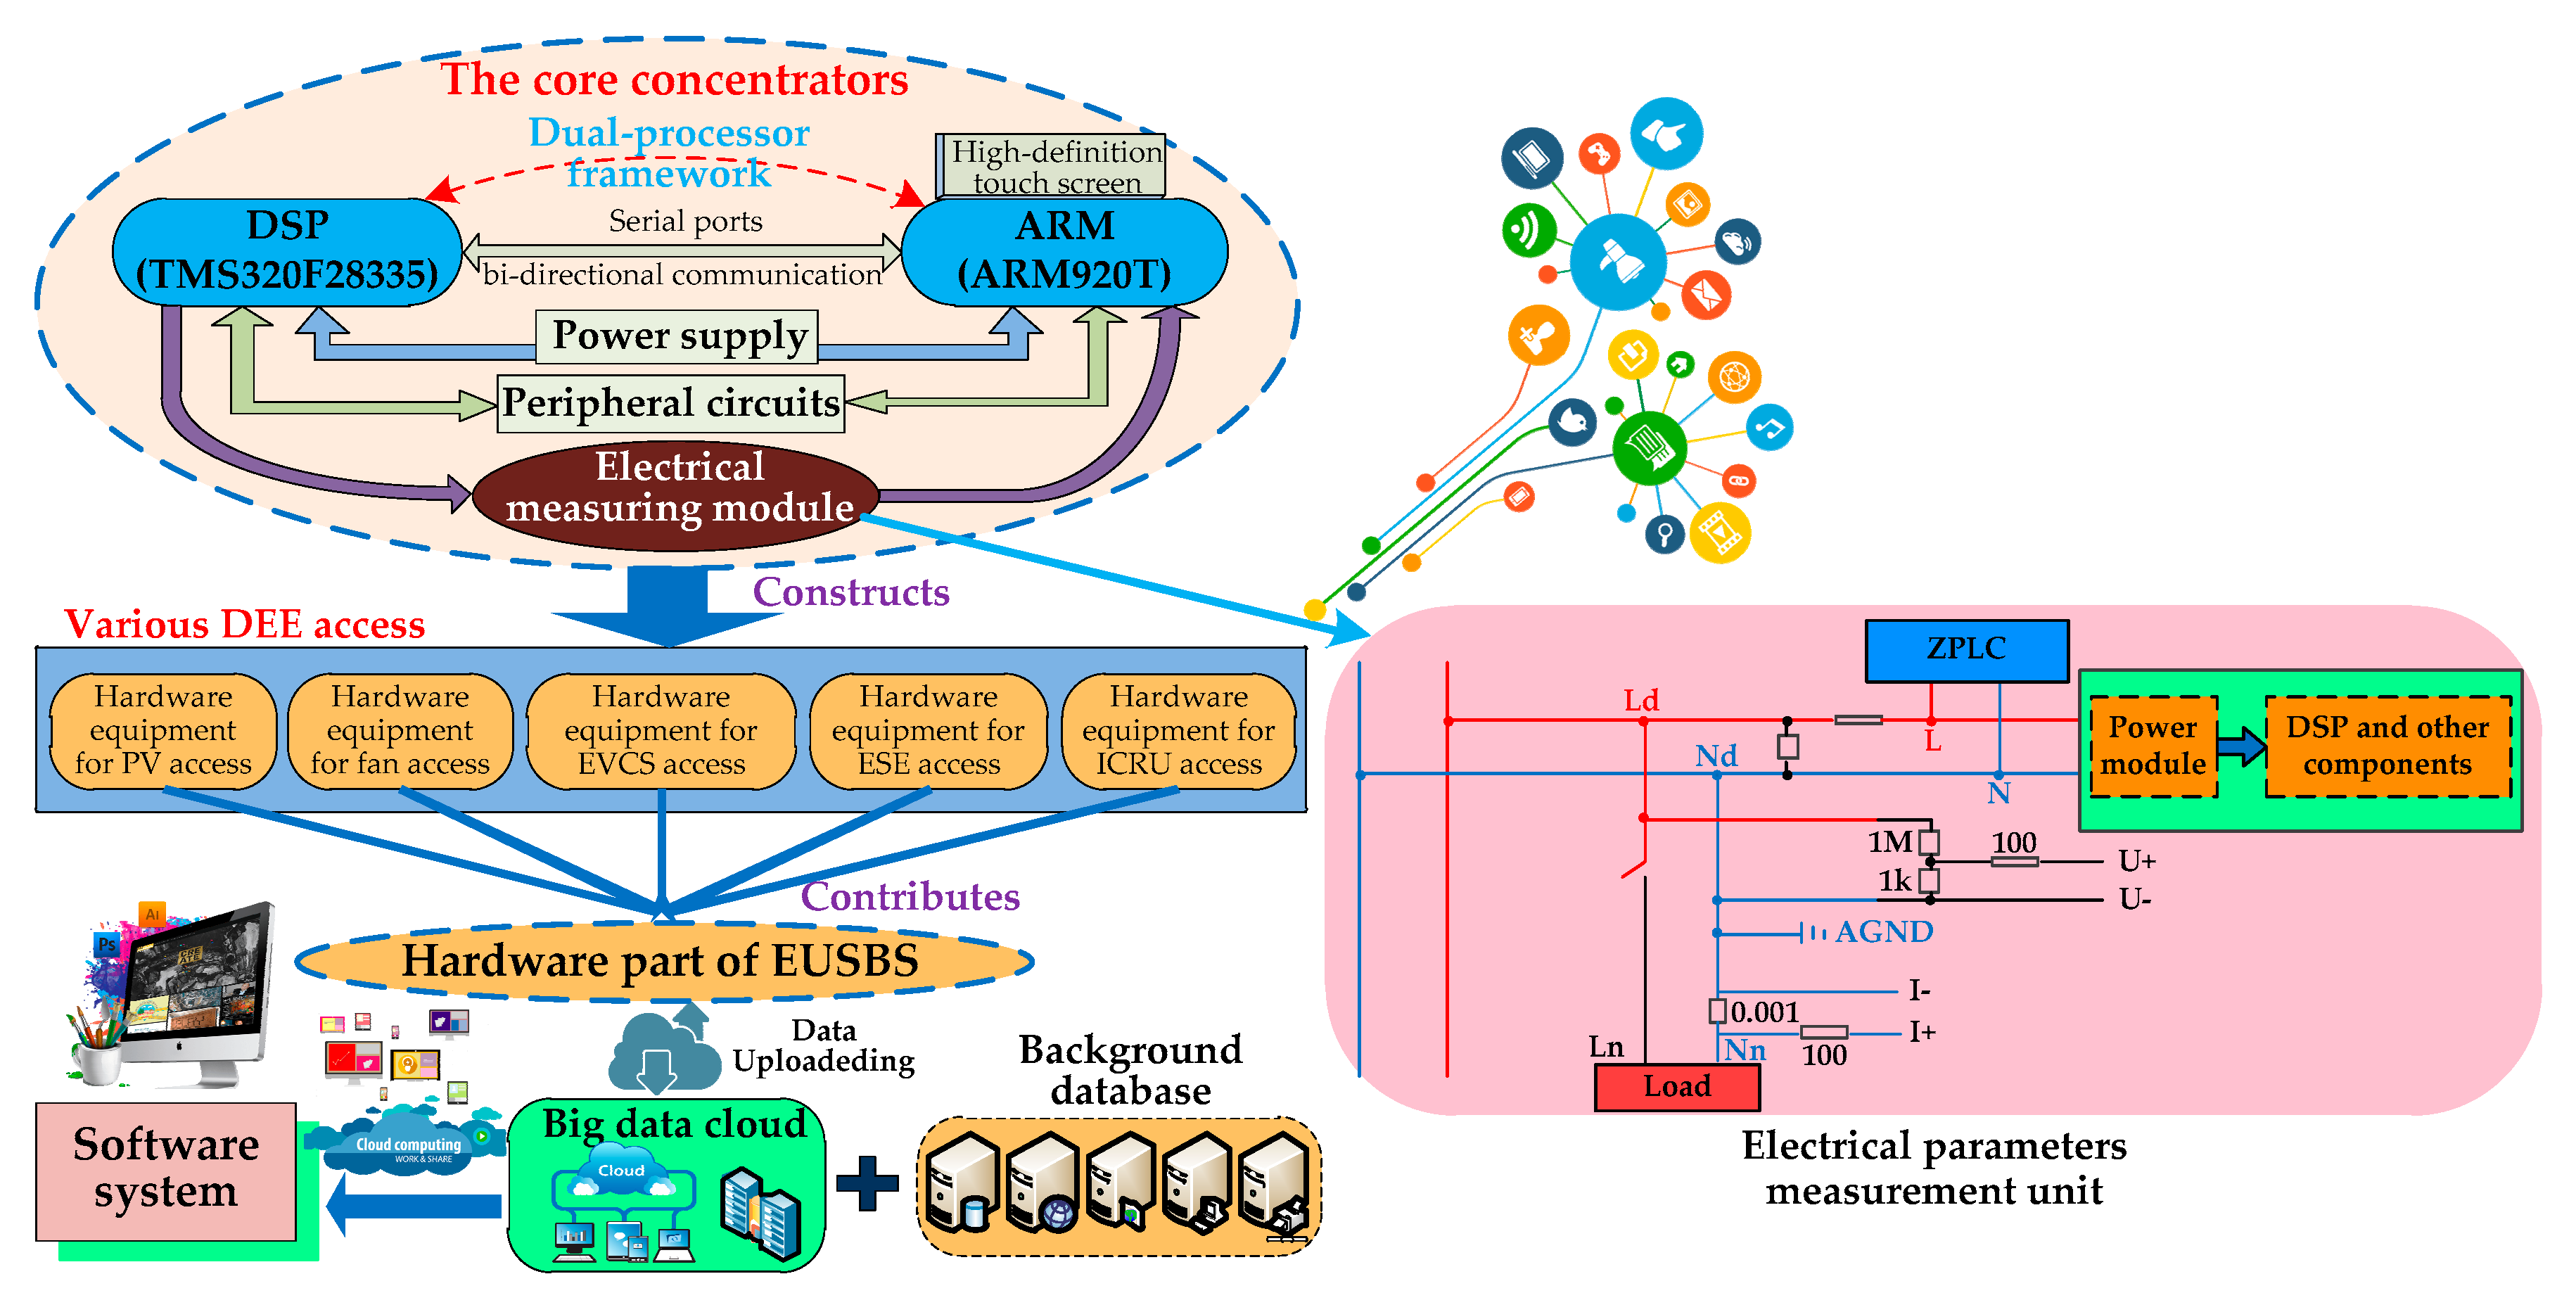
3.1. Framework Design

The hardware part is designed to complete a series of computing tasks, including signal acquisition of various electrical and ambient variables, harmonics measurement, fast Fourier transform (FFT), support of power line carrier and ZigBee communication, as well as intelligent interaction with users. The hardware part sends the information after processing to the software platform to generate the optimization and control strategies for DEE access and electricity utilization of CRU. The hardware part contains a lot of functional components, which are applied for DEE access and electricity data collection and processing, while one of the most important components is the concentrator, which is designed as a dual-processor framework based on DSP and ARM after consideration of the balance between cost and energy consumption, so that it is advantageous because of its high-speed computing, high computing precision and good stability. The concentrators and the equipment for DEE access contribute the hardware part of EUSBS, which is shown in Figure 4, where the DSP adopts TMS320F28335, manufactured by Texas Instruments (Dallas, TX, USA) and is responsible for signal acquisition and processing, uplink- and downlink-communication and operation control of electrical equipment; the ARM adopts ARM920T combined with a high-definition LCD to provide a friendly supply-demand interaction interface for users; in addition, the built-in smart algorithms can make local analysis on electricity utilization behavior of users, combining with further analysis by background software platform, then a variety of optimized electricity utilization strategies are generated for users to choose. The hardware part designed in Figure 4 is applied for access of PV, fans, EVCS, ESE and CRU and plug-and-play of DEE, signifying that it is a unified electrical interface for various DEE, and compatible with a variety of common communication protocols, for example, low-voltage power line carrier, ZigBee, WiFi, 3G, 4G, Bluetooth, and even 5G. Moreover, electricity utilization data are uploaded via the hardware part to the cloud server for big data collection and management, based on which, together with a deep data mining by the software platform combing with the background database and cloud computing, so that we can formulate the coordination control and optimization strategies of electricity utilization for users.
In Figure 4, the power supply circuit is used for DSP and ARM, and it is composed of a specialized TPS73HD301 power chip and some filter capacitors, ensuring a stable operation ability; the peripheral circuits contain the signal acquisition and amplification circuit, isolation circuit, power line carrier and ZigBee communication circuit, power supply circuit, key circuit, relay module, sensors, storage and clock module, etc., among them, the signal acquisition and amplification circuit is core of the built-in electrical parameters measurement unit shown in Figure 4, and this unit adopts resistive subdivision mode to measure voltage signals with the attenuation ratio of 1000:1, and uses precision Mn-Cu alloy as the sampling resistance of current signals; the isolation circuit adopts an ADuM7642 magnetic coupling isolation chip; the power line carrier and ZigBee communication module adopts ZPLC-10 with a built-in isolation circuit, and DRF1605H respectively; the power module uses a LD12-20B12 to convert AC 220 V into DC 12 V; the sensor module includes an AM2302 temperature & humidity sensor and MQ135 air quality sensor; the key and ARM module is mainly used to interact with users; the expanded storage chip adopts AT24C64; the built-in clock chip adopts DS1302, which records the time information of electricity utilization for users. According to the chip selections, the specific development process of the hardware part is further elaborated in the following sections.

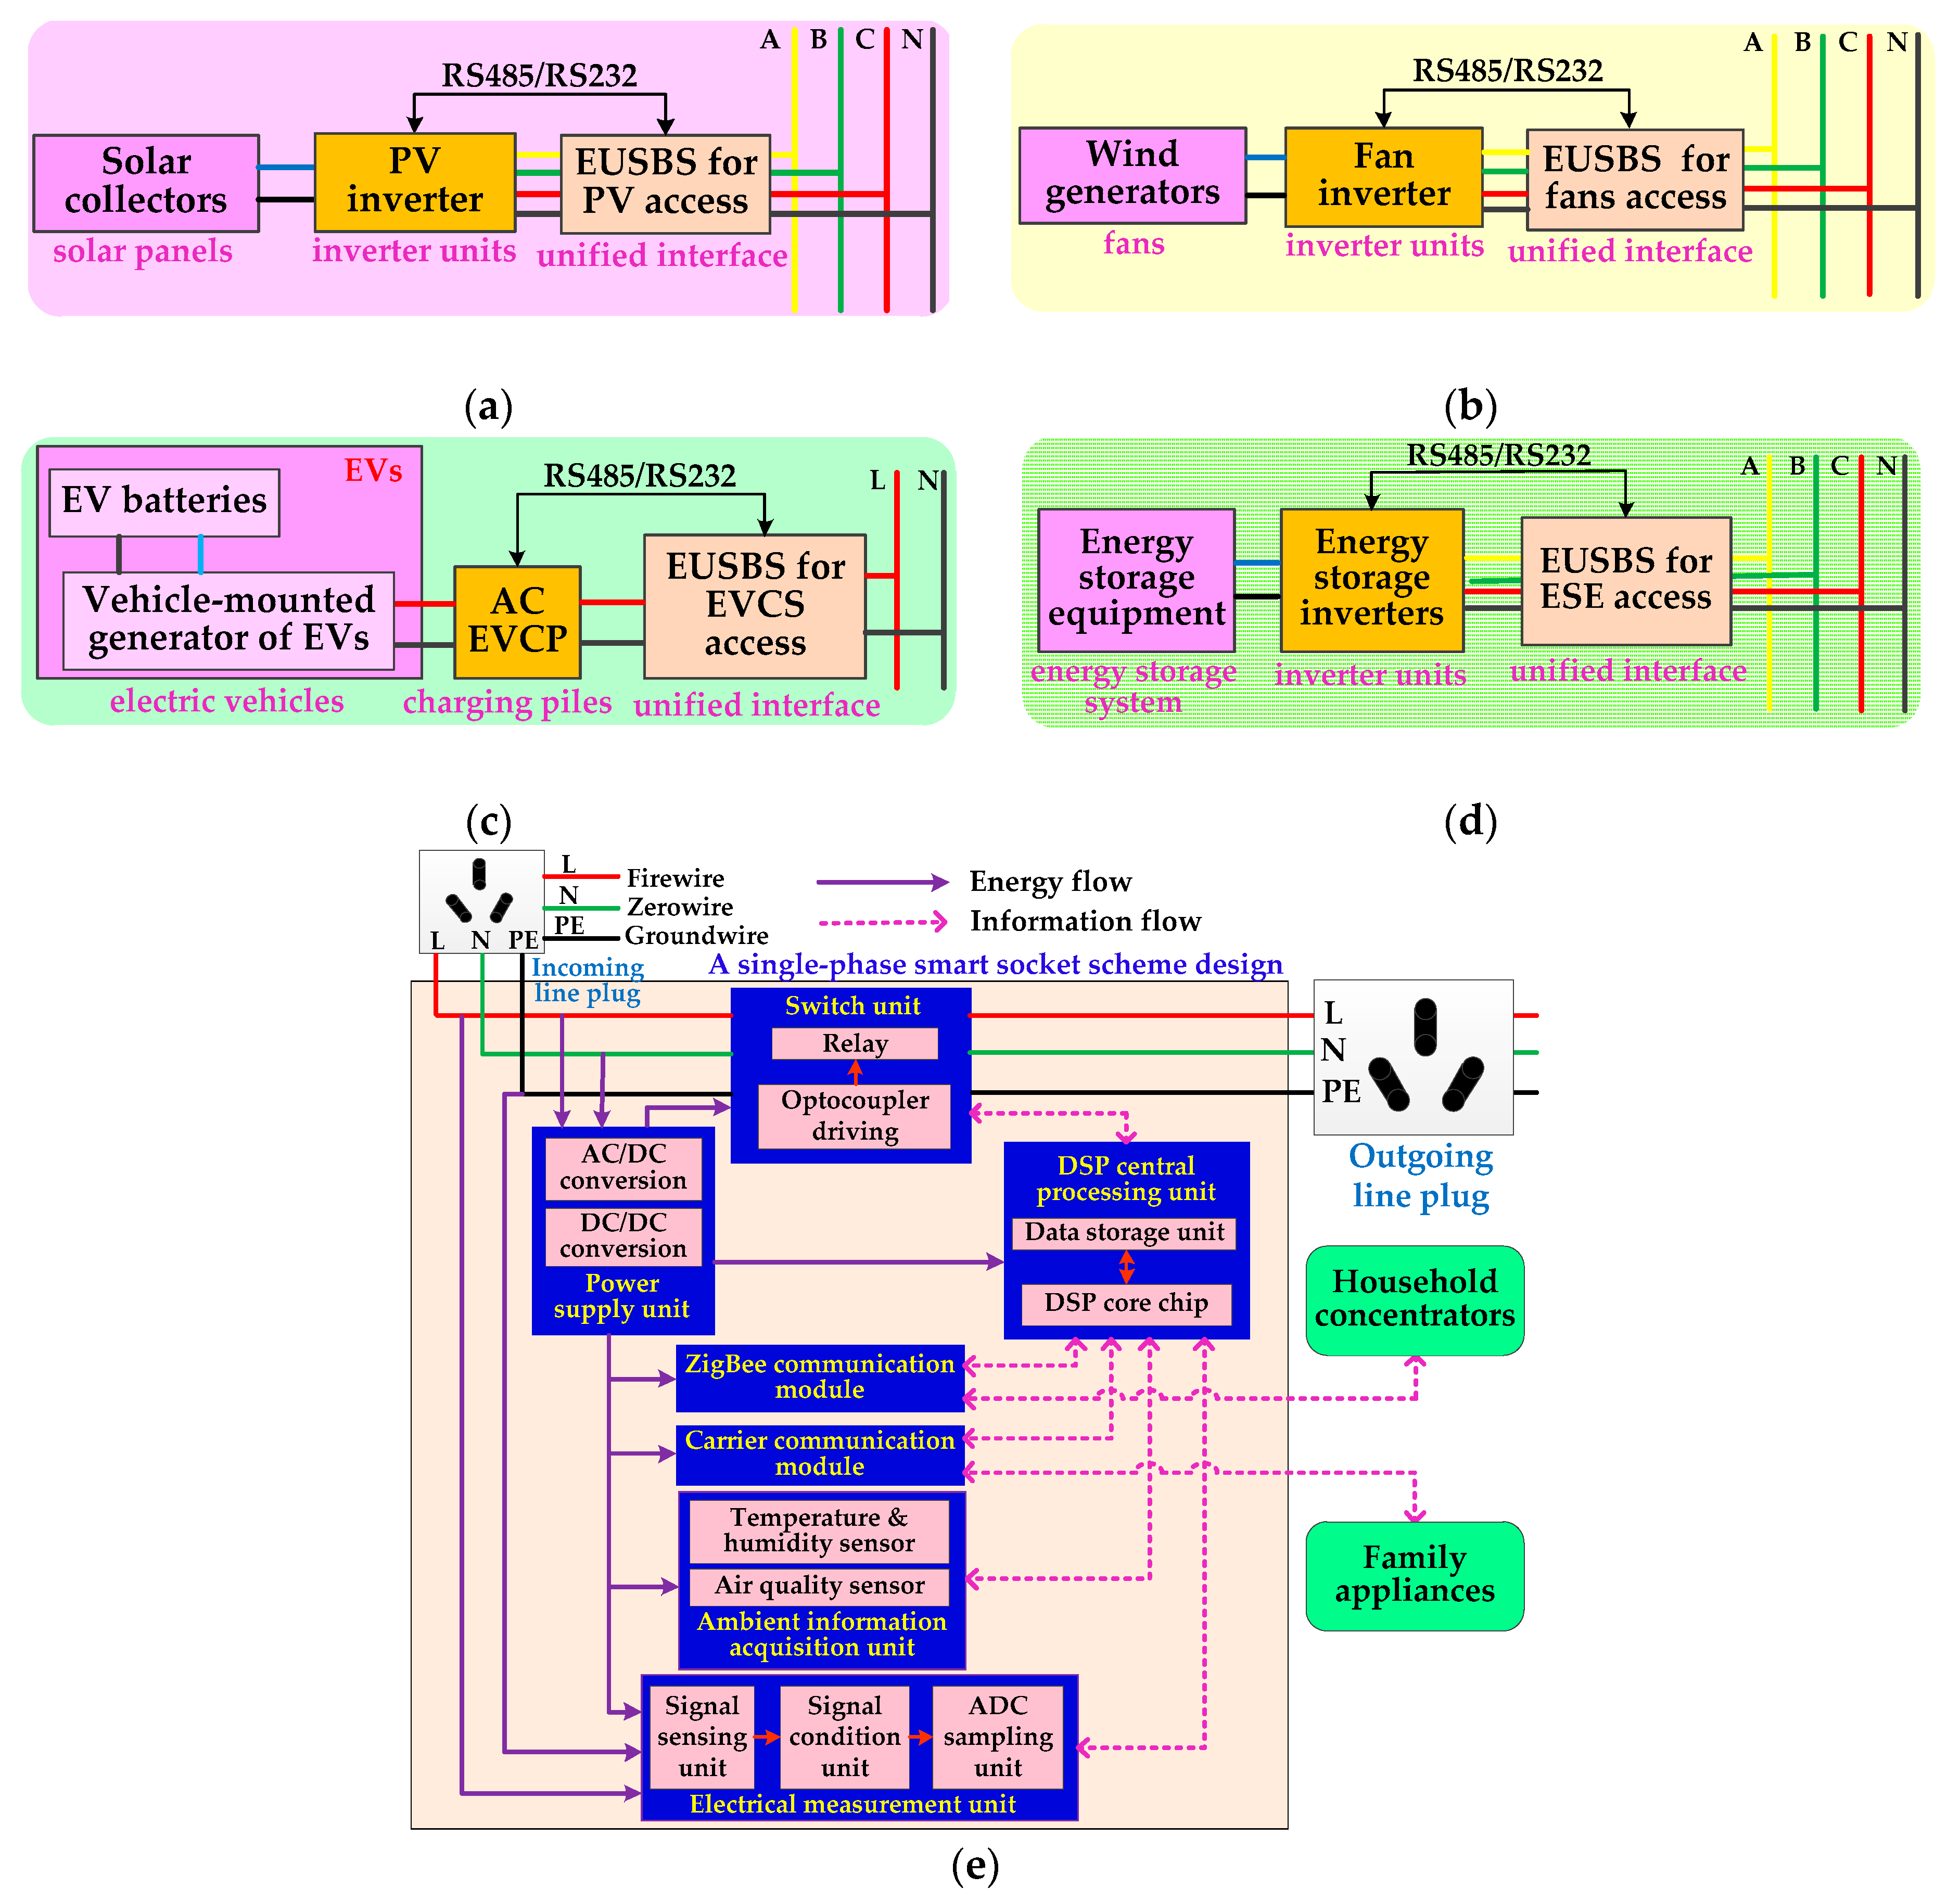
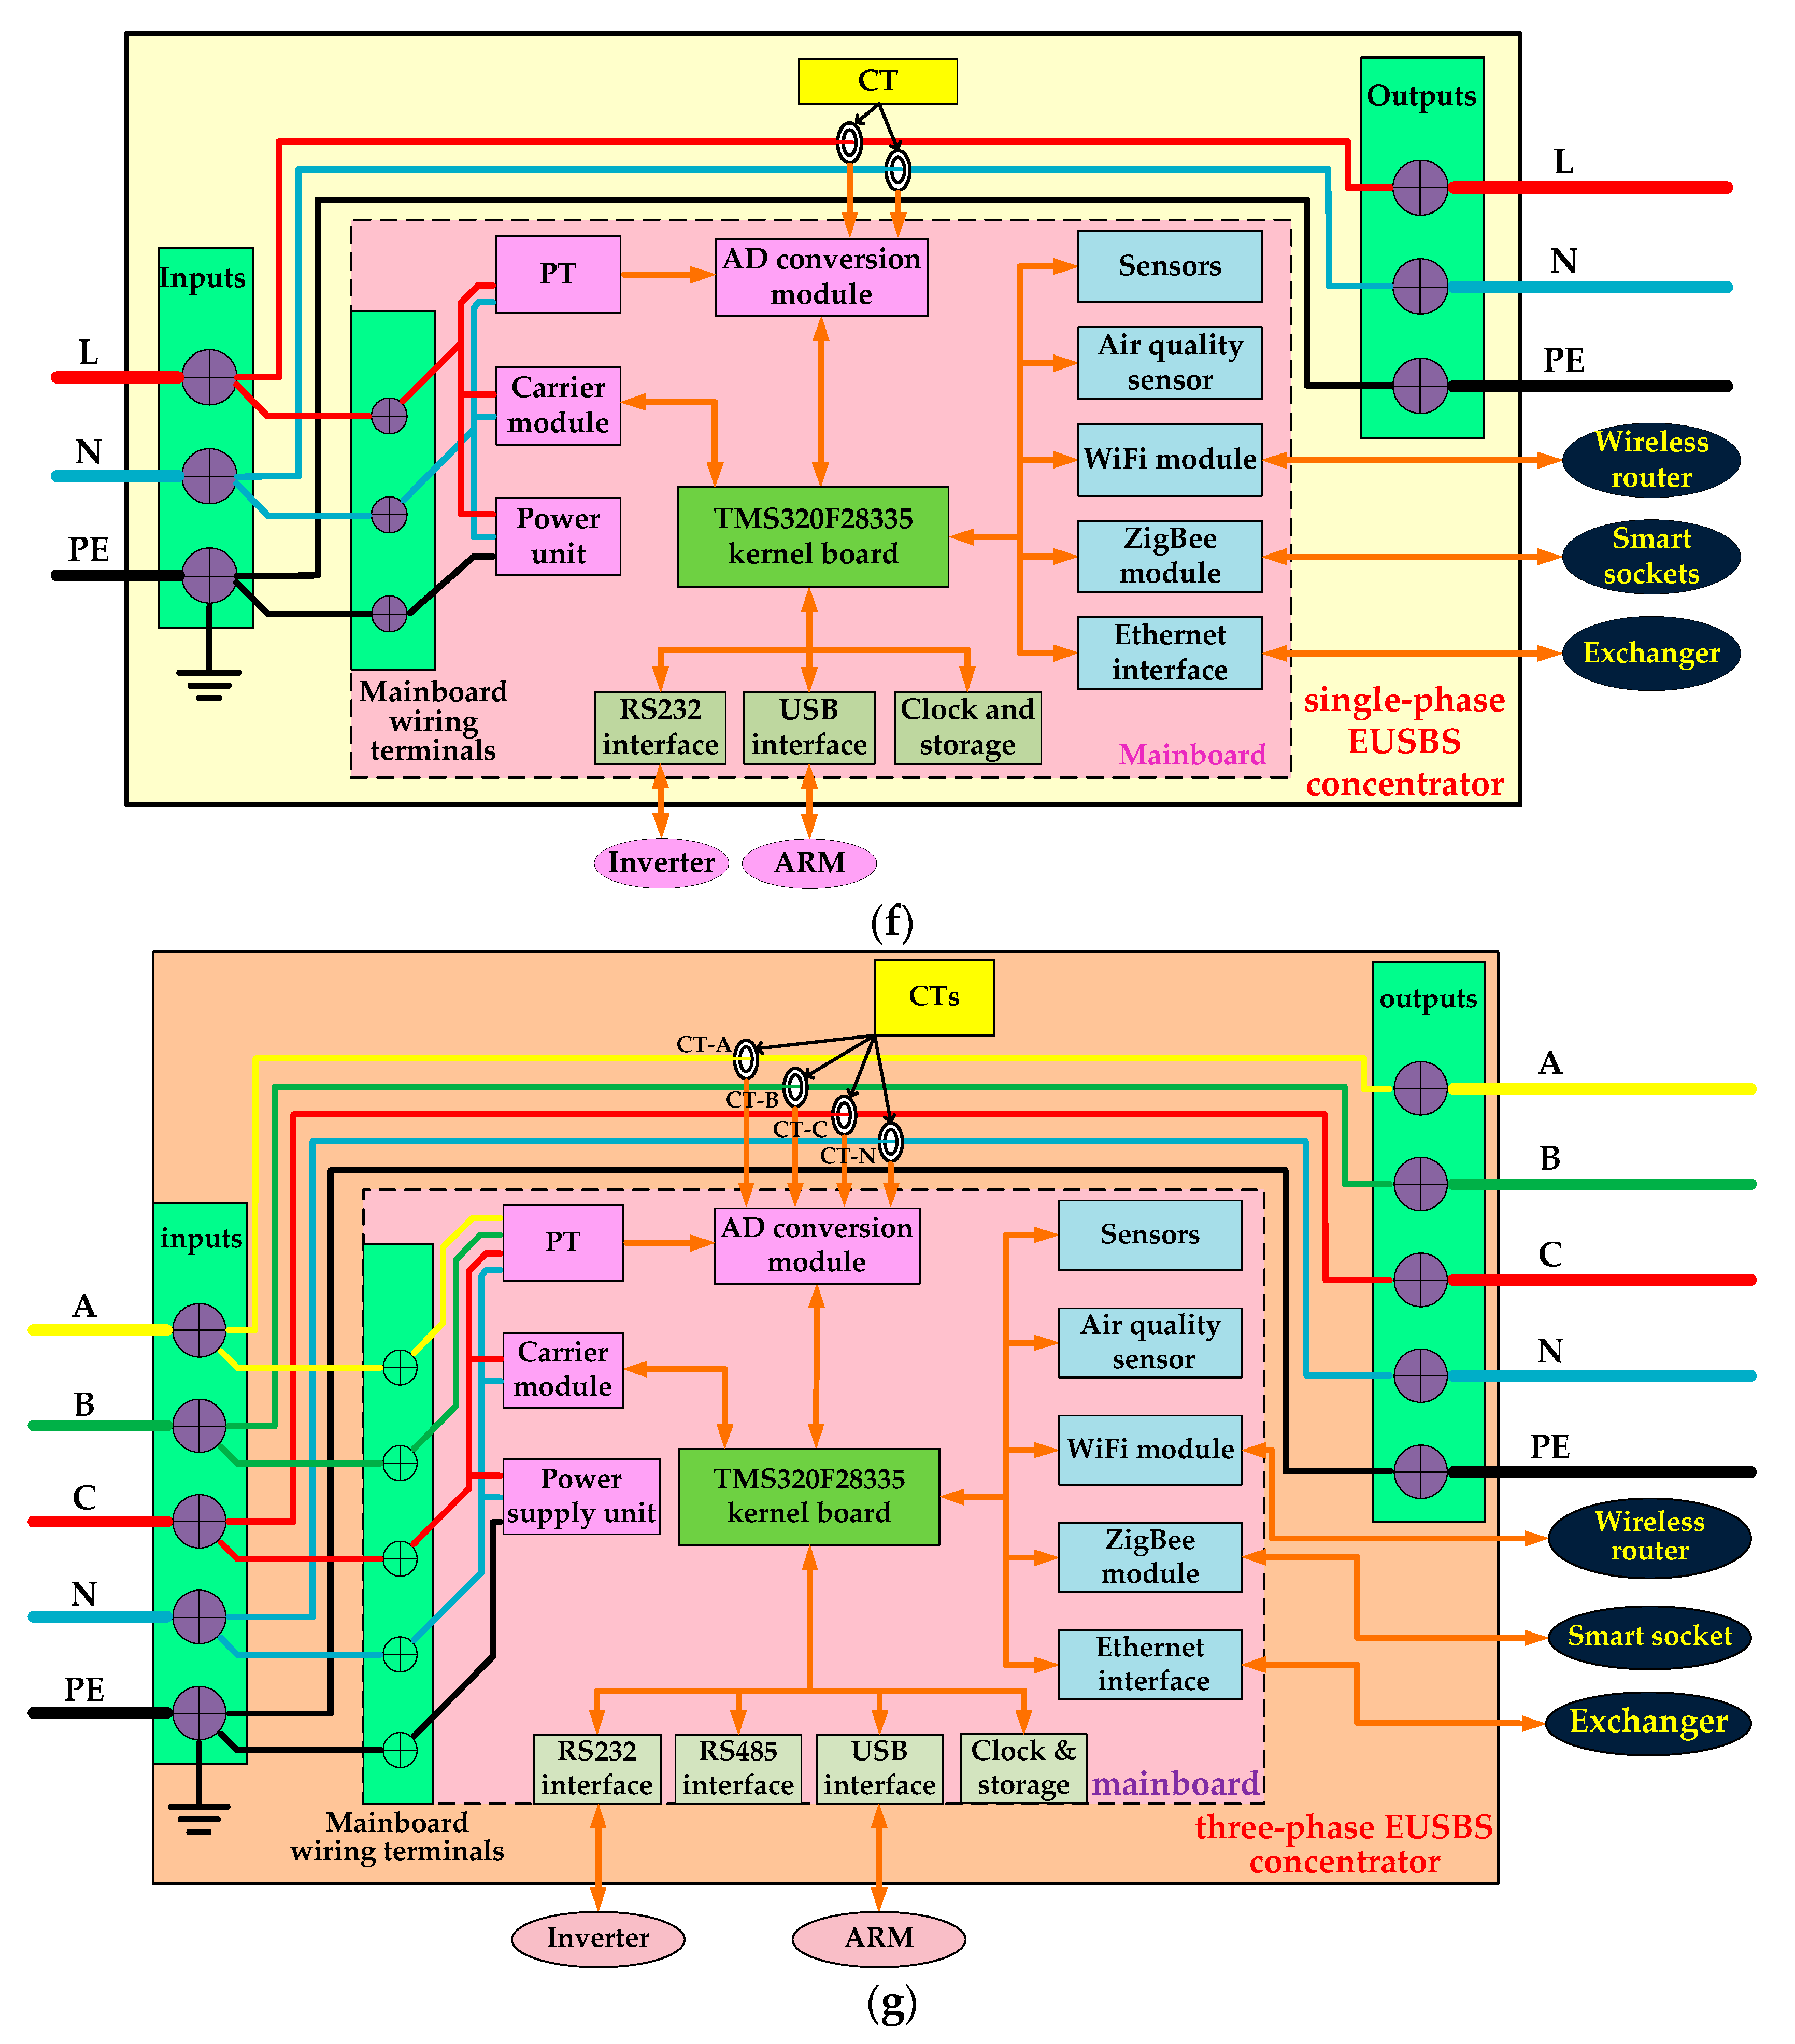
3.2. Development of Five Major EUSBS Hardware Equipment

The EUSBS hardware equipment are divided into the hardware equipment for PV access, fan access, EVCS access and ESE access, as well as the devices for CRU access, and the architecture design for all of which is shown in Figure 5.

3.2.1. The Hardware Equipment for PV Access

It is mainly composed of the PV inverter and the EUSBS interface for PV access (Figure 5a). The DC current of solar collector is output to the PV inverter for inversion of AC current and output to the grid via EUSBS in three-phase four-wire mode, and one of phases is used to provide power for the EUSBS.

3.2.2. The Hardware Equipment for Fans Access

This part is applied to identify the characteristics of accessed fans, support the plug-and-play of fans and continuously control the output of fans (Figure 5b). In addition, it is also has a built-in electrical parameter measurement module that can complete a real-time detection of various electrical quantities of the accessed fans, such as the current Pout-total, PF, generation capacity Cg, Uout and Iout; besides, it also completes power quality detection and ambient information collections around the installation site, such as Tam, Ham and PMam; moreover, this hardware equipment can quickly and safely make the fans in connection or disconnection.

3.2.3. The Hardware Equipment for EVCS Access

It is used to intelligently identify the characteristics of the accessed charging piles of EV, and complete a real-time monitoring of various electrical parameters (Figure 5c), for example, the current Pout-total, PF, Qc, Uout, Iout, voltage harmonics and current harmonics; besides, it is able to collect the environmental information, compatible with different communication protocols, and quickly close and open the charging piles safely.

3.2.4. The Hardware Equipment for ESE Access

It is required to support the plug-and-play of ESE, and also has a same function of real-time monitoring various electrical parameters of ESE access to system (Figure 5d), such as the current remaining electricity storage capacity, current output/input total power, PF, Uout, Uinput, Iout, Iinput, and voltage/current harmonics; it is also able to collect the ambient information and has a good compatibility with various communication protocols; in addition, as the energy storage system is installed indoors, so we can select WiFi as a main communication mode; moreover, it can continuously control the energy storage system.

3.2.5. The Hardware Equipment for CRU Access

It is designed as a multi-level hierarchical hardware system that is composed of smart sockets (Figure 5e) and concentrators. The concentrators are divided into single-phase concentrator (Figure 5f) and three-phase concentrator (Figure 5g). In addition, according to the location, they are also classified as household concentrator, floor concentrator and building concentrator, and they are similar in design and performance; among them, the household concentrator is served as an energy concentrator and an information concentrator; the other two are only used as information concentrators because of their power capacity limitation. The concentrators not only conduct a bi-directional interaction of information and energy between CRU and grid, but also complete a real-time detection for DEE, moreover, they are compatible with some communication protocols, for example, the power line carrier and ZigBee, and the selection of communication modes is based on the application range, data rate and the effective transmission distance, so the concentrators support communication with various electricity information collecting terminals, such as smart socket, smart meter, and ambient sensor. Now aimed at Figure 5e–g, the hardware equipment for CRU access is briefly introduced as follows.
The smart socket is composed of the power supply unit, switch unit, ambient information acquisition unit, electrical measurement unit, ZigBee communication unit, and DSP central processing unit. Three tasks are completed by the smart socket including: (a) communicates with household concentrator via ZigBee (uplink communication), at the moment the household concentrator is treated as server node/central node, while the socket as device node/terminal node, and it also communicates with smart mobile terminals via Bluetooth or WiFi; (b) measures electrical parameters, for example, the Usingle, Isingle, P, PF, f, harmonics, Tam, Ham and PMam, after that, the data are uploaded to the household concentrator by socket; (c) connects or cuts off the equipment via APP in smart mobile terminals according to actual demands. The socket also conducts downlink communication with smart household appliances via a specialized low-voltage carrier mode with advantages of short-distance and high-speed, moreover, the carrier signals are only used for the smart sockets. The technical specifications of the smart socket are presented in Table 2. Apart from these specifications presented in Table 2, for the smart socket, its rated voltage is 220 V ± 20% with 50 Hz, maximum cut-off current is 10 A, total power consumption is lower than 2 W, product size is 110 × 65 × 36 mm, communication mode is WiFi, communication distance is 0–100 m, and transmission rate is 11–54 Mbps.
The household concentrator is a core component for the EUSBS hardware equipment, which enables electrical data collection, communication, user interface interaction, and the local user behavior analysis via the built-in advanced smart algorithms. The uplink communication is conducted with the floor concentrator (as device node) via low-voltage carrier and the downlink communication with smart socket via ZigBee, at the moment the household concentrator is server node/central node, the socket is device node/terminal node. The technical specifications of the household concentrator are shown in Table 3. Besides, the other technical specifications of this developed household concentrator are as follows: rated voltage is 220 V ± 20%, with 50 Hz; maximum cut-off current is 40 A; overall power consumption is lower than 8 W; product dimension is 495 × 300 × 165 mm; communication mode is WiFi; communication distance is 0–100 m; and transmission rate is 11–54 Mbps.
The floor concentrator is a system-level device which performs electrical data acquisition and communication. Its uplink communication with the building concentrator (treated as a device node/terminal node) is completed via ZigBee; and the downlink communication with the household concentrator installed on the user side is finished based on the low-voltage power line carrier, at the moment the floor concentrator is treated as server node while the household concentrator as device node.
The building concentrator is a building-level device which also conducts electrical data collection and communication. The data includes Uthree-phase, Ithree-phase, P, PF and electrical energy of each building. The uplink communication uses with Grid Corporation is completed via the exchangers based on Ethernet, while the downlink communication with the floor concentrator (treated as device node/terminal node) is finished via ZigBee, and at the moment the building concentrator is served as server node/central node.
Note that the inverter is a significant component for each above EUSBS hardware equipment. Compared with an ordinary inverter, the inverter developed in the EUSBS adopts a meter-source unibody design structure, based on which, a large number of electrical parameters can be measured via the voltage/current sensors, including the output voltage of the photovoltaic panel, Uoutput, the input current of the boost circuit, the DC-side capacitor voltage of the three-level three-phase inverter bridge, the three-phase current entering the grid, and the three-phase voltage of the grid. Based on these electrical data, we can calculate other electrical parameters, including the DC-side current of the inverter bridge, the AC-side active power of the inverter, the power factor (PF), and the total amount of electricity generated by the photovoltaic panel, etc. After that, the above measured or calculated electrical data can be returned back to the users via the ESUBS. The functional block diagram of the actual researched and developed inverter is shown in Figure 6. Aiming at this, we give a more detailed explanation as follows. In Figure 6, the inverter is divided into several different functional parts:
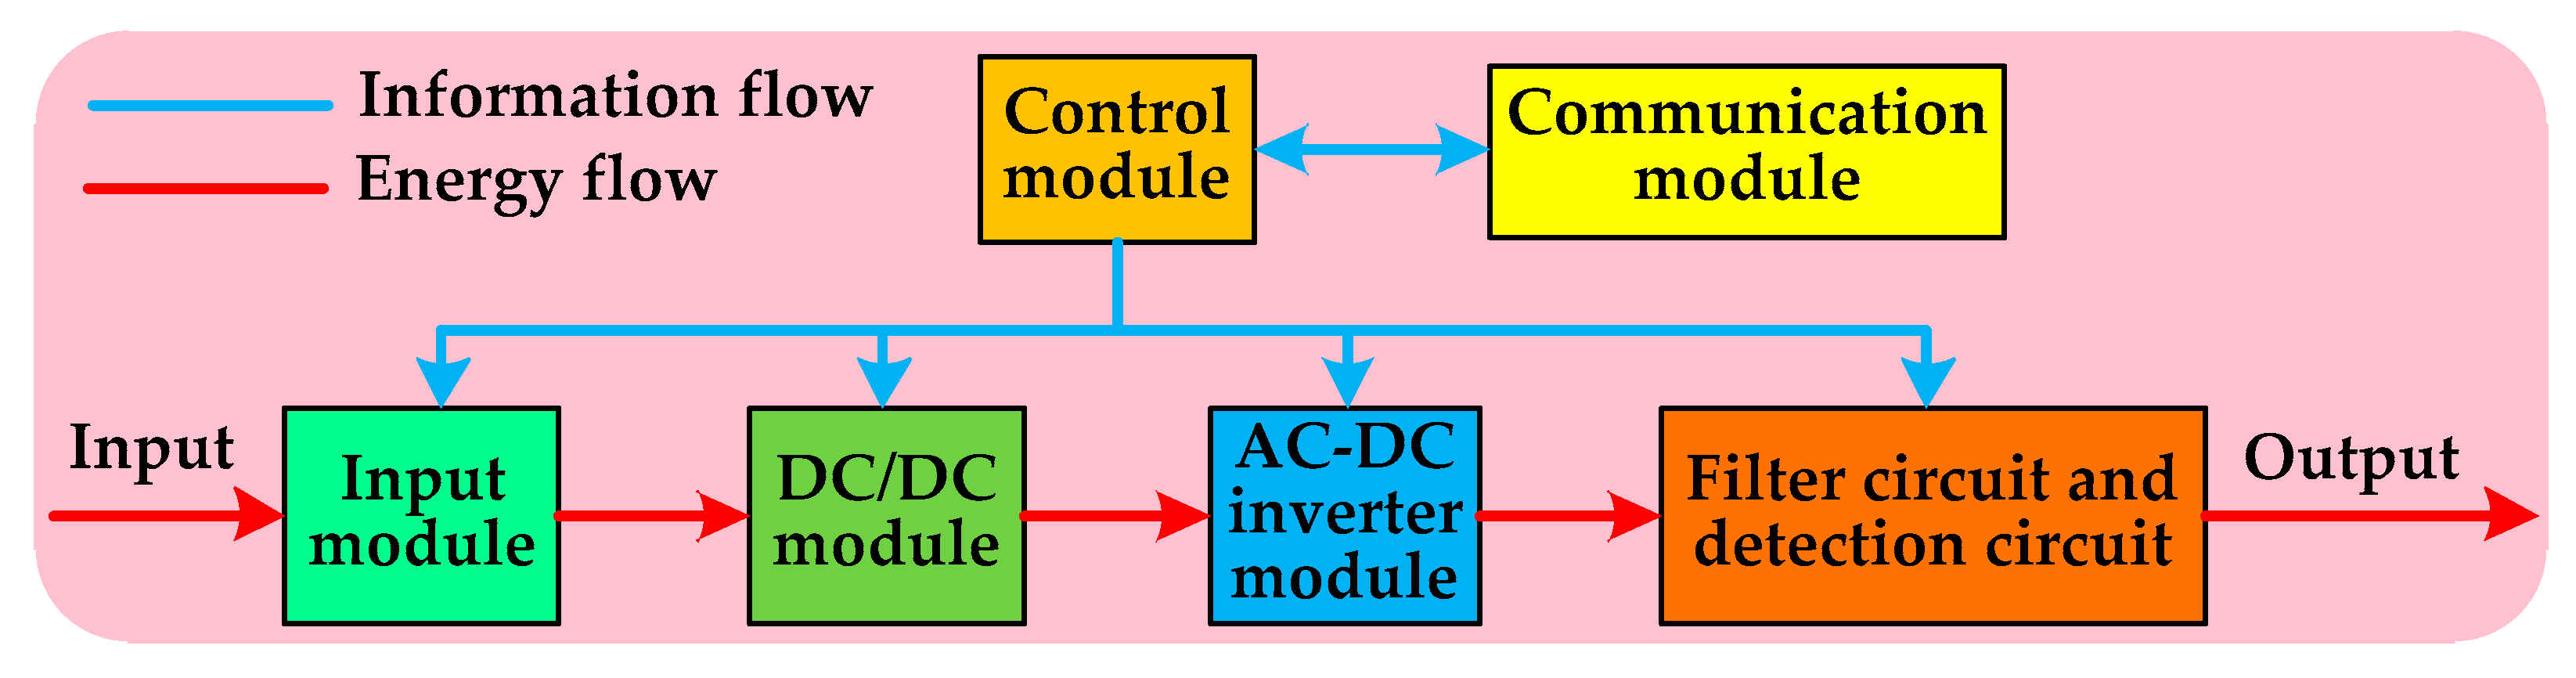
  • The control module: it includes all sampling, detection, and control circuits. Its main function is first to finish signal conditioning to the sampling data and detection signals from the lower hardware circuit. Then, these signals after conditioning are sent to the DSP and ARM for further processing. At the same time, the control module performs data transmission with the communication module, and outputs the driving signals required for the action of the boost switching tube and the inverter switching tube, in order to control the equipment to be connected to the grid and complete the system fault detection, thus realizing the control of the whole system.
  • The communication module: it is mainly responsible for man-machine interaction. Specifically, through the display screen, we can set the operating mode of the equipment and read the real-time data of equipment during operation, including AC and DC voltage and current, input and output power, and the amount of power generation.
  • The input module: it mainly includes a two-way DC input and a switching power supply circuit. Its main function is to collect the DC voltage and current signals input from the inverter, and provide AC and DC auxiliary power for the control circuit, driving circuit, grid-connection relay, communication display, fans, GFCI and PVISO detection of the entire equipment.
  • The DC/DC module: it mainly includes a boost circuit module. The main function of this module is to realize the parallel boosting to the two-way inputs so that making the input voltage of the inverter meet the requirements of grid connection after conversion.
  • The inverter module: it mainly contains a neutral-point level clamping three-level inverter circuit. Its main function is to reverse the DC bus voltage to AC voltage.
  • The filter circuit and detection circuit: it mainly includes LCL filter circuit, leakage current detection circuit, and EMC filter circuit. Its main function is to filter the current output by the inverter module, detect the leakage current, and control the relay to realize the grid connection of the equipment.

3.3. Laboratory Prototypes Development of EUSBS Hardware Equipment

Based on the previous hardware principle design, the laboratory prototypes of a smart socket and an EUSBS concentrator are shown in Figure 7, respectively. In Figure 7, the smart socket (Figure 7a) is developed based a TMS320F28335 DSP; the prototype of concentrator (Figure 7b) is developed with a DSP-ARM-based dual-processor framework, and consists of a DSP-based bottom data acquisition board and an ARM-based top-level UI board. The former is responsible for data acquisition and processing, and equipment communication, which contains DSP and its peripheral circuit, and a series of modules and conversion circuits, such as the potential transformer (PT), current transformer (CT), AD conversion unit, sensors, WiFi, carrier, Ethernet, ZigBee, USB, RS232, RS485 and RS422; the latter is responsible for providing a friendly supply-demand interaction interface for uses, which includes ARM and its peripheral circuit and a high-definition touch screen.
The prototype of a smart socket is shown in Figure 7a, where the prototype mainly contains eight parts according to the numbered sequence: DSP chip, ambient temperature and humidity sensor, smoke particulate matter concentration sensor, screen switch and interfaces, ADC chip, ZigBee module, sampling and amplifying circuit, power supply module and relays; meanwhile the prototype of an EUSBS concentrator is shown in Figure 7b and which is mainly composed of ten parts according to the numbered sequence: circuit breaker, power supply circuit, WiFi module, DSP chip, clock circuit, ZigBee module, Ethernet interface, JTAG debugging interface, ambient temperature and humidity sensor and smoke particulate matter concentration sensor. Based on Figure 7, when an EUSBS concentrator is connected to a smart mobile terminal, such as a smart phone, then we can use the APP installed on the phone to open the main interface of the software platform of EUSB, through the phone, we can control and communicate with the concentrator, which completes a series of computing tasks, including acquisition of a variety of electrical data and ambient parameters, harmonics measurement based on FFT, low-voltage power line carrier and ZigBee based communication, and intelligent interaction with the users.
Aiming at the prototype of EUSBS concentrator, apart from the DSP-based bottom-layer data acquisition board and the ARM-based top-layer user interface (UI) board, we need to configure an air switch in series connection with the incoming and outgoing terminals of concentrator respectively, for a more reliable power supply, and further configure a normally open air switch connected to concentrator in parallel mode. Hence, when a power outage occurs, which is caused by a fault in the EUSBS concentrator, at this point we just need to open the normally closed air switch and simultaneously close the normally open one, and thereby we will recover the power supply for the users.
These three air switches above combining with the EUSBS concentrator are designed to package in a new-type power distribution box, which is applied for an easy access to the urban power network in series mode ahead of user’s original distribution box. The configuration principle of the new-type distribution box is shown in Figure 8a, based on which, the corresponding single-phase and three-phase laboratory prototypes can be developed. In addition, the entire assembling of the developed distribution box combined with the ARM-based high-definition touch screen can also be developed. Based on the laboratory prototypes, the concrete installation mode of the EUSBS concentrator is represented graphically as in Figure 8b. We can see from Figure 8b that the EUSBS concentrator access to users is connected in series between the smart electrical meter and indoor distribution box, and then we conduct management for the electricity equipment via the EUSBS smart socket.
Based on the developed concentrators illustrated in Figure 8, which have independent computing and processing abilities based on the Android system, and adopt advanced smart algorithms and new sensor technologies to provide a convenient operation and watch for users. So the EUSBS concentrators are not only E-net-based smart terminal interfaces for plug-and-play of various DEE and bi-directional information-energy interaction between DEE and grid, but also electrical interfaces for various distributed equipment, such as distributed power supply, distributed ESE, EV, and controllable loads, in addition, they are compatible with a variety of communication protocols for supporting of bi-directional information flow between various distributed equipment and grid. Each household installs only one EUSBS concentrator in a small-size space, where the EUSBS concentrator is applied as an energy management system for multiple energy optimization and improved energy utilization. The equipment information of the EUSBS concentrator is shown in Table 4.

4. Software Platform Design of EUSBS

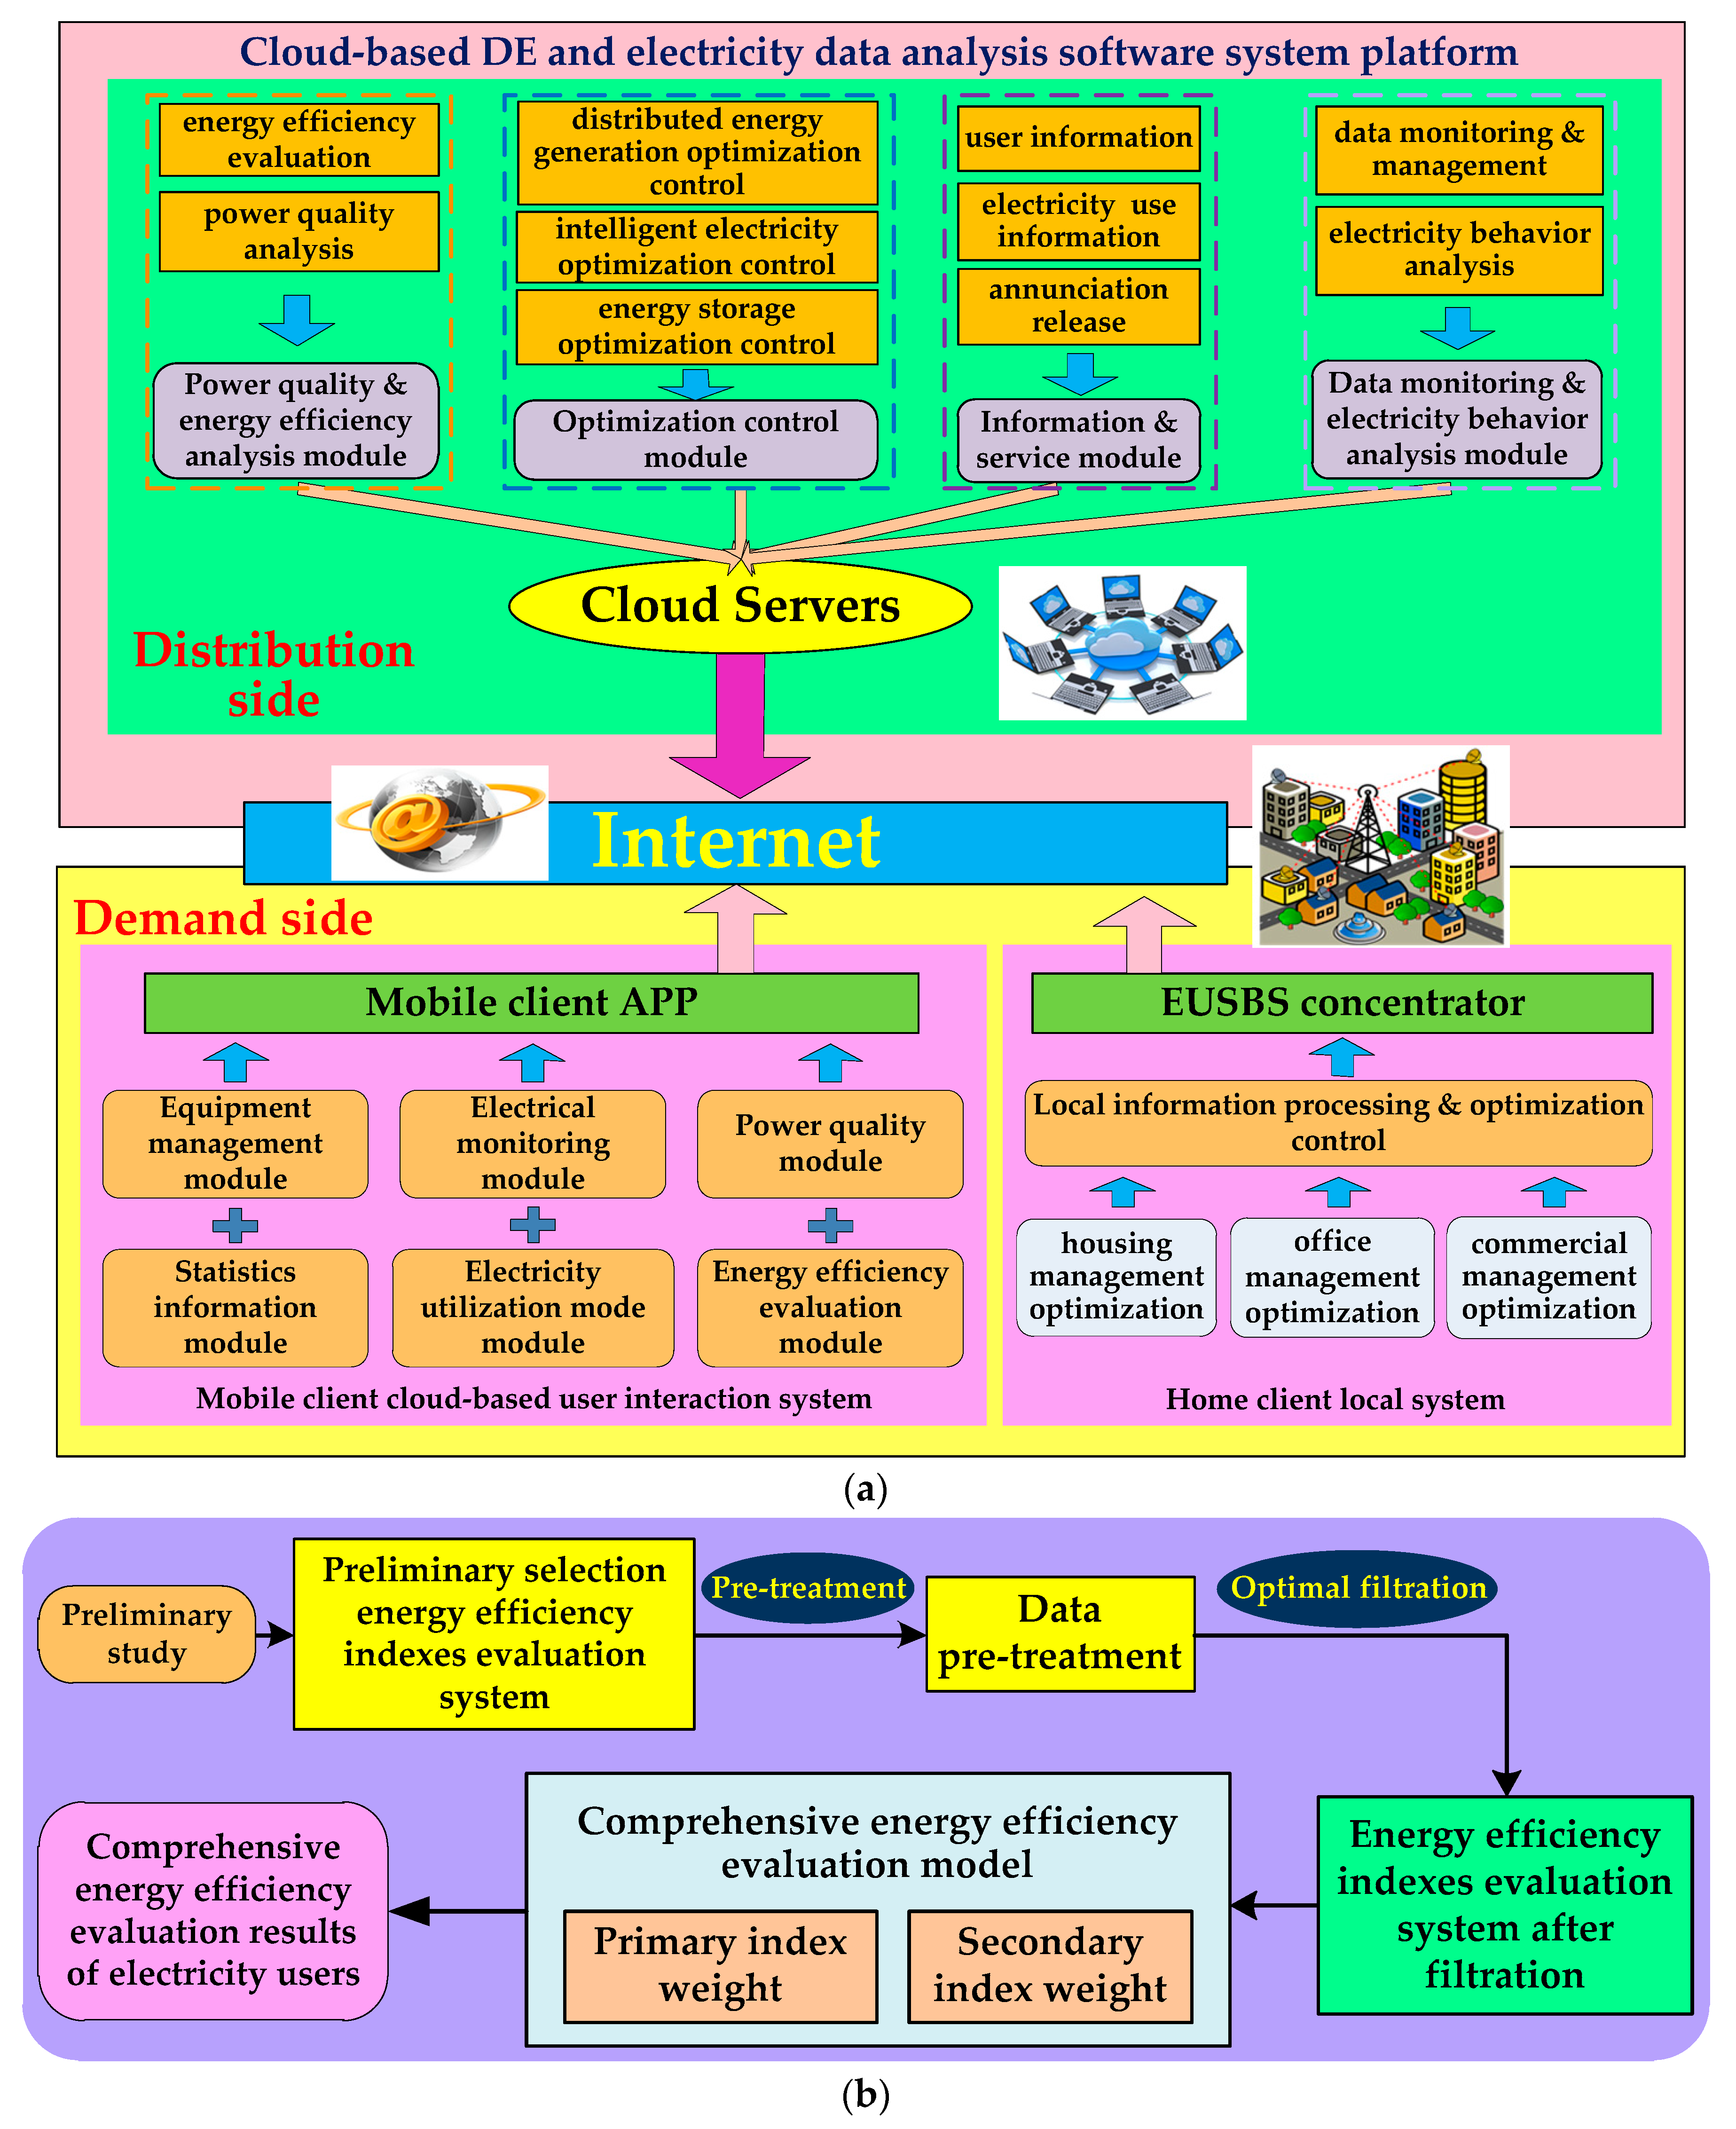
4.1. Framework Design

The software part of EUSBS is designed as a cloud-based DEE and electricity data analysis software system platform, which is applied on both distribution side and demand side. The framework design of software platform is shown in Figure 9a, where on distribution side, it contains four functional modules which are used for power quality & energy efficiency analysis, optimized control, information & service, and data monitoring & electricity behavior analysis respectively; on demand side we develop a cloud server based UI system mobile client (an APP) and a home client local system. Depending on the internet shown in Figure 9a, a deep information-energy fusion is formed between the distribution side and demand side and moreover, a deep supply-demand interaction between grid and users is achieved. The developed APP acts in concert with EUSBS concentrators, achieving classified management, smart analysis, classified storage, real-time uploading and comparative analysis for the collected electricity information, so each functional module of the software platform (mobile client APP) is briefly introduced as follows.

4.1.1. Power Quality & Energy Efficiency Analysis Module

It is developed to conduct power quality and energy efficiency analysis based on the electrical information collected by EUSBS hardware equipment, and for power quality analysis, which is mainly concentrated on harmonics, voltage deviation and three-phase unbalance, and the evaluations of them are implemented based on the national standards; for energy efficiency analysis, we adopt the AHP (analytic hierarchy process) approach with four steps: (a) establish a hierarchical model to determine the levels of relevant factors according to their attributes; (b) constitute a comparative matrix via the paired comparison method and use the one to nine comparison scale until to the bottom layer; (c) calculate the weight vector and conduct the consistency tests to make sure whether the maximum eigenvector (has been normalized) of the paired comparison matrix required; (d) calculate the combination weight vector and conduct combination consistency tests, after that, judge whether the tests are passed, if are, a decision will be made according to the results of the combination weight vector, if not, we need to reconsider the model in step (a) or reconstruct the paired comparison matrix in step (b) using its large consistency ratios until an ideal decision is made. The energy efficiency evaluation flow is shown in Figure 9b.

4.1.2. Optimization Control Module

It is applied for optimization and control of DEE, including DG of new energy, EV, ESE, and the smart electricity utilization equipment. The optimization and control objectives are divided into smart electricity utilization and DG, and then the former is achieved depending on the coordination with electricity market mechanisms, moreover, the users at the moment autonomously choose electricity utilization modes, including electricity cost saving mode, electricity consumption saving mode and interrupt response mode, respectively corresponding to different levels of control authority from Grid Corporation agreed by users for their controllable loads. The interactive response flow for smart electricity utilization is shown in Figure 9c.
Figure 9c shows that the controllable loads are determined by users according to the acquired control commands; meanwhile, users’ electricity utilization behavior and habits are obtained by the software platform via statistics, inductions and reinforcement learning. After that, the segments of controllable time are determined, as well as day-ahead dispatching plans and real-time scheduling strategies. Users’ behavior are acquired based on massive data mining and analysis and which are timely applied in strategies making by software platform, after that, the strategies are executed via feedback to hardware part of EUSBS. Before the behavior and habits of users are noticeably determined, the users will temporarily decide the segments of controllable time for loads by themselves, and the decisions are transmitted to grid as a dispatching plan basis over the mobile client APP or household concentrators.
The smart algorithms for optimization and control in software platform are coded by Matlab and called via a Java-Matlab-based mixed program, and the algorithms include:
(a)
MGSO [62,63,64]. It is based on a finder-searcher model, possessing a high efficiency regarding high-dimension multimodal optimization issues, so it has a broad application prospect in Pareto multi-object dynamic optimization field.
(b)
TOPSIS-Q(λ) [65]. It combines the improved TOPSIS (technique for order preference similar to an ideal solution) algorithm in terms of multi-objective decision and the multi-step backtracking Q(λ) algorithm about random optimization ability, so that it is remarkably applied in solving of real-time dynamic control issues of active loads.
(c)
TRL [66,67,68,69]. It is a novel algorithm based on a high integration of multi-agent collaboration, reinforcement learning and transfer learning in term of an efficient information utilization of historical optimization tasks, perceptibly can be applied in field of fast dynamic optimization of active loads.
Particularly, besides the above smart algorithms for optimization and control of DEE, the management of DEE is essential, so a framework of which is designed as shown in Figure 10.

4.1.3. Information and Service Module

In this module the MySQL database is applied for information management and the socket communication technique (SCT) is used for user communications and information release. The user information contains user electricity account, user equipment and topology of corresponding nodes, while the last one is used as network structure information for smart electricity optimization and dispatching. In addition, the SCT is used to release some warning information of security, power outage, peak load, electricity bill and energy-saving benefit statistics of electricity optimization, etc.

4.1.4. Data Monitoring and Electricity Behavior Analysis Module

This module is applied for data storage and processing, part of which are collected by EUSBS in a high frequency reaching a minute- or higher level, in a background cloud server, to generate the real-time data monitoring curves and user electricity utilization data statistic charts. The data collected by smart socket and EUSBS concentrator are stored in cloud server, and the acquisition time interval is adjustable (1–60 s). Moreover, the module carries out deep data mining to acquire typical electricity utilization behavior of users, so as to provide data supports for load control.

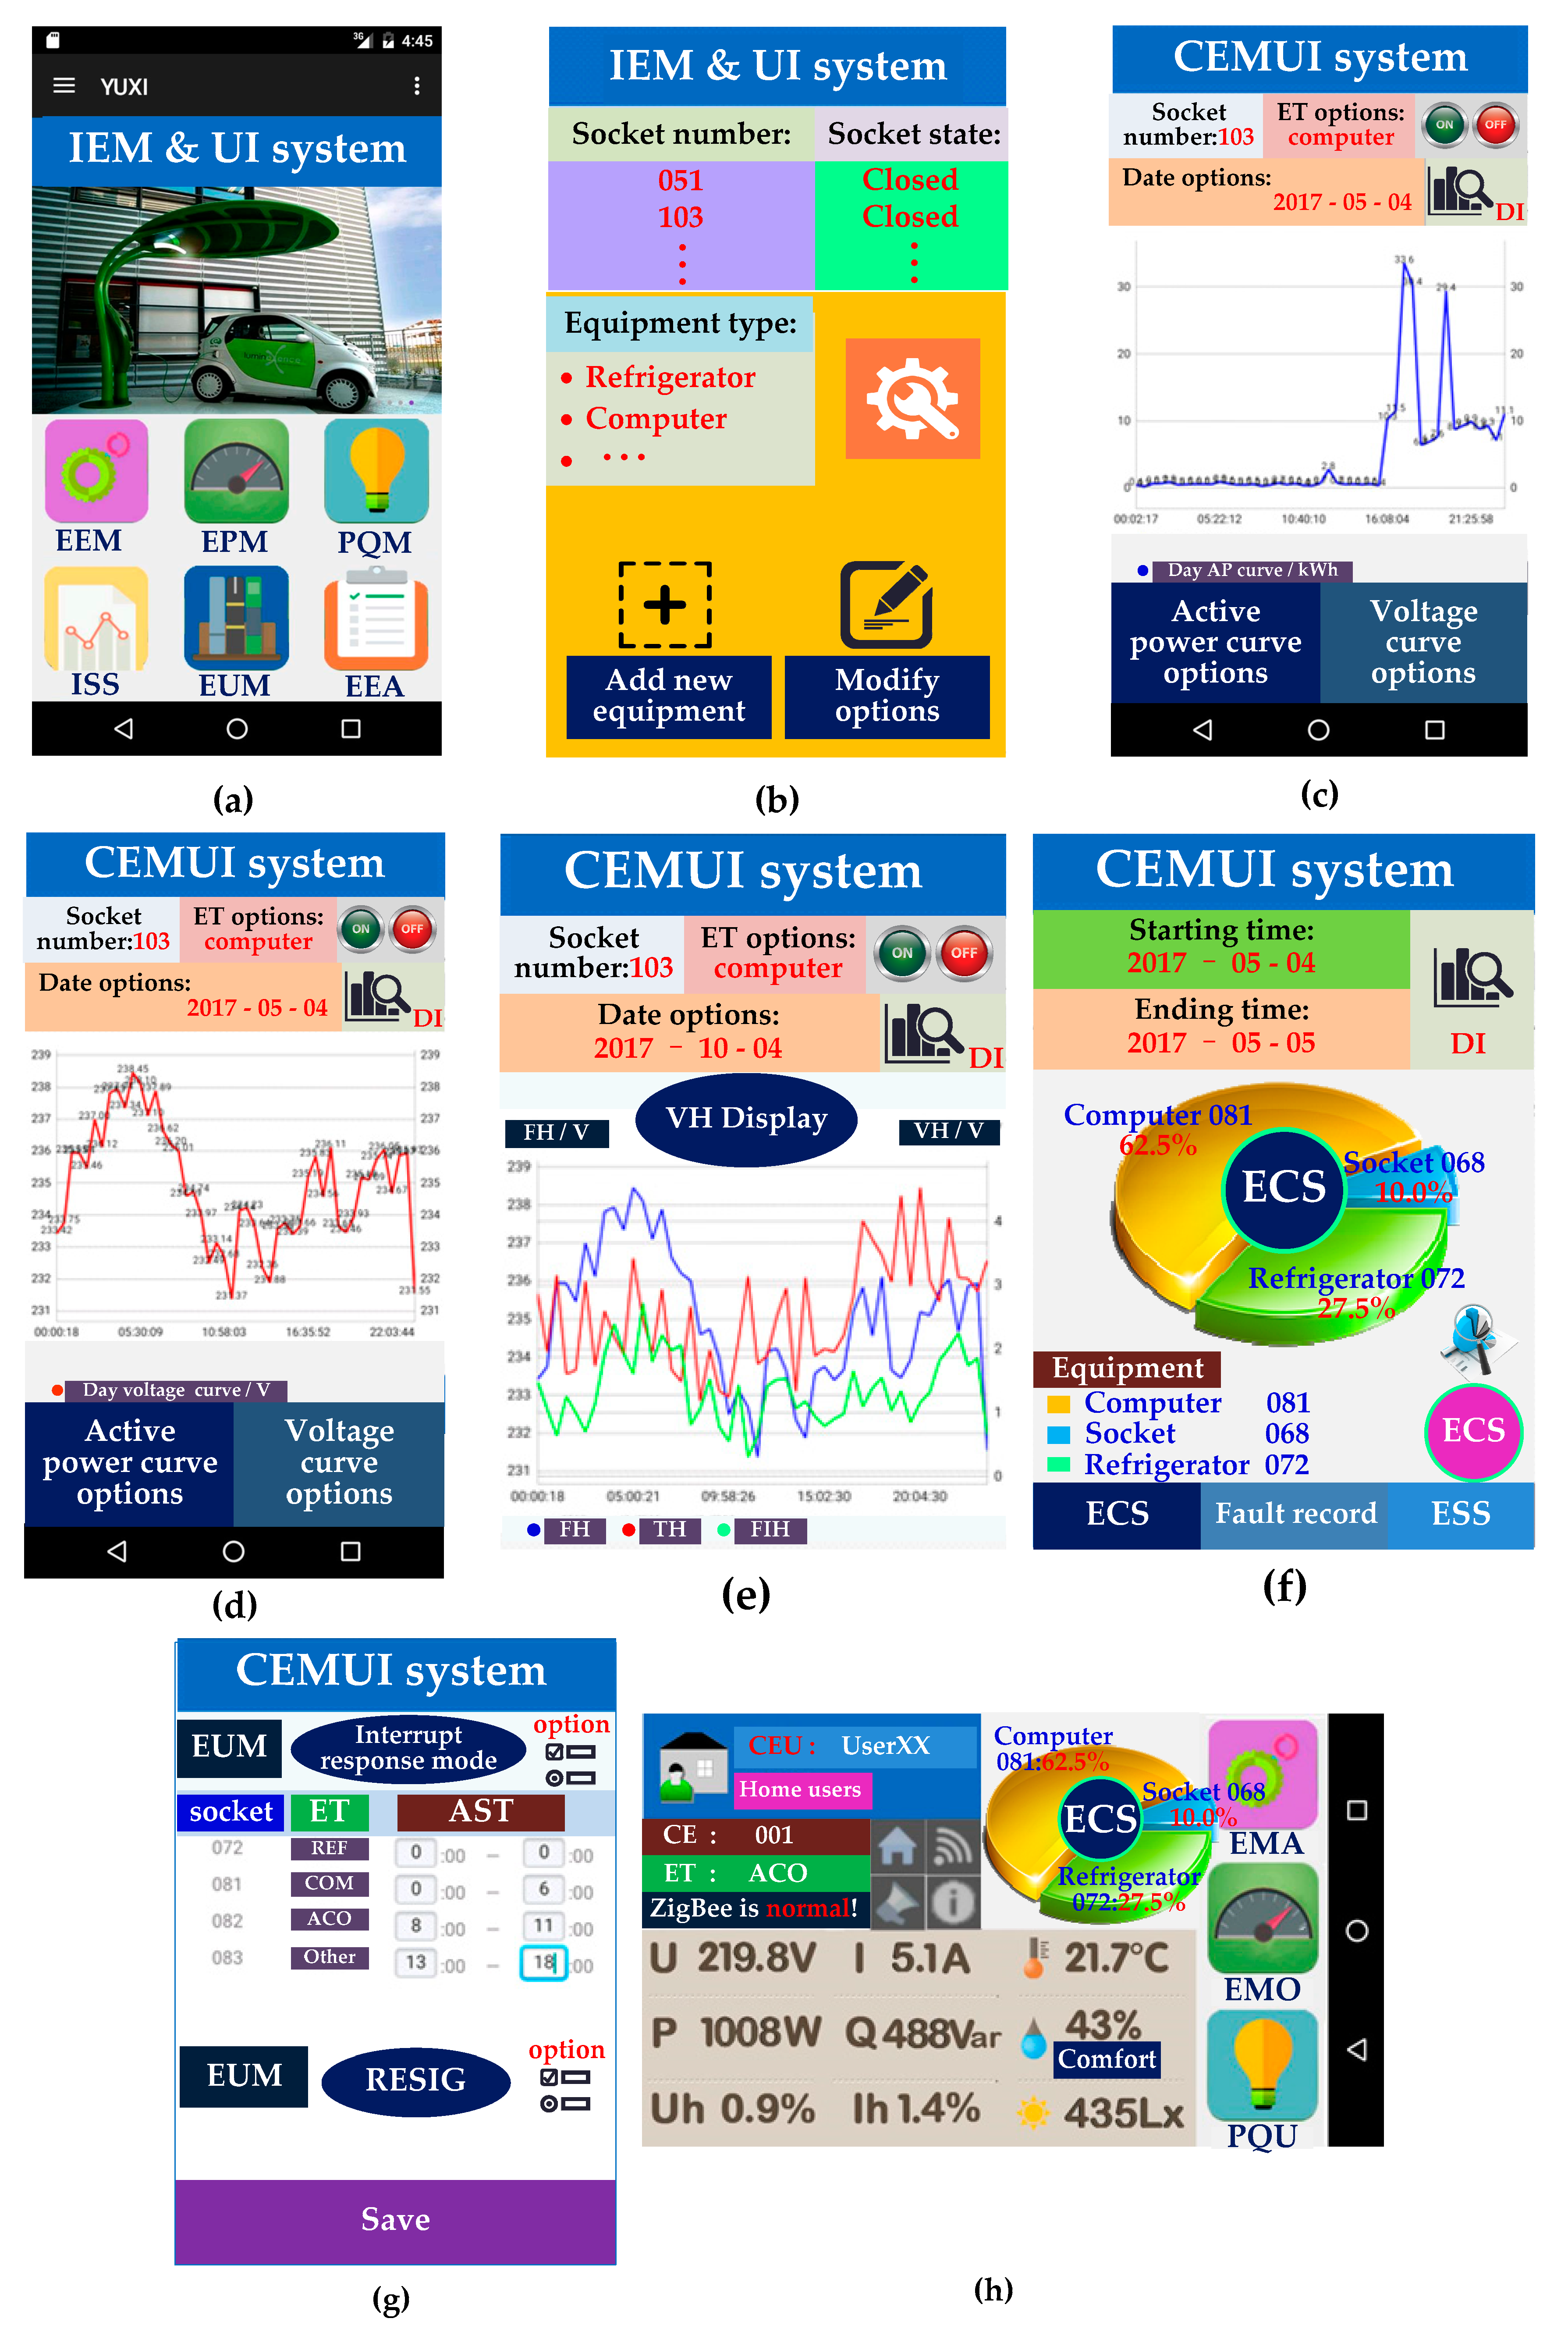
4.2. Software Interfaces Development

The software on smart model terminals is a cloud-based user interaction (UI) client APP, which is developed as a front-end display to interact with users. The programs of data computing and storage are executed in background cloud server. The APP is a comprehensive energy management and UI system (short for CEMUI system), which contains six parts in its main interface: EEM, EPM, PQM, ISS, EUM and EEA and is shown in Figure 11a, besides, the other main functional interfaces of the APP are shown in Figure 11b–h. Among these, Figure 11a shows the system’s Android client application homepage, which is an APP facing to the electricity users. In the main interface of the APP, the main functional modules include energy and equipment management (EEM), electrical parameters monitoring (EPM), power quality monitoring (PQM), information stabilities service (ISS), electricity utilization mode (EUM), and energy efficiency assessment (EEA). The main function of this APP is to provide users with brief electricity consumption information to help them manage their own electrical equipment and distributed power supply. It communicates with the monitoring devices and the cloud platform server to realize the control and management of user’s own equipment and the acquisition of power consumption information.
Figure 11b presents the equipment management module interface, which is mainly used to realize the basic state view of all monitoring devices that are belong to the current user, including the monitoring device’ number type and opening and closing status. In this figure, the current monitoring devices are smart sockets, for example, the number 51 and number 103 sockets are both in closed states currently; in addition, new equipment types can be added for monitoring, including refrigerator, computer, air conditioning, etc., and for these monitoring devices already belonging to the current user, the corresponding type parameters can be modified; note that in the software, the current user only has permission to modify and control the monitoring devices belonging to his own user name.
Figure 11c,d demonstrate the day active power curve and day voltage curve interfaces, respectively. In Figure 11c, the monitoring equipment is a computer which is connected to a smart socket numbered 103. Its active power curve and day voltage curve on 4 May 2017 can be seen in Figure 11c,d, respectively. The monitoring data of the computer on this day will be stored in the back-end database of the server. When the user needs to view, the user can obtain the desired statistical data of a certain time interval via the APP, which can generate intuitive statistical charts as shown in Figure 11c,d. Through these charts, we can obtain the moment when the maximum active power of the current device occurs, as well as its voltage fluctuations.
Figure 11e presents the voltage harmonic curves interface, in which the current monitoring device is still a computer that is connected to a smart socket numbered 103, and its voltage harmonic information on 4 October, 2017 can be viewed, including the fundamental harmonic, third harmonic, and fifth harmonic. Through these voltage harmonic statistics, we can clearly understand the current power quality situation.
Figure 11f demonstrates the information statistics module interface. In this interface, the statistical time is started from 4 May to 5 May 2017, and the current monitoring equipment include a computer numbered 81, a smart socket numbered 68, and a refrigerator numbered 72, and they occupy 62.5%, 10%, and 27.5% of power consumption within this day, respectively.
Figure 11g presents the electricity utilization mode customization interface, which enables optimization and control the selected monitoring devices. By selecting the corresponding power consumption mode, for example, the electricity-saving mode and response to interruption mode, among them, the former is the simplest approach to optimizing the power consumption of home appliances. However, this mode cannot reduce amount of household electricity consumption, thus it is a non-energy-saving electricity consumption response mode. At this point, the user comfort will not be affected. Hence, it is an electricity price based optimization mode for transfer-type loads, and the optimized electric appliances include washing machine, clothes dryer, vacuum cleaners, and water heaters. In contrast, the response to interruption mode is a two-way interaction demand response based on incentives, under which the user responses to the incentive information issued by the power company. The user will stop the operating appliances within the incentive period.
Figure 11h shows the home client local optimization and control system interface. In this figure, a comprehensive local optimization result can be seen clearly by the userXX, which shows that the number of current equipment is 001, the equipment type is air-conditioning, the communication mode is ZigBee and it is normal in current state. Besides, the voltage, current, active power, reactive power, voltage harmonic, and current harmonic are 219.8 V, 5.1 A, 1008 W, 488 Var, 0.9%, and 1.4%, respectively. Simultaneously, the current temperature is 21.7 °C, the user comfort is 43%, and the illumination is 435Lx. In addition, we can check the information of statistical electricity use and saving amount in the selected time period by choosing the start data and end date of the query in this interface.
Note that the abbreviations in the interfaces are just used in Figure 11 for a clear reading, and among which, ET means equipment type, AP means active power, DI means data inquiry, FH means fundamental harmonic, TH means third harmonic, FIH means fifth harmonic, VH means voltage harmonics; REF means refrigerator; COM means computer; ACO means air-conditioning; RESIG means residuary electricity sent into grid; CE means current equipment.

5. Application Study

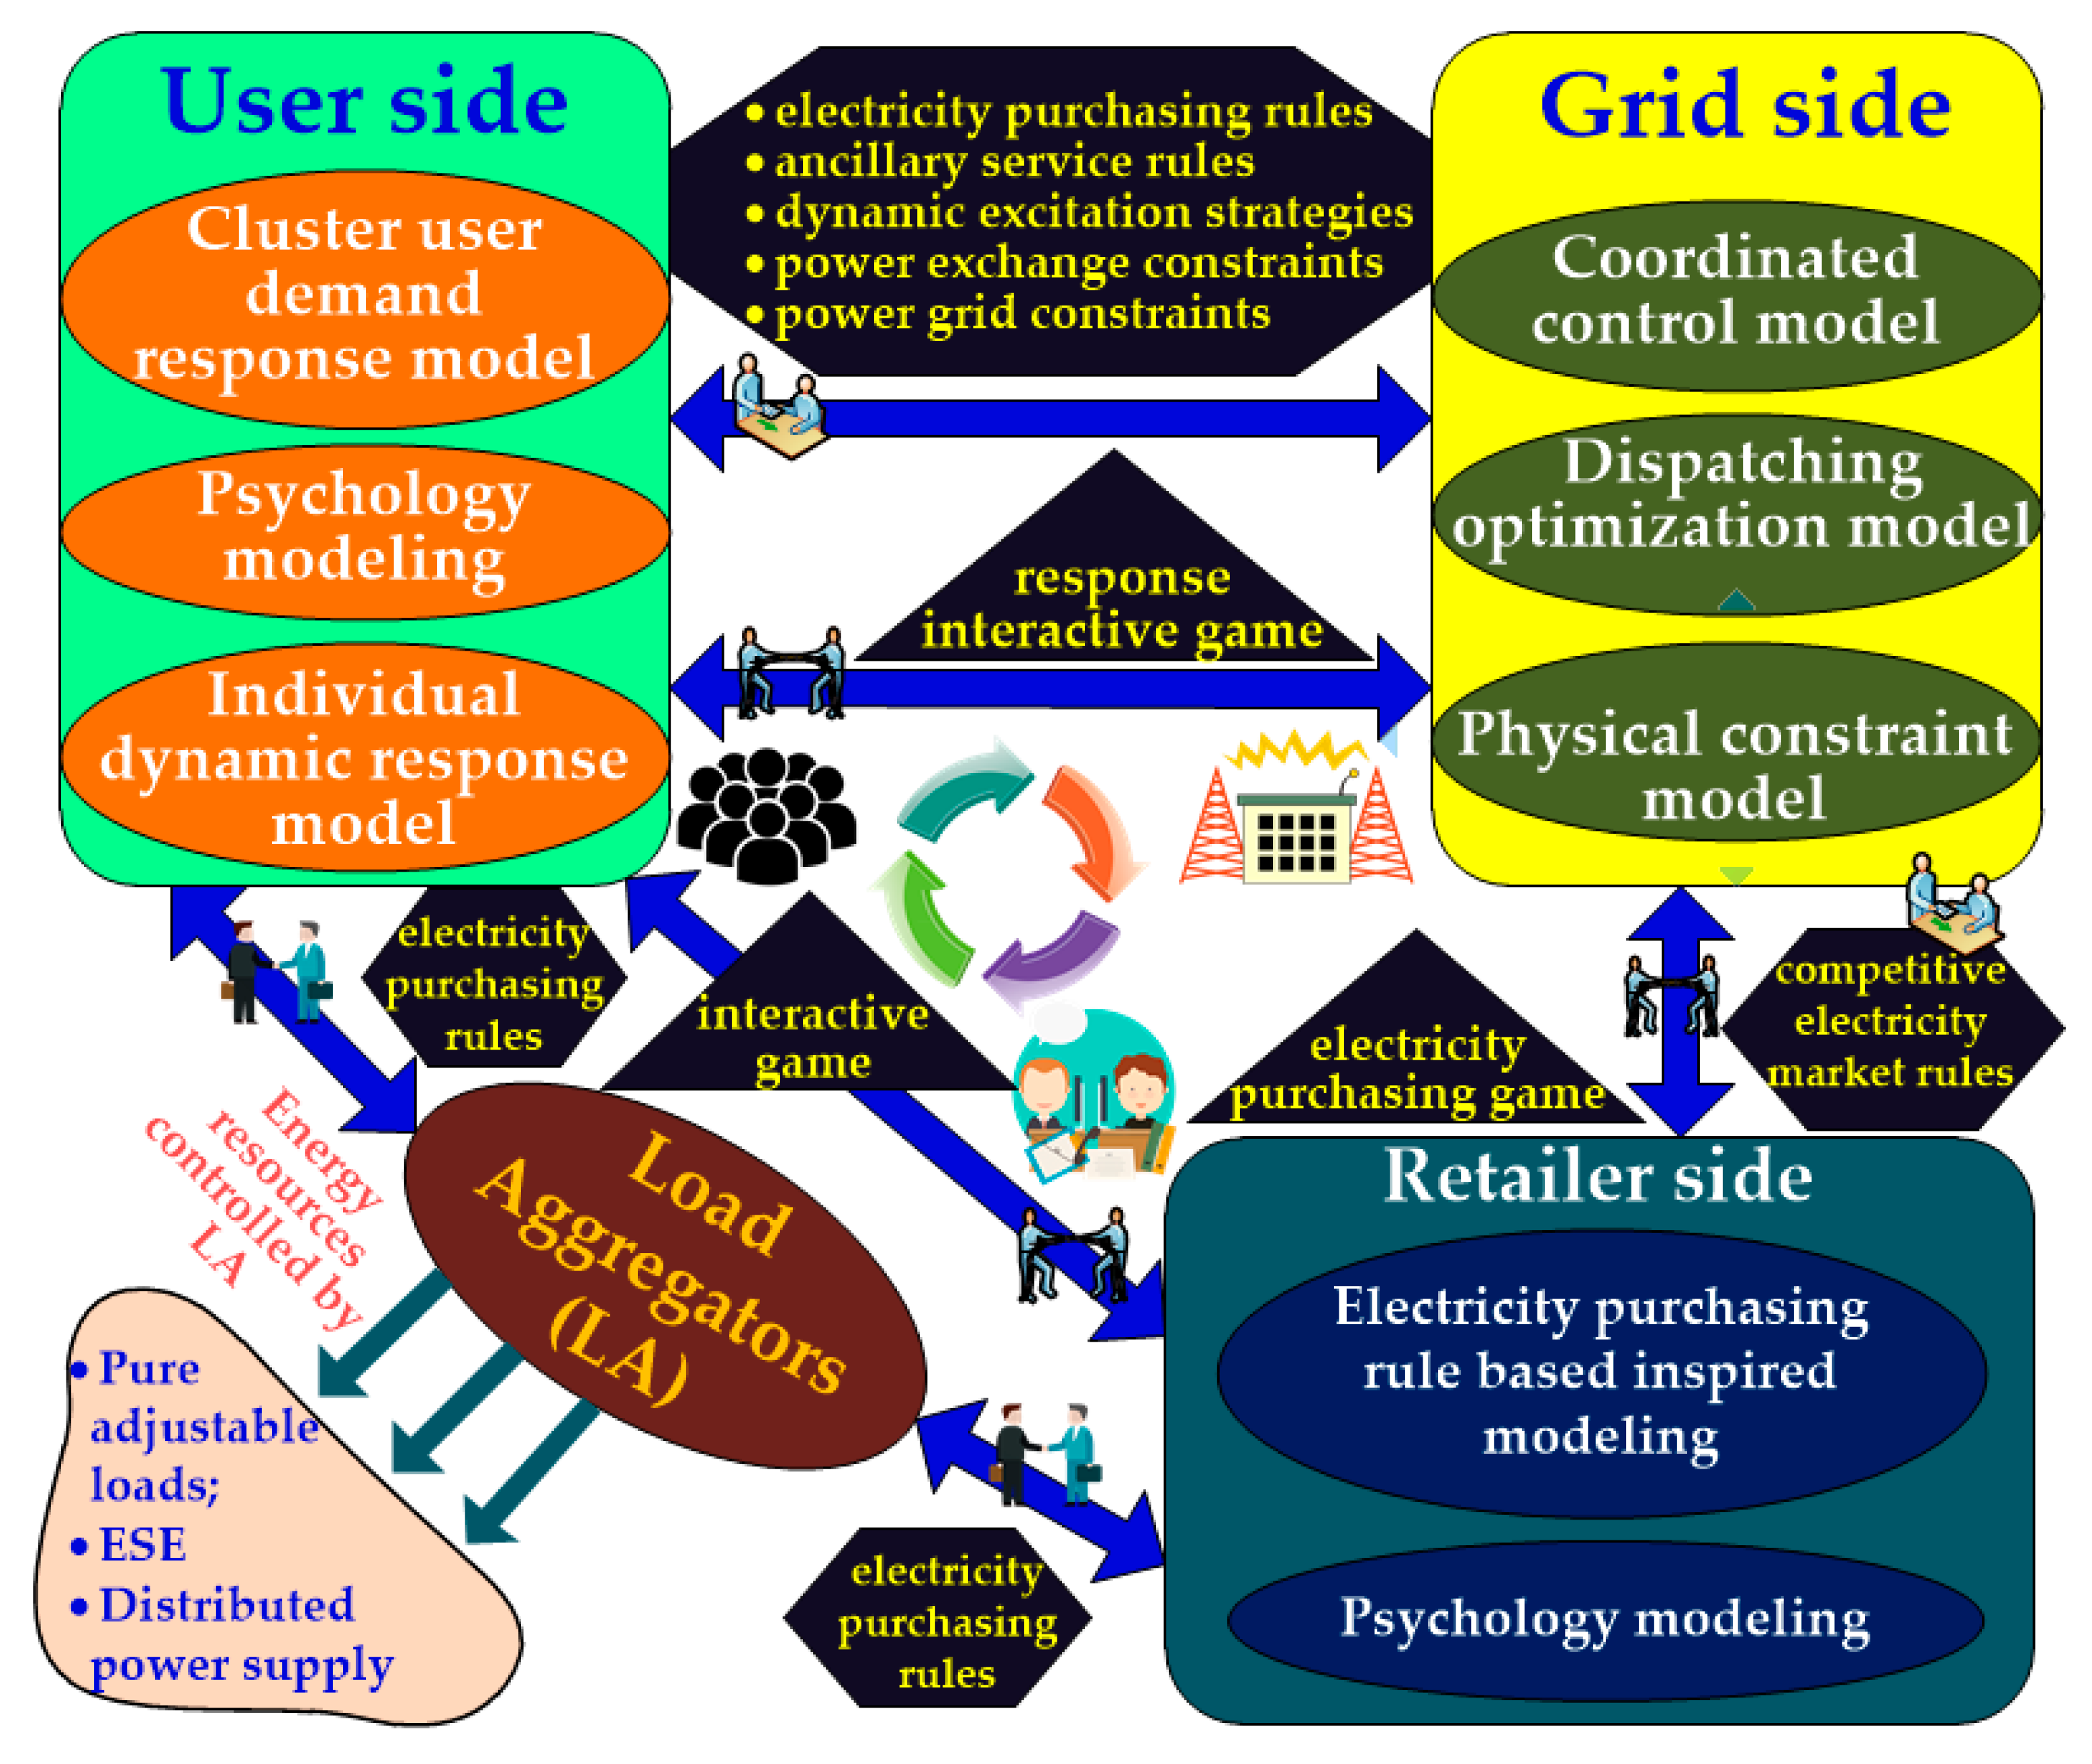
5.1. Friendly Interaction Game Mechanism between Grid and User

We develop the EUSBS based on internet technologies to achieve a friendly supply-demand interaction between grid and user, in which, the grid and user are treated as the cooperative game objectives. When we take the electricity retailers into consideration, the game between grid and user is changed into a grid-user-retailer cooperative game, at the moment, we can divide it into a two-layer two-person cooperative game, that is, the grid-retailer game and retailer-user game, in the latter case the grid can also be treated as a kind of retailer. After that conversion, the game input includes: (a) the Pareto frontier of the objectives of grid-side peak load shifting and retailer-side electricity purchasing cost, and (b) grid-side and retailer-side objective function values with different strategy combinations of costs and plans of electricity purchasing; the game output contains the optimal price strategies and plan strategies of electricity purchasing.
When the retailer is not considered, the game input is just the objective function values of grid-side and user-side with different action strategy combinations on the required Pareto frontier; and the game output is the optimal Nash equilibrium, that is the optimal incentive price strategy and electricity utilization plan strategy. The principle framework is designed in Figure 12 for the cooperative game between grid and user and meanwhile taking the retailer and load aggregation corporation into account.
Based on Figure 12, the study for multi-player interactive game contains three steps: (a) use the affective learning and reinforcement learning to simulate trilateral behavior features in electricity interaction process; (b) use dynamic game theory to divide the trilateral game into a two-layer game model, including the grid-retailer game and the retailer-user game; (c) use multi-agent reinforcement learning to solve Nash equilibriums or Pareto solutions of trilateral dynamic game.

5.2. A Case for Building Energy Management

The process of building energy management based on EUSBS is briefly illustrated as follows. First, in the day-ahead stage, the electricity use data of controllable equipment in the building is uploaded to the cloud server via the EUSBS based on artificial establishment. In addition, users’ requirements for comfort can also be uploaded to the cloud server via the EUSBS. Then, according to the uploaded data of electricity use, the server carries out building energy calculations via data mining and cloud computing, in order to optimize the day-head output scheduling of equipment, such that the output scheduling instructions of all categories of equipment can be obtained. Thereby these output scheduling instructions are sent to the EUSBS for storage. Finally, at the time of the day, the energy USB concentrator will give these control instructions to equipment at the appropriate time to achieve coordination and control of the equipment, so as to reduce the operation costs of the building. In this process, the ultimate goal of comprehensive energy dispatching and optimization for the building is to achieve the minimum total operation cost in an operational cycle. In this section, we first establish the building equipment model, including a combined cooling heating and power (CHP) model, a fuel cell model, an electric boiler model, a storage battery model, and room temperature control system model. Then, we determine the objective function, namely minimizing the total operation cost, as depicted earlier. In addition, the relevant constrained conditions should be taken into account, including electric power equilibrium constraint, heat power balance constraint, power interaction constraint, controllable units’ constraint, and storage battery constraint. Based on the established model, objective function and constrained conditions, a comprehensive commercial building is selected as the control and optimization object to carry out a case study.

5.2.1. Building Equipment Models

Combined CHP model: in this paper, the CHP model is composed of gas turbine and bromide-refrigerator. Among them, the gas turbine burns natural gas to produce electric energy and waste heat of flue gas, in which the waste heat of flue gas cannot be used directly. It must be used by the conversion of bromide-refrigerator. For the gas turbine, its output power and output waste heat o flue gas are demonstrated [70,71] as:
C fuel ( t ) = C ng Q LHV P mt ( t ) η mt ( t ) Δ T
Q mt ( t ) = P mt ( t ) ( 1 η mt ( t ) η L ) η mt ( t )
where Cfuel(t) is the fuel cost of miniature gas turbine at time period t, yuan (the monetary unit of China); Cng is the unit price of natural gas, yuan/m3; QLHV is the lower heat quantity value of natural gas, kWh/m3; Pmt(t) is the output power of miniature gas turbine at time period t, kW; ηmt(t) is the power efficiency of miniature gas turbine at time period t, %; Δt is the unit time period, hour; Qmt(t) is the waste heat of flue gas, kW; ηL is the radiation loss rate, %.
Bromide-refrigerator absorbs the waste heat from the gas turbine and then converts it into heat energy. The relationship between its input and output is presented [71] as:
Q mt - h ( t ) = Q mt ( t ) η h C OPh
where Qmt-h(t) is the heat capacity of bromide-refrigerator, kW; COPh and ηh are coefficient of heating performance and recovery rate of flue gas of bromide-refrigerator, respectively, %, %.
Fuel cell model: fuel cell is a device that uses natural gas as primary energy, and has high power generation efficiency. The gas turbine is equipped with fuel cells to make up for the shortage of its generation capacity. The output power of fuel cell [71] is shown as:
C fc ( t ) = C ng P fc ( t ) Δ t η fc ( t ) Q LHV
where Cfc(t), Pfc(t) and ηfc(t) are fuel cost, generated power and generating efficiency of fuel cell at time period t, respectively, yuan, kW, %.
Electric boiler model: electric boiler is a kind of heat-producing equipment. It produces heat energy by consuming power energy for the heat energy demand of the building, in order to prevent the case in short heat load supply when only CHP system used for heat supply. The output power of electric boiler [71] is demonstrated as:
Q eb ( t ) = P eb ( t ) η eb
where Peb(t) and Qeb(t) are the power consumption and heating power of electric boiler at time period t, respectively, kW, kW; ηeb is the efficiency of electricity transforming to heat of the electric boiler, %.
Storage battery model: by charging and discharging electric energy timely, the storage battery can realize the decoupling of electric energy in time. The storage capacity and charging and discharging power of the battery [70] meet the following relations:
E ( t ) = { E ( t 1 ) ( 1 δ ) + Δ T P ch ( t ) η ch , when charging E ( t 1 ) ( 1 δ ) Δ T P dis ( t ) η dis , when discharging
where E(t) is the total power of battery at time period t, kWh; δ is the self-discharge rate of battery with a very small value, %; Pch(t) and Pdis(t) are charge and discharge power of battery, respectively, kW, kW; ηch and ηdis are charge and discharge efficiency, respectively, %, %.
Room temperature control system model: room temperature control is performed mainly based on the electric boiler and CHP coefficient, by controlling the power of this equipment. According to the time-section discrete processing method, as well as the ambient temperature and building parameters, the room temperature control model can be established via the principle of thermal balance [72,73,74,75] as:
T H ( t + 1 ) = e 1 / ( R C ) T H ( t ) + R [ 1 e 1 / ( R C ) ] Q H ( t ) + [ 1 e 1 / ( R C ) ] T out ( t )
where R is the room heat resistance, °C/kW; C is the thermal capacity of the room, kWh/°C; Tout(t) is the ambient temperature at the moment t, °C; QH(t) is the room temperature regulating thermal power, kW.

5.2.2. Objective Function and Constrained Condition

The comprehensive energy model of the building proposed in this paper is solved with the goal of overall economy. According to the electricity prices released by Power Company, this built model is employed to optimize the output of the controllable resources. Meanwhile, we introduce room temperature constraint to ensure the requirement of the human body to the comfort of the interior of a building. Hence, the objective function of the building’s comprehensive energy dispatching and optimization model is the minimum of total operation cost in an operational cycle T, namely:
min   f = t T [ C fuel ( t ) + C fc ( t ) + C ex ( t ) ]
C ex ( t ) = P b ( t ) × price b ( t ) × Δ T P s ( t ) × price s ( t ) × Δ T
where Cex(t) represents the interaction cost among the building and operator at the moment t, yuan; Pb(t) and Ps(t) are the electrical energy purchased and sold to the power grid by the building, respectively, kW, kW. priceb(t) and prices(t) are the day-ahead selling price and purchasing price of electricity at the moment t released by the power company, respectively, in yuan/kWh, yuan/kWh.

5.2.3. Constrained Conditions

Aiming at the objective function above, the relevant constraints are demonstrated as follows.
(a) Electric power equilibrium constraint:
P s ( t ) P b ( t ) = P mt ( t ) + P fc ( t ) + P dis ( t ) P ch ( t ) P eb ( t )
(b) Heat power balance constraint
This constraint depicts the balance between heat dissipation power of the building itself and heat producing power of equipment, which ensures that the room temperature of building is maintained in a comfortable temperature range. Hence, this constraint is presented as:
Q eb ( t ) + Q mt - h ( t ) = Q H ( t )
(c) Power interaction constraint
This power interaction between building and power grid is subject to the upper limit of electric power transmission of the contact line, namely:
| P i . s ( t ) P i . b ( t ) | P line . max
where Pline.max is the upper limit of electric power transmission of the contact line, kW.
(d) Controllable units’ constraint
The controllable units in this paper include electric boiler, gas turbine, and fuel cell. The output range of them is:
P d . min P d ( t ) P d . max
where Pd.min and Pd.max are the upper and lower limit of output of the controllable unit d, kW, kW. Pc(t) is the output power of the controllable unit c at the moment t, kW.
(e) Storage battery constraint
The storage battery should meet the capacity constraint, and the charge and discharge constraints as:
E min E ( t ) E max
P v . min P v ( t ) P v . max
E ( T ) = E ( 0 )
where Pv.min and Pv.max are the upper and lower limit of the charge and discharge power of battery, respectively, kW, kW; Pv(t) is the power of charging or discharging of battery at the moment t, kW; Emin and Emax are the upper and lower limit of battery capacity, kWh, kWh; E(t) is the storage capacity of battery at the moment t, kWh.

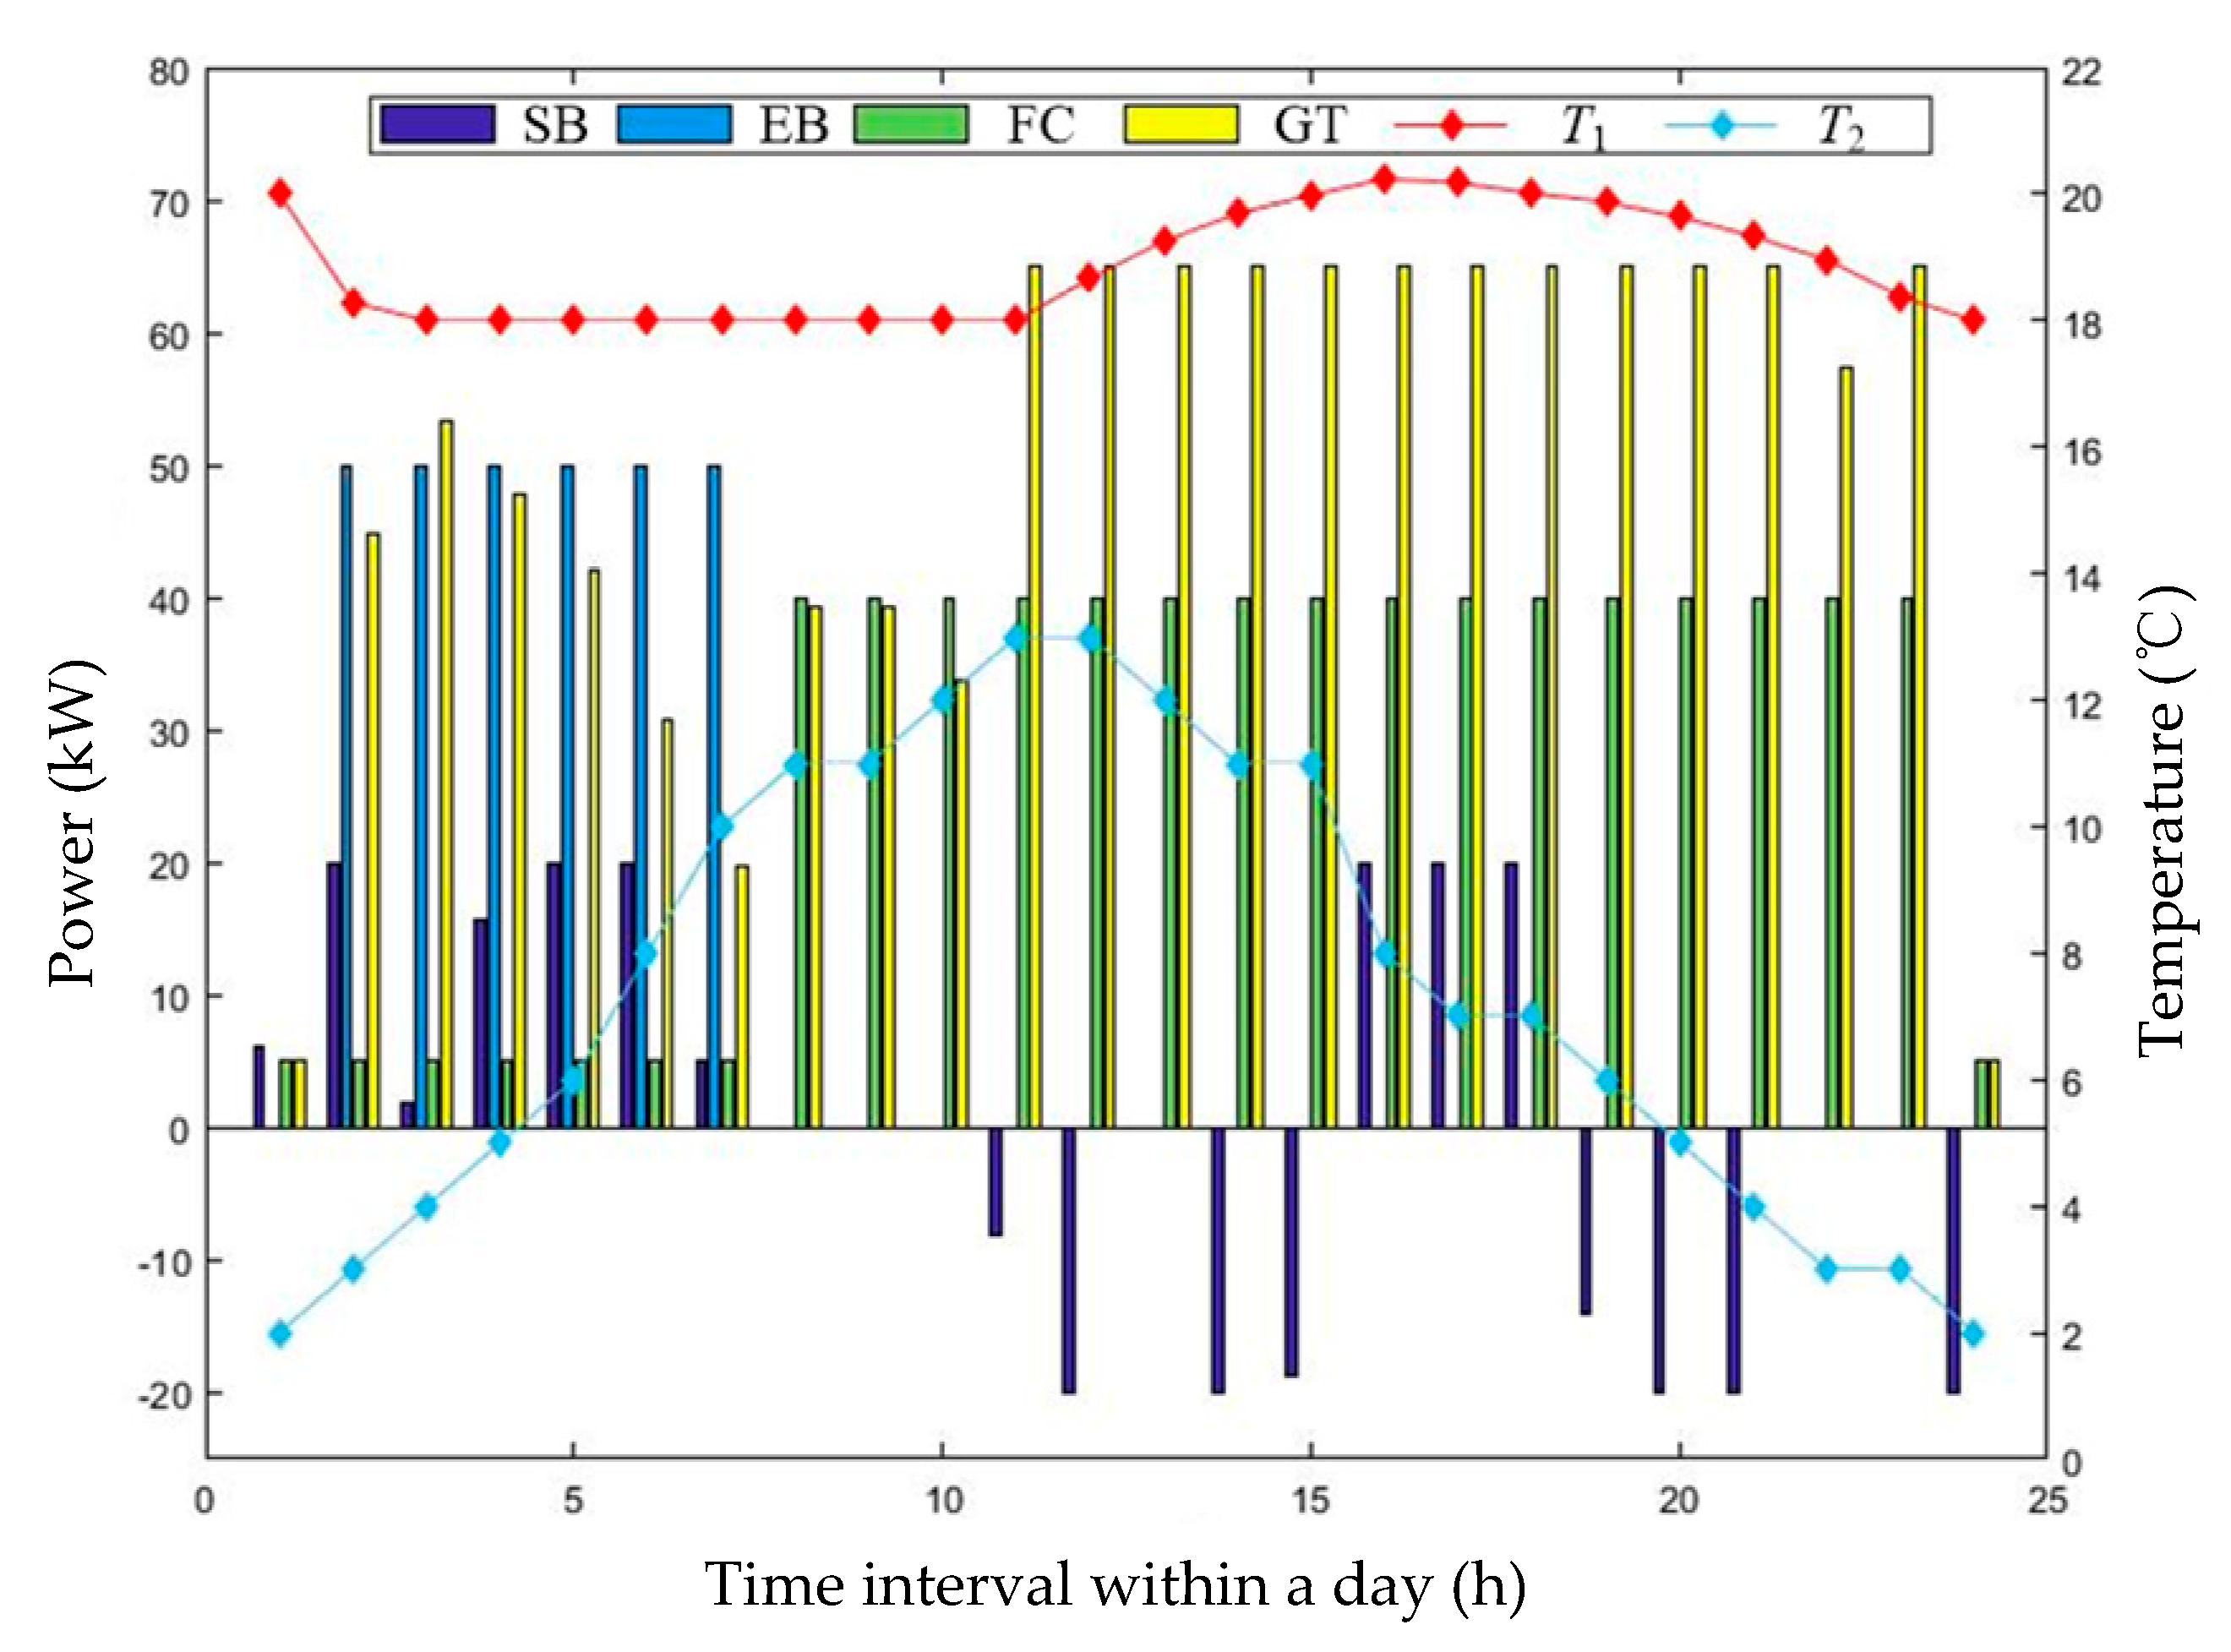
5.2.4. Case Analysis

Based on the EUSBS developed in this paper, as well as the mathematical model of building energy management presented above, we select a certain comprehensive commercial building [76,77] in winter from a city located in the south of China as the research objective for building energy control and optimization analysis. In this case study, the background is winter, thus the room temperature of this building is required to reach to 20 °C, with the maximum allowable deviation of 2 °C [77]. The ultimate calculation result of equipment output and temperature variation of this building is illustrated in Figure 13 as follows.
As shown in Figure 13, the heating source of this building is electric boiler and gas turbine. The output scheduling instructions for the distributed equipment in the building will be sent to the EUSBS for storage. Now, according to Figure 13, these instructions can be made for each period of time as follows.
In the 0–7 periods of time, the heat dissipation amount of this building is relatively large, due to the greater temperature difference between indoor and outdoor. Hence, the electric boilers with better heat effect at this point become the main heat source of the building, and these electric boilers are in full output status. However, at this time, if we simply rely on the electric boilers for heat supply, it is obviously no satisfied with the demand for the heat of this building, so the gas turbine is also needed to assist the heat until the heat demand is met. Although the generation cost of gas turbine is higher than that of electricity purchasing from power grid, due to the large heat dissipation amount at this time, the gas turbine still outputs part of its power to maintain the room temperature, even though its operation cost is relatively high. It can be seen from Figure 13 that, the thermal power generated by gas turbines is just satisfied with the minimum requirement of room temperature. This can minimize losses at the request of room temperature. At this time period, the price of electricity selling of power grid is low, so the battery will charge a lot amount of energy, so as to reduce the electricity purchased from grid by the building in later periods of time, which is conducive to economic operation.
In the 7–10 periods of time, the heat demand of building is not very high, thus gas turbines are enough to meet its demand. Moreover, these periods of time belong to the normal periods, during which the electricity purchase price of power grid is higher than the generation cost of gas turbines, thus gas turbines can earn some profits by selling electricity to the power grid under the condition of meeting the demand of electricity. Although the more the gas turbine generates at this time, the more benefits are obtained, the gas turbine does not show full output status. This is because the electricity purchase price is higher in later periods of time, so the current power output by gas turbine is mainly used to maintain the minimum requirement of room temperature, leaving more space for power generation for the later periods of time. If too much electricity is generated at this time, the room temperature will rise and deviate from the minimum requirement. In this way, due to the upper limit of room temperature, causing the generation space of gas turbine in later periods will be compressed, such that the gas turbine will not be able to fully output. Moreover, in the later peak period, the electricity price is higher, thus the profit that can be earned is greater than that in the normal period. Therefore, if the gas turbine cannot fully output power, the profit it earns will be relatively less.
In the 10–15 periods of time, these periods belong to peak time periods. At this point, the gas turbine maintains full output, and sells more electricity as much as possible to get a higher profit while meeting the demand of electricity use. At the same time, the room temperature is also increasing, but is has not exceeded the upper limit. This is due to the reasonable arrangement of the output of each turbine in the preceding period, so that the gas turbine can obtain the maximum benefit and meanwhile the room temperature will not exceed the upper limit. The battery is in discharge state at this time period, and it is used to transfer the electric energy charged during the valley period to the peak period for use, such that the operation cost of the building is reduced.
The 15–18 periods of time belong to normal time periods. At this time, the gas turbine is still in full state, so as to get maximum benefit. However, as the temperature difference between the building and outside the building is increasing gradually, the heat dissipation amount of the building is increasing gradually as well. Although the gas turbine is in full state, the temperature inside the building will not be higher than the upper limit, but it is falling. Because the room temperature still meets the requirements during this period, the electric boiler is not running, ensuring the lowest operation cost of the building while meeting the requirements of operation. The battery is in charge state currently, so as to reduce the demand for power in the next peak period.
In the 18–23 periods of time, these belong to peak time periods, during which the battery discharges in order to reduce the operation cost. The gas turbine is in generation state at this time, and it improves the income of electricity sale in the case of electricity consumption, while reducing the downward trend of room temperature, ensuring room temperature is still within the required range in this period.
In the 23–24 periods of time, these belong to valley periods. At this time, the power of gas turbine is in the lower limit. This is because the prices of electricity purchasing and selling of the power grid are both lower than the generation cost of gas turbine at present. If gas turbines generate at this point, they can only increase the operation cost of building, without any other use. As for fuel cells, it is unnecessary to consider the effect of them on the room temperature because they do not generate heat. It is said that fuel cells are relatively independent units between time and time periods. In the valley period, the price of electricity sale or purchase of the power grid is lower than the power generation cost of fuel cells. However, in the normal or peak period, this will be higher than the power generation cost of fuel cells. Hence, the power of fuel cell is in the lower limit in the valley period, during which the fuel cell generates less power as possible to reduce the operation cost of the building. While in other periods, the fuel cell is in full output state and generates electricity at maximum power to further reduce the operation cost of the building.
The electricity price of the power grid, gas price of the gas network, the parameters of equipment in the building, and the parameters of the building are presented in Appendix A.

6. Conclusions

Under the background of the E-net, this paper presents a detailed scheme design of the energy universal service bus system (EUSBS) is based on the technologies of E-net, which is composed of a hardware system and a software system platform. Among them, the corresponding hardware development and software system design schemes demonstrated in detail. Moreover, based on the developed EUSBS, an application study is conducted with the purpose of achieving the minimum operational cost of a commercial building in a certain city located in the south of China. The developed EUSBS can provide an idea for intelligent energy management of the buildings. The main contributions can be summarized as follows:
(1)
The hardware part of EUSBS including five kinds of hardware equipment, among which, four of them are used for access of distributed PV, fans, ESE and EVCS respectively, and the last one for real-time electricity equipment monitoring of CRU who have access to the EUSBS. This part provides a unified interface platform for plug-and-play of DEE, together with a local analysis, and in which the advanced smart algorithms are used for users’ data mining to acquire their electricity utilization behavior and habits, as well as the characteristics of electricity equipment. Moreover, it is designed to cooperate with the EUSBS software platform, so we can formulate better strategies of electricity utilization for users.
(2)
The software part of EUSBS is a cloud-based DEE and electricity data analysis software system platform. Based on Java, the platform achieves extremely efficient and fast electrical information data mining and coordinated optimization solution through the call of computing engine of Matlab, in addition, it enables background data read and storage with combination of MySQL database technology.
(3)
The designed EUSBS is as a unified access platform for identification and plug-and-play of distributed energy and equipment, which is compatible with a variety of common wireless communication protocols, as well as realizes integrated energy management and control for users, together with a real-time interaction between user and grid and a unified coordination and control of various distributed energy sources on demand side. EUSBS fully uses internet technologies to complete wide-area coordination between distributed power supply and electrical equipment, so that a transformation of utilization mode from centralized fossil energy to distributed renewable energy is realized.
(4)
Depending on the perfect hardware equipment and the technical support of software system platform, a deep fusion of information-flow and energy-flow is realized to overcome the difficulties in big data collection and utilization of electricity distributing and utilization, so that a deep supply-demand interaction between grid and user is realized, as well as a substantial coordination control and optimization between grid and distributed power supply and electricity utilization equipment.
(5)
The building equipment model has been established for an application study to verify the practicability of the EUSBS developed in this paper. The case study shows that the EUSBS can achieve comprehensive energy dispatching and optimization for the selected building, with goal of minimum total operation cost in an operational cycle.
(6)
The demand of industry, the reform of electricity market, the transformation of energy, and the technologies of big data and artificial intelligence have all been reached a new starting point, which provides a good opportunity for breakthroughs in new energy management technologies. In this paper, in the context of E-net, a new EUSBS facing to the distribution network side and demand side of E-net is investigated. On this basis, in the future, we need to further carry out the following investigations:
(a)
Upgrade the EUSBS hardware devices and software system platforms;
(b)
Focus on home energy management, collect more massive data on home users’ electricity consumption, in order to conduct in-depth analysis and excavation of the user’s electricity behavior and energy efficiency, and establish the electricity optimization and control strategies;
(c)
Focus on the research of real-time response optimization technologies of the user demand-side based on E-net;
(d)
Research on the big data analysis technology, further promote the developed unified identification and plug-and-play interface for the distributed equipment, and focus on wireless communication protocols that can support the EUSBS hardware devices, such that developing more efficient common interface interconnection software for user energy management;
(e)
Further integrate the EUSBS hardware devices, wireless communication protocols, and user energy management common interconnection system software to build a unified distribution network side/demand-side IEM system facing to the E-net.
(f)
Aiming at the developed user IEM system, carry out system application research work and set up the demonstration application project.

Author Contributions

L.C. and T.Y. conducted the survey, that is, the detailed scheme design and investigation of the EUSBS. L.C., T.Y., H.J., W.W., W.X. and J.H. developed the hardware system. L.C., T.Y. and Z.Z. developed the software system platform. L.C., T.Y. and Z.Z. conducted the application study. L.C. wrote and polished the paper.

Acknowledgments

The authors gratefully acknowledge the support of the National Natural Science Foundation of China (Grant. 51477055 & 51777078), and the Key Science and Technology Projects of China Southern Power Grid (CSGTRC-KY2014-2-0018).

Conflicts of Interest

The authors declare no conflict of interest. The founding sponsors had no role in the design of the study; in the collection, analyses, or interpretation of data; in the writing of the manuscript, and in the decision to publish the results.

Nomenclature

Pactive power, kWPd.maxthe lower limit of output of the controllable unit d
Qreactive power, kWPc(t)the output power of the controllable unit c at the moment t
Vsinglesingle-phase voltage, VPv.minthe upper limit of the charge and discharge power of battery
Isinglesingle-phase current, APv.maxthe lower limit of the charge and discharge power of battery
Vthree-phasethree-phase voltage, VPv(t)the power of charging or discharging of battery at the moment t
Ithree-phasethree-phase current, AEminthe upper limit of battery capacity
Pout-totaloutput total power, kWEmaxthe lower limit of battery capacity
PFpower factorsE(t)the storage capacity of battery at the moment t
Cggeneration capability, kVAEUSBSenergy universal service bus system
Uout/Uinputoutput/input voltage, VEUSBenergy universal service bus
Iout/Iinputoutput/input current, AUSBuniversal service bus
ffrequency, HzE-netenergy Internet
Qcelectricity consumption, kWhPVphotovoltaic
Tamambient temperature, °CEVCSelectric vehicle charging stations
Hamambient humidity, %RHEVCPelectric vehicle charging piles
PMamsmoke particulate matter concentration, μg/m3EVelectric vehicle
Cfuel(t)the fuel cost of miniature gas turbine at time period tCRUcommercial and residential users
Cngthe unit price of natural gasESEenergy storage equipment
QLHVthe lower heat quantity value of natural gasDEEdistributed energy and equipment
Pmt(t)the output power of miniature gas turbine at time period tHEMShome energy management system
ηmt(t)the power efficiency of miniature gas turbine at time period tQGEpower generation equipment
Δtthe unit time periodIEMintegrated energy management
Qmt(t)the waste heat of flue gasELANenergy local area network
ηLthe radiation loss rateDGdistributed generation
Qmt-h(t)the heat capacity of bromide-refrigeratorDSMdemand side management
COPhcoefficient of heating performance of a bromide-refrigeratorP2Gpower to gas
ηhrecovery rate of flue gas of bromide-refrigeratorCPScyber physical system
Cfc(t)fuel cost of fuel cell at time period tDPSdistributed power supply
Pfc(t)generated power of fuel cell at time period tEUelectricity utilization
ηfc(t)generating efficiency of fuel cell at time period tDSPdigital signal processor
Peb(t)the power consumption of electric boiler at time period tARMadvanced AISC machines
Qeb(t)the heating power of electric boiler at time period tAPPapplication program
ηebthe efficiency of electricity transforming to heat of the electric boilerMGSOmultiple group search optimizer
E(t)the total power of battery at time period tTOPSIStechnique for order preference similar to an ideal solution
δthe self-discharge rate of battery with a very small valueTRLtransfer reinforcement learning
Pch(t)charge power of batteryUIuser interaction
Pdis(t)discharge power of batteryEEMenergy and equipment management
ηchcharge efficiencyEPMelectrical parameters monitoring
ηdisdischarge efficiencyPQMpower quality monitoring
Rthe room heat resistanceISSinformation stabilities service
Cthe thermal capacity of the roomEUMelectricity utilization mode
Tout(t)the ambient temperature at the moment tEEAenergy efficiency assessment
QH(t)the room temperature regulating thermal powerSCTsocket communication technique
Cex(t)the interaction cost among the building and operator at the moment tECSelectricity consumption statistics
Pb(t)the electrical energy purchased to the power grid by the buildingESSelectricity saving statistics
Ps(t)the electrical energy sold to the power grid by the buildingCEUcurrent electricity users
priceb(t)the day-ahead selling price of electricity at the moment t released by the Power CompanyASTadjustable-scheduling-time
prices(t)the day-ahead purchasing price of electricity at the moment t released by the Power CompanySQLstructure quest language
Pline.maxthe upper limit of electric power transmission of the contact linenZEBnet zero energy building
Pd.minthe upper limit of output of the controllable unit d

Appendix A

Table A1. The electricity price of the distribution network.
Time Period/hourPeriod DescriptionElectricity Sale Price/(yuan/kWh)Electricity Purchase Price/(yuan/kWh)
0:00–7:00Valley period0.170.13
7:00–10:00Normal period0.490.38
10:00–15:00Peak period0.830.65
15:00–18:00Normal period0.490.38
18:00–21:00Peak period0.830.65
21:00–23:00Normal period0.490.38
23:00–24:00Valley period0.170.13
Table A2. The natural gas price of the gas network.
Time Period/hourSelling Price/(yuan/m3)
0: 00–24: 001.58
Table A3. The parameters of relevant equipment in the building.
TypesParametersValue
Storage batteryPv.max/kW20
Pv.min/kW0
δ/%0
ηch/%0.9
ηdis/%0.9
Gas fired-boilerUpper limit of generated output/kW65
Lower limit of generated output/kW5
Power generation efficiency0.3
Radiation loss0.15
Electric boilerUpper limit of power consumption/kW50
Lower limit of power consumption/kW0
ηeb/%1
Bromide-refrigeratorCOPh/%1.2
ηh/%0.9
Fuel cellUpper limit of generated output/kW40
Lower limit of generated output/kW5
ηfc/%0.62
Table A4. The building parameter and environmental parameter.
TypesParameterValue
BuildingR/(°C/kW)18
C/(kWh/°C)0.525
Other parameterLow heating value of natural gas /(kWh/m3)9.7

References

  1. Yu, W.; Li, B.Z.; Lei, Y.R.; Liu, M. analysis of a residential building energy consumption demand model. Energies 2011, 4, 475–487. [Google Scholar] [CrossRef]
  2. Liu, Z.Y. Global Energy Internet; China Electric Power Press: Beijing, China, 2015; pp. 1–10. [Google Scholar]
  3. Rifkin, J. The Third Industrial Revolution: How Lateral Power Is Transforming Energy, the Economy, and the World; Palgrave MacMillan: New York, NY, USA, 2011; pp. 5–8. [Google Scholar]
  4. Dong, Z.Y.; Zhao, J.H.; Wen, F.S.; Xue, Y.S. From smart grid to energy internet basic concept and research framework. Autom. Electr. Power Syst. 2014, 38, 1–11. [Google Scholar]
  5. Wu, C.; Tang, W.; Bai, M.K.; Zhang, L.; Cai, Y.X. Energy router based planning of energy Internet at user side. Autom. Electr. Power Syst. 2017, 41, 20–28. [Google Scholar]
  6. Yi, P.; Zhu, T.; Jiang, B.; Wang, B. Deploying energy routers in an energy internet based on electric vehicle. IEEE Trans. Veh. Technol. 2016, 65, 4714–4725. [Google Scholar] [CrossRef]
  7. Li, R.; Chen, L.J.; Yuan, T.J.; Li, C.L. Optimal dispatch of zero-carbon-emission micro Energy Internet integrated with non-supplementary fired compressed air energy storage system. J. Mod. Power Syst. Clean Energy 2016, 4, 566–580. [Google Scholar] [CrossRef]
  8. Wang, K.; Yu, J.; Yu, Y.; Wu, J.S. A Survey on energy internet: Architecture, approach, and emerging technologies. IEEE Syst. J. 2017, 99, 1–14. [Google Scholar] [CrossRef]
  9. Sun, Q.Y.; Zhang, Y.B.; He, H.B.; Zhang, H.W. A novel energy function-based stability evaluation and nonlinear control approach for energy internet. IEEE Trans. Smart Grid 2017, 8, 1195–1210. [Google Scholar] [CrossRef]
  10. González-Cabrera, N.; Gutiérrez-Alcaraz, G. Nodal user’s demand response based on incentive based programs. J. Mod. Power Syst. Clean Energy 2017, 5, 79–90. [Google Scholar] [CrossRef]
  11. Yan, H.G.; Li, B.; Chen, S.S.; He, G.X. Future evolution of automated demand response system in smart grid for low-carbon economy. J. Mod. Power Syst. Clean Energy 2015, 3, 72–81. [Google Scholar] [CrossRef]
  12. Jiang, Z.Q.; Ai, Q. Agent-based simulation for symmetric electricity market considering price-based demand response. J. Mod. Power Syst. Clean Energy 2017, 11, 1–10. [Google Scholar] [CrossRef]
  13. Albadi, M.H.; El-Saadany, E.F. A summary of demand response in electricity markets. Electr. Power Syst. Res. 2008, 78, 1989–1996. [Google Scholar] [CrossRef]
  14. Ni, L.N.; Wen, F.S.; Liu, W.J.; Meng, J.L.; Lin, G.Y.; Dang, S.L. Congestion management with demand response considering uncertainties of distributed generation outputs and market prices. J. Mod. Power Syst. Clean Energy 2016, 5, 66–78. [Google Scholar] [CrossRef]
  15. Kumar, Y.V.P.; Bhimasingu, R. Renewable energy based microgrid system sizing and energy management for green buildings. J. Mod. Power Syst. Clean Energy 2015, 3, 1–13. [Google Scholar] [CrossRef] [Green Version]
  16. Smith, R.; Meng, K.; Dong, Z.Y.; Simpson, R. Demand response: A strategy to address residential air-conditioning peak load in Australia. J. Mod. Power Syst. Clean Energy 2013, 1, 223–230. [Google Scholar] [CrossRef]
  17. Wang, Y.P.; Yang, W.; Liu, T. Appliances considered demand response optimisation for smart grid. IET Gener. Transm. Dis. 2017, 11, 856–864. [Google Scholar] [CrossRef]
  18. Huang, A.Q.; Crow, M.L.; Heydt, G.T.; Zheng, J.P.; Dale, S.J. The future renewable electric energy delivery and management (FREEDM) system: The energy internet. Proc. IEEE 2010, 99, 133–148. [Google Scholar] [CrossRef]
  19. Xinhua News: The Third Industrial Revolution to Save Europe? Available online: http://news.xinhuanet.com/fortune/2012-05/30/c_123212309.htm (accessed on 30 May 2012).
  20. National Energy Administration: Germany Relies on E-Energy Technology Innovation to Build Intelligent Energy Networks. Available online: http://www. nea.gov.cn/2012-02/14/c_131409715.htm (accessed on 14 February 2012).
  21. People News: Chinese Government Work Report of 2015 (Full Record). Available online: http://lianghui.people.com.cn/2015npc/n/2015/0 305/c3 94 298-26642056.html (accessed on 5 March 2015).
  22. CCTV News: Jin Ping Xi Attednd the Opening Ceremony of the “Belt and Road Forum for International Cooperation” and Delivered a Keynote Speech. Available online: http://xuexi.cctv.com/2017/05/15/A RTIwlhj9FmJ3ZbVdRqm3NGm170515.shtml (accessed on 15 May 2017).
  23. Yu, S.; Sun, Y.; Niu, X.H.; Zhao, C. Energy Internet system based on distributed renewable energy generation. Electr. Power Autom. Equip. 2010, 30, 104–108. [Google Scholar]
  24. Wang, J.Y.; Meng, K.; Cao, J.W.; Cheng, Z.H.; Gao, L.C.; Lin, C. Information technology for energy internet: A survey. J. Comput. Res. Dev. 2015, 52, 1109–1126. [Google Scholar]
  25. Liu, S.C.; Zhang, D.X.; Zhu, C.Y.; Li, W.D.; Lu, W.B.; Zhang, M.J. A view of big data in energy internet. Electr. Pow. Syst. Res. 2016, 40, 14–21. [Google Scholar]
  26. Jin, Y.; Wang, Z.Y.; Jiang, C.W.; Zhang, Y. Dispatch and bidding strategy of active distribution network in energy and ancillary services market. J. Mod. Power Syst. Clean Energy 2015, 3, 565–572. [Google Scholar] [CrossRef]
  27. Xiang, Y.; Liu, J.Y.; Yang, W.; Huang, C. Active energy management strategies for active distribution system. J. Mod. Power Syst. Clean Energy 2015, 3, 533–543. [Google Scholar] [CrossRef]
  28. Sun, Q.Y.; Han, R.K.; Zhang, H.W.; Zhou, J.G.; Guerrero, J.M. A multiagent-based consensus algorithm for distributed coordinated control of distributed generators in the energy internet. IEEE Trans. Smart Grid 2015, 6, 3006–3019. [Google Scholar] [CrossRef]
  29. Wang, J.Y.; Guo, J.H.; Cao, J.W.; Gao, L.C.; Hu, Z.W.; Zhou, J.; Ming, Y.Y.; Fang, Z.W. Review on information and communication key technologies of energy Internet. Smart Grid 2015, 3, 473–485. [Google Scholar]
  30. Zhang, N.; Wang, Y.; Kang, C.Q.; Cheng, J.N.; He, D.W. Blockchain technique in the energy Internet: Preliminary research framework and typical applications. Proc. CSEE 2016, 36, 4011–4022. [Google Scholar]
  31. Tai, X.; Sun, H.B.; Guo, Q.L. Electricity transactions and congestion management based on blockchain in energy internet. Power Syst. Technol. 2016, 40, 3630–3638. [Google Scholar]
  32. Yan, Y.; Zhao, J.H.; Wen, F.S.; Chen, X.Y. Blockchain in energy systems: Concept, application and prospect. Electr. Power Constr. 2017, 38, 12–20. [Google Scholar]
  33. Zhang, Y.; Wen, J.T. The IoT electric business model: Using blockchain technology for the internet of things. Peer Peer Netw. Appl. 2017, 10, 983–994. [Google Scholar] [CrossRef]
  34. Mengelkamp, E.; Gärtnera, J.; Rock, K.; Kessler, S.; Orsini, L.; Weinhardt, C. Designing microgrid energy markets: A case study: The Brooklyn Microgrid. Appl. Energy 2018, 210, 870–880. [Google Scholar] [CrossRef]
  35. Zizzo, G.; Sanseverino, E.R.; Ippolito, M.G.; Gallo, P. A technical approach to p2p energy transactions in microgrids. IEEE Trans. Industr. Inf. 2018. [Google Scholar] [CrossRef]
  36. Chen, L.J.; Zheng, T.W.; Mei, S.W.; Xue, X.D.; Liu, B.H.; Lu, Q. Review and prospect of compressed air energy storage system. J. Mod. Power Syst. Clean Energy 2016, 4, 1–13. [Google Scholar] [CrossRef]
  37. Tian, S.M.; Luan, W.P.; Zhang, D.X.; Liang, C.H.; Sun, Y.J. Technical forms and key technologies on energy internet. Proc. CSEE 2015, 35, 3482–3494. [Google Scholar]
  38. Zha, Y.B.; Zhang, T.; Huang, Z.; Zhang, Y.; Liu, B.L.; Huang, S.J. Analysis of energy internet key technologies. Sci. Sin. 2014, 44, 702–713. [Google Scholar]
  39. Althaher, S.; Mancarella, P.; Mutale, J. Automated demand response from home energy management system under dynamic pricing and power and comfort constraints. IEEE Trans. Smart Grid 2015, 6, 1874–1883. [Google Scholar] [CrossRef]
  40. Teng, X.L.; Gao, Z.H.; Zhang, Y.Y.; Huang, H.; Li, L.L.; Liang, T.T. Key technologies and the implementation of wind, PV and storage co-generation monitoring system. J. Mod. Power Syst. Clean Energy 2014, 2, 104–113. [Google Scholar] [CrossRef]
  41. Chen, Z.X.; Zhang, Y.J.; Cai, Z.X.; Li, L.C.; Liu, P. Characteristics and technical challenges in energy Internet cyber-physical system. In Proceedings of the IEEE PES Innovative Smart Grid Technologies Conference Europe (ISGT-Europe), Ljubljana, Slovenia, 9–12 October 2017; pp. 1–5. [Google Scholar]
  42. Zhou, K.L.; Yang, S.L.; Shao, Z. Energy internet: The business perspective. Appl. Energy 2016, 178, 212–222. [Google Scholar] [CrossRef]
  43. Chen, Q.X.; Liu, D.N.; Lin, J.; He, J.J.; Wang, Y. Business models and market mechanisms of energy internet. Power Syst. Technol. 2015, 39, 3050–3056. [Google Scholar]
  44. Wang, W.L.; Wang, D.; Jia, H.J.; Chen, Z.Y.; Guo, B.Q.; Zhou, H.M.; Fan, M.H. Review of steady-state analysis of typical regional integrated energy system under the background of energy Internet. Proc. CSEE 2016, 36, 3292–3305. [Google Scholar]
  45. Beccali, M.; Bonomolo, M.; Galatioto, A.; Pulvirenti, E. Smart lighting in a historic context: A case study. Manag. Environ. Qual. Int. J. 2017, 28, 282–298. [Google Scholar] [CrossRef]
  46. Ashabani, M.; Gooi, H.B. Multiobjective automated and autonomous intelligent load control for smart buildings. IEEE Trans. Power Syst. 2018, 33, 2778–2791. [Google Scholar] [CrossRef]
  47. Brusco, G.; Burgio, A.; Menniti, D.; Pinnarelli, A.; Sorrentino, N.; Scarcello, L. An energy box in a cloud-based architecture for autonomous demand response of prosumers and prosumages. Electronics 2017, 6, 98. [Google Scholar] [CrossRef]
  48. Pop, C.; Cioara, T.; Antal, M.; Anghel, I.; Salomie, I.; Bertoncini, M. Blockchain based decentralized management of demand response programs in smart energy grids. Sensors 2018, 18, 162. [Google Scholar] [CrossRef] [PubMed]
  49. Martinez, M.A.G.; Montero, M.I.M.; Gonzalez, F.B.; Marcos, V.M.M.; Cadaval, E.R.; Romera, E.G. A smart power electronic multiconverter for the residential sector. Sensors 2017, 17, 1217. [Google Scholar] [CrossRef] [PubMed]
  50. Godina, R.; Rodrigues, E.M.G.; Pouresmaeil, E.; Matias, J.C.O.; Catalao, J.P.S. Model predictive control home energy management and optimization strategy with demand response. Appl. Sci. 2018, 8, 408. [Google Scholar] [CrossRef]
  51. Sartori, I.; Napolitano, A.; Voss, K. Net zero energy buildings: A consistent definition framework. Energy Build. 2012, 48, 220–232. [Google Scholar] [CrossRef]
  52. Voss, K.; Sartori, I.; Napolitano, A.; Geier, S.; Gonzalves, H.; Hall, M.; Heiselberg, P.; Widen, J.; Candanedo, J.A.; Musall, E.; et al. Load matching and grid interaction of net zero energy buildings. In Proceedings of the Eurosun 2010, Graz, Austria, 28 September–1 October 2010; pp. 1–8. [Google Scholar]
  53. Sesana, M.M.; Salvalai, G. Overview on life cycle methodologies and economic feasibility for nZEBs. Build. Environ. 2013, 67, 211–216. [Google Scholar] [CrossRef]
  54. Marszal, A.J.; Heiselberg, P.; Bourrelle, J.S.; Musall, E.; Voss, K.; Sartori, I.; Napolitano, A. Zero energy building—A review of definitions and calculation methodologies. Energy Build. 2011, 43, 971–979. [Google Scholar] [CrossRef]
  55. Hernandez, P.; Kenny, P. From net energy to zero energy buildings: Defining life cycle zero energy buildings (LC-ZEB). Energy Build. 2010, 42, 815–821. [Google Scholar] [CrossRef]
  56. Li, D.H.W.; Yang, L.; Lam, J.C. Zero energy buildings and sustainable development implications—A review. Energy 2013, 54, 1–10. [Google Scholar] [CrossRef]
  57. The European Parliament and the Council of the European Union. Directive 2010/31/EU of the European Parliament and of the Council of 19 May 2010 on the energy performance of buildings (recast). Official Journal of the European Union, 18 July 2010; 1–5. [Google Scholar]
  58. Liu, N.; Wang, J.; Wang, L.F. Distributed energy management for interconnected operation of combined heat and power-based microgrids with demand response. J. Mod. Power Syst. Clean Energy 2017, 5, 1–11. [Google Scholar] [CrossRef]
  59. Chen, C.S.; Duan, S.X. Microgrid economic operation considering plug-in hybrid electric vehicles integration. J. Mod. Power Syst. Clean Energy 2015, 3, 221–231. [Google Scholar] [CrossRef]
  60. Melhorn, A.C.; Mckenna, K.; Keane, A.; Flynn, D.; Dimitrovski, A. Autonomous plug and play electric vehicle charging scenarios including reactive power provision: A probabilistic load flow analysis. IET Gener. Transm. Dis. 2017, 11, 768–775. [Google Scholar] [CrossRef]
  61. Khan, M.T.A.; Norris, G.; Chattopadhyay, R.; Husain, I.; Bhattacharya, S. Autoinspection and permitting with a PV utility interface (PUI) for residential plug-and-play solar photovoltaic unit. IEEE Trans. Ind. Appl. 2017, 53, 1337–1346. [Google Scholar] [CrossRef]
  62. Cao, Y.J.; Zhu, Q.L.; Fang, B.L.; Tan, Y.; Zeng, L. Optimal allocation of multi-type FACTS devices in power systems based on power flow entropy. J. Mod. Power Syst. Clean Energy 2014, 2, 173–180. [Google Scholar]
  63. Li, Y.Z.; Li, M.S.; Wu, Q.H. Optimal reactive power dispatch with wind power integrated using group search optimizer with intraspecific competition and Lévy walk. J. Mod. Power Syst. Clean Energy 2014, 2, 308–318. [Google Scholar] [CrossRef]
  64. Lee, C.L.; Kuo, S.C.; Lin, C.J. An efficient forecasting model based on an improved fuzzy time series and a modified group search optimizer. Appl. Intell. 2017, 46, 641–651. [Google Scholar] [CrossRef]
  65. Tang, J.; Zhang, X.S.; Cheng, L.F.; Yu, T.; Pan, B.; Guo, L.X.; Tan, M. TOPSIS-Q(λ) learning for multi-objective optimal carbon emission flow of power grid. In Proceedings of the 2nd International Conference on Intelligent Materials and Mechatronics (IMM 2015), Hong Kong, China, 29–30 October 2015; pp. 20–26. [Google Scholar]
  66. Yang, L.; Jing, L.; Ng, M.K. Robust and non-negative collective matrix factorization for text-to-image transfer learning. IEEE Trans. Image Process 2015, 24, 4701–4714. [Google Scholar] [CrossRef] [PubMed]
  67. Pan, S.J.; Yang, Q. A survey on transfer learning. IEEE Trans. Knowl. Data Eng. 2010, 22, 1345–1359. [Google Scholar] [CrossRef]
  68. Nguyen, T.T.; Silander, T.; Zhuoru, L.; Leong, T.Y. Scalable transfer learning in heterogeneous, dynamic environments. Appl. Intell. 2017, 247, 70–94. [Google Scholar] [CrossRef]
  69. Li, N.; Hao, H.Z.; Gu, Q.; Wang, D.R.; Hu, X.M. A transfer learning method for automatic identification of sandstone microscopic images. Comput. Geosci. 2017, 103, 111–121. [Google Scholar] [CrossRef]
  70. Wu, X.; Wang, J.X.; Bie, Z.H. Economic generation scheduling of a microgrid using mixed integer programming. Proc. CSEE 2013, 33, 1–8. [Google Scholar]
  71. Li, M.H.; Zhang, F.; Liang, J. Optimization on microgrid with combined heat and power system. Proc. CSEE 2015, 35, 3569–3576. [Google Scholar]
  72. Shao, S.; Pipattanasomporn, M.; Rahman, S. Development of physical-based demand response-enabled residential load models. IEEE Trans. Power Syst. 2013, 28, 607–614. [Google Scholar] [CrossRef]
  73. Pisello, A.L.; Bobker, M.; Cotana, F. A building energy efficiency optimization method by evaluating the effective thermal zones occupancy. Energies 2012, 5, 5257–5278. [Google Scholar] [CrossRef]
  74. Miceli, R. Energy management and smart grids. Energies 2013, 6, 2262–2290. [Google Scholar] [CrossRef] [Green Version]
  75. Dolan, P.S.; Nehrir, M.H.; Gerez, V. Development of a Monte Carlo based aggregate model for residential electric water heater loads. Electr. Power Syst. Res. 1996, 36, 29–35. [Google Scholar] [CrossRef]
  76. Chang, H.H. Non-intrusive demand monitoring and load identification for energy management systems based on transient feature analyses. Energies 2012, 5, 4569–4589. [Google Scholar] [CrossRef]
  77. Wang, D.Z.; Zhang, X.S.; Qu, K.P.; Yu, T.; Pan, Z.N.; Liu, Q.J. Pareto tribe evolution with equilibrium-based decision for multi-objective optimization of multiple home energy management systems. Energy Build. 2018, 159, 11–23. [Google Scholar] [CrossRef]
Figure 1. Supply-demand interaction and information-energy fusion between power grid and distributed energy and equipment (DEE) via energy universal service bus system (EUSBS).
Energies 11 01160 g001
Figure 2. System architecture and topology application architecture design of EUSBS. (a) The entire designed framework of EUSBS; (b) The topology application architecture of the buildings; (c) The topology application architecture of the floors in each building.
Energies 11 01160 g002aEnergies 11 01160 g002b
Figure 3. Topological architecture of an application scenario in a demonstration site based on the developed EUSBS.
Energies 11 01160 g003
Figure 4. Overall framework design of hardware part of EUSBS.
Energies 11 01160 g004
Figure 5. Schematic design of five major categories of EUSBS hardware equipment: (a) hardware equipment for PV access; (b) hardware equipment for fans access; (c) hardware equipment for EVCS access; (d) hardware equipment for energy storage equipment (ESE) access; (e) smart socket; (f) single-phase EUSBS concentrator; (g) three-phase EUSBS concentrator.
Energies 11 01160 g005aEnergies 11 01160 g005b
Figure 6. Functional block design of inverter.
Energies 11 01160 g006
Figure 7. Laboratory prototypes development of smart socket and EUSBS concentrator: (a) the prototype of a smart socket; (b) the prototype of an EUSBS concentrator.
Energies 11 01160 g007
Figure 8. Prototype developments of EUSBS concentrator and the entire new-type distribution box: (a) the configuration principle of the new-type distribution box; (b) the installation mode of EUSBS concentrator.
Energies 11 01160 g008
Figure 9. Framework design of software platform of EUSBS and two application flow designs: (a) the framework design of the software platform of EUSBS; (b) the flow design for energy efficiency evaluation; (c) the interactive response flow for smart electricity utilization.
Energies 11 01160 g009aEnergies 11 01160 g009b
Figure 10. Framework design of DEE management.
Energies 11 01160 g010
Figure 11. Some functional interfaces display of the CEMUI system: (a) APP functional selection main interface; (b) equipment management module interface; (c) day active power curve interface; (d) day voltage curve interface; (e) voltage harmonic curves interface; (f) information statistics module interface; (g) electricity utilization mode customization interface; (h) home client local optimization and control system interface.
Energies 11 01160 g011
Figure 12. The principle framework for the cooperative game between grid and user and meanwhile taking the retailer and load aggregation corporation into account.
Energies 11 01160 g012
Figure 13. The variation of output power of equipment and temperature of the building, where SB, EB, FC and GT represent the power variation of the storage battery, the electric boiler, the fuel cell and the gas turbine in the building, respectively; T1 and T2 indicate the variation of room temperature in the building and the ambient temperature, respectively.
Energies 11 01160 g013
Table 1. Key technologies in development of future energy Internet (E-net).
Key TechnologiesCutting-Edge Research Directions
Information technology [24]IntelliSense, cloud computing
Big data technology [25]Data acquisition, integration, fusion, quality control, storage, analysis
Active distribution network [26,27]Distribution comprehensive plan
Coordinated optimization control [28]Distributed cooperative control, energy management/conversion
Communication technology [29]ICT system key network layer design
Integrated energy management [30]Multiple energy network coupling, intelligent energy management
Blockchain technology [30,31,32,33,34,35]Electricity transactions and congestion management
Advanced energy storage [36]P2G, new energy storage materials/management/system planning
Advanced power electronics [37]SiC-/GaN-based new wide band gap materials and power components
Smart fault management [38]New-type circuit breaker, IGBT
Automated demand response [39]Load active control, ADR system
System programming technology [40]Framework design, reliability
Table 2. Technical specifications of the smart socket.
ItemsRangePrecision
RMS voltage[110, 260], /V±1%
RMS current[0.02, 10], /A±1%
Frequency[40, 70], /Hz±0.5%
Power factor[0, 1.0]±0.04
Active power[0, 2.6], /kW±2%
Apparent power[0, 2.6], /kVar±2%
Voltage and current harmonics2–31 times±10%
Temperature[−50, 400], /°C±1%
Table 3. Technical specifications of the household concentrator.
Basic FunctionMeasuring RangeBasic Precision
AC voltage400 V±0.5%
AC current10 A/50 A±0.5%
Active power1 W–2 kW/10 kW±1%
Reactive power1 Var–2 kVar/10 kVar±1%
Apparent power1 VA–2 kVA/10 kVA±1%
Frequency40–60 Hz±1%
Electric energy1–9999 kWh±1%
HarmonicsTHD±4%
Table 4. Equipment information of the EUSBS concentrator.
General ParametersDescriptionGeneral ParametersDescriptionGeneral ParametersDescription
Total volume495 × 300 × 165 mmEquipment ROM8 GBTotal weight11 kg
Equipment shell materialmetalOperation temperature−20–60 °CEquipment RAM1 GB
Screen size210 × 160 mmExternal interfaceEthernet, RS232, JTAG debug portOperation systemAndroid M1
Protection gradeIP65Operation voltage220 VRated work frequency50 Hz

