Article

The Scale, Structure and Influencing Factors of Total Carbon Emissions from Households in 30 Provinces of China—Based on the Extended STIRPAT Model

1
School of Statistics, Dongbei University of Finance and Economics, Dalian 116025, China
2
Postdoctoral Research Station, Dongbei University of Finance and Economics, Dalian 116025, China
3
Editorial Department, Dongbei University of Finance and Economics, Dalian 116025, China
*
Author to whom correspondence should be addressed.
Energies 2018, 11(5), 1125; https://doi.org/10.3390/en11051125
Submission received: 30 March 2018 / Revised: 25 April 2018 / Accepted: 1 May 2018 / Published: 2 May 2018
(This article belongs to the Special Issue Modeling and Simulation of Carbon Emission Related Issues)

Abstract

:
Household carbon emissions are important components of total carbon emissions. The consumer side of energy-saving emissions reduction is an essential factor in reducing carbon emissions. In this paper, the carbon emissions coefficient method and Consumer Lifestyle Approach (CLA) were used to calculate the total carbon emissions of households in 30 provinces of China from 2006 to 2015, and based on the extended Stochastic Impacts by Regression on Population, Affluence, and Technology (STIRPAT) model, the factors influencing the total carbon emissions of households were analyzed. The results indicated that, first, over the past ten years, the energy and products carbon emissions from China’s households have demonstrated a rapid growth trend and that regional distributions present obvious differences. Second, China’s energy carbon emissions due to household consumption primarily derived from the residents’ consumption of electricity and coal; China’s products household carbon emissions primarily derived from residents’ consumption of the high carbon emission categories: residences, food, transportation and communications. Third, in terms of influencing factors, the number of households in China plays a significant role in the total carbon emissions of China’s households. The ratio of children 0–14 years old and gender ratio (female = 100) are two factors that reflect the demographic structure, have significant effects on the total carbon emissions of China’s households, and are all positive. Gross Domestic Product (GDP) per capita plays a role in boosting the total carbon emissions of China’s households. The effect of the carbon emission intensity on total household carbon emissions is positive. The industrial structure (the proportion of secondary industries’ added value to the regional GDP) has curbed the growth of total carbon emissions from China’s household consumption. The results of this study provide data to support the assessment of the total carbon emissions of China’s households and provide a reasonable reference that the government can use to formulate energy-saving and emission-reduction measures.

1. Introduction

According to the International Energy Agency (IEA) [1], China surpassed the US as the world’s largest emitter of carbon in 2007, and according to data on carbon dioxide emissions released by the BP World Energy Statistics Yearbook (2017) [2], China’s global share of carbon emissions rose from 20.9% in 2005 to 27.5% in 2014 and remains on the rise. China, the largest developing country in the world, has undergone vigorous and rapid development over the past 40 years, and the increased large-scale, mechanized production, growing consumer demand, and improved living standards have caused China’s carbon dioxide emissions to increase every year. To reduce carbon emissions, China has established a series of emissions reduction plans: at the World Climate Conference in Copenhagen in 2009, China vowed that by 2020 its carbon intensity would decrease by 40–45% from the 2005 amount. In 2014, China increased its goal of peak carbon emissions to approximately 2030. In 2015, at the Paris summit, China reaffirmed its commitment of peak carbon emissions to approximately 2030; China has also proposed that to approximately 2030, non-fossil energy consumption would account for about 20% of primary energy consumption, and carbon intensity would be 60 to 65% lower than 2005, and forest stock would be about 4.5 billion cubic meters more than in 2005. In December 2017, China officially launched the national carbon emission trading system [3], taking an important step on the path of reducing emissions. Therefore, how to achieve energy savings and emissions reduction and how to develop an appropriate path for China’s low-carbon development have become timely issues for scholars.
Currently, most of our efforts to reduce emissions are committed to the field of industrial production. Recent years have seen diminishing marginal benefits of industrial emission reductions, and changing consumption patterns have been an effective manner by which to mitigate climate warming. All types of research on carbon emissions at the production level have gradually shifted to the consumption level. At present, household carbon emissions account for more than 40% [4] of China’s total carbon emissions and increase yearly. In 2012, China’s GDP growth rate was 7.7% [5], farewell to the past more than 30 years average of 10% per cent growth, indicating that China’s economic growth phase has undergone a fundamental shift in the economic development of the “new normal”. An important manifestation of the new normal of economic development is that the contribution rate of consumption to economic growth is obviously increased. In 2010, consumption contributed 61.9% [6] to China’s economic growth, surpassing investment for the first time since 2006. In 2016, the contribution of consumption to China’s economic growth increased to 64.6% [6]. Therefore, expanding domestic demand and promoting consumption are important pillars for economic growth. Changes in the size and structure of residents’ consumption will have significant impacts on China’s carbon emission. It is of great practical significance to study the carbon emissions of households and their influencing factors. To determine whether residents directly generate carbon emissions when they consume products and services, we can divide household consumption carbon emissions into energy carbon emissions of households and products carbon emissions of households. Energy carbon emissions of households are produced by residents’ direct consumption of energy products. Products carbon emissions of households are generated by the residents’ consumption of products and services that consume energy in all aspects of production and sales. The combination of energy and products carbon emissions of household consumption is called total household carbon emissions. This paper calculates the energy and products carbon emissions of household consumption and comprehensively analyses the present situation and influencing factors on total carbon emissions of China’s household consumption.

2. Literature Review

At present, the research on the carbon emissions of households is divided into two areas: scale calculation and influential factor analysis. The measurement of scale is divided into the calculation of the energy carbon emissions of household consumption and calculation of the products carbon emissions of household consumption, and research on the influencing factors of carbon emissions from households primarily concentrates on the population, per capita income and technical levels. Currently, studies have focused on several areas, which are discussed in the following sections.

2.1. Measurement of the Size of Carbon Emissions of Household Consumption

Existing research primarily uses the carbon emission coefficient method to calculate the energy carbon emissions of household consumption. There are three methods for calculating products carbon emissions from households: Input-Output Analysis (IOA), Life-Cycle Analysis (LCA) and the Consumer Lifestyle Approach (CLA). ① The input-output analysis method, proposed by Professor Leon (Wassily Leontief) in 1936, was applied to the quantitative analysis of the American economic system in the same year [7], and the theoretical setting and empirical application were further analyzed in 1937 [8]. Herendeen [9] first applied it to the analysis and calculation of energy consumption in the United States in 1976. Druckman [10] established a quasi-multi-region-input-output model to study the carbon emissions produced by British residents from consumer products and services from 1990 to 2004; the results indicated that more than one-fourth of the UK household consumption carbon emissions in 2004 came from recreational and leisure consumption. Peng et al. [11] developed a non-competitive input-output model to calculate the carbon emissions caused by Chinese residents’ consumption and their sectoral distribution from 1992 to 2007. Their results indicated that during the period of inspection, residents’ consumption and carbon emissions indicated a rapid growth trend, which is an important component of China’s total carbon emissions. Based on the statistical data from Shanghai from 1997 to 2010, Wu, Guo et al. [12] used the input-output model to calculate the products carbon emissions from Shanghai residents’ consumption, and the study observed that the products carbon emissions of Shanghai residents’ consumption was increasing, which was the primary source of the total carbon emissions of residents’ consumption. Tian et al. [13] used the input-output model to calculate the products carbon emissions of residents in Liaoning Province in 1997, 2002 and 2007. The study determined that the products carbon emissions from urban residents’ consumption were the primary component of products carbon emissions of residents’ consumption. ② Life-Cycle Analysis examines the effect of a product or service on the environment throughout its life cycle. Liu et al. [14] used the life-cycle analysis method to construct the sustainable consumption evaluation model, and those authors analyzed the ecological influence of the Chinese urban household consumption behavior in 2000 and compared the contribution of different consumption behaviors to the ecological effect. Yiao et al. [15] accounted for the total amount of products carbon dioxide emitted by Chinese residents from 1997 to 2007 using the comprehensive life-cycle analysis method and determined that the products carbon emissions from urban residents was the primary component of household consumption products emissions. ③ The Consumer Lifestyle Approach (CLA), based on household consumer goods, calculates the carbon emissions from each type of consumption activity according to the expenditure of each category of consumer goods. Bin et al. [16] analyzed the relation between the energy consumption and carbon emissions of American residents using the consumer lifestyle approach and presented a detailed calculation method of the energy and products carbon emissions of residents’ consumption. Wei et al. [17] studied carbon emissions from the end energy consumption of rural and urban residents in China from 1999 to 2002 using the consumer lifestyle approach and determined that the total carbon emissions of residents’ consumption accounted for approximately 30% of the total carbon emissions. Fan and Wang [18] adopted the consumer lifestyle method to measure the products carbon emissions of Chinese residents from 1993 to 2007 as well as the trend in consumption carbon emissions of urban and rural residents per capita.

2.2. Study of the Factors Influencing the Consumption Carbon Emissions of Households

The research methods of the factors influencing household consumption carbon emissions primarily include two types. The first type is decomposition analysis, including Index Decomposition Analysis (IDA) and Structural Decomposition Analysis (SDA). The other type is the environmental effect (I) = population (P) × affluence (A) × technology (T) (IPAT) equation or STIRPAT model. Greenring et al. [19] used Di’s index method to analyse 10 countries in the OECD regarding their carbon emissions from residential terminal services and private transport sectors from 1970 to 1993. It was determined that the effects of the energy structure of terminal consumption, fuel composition and energy intensity on the reduction of the intensity of carbon emissions were different. Using the LMDI model, Chai [20] constructed a complete decomposition model of carbon emissions of urban residents and evaluated the factors influencing the daily carbon emissions of Chinese urban residents from the perspectives of the consumption pattern, income and family size. Du [21] calculated and analyzed the influence of the urban-rural structure, consumption carbon intensity, consumption level and consumption structure on the products carbon emissions of Chinese residents from 2000 to 2015 using the LMDI model. Wang and Xia [22] used the SDA Model to analyse the factors influencing consumption carbon emissions of Chinese residents from 1995 to 2009, and the study determined that the carbon emissions generated by residents’ consumption were generally increasing during the study period. However, from the perspective of structure and influence factors, Chinese residents’ consumption remains in the area of low-carbon development (low-carbon development is a sustainable development model characterized by low energy consumption, low pollution and low emission, which is of great significance to the sustainable development of economy and society.). Based on the IPAT equation, Hubacek et al. [23] analyzed the influence factors of environmental change and carbon emissions in China and India from 1960 to 2000, and the results indicated that the influence of wealth factors on carbon emissions increased and that the influence of technical factors on carbon emissions decreased. Hubacek et al. [24] used the IPAT model to analyse the influence factors of China’s carbon emissions from 1978 to 2008. The article reported that the increase in economic levels rendered residents inclined to consume products that generate more carbon emissions in the production process, leading to increased carbon emissions. Fu et al. [25] analyzed the factors influencing the products carbon emissions of Chinese residents from 1996 to 2011 using the STIRPAT model and determined that per capita output, the energy intensity and energy structure were the primary factors influencing the products carbon emissions of residents’ consumption. Tang et al. [26] calculated the energy carbon emissions of Chinese residents from 1990 to 2014 and used the STIRPAT model to quantify the effects of variables such as the population size, energy structure, household consumption level and urbanization rate on China’s consumption of energy carbon emissions. Based on China’s provincial data from 2003 to 2012, Ji et al. [27] constructed the dynamic panel data model of the influencing factors of energy carbon emissions from households using the extended STIRPAT model. Based on the extended STIRPAT model, Richard [28] analyzed the influencing factors of energy consumption in 14 countries in the EU from 1960 to 2000. The study found that the total population, urbanization rate, per capita GDP, and the proportion of people over 65 years of age had catalytic effects on energy consumption, and the impact of GDP per capita on energy consumption was consistent with the Kuznets hypothesis. To examine the determinants of nitrogen oxides (NOx) emissions in the Community of Madrid in Spain, which is one of the most densely populated regions in Europe, Tiziana et al. [29] used an extended STIRPAT model to analyse the effects of the total population, income level, the population over 64 years of age and the proportion of male population aged 22–55 to the emission of NOx. Rosalia et al. [30] extended the classic Pressure-State-Response model. And the effects of GDP, urbanization rate, 0–14-year-old children’s ratio on the emission of carbon monoxide (CO), nitrogen oxides (NOx) and volatile organic compounds (VOC) in European Union countries in 1995–2005 were analyzed. Brantley [31] summarized the literatures, which used the STIRPAT model to study the impacts of total population, age structure, family size and urbanization rate on carbon emissions. This paper summarizes the methods, conclusions, and limitations of existing studies as presented in Table 1.
On the whole, the majority of the literature concerns the total carbon emissions of household consumption and their influencing factors at the national level or in the single area. There are few studies on the provincial level, which cannot fully reflect the consumption carbon emissions of Chinese residents from the spatial scope. In the selection of influencing factors, most scholars use a single population to examine the effect of demographic changes on the total carbon emissions of household consumption without analyzing the demographic structure. With the development of human society, population structure has become an important component of the population problem and should be included in the field of investigation.
This paper measured the total carbon emissions of China’s households from 2006 to 2015 at the provincial level. Therefore, this paper can provide support for a comprehensive forecast of the future development trend of China’s household consumption total carbon emissions and guidance on the government’s policy for formulating targeted emission reduction policies according to the differences in the total carbon emissions of households in different regions. This article introduced the ratio of children 0–14 and gender ratio. These two factors can be used to study the effect of demographic changes on the total carbon emissions of household consumption. China is now vigorously pursuing a comprehensive fetus policy, and China’s current gender ratio is seriously unbalanced (in 2015, it was 105.02). In this context, it is possible to provide theoretical guidance for China to specify a reasonable population policy to promote sustainable low-carbon development by studying the 0–14-year-old children’s ratio and gender ratio.
The following sections of this article are arranged as follows: the third section introduces the calculation method of the total carbon emissions of household consumption, presents the model construction of the factors affecting the total carbon emissions of household consumption and provides a data explanation. The fourth section analyses the results of the total carbon emissions of household consumption and the results of the model construction. The fifth section, the discussion section, compares the similarities and differences between this article and previous research and discusses the limitations of this article. The sixth section includes the conclusions and suggestions for future research.

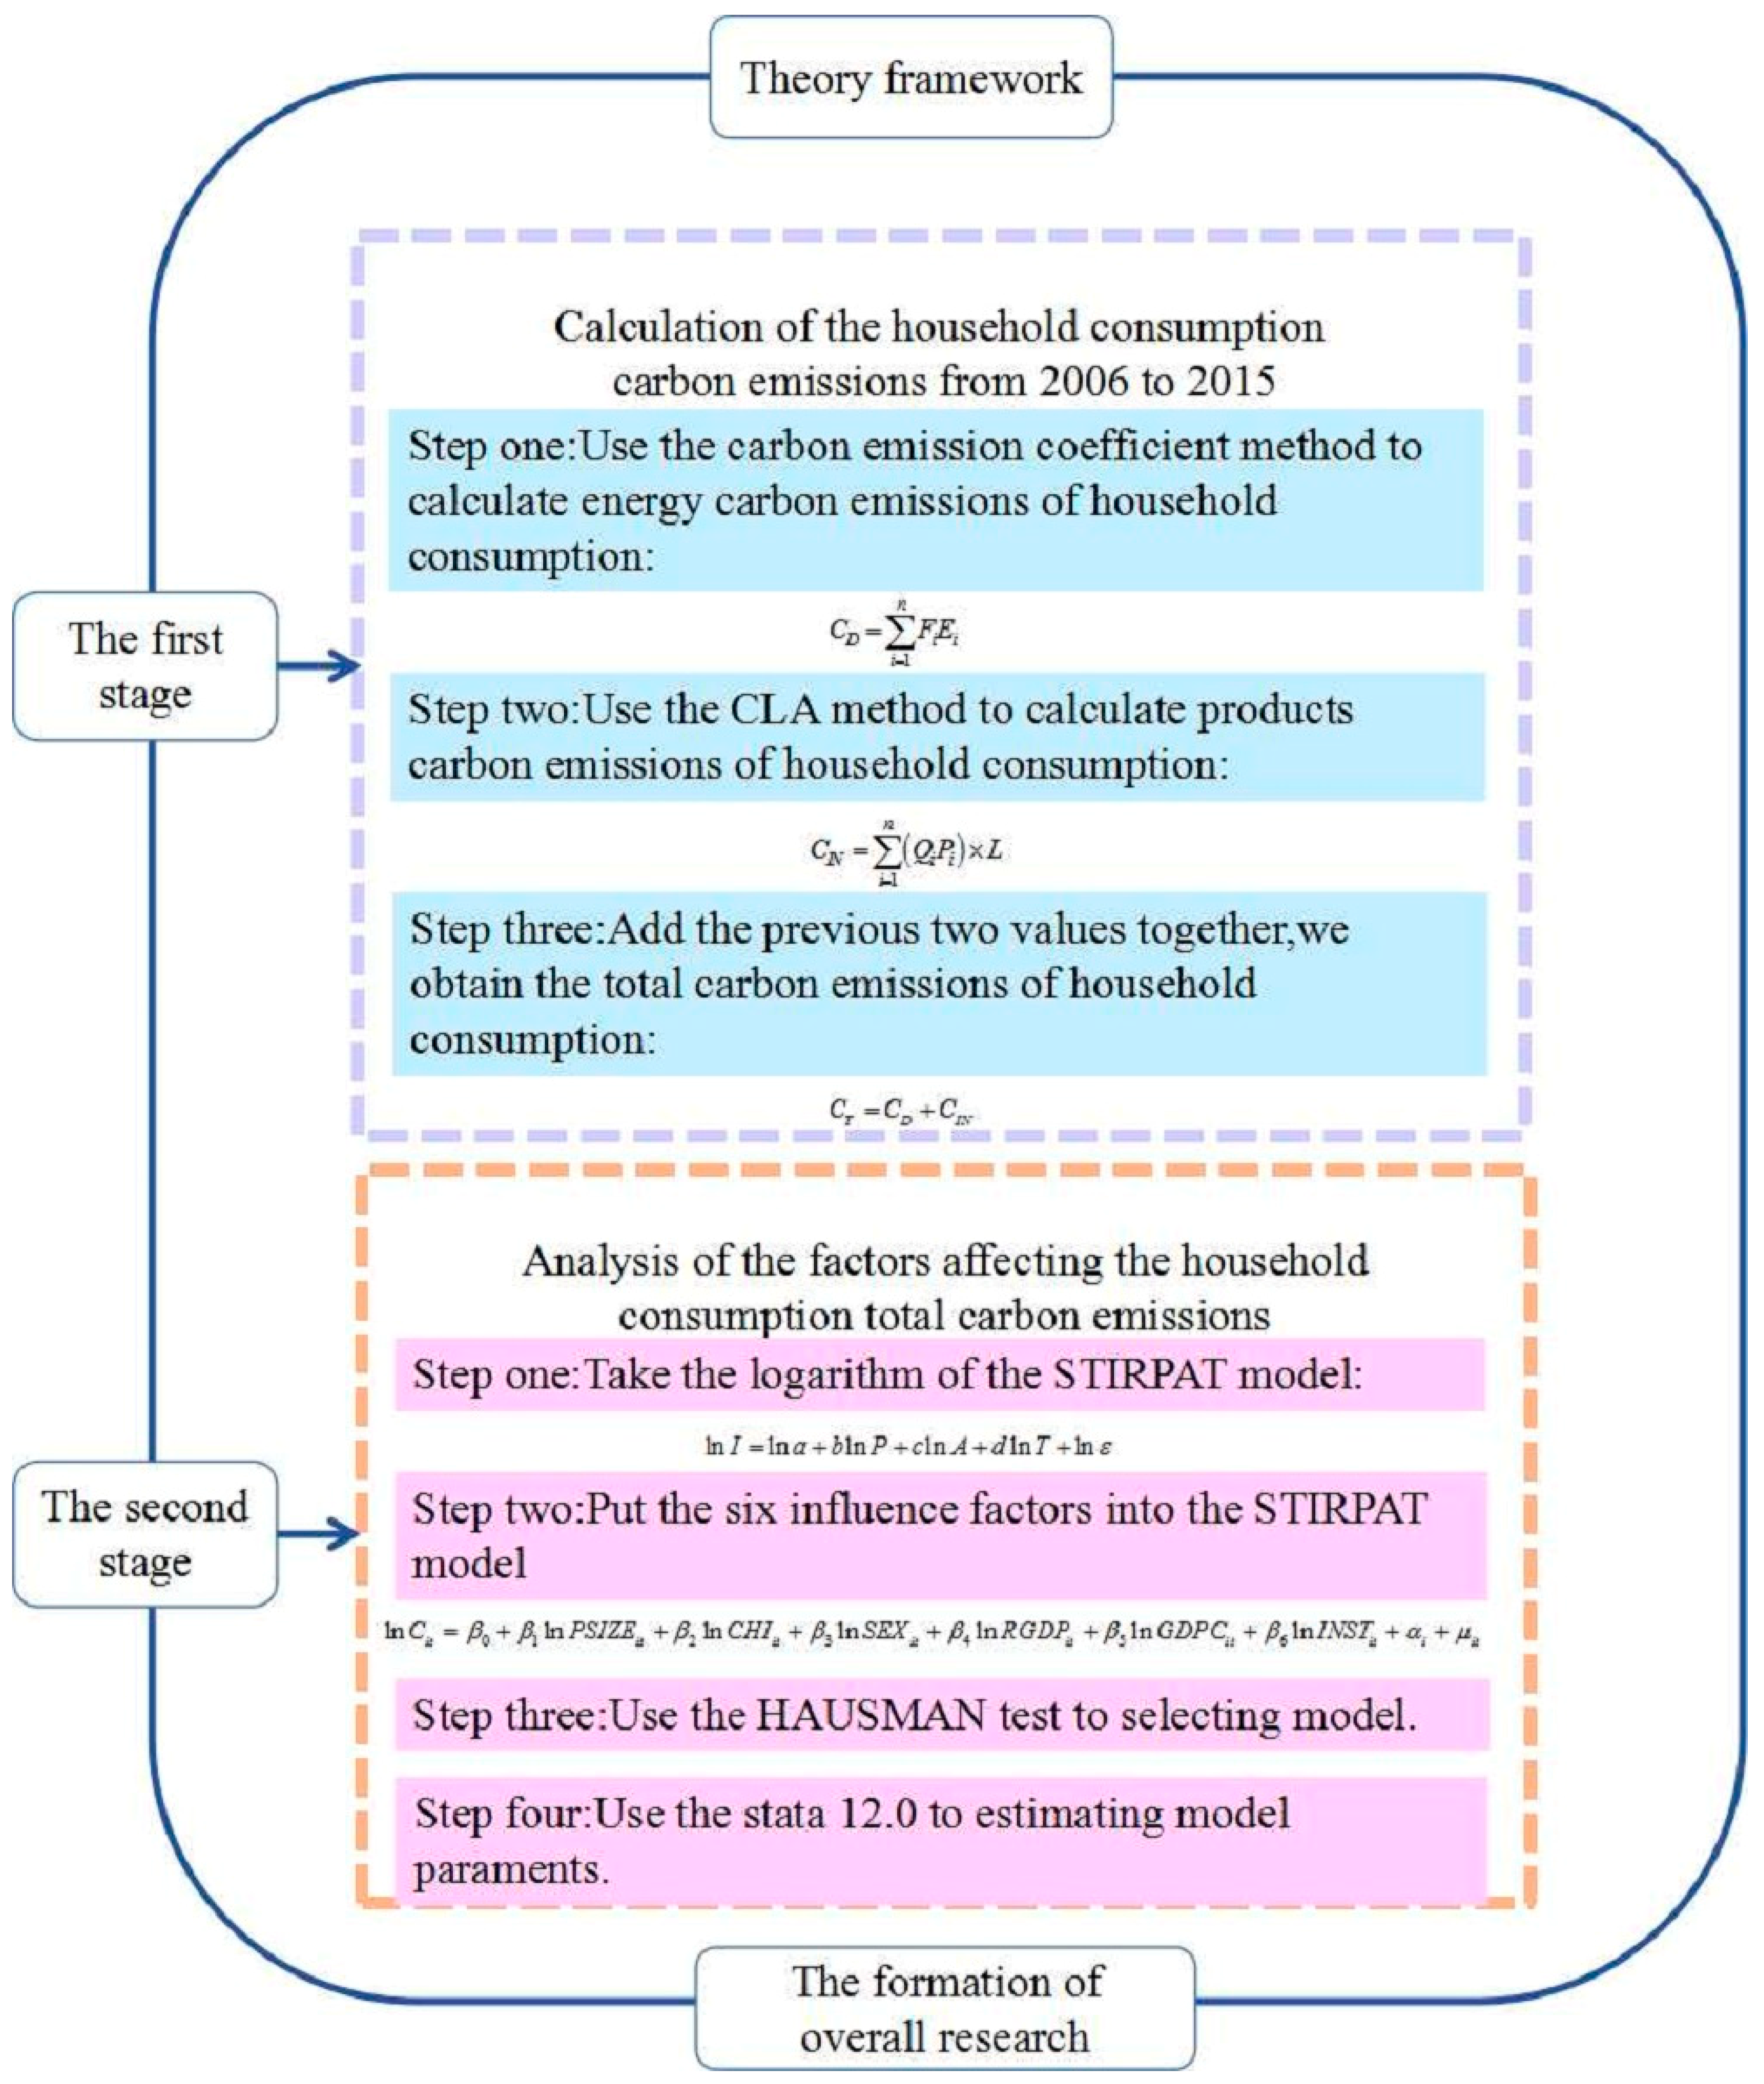
3. Research Methods and Data Explanation

3.1. Calculation Model of Total Carbon Emissions from Households

Total carbon emissions from households CT are expressed as Equation (1):
C T = C D + C I N
In Equation (1), CD and CIN indicate energy consumer carbon emissions and products consumer carbon emissions, respectively.
The method of calculating energy carbon emissions of household consumption adopts the method of the carbon emission coefficient, and CD is expressed as Equation (2):
C D = i = 1 n F i E i
In Equation (2), Fi is the carbon emission factor for various energy sources. Ei indicates the population’s consumption of various energy sources. Data were from the regional energy balance table in the China Energy Statistics Yearbook (2007–2016) [32]. i = 1, 2, …, 5 were used to indicate the five types of energy that residents consume in their lives: coal, petroleum, natural gas, electricity and heat. Choosing these five kinds of energy products to calculate the energy carbon emission of Chinese residents’ consumption was mainly based on the previous research [12] and consideration of the residents’ demand for energy products in real life. The direct consumption of coal by residents is primarily used for cooking and heating. Especially in rural China, the use of coal is more common; the direct consumption of petroleum by residents is mainly used for providing fuel (petrol) to vehicles and cooking (liquefied petroleum gas). It is necessary to emphasize that there are various kinds of petroleum products. This paper mainly refers to gasoline and liquefied petroleum gas (LPG); natural gas is mainly used by residents for cooking. There is a greater demand for natural gas in urban areas; electricity and heat are essential civil energies in residents’ life. The carbon emission coefficients of the three primary energy sources of coal, petroleum and natural gas are presented in Table 2. Electricity and heat are two energy sources that do not directly produce carbon emissions in the process of consumption but produce carbon emissions during production. Thus, the carbon emission coefficients of electricity and heat (Table 3) must be computed in conjunction with the carbon emissions generated by electricity and heat in the production process and their yields, and the formula for calculating the carbon emission coefficients of electricity is expressed as Equation (3):
F e l e c t r i c i t y = i 3 F i A i I e l e c t r i c i t y
In Formula (3), FElectricity represents the carbon emission factor of the electricity Fi represents the carbon emission factor of coal, petroleum and natural gas. Ai represents the amount of coal, petroleum and natural gas consumed by electricity generation. These data were derived from the regional energy balance table in the China Energy Statistics Yearbook (2007–2016) [32], i = 1, 2, 3. IElectricity represents the total supply of electricity.
Similarly, the formula for calculating the carbon emission coefficient of heat is expressed as Equation (4):
F h e a t = j 3 F j A j I h e a t
In Equation (4), Fheat indicates the carbon emission coefficient of heat. Fj represents the carbon emission factor of coal, petroleum and natural gas. Aj indicates the amount of coal, petroleum and natural gas consumed by heating, j = 1, 2, 3. Iheat represents the total supply of heat.
The calculation of products carbon emissions of household consumption primarily refers to the research method of Wei [17]. Using the CLA method to calculate the products carbon emissions of household consumption, the formula is expressed as Equation (5):
C I N = i = 1 n ( Q i P i ) × L
In Equation (5), Qi indicates that residents buy consumer goods per capita of consumption expenditure (data are from the China Statistical Yearbook (2007–2016) [39]). Pi indicates the carbon emission factor for each consumer product (Table 4). L is the total population (data are from the China Statistical Yearbook (2007–2016) [39]). Finally, i = 1, 2, , 8 indicates the type of the eight major categories of consumer goods: food, clothing, residences, household appliances and supplies, transportation and communications, culture and entertainment, health care and others. The official statistics of China divide the household consumption into eight categories, and the eight categories are subdivided into many small categories. Considering the availability of data, the paper no longer accounts for the products carbon emissions of residents according to the small subdivided categories.

3.2. Analysis Model of Factors Affecting Total Carbon Emissions from Households

3.2.1. STIRPAT Model

The IPAT model, can be used to study the effects of demographic, economic and technological factors on environmental pressure. The IPAT model has been widely used since it was introduced in the 1970s. However, the IPAT model has limitations, by changing only one of the factors to analyse the problem, the effect of various factors on the dependent variable is of equal proportions. To overcome this limitation, Dietz & Rosa (1994) [41] expanded the model into a random form, the STIRPAT model, the expression of which is Equation (6):
I = a P b A c T d ε
In Equation (6), I represents the environmental effect. P, A and T represent the population, wealth and technology, respectively; a is constant, and b, c and d are indices that can be used to analyse the nonproportional effects of the changes of various factors on the environment. ε is a random perturbation term.
In the empirical analysis, we generally take the logarithm of the two sides and obtain the following models:
ln I = ln a + b ln P + c ln A + d ln T + ln ε
In Equation (7), the logarithm of the three exponents b, c and d in the model can be estimated as parameters, and the various influencing factors can be decomposed and analyzed appropriately, which provides a theoretical basis for studying the effects of various factors on the environment.
The studies of Du [21], Hubacek [23] and Ji [27] found that population size, living standards, carbon intensity and industrial structure had significant impacts on consumer carbon emissions. In addition to these factors, Richard [28] and Rosalia [30] introduced age structures in the study of carbon emissions. Considering the existing research and the actual situation in China, this paper adds the variable of gender ratio. It is primarily due to the imbalance of gender ratio at present in China, which leads to differences in consumption habits and consumption structure. Thus, this paper constructs an extended STIRPAT model of the influence factors of total carbon emission in residents’ consumption, which is expressed as Equation (8):
ln C i t = β 0 + β 1 ln P S I Z E i t + β 2 ln C H I i t + β 3 ln S E X i t + β 4 ln R G D P i t + β 5 ln G D P C i t + β 6 ln I N S T i t + α i + μ i t
In Equation (8), (i = 1, 2, L, 30) represents 30 provinces in mainland China except Tibet. In this formula, t(t = 2006, 2007, L, 2015) is the sample observation period. C is the total carbon emissions of residents’ consumption. PSIZE is the size of the population. CHI is the 0–14-year-old children’s ratio. SEX is the gender ratio (female = 100). RGDP is GDP per capita. GDPC is the carbon emissions intensity. INST is the industrial structure. The data of the population size, 0–14-year-old children’s ratio, gender ratio, GDP per capita, carbon intensity and industrial structure were all derived from the Statistical Yearbook of China (2007–2016) [39], and some transformations and calculations have been made.

3.2.2. Variable Description

  • Population sizes (PSIZE). This paper used the number of households to represent the population size factor. Related research indicates that as the household numbers increase, two factors change in residents’ consumption: one is the increase in the basic unit of consumption, which inevitably leads to the expansion of the consumption scale and an increase in households’ total carbon emissions. The second factor is that as the number of households increases, the households shrink and consumption of some common consumer goods increases, which can also lead to an increase in the total carbon emissions of household consumption. Therefore, in theory, the increase in household numbers leads to an increase in the total carbon emissions of household consumption.
  • Zero-to-fourteen-year-old children’s ratio (CHI). In this paper, the proportion of the 0–14-year-old children of the total population is represented by CHI. This indicator is a factor that reflects the demographic structure. These children are not part of the working age population, their consumption type and consumption psychology have particularity, and their proportion changes inevitably lead to changes in residents’ consumption. The introduction of this variable is of practical significance because of the widespread implementation of the fetus policy.
  • Gender ratio (SEX). The gender ratio in this article is calculated by the female population = 100. A higher gender ratio indicates a larger male population. Males and females have different consumption propensities, and a change in the gender ratio leads to changes in the total carbon emissions of household consumption. Considering the reality of the gender imbalance in China, it is also of practical significance to introduce this variable.
  • Per capita income level (RGDP). This paper used GDP per capita to express RGDP. Based on the 2006-year base period, the GDP per capita was reduced by the gross domestic product index, excluding the effect of the price factor on GDP per capita. If people’s per capita income level is different, then they have different requirements for environmental and material consumption, which leads to differences in the total carbon emissions of household consumption. This paper presents the index as a wealth factor in the STIRPAT model.
  • Carbon emissions intensity (GDPC). Carbon intensity refers to the amount of carbon emitted by the one million GDP, or “carbon emissions per unit of GDP”. This index can be used as a technical factor in the STIRPAT model. If this indicator is low, it will inhibit the total carbon emissions of household consumption.
  • Industrial structure (INST). In this paper, the proportion of the second industrial added value to the GDP was used to express the INST. Production determines consumption; differences in industrial structures lead to different consumption structures, and differences in consumption structures affect the total household carbon emissions. Therefore, in addition to the above variables, which are used to embody the three factors of population, wealth and technology in the model, this paper introduces the industrial structure, which can reflect changes in the production structure.
The independent variables mentioned above are presents in Table 5 in original units.
The method model and research concept of this paper are presented in Figure 1.

4. Results and Analysis

4.1. Calculation and Analysis of the Total Carbon Emissions of China’s Household Consumption

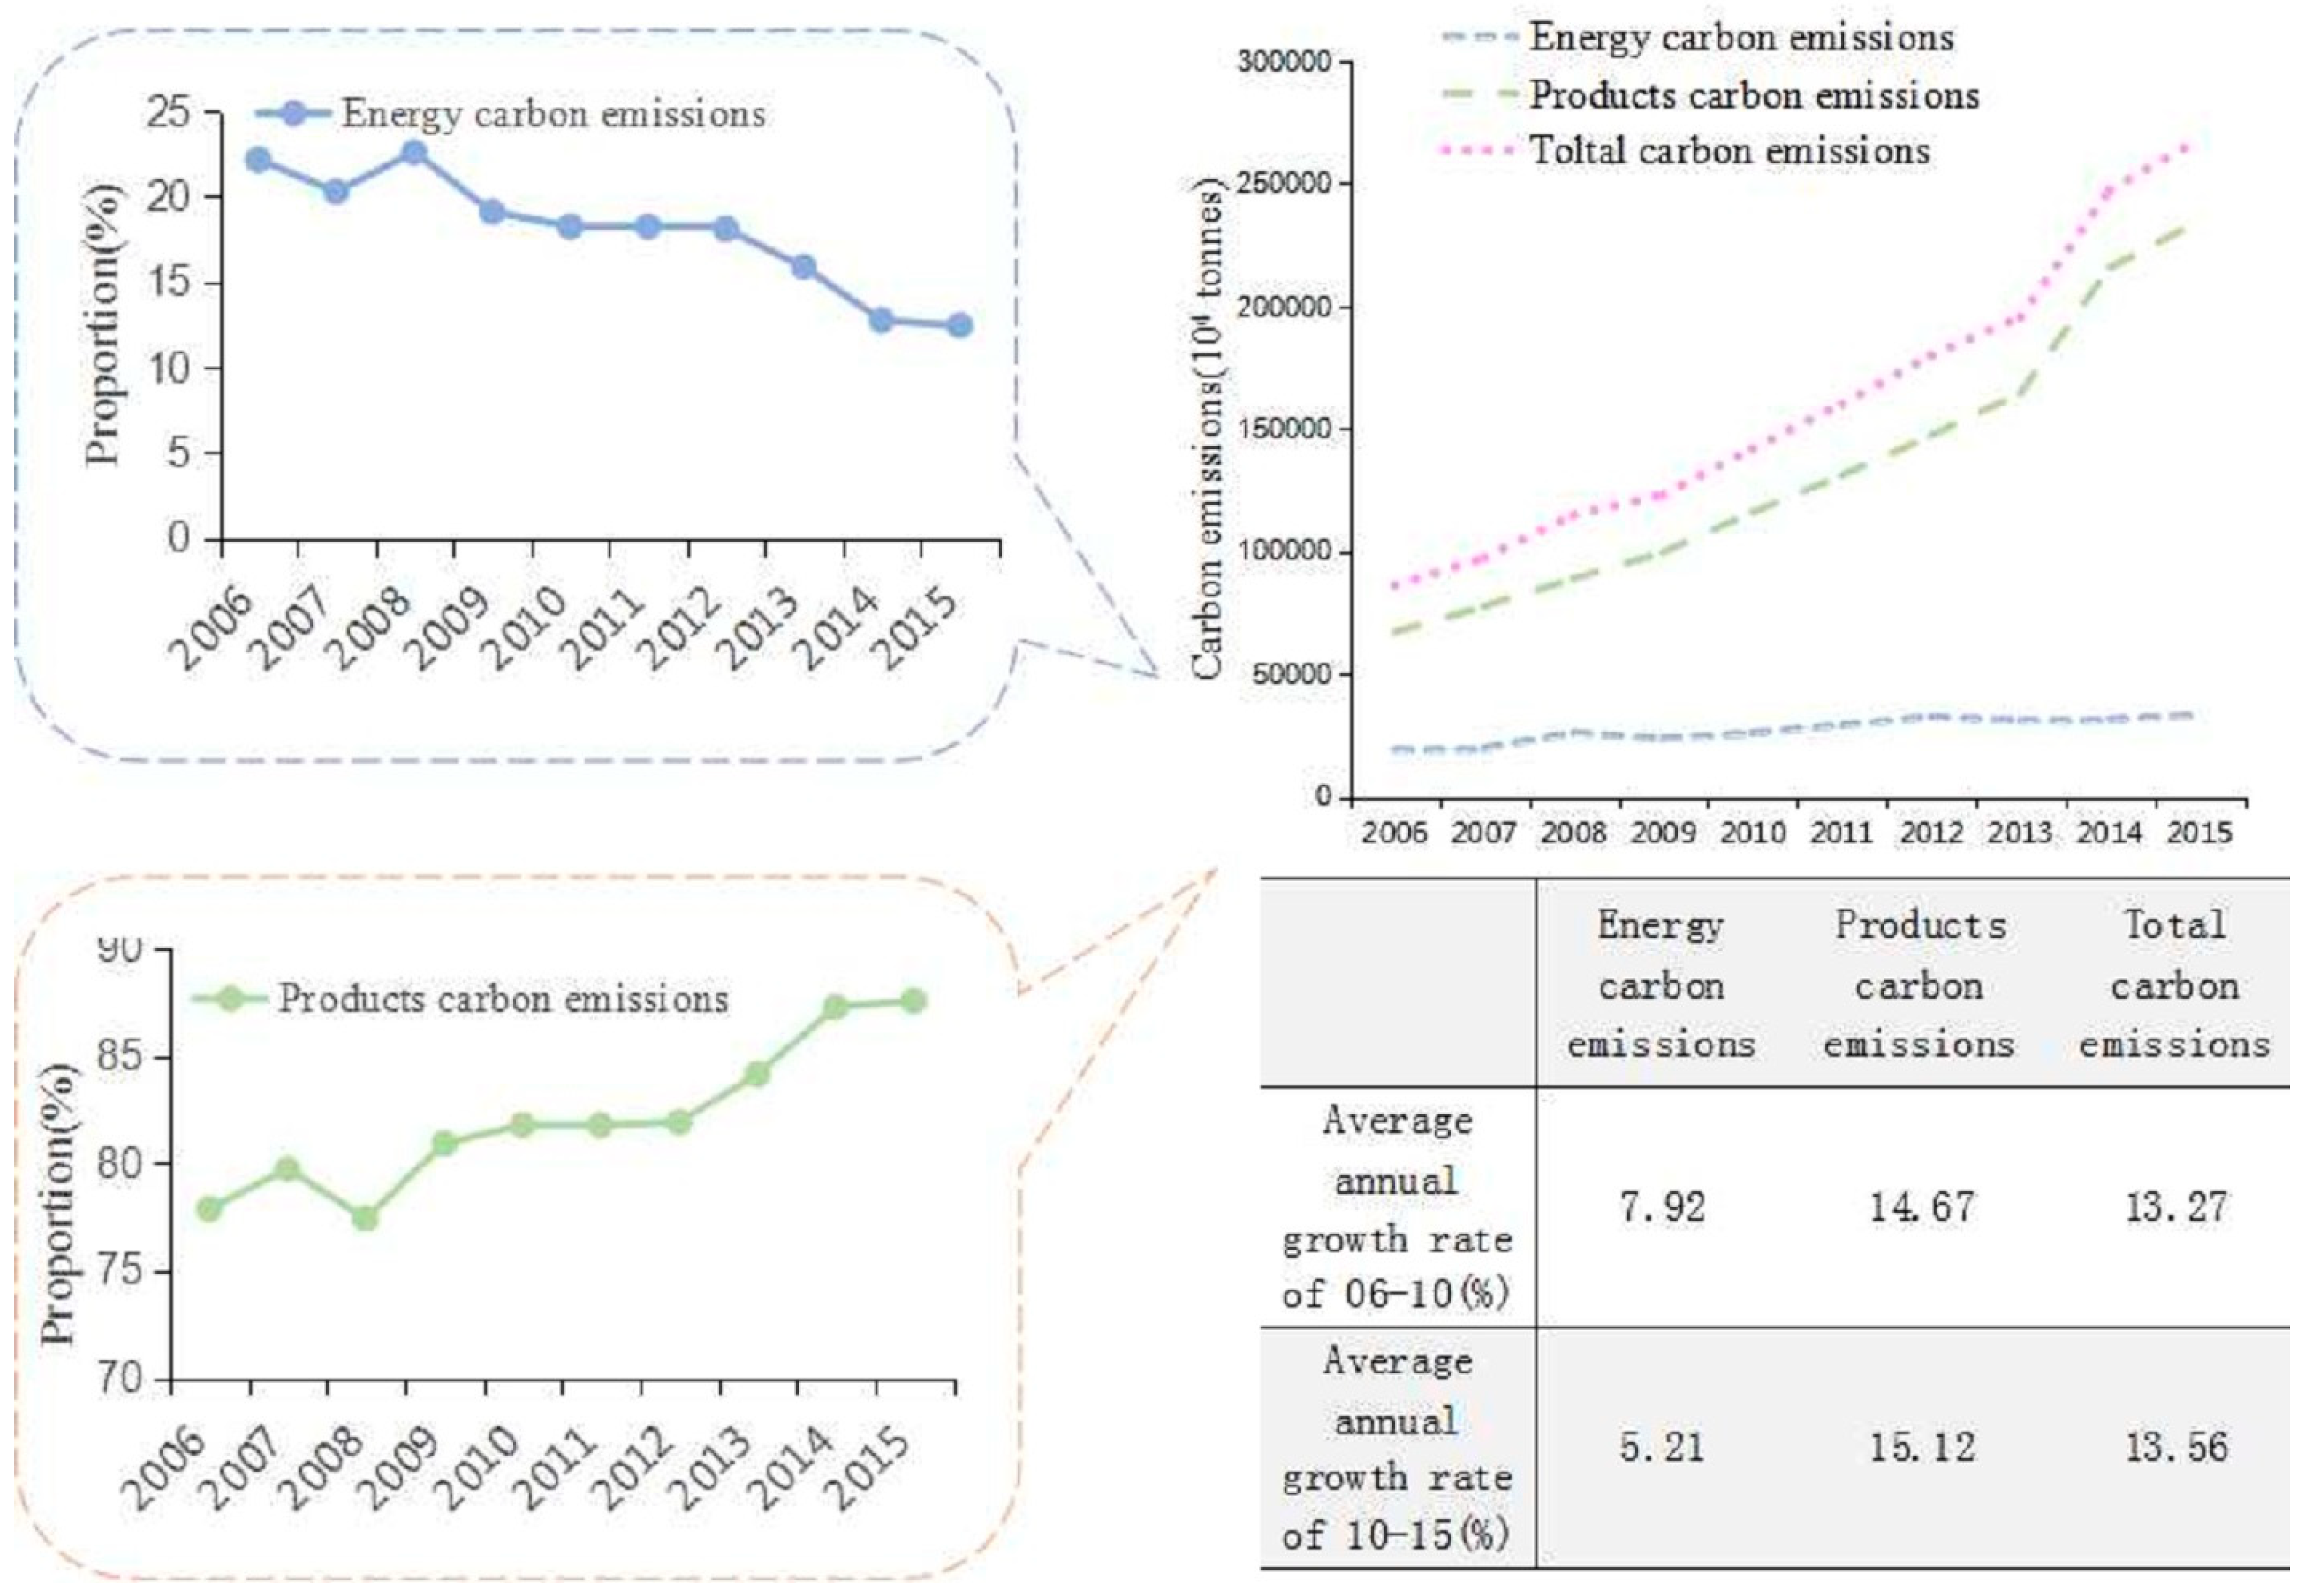
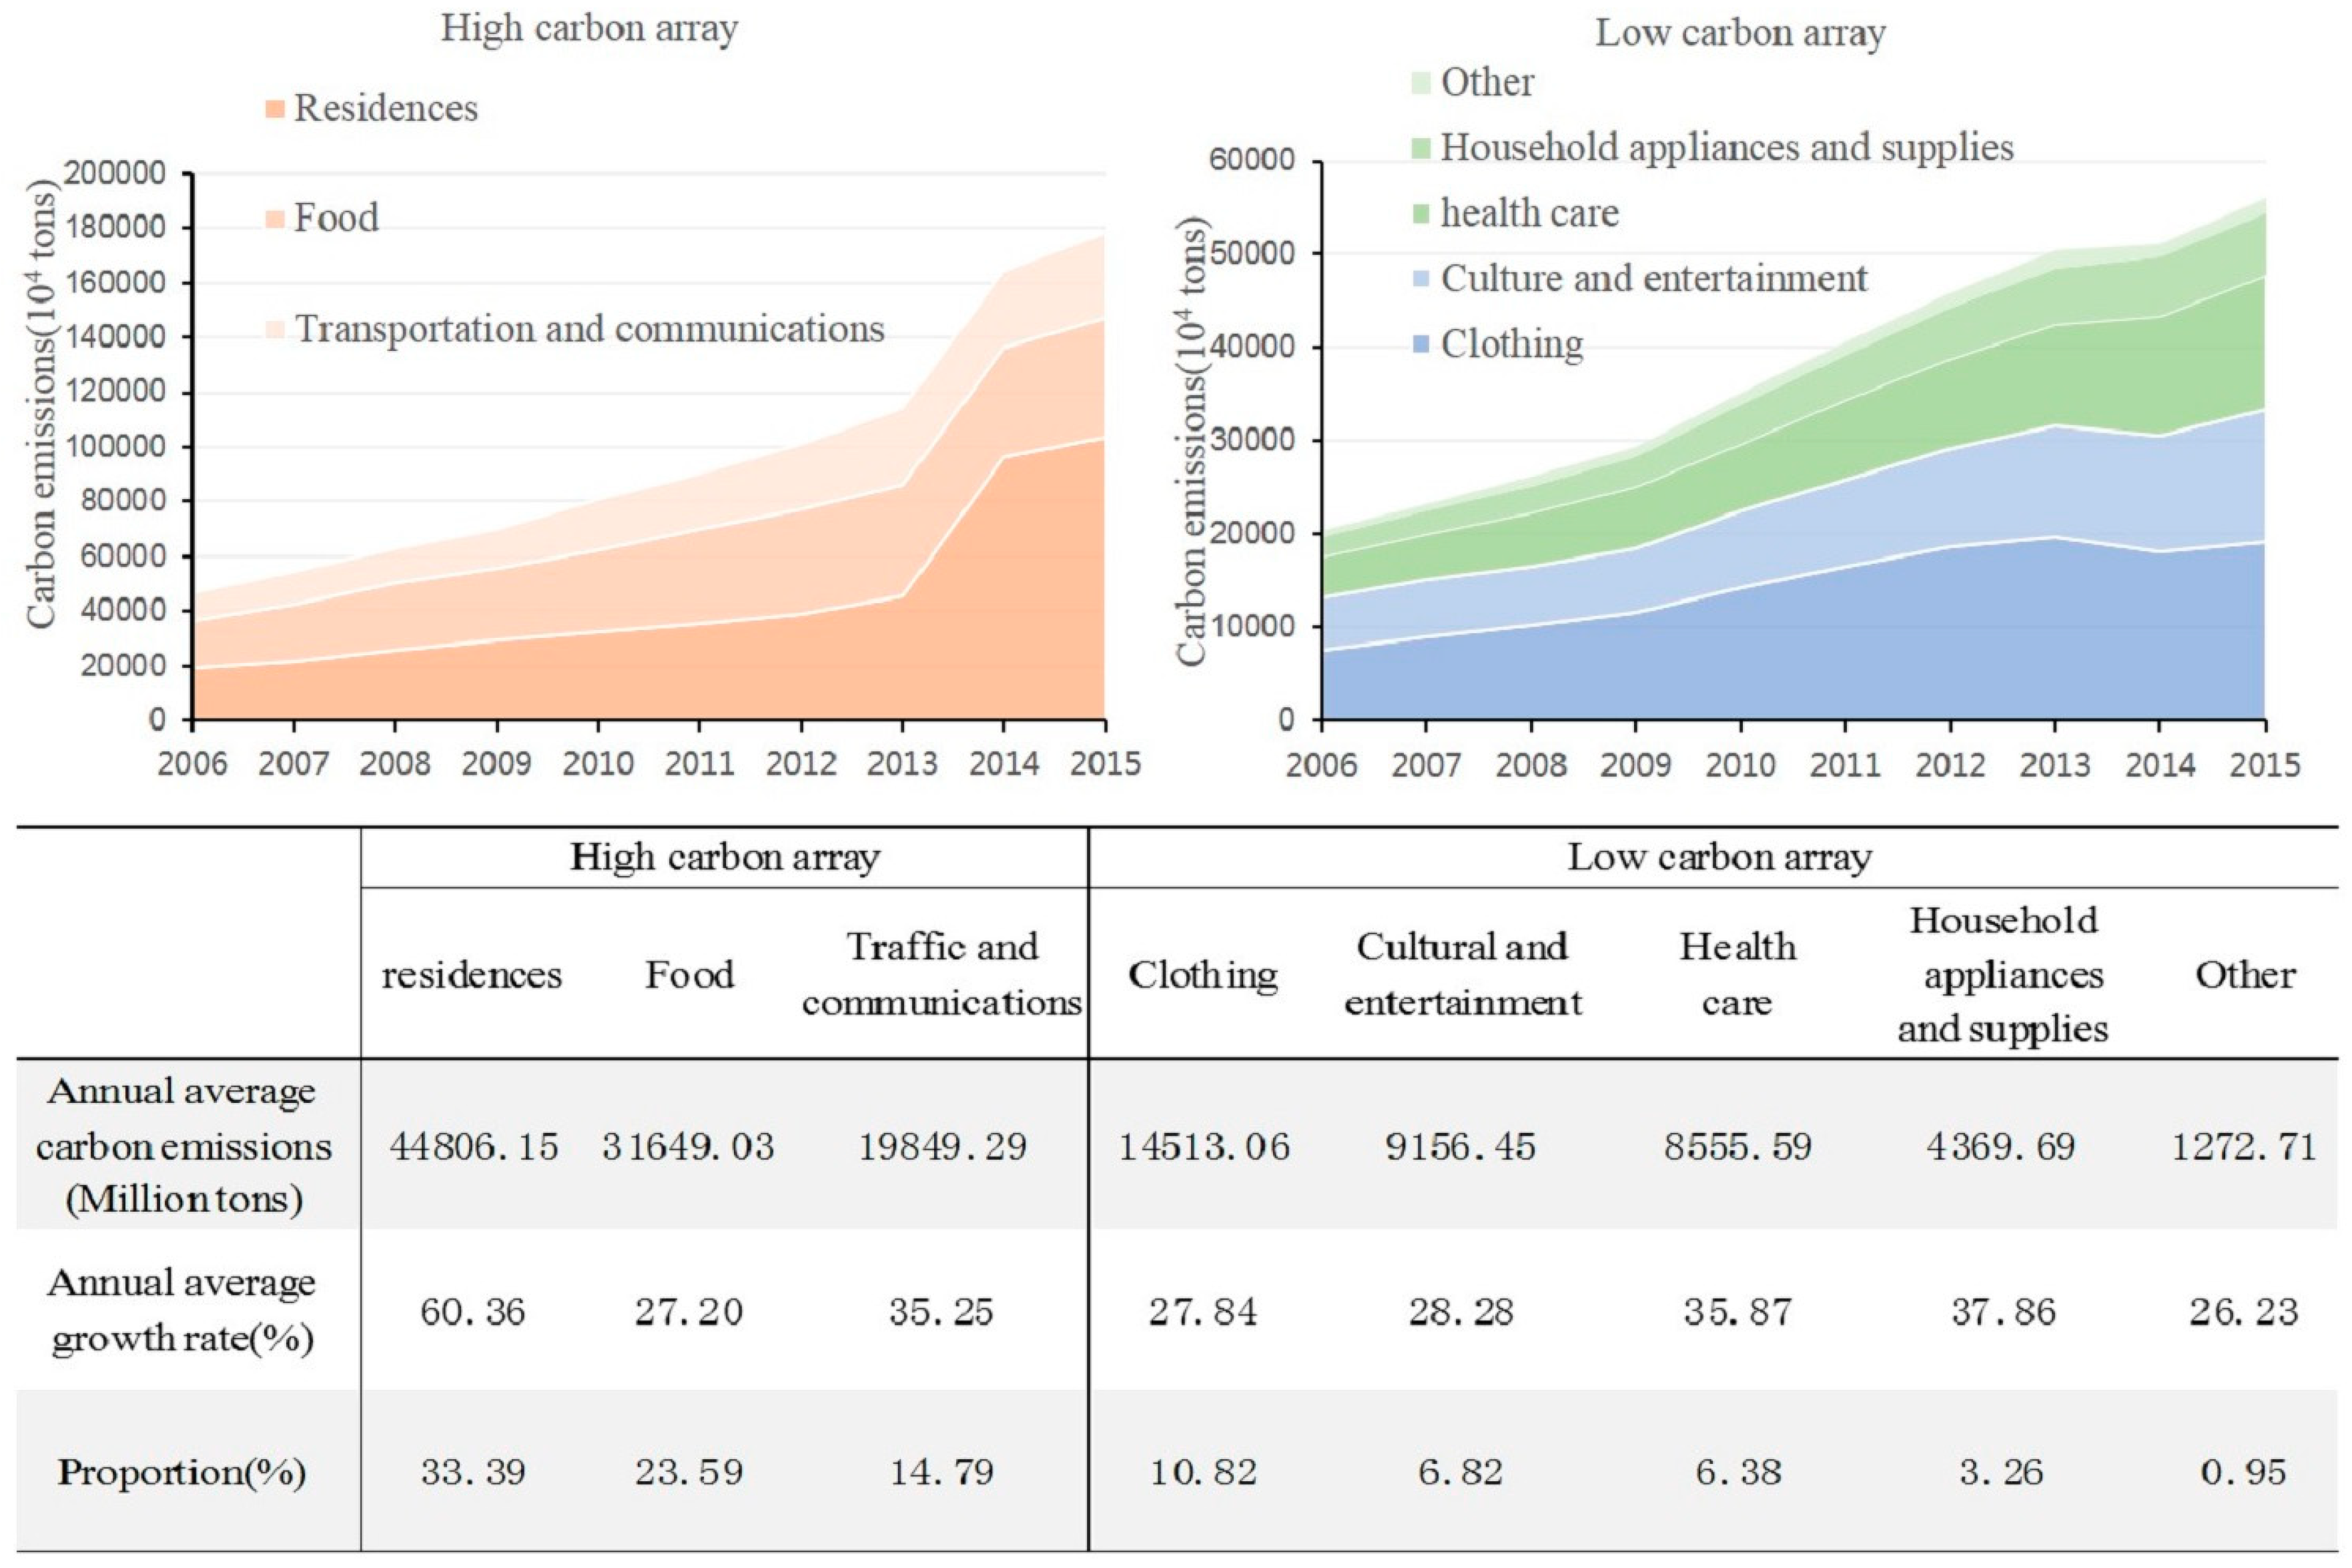
4.1.1. Analysis of The Scale and Composition of the Total Carbon Emissions of China’s Household Consumption

According to Equation (2), we can estimate the energy carbon emissions of China’s household consumption from 2006 to 2015, and according to Equation (5), we can estimate the products’ carbon emissions of China’s household consumption from 2006 to 2015; the total carbon emissions of China’s households can be obtained by adding the two together. The changes in the size and composition of the total carbon emissions of China’s households from 2006 to 2015 are presented in Figure 2.
According to the general trend of change, the energy carbon emissions of China’s household consumption, products carbon emissions of China’s household consumption and total carbon emissions of China’s household consumption from 2006 to 2015 are increasing. In 2006, the energy carbon emissions from China’s households were 190.74 million tons; in 2010, the energy carbon emissions reached 258.72 million tons, which reflected an average annual growth rate of 7.92%. In 2015, the energy carbon emissions of China’s household consumption grew to 333.44 million tons, with an average annual growth rate of 5.21% from 2010 to 2015.
In 2006, the products carbon emissions from China’s households were 670.68 million tons; by 2010, the emissions had increased to 1159.52 million tons, an average annual growth rate of 14.67%. By 2015, the products carbon emissions of China’s household consumption had increased further to 2344.90 million tons; the annual average growth rate from 2010 to 2015 was 15.12%. In 2006, the total carbon emissions from China’s households were 861.41 million tons, reaching 1418.24 million tons in 2010, with an average annual growth rate of 13.27%. In 2015, the total carbon emissions of China’s household consumption grew to 2678.35 million tons, with an average annual growth rate of 13.56% from 2010 to 2015. Thus, the rate of the products carbon emissions of China’s household consumption grew faster than that of the energy carbon emissions of China’s household consumption. In the future, the products carbon emissions of China’s household consumption will increase further, which is the primary force stimulating the total carbon emissions from China’s households. In terms of structural changes, the products carbon emissions of China’s household consumption have accounted for more than 70% of the total carbon emissions from China’s households from 2006 to 2015. In 2006, it was 77.86% and grew to 87.55% by 2015. The proportion of energy carbon emissions of China’s household consumption has hovered at approximately 20%, and there has been a downward trend in recent years. With the rapid development of China’s economy and the improvement of living standards, the people’s desire to consume is strengthened. Thus, the products carbon emissions of China’s household consumption and total carbon emissions of China’s household consumption are bound to demonstrate rapid growth. Simultaneously, progress in science and technology and the promotion of clean energy, such as wind and water, have slowed the growth of the energy carbon emissions of China’s household consumption.

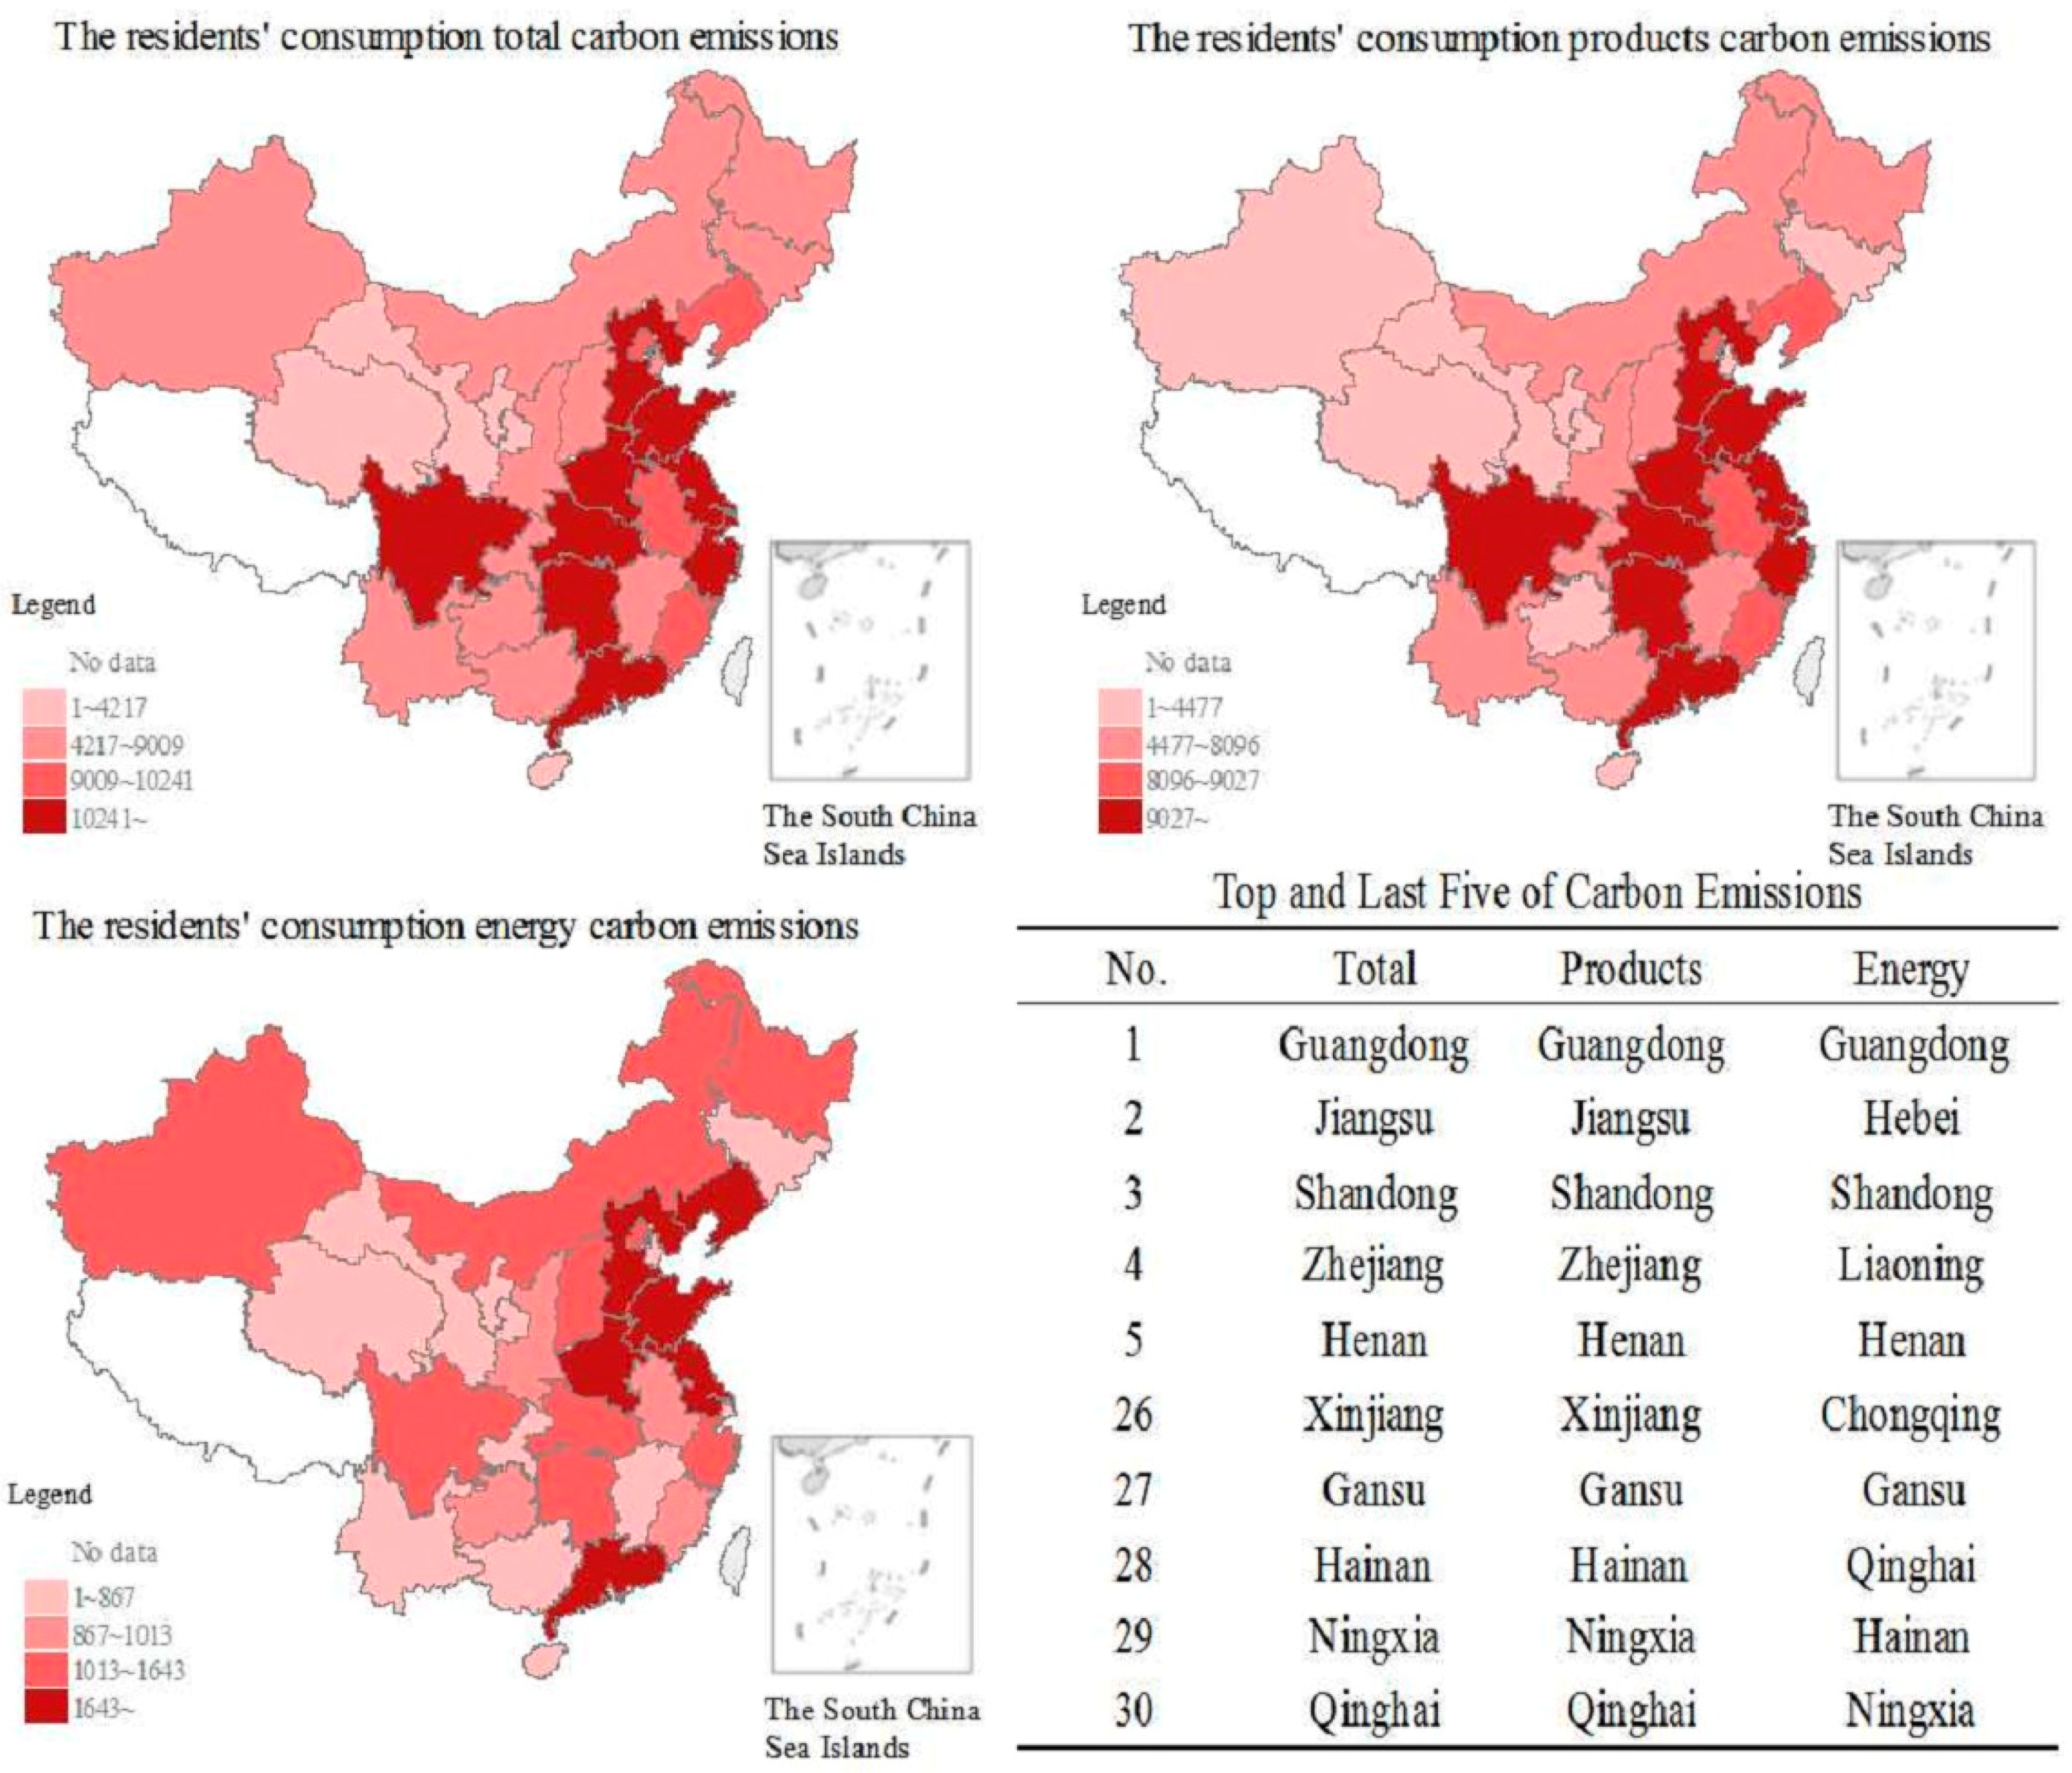
4.1.2. Analysis of the Regional Characteristics of Total Carbon Emissions from China’s Household Consumption

Because of the vastness of the Chinese territory, the region’s economic development status, living habits, population distribution and geographical locations have extremely large differences. Thus, China’s regional residents’ consumption and consumption structure differ greatly, leading to regional differences in total carbon emissions from China’s household consumption. Figure 3 presents the spatial distribution of total carbon emissions from China’s household consumption in 2015. Figure 3 indicates clear regional differences in total carbon emissions from China’s household consumption. There are ten provinces with a total carbon footprint of more than 1 billion tons, whereas households in the lower provinces consume approximately 10 million tons of total carbon emissions. Rounding out the top five are Guangdong (274.92 million tons), Jiangsu (196.05 million tons), Shandong (176.82 million tons), Zhejiang (167.89 million tons) and Henan (136.93 million tons). The common characteristics of these provinces are their vast areas and large populations. Although Beijing and Shanghai do not have the advantages of area and population, they do have developed economies and population flow; their household consumption total carbon emissions reached 99.87 million tons and 111.59 million tons, which were located in the forefront of 30 provinces. The bottom five were Qinghai (9.98 million tons), Ningxia (10.98 million tons), Hainan (14.29 million tons), Gansu (35.22 million tons) and Xinjiang (42.19 million tons); the majority of these provinces are located in the midwest, in which there is less population and economic development is relatively backward.
Because products’ carbon emissions accounted for approximately 80% of the total carbon emissions from China’s household consumption, they are a major component of China’s household consumption carbon emissions. The geographical distribution of products carbon emissions is identical to that of the total carbon emissions from China’s households. The same provinces are at the top and bottom of the list of China’s household consumption products carbon emissions and China’s household consumption total carbon emissions. The geographical distribution of the energy carbon emissions of China’s households is quite different from that of the former two. The regional distribution of the energy carbon emissions of China’s households indicates a significant difference between the north and south, and the energy carbon emissions of households in northern areas are higher than those in the south, which indicates that the total carbon emissions of China’s households and the products carbon emissions of China’s households are greatly influenced by the economic development level and population factors, whereas the regional distribution of the energy carbon emissions of China’s households is relatively more vulnerable to the geographical location. Heating in the north consumes more fossil energy in winter, leading to more energy carbon emissions from households in the north than in the south as a whole. Liaoning Province, a typical area, ranked thirteenth in the products carbon emissions of households (81.15 million tons) and fourth in the energy carbon emissions of household consumption (17.82 million tons).

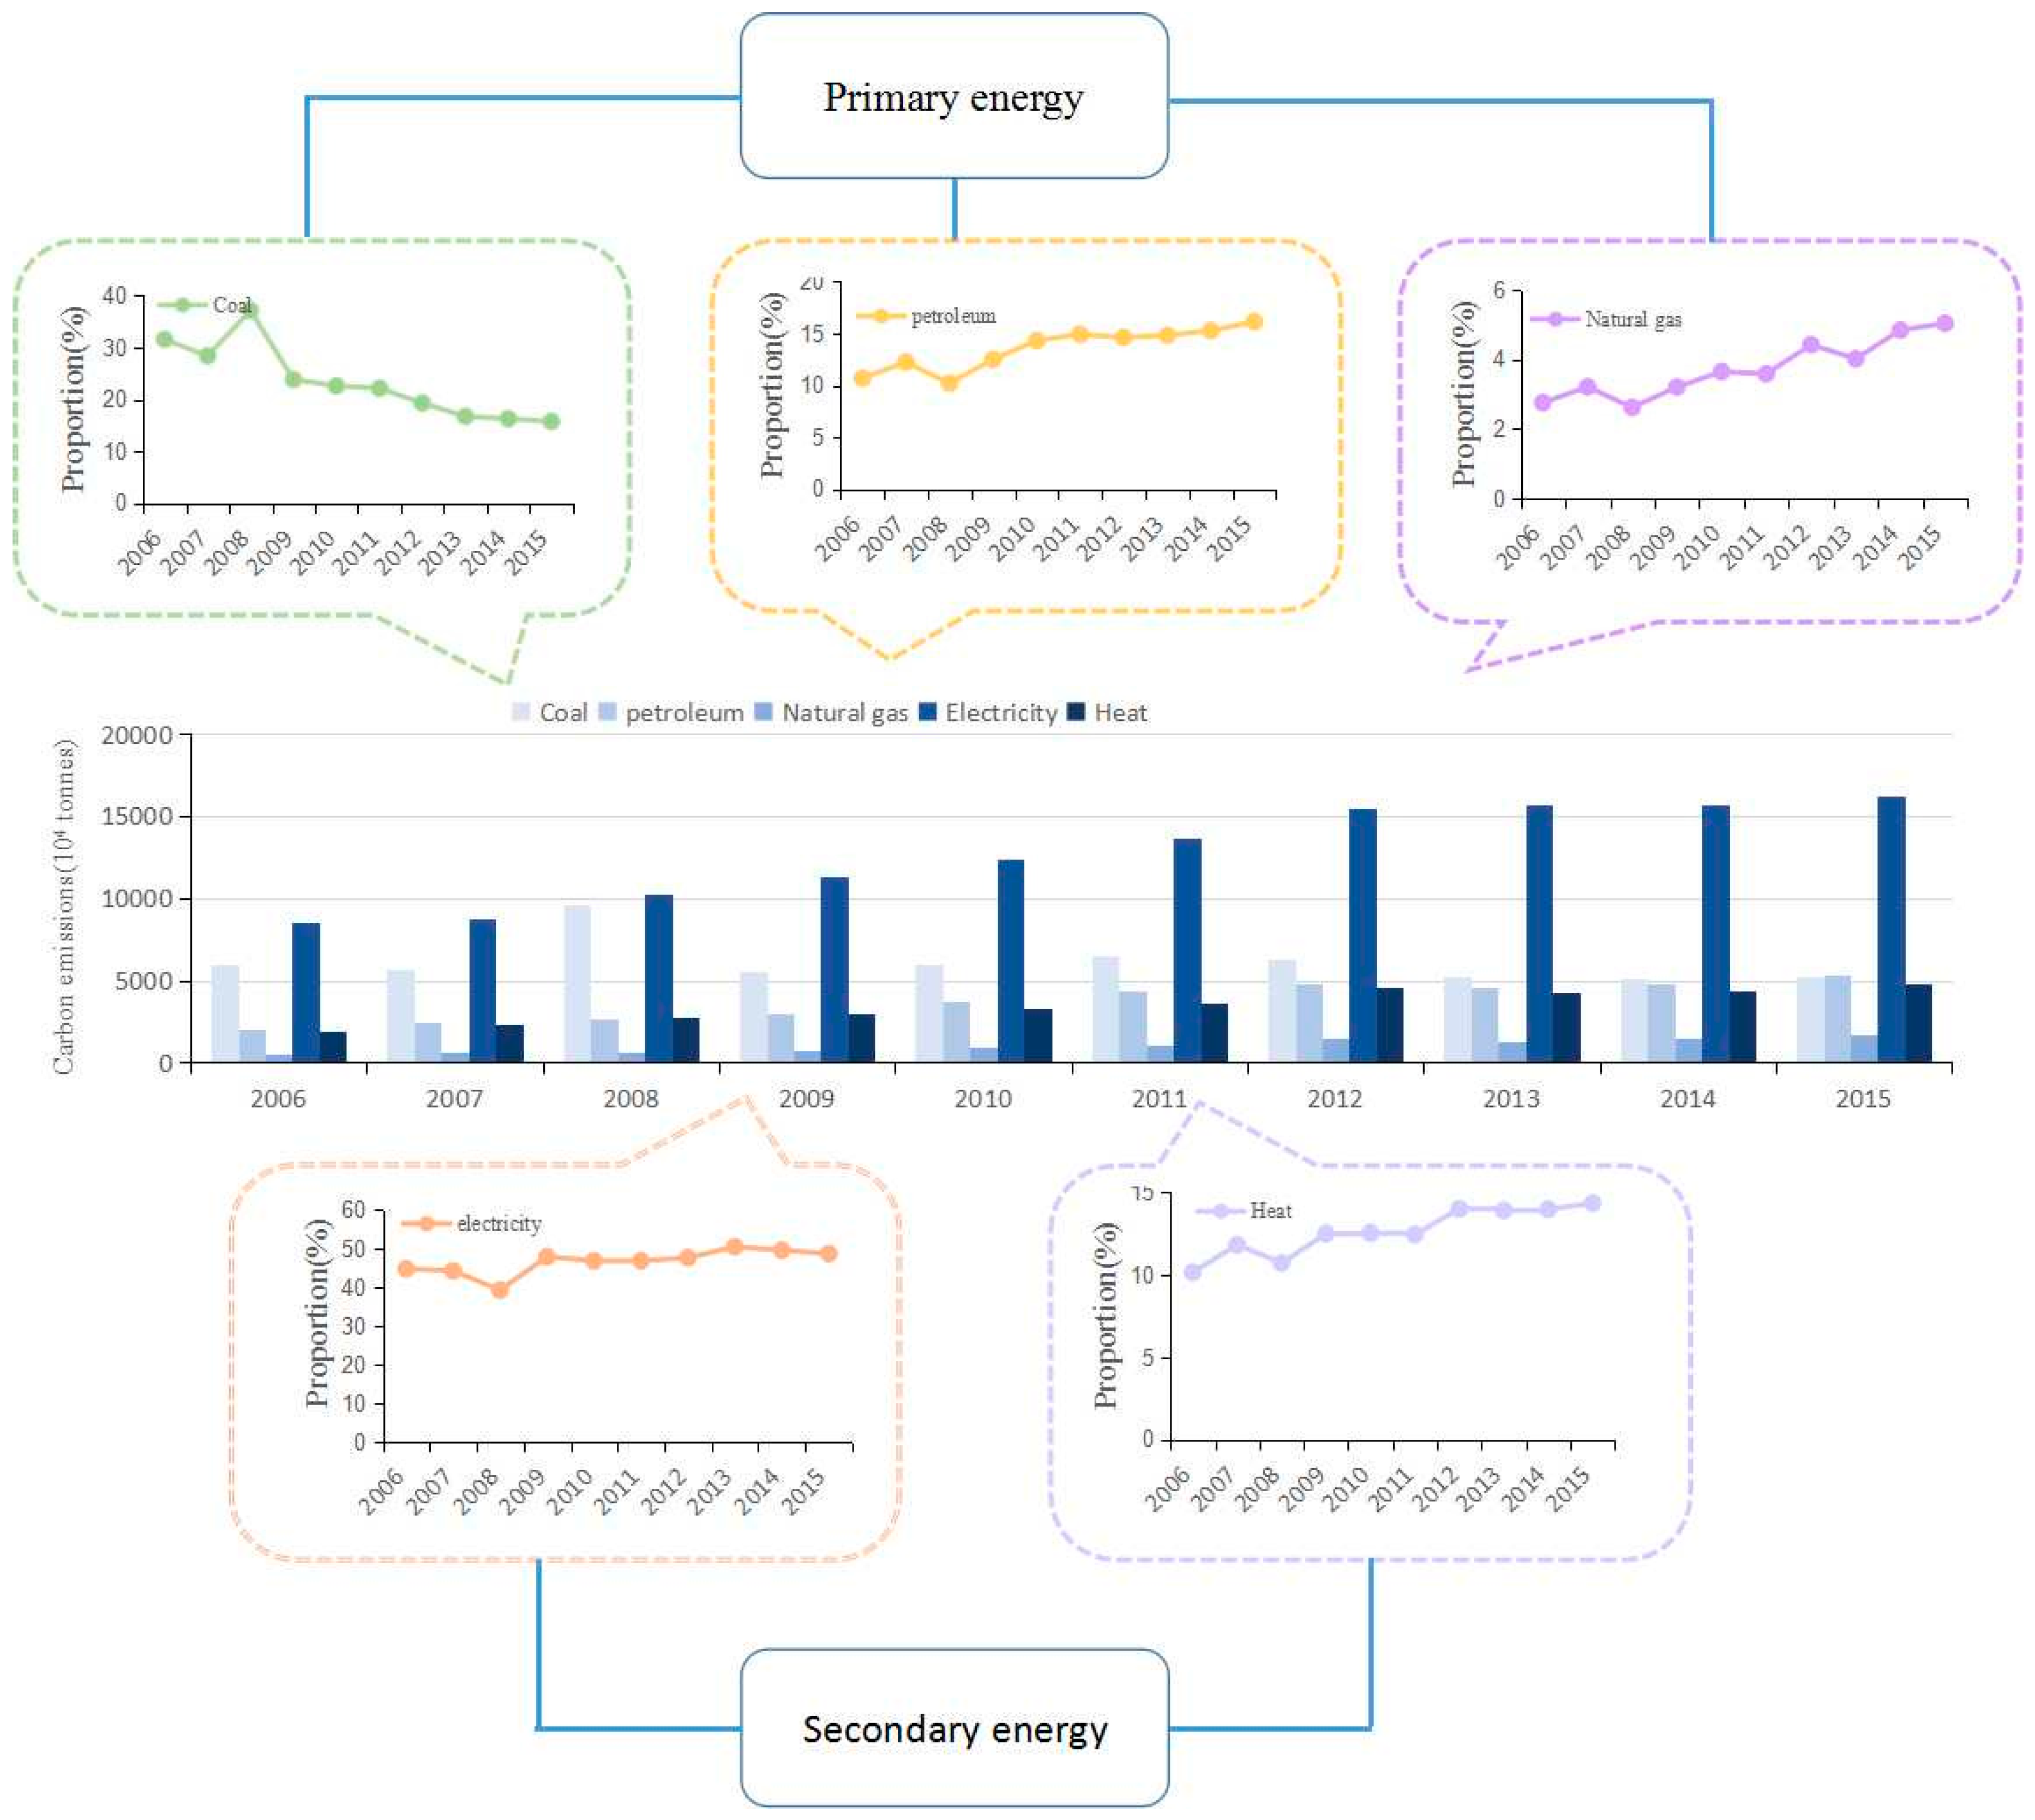
4.1.3. Analysis of the Sources of Energy Carbon Emissions from China’s Household Consumption

The energy carbon emissions of household consumption refer to the carbon emissions produced by residents’ consumption of energy products in their daily lives. The energy products here refer to coal, petroleum, natural gas, electricity and heat. Because different energy products have different levels of cleanliness, different energy consumption combinations affect carbon emissions.
Figure 4 is the contribution of five energy sources to the energy carbon emissions of China’s household consumption. As seen in Figure 4, from 2006 to 2015, the carbon emissions generated by the electricity supply were the primary source of the energy carbon emissions of China’s household consumption; the proportion of the change was not small, between 40% and 50%. The second-highest contribution to the energy carbon emissions of China’s household consumption was carbon emissions from coal consumption; however, the proportion was in a downward trend from 2006 to 2015 and was reduced to 15.73% by 2015. Carbon emissions from coal consumption are already lower than those generated by petroleum and heat consumption. Of the three primary sources of energy, coal has the highest carbon emission coefficient. The reduction of coal consumption is due to the optimization of the energy consumption structure, which has a certain inhibitory effect on the energy carbon emissions of China’s household consumption. The total carbon emissions generated by these three types of energy, petroleum, natural gas and heat, account for approximately 30% of the energy carbon emissions of China’s household consumption. Although the proportion is not large, it is increasing. In general, the carbon emissions generated by residents’ consumption of various energy sources continue to grow, and the pressure on the environment cannot be ignored.

4.1.4. Analysis of the Sources of Products Carbon Emissions from China’s Household Consumption

The products carbon emissions of household consumption refer to the carbon emissions generated by the consumption of non-energy products in daily life. The products carbon emissions of household consumption come from household consumption of food, clothing, residences, household appliances and supplies, transportation and communications, culture and entertainment, health care and other types of consumer goods.
In this paper, the products carbon emissions of eight types of consumer goods were divided into a high carbon group and a low carbon group. The high carbon group included residences, food, transportation and communications. The low carbon group included clothing, culture and entertainment, health care, household appliances and supplies. Figure 5 presents the change in products carbon emissions of eight consumer goods and indicates clear differences in products carbon emissions from different client categories. The largest average amount of carbon emissions comes from the residence category, and its annual products carbon emissions is 448,060 tons, which is increasing yearly. In 2006, the products carbon emissions of residences was 1904.3 million tons, which increased to 1034.56 million tons in 2015, with an average annual growth rate of 20.69%. The residence rate was followed by food (316.49 million tons) and transportation and communications (19,849 million tons). Products carbon emissions from the first three high carbon sequestrations accounted for 71.78% of the products carbon emissions of all eight types of consumer goods. Products carbon emissions from other and household appliances and supplies were low, accounting for only 4.21 percent of the total products carbon emissions of household consumption. Clearly, the products carbon emissions of China’s household consumption are characterized by a high concentration in the consumption category. In general, the products carbon emissions of eight consumer products are increasing yearly, which places increasingly more pressure on the environment.
Summary: The total carbon emissions of China’s household consumption increased during the study period, and the regional differences are clear. The consumption mix of different energy and non-energy products significantly affected the total carbon emissions of China’s household consumption.

4.2. Analyses of the Factors Influencing the Total Carbon Emissions of China’s Household Consumption

4.2.1. Parameter Estimation Results of Panel Data Model

Based on panel data of 30 provinces in China from 2006 to 2015, this paper used the developed STIRPAT model to analyse the factors influencing the total carbon emissions of China’s household consumption using Stata12.0 software.
In order to determine whether the impact of GDP per capita on China’s consumption of total carbon emissions was consistent with the Kuznets hypothesis, the square of GDP per capita was introduced as an explanatory variable in model (1) [25]. If the coefficient of the square of GDP per capita was negative and the t-test under a given condition was adopted, it indicates that the impact of GDP per capita on the total carbon emission of Chinese residents was consistent with the Kuznets hypothesis. The Hausman test results of model (1) and model (2) were shown in Table 6, and both model (1) and model (2) chose fixed effect model. The estimation results of the fixed effect model were presented in Table 7. In the model (1), the coefficient of the square of GDP per capita did not pass the t-test, which showed that the impact of GDP per capita on the consumption of carbon emissions by Chinese residents did not conform to the Kuznets hypothesis. Further, the square of GDP per capita was removed from the model (1) to obtain the model (2). From the estimation results of model (2), regression models adjusted R 2 is close to 1, and the overall significance test of the model of the F test indicated that the p value was less than 0.05; thus, the overall model fitting effect was good. All of the coefficients of the explanatory variables passed the t test under the given condition, and the fitting effect of each coefficient was good.

4.4.2. Analysis of Influencing Factors

  • The influence coefficient of the number of households is 0.7903, which indicates that the increase in the number of households will lead to an increase in total carbon emissions of China’s household consumption. First, the increase in the number of households indicates the increase in the number of basic units of consumption, which will lead to the expansion of the consumption scale and hence to an increase in total household carbon emissions. Second, the increase in the number of households represents, to a certain extent, shrinking family units and some increase in the public consumption of consumer goods, which will lead to an increase in the total carbon emissions from China’s households.
  • The influence factor of the age structure factor of the 0–14-year-old children’s ratio was 0.5729. Considering other invariable factors, each additional unit will lead to a 0.5729 increase in total carbon emissions from China’s households, with a significant effect on the total carbon emissions of China’s household consumption. This is because education expenditure accounts for about 7% [6] of household consumption expenditure, which has a great impact on family consumption tendency. The effect of increasing the ratio of total carbon emissions from household consumption is more complicated [42]: in the short term, education expenses will stimulate the growth of household consumption and thus lead to an increase in the total carbon emissions from household consumption. In the long run, the increase in the number of children will increase social and economic burdens, such as parents meeting their children’s consumption needs, which may inhibit the fulfilment of the parents’ own needs. At the national level, society as a whole must devote more human, physical and financial resources to protecting and raising children and adolescents, which will certainly reduce investment in other areas. Thus, the increase in the number of children in the long term will inhibit economic growth, thereby indirectly reducing total carbon emissions from households. At present, the role of Chinese children in the total carbon emissions from household consumption is primarily reflected in the short-term effects (the influence coefficient is positive); thus, with the implementation of the fetus policy, the total carbon emissions of China’s household consumption will be further increased.
  • The influence coefficient of the gender ratio was 0.3282, indicating that with other factors unchanged, the total carbon emissions of China’s household consumption will increase by 0.3282 units per unit of increase in the gender ratio. Compared with the age factor, the gender ratio has a weaker effect on the carbon emissions from China’s household consumption. People of different genders have different needs for consumer goods, which leads to the difference of consumption carbon emissions. According to a previous article, of the eight consumer products of residents, the high-carbon group includes residences, food and transportation and communications, accounting for 71.78% of the products carbon emissions of China’s household consumption. Among these three types of consumer goods, the consumption of residences is mostly family public consumption, and the gender difference does not have much influence in this area. In terms of food consumption, for physiological reasons, men consume more food than women and are more likely to consume meat, leading to higher products carbon emissions from food consumption than women. In the area of transportation and communications, the majority of people who buy private cars are male, which leads men to consume more than women in this area. Products carbon emissions from men’s consumption in transportation and communications are higher than women’s. With the implementation of the fetus policy, the imbalance of the gender ratio will improve; in the long run, the development trend of China’s gender ratio is conducive to reducing the total carbon emissions of household consumption.
  • The absolute value of the effect coefficient of the per capita GDP is the largest (1.1215) and has the most significant effect on the total carbon emissions of China’s household consumption. First, the per capita GDP is higher, indicating that the living standards of the residents in the region are higher and that they are more inclined to high-energy consumption and high-carbon emission products. Second, GDP per capita reflects the overall level of economic development in the region. Higher levels of economic development lead to greater production and consumption demands supported by the entire region’s economic development and the inevitable increase in total carbon emissions from household consumption.
  • The influence coefficient of the technical factor of the carbon emission intensity is 0.0839, which trends in the same direction as the total carbon emissions of China’s household consumption. Therefore, the improvement of technology can promote the improvement of energy use efficiency, thereby inhibiting the total carbon emissions of household consumption, which is an effective manner in which to reduce the total carbon emissions of household consumption.
  • The influence coefficient of the industrial structure on the total carbon emissions of household consumption is -0.6236. In recent years, with the development of China’s economy and the upgrading of the industrial structure, tertiary industry has developed rapidly. The improvement in people’s living standards has caused people to no longer be satisfied with the basic necessities of food and clothing and has increased the consumption demand for entertainment and enjoyment, which are mostly in tertiary industries. Therefore, the development trend of China’s industrial structure and the total carbon emissions of China’s household consumption are moving in the reverse direction.
Summary: The number of households, 0–14-year-old children’s ratio, gender ratio, GDP per capita and carbon emissions intensity are moving in the same direction as the total carbon emissions of China’s household consumption. The industrial structure and carbon emissions of China’s household consumption are moving in the opposite direction.

5. Discussion

5.1. Comparisons between this Paper and Previous Studies

This paper measures the total carbon emissions from household consumption in 30 provinces in China from 2006 to 2015 and analyses their influencing factors based on the STIRPAT model. The research results of this paper have similarities with and differences from previous studies.
With regard to the scale and composition of total carbon emissions of China’s household consumption, this paper and the studies of Peng [11], Wu [12], Wei [17], and Tang [26] observed that the total carbon emissions of China’s household consumption increased during the study period. Products carbon emissions from households are the primary component of the total carbon emissions from households. This is because as the standard of living of Chinese residents increases, people’s consumption increases and they tend to consume products that produce more carbon emissions in the production process; therefore, the total carbon emissions of household consumption is increasing. However, this article observed that carbon emissions from residents’ consumption of electricity are the focal components of energy carbon emissions from China’s households. In products carbon emissions of China’s household consumption, products carbon emissions from residents’ consumption of transportation and communications occupy three of the eight categories of consumer goods. Products carbon emissions from residents’ consumption of culture and entertainment are ranked fifth. The research results of Wei et al. [17] indicated that the energy carbon emissions of China’s household consumption were primarily from residents’ consumption of coal. In products carbon emissions of China’s household consumption, the residents’ products carbon emissions from culture and entertainment consumption were higher than the residents’ products carbon emissions from transportation and communications consumption. This is because the research period of Wei et al. [17] was from 1999 to 2002, and the research period of this paper was from 2006 to 2015. As time passed, residents’ consumption of energy products diversified; residents tended to consume more clean energy and consume less coal. In recent years, traffic communication products have rapidly been popularized, and private cars and mobile phones have caused residents’ consumption of transportation and communications to increase significantly.
The analysis of the factors influencing the total carbon emissions of China’s household consumption, consistent with Du [21], Fu [25], and Ji [27] et al., determined that the population size, per capita GDP and carbon emission intensity have a driving effect on China’s household consumption total carbon emissions. However, this paper argues that the effect of the per capita GDP on China’s household consumption total carbon emissions has exceeded the population size factor, which differs from previous research. The effects of economic development on total carbon emissions from household consumption extends beyond the demographic factor: this gap will widen further in the future, and the effect of economic factors on the total carbon emissions of China’s household consumption will be increasingly more significant.

5.2. Significance of This Study in Other Countries and the Limitations of This Study

The methods and the conclusions of this paper not only apply to China but also to other countries. In recent years, the birth rate in developing countries has remained high. Residents’ consumption presents a new and changing characteristic, which will lead to further aggravation of carbon emissions from household consumption. Richard et al. [28] found that the increase in total population was the main factor that led to the increase of energy consumption in EU countries. This is consistent with the conclusion of this paper, which shows that the impact of total population on energy consumption and carbon emissions is the same in different countries. Yeh et al. [43] found that the increase in population and the proportion of the working-age population will lead to an increase in energy consumption in Taiwan. This is consistent with the findings of this study, which show that changes in population and population structure have significant effects on energy consumption and carbon emissions. Because of the diminishing efficiency of industrial emissions reduction, it is obviously more effective and reasonable to reduce carbon emissions from the consumer side. To measure the products carbon emissions of China’s household consumption in consecutive years, this paper adopted the Consumer Lifestyle Approach (CLA), which measures the products carbon emissions from terminal consumption. Because there is no combination of an input-output table and a lack of dependence on industry, products carbon emissions from household consumption may be underestimated.

6. Conclusions and Suggestions

6.1. Conclusions

In this paper, the carbon emissions coefficient method and Consumer Lifestyle Approach (CLA) were used to measure the total carbon emissions of China’s household consumption from 2006 to 2015. This paper analyzed the spatio-temporal characteristics of total carbon emissions from China’s households and the sources of total carbon emissions from China’s households. On this basis, using the STIRPAT model as the theoretical basis, this paper expanded the model by introducing factors such as the number of households, 0–14-year-old children’s ratio, gender ratio, per capita GDP, carbon emissions intensity and industrial structure; constructed the panel data model of the total carbon emissions of China’s household consumption; and analyzed the effects of six factors on the total carbon emissions of China’s household consumption. Main conclusions of this paper are shown in Table 8. The research of this paper resulted in the following conclusions:
First, in terms of the scale and structural changes of total carbon emissions from China’s households, energy and products carbon emissions and total carbon emissions from China’s households have been increasing in recent decades. Products carbon emissions from China’s households are the primary source and primary driving force of the total carbon emissions of China’s household consumption. With the further development of the economy, the total carbon emissions of China’s household consumption will continue to increase over a long period of time.
Second, in terms of the spatial distribution of the total carbon emissions from China’s households, the results indicated that the high-carbon platoon is primarily distributed in the east and the middle region and that the carbon emissions level is low in the western region, which is primarily influenced by regional economic development levels. The regional distribution of energy carbon emissions from China’s households is also affected by geographical factors, such as the geographical location; its regional distribution demonstrates clear north-south differences, and the energy carbon emissions from households is higher in the north than in the south.
Third, with regard to the source of total carbon emissions from China’s households, the proportion of carbon emissions generated by electricity and coal consumption in energy carbon emissions from China’s household consumption is greater, representing 47% and 22% of energy carbon emissions from China’s household consumption in the past decade, respectively. For products carbon emissions of China’s household consumption, residences, food, and transportation and communications belong to the high carbon emissions group. Products carbon emissions of these three types of high-carbon emission products account for more than 70% of the total products carbon emissions.
Finally, with regard to the effects of the variables on the total carbon emissions from China’s households, the number of households, 0–14-year-old children’s ratio, gender ratio, GDP per capita and carbon emissions intensity were positively correlated with the total carbon emissions of China’s household consumption. The industrial structure was negatively correlated with the total carbon emissions of China’s household consumption.

6.2. Suggestions

According to the study, consumption carbon emission of Chinese residents was still on the rise, and the regional distribution was obviously different. Demographic, economic and technological factors had significant impacts on Chinese residents’ consumption of carbon emissions. Therefore, in terms of policy design, the first step should be to formulate targeted policies to guide and encourage residents to adopt low-carbon consumption patterns, and secondly, to improve energy use efficiency and reduce carbon intensity by promoting technological innovation.
In response to a series of emission reduction policies and plans currently formulated by the Chinese government, combined with the existing research, this article specifically put forward the following recommendations:
(1)
Many of China’s current administrative policies have helped curb the increase in consumer carbon emissions, but further improvements are needed. The carbon intensity regulation policy can promote the production sector to optimize the energy supply structure, and increase the supply of the energy with lower carbon emission factor. So the policy plays a guiding role in the consumption of residents. Such a policy would also increase the price of energy products with higher carbon emissions, leading residents to voluntarily choose clean energy. But at present, China mainly promotes the implementation of carbon intensity control by administrative means, lack of legislative support. Therefore the government should strengthen the formulation of supporting legal system in the future; low-carbon labeling policies can help consumers identify low-carbon products, but such policies need to be complemented by promotional and price incentives. Therefore, the government should increase the low carbon propaganda, expand low-carbon propaganda channels. Advocacy through the popular mobile phone app is a good choice. The Government should also increase the subsidy for the residents to buy low energy products; Step electricity price policy can promote the residents to form a low-carbon lifestyle, and can be extended to the heating aspect; China’s two-child policy and the prohibition of illegal gender identification policy in the long run are conducive to curb the increase in consumer carbon emissions. So these policies should be continued to be implemented, and supplemented by public propaganda.
(2)
The policies of energy saving and emission reduction based on market regulation mainly includes establishing carbon trading market and levying carbon tax. China has set up a nationwide carbon trading market, but has not yet implemented a carbon tax policy. As with carbon intensity regulation, carbon trading markets also indirectly regulate consumer carbon emissions through the production sector. The establishment of a carbon trading market can promote the optimal distribution of carbon emission rights, which will undoubtedly reduce the cost of China’s emission reduction. But China’s carbon trading market has been established late, a series of regulatory and regulatory policies are not yet standardized, the Chinese government needs improve it based on the actual situation and draw on the experience of developed countries; Carbon tax policy is also an effective way to promote the early completion of carbon peak in China, but the levy of the carbon tax needs to consider the issue of fairness and public acceptance. It is a good choice to carry out a progressive tax rate and return the carbon tax to companies and residents.

Author Contributions

Yong Wang and Guangchun Yang were mainly responsible for the writing of the full text. Peipei Shang conceived and designed the study. Ying Dong and Yu Cheng built the models of the paper.

Acknowledgments

This paper is supported by Liaoning Economic and Social Development Research Project (2018lslktzd-010), National Natural Science Foundation of China (71573034), Liaoning Social Science Fund (L17CTJ001, L17BJY042), China Postdoctoral Science Fund (2016M601318, 2017T100180) and Research Project of Dongbei University of Finance and Economics (DUFE2017Q16).

Conflicts of Interest

The authors declare no conflict of interest.

References

  1. International Energy Agency. Available online: http://www.iea.org/ (accessed on 20 April 2018).
  2. BP World Energy Statistics Yearbook. 2017. Available online: https://www.bp.com/zh_cn/china/reports-and-publications/_bp_2017-_.html (accessed on 20 April 2018).
  3. National Development and Reform Commission. Available online: http://qhs.ndrc.gov.cn/qjfzjz/ 201712/W020171221535050998016.pdf (accessed on 20 April 2018).
  4. Liu, L.; Wu, G.; Wang, J.; Wei, Y. China’s carbon emissions from urban and rural households during 1992–2007. J. Clean. Prod. 2011, 19, 1754–1762. [Google Scholar] [CrossRef]
  5. National Bureau of Statistics of the People’s Republic of China. Available online: http://www.stats.gov.cn/tjsj/zxfb/201602/t20160229_1323991.html (accessed on 20 April 2018).
  6. National Bureau of Statistics of the People’s Republic of China. Available online: http://www.stats.gov.cn/tjsj/ndsj/2017/indexch.htm (accessed on 20 April 2018).
  7. Leontief, W.W. Quantitative Input and Output Relations in the Economic Systems of the United States. Rev. Econ. Stat. 1936, 18, 105–125. [Google Scholar] [CrossRef]
  8. Leontief, W.W. Interrelation of Prices, Output, Savings, and Investment. Rev. Econ. Stat. 1937, 19, 109–132. [Google Scholar] [CrossRef]
  9. Herendeen, R. Total energy cost of household consumption in Norway, 1973. Energy 1978, 3, 615–630. [Google Scholar] [CrossRef]
  10. Druckman, A.; Jackson, T. The carbon footprint of UK households 1990–2004: A socio-economically disaggregated, quasi-multi-regional input–output model. Ecol. Econ. 2009, 68, 2066–2077. [Google Scholar] [CrossRef] [Green Version]
  11. Peng, S.J.; Zhang, W.C. The empirical analysis of carbon emission trend and its influencing factors in Chinese residents’ consumption. World Econ. 2013, 36, 124–142. [Google Scholar]
  12. Wu, K.Y.; Guo, X.; Wang, W.X.; Zhang, H. An empirical analysis of consumption carbon emissions of Shanghai residents. Resour. Environ. Yangtze River Basin 2013, 22, 535–543. [Google Scholar]
  13. Tian, X.; Geng, Y.; Dong, H.; Dong, L.; Fujita, T.; Wang, Y.; Zhao, H.; Wu, R.; Liu, Z.; Sun, L. Regional household carbon footprint in China: A case of Liaoning province. J. Clean. Prod. 2015, 114, 401–411. [Google Scholar] [CrossRef]
  14. Liu, J.R.; Wang, R.S.; Yang, J.W. Ecological impact assessment of household consumption based on life cycle analysis. Urban Environ. Urban Ecol. 2005, 1, 15–17. [Google Scholar]
  15. Yao, L.; Liu, J.R.; Wang, R.S. Comparative analysis of carbon emissions implied by urban and rural residents in China. Chin. Popul.·Resour. Environ. 2011, 21, 25–29. [Google Scholar]
  16. Shui, B.; Dowlatabadi, H. Consumer lifestyle approach to US energy use and the related CO emissions. Energy Policy 2005, 33, 197–208. [Google Scholar]
  17. Wei, Y.M.; Liu, L.C.; Fan, Y.; Wu, G. The impact of lifestyle on energy use and CO2, emission: An empirical analysis of China’s residents. Energy Policy 2007, 35, 247–257. [Google Scholar] [CrossRef]
  18. Fan, L.; Wang, D. Calculation and analysis of carbon emission from indirect energy consumption of Chinese residents. Eco-Economy 2014, 30, 28–32. [Google Scholar]
  19. Greening, L.A. Effects of human behavior on aggregate carbon intensity of personal transportation: Comparison of 10 OECD countries for the period 1970–1993. Energy Econ. 2004, 26, 1–30. [Google Scholar] [CrossRef]
  20. Chai, S.G. An empirical study on the driving factors of carbon emission from urban residents. Stat. Decis. 2016, 32, 95–99. [Google Scholar]
  21. Du, W. Analysis of indirect carbon emission characteristics of Chinese residents’ life based on LMDI decomposition model. China’s Popul. Resour. Environ. 2016, 26, 5–9. [Google Scholar]
  22. Wang, H.J.; Xia, Y. Analysis on the influencing factors and development path of Chinese residents’ consumption carbon emission. China Manag. Sci. 2017, 25, 1–10. [Google Scholar]
  23. Hubacek, K.; Guan, D.; Barua, A. Changing lifestyles and consumption patterns in developing countries: A scenario analysis for China and India. Futures 2007, 39, 1084–1096. [Google Scholar] [CrossRef]
  24. Hubacek, K.; Feng, K.; Chen, B. Changing Lifestyles towards a Low Carbon Economy: An IPAT Analysis for China. Energies 2011, 5, 22–31. [Google Scholar] [CrossRef]
  25. Fu, J.Y.; Li, C.L. Calculation and driving factors of indirect energy-use carbon emission from Chinese residents’ consumption—Panel data analysis based on STIRPAT model. Consum. Econ. 2015, 31, 92–97. [Google Scholar]
  26. Tang, Y.Y.; Li, S.; Xia, Q. Analysis on the factors affecting the carbon emission of Chinese residents ‘living energy—Based on STIRPAT model. Eco-Economy 2017, 33, 42–47. [Google Scholar]
  27. Ji, Z.Y.; Lai, X.F.; Jia, L.J. Carbon emissions from domestic energy consumption in the household sector: A study of measurement and driving factors. China’s Popul. Resour. Environ. 2016, 26, 64–72. [Google Scholar]
  28. York, R. Demographic trends and energy consumption in European Union Nations, 1960–2025. Soc. Sci. Res. 2007, 36, 855–872. [Google Scholar] [CrossRef]
  29. Laureti, T.; Montero, J.M.; Fernández-Avilés, G. A local scale analysis on influencing factors of NOx, emissions: Evidence from the Community of Madrid, Spain. Energy Policy 2014, 74, 557–568. [Google Scholar] [CrossRef]
  30. Castellano, R.; Laurete, T.; Rego, A. Estimating the effects of road transportation on environmental quality. Environ. Eng. Manag. J. 2010, 9, 1151–1160. [Google Scholar]
  31. Liddle, B. Impact of population, age structure, and urbanization on carbon emissions/energy consumption: Evidence from macro-level, cross-country analyses. Popul. Environ. 2014, 35, 286–304. [Google Scholar] [CrossRef]
  32. The China Energy Statistics Yearbook. Available online: http://epub.cnki.net/KNS/brief/ result.aspx?dbPrefix=CYFD (accessed on 8 December 2017).
  33. ENERGY.GOV. Available online: https://www.energy.gov/ (accessed on 12 November 2017).
  34. EIA. Available online: https://www.eia.gov/ (accessed on 12 November 2017).
  35. Oak Ridge National Laboratory. Available online: https://www.ornl.gov/ (accessed on 10 November 2017).
  36. Intergovernmental Panel on Climate Change. Available online: https://www.ipcc.ch/ (accessed on 12 November 2017).
  37. Ministry of Science and Technology of the People’s Republic of China. Available online: http://www.most.gov.cn/index.htm (accessed on 15 November 2017).
  38. Energy Research Institute National Development and Reform Commission. Available online: http://www.eri.org.cn/ (accessed on 15 November 2017).
  39. National Bureau of Statistics of the People’s Republic of China. Available online: http://www.stats.gov.cn/tjsj/ndsj/ (accessed on 15 November 2017).
  40. Fu, Y.P.; Ma, S.C.; Song, B.Y. The difference of consumption carbon emission between urban and rural residents in China and its influencing factors—Empirical analysis based on panel data. Explor. Econ. Probl. 2016, 37, 43–50. [Google Scholar]
  41. Dietz, T.; Rosa, E.A. Rethinking the environmental impacts of population, affluence and technology. Hum. Ecol. Rev. 1994, 2, 277–300. [Google Scholar]
  42. CNKI. Available online: http://kns.cnki.net/KCMS/detail/detail.aspx?dbcode=CJFQ&dbname=CJFDLAST2016&filename=ZRZY201512001&uid=WEEvREcwSlJHSldRa1FhcTdWajFtaW1FbDByRHVsTWNzU0JrMFFNR3VsYz0=$9A4hF_YAuvQ5obgVAqNKPCYcEjKensW4ggI8Fm4gTkoUKaID8j8gFw!!&v=MDc1MjNMdXhZUzdEaDFUM3FUcldNMUZyQ1VSTEtmWXVadEZ5M2xVcjdJUHovUmQ3RzRIOVROclk5RlpZUjhlWDE= (accessed on 20 April 2018).
  43. Yeh, J.C.; Liao, C.H. Impact of population and economic growth on carbon emissions in Taiwan using an analytic tool STIRPAT. Sustain. Environ. Res. 2017, 27, 41–48. [Google Scholar] [CrossRef]
Figure 1. Method flowchart.
Energies 11 01125 g001
Figure 2. The scale and structural change of the total carbon emissions of China’s household consumption from 2006 to 2015.
Energies 11 01125 g002
Figure 3. The spatial distribution of the total carbon emissions of China’s household consumption in 2015.
Energies 11 01125 g003
Figure 4. The contribution of five energy sources to the energy carbon emissions of China’s household consumption.
Energies 11 01125 g004
Figure 5. The change in products carbon emissions of eight consumer goods.
Energies 11 01125 g005
Table 1. Summary of household consumption carbon emission research.
Research TopicsAuthorResearch MethodsResearch Process and Primary ConclusionsResearch Limitations
Scale calculation of household consumption carbon emissionsDruckman et al. [10]Quasi-Multi-Region-Input-Output (QMRIO)The 2004 British household consumption carbon emissions were calculated based on the quasi-multi-region-input-output model. The study determined that the primary source of household carbon emissions in Britain was consumption of recreational and leisure goods.Only accounted for data from 2004; it is not possible to examine the trend of household consumption carbon emissions in the UK vertically.
Shuijun Peng et al. [11]Non-Competitive-Input-Output AnalysisBased on the non-competitive input-output model, the consumption carbon emissions and their sectoral distribution of Chinese residents from 1992 to 2007 were estimated. The results indicated that the total carbon emissions of Chinese residents during the study period demonstrated a rapid growth trend, which is an important component of total carbon emissions. Products carbon emissions from residents are the primary component of total carbon emissions of residents, and the majority of them come from the consumption activities of urban residents.Using interval data to account for four years of household consumption carbon emissions, the analysis year was inconsistent and less.
Xu Tian et al. [13]Input-Output AnalysisThe carbon emissions coefficient method and the input-output model method were used to calculate the total carbon emissions of households in Liaoning Province in 1997, 2002 and 2007. The time change and urban-rural difference of total carbon emissions of households in Liaoning Province were analyzed. It was determined that the total carbon emissions of households in Liaoning province was increasing during the study period, the products carbon emissions from households was the primary source of total carbon emissions, and the difference between urban and rural residents was significant.The analysis with interval data cannot continuously reflect the change and development of household consumption carbon emissions. In this single area of Liaoning, there was no comparative analysis between regions.
Jingru Liu et al. [14]Life-Cycle Analysis (LCA)Based on the LCA model, this paper constructed a sustainable consumption evaluation model to calculate the products carbon emissions of Chinese urban household consumption in 2000 and compared the ecological effects of consumption behavior. The study determined that the most important effect on household consumption products carbon emissions was traffic-related consumption behavior, followed by food and housing.The traditional LCA model was used to study only the environmental effect within the system boundary, ignoring the environmental effect outside the system boundary, and the evaluation scope was incomplete.
Liang Yao et al. [15]Comprehensive Life-Cycle AnalysisThe LCA method and the input-output table were combined to calculate the products carbon emissions of Chinese residents from 1997–2007. The study determined that the products carbon emissions of household consumption in 2007 were 1.61 times that of household consumption in 1997; the average annual growth rate was 4.89%.Although Comprehensive Life Cycle Analysis was adopted, the data were not available. The accounting year was too small and inconsistent and cannot fully reflect the change rule of products carbon emissions of residents’ consumption. The input-output table was a value type, the environmental effect was a physical type, and the combination of the two also resulted in inaccurate accounting.
Yiming Wei et al. [17]Consumer Lifestyle Approach (CLA)The Consumer Lifestyle Approach (CLA) was used to account for China’s urban and rural residents’ consumption of carbon emissions from 1999–2002. It determined that approximately 26% of energy consumption and 30% of carbon emissions came from residents’ consumption activities.The lack of consideration of industrial relevance in CLA method may underestimate the products carbon emissions of households.
Influential factor analysis of household consumption carbon emissionsGreenring et al. [19]Di’s index methodThe carbon emissions of ten countries in the OECD were analyzed for their carbon emissions from residential terminal services and private transport sectors from 1970–1993 using Di’s Index method. It was determined that the effects of the energy structure of terminal consumption, fuel composition and energy intensity on the reduction of carbon emission intensity differed.Although the use of Di’s index method can reflect the influence of various factors on the direction and extent of household consumption carbon emissions, there is an inability to establish a relation between the appropriate predictions.
Hubacek et al. [23]IPAT modelBased on the IPAT equation, the influence factors of environmental change and carbon emissions in China and India from 1960–2000 were analyzed. The results indicated that the influence of wealth factors on carbon emissions increased and the influence of technical factors on carbon emission decreased.Using the IPAT equation, we can change one of the factors by fixing other factors to analyse the problem, assuming that the influence of each factor on the dependent variable is equal to the actual situation. However, in real life, the changes in various factors are not equal.
Zhiying Ji et al. [27]Extended STIRPAT and Kaya modelBased on the calculation of the energy consumption carbon emissions of Chinese households from 2003–2012, the influence factors of energy carbon emissions from residents’ consumption were analyzed using the extended STIRPAT model and KAYA model. It was determined that the population size, consumption level, energy consumption structure, carbon emission intensity, energy consumption intensity and urbanization significantly affected residents’ energy carbon emissions, and there were differences between urban and rural factors.This article examined only the household consumption energy carbon emissions. There was no analysis of household consumption products carbon emissions. Therefore, the article cannot fully reflect China’s household consumption carbon emissions.
Table 2. Carbon emission coefficients for all types of primary energy (ton carbon/ ton tce).
Data SourcesCarbon Emission Coefficient of CoalCarbon Emission Coefficient of PetroleumCarbon Emission Coefficient of Natural Gas
DOE [33]/EIA [34]0.700.480.39
ORNL [35]0.720.590.40
IPCC [36]0.760.590.45
National Science and Technology Commission Climate Change Project [37]0.730.580.41
National Development and Reform Commission Energy Research Institute [38]0.750.580.44
Average0.730.560.42
Table 3. Carbon emission coefficients of electricity and heat.
2006200720082009201020112012201320142015
Carbon emission coefficient of electricity (million t carbon/billion kW·h)2.65842.48732.51002.55252.44242.42362.49372.43012.28872.2255
Carbon emission coefficient of heat (million t carbon/10 ^ 10 kJ)0.03260.03290.03220.03180.03290.03350.03820.03430.03320.0333
Note: The electricity carbon emission coefficient is calculated by Equation (3), and the heat carbon emission coefficient is calculated by Equation (4).
Table 4. Consumption of consumer goods carbon emission factor table [40] (unit: ton carbon/million).
Consumption TypeCarbon emission Factor (Ton Carbon/Million)Consumption TypeCarbon Emission Factor (Ton Carbon/Million)
Food0.66Transportation and communications1.1
Clothing1.21Culture and entertainment0.6
Residences2.21Health care0.9
Household appliances and supplies0.52Others0.3
Table 5. Summary statistics for pooled data (n = 300).
2006200720082009201020112012201320142015
CTMinimum3,272,615.93,389,096.73,810,304.34,222,105.65,038,779.25,665,363.66,216,264.87,042,161.39,300,614.59,977,888.0
Mean28,713,827.332,423,317.738,269,260.841,007,200.947,447,563.653,344,770.259,916,367.365,164,069.382,424,758.789,278,260.9
Maximum94,772,323.6109,511,861.9121,897,595.2132,347,908.115,8443,649.01,75,628,659.8194,937,327.9211,315,200.7250,312,464.5274,917,288.0
PSIZEMinimum149.3151.2151.0155.7162.9162.8168.6171.5182.8169.9
Mean1354.71364.51376.11393.61431.91477.71487.81517.01528.41470.9
Maximum3166.33186.13181.53178.03262.83323.13328.23476.23446.83419.1
CHIMinimum8.18.07.97.68.68.38.59.410.19.3
Mean18.417.817.316.816.516.316.316.216.216.3
Maximum27.327.226.024.825.224.223.022.122.122.6
SEXMinimum94.995.695.197.3101.595.898.698.998.2100.5
Mean102.8103.0103.3103.7105.7105.1105.1105.4105.1105.7
Maximum109.9110.0109.8114.2114.5115.2113.6111.7118.6120.4
RGDPMinimum0.60.70.80.91.11.21.41.61.71.9
Mean1.92.22.42.62.93.23.53.84.14.4
Maximum5.86.67.17.56.97.37.88.38.99.5
GDPCMinimum0.30.30.30.30.30.30.30.30.30.3
Mean0.40.40.40.40.40.40.40.40.50.5
Maximum0.70.70.70.70.70.60.70.60.70.7
INSTMinimum27.426.825.723.524.023.122.722.321.319.7
Mean47.748.349.447.549.149.748.647.946.043.3
Maximum57.860.061.556.557.359.057.757.354.150.5
Table 6. Hausman Test.
InspectionChi square Statisticp Value
Model (1)93.690.0000
Model (2)79.990.0000
Table 7. Estimated results of fixed effect model.
StatisticsModel (1)Model (2)
lnPSIZE0.7735 *** (8.46)0.7903 *** (9.05)
lnCHI0.5572 *** (6.28)0.5729 *** (6.74)
lnSEX0.3097 * (1.66)0.3282 * (1.79)
lnRGDP1.1009 *** (27.75)1.1215 *** (50.48)
(lnRGDP)20.0132 (0.63)
lnGDPC0.0839 *** (4.08)0.08389 *** (4.09)
lnINST−0.5685 *** (−8.09)−0.5831 *** (−8.81)
β0 (constant)9.6374 *** (9.00)9.4422 *** (9.22)
Individual effectsyesyes
Time effectnono
N300300
Adjusted R20.96490.9649
F1033.55001208.6400
P0.00000.0000
Note: *** and * indicate that the statistical quantity is significant at the significance level of 1% and 10%, respectively.
Table 8. Main conclusions of this paper.
Scale calculation of household consumption carbon emissions Trend of ChangeMain ComponentRegional Distribution
Total carbon emissionsThe total carbon emissions of households increased from 861.41 million tons to 2678.35 million tons in 2006–2015, with an average annual growth rate of 13.43%.About 80% of the total carbon emissions came from products carbon emissions.High carbon areas were mainly located in the eastern and central regions.
Products carbon emissionsThe products carbon emissions of households increased from 670.68 million tons to 2344.90 million tons in 2006–2015, with an average annual growth rate of 14.92%.About 33.39% of the products carbon emissions came from the consumption of residences.High carbon areas were mainly located in the eastern and central regions.
Energy carbon emissionsThe energy carbon emissions of households increased from 190.74 million tons to 333.44 million tons in 2006–2015, with an average annual growth rate of 6.40%.About 40% of the energy carbon emissions came from the consumption of electricity.High carbon areas were mainly in the North.
Influential factor analysis of household consumption carbon emissions Demographic factorsEconomic factorTechnical factor
Coefficients of factorsPSIZE = 0.7903RGDP = 1.1215GDPC = 0.0839
CHI = 0.5729
SEX = 0.3282

