Article

Defect Pattern Recognition Based on Partial Discharge Characteristics of Oil-Pressboard Insulation for UHVDC Converter Transformer

1
Department of Electrical Engineering, Shandong University, Jinan 250061, China
2
Shandong Provincial Key laboratory of UHV Transmission Technology and Equipments, #17923 Jingshi Road, Jinan 250061, China
3
Jinan Power Supply Company of State Grid Shandong Electric Power Company, #238 Luoyuan Road, Jinan 250012, China
*
Author to whom correspondence should be addressed.
Energies 2018, 11(3), 592; https://doi.org/10.3390/en11030592
Submission received: 5 February 2018 / Revised: 6 March 2018 / Accepted: 7 March 2018 / Published: 8 March 2018
(This article belongs to the Section F: Electrical Engineering)

Abstract

:
The ultra high voltage direct current (UHVDC) transmission system has advantages in delivering electrical energy over long distance at high capacity. UHVDC converter transformer is a key apparatus and its insulation state greatly affects the safe operation of the transmission system. Partial discharge (PD) characteristics of oil-pressboard insulation under combined AC-DC voltage are the foundation for analyzing the insulation state of UHVDC converter transformers. The defect pattern recognition based on PD characteristics is an important part of the state monitoring of converter transformers. In this paper, PD characteristics are investigated with the established experimental platform of three defect models (needle-plate, surface discharge and air gap) under 1:1 combined AC-DC voltage. The different PD behaviors of three defect models are discussed and explained through simulation of electric field strength distribution and discharge mechanism. For the recognition of defect types when multiple types of sources coexist, the Random Forests algorithm is used for recognition. In order to reduce the computational layer and the loss of information caused by the extraction of traditional features, the preprocessed single PD pulses and phase information are chosen to be the features for learning and test. Zero-padding method is discussed for normalizing the features. Based on the experimental data, Random Forests and Least Squares Support Vector Machine are compared in the performance of computing time, recognition accuracy and adaptability. It is proved that Random Forests is more suitable for big data analysis.

1. Introduction

With the rapid growth of electricity consumption, in many countries and regions around the world, there is an imbalance between electricity load and power generation. The advantages of the UHVDC transmission system in terms of high capacity and low loss are evident when the energy should be delivered from the remote power generation areas to the load-intensive areas over long distance. Especially in countries such as China and Brazil which are large in area and have uneven population distribution, in addition to fossil-fuel power generation, new energy sources such as wind and solar power generation bases are located far away from large cities, therefore, the development of UHVDC transmission system is more rapid in these places [1,2]. As a key apparatus in HVDC transmission system, convertor transformer takes critical operating responsibilities, so its operating status recognition is particularly important to prevent insulation failure [3]. The valve winding of the converter transformer has to withstand combined AC-DC voltage [4]. Partial discharge (PD) is a discharge phenomenon that can reflect the insulation failure process, and the discharge characteristics of different defect models under different voltage forms are not the same [5,6]. The PD characteristics of pure AC and DC voltage have been widely investigated, but the study on PD characteristics under combined AC-DC voltage is not deep enough. Therefore, the PD behavior of typical defects in oil-pressboard insulation under combined AC-DC voltage and the application ways to reflect the insulation state of the converter transformer are significant topics.
With regard to research on PD characteristics, there are two main research directions including PD development stages recognition and PD pattern recognition. The PD characteristics of the whole process from the beginning to the breakdown are important to the research on the division and recognition of PD development stages, which is based on a single type defect model. Artificial Neural Network (ANN), Fuzzy Cluster (FC) analysis and Least Squares Support Vector Machine (LSSVM) can be utilized in this field [7,8,9]. The main purpose of PD pattern recognition is to identify the defect type and most of the research is based on the signal statistics of a single PD source. Fingerprint identification technology of PD statistical graph [10,11], PD gray image and fractal image compression technology [12,13] and PD energy distribution recognition technology [14] are commonly used in this field. However, these results mainly focus on AC or DC voltage respectively, and the PD characteristics application under combined AC-DC voltage is reported rarely.
In practice, PD in transformer is likely to occur simultaneously in more than one place. So the separation of different PD sources is required before analyzing the PD characteristics. One solution is to use the blind source separation (BSS) technique to process the PD signals. This method separates the signals from all sources when the condition is met. The condition is that the number of sensors should be greater than or equal to the number of sources. Therefore, this method is only suitable for the transformer, which has multiple pre-installed UHF sensors, and its adaptability is not wide [15]. The other solution is to use the classification and recognition algorithm to deal with the signals obtained by the pulse current method. FC and LSSVM are commonly used in this method [16]. When the PD sources of the same type defect model produce signals with a similar propagation path, this method cannot separate them well. Therefore, this method is applicable to the general pulse current method PD test, and transformer insulation state can be determined by the PD pattern recognition combined with the transformer insulation structure and manufacturing technique. So this method can be applied to the vast majority of cases. In the previous studies on PD pattern recognition based on pulse current method PD test, there are mainly two ideas: one solution is to classify using methods like FC, then do learning and recognition with the methods like ANN; the other solution is to use one classification algorithm that includes learning processes like LSSVM. Extraction of certain features of the original signals can contact the original data and the algorithms. Phase Resolved Partial Discharge (PRPD) pattern under AC voltage, Time and Amplitude Resolved Partial Discharge (TARPD) pattern under DC voltage and other statistical patterns provide statistical basis for PD characteristics. At the same time, the characteristics of a single PD pulses such as equivalent time, equivalent frequency and rising gradient also provide another feature extraction method. The nesting of multilayer calculation processes may increase the amount of computation and cause the loss of information.
Smart grid is an important trend of power network. The rapid development of hardware makes the online monitoring of power grid status based on big data achievable: for example, the monitoring and evaluation of the insulation status of a converter transformer based on a large number of PD data. Aiming at the above described requirements and problems, laboratory tests were established for the investigation of the PD characteristics in oil-pressboard insulation with three defect models (needle-plate, surface discharge and air gap) under 1:1 combined AC-DC voltage. PD signals of the whole development process were recorded. Different characteristics were analyzed and related discharge mechanism was discussed. Random Forests (RF) algorithm is used to complete the recognition process. Zero-padding method is used to normalize the features including single PD pulse waveform and discharge phase information. RF and LSSVM are compared in the performance of computing time, recognition accuracy and adaptability.

2. Experimental System and Methods

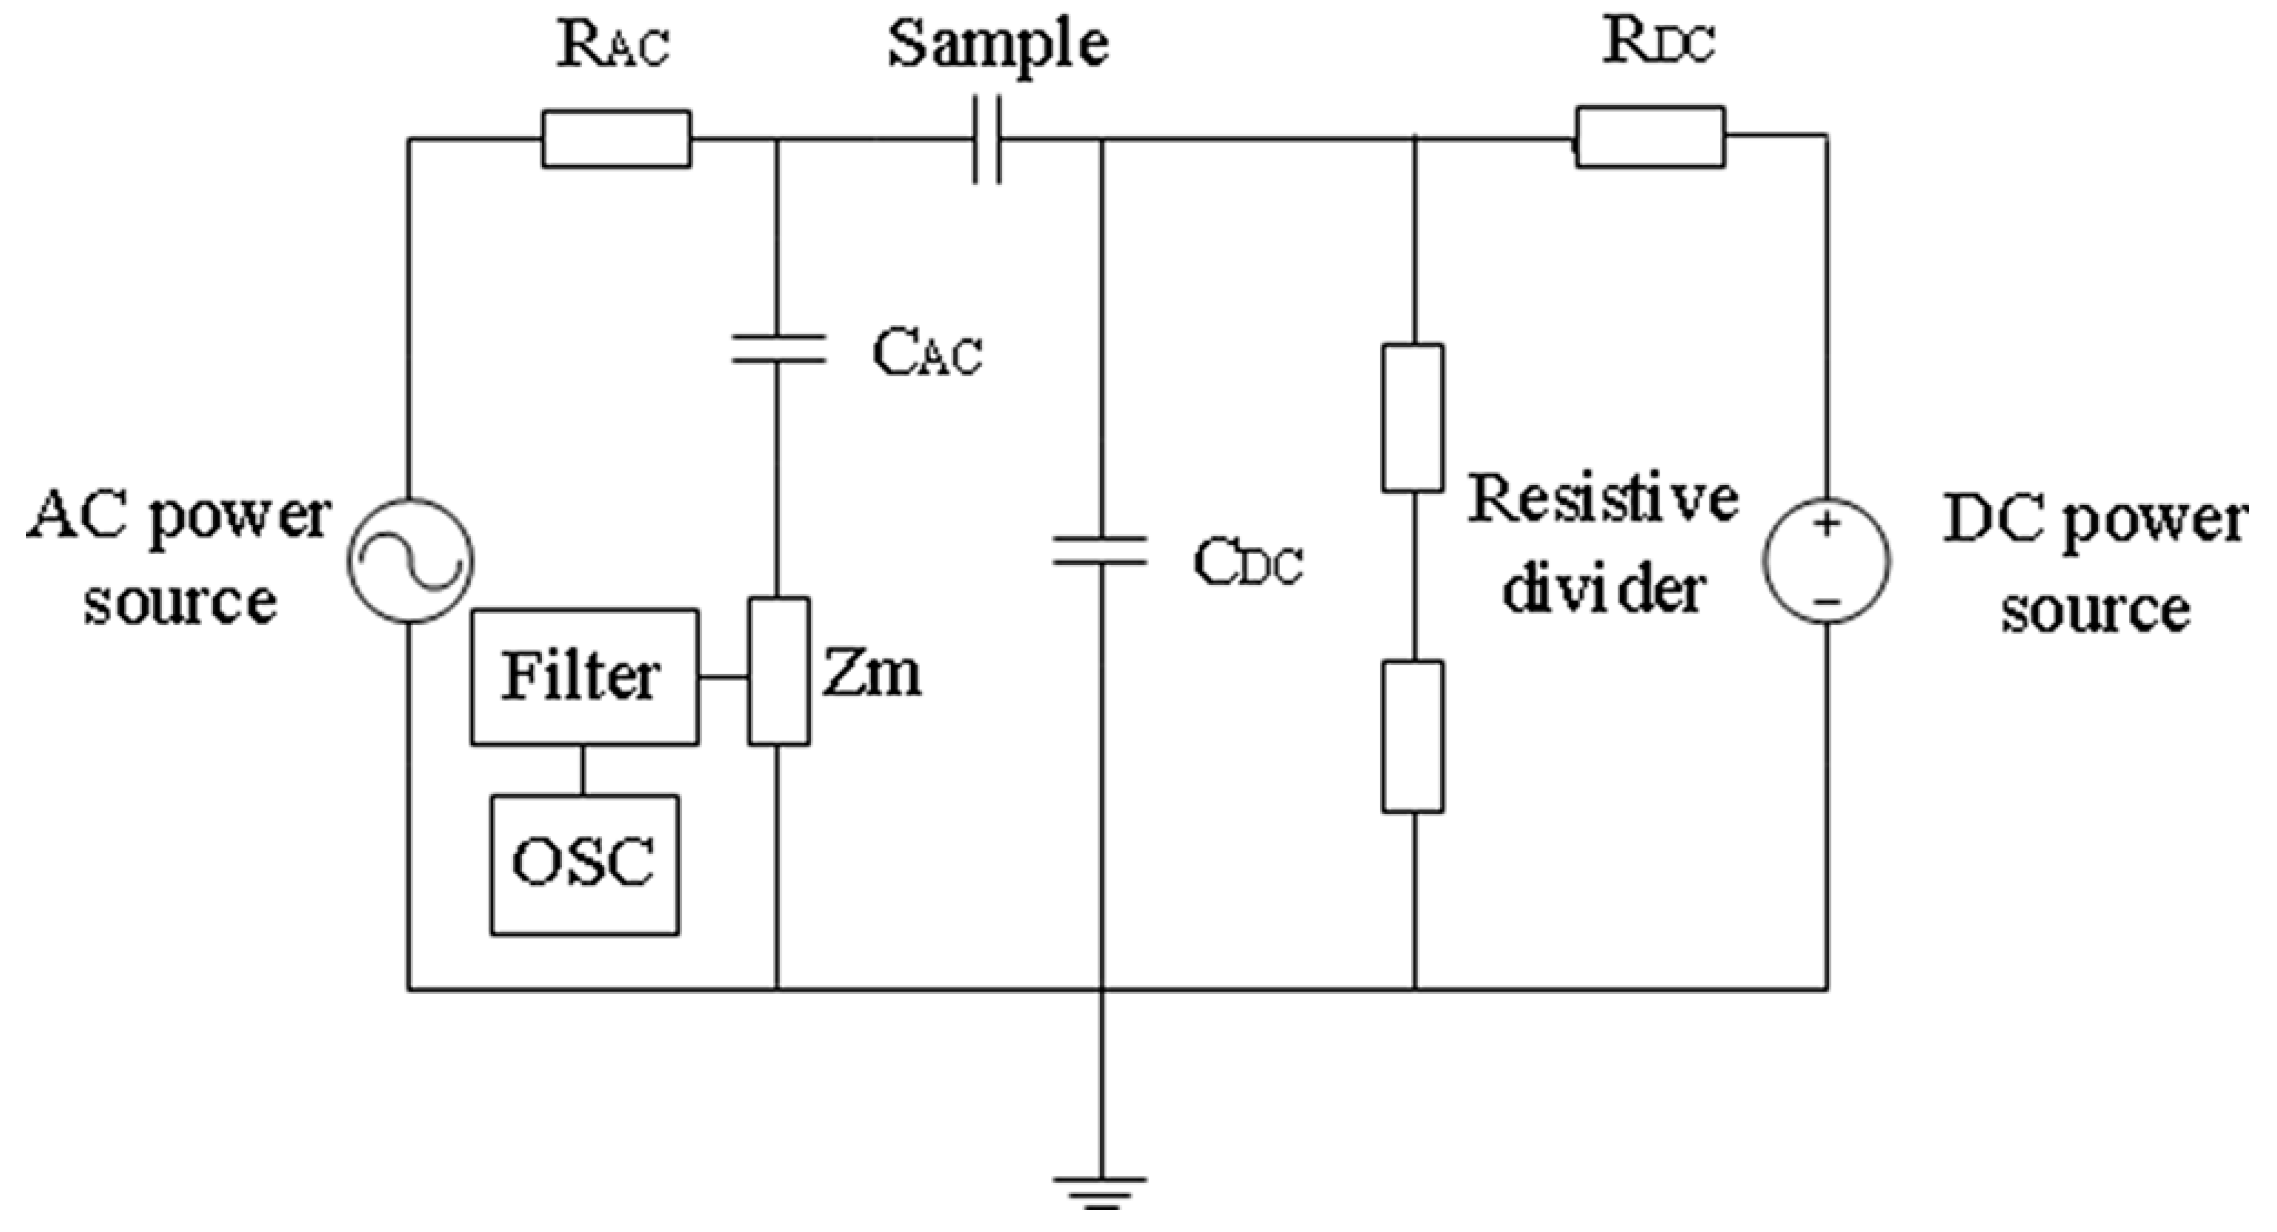
2.1. Experimental Circuit

Experimental circuit for PD measuring under combined AC-DC voltage based on IEC 60270 [17] is shown in Figure 1. Background noise in laboratory of all the tests is less than 5 pC. AC power source is a PD-free transformer and DC power source is a PD-free voltage doubling circuit whose ripple coefficient is less than 1%. RAC and RDC are protective resistors. CAC and CDC are coupling capacitors. Zm is the detecting impedor. OSC represents an oscilloscope. Filter represents a high-pass filter. The parameters of the experimental circuit are shown in Table 1.

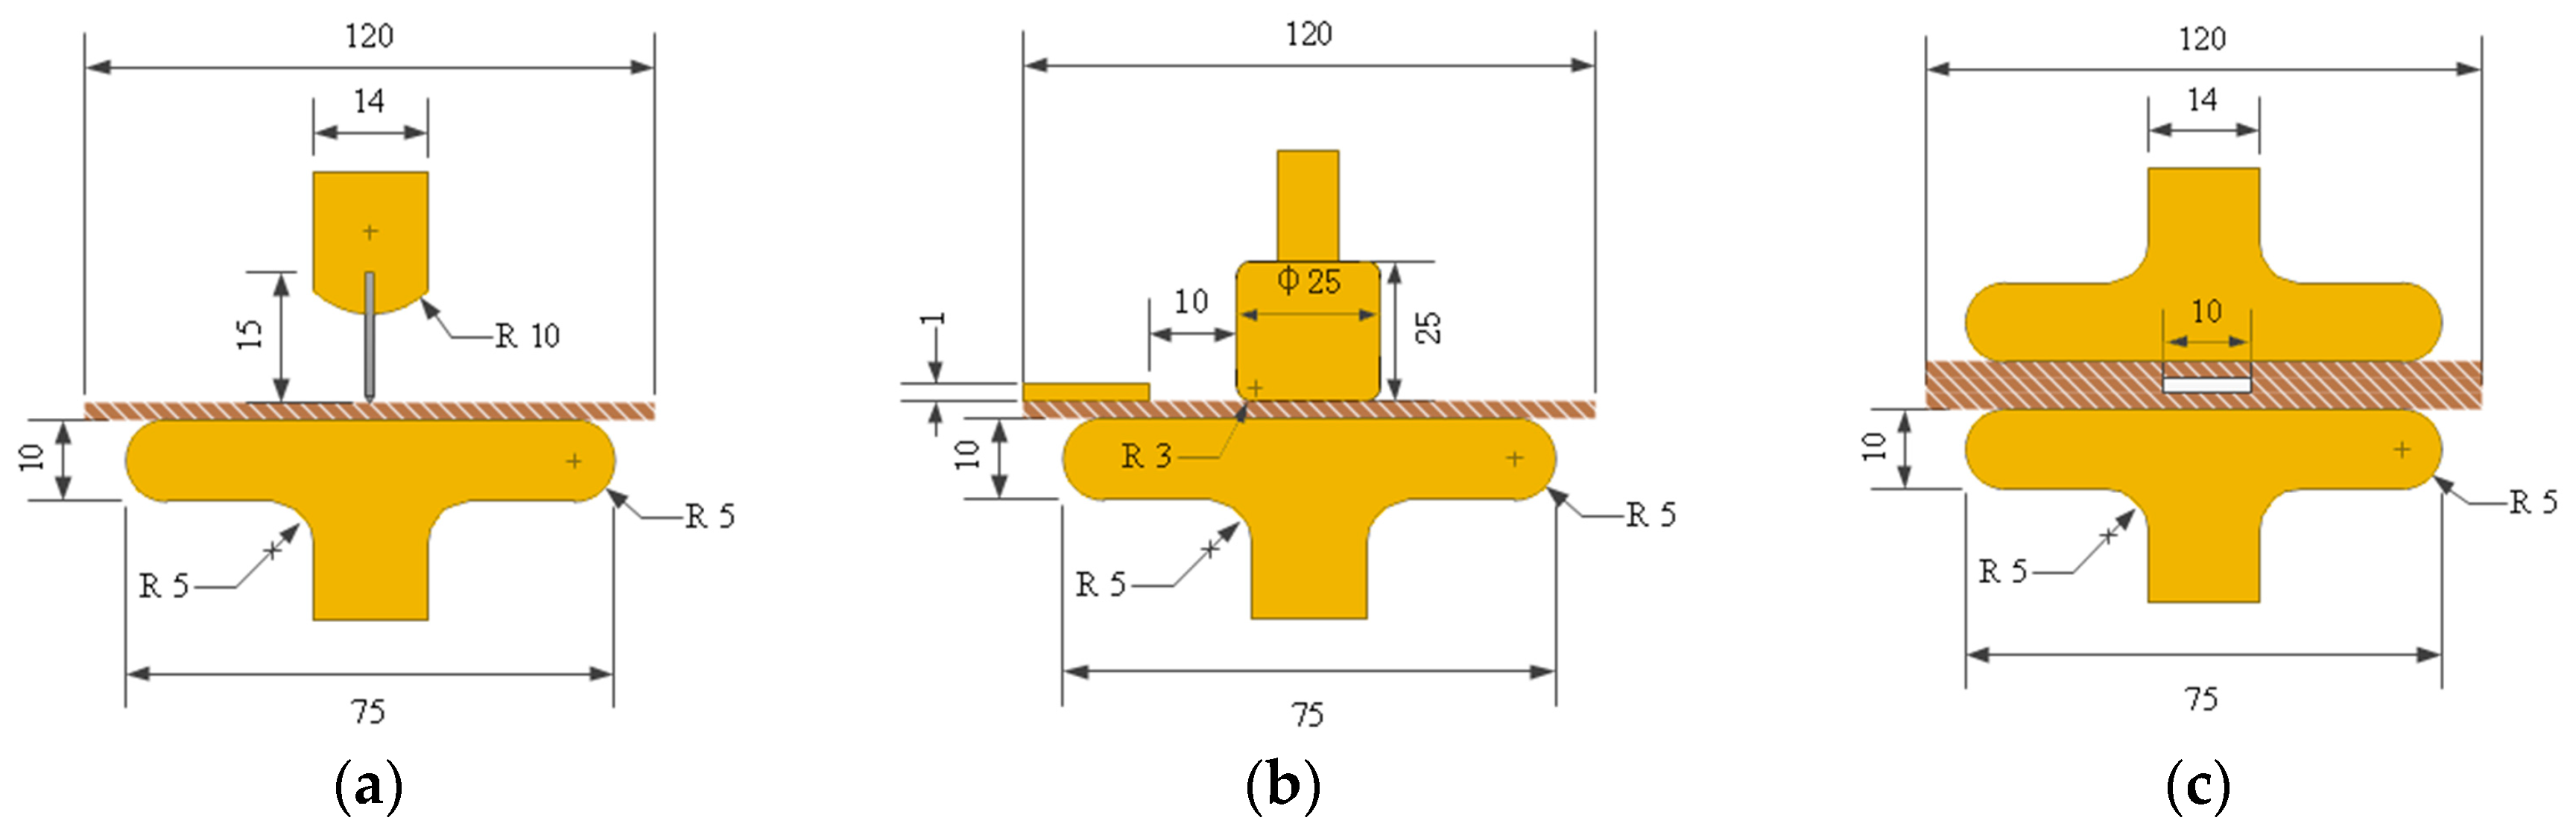
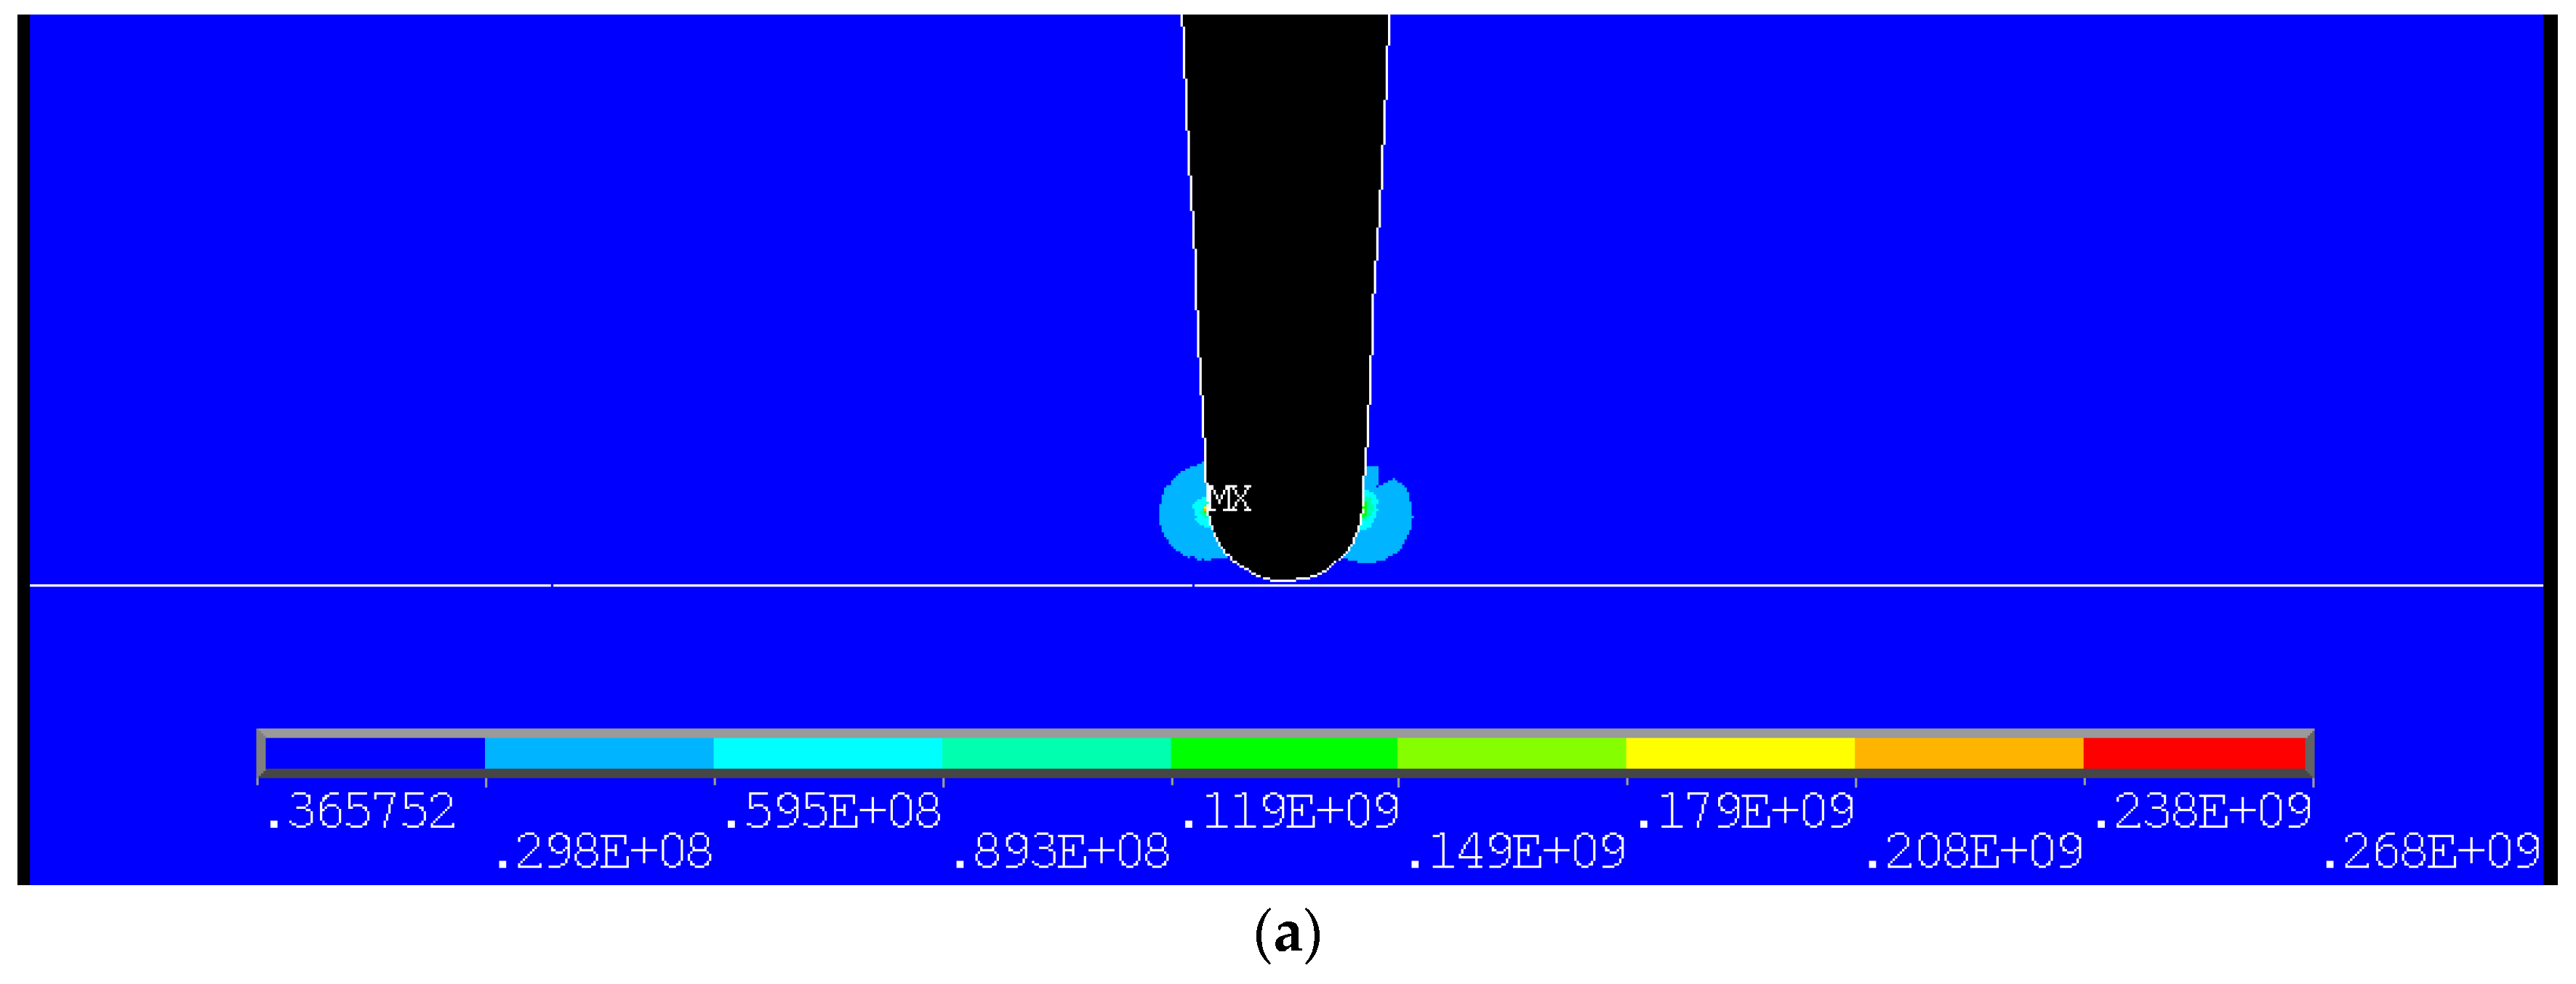
2.2. Electrodes and Specimen

Three common defect models are selected, such as needle-plate, surface discharge and air gap, which represent three typical defects: corona discharge in oil in extremely uneven electric field strength, surface discharge along the oil-pressboard surface and discharge in air gap of pressboard. The schematic diagrams of the electrodes are shown in Figure 2. In addition, all the dimensions of the electrodes are in millimeters. Each model contains at least one upper electrode, one lower electrode and pressboard, and is placed in a glass box filled with oil throughout the whole course of the experiment. All the lower electrodes are circular plates. The surface discharge model has two upper electrodes, one is a column electrode located in the center and one is a small rectangular plate electrode on the edge of the pressboard. The upper and lower electrodes are the same circular plates in air gap model. Due to the symmetrical structure, the schematic diagram of each model shown in Figure 2 is proposed with longitudinal section. The needle electrode is made by carbon steel and its curve radius is 100 μm. Other electrodes and the base of needle electrode are made by brass. The two electrodes are closely adjoined to the oil-impregnated pressboard specimen, where no oil layer should exist between electrodes. Needle electrode, column electrode and upper plate electrode of air gap model are connected with AC voltage side; all the lower plate electrodes and the plate electrode above the pressboard of surface discharge model are connected with DC voltage side.
1 mm-thick Weidmann pressboard in 120 mm × 120 mm size was dried under 110 °C and vacuum of 50 Pa for 72 h. The immersion process with Kunlun 25# Karamay transformer oil of the pressboard was performed under 80 °C and vacuum of 50 Pa for 48 h. The moisture content of pressboard is less than 1%. The gas volume fraction in oil is less than 2%, and the micro-moisture content of oil is less than 10 ppm, which is conformed to IEC 60641 [18]. The air gap model contains three layers of pressboard, among which the middle layer of pressboard has a round hole of 10 mm diameter in the center. Epoxy adhesive was used to bond the pressboard around the hole.

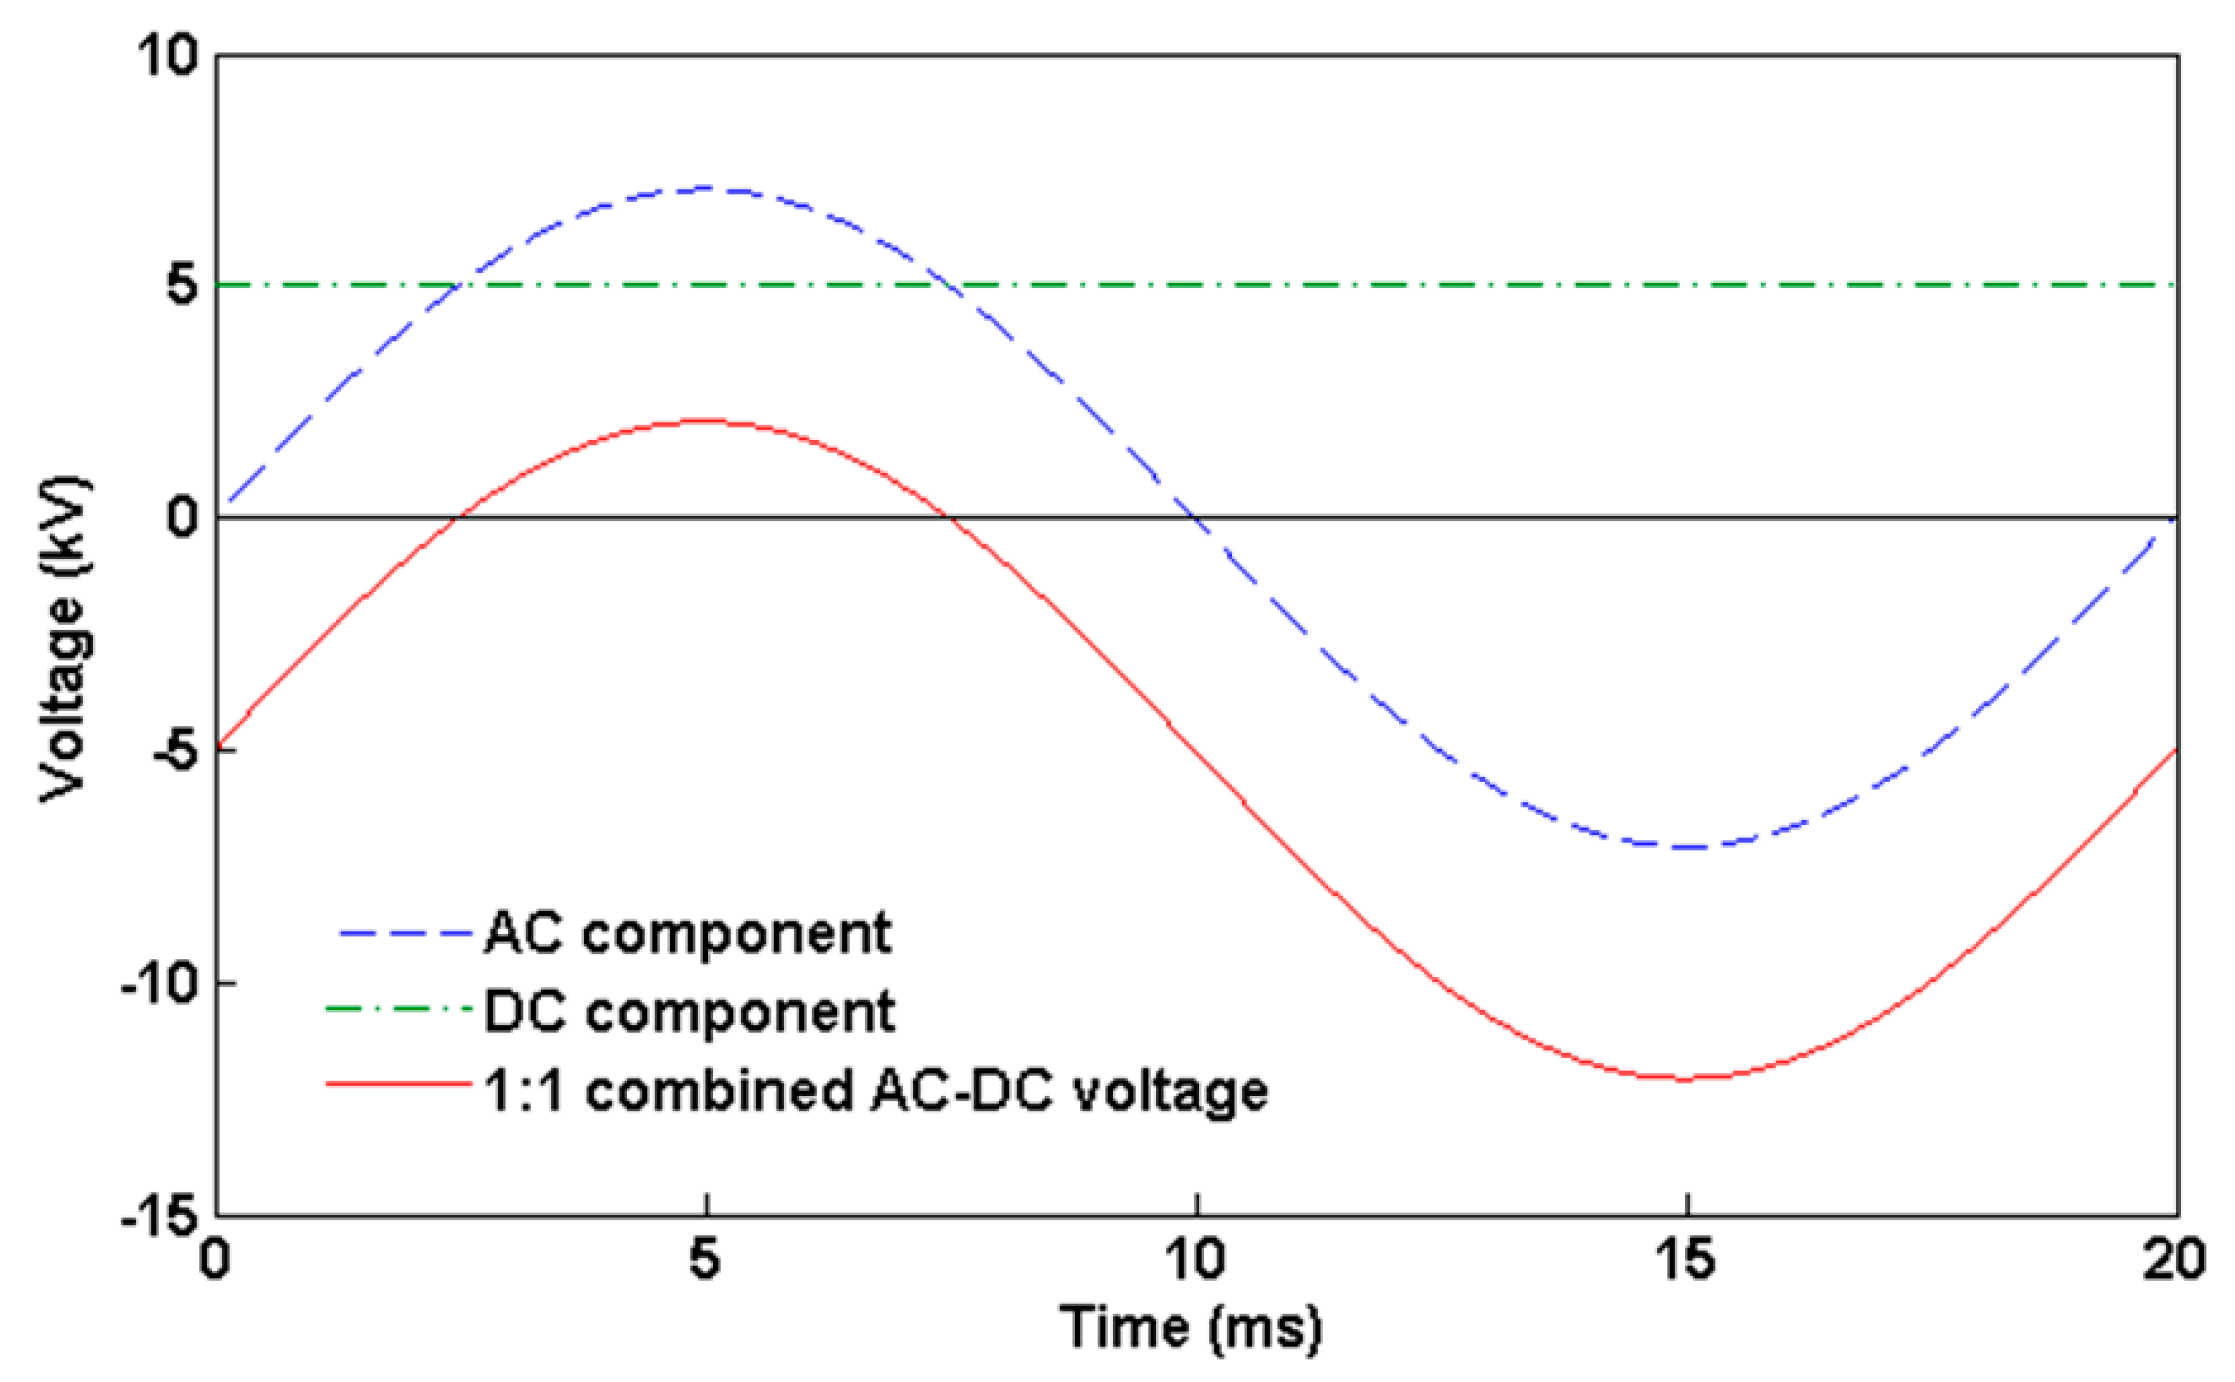
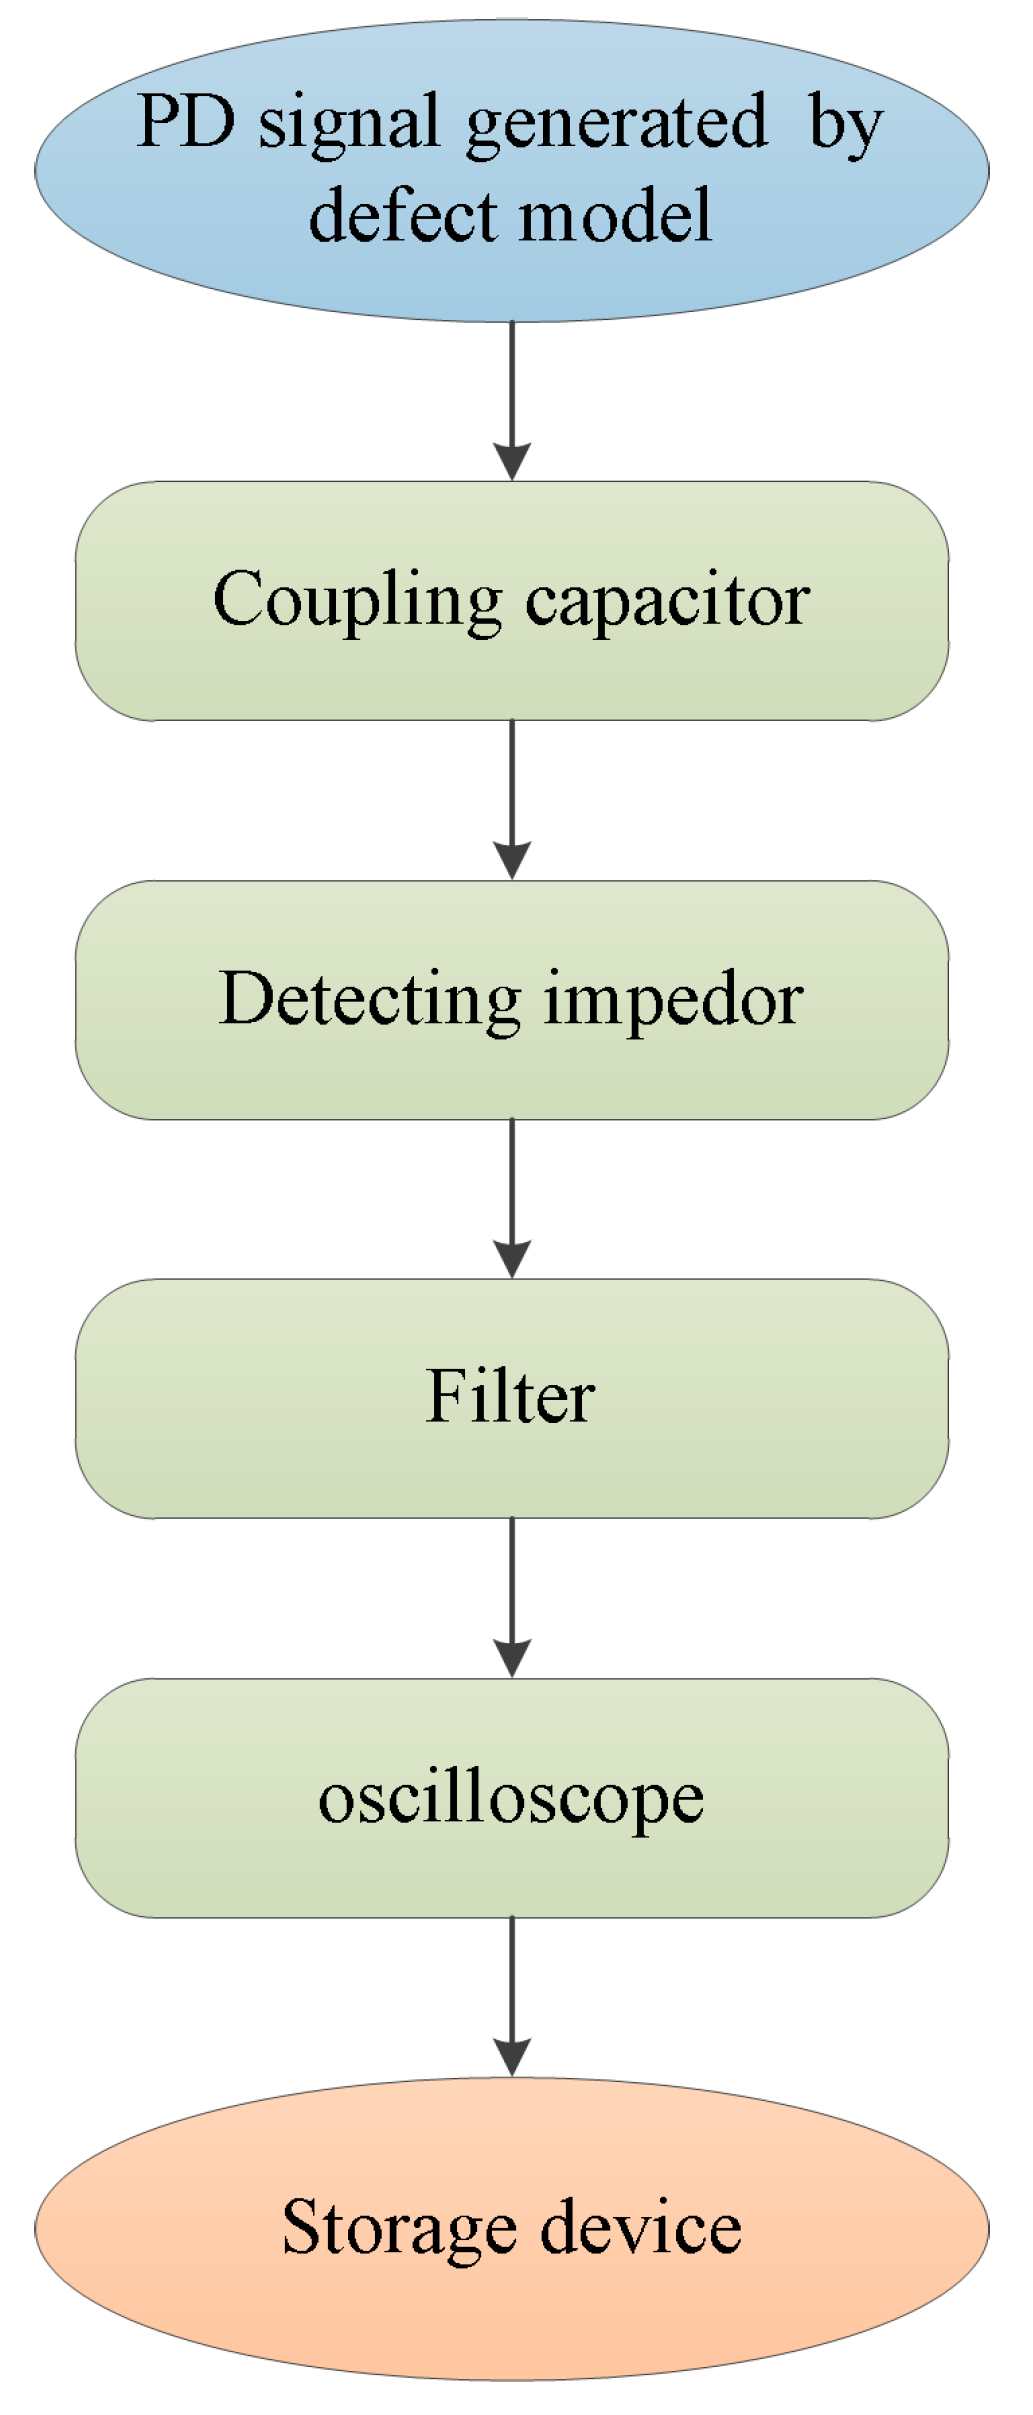
2.3. Voltage Application Method and Data Collection

For the factory acceptance test of oil-immersed converter transformers, four kinds of ratios between AC voltage effective value and DC voltage average value are commonly applied to valve winding, namely 1:1, 1:3, 1:5 and 1:7, respectively [19]. 1:1 is more commonly used in practical operation and experimental study. This study is focused on the PD characteristics of different models and the recognition methods of discharge sources, not on the influence of ratios, thus 1:1 was used for experimental research.
Constant-voltage testing method was used in these experiments because it is similar to the actual situation. All the tests were performed at room temperature. The PD measuring system was calibrated with 500 pC standard pulse discharge source, and the sensitivity of PD measurement system is 5 pC. Both AC and DC voltage were raised step by step (2 kV for each step). In order to wait for the stability process of the conduction current, AC voltage is superimposed on DC voltage after 2 min for each step [20]. The final constant voltage is the PD inception voltage (PDIV) of each test, which can balance the demands of experimental time controlling and simulation of actual situation. In actual operation condition, the voltage of each defective part is not the same, so different levels of external voltage were used for the three defect models in the experiments to ensure that the entire PD process can be properly recorded. The experiment for each model was repeated twice and the results of two experiments for each model were approximately similar. The constant voltage levels of three models were 14 kV for needle-plate model, 16 kV for surface discharge model and 5 kV for air gap model respectively. The waveform of 1:1 combined AC-DC voltage is shown in Figure 3. Sampling rate in this scheme is 100 MS/s. PD pulses of 5 consecutive primitive cycles (20 ms × 5) were sampled in every 3 min. The sampling process began 2 min after the voltage was constant and ended when discharge breakdown occurred. The flow diagram of the PD measurement is shown in Figure 4.

3. Experimental Results and Discussion

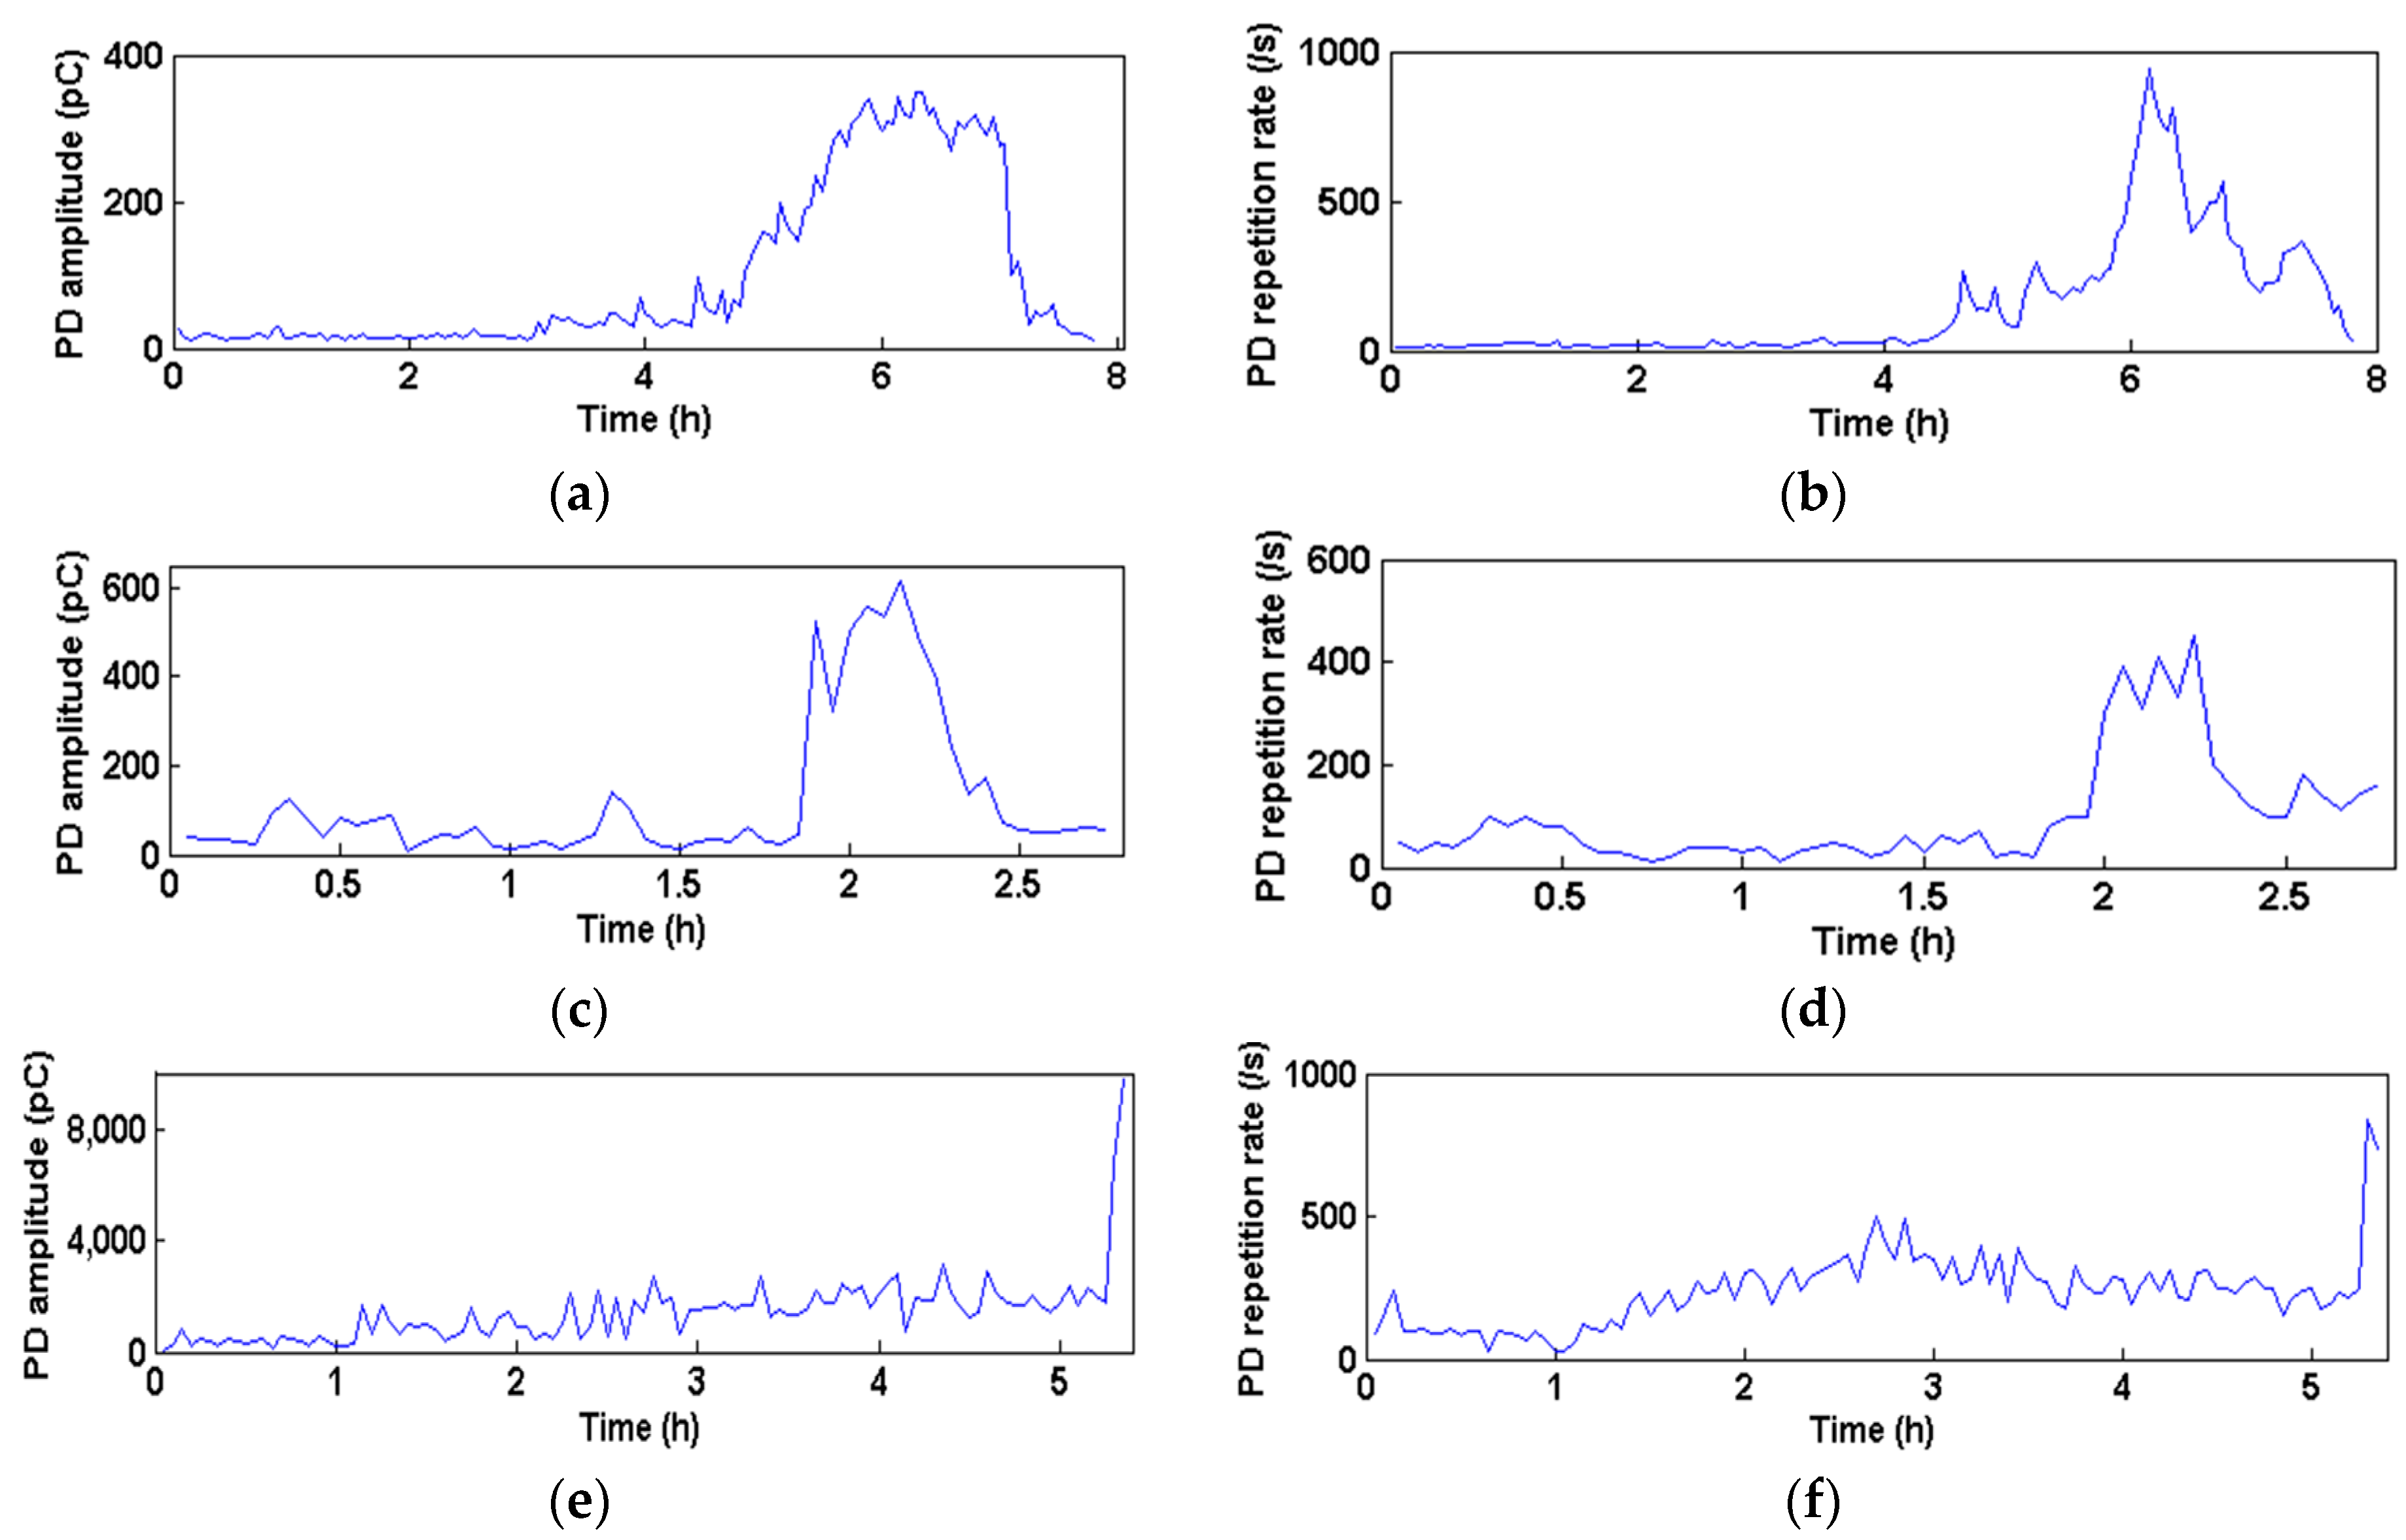
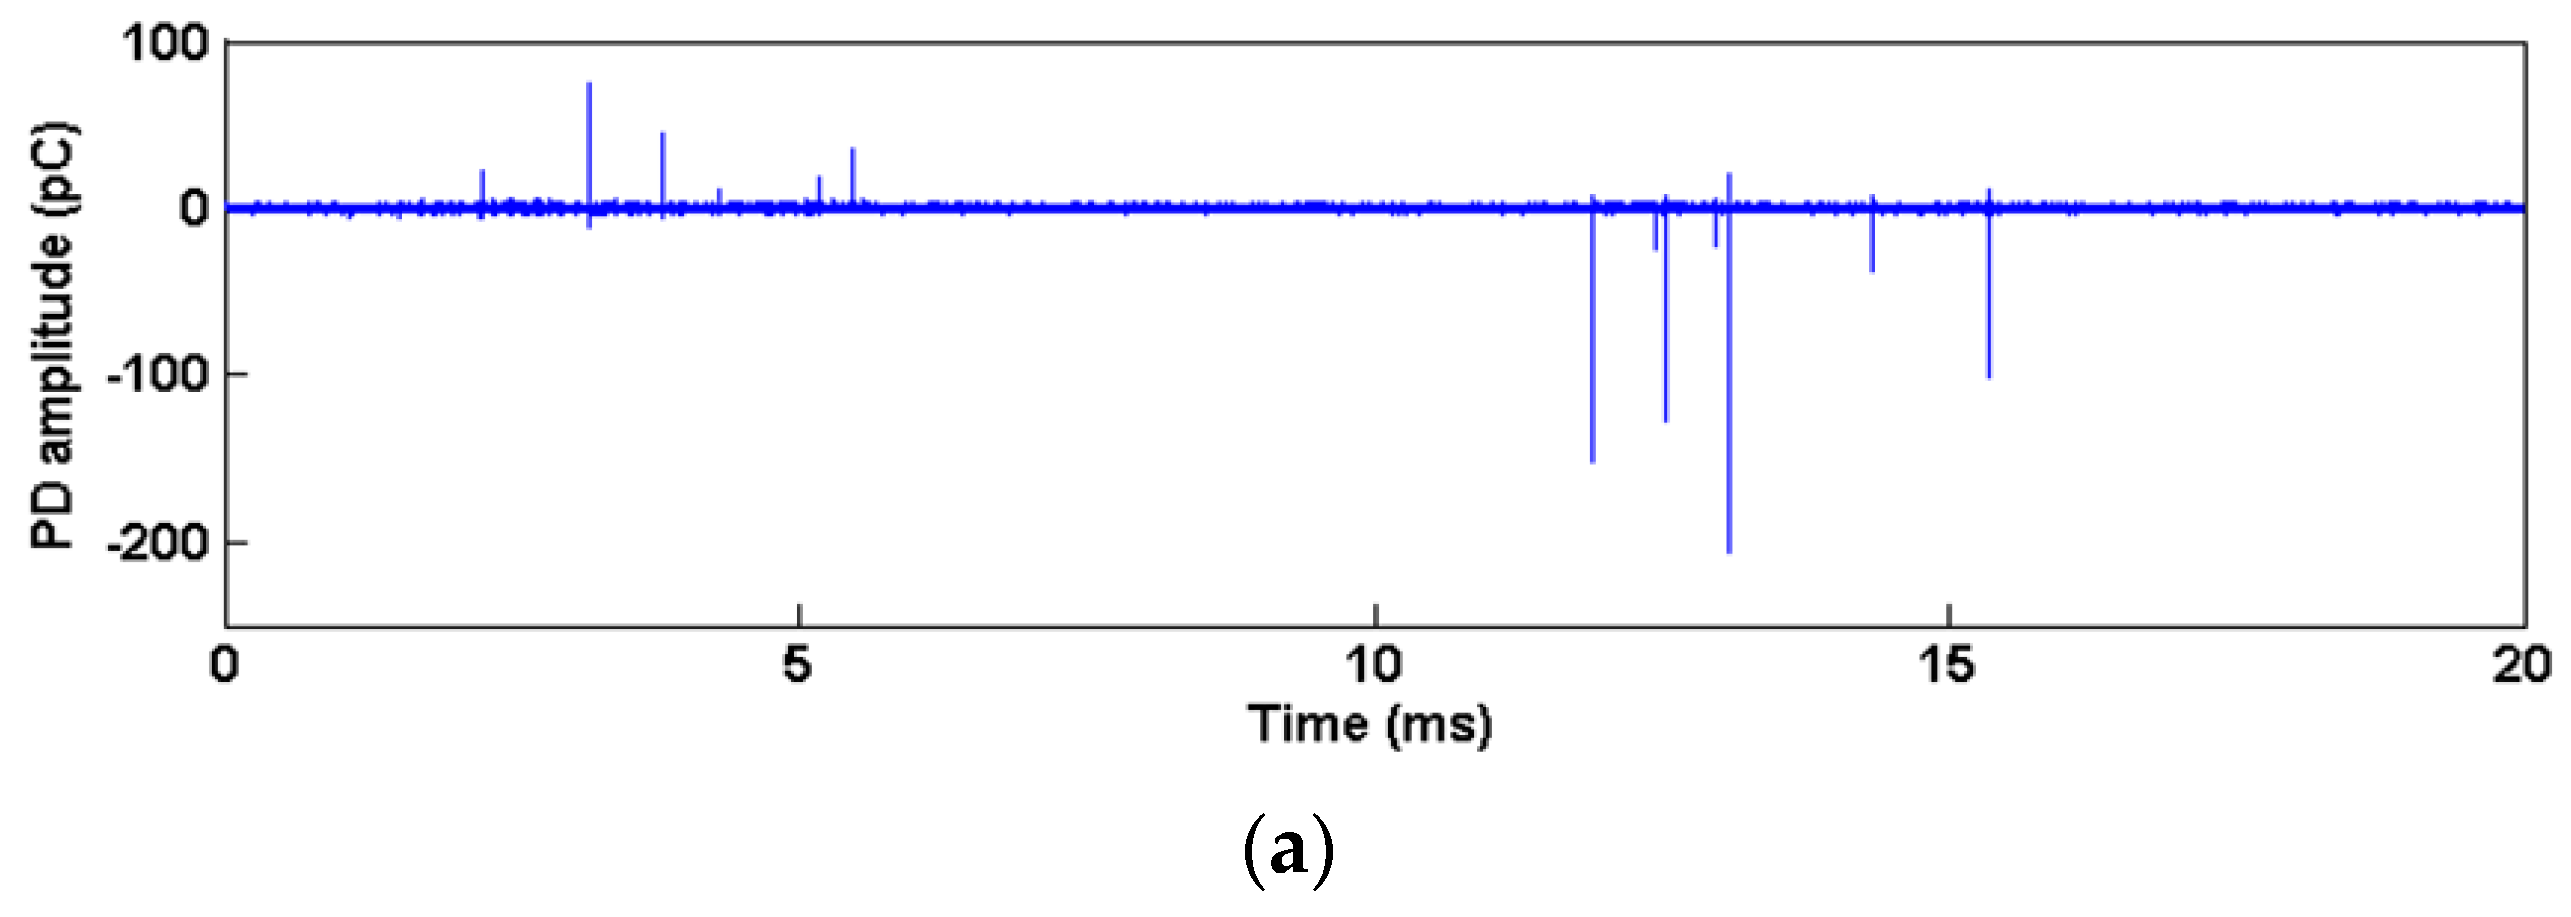
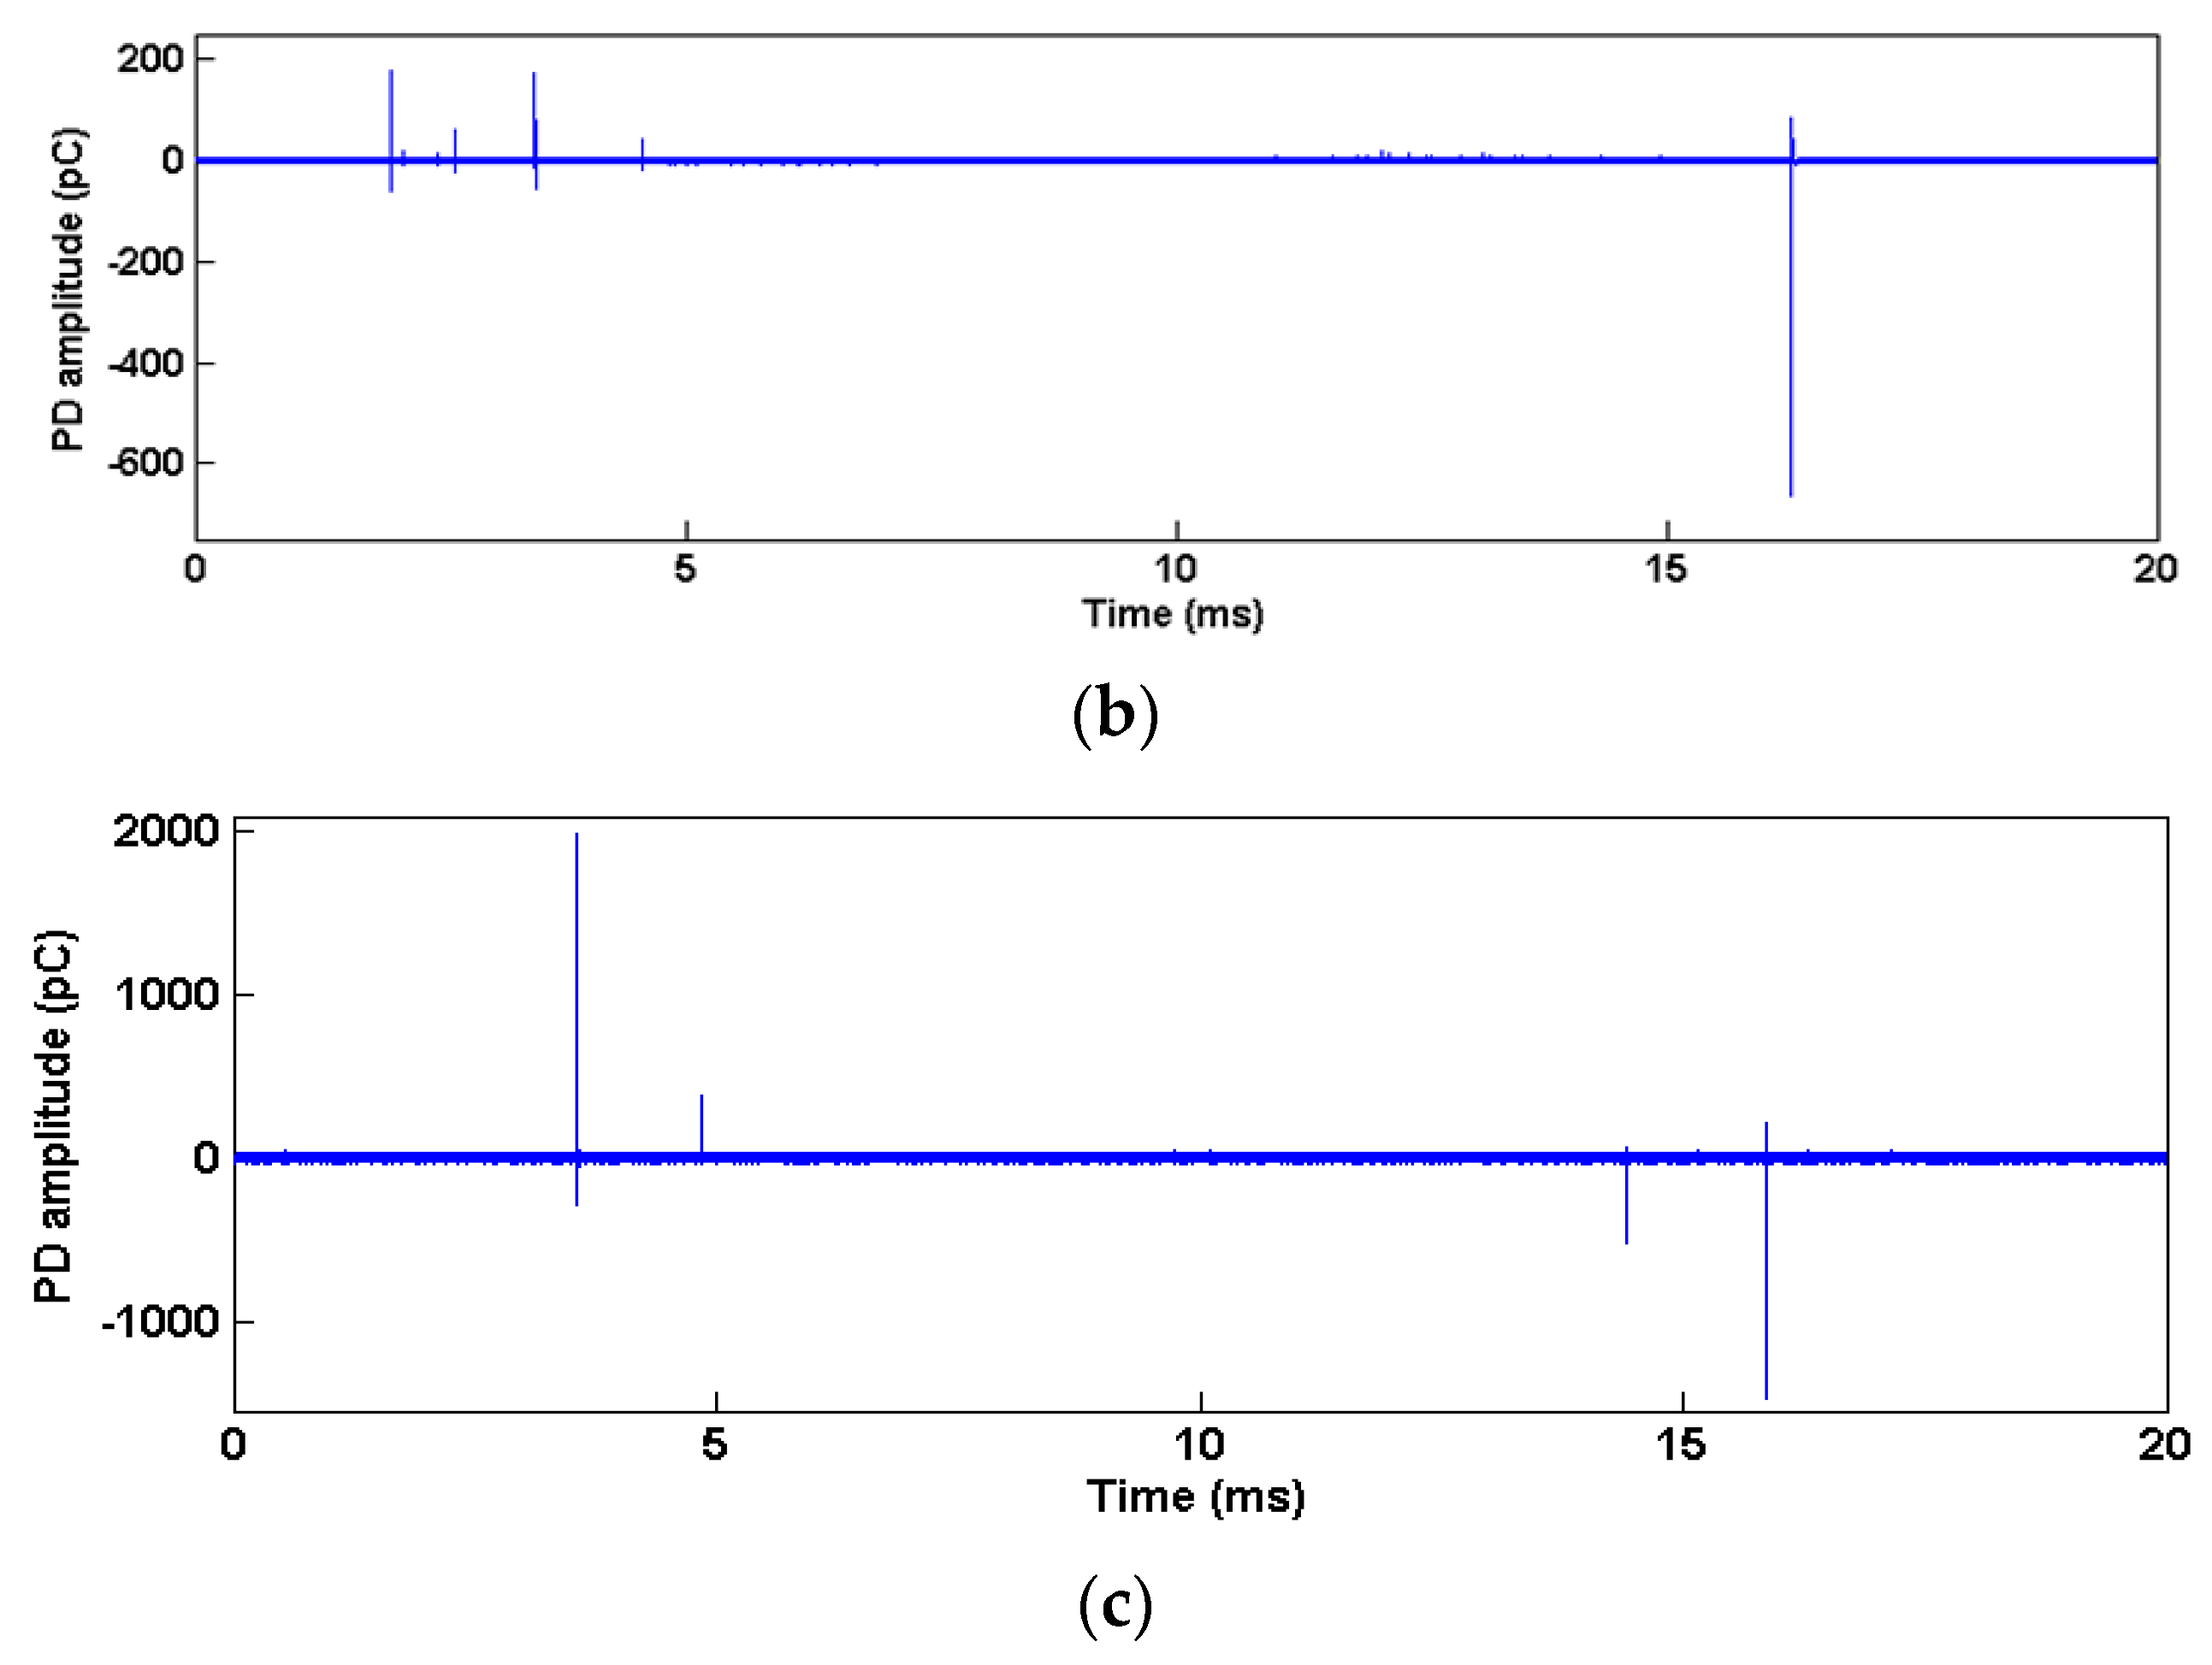
3.1. PD Development Process

The PD processes of three models are different in appearance. The maximum of apparent charge (Qmax) and PD repetition rate (N) are two indicators of PD degree. The time-variation trends of Qmax and N of three models are shown in Figure 5. Because in the experiment of this paper, data of 5 primitive cycles are collected every 3 min, every sample of Qmax is the apparent charge of the largest pulse in the 5 primitive cycles. The experimental process of each PD defect model forms a figure of Qmax time-variation trend. While 1 s contains 50 primitive cycles, the total number of PD pulses in each of the 5 cycles will be multiplied by a factor of 10, planning for the PD repetition rate per 1 s, and creating a time-variation trend of N. The two PD indicators of needle-plate model gradually increase in the first half then maintain a relatively stable state, and rapidly decline before breakdown. The PD indicators of surface discharge model are relatively smoothly at a low level in the first half then rise rapidly, after a period of time they decline until the breakdown. The PD process of air gap model is almost in a steady rising state, and in the vicinity of the breakdown suddenly rises. Overall the PD process of needle-plate model develops the most slowly; Qmax and N of air gap model are the highest because the PD degree of air gap model is the most serious.
In previous studies, the whole PD process is generally divided into three to five stages. In general, the discharge processes of most models before breakdown will experience the discharge steady stage and pre-breakdown stage [21,22]. Figure 6 shows the PD pulses in one primitive cycle in the steady stage of each model. It can be seen that under 1:1 combined AC-DC voltage whose waveform has asymmetrical positive and negative half cycle, PD amplitude in one cycle of needle-plate and surface discharge models is obviously asymmetrical, but this feature of the air gap model is not obvious.

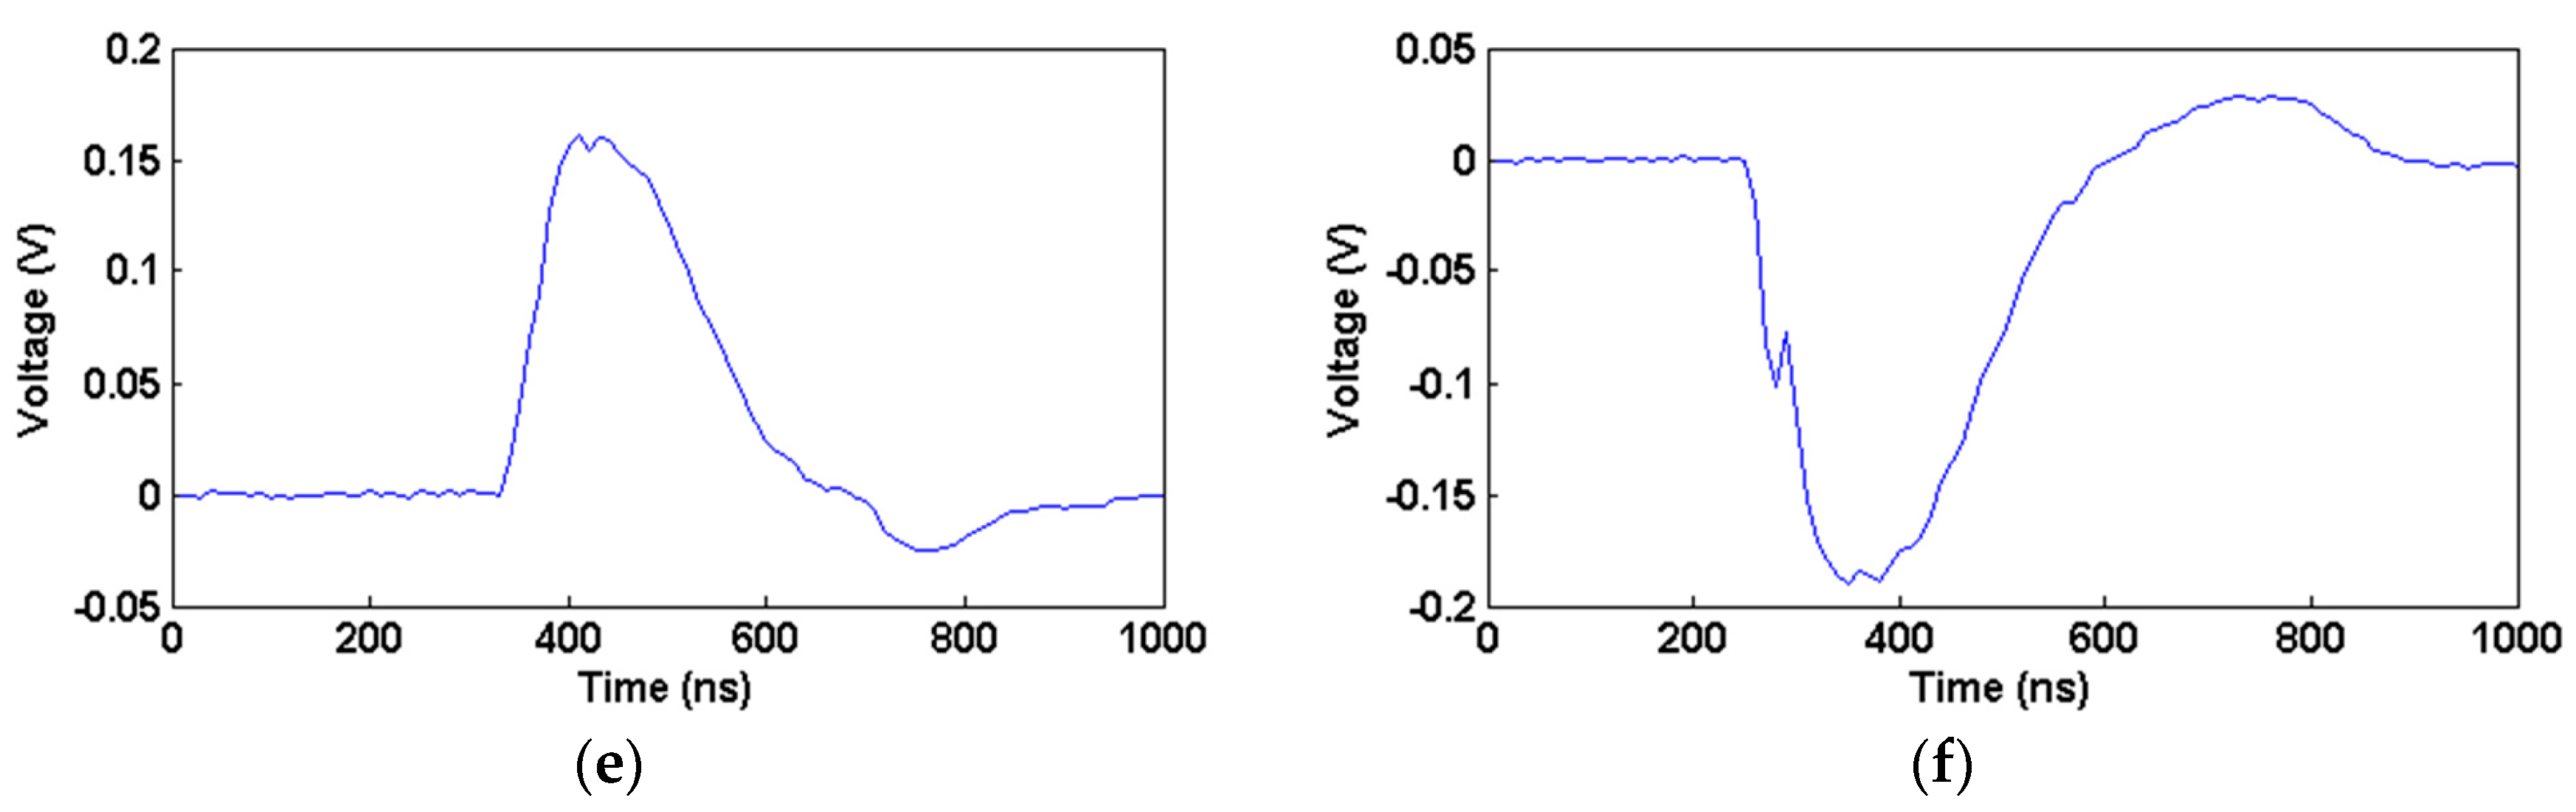
3.2. Discussion on PD Characteristics

PD characteristics are closely related to the model type and oil-pressboard insulation state, and the essence can be obtained from the physical process of discharge and its phenomenon. The dielectric constant proportion of the oil impregnated pressboard and transformer oil is about 2:1 and volume resistivity proportion is dozens to hundreds of times. Therefore, when the voltage is applied, the distribution of the electric field is different for each model because of its different structures.
The electric field distribution of needle-plate model under AC and DC voltage components at the moment when the voltage is applied is shown in Figure 7a,b. The electric field generated by the AC component of the voltage is mainly concentrated around the needle tip, while the electric field generated by the DC component is mainly concentrated in the pressboard. However, the electric strength of the oil is lower and the electric field strength in oil is higher, so PD occurs firstly in the oil around the tip.
The AC voltage component changes periodically while the DC component polarity does not change, so under the DC voltage component, the electrode will inject charges more obviously into the pressboard. At the same time, the charges are concentrated on the interface of the insulating medium as shown in Figure 8. Figure 8a shows the space charge distribution of needle-plate model under DC component. For needle-plate model in the initial stage of PD process, the electric field is seriously distorted near the tip of the needle, resulting in a small amount of bubbles. The charges accumulate at the bubble interface and the oil-paper interface, so that the electric field strength at the tip is weakened and the electric field strength of the oil-paper interface is enhanced. However, the charges accumulated at the oil-gas interface are limited, and the charges of the oil-paper interface diffuse rapidly under the repulsive force. Therefore, the discharge amplitude and frequency are low and the discharge randomness is strong. With the development of discharge, the small bubbles in the oil continue to increase and gather, the paper fiber is ablated, and the pressboard under the tip of needle is sunken. In addition, under the action of DC voltage component, the directional movement of charge inside the pressboard will also lead to local defects, so that the amplitude and frequency of the PD pulses are increased. With a certain period of the steady stage, the bubbles continue to accumulate, a number of gas columns are formed on the pressboard. At this point, a lot of gas is gathered in the depression under the tip of needle format to form gas gap, so that oil gap discharge transforms into gas gap discharge, indicating that the discharge process goes into the pre-breakdown stage. At this time, the discharge in oil gap is weakened and the discharge in gas gap is enhanced. However, the gas gap surface is smooth, and the electric field distribution is more uniform, so there is no penetrating discharge of high-energy. Charge on oil-gas interface diffuse fast, discharge amplitude and frequency are beginning to decline. Gas discharge will bring about a large number of strong oxidized charged particles, and these particles continue to hit the pressboard. Consequently the fiber quickly breaks and the pressboard enters the rapid aging stage [23]. In addition, the large amount of charge generated by the gas discharge will pass through the pressboard in the form of leakage current causing the internal defects of the pressboard. When the gas gap is expanded and drifted under the action of buoyancy, the high energy streamer discharge will run through the oil gap, and inject a lot of charge into the pressboard internal defects, so the pressboard is rapidly carbonized, resulting in insulation breakdown.
The electric field distribution diagrams of surface discharge model under AC and DC voltage components when the voltage starts to be applied are shown in Figure 9a,b. The electric field generated by the AC component of the voltage is mainly concentrated at the angle between the column electrode and the pressboard, while the electric field generated by the DC component is mainly concentrated in the pressboard. At the same time, the small plate electrode on the paper will produce slightly stronger electric field strength in the oil under the DC voltage component.
The space charge distribution of surface discharge model under DC voltage component is shown in Figure 8b. For surface discharge model, in the initial stage the electric field strength is high near the edge of electrode and pressboard contact surface, where the surface discharge begins to occur. The resulting charges will accumulate near the electrode, improving the electric field distortion to a certain extent, making the discharge remaining at a low level for a long period of time. However, with the passage of time, splitting decomposition of oil induced by discharge produces gas, and the charges near the electrode are gradually increased, especially one electrode connected to the positive DC high voltage leads to a large amount of positive charge. The increase of the bubble and the advance of the charge improve the degree of discharges along the surface. Meanwhile, the PD amplitude and the frequency are obviously increased, and the pressboard begins to be obviously destroyed [19]. When there are enough bubbles, the gas gap discharge becomes the main discharge form instead of the discharge in oil. Because the charge generated by gas discharge dissipates quickly, PD amplitude and frequency drops again. The strength of the insulating oil has been significantly reduced, so Impurity Bridge is easily to be formed under the action of a strong electric field, causing flashover.
The electric field distribution diagrams of air gap model under AC and DC voltage components when the voltage starts to be applied are shown in Figure 10a,b. Figure 8c shows the space charge distribution of air gap model under DC voltage component. For air gap model, since the dielectric constant of pressboard is several times of the dielectric constant of air, the electric field strength generated by the AC component is concentrate in the air gap. In addition, the electric field strength generated by the DC component is also slightly higher inside the air gap. However, the electric strength of the air gap is lower, the PD initial voltage is low and the discharge mainly occurs inside the air gap and the end of the PD process is also marked by air gap breakdown. As the influence of the AC voltage component on the discharge of air gap model is more obvious than the above two models, the discharge amplitude is more balanced in the positive and negative half cycles.

4. Defect Pattern Recognition Based on PD Characteristics Using Random Forests

In order to discuss the defect pattern recognition system based on PD characteristics using RF, the waveform and phase of single PD pulse are used to provide information for recognition. In practice, the mainstream PD testers with good performance have single pulse recording function. In this paper, an oscilloscope is used to record the experimental data; all the data collected in the experiment should be processed to extract the waveform and the phase of each PD pulse as the basis of the research.

4.1. Random Forests

As a highly flexible machine learning algorithm, RF has a wide range of applications [24,25]. RF is an algorithm that integrates multiple decision trees and its essence belongs to Ensemble Learning—a branch of machine learning. Explaining RF in principle, for classification problems each decision tree is a classifier, and RF integrates all classification voting results specifying the category with the highest number of votes as the final output. It is the most Simple Bagging ideas [26]. As a very flexible and practical method, RF has the following characteristics:
(1)
It is unexcelled in accuracy among current algorithms.
(2)
It runs efficiently on large data bases.
(3)
It can assess the important degree of each variable in the classification.
(4)
It gets an unbiased estimate of the internal generating error as the forest building progresses.
The above characteristics make RF very suitable for online monitoring of insulation status system based on big data. For the classification problem, RF is divided into two stages of training and testing, and the main steps are:
(1)
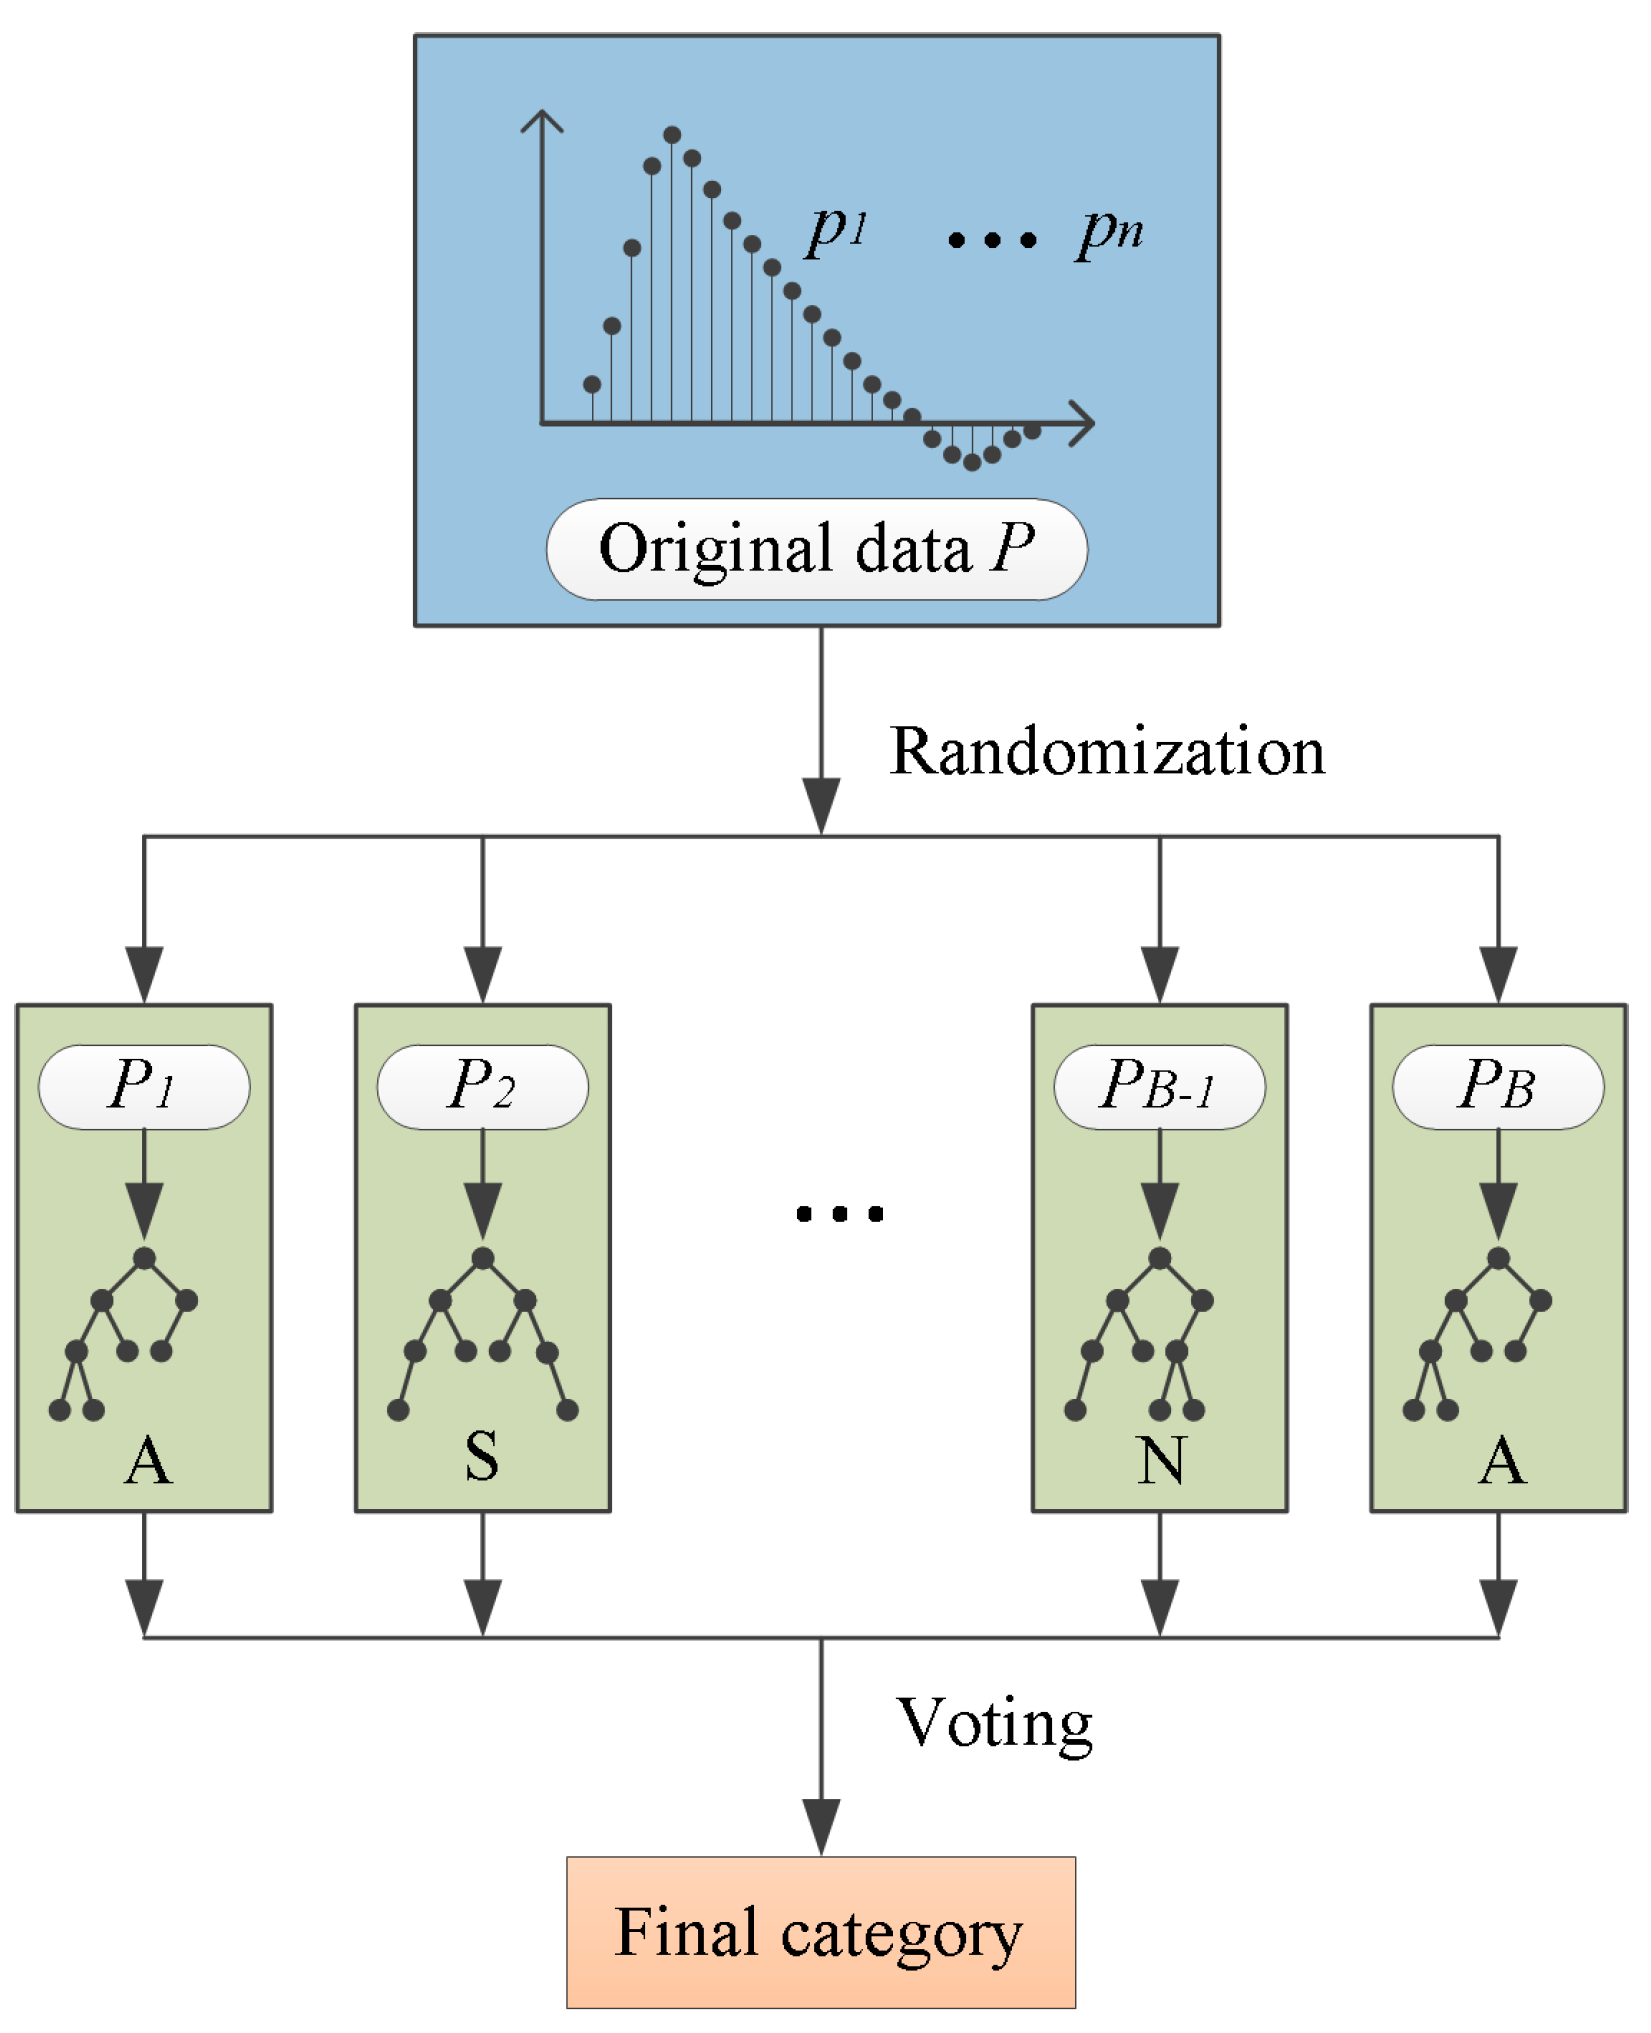
Given a training set X = x1, ..., xn with responses Y = y1,..., yn, bagging repeatedly (B times) select n random samples from { X , Y } with replacement called { X b , Y b } where b = 1, ..., B. In addition, take them as the root node samples of each decision tree fb.
(2)
When establishing decision tree, if the feature dimension of each sample is M, specifying a constant m << M, randomly select m feature subsets from the M features without replacement. Each time the tree is split, the optimal feature is selected as the split node from the m features. In general, if there are a total of M features in the classification task, select m = M features in each split.
(3)
After establishing the random forests, for the test sample x’, each decision tree has a type output fb(x’), and the final category is decided by voting.
RF classification effect (error rate) is related to two factors:
(1)
The error rate increases when the correlation of any two trees in a forest rises.
(2)
The error rate decreases when the classification ability of each tree rises.
During the calculation process, random selection of samples and features is a way of de-correlating the trees. It is not necessary to carry out cross-validation or an independent test to get an unbiased estimate of the error, so unlike LSSVM and other algorithms [27], it does not need to do a lot of parameter debugging in the calculation process of RF. The number of trees B is a free parameter. Typically, a few hundred to several thousand trees are used, depending on the size and nature of the training set. Choosing the best B is mainly based on the calculation of bag error rate—oob error (out-of-bag error). It is calculated as follows:
(1)
For each sample, compute its classification as an oob sample (about 1/3 trees).
(2)
Then take a simple majority vote as the classification result of the sample.
(3)
Finally, use the ratio of misclassified number to the total number of samples as the oob error rate of RF.
The sample features are the time, amplitude and phase information of PD pulse; the output classification result should be the PD source type. Table 2 shows the abbreviation of the source type which will be used in subsequent programming and discussion. Figure 11 shows the flowchart of PD source type classification with RF.

4.2. Data Preprocessing

The experiments in this manuscript were conducted in the lab where the background noise was controlled below 5 pC. However, background noise is the major obstacle in the field tests of PD. Noise can distort the PD pulse waveform and interfere with the recognition algorithm. Therefore, in the field tests the original data must be de-noised in order to get a better recognition effect. Hybrid particle swarm optimization wavelet adaptive threshold estimation (HPSOWATE) is used here for the de-noising of original PD signals. This algorithm incorporates the crossover mutation and chaos to optimize the global threshold value. Genetic algorithm and particle swarm algorithm are introduced to verify the results. When the signal to noise ratio (SNR) is in the range of 0.5 to 2, the mean square error and amplitude error performance of HPSOWATE is significantly better than other wavelet de-noising methods [28]. In Figure 12 the original signal obtained in the field test and the de-noised signal of oscillation-attenuated PD pulse are shown to denote the de-noising effect of HPSOWATE. It can be seen that the de-noised signal not only retains the trend of the original signal but also meets the requirement of SNR for the recognition algorithm.

4.3. Sample Feature Selection

In previous studies, the classification and recognition of PD signals are based on feature extraction, and take the extracted features as the input of algorithms to get the classification and recognition results. There are mainly three methods for extracting the features of PD signal. The first one is to extract the features from the statistical spectrum of the signals. The second one is to take the average value after the features is extracted from the waveform of single PD pulses. The third one is to extract the features directly from single PD pulses as the input of classification algorithms. The first method is to calculate statistical spectrum such as PRPD, and then extract the spectral features or grayscale for classification. This method works well when it is determined that there is only one PD source. However, when the type and number of PD sources are unknown, the calculation of the statistics spectrum based on mixed signals will no longer be able to reflect the actual situation. The second method is to calculate the equivalent time, equivalent frequency and other features of single PD pulses, and then take the average within a certain period of time as an algorithm input to reduce the impact of randomness. When this method is applied to a multi-source problem, it is necessary to classify the pulses first, and then take the average of features from a single source for recognition. The complex computational process makes this method inconvenient to use in multi-source problems. The third method is to use single-pulse features like equivalent frequency and so on as the input of the classification algorithm directly and there is no statistical or averaging process, so the abilities of classification and preventing over-fitting are required highly.
In the existing classification algorithms, RF has the highest classification ability when the sample size is large, and the over fitting problem is not prone to occur, which is very suitable for the aforementioned third method of recognition. Meanwhile RF is insensitive to the magnitude of the feature, and the classification calculation can be performed only when the feature dimensions are the same. Therefore, the calculation process can be greatly simplified. In view of the advantages of RF, original waveforms of PD pulses combined with phase information are selected as the input of RF.
The typical pulse waveforms of three PD models in negative and positive half cycles are shown in Figure 13. The pulses are all from the steady stage mentioned in Section 3.1 and two pulses of one model are from the same primitive period. It can be seen that different PD characteristics lead to different pulses. Because the 1:1 combined AC-DC voltage has asymmetric cycle, the pulses from the same model show different patterns in the positive and negative half cycles, including amplitude, pulse width and so on. Therefore, different with the PD analysis under DC voltage, the phase information of discharge still has important reference value in the PD characteristics analysis. So in addition to the information provided by the pulse waveform, the phase of each PD pulse is added to the feature amount of the sample. The phase processing method is that one cycle is equally divided into 360 phase windows, and the degree of phase window where each pulse is located represents its phase information.
RF algorithm requires the same number of feature dimensions for each sample. The PD pulse of oil-paper insulation is usually dozens of nanoseconds to one microsecond or so. Of the same model in the same development stage, PD pulse shapes are not exactly the same. Under a uniform sampling rate, the number of points contained in each PD pulse is almost different. Therefore, the dimensions of the sample features need to be normalized. The zero-padding method is used to normalize the dimensions of sample features. In view of the PD signal duration range and the sampling rate of the experiment in this paper, 400 is selected as the normalized feature dimension. The specific normalization process is shown in Figure 14. The phase information is taken as the first feature. The PD pulse is connected with the first feature from the second digit. Finally, the remaining positions up to 400 are all supplemented by zero. According to the experimental results, the data between the initial zero-crossing and the third zero-crossing of each discharge is a discharge pulse. This method not only ensures the unification of feature dimensions without losing the information of PD pulses, but also makes the results suitable for RF input. It is noteworthy that the selection of feature dimension needs to be matched with the actual situation, taking into account the experimental circuit structure, sampling rate and assignment calibration.

4.4. Recognition Results

In this paper, three types of PD defect model are investigated and the experiment of each model was repeated twice. In order to verify the effectiveness of the recognition algorithm, two methods of sample selection are used to test as follows:
(1)
All PD pulses are from steady stage. Because of the high PD repetition rate during the steady stage, 1000 discharge pulses were selected for each model as the training set during the steady stage of the first experiment. In addition, 2000 pulses were selected for each model as the test set during the steady stage of the second experiment. This method is abbreviated as 1th set.
(2)
PD pulses of three models come from two different stages. Because the PD amplitude of the air gap model is comparatively higher, in the data of the first experiment, 500 PD pulses of the air gap model at the initial stage were selected and 500 PD pulses of other two models respectively were selected at the steady stage as the training set. In the second experimental data of each model, 1000 pulses were selected as the test set according to the same stages. This method is abbreviated as 2nd set.
When the feature dimension M is 400, m = 20. According to the principle of RF, when the number of decision trees increases to a certain extent, the accuracy of the algorithm will approach a stable interval, therefore considering the impact of calculation accuracy and amount, the number of decision trees B is selected as 500. During the classification test, the three selected test sets of three models are combined and each test sample is input to RF in a random order to finally obtain the classification result.
Table 3 shows the recognition results of two sample selection methods. The recognition rate is calculated as the ratio of the number of correctly recognized samples to the total number of samples in the test set.

4.5. Effect Assessment and Disscussion

It can be seen from Table 3 that the difference between the recognition results obtained by the two sample selection methods is small, and the recognition rate is both high. As good classification algorithms, RF and LSSVM are often used in recognition problems. However, the two algorithms differ in their scope of application. LSSVM works well for small and unbalanced samples. Based on the data set selected in Section 4.3, the classification performance of RF and LSSVM is compared. For the performance comparison of the two algorithms, quantifiable indicators are the calculation time and recognition rate. There are two methods of comparison: the first one uses the features proposed in this paper as input (1st feature), and the second one uses the traditional features for single pulse as input (2nd feature). The traditional features for single pulse are equivalent time, equivalent frequency and time interval [29]. In order to simultaneously evaluate the feature calculation method proposed in this paper, the calculation time in comparison includes the time of feature extraction. Table 4 shows the performance comparison results based on 1st feature. In addition, Table 5 shows the performance comparison results based on 2nd feature.
Because computing speed is affected by hardware conditions, the calculation time is based on the same computer and the same software MATLAB 2012 (MathWorks, Natick, MA, USA) in order to evaluate the performance of the algorithms under the same conditions.
It can be seen in Table 4 and Table 5 that when the number of samples and the feature dimension are small, the calculation accuracy of RF and LSSVM are similar. Any increase in the number of samples or feature dimension can significantly increase the calculation time of LSSVM. The performance of RF has remained a relatively stable level.
Although the calculation speed of RF is not the fastest among all the classification methods, it is good at classifying large samples and is robust to noise. Therefore, the calculation time for data pretreatment in the conventional method can be reduced. In the on-line partial discharge monitoring of power equipment, the processing of big data has become a major demand. Monitoring of large sample size contributes to real-time, continuous and accurate assessment of insulation state. Comparing the results of Table 4 and Table 5, considering the overall recognition ability RF combined with 1st feature is better.
At the same time, the influence of parameter debugging on the recognition ability should also be considered. In the aforementioned comparison test, RF parameters are not adjusted in all the calculations, while LSSVM is more sensitive to the input and the parameters needs to be adjusted when the input is different. For the LSSVM, the kernel function parameters and the regularization parameter are the main factors that affect the performance. Secondly, the selection of the penalty factor also has certain influence on the performance. In previous research, some researchers put forward a variety of optimization methods for this problem such as cross-validation selection method, genetic algorithm-based selection method, particle swarm optimization-based selection method and so on [30,31]. No matter which kind of selection method will increase the calculation time to some extent, while making the operation of the recognition system more difficult. Cross-validation is used in this paper to adjust the parameters. The adjustment time varies with the proficiency of the operators and therefore cannot be compared quantitatively. In actual operation monitoring, excessive parameter debugging will greatly reduce the operability of the recognition system. So comprehensively considering all aspects of the situation, RF is more adaptable.
In this paper, only PD pattern recognition is studied. However in practical application, the development stage of PD is also an important monitoring target. In order to get a better application effect, based on the research of this paper, the stage recognition of PD development under different models is required. The expert library that can comprehensively recognize the PD pattern and development stages is the next step of research.

5. Conclusions

In order to study the defect pattern recognition based on PD characteristics, the PD characteristics of oil-pressboard insulation with three defect models (needle-plate, surface discharge and air gap) under 1:1 combined AC-DC voltage is described in this paper. RF is used for PD pattern recognition. Single PD pulse and its phase information are used as the input feature, and zero-padding method is used to normalize the feature dimension. The main conclusions are as follows:
(1)
According to the time-variation trends of Qmax and N, PD pulse distribution in single cycle and discharge mechanism explanation, it can be seen that under 1:1 combined AC-DC voltage, the influence of DC voltage component on the PD characteristics of air gap model is less than that of other two models, and the influence of DC component on PD repetition rate is less than that of PD amplitude.
(2)
In the case of a large sample size, recognition effect of RF on the PD pattern is good. In the case that PD pulses of the three models are all in a steady stage and are in different stages, the recognition effect can reach more than 85%.
(3)
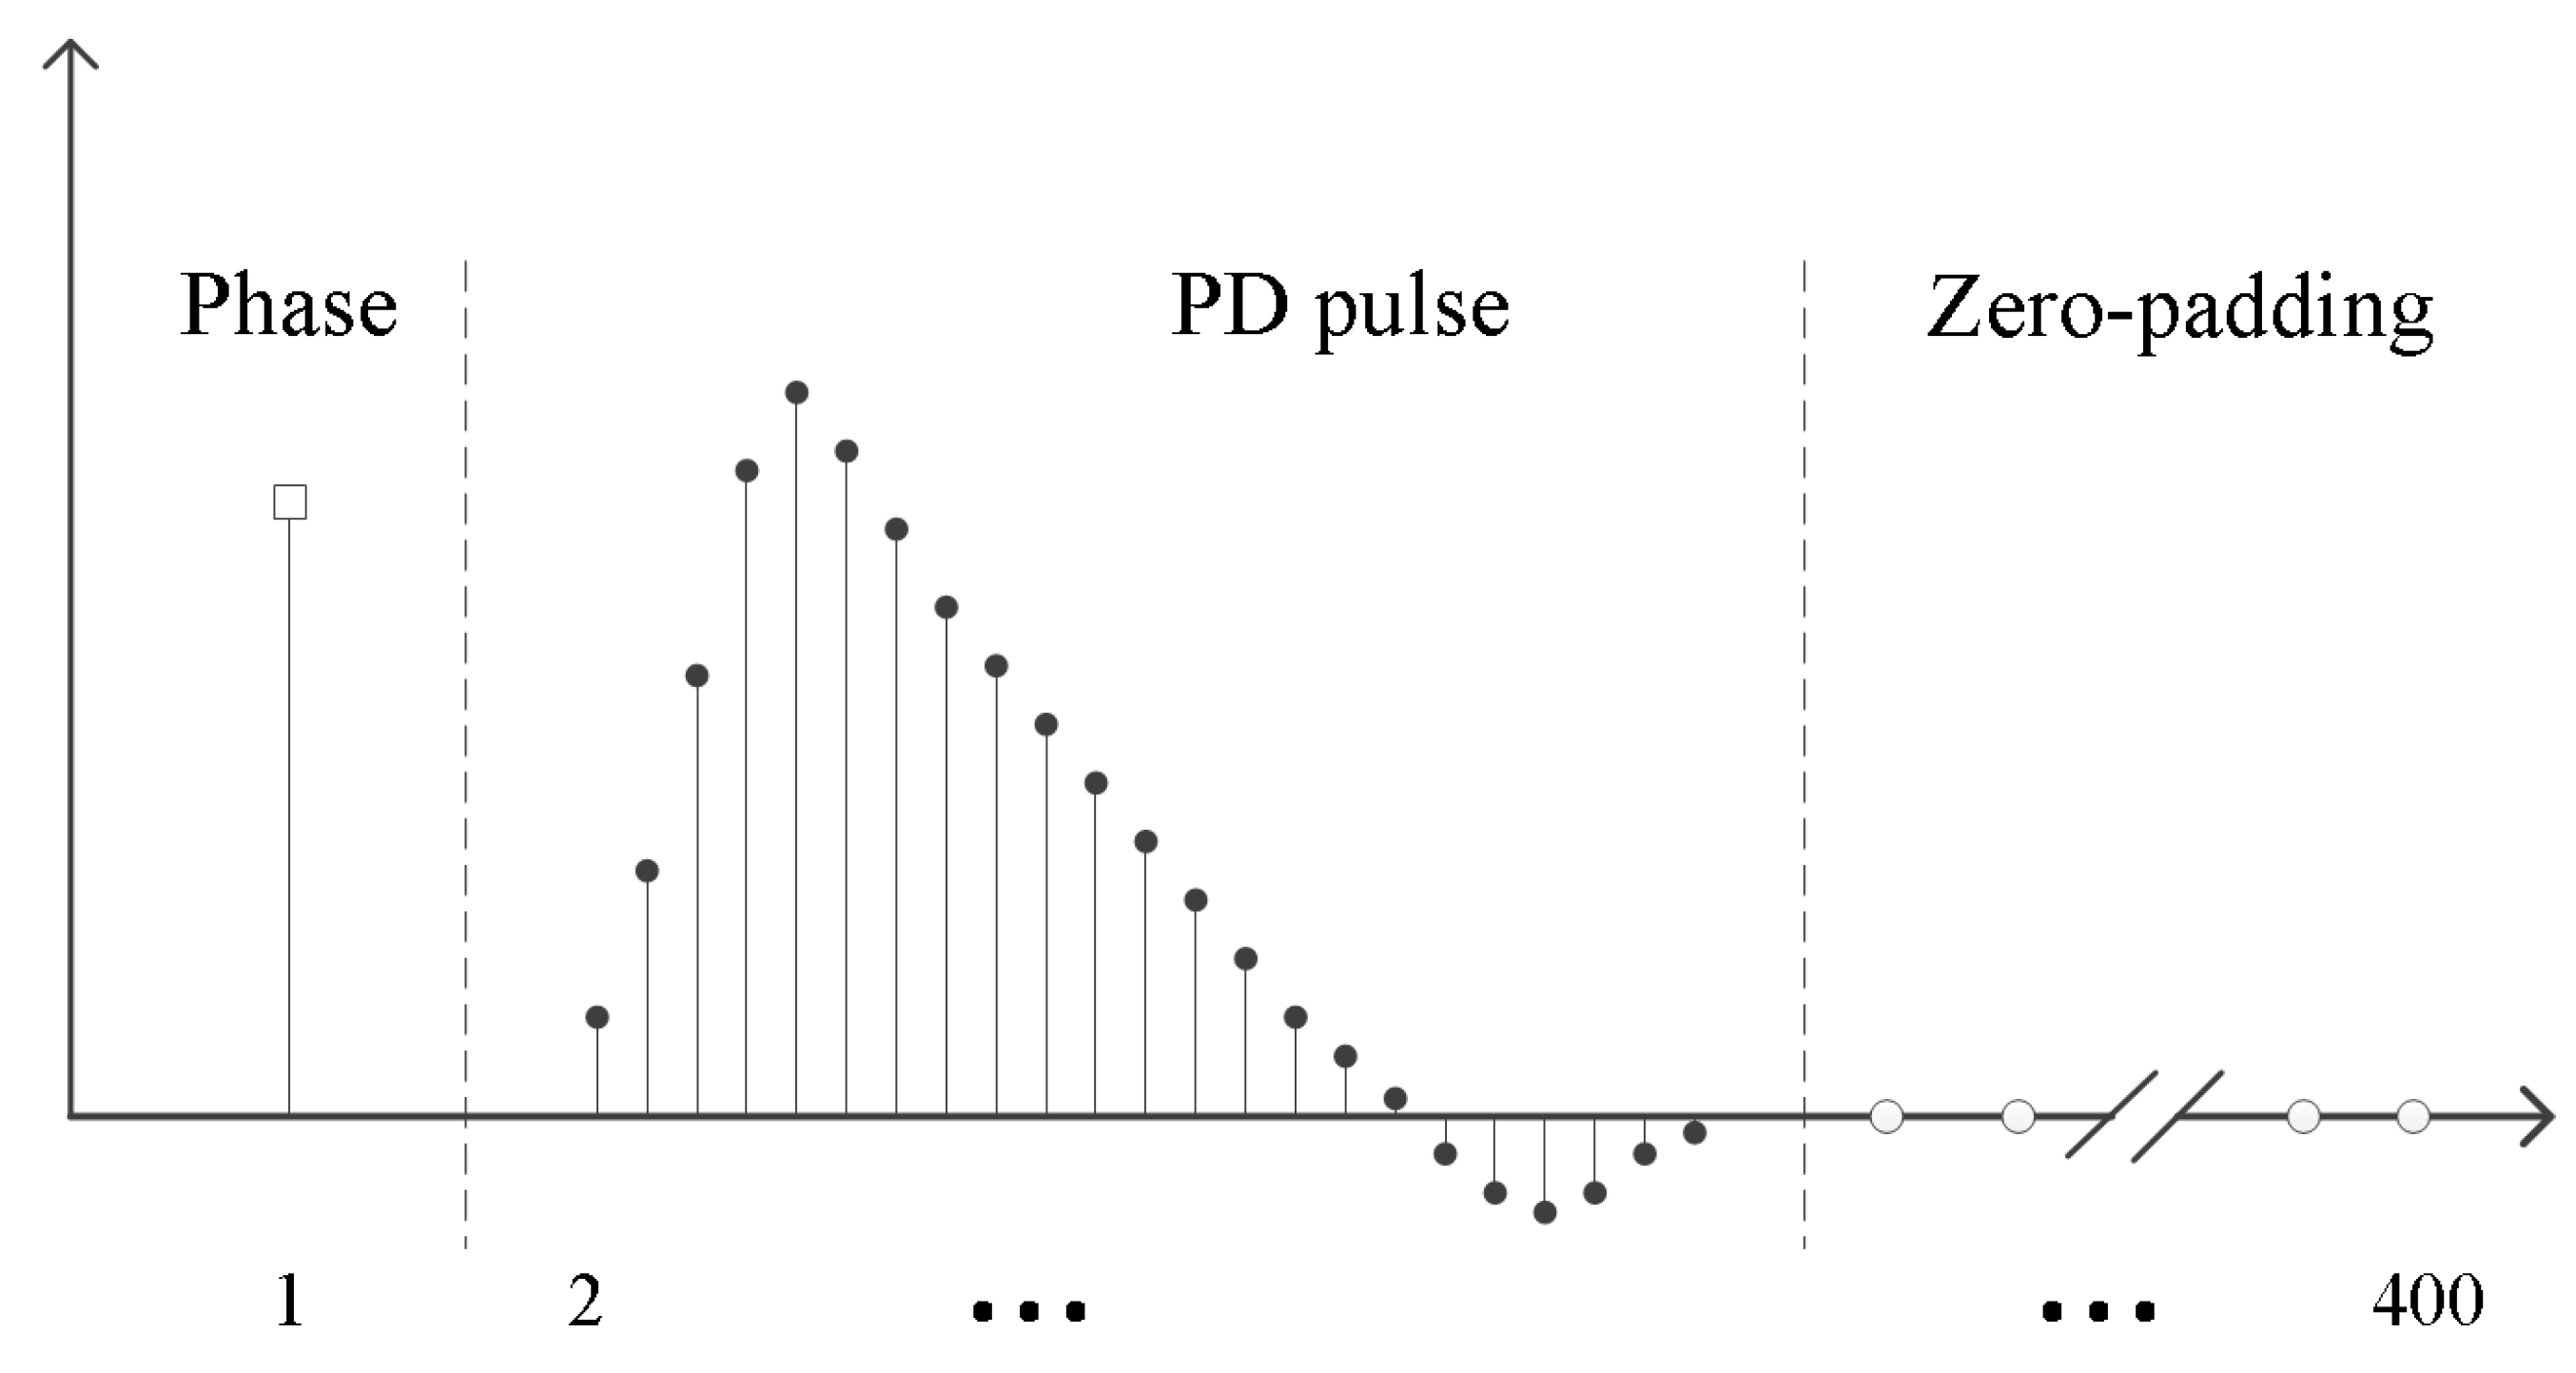
Using phase information combined with waveform of PD pulse as the input feature can well reflect the characteristics. The method of zero-padding used to normalize the features can reduce the calculation amount and prevent information lose. Therefore, it is suitable for the PD pattern recognition in cooperation with RF.
(4)
RF and LSSVM are compared for PD pattern recognition. In the case of a large amount of data, comprehensively considering the recognition rate, calculation time and adaptation, the performance of RF is better.

Acknowledgments

Project supported by the National Natural Science Foundation of China (51777117).

Author Contributions

Wen Si conceived and designed the experiments, Yalin Shi and Tongqiao Zhang helped with the experiment; Huaishuo Xiao optimized the algorithm; Wen Si wrote the paper, Simeng Li and Qingquan Li revised it.

Conflicts of Interest

The authors declare no conflict of interest.

References

  1. Sha, Y.C.; Zhou, Y.X.; Zhang, L.; Huang, M.; Jin, F.B. Measurement and simulation of partial discharge in oil-paper insulation under the combined AC-DC voltage. J. Electrost. 2013, 71, 540–546. [Google Scholar] [CrossRef]
  2. Li, X.N.; Li, F.Q.; Chen, S.Y.; Li, Y.N.; Zou, Q.; Wu, Z.P.; Lin, S.B. An improved commutation prediction algorithm to mitigate commutation failure in high voltage direct current. Energies 2017, 10, 1481. [Google Scholar] [CrossRef]
  3. Li, S.M.; Si, W.; Li, Q.Q. Partition and recognition of partial discharge development stages in oil-Pressboard insulation with needle-plate electrodes under 1:1 combined AC-DC voltage stress. IEEE Trans. Dielectr. Electr. Insul. 2017, 24, 1781–1793. [Google Scholar] [CrossRef]
  4. Li, J.H.; Han, X.T.; Liu, Z.H.; Yao, X.; Li, Y.M. PD characteristics of oil-pressboard insulation under AC and DC mixed voltage. IEEE Trans. Dielectr. Electr. Insul. 2016, 23, 444–450. [Google Scholar] [CrossRef]
  5. Lu, Y.C.; Li, W. Study on condition assessment and fault diagnosis for converter transformers. In Proceedings of the International Conference on High Voltage Engineering and Application, Chengdu, China, 19–22 September 2016; pp. 1–4. [Google Scholar]
  6. Jiang, W.; Hu, J.C.; He, L. Anti-interference measures and discharge location for UHVDC converter transformer partial discharge test. In Proceedings of the 12th IET International Conference on AC and DC Power Transmission (ACDC 2016), Beijing, China, 28–29 May 2016; p. 4. [Google Scholar]
  7. Mas’ud, A.A.; Ardila-Rey, J.A.; Albarracin, R.; Muhammad-Sukki, F.; Bani, N.A. Comparison of the performance of artificial neural networks and fuzzy logic for recognizing different partial discharge sources. Energies 2017, 10, 1060. [Google Scholar] [CrossRef]
  8. Chen, B.C.; Qi, W.Q.; Yuan, J.X.; You, Y.H. Recognition of high-voltage cable partial discharge signal based on adaptive fuzzy c-means clustering. Int. J. Patt. Recogn. Artif. Intell. 2017, 31, 1759009. [Google Scholar] [CrossRef]
  9. Raymond, W.J.K.; Illias, H.A.; Abu Bakar, A. Classification of partial discharge measured under different levels of noise contamination. PLoS ONE 2017, 12, e0170111. [Google Scholar]
  10. Si, W.R.; Li, J.H.; Yuan, P.; Li, Y.M. Digital detection, grouping and classification of partial discharge signals at DC voltage. IEEE Trans. Electr. Insul. 2008, 15, 1663–1674. [Google Scholar]
  11. Mas’ud, A.A.; Stewart, B.G.; Mcmeekin, S.G.; Nesbit, A. Partial discharge pattern classification of angled point-oil-pressboard degradation. In Proceedings of the Electrical Insulation and Dielectric Phenomena Annual Report, Shenzhen, China, 20–23 October 2013; pp. 1217–1220. [Google Scholar]
  12. Wei, G.; Tang, J.; Zhang, X.X.; Lin, J.Y. Gray intensity image feature extraction of partial discharge in high-voltage cross-linked polyethylene power cable joint. Int. Trans. Electr. Energy Syst. 2014, 24, 215–226. [Google Scholar] [CrossRef]
  13. Zhang, S.Q.; Li, C.R.; Wang, K.; Li, J.Z.; Liao, R.J.; Zhou, T.C.; Zhang, Y.Y. Improving recognition accuracy of partial discharge patterns by image-oriented feature extraction and selection technique. IEEE Trans. Dielectr. Electr. Insul. 2016, 23, 1076–1087. [Google Scholar] [CrossRef]
  14. Xin, L.; Caixin, X.; Yang, Y.M.; Li, J.; Tang, J.J. Research on PD pattern recognition by extracting features from PD energy distribution. In Proceedings of the Fifth International Conference on Electrical Machines and Systems, Shenyang, China, 18–20 August 2001; pp. 354–356. [Google Scholar]
  15. Boya, C.; Ruiz-Llata, M.; Posada, J.; Garcia-Souto, J.A. Identification of multiple partial discharge sources using acoustic emission technique and blind source separation. IEEE Trans. Dielectr. Electr. Insul. 2015, 22, 1663–1673. [Google Scholar] [CrossRef]
  16. Wang, K.; Li, J.Z.; Zhang, S.Q.; Gao, F.; Cheng, H.C.; Liu, R.; Liao, R.J.; Grzybowski, S. A new image-oriented feature extraction method for partial discharges. IEEE Trans. Dielectr. Electr. Insul. 2015, 22, 1015–1024. [Google Scholar] [CrossRef]
  17. International Electrotechnical Commission. High-Voltage Test Techniques-Partial Discharge Measurements; IEC 60270; IEC: Geneva, Switzerland, 2000. [Google Scholar]
  18. International Electrotechnical Commission. Specification for Pressboard and Presspaper for Electrical Purposes; IEC 60641; IEC: Geneva, Switzerland, 2008. [Google Scholar]
  19. Qi, B.; Wei, Z.; Li, C.R. Creepage discharge of oil-pressboard insulation in AC-DC composite field: Phenomenon and characteristics. IEEE Trans. Dielectr. Electr. Insul. 2016, 23, 237–245. [Google Scholar] [CrossRef]
  20. Sha, Y.C.; Zhou, Y.X.; Li, J.Z.; Wang, J.Y. Partial discharge characteristics in oil-paper insulation under combined AC-DC voltage. IEEE Trans. Dielectr. Electr. Insul. 2014, 21, 1529–1539. [Google Scholar] [CrossRef]
  21. Cui, Y.J.; Zhu, L.Y.; Ji, S.C.; Cao, P.; Zhang, F. Partial discharge development in needle-plane configuration of oil-paper insulation under AC voltage. IEEE Trans. Dielectr. Electr. Insul. 2017, 24, 2469–2476. [Google Scholar] [CrossRef]
  22. Chen, W.G.; Chen, X.; Xie, B.; Wang, Y.Y.; Liao, R.J. Feature extraction and stage classification of cavity discharge development in transformer oil-paper insulation. IEEE Trans. Dielectr. Electr. Insul. 2014, 24, 819–825. [Google Scholar]
  23. Li, Y.; Zhang, Q.G.; Wang, T.L.; Li, J.Z.; Guo, C.; Ni, H.L. Degradation characteristics of oil-immersed pressboard samples induced by partial discharges under DC voltage. IEEE Trans. Dielectr. Electr. Insul. 2017, 24, 1110–1117. [Google Scholar] [CrossRef]
  24. Ashesh, M.S.; Bhavesh, R.B. Fault discrimination scheme for power transformer using random forest technique. IET Gener. Transm. Distrib. 2016, 10, 1431–1439. [Google Scholar]
  25. Ren, A.; Li, Q.Q.; Xiao, H.S. Influence analysis and prediction of ESDD and NSDD based on random forests. Energies 2017, 10, 878. [Google Scholar] [CrossRef]
  26. Leo, B. Random forests. Mach. Learn. 2001, 45, 5–32. [Google Scholar]
  27. Sharkawy, R.M.; Abdel-Galil, T.K.; Mangoubi, R.S.; Salama, M.M. Particle identification in terms of acoustic partial discharge measurements in transformer oils. IEEE Trans. Dielectr. Electr. Insul. 2008, 15, 1649–1656. [Google Scholar] [CrossRef]
  28. Li, Q.Q.; Qin, B.Y.; Si, W.; Wang, R.X.; Liu, B.; Ma, S.; Wang, X. Estimation algorithm for adaptive threshold of hybrid particle swarm optimization wavelet and its application in partial discharge signals de-noising. High Volt. Eng. 2017, 43, 1485–1492. (In Chinese) [Google Scholar]
  29. Li, S.M.; Li, Q.Q.; Si, W.; Yao, J.Y. An image-oriented recognition method for PD development stage in oil-pressboard insulation with needle-plate model under AC-DC mixed voltage. In Proceedings of the 2017 1st International Conference on Electrical Materials and Power Equipment (ICEMPE), Xi’an, China, 14–17 May 2017; pp. 275–282. [Google Scholar]
  30. Li, D.; Zhang, H.X.; Zhang, M.M. Wavelet de-noising and genetic algorithm-based least squares twin SVM for classification of arrhythmias. Circuits Syst. Signal Process. 2017, 36, 2828–2846. [Google Scholar] [CrossRef]
  31. Cao, J.; Jiang, Z.B.; Wang, K.Z. Customer demand prediction of service-oriented manufacturing using the least square support vector machine optimized by particle swarm optimization algorithm. Eng. Optim. 2017, 49, 1197–1210. [Google Scholar] [CrossRef]
Figure 1. Schematic diagram of the experimental arrangement.
Energies 11 00592 g001
Figure 2. Schematic diagram of the electrodes. (a) Needle-plate; (b) Surface discharge; (c) Air gap.
Energies 11 00592 g002
Figure 3. The applied voltage waveform.
Energies 11 00592 g003
Figure 4. Flow diagram of the PD measurement.
Energies 11 00592 g004
Figure 5. Time-variation trends of Qmax and N of three models. (a) Qmax of needle-plate; (b) N of needle-plate; (c) Qmax of surface discharge; (d) N of surface discharge; (e) Qmax of air gap; (f) N of air gap.
Energies 11 00592 g005
Figure 6. PD pulses in one primitive cycle of three models. (a) Needle-plate; (b) Surface discharge; (c) Air gap.
Energies 11 00592 g006aEnergies 11 00592 g006b
Figure 7. Electric field distribution of needle-plate model under AC and DC voltage components. (a) AC voltage component; (b) DC voltage component.
Energies 11 00592 g007aEnergies 11 00592 g007b
Figure 8. Space charge distribution diagram under DC component. (a) Needle-plate; (b) Surface discharge; (c) Air gap.
Energies 11 00592 g008
Figure 9. Electric field distribution of surface discharge model under AC and DC voltage components. (a) AC voltage component; (b) DC voltage component.
Energies 11 00592 g009
Figure 10. Electric field distribution of air gap model under AC and DC voltage components. (a) AC voltage component; (b) DC voltage component.
Energies 11 00592 g010aEnergies 11 00592 g010b
Figure 11. Flowchart of PD source type classification with RF.
Energies 11 00592 g011
Figure 12. Original signal and de-noised signal of oscillation-attenuated PD pulse.
Energies 11 00592 g012
Figure 13. Single PD pulses of three models. (a) Positive half cycle of needle-plate; (b) Negative half cycle of needle-plate; (c) Positive half cycle of surface discharge; (d) Negative half cycle of surface discharge; (e) Positive half cycle of air gap; (f) Negative half cycle of air gap.
Energies 11 00592 g013aEnergies 11 00592 g013b
Figure 14. Schematic diagram of the feature normalization.
Energies 11 00592 g014
Table 1. Parameters of the experimental circuit.
ParameterIndex
Rated voltage of AC power source70 kV
Rated power of AC power source7 kVA
Rated voltage of DC power source50 kV
Rated power of DC power source5 kVA
Ratio of resistive divider1000:1
RAC10 MΩ
RDC20 MΩ
CAC830 pF
CDC830 pF
Passband of filterHigh-pass 1 kHz
Table 2. Abbreviation of the source type.
PD Source TypeNeedle-PlateSurface DischargeAir Gap
AbbreviationNSA
Table 3. Recognition results.
Model TypeRecognition Rate (%)Recognition Rate (%)
1st Set2nd Set
N87.8585.90
S89.7588.50
A92.0591.20
Table 4. Performance comparison results of 1st feature.
AlgorithmModel TypeRecognition Rate (%)Calculation Time (s)
1st Set2nd Set1st Set2nd Set
RFN87.8585.90547.34326.65
S89.7588.50
A92.0591.20
LSSVMN70.2571.604783.142968.58
S73.6072.20
A73.7072.80
Table 5. Performance comparison results of 2nd feature.
AlgorithmModel TypeRecognition Rate (%)Calculation Time (s)
1st Set2nd Set1st Set2nd Set
RFN75.9073.40602.45395.77
S76.5574.10
A76.9576.20
LSSVMN75.2573.60696.61419.67
S75.8074.20
A76.3576.80

