Article

Impact of Heat Pump-Driven Liquid Desiccant Dehumidification on the Energy Performance of an Evaporative Cooling-Assisted Air Conditioning System

Department of Architectural Engineering, College of Engineering, Hanyang University, 222 Wangsimni-Ro, Seongdong-Gu, Seoul 04763, Korea
*
Author to whom correspondence should be addressed.
Energies 2018, 11(2), 345; https://doi.org/10.3390/en11020345
Submission received: 2 January 2018 / Revised: 22 January 2018 / Accepted: 24 January 2018 / Published: 2 February 2018

Abstract

:
The main objective of this research is to investigate the energy performance enhancement obtained by applying a heat pump to a liquid desiccant and indirect and direct evaporative cooling-assisted 100% outdoor air system (LD-IDECOAS). In conventional LD-IDECOAS operation, the boiler providing regeneration heat to the weak desiccant solution consumes most of the energy. In order to reduce the regeneration energy consumption in the LD-IDECOAS, a heat pump-integrated LD-IDECOAS (HPLD-IDECOAS) is suggested in this research. The heat pump reclaims waste heat from the absorber side of the system, and delivers the reclaimed heat to the regenerator side. Detailed energy simulations for both the LD-IDECOAS and HPLD-IDECOAS were conducted to analyze the energy saving potentiality of the proposed system over the conventional LD-IDECOAS. In both systems, it was assumed that a packed-bed type liquid desiccant unit with an aqueous solution of lithium chloride (LiCl) was used. In the proposed system, a heat pump with R-134a refrigerant was adopted. The results show that the proposed system was able to provide a 33% reduction in annual primary energy consumption compared with the conventional LD-IDECOAS. This significantly enhanced energy performance was mainly obtained through an 83% reduction in the gas energy consumed for regeneration of the desiccant solution in the proposed system by applying the heat pump.

1. Introduction

According to the recent literature [1], liquid desiccant and evaporative cooling-assisted air conditioning systems are attracting more interest for realizing energy conservative air-conditioning options. The liquid desiccant system, which dehumidifies the process air, plays an important role in enhancing the performance of evaporative coolers. In a liquid desiccant system, the desiccant solution should be heated for regeneration and cooled for enhancing the moisture removal efficiency, which accounts for over 40% of the total energy consumption in a liquid desiccant and evaporative cooling-assisted air conditioning system [2]. However, if combined with low-grade heat sources, the liquid desiccant-integrated system may provide high energy saving potential over conventional air conditioning systems [3]. There is research available that [4,5,6,7,8] addresses the potential of deploying waste heat recovery or solar energy as a heat source, for regenerating the desiccant solution, and the water-side free cooling approach can be applied for cooling the desiccant solution.
Katejanekarn and Kumar [4] conducted a simulation on a solar-regenerated liquid desiccant system for dehumidifying the outdoor air. They concluded that solar radiation, ventilation rate, and desiccant solution concentration were the most influential factors determining the performance of their proposed system. Gommed and Grossman [5] proposed a liquid desiccant system which is assisted by a solar thermal system and a cooling tower. Their experimentally validated simulation confirmed that their proposed system could provide a high degree of dehumidification. Jain et al. [6] conducted an experimental study on the performance of a liquid desiccant system with a water-side free cooling and an electric heater for solution cooling and heating. They used lithium chloride and calcium chloride solutions and found that lithium chloride showed a better dehumidification performance. Alizadeh [7] conducted a theoretical and experimental study on a liquid desiccant air conditioning system assisted by a solar thermal system composed of flat plate solar collectors and an evaporative cooling system. It was found that the suggested system was an effective way of air-conditioning in hot and humid climates. Buker and Riffat [8] studied the adsorption of a polyethylene heat exchanger installed under photovoltaic panels for liquid desiccant regeneration. They concluded that their proposed system could be beneficial in relation to energy and contributive to a sustainable environment.
On the other hand, the heat pump-driven liquid desiccant system (HPLD) has also been studied [9,10,11,12] by focusing on its dehumidification performance, energy consumption, and matching heat pump capacity to the required solution cooling and heating loads. Yamaguchi et al. [9] conducted HPLD performance tests and discussed methods for improving the system efficiency. They concluded that the coefficient of performance (COP) of the HPLD could be increased by enhancing the compressor isentropic efficiency and the solution heat exchanger efficiency. Bergero and Chiari [10] evaluated the system performance of an HPLD with a hygroscopic solution and hydrophobic membrane using a SIMULINK program (The Mathworks, Inc., Natick, MA, USA) by varying a few significant operating parameters. The simulation results showed that compared to a conventional system, their system could achieve savings exceeding 50%, under certain operating conditions. Zhang et al. [11] focused on methods for effectively releasing the leftover heat from the heat pump condenser after regenerating the desiccant solution. They tested two different types of assistant condensers for exhausting the extra heat: air-cooled and water-cooled assistant condensers. They indicated that systems with air-cooled and water-cooled assistant condensers showed 18% and 35% higher COP, respectively, compared to the reference HPLD system with no assistant condensers. Niu et al. [12] investigated methods for matching the heat pump capacity to the desiccant solution heating and cooling loads. They showed that the solution flow rate in the condenser, the revolutions of the compressor, and the air flow rate in the air-cooled assistant condenser should be simultaneously controlled to match the load in the HPLD system.
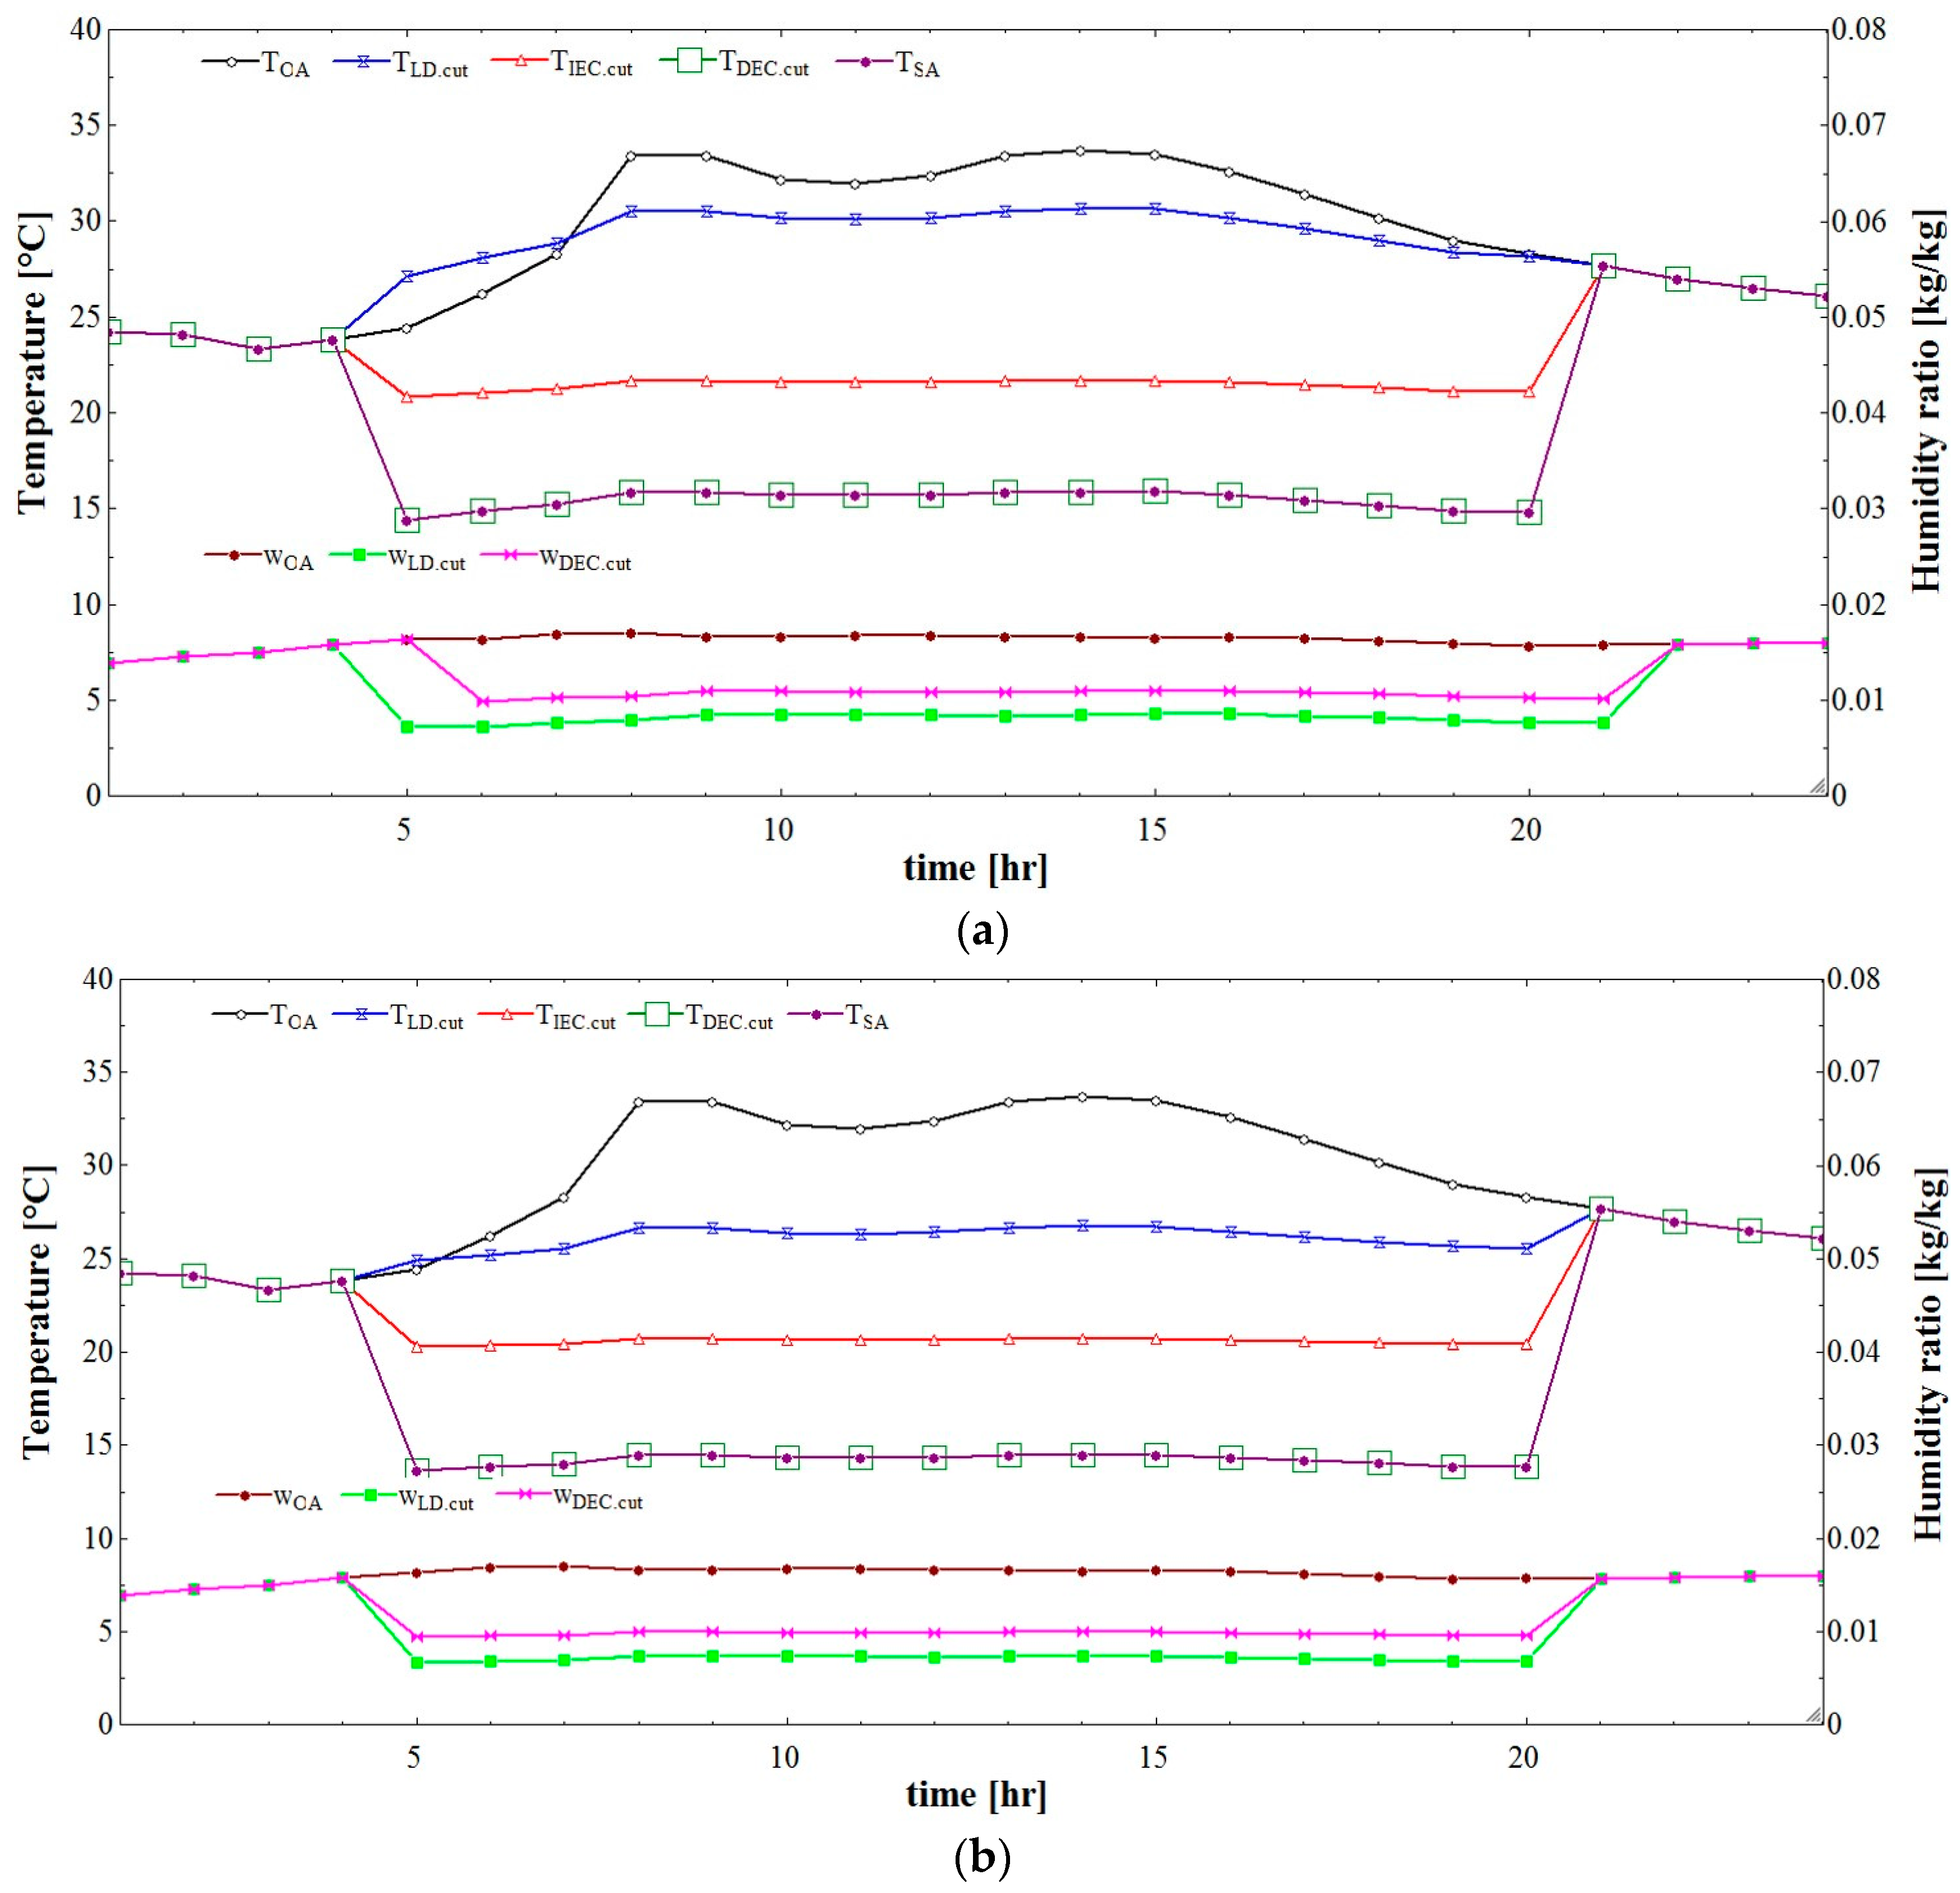
Recently, a liquid desiccant and indirect and direct evaporative cooling-assisted 100% outdoor air system (LD-IDECOAS) has been suggested, and its energy saving potential has also been addressed in the available studies [2,13,14]. In the existing LD-IDECOAS, the strong desiccant solution is cooled by the water-side free cooling of the cooling tower before the absorber, and the weak desiccant solution is heated by the conventional gas-fired boiler or by renewable heat sources. However, an HPLD system has not been considered as an option for the dehumidification section in the existing LD-IDECOAS. Consequently, in this study, the liquid desiccant (LD) part of the existing LD-IDECOAS is replaced by an HPLD (i.e., HPLD-IDECOAS). Subsequently, a quantitative analysis and energy performance comparison of both the established LD-IDECOAS and the proposed HPLD-IDECOAS are conducted via a detailed energy simulation. The HPLD-IDECOAS suggested in this research uses lithium chloride (LiCl) solution as the liquid desiccant, and R-134a is chosen as the refrigerant for the heat pump for cooling and heating of the desiccant solution. The simulations of both systems are conducted by modeling each system using a commercial engineering equation solver (EES) program.

2. Humidification Methods

2.1. System Overview

LD-IDECOAS is an evaporative liquid desiccant based system that uses 100% outdoor air (OA) in compliance with the thermal demands of the rooms being served. The system handles sensible and latent load separately with the selective components required according to the OA conditions. The LD-IDECOAS (Figure 1) consists of an LD unit for dehumidifying the process air, and an indirect evaporative cooler (IEC) and direct evaporative cooler (DEC) for sensible and adiabatic cooling of the process air. To enhance the cooling effect of the IEC, the exhaust air (EA) can be supplied to the secondary channels of the IEC experiencing direct evaporative cooling when its wet bulb temperature (WBT) is lower than that of the outdoor air (OA); otherwise, the OA is used as scavenger air supplied to the secondary channels of the IEC. The heating coil (HC) and sensible heat exchanger (SHE) are located at the exhaust air (EA) side to maintain the neutral deck temperature set point when the dual duct approach is selected as the air distribution system.

2.2. Operation Modes

According to previous research [2], the operating modes of the LD-IDECOAS are determined by considering the thermodynamic OA conditions on the psychrometric chart. The air conditions on the psychrometric chart are separated into four regions, as shown in Figure 2. There are three lines that compart the chart into four regions. Lines 1 and 2 stand for the humidity ratio and the wet bulb temperature lines at the supply air (SA) set point, respectively. Line 3 represents the dry bulb temperature line at the SA set point. Table 1 is the summary of operation modes of each system component under a given operational OA region.
In Region A, the OA is primarily dehumidified with the LD unit, to make the humidity ratio of the air reach Line 1, as shown in Figure 2. The dehumidified air is sensibly and adiabatically cooled by the IEC and DEC in series, to meet the target SA condition (i.e., 15 °C and saturation). In Region B, the OA condition on the psychrometric chart falls between Line 1 and Line 2. Since the air in this region has a lower humidity ratio than Line 1, as shown in Figure 2, the LD unit is deactivated and bypassed, and the air is directly sent to the IEC for sensible cooling, until the air condition meets Line 2. Subsequently, the air is adiabatically cooled by the DEC to meet the target SA condition. In Region C, the OA has lower WBT than that at the SA target condition. In this region, the LD and IEC are turned off and bypassed. Only the DEC is operated to meet the SA DBT (dry bulb temperature) set point (i.e., 15 °C), while the WBT of the SA may be somewhat lower than the target value. In Region D, the DBT and the WBT of the OA are lower than those at the SA target condition; thus, the LD and the DEC are deactivated and bypassed. Only the IEC is activated to work as a SHE to recover sensible heat from the EA stream for preheating the introduced OA. If the sensible heat reclaimed by the IEC is not sufficient enough to meet the cold deck SA temperature (i.e., 15 °C) or the neutral deck temperature (i.e., 20 °C), the auxiliary HC installed at the EA side is activated.

2.3. Conventional Liquid Desiccant Unit

A liquid desiccant unit is composed of an absorber, a regenerator, a sensible heat exchanger, a solution heating coil, and a solution cooling coil. In the absorber, the strong solution dehumidifies the entering process air. This dehumidification process is an exothermic process; thus, the strong solution should be cooled by the solution cooling coil before entering the absorber. The weak desiccant solution leaving the absorber should be delivered to the regenerator after it is heated by the solution heating coil up to the regeneration temperature. Both the dehumidification and regeneration processes are repeated in the LD unit during the operation, and the driving force of moisture transfer to and from the desiccant solution is the vapor pressure difference between the desiccant solution and the air passing through the solution in the absorber or in the regenerator [15]. In general, the weak desiccant solution that enters the regenerator should be heated to 45–80 °C for the regeneration process, whereas the strong solution entering the absorber should be cooled down to 15–30 °C for the dehumidification process [4,5,6,7,16]. To reduce the energy consumed in solution cooling and heating, the solutions that leave the absorber and regenerator are preheated and precooled, respectively, by the sensible heat exchanger. The solutions leaving the sensible heat exchanger are heated and cooled in the heating and cooling coils, respectively, and a gas boiler and a chiller are generally used to treat the required solution heating and cooling loads in the coils. A packed-bed tower type absorber and a regenerator are commonly used [17]. A conventional liquid desiccant system with a gas boiler and a cooling tower to treat the required solution heating and cooling loads in the coil is used in this study as a reference system for comparing the system performance and energy consumption with a heat pump driven liquid desiccant system (Figure 3).

2.4. Heat Pump-Driven Liquid Desiccant Unit

The heat pump is a vapor compression refrigeration system transporting the heat from a lower temperature heat source to a higher temperature heat sink [18,19,20]. The system is composed of an evaporator, a compressor, a condenser, and an expansion valve. In the evaporator, the refrigerant absorbs the heat from the heat source as it changes its phase from liquid to gas, and releases heat in the condenser to the heat sink. An electric power input to the compressor is required to drive this heat pump cycle.
In this research, the cooling coil, heating coil, chiller, and boiler used in the conventional LD unit (Figure 3) were replaced by the heat pump, as shown in Figure 4. In the heat pump-driven liquid desiccant (HPLD) unit, the evaporator cools or extracts heat from the strong solution before the absorber, and the condenser releases heat for heating the weak solution before the regenerator. Once the heat pump is operated in cooling mode, the generated cooling capacity of the heat pump can match up the solution cooling demand by means of an inverter control, while an auxiliary condenser or heater may be required to meet the solution heating demand.

3. Energy Simulation

3.1. Simulation Overview

The operating energy consumption of both the reference system (i.e., LD-IDECOAS) and the proposed system (i.e., HPLD-IDECOAS) serving an identical office space, were estimated via a detailed energy simulation. Both systems were identical, except for the liquid desiccant part of the systems. In the reference system, a cooling tower with a 5 °C approach [21] and a gas boiler were used to treat the solution cooling and heating demands, while the evaporator and the condenser of the heat pump accommodated those demands in the proposed system. In both systems, the design temperature of the desiccant solution entering the absorber and the regenerator was 25 °C and 60 °C, respectively, and the concentration of the strong solution entering the absorber was 38%, just as in previously conducted researches [2,13]. Furthermore, liquid to gas ratio in the absorber and regenerator were assumed to be 1 and 0.5, respectively and the packing dimension value (aZ) was assumed to be 100 [2].
The model space was an office located in Seoul, South Korea with a floor area of 625 m2 (25 m × 25 m) and 32 occupants. Each occupant had a personal computer and was doing light work. Based on the ISO-7730 norm [22], it was assumed that each occupant generated 75 W sensible heat and 75 W latent heat. Each computer added 230 W sensible heat to the space, and the heat generation density of the lighting fixtures was 13 W/m2. Detailed physical parameters of the model building are summarized in Table 2. In this research, the peak and hourly thermal loads of the model space were predicted by using the TRNSYS 17 program (Version 17, Thermal Energy System Specialists, Madison, WI, USA). The hourly weather data for energy calculations [23] of the model space were applied to evaluate the operating energy performances of both systems in annual operation. The set-point condition of the model space was designed to be 26 °C DBT and 55% relative humidity for summer, 20 °C DBT and 55% relative humidity for winter, and 24 °C DBT and 55% relative humidity for the intermediate seasons, according to the american society of heating, refrigerating, and air-conditioning engineers (ASHRAE) standard for comfort zones [24].
In the simulation, the mass flow rate, concentration, and temperature at each state point, from P1 to P6, at the desiccant solution side of the liquid desiccant system (Figure 5) were estimated. Conditions of the process and regeneration air, such as air flow rate, dry bulb temperature, and humidity ratio, before and after the absorber and the regenerator, were estimated to evaluate the energy performance of both the reference and proposed systems.

3.2. Liquid Desiccant Unit Model

3.2.1. Absorber Model

The performance of a liquid desiccant system can be evaluated based on several standards [25], and the effectiveness of the absorber is the most frequently used performance indicator [26]. Several models for predicting the effectiveness of the absorber have been established with experimental data [25,26,27,28,29,30,31,32,33] or theoretical analyses [34,35,36,37]. In this simulation, the linear regression model suggested by Chung and Luo [25] was selected to determine the dehumidification effectiveness of the absorber (Equation (1)). They expressed the dehumidification effectiveness of the absorber as a function of seven operational parameters: mass flow rate of the process air ( G i n ), solution mass flow rate ( L i n ), solution inlet temperature ( T L i n ), air inlet temperature ( D B T G i n ), surface area-to-volume ratio of packing ( a ), packing height ( Z ), and vapor pressure difference of the desiccant solution to the vapor pressure of water ( X ).
ε a b s   = ( 1 0.024   ( G i n L i n ) 0.6 exp ( 1.057   D B T G i n T L i n ) a Z 0.185   X 0.638 ) ( 1 0.192   exp ( 0.615   D B T G i n T L i n ) π 21.498 )
In addition to numerous established models, the effectiveness of dehumidification is generally defined as the ratio of the changes in temperature or in humidity ratio of the process air in the absorber, as shown in Equations (2) and (3). Once the dehumidification effectiveness of the absorber is predicted by the Chung and Luo’s model (Equation (1)), the temperature and humidity ratio of the process air that leaves the absorber can be obtained from Equations (2) and (3) with the assumption that the ε a b s , ε a b s ,   w , and ε a b s ,   T are identical [4]. The equilibrium humidity ratio ( w a b s , e q ) of the desiccant solution in the absorber can be determined by Equation (4) [37]. The vapor pressure at the saturation condition of the desiccant solution in the absorber is determined by Equation (5), suggested by Fumo and Goswami [26], with the model coefficients shown in Table 3. In this research, it was assumed that the equilibrium temperature of the desiccant solution in the absorber was identical to the temperature of the strong solution that enters the absorber (i.e., 25 °C) [28].
ε a b s ,   w   =   w a i r , a b s , i n w a i r , a b s , o u t w a i r , a b s , i n w a b s , e q
ε a b s ,   T   =   T a i r , a b s , i n T a i r , a b s , o u t T a i r , a b s , i n T a b s , e q
w e q   =   0.622   p s 101.325 p s
p s   = ( a 0 + a 1 · T L + a 2 · T L   2 ) + ( b 0 + b 1 · T L + b 2 · T L   2 ) · C L   2 +   ( c 0 + c 1 · T L + c 2 · T L   2 ) · T L 2
The mass flow rate of the desiccant solution at each state point of the absorber side shown in Figure 5, can be determined by considering the mass balance expressed by Equations (6)–(8). The solution mass flow rates at the state points P1 and P2 are identical (Equation (6)). The amount of dehumidified moisture from the process air ( m ˙ a b s , m o i ) is determined by Equation (7), and thus, the solution mass flow rate at the state point P3 can be expressed by Equation (8). Based on the mass balance, the concentration of the desiccant solution at each state point of the absorber side can also be expressed by Equations (9) and (10).
By considering the energy balance at the absorber side, it is possible to estimate the enthalpy of the desiccant solution at the state point P3 by using Equation (11), under the assumption that the heat generated from the exothermic process of dehumidification is transferred to the desiccant solution leaving the absorber [13].
Mass balance:
m ˙ p 1 , s o l = m ˙ p 2 , s o l
m ˙ a b s , m o i   =   m ˙ a i r , a b s , i n ( w a i r , a b s , i n w a i r , a b s , o u t )
m ˙ p 3 , s o l =   m ˙ p 2 , s o l +   m ˙ a b s , m o i
Solution concentration:
C p 1 , s o l = C p 2 , s o l
C p 3 , s o l = m ˙ p 2 , s o l · C p 2 , s o l / m ˙ p 3 , s o l
Energy balance:
m ˙ p 3 , s o l · h p 3 , s o l =   m ˙ p 2 , s o l · h p 2 , s o l +   m ˙ a b s , m o i · h f g a b s , m o i

3.2.2. Regenerator Model

The effectiveness of regeneration is defined as the ratio of the changes in temperature or humidity ratio of the regeneration air in the regenerator, as expressed by Equations (12) and (13). The amount of moisture added to the regeneration air ( m ˙ a b s , m o i ) is expressed by Equation (14); thus, the humidity ratio variation of the regeneration air in the regenerator can be determined under the assumption that the regeneration rate in the regenerator is identical to the dehumidification rate in the absorber (Equation (15)).
Once the humidity ratio of the regeneration air leaving the regenerator ( w a i r , r e g , o u t ) is determined by Equation (14), it is possible to obtain ε r e g ,   w by using Equation (12). In general, ε r e g ,   w and ε r e g ,   T are identical [4], thus the temperature of the regeneration air leaving the regenerator ( T a i r , r e g , o u t ) can be predicted from Equation (13).
The equilibrium humidity ratio of the solution ( w r e g , e ) in Equation (12) is determined by Equations (4) and (5), while the equilibrium temperature of the solution ( T r e g , e ) in Equation (13) is the temperature of the desiccant solution that enters the regenerator [28].
ε r e g ,   w   =   w a i r , r e g , o u t w a i r , r e g , i n w r e g , e w a i r , r e g , i n
ε r e g ,   T   =   T a i r , r e g , o u t T a i r , r e g , i n T r e g , e T a i r , r e g , i n
m ˙ r e g , m o i =   m ˙ a i r , r e g , i n · ( w a i r , r e g , o u t w a i r , r e g , i n )
m ˙ a b s , m o i =   m ˙ r e g , m o i
In terms of the mass balance at the regenerator side, the mass flow rates of the desiccant solution at the state points P4 and P5 (shown in Figure 5) are identical to the solution mass flow rate at P3 (Equation (16)). The mass flow rate of the solution at P6 after regeneration can be expressed by Equation (17).
The concentration of the weak solution at the state points P4 and P5 is identical to the concentration at P3 (Equation (18)), while the concentration of the strong solution at P6 after regeneration is increased, and can be expressed by Equation (19).
By considering the energy balance at the regenerator side, the enthalpy of the desiccant solution at the state point P6 can be estimated by Equation (20), under the assumption that the heat required for the endothermic process of regeneration is transferred from the desiccant solution [13].
Mass balance:
m ˙ p 4 , s o l   =   m ˙ p 5 , s o l =   m ˙ p 3 , s o l
m ˙ p 6 , s o l =   m ˙ p 5 , s o l   m ˙ r e g , m o i
Solution concentration:
C p 3 , s o l = C p 4 , s o l = C p 5 , s o l
C p 6 , s o l = m ˙ p 5 , s o l · C p 5 , s o l / m ˙ p 6 , s o l
Energy balance:
m ˙ p 6 , s o l · h p 6 , s o l =   m ˙ p 5 , s o l · h p 5 , s o l   m ˙ r e g , m o i · h f g r e g , m o i

3.2.3. Solution Cooling and Heating Loads

As shown in Figure 5, the solutions leaving the absorber and the regenerator initially exchange the sensible heat before entering the heating coil and the cooling coil, respectively. If the heat exchanger effectiveness is known, the amount of sensible heat exchanged between the solutions in the heat exchanger can be obtained from Equation (21). Consequently, the solution temperatures at the heat exchanger outlets (i.e., T p 1 , s o l and T p 4 , s o l ) can be determined by Equations (22) and (23). In this simulation the effectiveness of the sensible heat exchanger ( ε S H E ) was assumed as 80%.
On the other hand, if the set-point temperatures of the solutions at the absorber inlet (i.e., T p 2 , s o l ) and regenerator inlet (i.e., T p 5 , s o l ) are given, the cooling coil and the heating coil demands can be estimated by using Equations (24) and (25). In this research, the absorber inlet solution set-point ( T p 2 , s o l ) was 25 °C, and the regenerator inlet solution set-point ( T p 6 , s o l ) was 60 °C.
Sensible heat exchanger:
Q S H E =   ε S H E   · ( m ˙ p 6 , s o l · C p p 6 , s o l ) · ( T p 6 , s o l T p 3 , s o l )
T p 1 , s o l = T p 6 , s o l Q S H E m ˙ p 6 , s o l · C p p 6 , s o l
T p 4 , s o l = T p 3 , s o l + Q S H E m ˙ p 3 , s o l · C p p 3 , s o l
Solution cooling and heating loads:
Q c o o l i n g =   m ˙ p 1 , s o l · C p p 1 , s o l · ( T p 1 , s o l T p 2 , s o l )
Q h e a t i n g =   m ˙ p 4 , s o l · C p p 4 , s o l · ( T p 5 , s o l T p 4 , s o l )

3.3. Heat Pump Model

• Model Validation
The heat pump without the inverter control can be simulated by using a curve-fit model developed by Jin [38] and implemented in Energy Plus [39]. While this model is for a water–water heat pump, it was considered as a solution–solution heat pump model in this research because the impact of the heat capacity of the desiccant solution, which is different from that of the water on the heat exchange effectiveness at the evaporator and condenser, was not significant as one may observe in Figure 6.
In the research conducted so far, there is no available model for predicting the performance of a water–water heat pump. The most similar model is Jin’s water–water curve fit model. After examining the model with theoretical analysis, we concluded that the model can be used as a solution–solution heat pump; mechanical relations of fundamental thermodynamic laws and heat transfer correlations are employed in the modeling procedure. To analyze the possibility of the model usage as a solution based heat pump, the heat exchange effectiveness in the evaporator and condenser was examined. Using the theoretical equations depicting the effectiveness of the evaporator and condenser, two cases of evaporator effectiveness when using water and solution have been compared by adjusting number of transfer units (NTU) value from 0.1 to 5, and the typical NTU values used in the study (0.13 to 2.05) are within the range. Results are shown in Figure 6 and it was found that there was not much difference between the two. Similar results were also found at the condenser side.
• Heat Pump Model
As for the heat pump in cooling mode, this model returns the load-side (i.e., evaporator) and the source-side (i.e., condenser) capacities of the heat pump (Equations (26) and (28)) and the power input for the compressor (Equation (27)), as a function of four operating parameters of a heat pump: the volumetric flow rate ( V ˙ s o u r c e ) and inlet temperature ( T s o u r c e , i n ) of the source-side fluid, and the volumetric flow rate ( V ˙ l o a d ) and inlet temperature ( T l o a d , i n ) of the load-side fluid. The load-side capacity ( Q l o a d , c ) in Equation (26) is the cooling capacity of the heat pump at the evaporator, and the source-side capacity ( Q s o u r c e , c ) in Equation (28) is the heating capacity of the heat pump at the condenser. The power input ( P o w e r c ) is the power required in the heat pump operation. All the reference values and the model coefficients used in Equations (26) and (27) are presented in Table 4 [38].
Q l o a d , c Q l o a d , c , r e f = A 1 + A 2 · [ T l o a d , i n T r e f ] + A 3 · [ T s o u r c e , i n T r e f ] + A 4 · [ V ˙ l o a d V ˙ l o a d , r e f ] + A 5 · [ V ˙ s o u r c e V ˙ s o u r c e , r e f ]
P o w e r c P o w e r c , r e f = B 1 + B 2 · [ T l o a d , i n T r e f ] + B 3 · [ T s o u r c e , i n T r e f ] + B 4 · [ V ˙ l o a d V ˙ l o a d , r e f ] + B 5 · [ V ˙ s o u r c e V ˙ s o u r c e , r e f ]
Q s o u r c e , c = Q l o a d , c + P o w e r c
However, if the variable speed compressor control (i.e., inverter control) is adopted to modulate the heat pump capacity to match the solution cooling demand, the power and heating capacity of the heat pump should be adjusted. Based on the research by Madani et al. [40], Equations (30) and (31) return the compressor frequency ( F r e q P L R c ) and power ( P o w e r P L R c ) as a function of the part-load ratio ( P L R c ), determined by Equation (29). The valid frequency control range of the compressor was from 20 Hz to80 Hz, which is the common range used in the inverter control of heat pumps. Consequently, the heating capacity of the heat pump with inverter control can be expressed as Equation (32). When this adjusted heating capacity ( Q s o u r c e , P L R c ) of the heat pump cannot meet the solution heating load ( Q h e a t i n g ) in Equation (25), an auxiliary heating is required.
P L R c   = Q c o o l i n g Q l o a d , c
F r e q P L R c   =   1.28329127 · e 2 + 4.55418482 · e 1 · P L R c +   5.40172160 · e 1 · P L R C 2
P o w e r P L R c   =   4.74753792 · F r e q P L R c · e 2 + 6.20369156 · F r e q P L R c · P L R c · e 1 +   3.35400111 · e 1 · F r e q P L R c 2
Q s o u r c e , P L R c = Q c o o l i n g + P o w e r P L R c
Both the reference and proposed systems consist of identical components, except for the liquid desiccant part. Consequently, the simulation models for other components, such as the IEC, DEC, and SHE, refer to previous research [13] under the assumption that the effectiveness values of the IEC ( ε I E C ), DEC ( ε D E C ), and SHE ( ε S H E ) are 0.75, 0.95, and 0.80, respectively. Because of space limitations, further detailed description of other component models were omitted and readers are referred to the previous research [13].

4. Simulation Results

4.1. Comparison of Supply Air Condition

• Design day performance
Figure 7a,b show the supply air condition variation in both LD-IDECOAS and HPLD-IDECOAS on a peak summer day (i.e., 31 July), respectively, when both systems should operate under typical summer operation mode (i.e., Region A mode). In both systems, the introduced outdoor air was initially dehumidified by the LD unit. It can be seen in Figure 7 that the HPLD-IDECOAS provided more dehumidification through the LD unit than the conventional LD-IDECOAS. Lower desiccant solution temperature entering the absorber in the HPLD-IDECOAS enhanced dehumidification when compared with the conventional system. As shown in Figure 8, the temperature of the strong desiccant solution cooled by the water-side free cooling in the conventional LD-IDECOAS was 3–6 °C higher than that cooled by the heat pump in the HPLD-IDECOAS. This is due to the nature of the cooling tower, whose cooling performance is dependent on the wet-bulb temperature of the air passing through the tower. The liquid desiccant dehumidification is an exothermic process, and the dehumidification performance is enhanced at lower desiccant solution temperature [27].
Furthermore, the desiccant solution at lower temperature also provides an advantage in terms of the process air temperature leaving the LD. As can be seen in Figure 7, the temperature of the dehumidified air leaving the LD in the HPLD-IDECOAS was 3–4 °C lower than that in the conventional LD-IDECOAS.
The process air dehumidified and cooled to a greater degree through the HPLD also allowed the evaporative coolers (i.e., the IEC and DEC) to generate lower SA temperature than that of the conventional LD-DIECOAS. It can be seen in Figure 7 that the SA temperature acquired in the HPLD-IDECOAS after the DEC, was around 13 °C, which was 2–3 °C lower than that in the conventional LD-IDECOAS.
Along with the thermal behavior comparison depicted above, the air condition changes in the systems at the peak hour on the peak day has been summarized in Table 5.Here, the thermal conditions of the air leaving each component in the systems are shown with the temperature and humidity ratio. The results in Table 5, reconfirm that the suggested system provides better cooling performance compared with the conventional system. Lower temperature and humidity ratio of the process air after passing the LD unit can be observed with approximately 4 °C and 0.001 kg/kg difference. Also, the cooler and drier air leaving the LD unit is cooled down to greater degree in the IEC and DEC with a temperature difference of approximately 3 °C and 2.5 °C, respectively.
• Cooling season performance
Figure 9 and Figure 10 show the hourly supply air temperature and humidity ratio variations in both systems during summer operation (i.e., from June to August). The dotted lines in the figures indicate the recommended temperature and humidity ratio of the supply air, which are 15 °C and 100% relative humidity. As can be seen in both Figure 9 and Figure 10, the HPLD-IDECOAS always maintains both the supply air temperature and humidity ratio lower than the recommended level. On the contrary, the reference system (i.e., the LD-IDECOAS) showed that the supply air temperature and humidity ratio exceeded the recommended conditions in a certain period of time (i.e., from 4750 h to 5500 h) when the outdoor air was too hot and humid. The reason for this observation is as follows. In the HPLD-IDECOAS, the desiccant solution temperature entering the absorber is maintained at 25 °C by the heat pump, and thus, the dehumidification performance of the absorber is not affected by the outdoor air condition. Consequently, the desirable supply air condition can be maintained even under hot and humid outdoor air conditions. However, in the LD-IDECOAS, the desiccant solution temperature entering the absorber should be passively controlled by the water-side free cooling with the cooling tower, whose cooling capacity is highly affected by the wet-bulb temperature of the outdoor air. When the outdoor air is hot and humid, the wet-bulb temperature is too high and the desiccant solution entering the absorber cannot be sufficiently cooled to provide adequate dehumidification of the supply air. This results in undesirable supply air temperature and humidity ratio, which exceed the design levels, as shown in Figure 9.

4.2. Energy Consumption Comparison

• Summer operation
Figure 11 shows the comparisons of operating energy consumption in both systems during the summer (i.e., from June to August) and intermediate seasons. The operating energy consumed in each system was converted to primary energy by using local conversion factors of 2.75 and 1.1 for electricity and natural gas, respectively [41].
During summer operation (Figure 11a), it can be seen that the HPLD-IDECOAS used 24% more electricity over the conventional LD-IDECOAS, owing to the heat pump operation. However, this penalty in electricity consumption of the HPLD-IDECOAS was offset by significant gas energy savings caused by the heat pump reclaiming sensible heat from the desiccant solution at the absorber side and providing it at the regenerator side of the system. In the HPLD, the auxiliary gas boiler was activated when the condenser of the heat pump could not meet the required solution heating demand for regeneration, while, in the conventional LD, the solution heating should be done by the gas boiler only. Consequently, the HPLD-IDECOAS showed 38% less primary energy consumption during the summer compared with the LD-IDECOAS.
However, during winter operation, there was no difference in operating energy consumption because both systems operated identically, without activating the liquid desiccant section.
• Intermediate season operation
Figure 11b shows the operating energy consumption of both systems during the intermediate season. Because there was demand for liquid desiccant dehumidification even during the intermediate season, it can be seen that the HPLD-IDECOAS saved 50% of the gas consumption for regeneration of the desiccant solution, compared with the LD-IDECOAS. The proposed system consumed more electrical energy than the conventional system because of the heat pump operation, but this penalty was offset by the reduction in gas consumption. Consequently, the HPLD-IDECOAS showed 29% primary energy saving over the conventional LD-IDECOAS during the intermediate season.
• Annual operating energy consumption
Figure 12 shows the comparison of annual primary energy consumption between the conventional LD-IDECOAS and the HPLD-IDECOAS. As can be seen, the proposed system provided a 33% reduction in total primary energy consumption compared with the LD-IDECOAS. This energy benefit of the proposed system mainly came from the regeneration energy saving caused by the heat pump reclaiming sensible heat from the desiccant solution at the absorber side. About 83% of the gas consumption for regeneration was replaced by the heat pump in the proposed system.

5. Conclusions

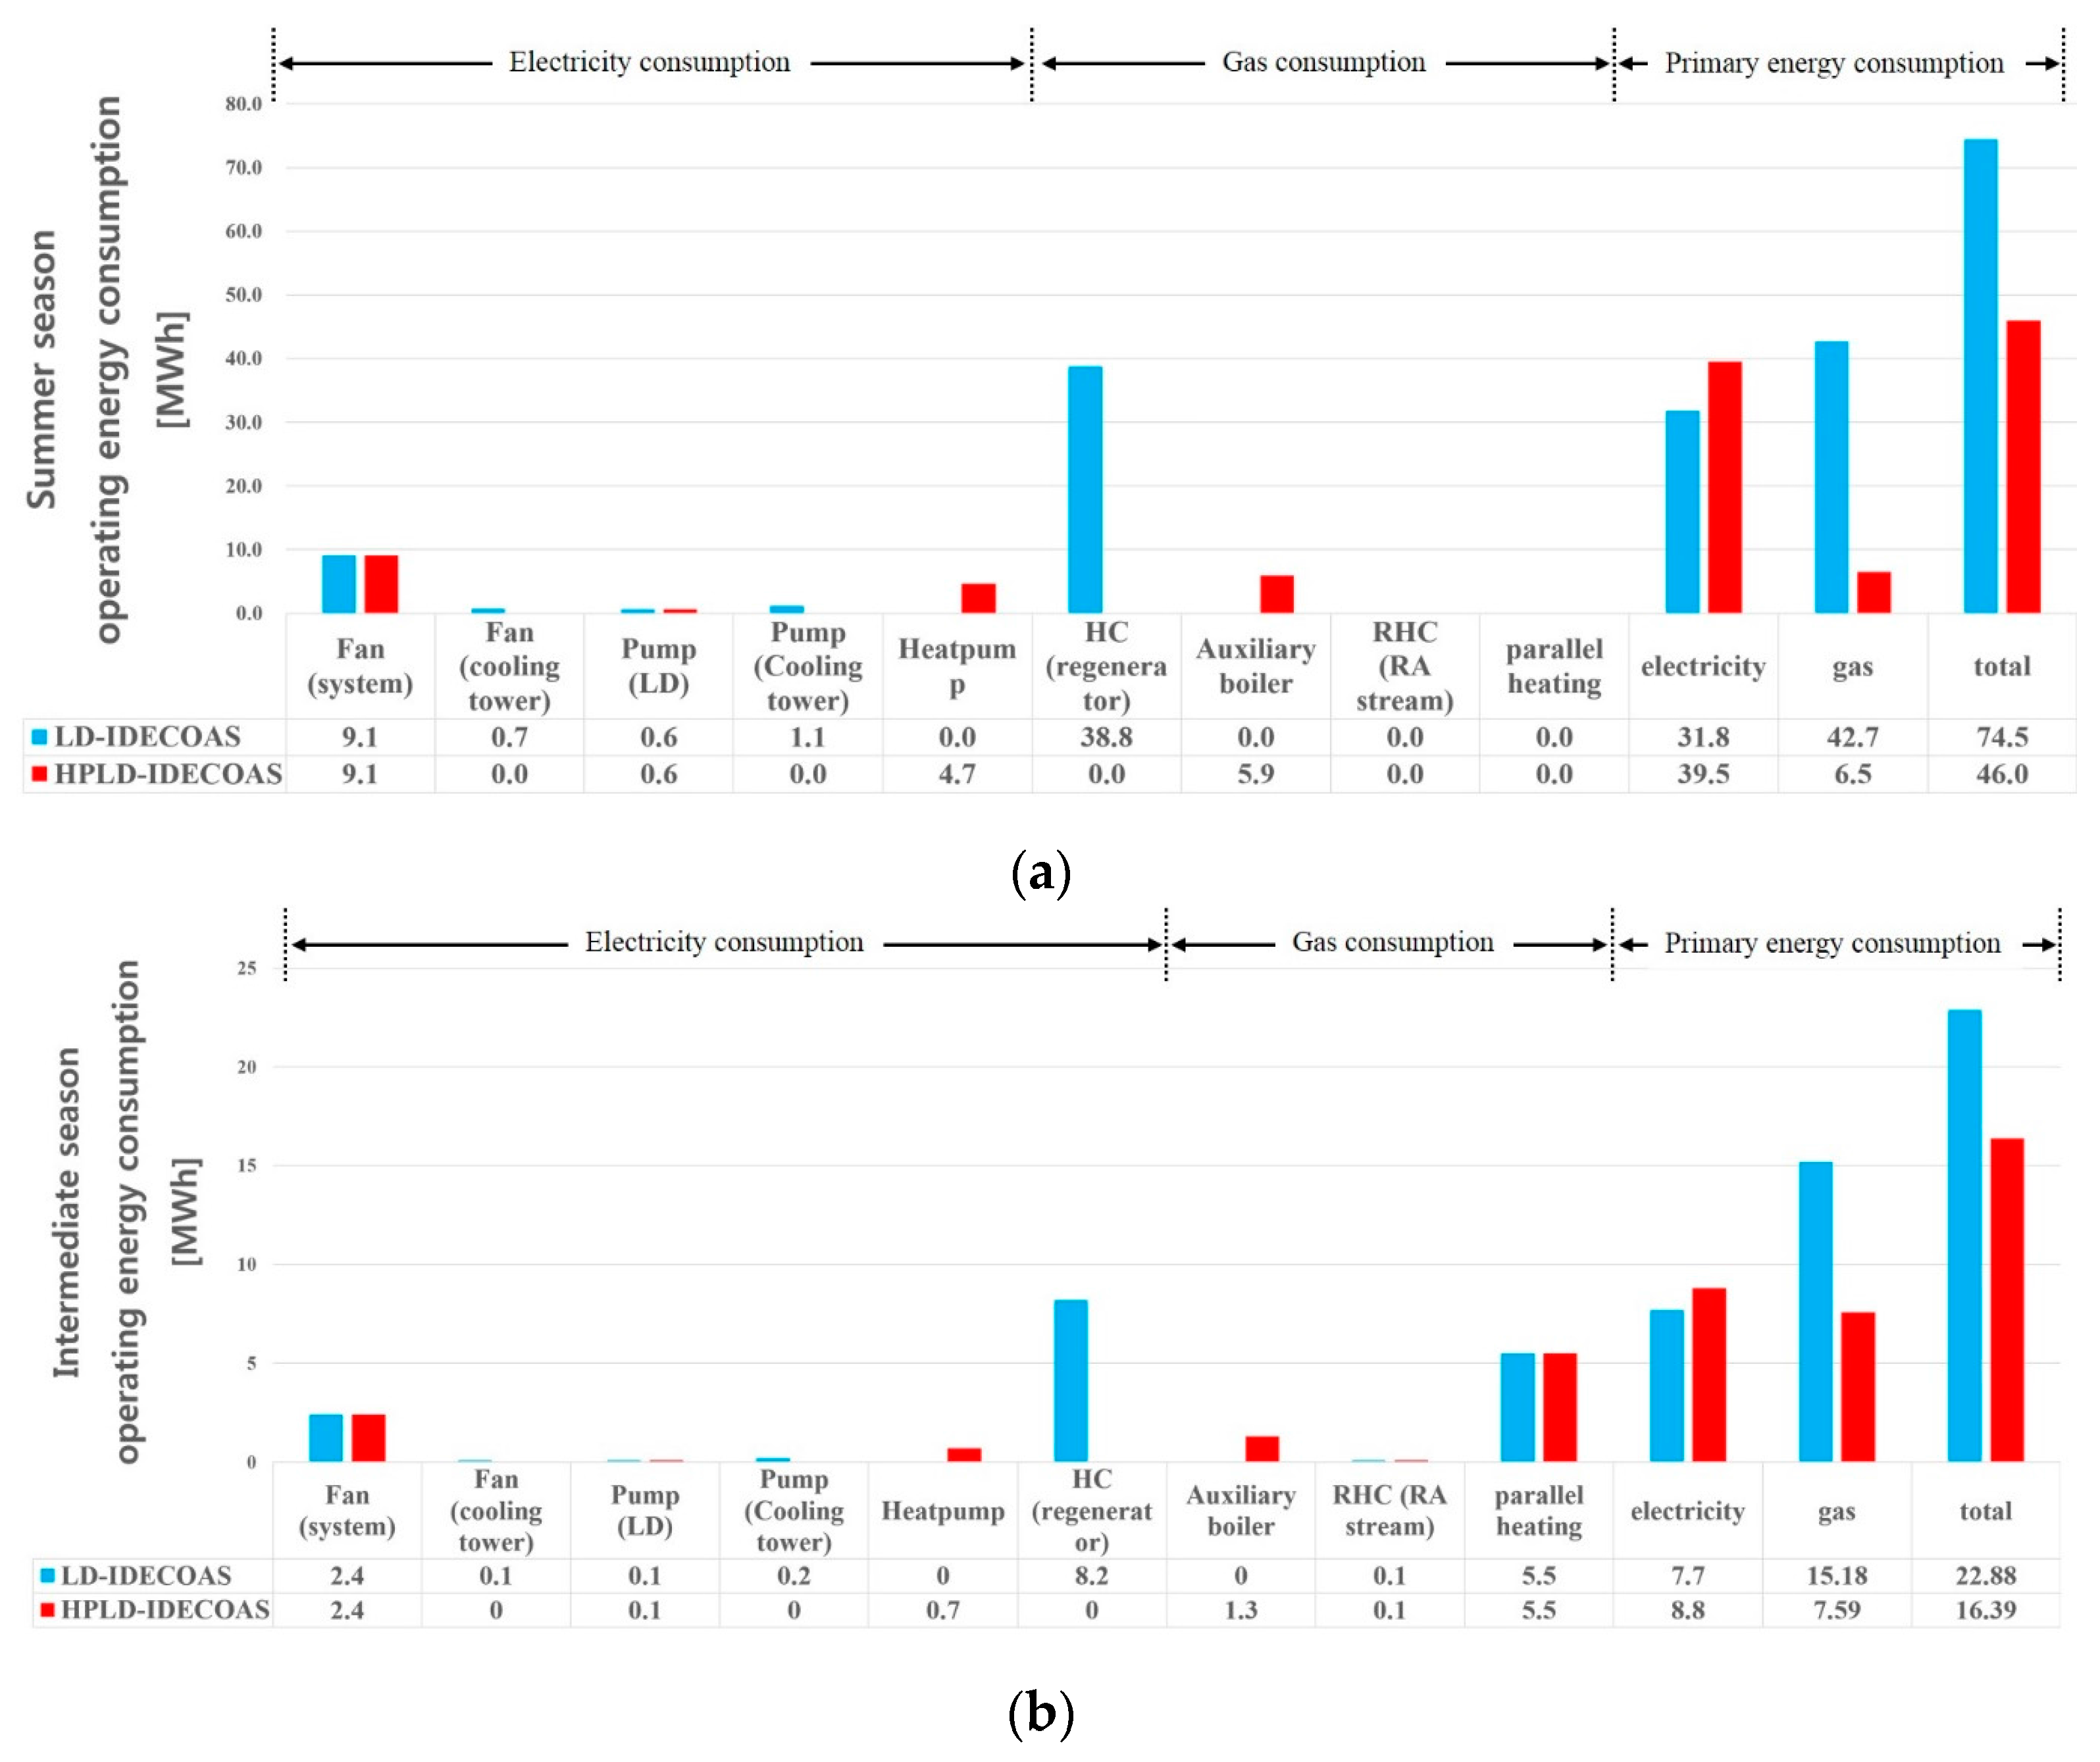
In this research, it was found that the HPLD-IDECOAS was able to provide a 33% reduction in annual primary energy consumption, compared with the LD-IDECOAS previously recommended in the literature. The significant energy saving potential expected in the proposed system is mainly obtained through the reduction in the gas consumption (i.e., 83%) required for regeneration of the weak desiccant solution, which is accomplished by means of the heat pump in the liquid desiccant section of the system. In fact, the LD-IDECOAS was intended to realize a non-vapor compression based air handling system. However, for successful deployment of the system in the relevant markets, the energy consumption for regeneration of the desiccant solution should be reduced as much as possible. As shown in this research, a heat pump applied in the liquid desiccant system is an adequate solution for the relatively high regeneration energy consumption observed in the LD-IDECOAS. By reclaiming sensible heat from the desiccant solution at the absorber side, and providing the recovered heat to the regenerator side using the heat pump, the HPLD-IDECOAS could enhance energy saving potential, and would be a successful renovation of the LD-IDECOAS.

Acknowledgments

This work was supported by the Korea Agency for Infrastructure Technology Advancement (KAIA) (grant 17CTAP-C116268-02), and the Korea Institute of Energy Technology Evaluation and Planning (KETEP) (No. 20164010200860).

Author Contributions

Jang-Hoon Shin, Joon-Young Park, Min-Suk Jo, and Jae-Weon Jeong performed the simulation and data analysis, and wrote this paper based on the obtained results.

Conflicts of Interest

The authors declare no conflict of interest.

Nomenclature

T temperature (°C)
w humidity ratio (kg/kg)
Q thermal load (W)
m ˙ mass flow rate (kg/s)
V ˙ volumetric flow rate (m3/s)
p vapor pressure (kPa)
P pressure drop (kPa)
C concentration
h enthalpy (kJ/kg)
h f g heat of vaporization of water (=2257 kJ/kg)
a0a2
b0b2
c0c2
coefficients of vapor pressure equation
A1A5
B1B5
coefficients of water to water heat pump model for cooling mode

Greek Symbols

Δ difference
ε efficiency
ρ density (kg/m3)

Subscripts

p 1 p 6 designated points in liquid desiccant unit
e equilibrium
m o i moisture
a b s absorber
r e g regenerator
s o l desiccant solution
i n inlet
o u t outlet
l o a d load side
s o u r c e source side
c cooling mode
r e f reference

Abbreviations

ASHRAEamerican society of heating, refrigerating, and air-conditioning engineers
COPcoefficient of performance
DBTdry bulb temperature
WBTwet bulb temperature
HPheat pump
HPLDheat pump driven liquid desiccant
LDliquid desiccant
LiCllithium chloride
LD-IDECOASliquid desiccant and evaporative cooling-assisted 100% outdoor air system
HPLD-IDECOASheat pump driven liquid desiccant and evaporative cooling-assisted 100% outdoor air system
NTUnumber of transfer units
SHEsensible heat exchanger
PLRpart load ratio
Freqfrequency
OAoutdoor air
SAsupply air
RAreturn air
DECdirect evaporative cooler
IECindirect evaporative cooler
HCheating coil

References

  1. Goetzler, C.J.W.; Zogg, R.; Young, J. Energy Savings Potential and RD & D Opportunities for Non-Vapor-Compression HVAC Technologies; Navigant Consulting, Inc.: Burlington, VA, USA, 2014. [Google Scholar]
  2. Kim, M.; Park, J.; Sung, M.; Choi, A.; Jeong, J. Annual operating energy savings of liquid desiccant and evaporative-cooling-assisted 100% outdoor air system. Energy Build. 2014, 76, 538–550. [Google Scholar] [CrossRef]
  3. Sahlot, M.; Riffat, S.B. Desiccant cooling systems : A review. Int. J. Low-Carbon Technol. 2016, 1–17. [Google Scholar] [CrossRef]
  4. Katejanekarn, T.; Chirarattananon, S.; Kumar, S. An experimental study of a solar-regenerated liquid desiccant ventilation pre-conditioning system. Sol. Energy 2009, 83, 920–933. [Google Scholar] [CrossRef]
  5. Gommed, K.; Grossman, G. Experimental investigation of a liquid desiccant system for solar cooling and dehumidification. Sol. Energy 2007, 81, 131–138. [Google Scholar] [CrossRef]
  6. Jain, S.; Tripathi, S.; Das, R.S. Experimental performance of a liquid desiccant dehumidification system under tropical climates. Energy Convers. Manag. 2011, 52, 2461–2466. [Google Scholar] [CrossRef]
  7. Alizadeh, S. Performance of a solar liquid desiccant air conditioner—An experimental and theoretical approach. Sol. Energy 2008, 82, 563–572. [Google Scholar] [CrossRef]
  8. Sami, M.; Riffat, S.B. Performance analysis of a combined Building Integrated PV / T Collector with a liquid desiccant enhanced dew point cooler. Energy Procedia 2016, 91, 717–727. [Google Scholar] [CrossRef]
  9. Yamaguchi, S.; Jeong, J.; Saito, K.; Miyauchi, H.; Harada, M. Hybrid liquid desiccant air-conditioning system: Experiments and simulations. Appl. Therm. Eng. 2011, 31, 3741–3747. [Google Scholar] [CrossRef]
  10. Bergero, S.; Chiari, A. Performance analysis of a liquid desiccant and membrane contactor hybrid air-conditioning system. Energy Build. 2010, 42, 1976–1986. [Google Scholar] [CrossRef]
  11. Zhang, T.; Liu, X.; Jiang, Y. Performance optimization of heat pump driven liquid desiccant dehumidification systems. Energy Build. 2012, 52, 132–144. [Google Scholar] [CrossRef]
  12. Niu, X.; Xiao, F.; Ma, Z. Investigation on capacity matching in liquid desiccant and heat pump hybrid air-conditioning systems. Int. J. Refrig. 2012, 35, 160–170. [Google Scholar] [CrossRef]
  13. Kim, M.H.; Park, J.S.; Jeong, J.W. Energy saving potential of liquid desiccant in evaporative-cooling-assisted 100% outdoor air system. Energy 2013, 59, 726–736. [Google Scholar] [CrossRef]
  14. Park, J.; Jeong, J. Operating Energy Savings of a Liquid Desiccant and Evaporative Cooling-Assisted Air-Handling System in Marine Applications. Energies 2017, 10, 487. [Google Scholar] [CrossRef]
  15. Ahmed, A.M.; Abdalla, K.N. Experimental study of heat and mass transfer of Solar Powered liquid desiccant regeneration system. In Proceedings of the Annual Conference of Postgraduate Studies and Scientific Research (Basic and Engineering Studies Board), Khartoum, Sudan, 17–20 February 2012; Volume 1, pp. 299–304. [Google Scholar]
  16. Grossman, G. A Liquid Desiccant System Dehumidification. J. Sol. Energy Eng. 2004, 126, 879–885. [Google Scholar] [CrossRef]
  17. Kumar, R. Studies on Stand Alone Liquid Desiccant Based Air-conditioning Systems; Indian Institute of Technology: Delhi, India, 2008. [Google Scholar]
  18. Bhatia, I.A. Fundamentals of Mechanical Refrigeration Systems; PDH Center: Fairfax, VA, USA, 2012. [Google Scholar]
  19. Business & Government Energy Management Division. Refrigeration and Heat Pumps; Energy Management Series 11; Energy, Mines, and Resources Canada: Devon, AB, Canada, 1985.
  20. Self, S.; Rosen, M.; Reddy, B. Energy Analysis and Comparison of Advanced Vapour Compression Heat Pump Arrangements. In Proceedings of the eSim 2012: The Canadian Conference on Building Simulation, Halifax, NS, Canada, 1–4 May 2012; pp. 463–477. [Google Scholar]
  21. ASHRAE. Handbook—HVAC Systems and Equipment; ASHRAE: New York, NY, USA, 2016; Chapter 39. [Google Scholar]
  22. Ergonomics of the Thermal Environment—Analytical Determination and Interpretation of Thermal Comfort Using Calculation of the PMV and PPD Indices and Local Thermal Comfort Criteria; International Standard; ISO: Geneva, Switzerland, 2005.
  23. ASHRAE. International Weather for Energy Calculations, version 2; ASHRAE: New York, NY, USA, 2011. [Google Scholar]
  24. Schoen, L.J.; Alspach, P.F.; Arens, E.A.; Aynsley, R.M.; Bean, R.; Eddy, J.; Int-hout, D.; Khalil, E.E.; Simmonds, P.; Stoops, J.L.; et al. Thermal Environmental Conditions for Human Occupancy; ASHRAE: New York, NY, USA, 2013. [Google Scholar]
  25. Chung, T.; Luo, C. Vapor Pressures of the Aqueous Desiccants. J. Chem. Eng. 1999, 44, 1024–1027. [Google Scholar] [CrossRef]
  26. Fumo, N.; Goswami, D.Y. Study of an aqueous lithium chloride desiccant system: Air dehumidification and desiccant regeneration. Sol. Energy 2002, 72, 351–361. [Google Scholar] [CrossRef]
  27. Chung, T.; Wu, H. Dehumidification of Air by Aqueous Triethylene Glycol Solution in a Spray Tower Dehumidification of Air by Aqueous Triethylene. Sep. Sci. Technol. 2017, 6395. [Google Scholar] [CrossRef]
  28. Chung, T.; Wu, H. Comparison between Spray Towers with and without Fin Coils for Air Dehumidification Using Triethylene Glycol Solutions and Development of the Mass-Transfer Correlations. Ind. Eng. Chem. Res. 2000, 39, 2076–2084. [Google Scholar] [CrossRef]
  29. Lai, M.; Chang, Y.; Wang, C.; Wu, H. Analysis of the Absorption-Dehumidification Process Variables Using the Experimental Design Methodology. Sep. Sci. Technol. 2007. [Google Scholar] [CrossRef]
  30. Zurigat, Y.H. Air dehumidification by triethylene glycol desiccant in a packed column. Energy Convers. Manag. 2004, 45, 141–155. [Google Scholar] [CrossRef]
  31. Longo, G.A.; Gasparella, A. Experimental and theoretical analysis of heat and mass transfer in a packed column dehumidifier/regenerator with liquid desiccant. Int. J. Heat Mass Transf. 2005, 48, 5240–5254. [Google Scholar] [CrossRef]
  32. Liu, X.H.; Yi, X.Q.; Jiang, Y. Mass transfer performance comparison of two commonly used liquid desiccants : LiBr and LiCl aqueous solutions. Energy Convers. Manag. 2015. [Google Scholar] [CrossRef]
  33. Hines, A.L. Comparison between Random and Structured Packings for Dehumidification of Air by Lithium Chloride Solutions in a Packed Column and Their Heat and Mass Transfer Correlations. Ind. Eng. Chem. Res. 1996, 35, 192–198. [Google Scholar]
  34. Chen, X.Y.; Li, Z.; Jiang, Y.; Qu, K.Y. Analytical solution of adiabatic heat and mass transfer process in packed-type liquid desiccant equipment and its application. Sol. Energy 2006, 80, 1509–1516. [Google Scholar] [CrossRef]
  35. Babakhani, D.; Soleymani, M. An analytical solution for air dehumidi fi cation by liquid desiccant in a packed column. Int. Commun. Heat Mass Transf. 2009, 36, 969–977. [Google Scholar] [CrossRef]
  36. Xiao, F.; Ge, G.; Niu, X. Control performance of a dedicated outdoor air system adopting liquid desiccant dehumidification. Appl. Energy 2011, 88, 143–149. [Google Scholar] [CrossRef]
  37. Seenivasan, D.; Selladurai, V.; Senthil, P. Optimization of Liquid Desiccant Dehumidifier Performance Using Taguchi Method. Adv. Mech. Eng. 2014. [Google Scholar] [CrossRef]
  38. Jin, H. Parameter Estimation Based Models of Water Source Heat Pumps. Ph.D. Thesis, Oklahoma State University, Stillwater, OK, USA, 2002. [Google Scholar]
  39. Tang, C.C. Modeling Packaged Heat Pumps in a Quasi-steady State Energy Simulation Program. Master’s Thesis, Oklahoma State University, Stillwater, OK, USA, 2005. [Google Scholar]
  40. Madani, H.; Claesson, J. Experimental Analysis of a Variable Capacity Heat Pump System Focusing on the Compressor and Inverter Loss Behavior. In Proceedings of the International Refrigeration and Air Conditioning Conference, West Lafayette, IN, USA, 12–15 July 2010. [Google Scholar]
  41. Park, D.J.; Yu, K.H.; Yoon, Y.S.; Kim, K.H.; Kim, S.S. Analysis of a building energy efficiency certification system in Korea. Sustainability 2015, 7, 16086–16107. [Google Scholar] [CrossRef]
Figure 1. Schematic diagram of an existing liquid desiccant and evaporative cooling-assisted 100% outdoor air system (LD-IDECOAS) [2].
Energies 11 00345 g001
Figure 2. Four regions on the psychrometric chart.
Energies 11 00345 g002
Figure 3. Schematic diagram of the conventional liquid desiccant (LD) system.
Energies 11 00345 g003
Figure 4. Schematic diagram of the heat pump driven liquid desiccant (HPLD) system.
Energies 11 00345 g004
Figure 5. Schematic diagram of the liquid desiccant (LD) system simulation.
Energies 11 00345 g005
Figure 6. Effectiveness comparison between water and solution.
Energies 11 00345 g006
Figure 7. Thermal behavior of the systems on the peak cooling day. (a) Conventional LD-IDECOAS; (b) HPLD-IDECOAS.
Energies 11 00345 g007
Figure 8. Absorber inlet temperatures of desiccant solution on the peak cooling day.
Energies 11 00345 g008
Figure 9. SA temperature in the systems in summer season. (a) SA temperature of the conventional LD-IDECOAS; (b) SA temperature of the proposed HPLD-IDECOAS.
Energies 11 00345 g009
Figure 10. SA humidity ratio in the systems in the summer season. (a) SA humidity ratio of the conventional LD-IDECOAS; (b) SA humidity ratio of the proposed HPLD-IDECOAS.
Energies 11 00345 g010aEnergies 11 00345 g010b
Figure 11. Comparison of seasonal operating energy consumption. (a) Comparison of operating energy consumption during the summer season; (b) Comparison of operating energy consumption during the intermediate season.
Energies 11 00345 g011
Figure 12. Annual primary energy consumption comparison.
Energies 11 00345 g012
Table 1. Operation mode and relevant components [2].
RegionLDIECDECHeating Coil
AONONONOFF
BOFFON (outlet enthalpy: 42.1 kJ/kg)ON (outlet temperature: 15 °C)OFF
COFFOFFON (outlet temperature: 15 °C)OFF
DOFFON (dry mode)OFFON/OFF (maintaining neutral deck temperature)
Table 2. Model building parameters [2].
LocationSeoul, Republic of Korea (TMY2 weather data)
Volume1875 m 3 ( 25 × 25 × 3 )
Window-Wall Ratio0.12
U-ValueCeiling1.706 W / m 2  
Wall0.524 W / m 2  
Window5.68 W / m 2  
SchedulesHVACASHRAE Standard 90.1 (2013)
OccupancyASHRAE Standard 90.1 (2013)
Internal Heat GainsPeople75 W/person (sensible, latent)
Equipment230 W/person (sensible)
Lighting130 W / m 2 (sensible)
Table 3. Coefficients of vapor pressure equation.
Dehumidification Process a 0 a 1 a 2
4.58208−0.1591740.0072594
b 0 b 1 b 2
−18.38160.5661−0.019314
c 0 c 1 c 2
21.312−0.6660.01335
Regeneration Process a 0 a 1 a 2
16.294−0.88930.01927
b 0 b 1 b 2
74.3−1.8035−0.01872
c 0 c 1 c 2
−226.47.49−0.039
Table 4. References and coefficients for cooling mode.
Reference Values
V ˙ l o a d , r e f ( m 3 / s ) 5.678 × 10⁻⁴
V ˙ s o u r c e , r e f ( m 3 / s ) 5.678 × 10⁻⁴
Q l o a d , c , r e f (nominal capacity) ( W ) 14,215.35
P o w e r c , r e f (W)1320.00
C O P r e f (-)4.00
T r e f ( K ) 283.00
Model Coefficients
A1A2A3A4A5
−2.8581 × 1004.3425 × 100−9.6592 × 10−11.0978 × 10−14.6779 × 10⁻²
B1B2B3B4B5
−8.3346 × 1004.3775 × 10−19.0091 × 1003.6343 × 10−2−2.6220 × 10⁻¹
Table 5. Air condition changes in the system.
SystemOALDIECDEC
T (°C) ω (kg/kg)Eff. (-)T (°C) ω (kg/kg)Eff. (-)T (°C) ω (kg/kg)Eff. (-)T (°C) ω (kg/kg)
LD-IDECOAS33.70.01660.8730.630.00850.7521.690.00850.9515.870.0109
HPLD-IDECOAS33.70.01660.8426.750.00740.7518.720.00740.9513.490.0099

