1. Introduction
Air distribution in passenger’s compartment is a very important factor to regulate temperature and air velocity in order to achieve thermal comfort. The study of air distribution plays an important role in the design of new HVAC (heating, ventilation, and air conditioning) equipment and also in the evaluation of existing solutions. Technological solutions such as innovations in air-conditioning and other forms of cooling or ventilation can improve environmental conditions, which is beneficial for human health, comfort, and productivity.
Saving energy and providing thermal comfort are two important goals of HVAC systems. Regarding the first goal, the European Project ECORailS (Energy Efficiency and Environmental Criteria in the Awarding of Regional Rail Transport Vehicles and Services, 2011) [
1] for enhanced energy-efficiency of regional rail passenger services is a good example, as its main objective is to reduce the specific energy consumption of European regional passenger rail transport by 15% by 2020. While it is relatively easy to define and estimate the energy consumption of HVAC systems, the evaluation of thermal comfort is much more challenging. The American Society of Heating, Refrigerating and Air-Conditioning Engineers (ASHRAE) defines thermal comfort as “condition of mind that expresses satisfaction with the thermal environment” [
2]. As it depends on personal factors (such as metabolic rate or clothing) and environmental factors (such as air velocity, air temperature, air temperature stratification, radiant temperature, radiant temperature asymmetry, relative humidity, or turbulence intensity in the occupied zone), the definition and evaluation of thermal comfort is subjective and complex.
European standard EN-14750-1:2006 [
3], relative to air conditioning for urban and suburban rolling stock, establishes a classification of the railway vehicles depending on the number of standing passengers, the average travel time, and the average time between two vehicle stops. According to that definition a railway vehicle is category A for suburban/regional transport and B for the rest. It also defines different comfort parameters and requirements that depend on the vehicle category and are related to the temperature and velocity within the railway vehicle.
Keeping fixed the parameters related to personal factors and the indoor geometry, thermal comfort is directly related to air conditions: velocity, temperature, and temperature stratification. It is evident that different diffusers and different locations of supply inlets and exhaust outlets will affect air distribution and, consequently, also the distribution of the cited thermal comfort parameters. Moreover, for a given HVAC system operating with different conditions (air supply temperatures, air supply flow, climate conditions etc.) these parameters will also change. Hence, it is necessary to understand quantitatively how these different operating conditions will affect local thermal comfort.
In public transport, such as railway vehicles, thermal comfort is even more important than in building applications. In fact, standing passengers inside a cabin for several minutes/hours do not have opportunities of moving. Passenger comfort has to be one of the most important elements in the design of public transport in order to persuade people to choose it instead of other means of transport. This is the reason why, for several years, many studies have focused on the air distribution system in the passenger’s cabin.
As discussed by Liu et al., in its literature review paper [
4] (focused on the particular case of commercial airliner cabins), two main approaches are available for analyzing air distribution: experimental measurements inside the cabin (with different equipment such as hotwire anemometers and hot-sphere anemometers, particle tracking velocimetry, particle streak velocimetry, particle image velocimetry, and ultrasonic anemometry) and numerical simulations (mainly CFD simulations). R. Lieto [
5] studied, both numerically and experimentally, the indoor climate in city busses. He contrasted his numerical results with measurements of the air speed in some selected points in two different situations (a moving vehicle with the door closed and the vehicle at a bus stop with open doors). Zhu et al. [
6] also studied, numerically and experimentally, the micro-environmental conditions in public transportation buses, focusing on thermal comfort and also on air quality. In other work, Zhu et al. [
7] studied numerically the risk of airborne influenza infection in a bus microenvironment with different ventilation system configurations.
There are more publications regarding air distribution in aircraft cabins that are also focused on thermal comfort and air quality. Bianco et al. [
8] studied numerically-transient simulations of the thermal and fluid dynamic fields in the cabin of an executive aircraft, considering 2D and 3D models. In other papers [
9,
10,
11,
12,
13,
14] the studies have been devoted to air quality and the distribution of pollutants, mainly CO and CO
2.
Although comfort conditions in public transport, such as buses or aircraft cabin, planes have been widely discussed in recent years, to the best of the knowledge of the authors, there are only a few papers specifically related to railway vehicles. Thompson et al. [
15] presented a review of cooling systems used in railway vehicles and the advantages of using heat storage in the complex environment of an underground railway. Show [
16] discussed a ventilation criterion for ensuring a clean environment, with low carbon-dioxide concentration (lower than 0.1% in air). To obtain such acceptable indoor air-quality inside the train compartment, he mentions two possibilities: to increase the fresh-air supply rate for dilution or to design a better air-distribution system. However, none of these studies in railway vehicles include an analysis of air distribution and its relationship with the passengers’ thermal comfort.
To the best of the knowledge of the authors, perhaps due to the complex and time-consuming process of the geometry definition and the high required computational time in the simulations, there are not any previous studies related specifically to air distribution railway vehicles with passengers using CFD techniques. Even though all the modes of transportation share some similarities, such as the air conditioning and the comfort conditions, there are also some differences in the functionality and the passengers’ distribution that make these transports different from a thermal analysis point of view. Moreover, as concluded in Yan et al. [
17] the computational manikin model approach representing the passengers in the vehicle can affect the temperature fields, and an excessive degree of simplification can be incapable of predicting accurate results.
Experimental measurements, which are often considered reliable to analyze air distribution and thermal comfort, can be technically very difficult and expensive. It is very difficult to obtain results under realistic thermo-fluid conditions or detailed geometry. On the other hand, CFD simulations offer a good alternative. Due to their flexibility and efficiency a lot of scenarios can be studied with a relatively low cost. Furthermore, the results in terms of temperature and velocity fields can be obtained for the whole volume of interest and not only for a specific measured point.
In the present work, a detailed CFD analysis of air distribution and the temperature and velocity profiles in different sections of a representative railway vehicle is performed (including the passengers), in order to discuss the results in terms of thermal comfort.
2. Problem Definition and Methodology
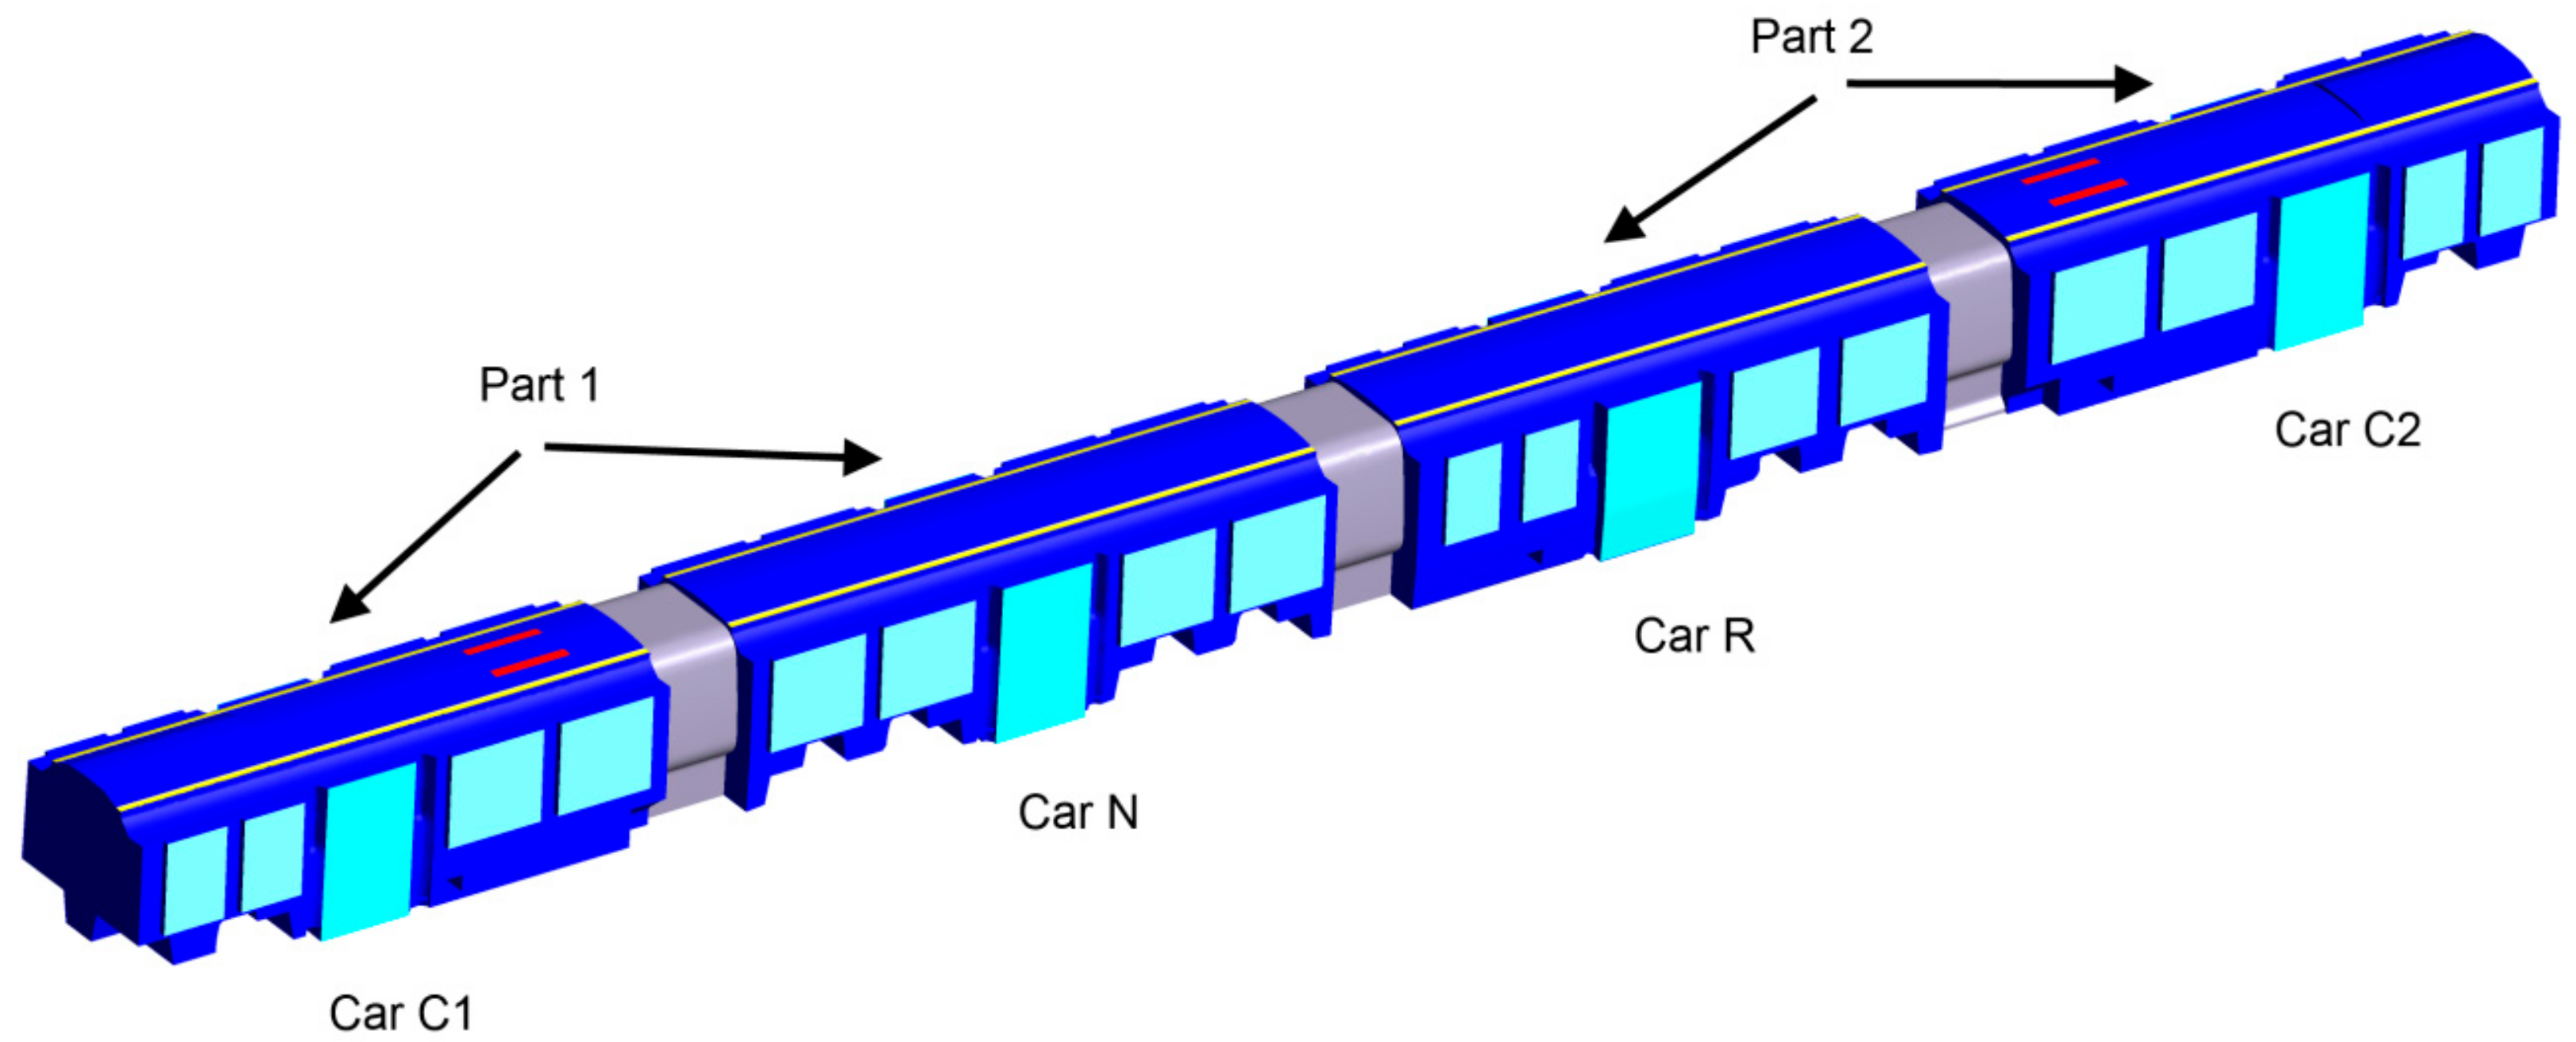
A detailed three-dimensional CFD model of a railway vehicle formed by four cars is developed using the software ANSYS-CFX (ANSYS, Inc., Southpointe, Canonsburg, PA, USA). The tram (39.475 m length and 2.650 m width) is divided in two parts (part one: cars C1 and N, and part two: cars R and C2). In each car there are two doors and eight windows. Although cars C1 and C2 are identical, cars N and R are geometrically different.
In the model, a representative HVAC system and a random distribution of passengers are integrated. In all the studied cases, the tram remains stopped and the driver’s cabin is not included. A 3D view of the railway vehicle is shown in
Figure 1.
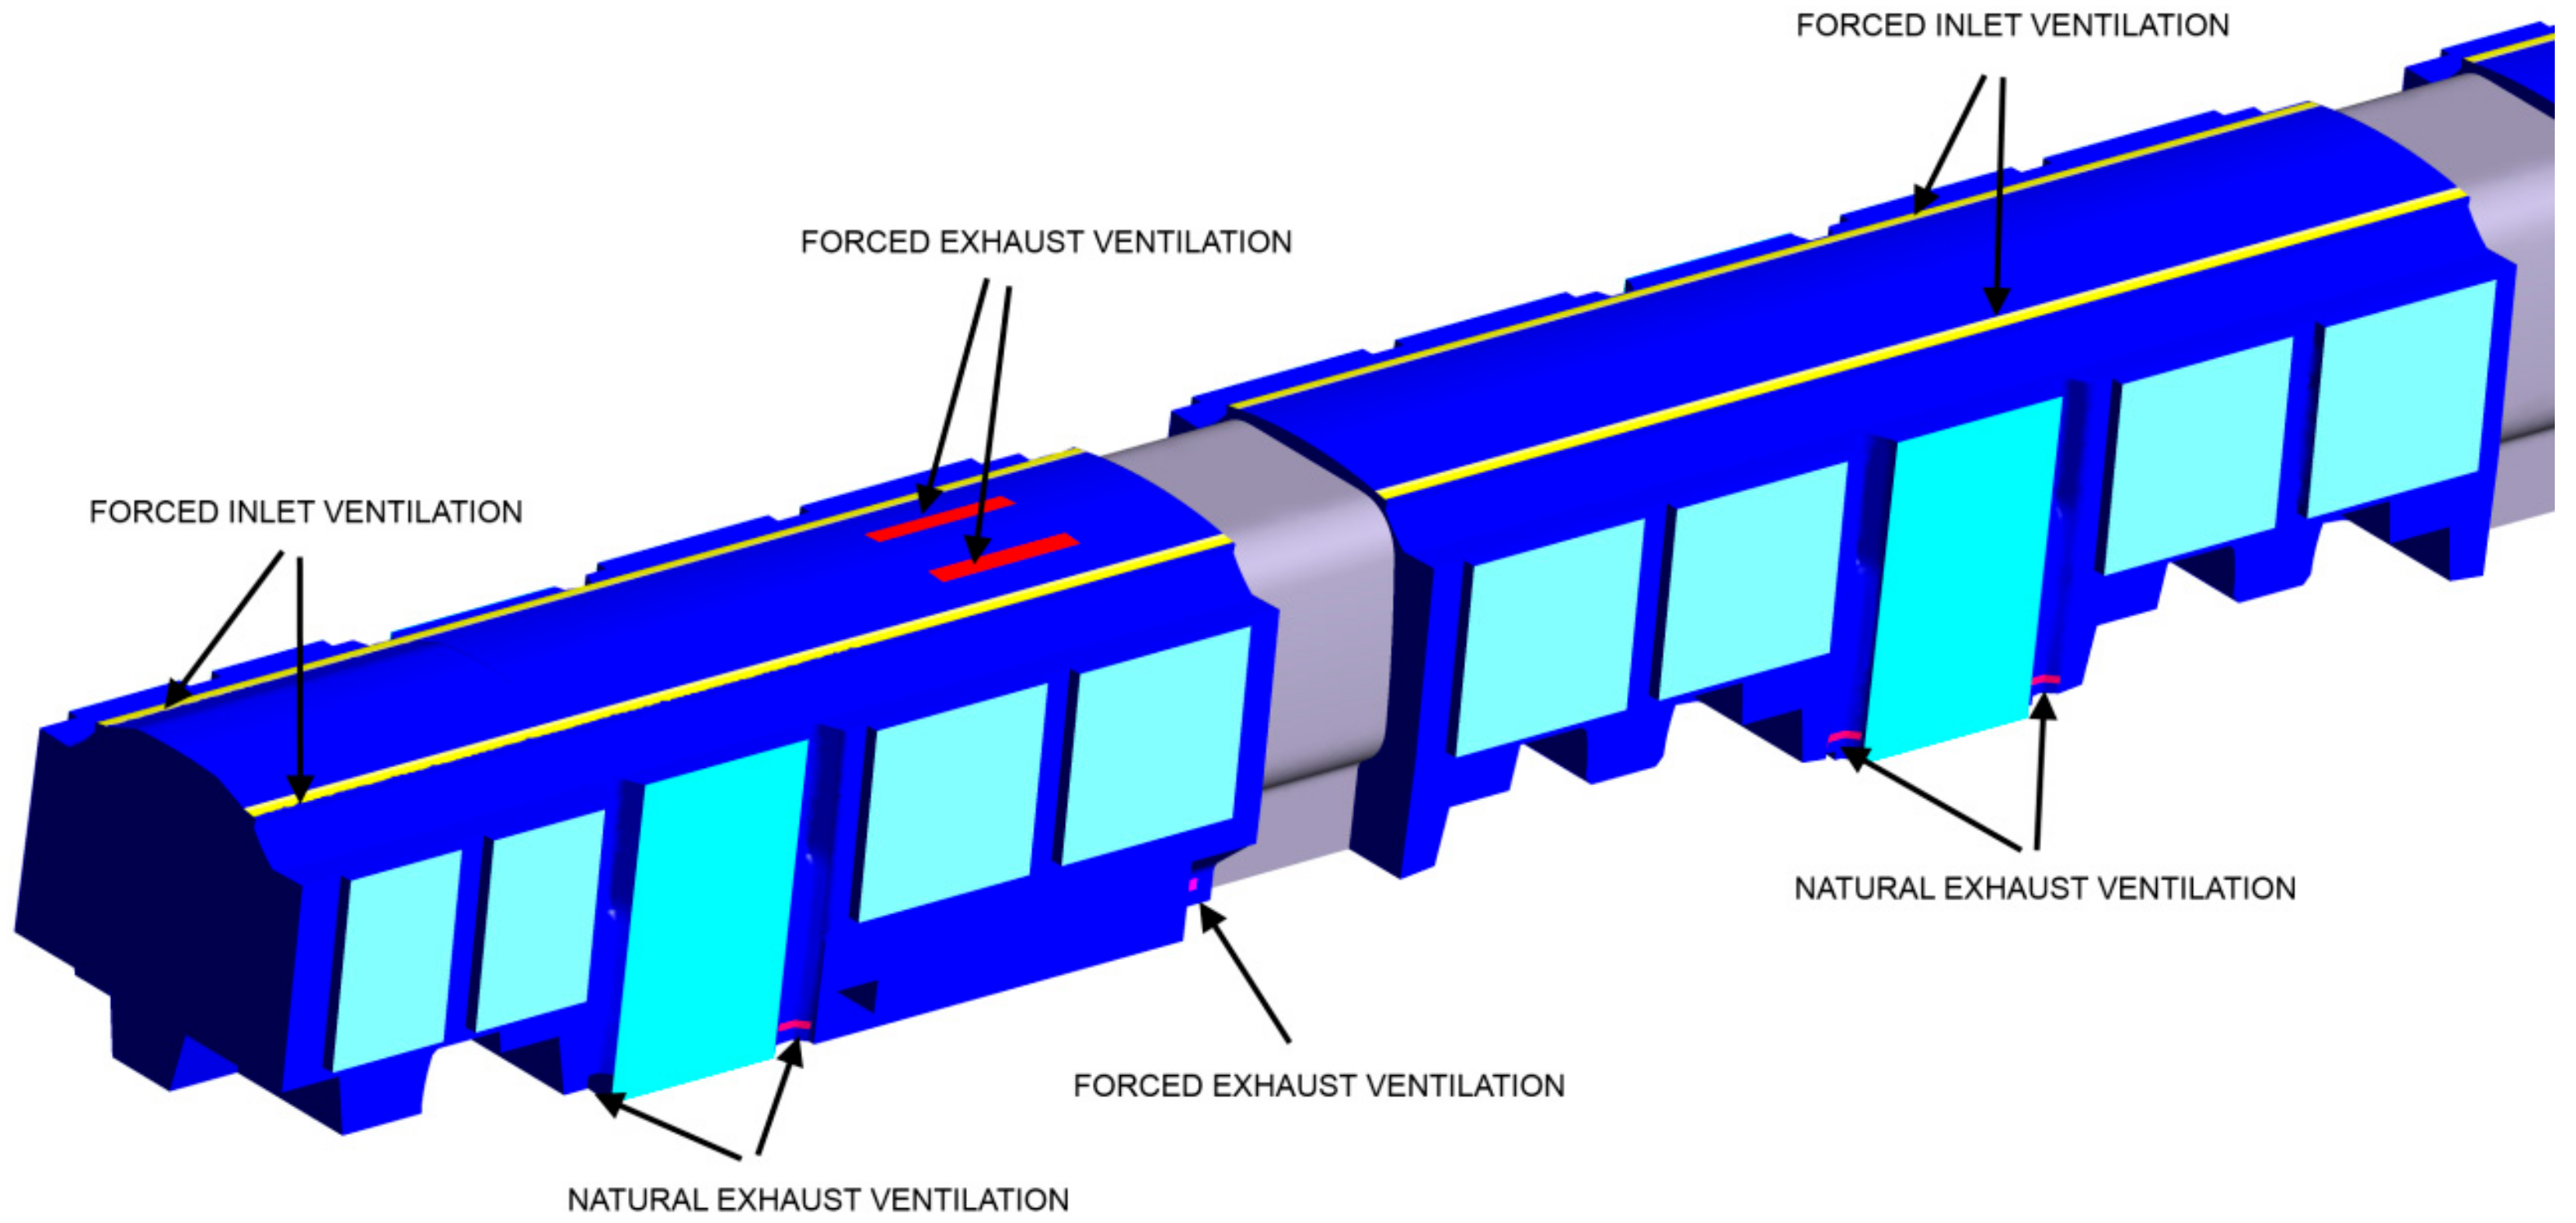
The boundary conditions related to the HVAC system are shown in
Figure 2, for part one of the tram. The conditioned air (3000 m
3/h in each part of the tram) is supplied by two longitudinal forced ventilation inlets located at the ceiling of the tram. In the extreme cars (C1 and C2) there are two forced ventilation exhausts. Air is homogenously supplied along the tram, except near the forced exhaust vents located at the ceiling, where vents are closed in order to avoid the short-circuiting of the supply air.
In each door there are two natural exhaust openings. In cars C1 and C2 there are, in total, two forced exhaust ventilation systems located at the walls of 150 m3/h each.
In addition, the HVAC system includes 16 convectors (four in each car) that only work during winter climate conditions. These convectors are of two different models: type 1 (supplied flow 230 m
3/h) and type 2 (supplied flow 200 m
3/h). The number of the different convectors in each car is shown in
Table 1.
The cases studied are based on two different passengers’ occupation scenarios, one including the passengers (220 in total, 120 standing and 100 seated) and the other without passengers. In the cases including occupation, it is considered a sensible heat load of 78 W/person (17.16 kW in total). There are two lighting rows in the longitudinal direction on each side of the ceiling. The total lighting sensible heat load in the tram is 2.67 kW (homogeneously distributed in the four cars). The overall heat loss coefficient through the tram envelope (including walls, windows, floor and ceiling) is assumed to be 2 W/(m2K).
Eight different parameters of working conditions have been studied for typical weather conditions in Northern Europe, in an attempt to investigate air distribution, temperature, and velocity fields inside the tram and its effects on thermal comfort. The temperature conditions are summarized in
Table 2 for different scenarios.
Cases 1–4 and 5–8 correspond to summer and winter weather conditions, respectively. Scenarios without passengers (cases 1, 2, 5, and 6) and with passengers (cases 3, 4, 7, and 8) are considered. In all cases, supplied air flow temperature, exterior temperature, and the convectors’ supplied temperature are indicated (the last only for winter cases). Solar radiation is not included in the model. The air flow conditions for each part of the tram are described in
Table 3.
In all the studied scenarios the fresh air flow for each part of the tram is indicated. The difference between the 3000 m3/h supplied flow in each part of the tram and the fresh flow is the forced flow exhausted by the ceiling extractions (recirculated air flow).
The rest of the air is exhausted by the forced wall extractions located at the walls in cars C1 and C2 and by the natural openings located at the doors. Particularly, in cases 1 and 5 the HVAC system does not supply fresh air, which means that in each part of the tram, the 3000 m3/h supplied air flow is exhausted by the ceiling extractions. The forced wall extractions located at the walls of cars C1 and C2 are active in all cases except for cases 1 and 5. Finally, the convectors’ supplied air flow in the two different parts of the tram (only for winter cases) is also indicated.
For the defined operating conditions, a 3D CFD model is used to predict the temperature and velocity fields of air inside the tram. With this methodology, the conservation equations of mass, momentum and energy (Navier-Stokes equations) are solved using a computer-based tool over the region of interest, with specified conditions on the boundaries of the tram.
The mesh is formed by tetrahedral elements in the fluid volume and prismatic elements near the walls in order to obtain the correct refinement of the viscous kinematic and thermal boundary layer. For the inlet and outlet regions of air ventilation, the mesh has been generated with smaller elements in order to obtain more precision and detail in the characteristics of the air movement in this critical zone for the velocity field.
In the analysis it is considered a steady-state regime, and the sheer stress transport (SST) turbulence model is used. Air is considered to behave like an ideal gas.
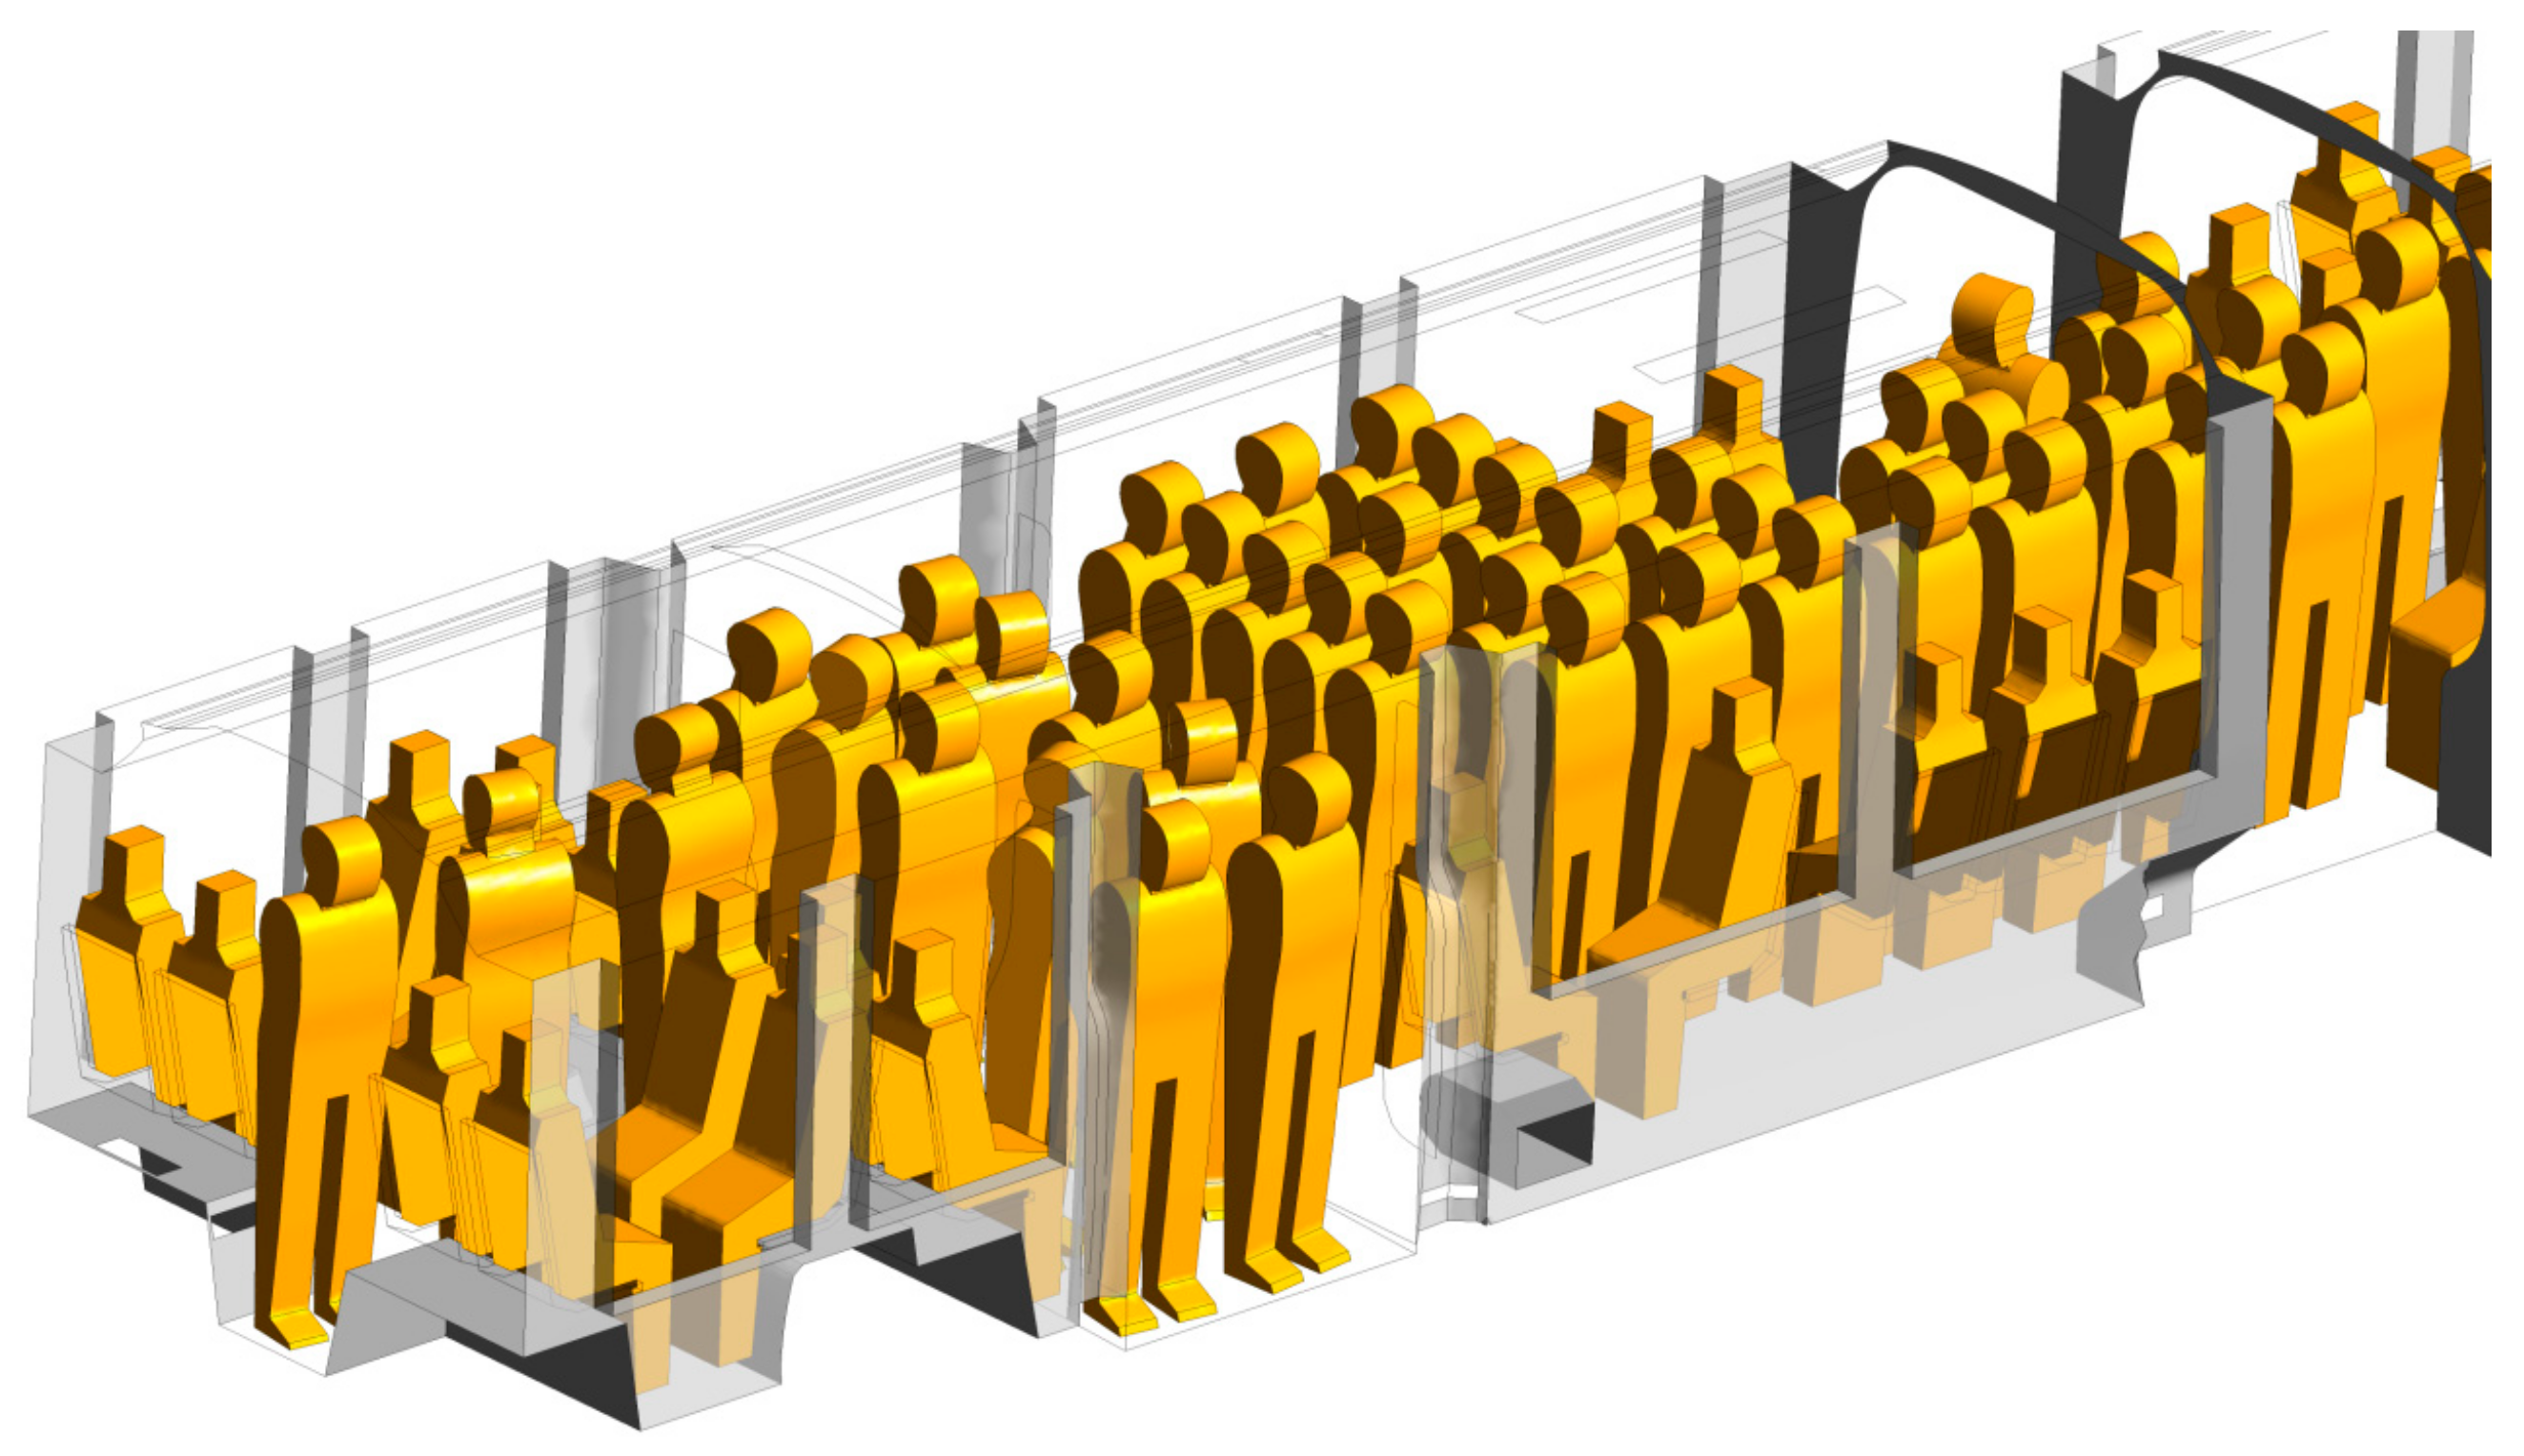
The passengers are modeled in two different positions: standing or sitting. For the purpose of this study, the design capacity of the tram is 220 passengers, 120 standing and 100 sitting. In order to reduce the number of nodes and the time consumption during the simulations, a simplified geometry model of the passengers has been defined. A sketch of the passengers’ distribution in car C1 is shown in
Figure 3.
A similar passenger distribution is defined in the rest of the cars.
3. Results
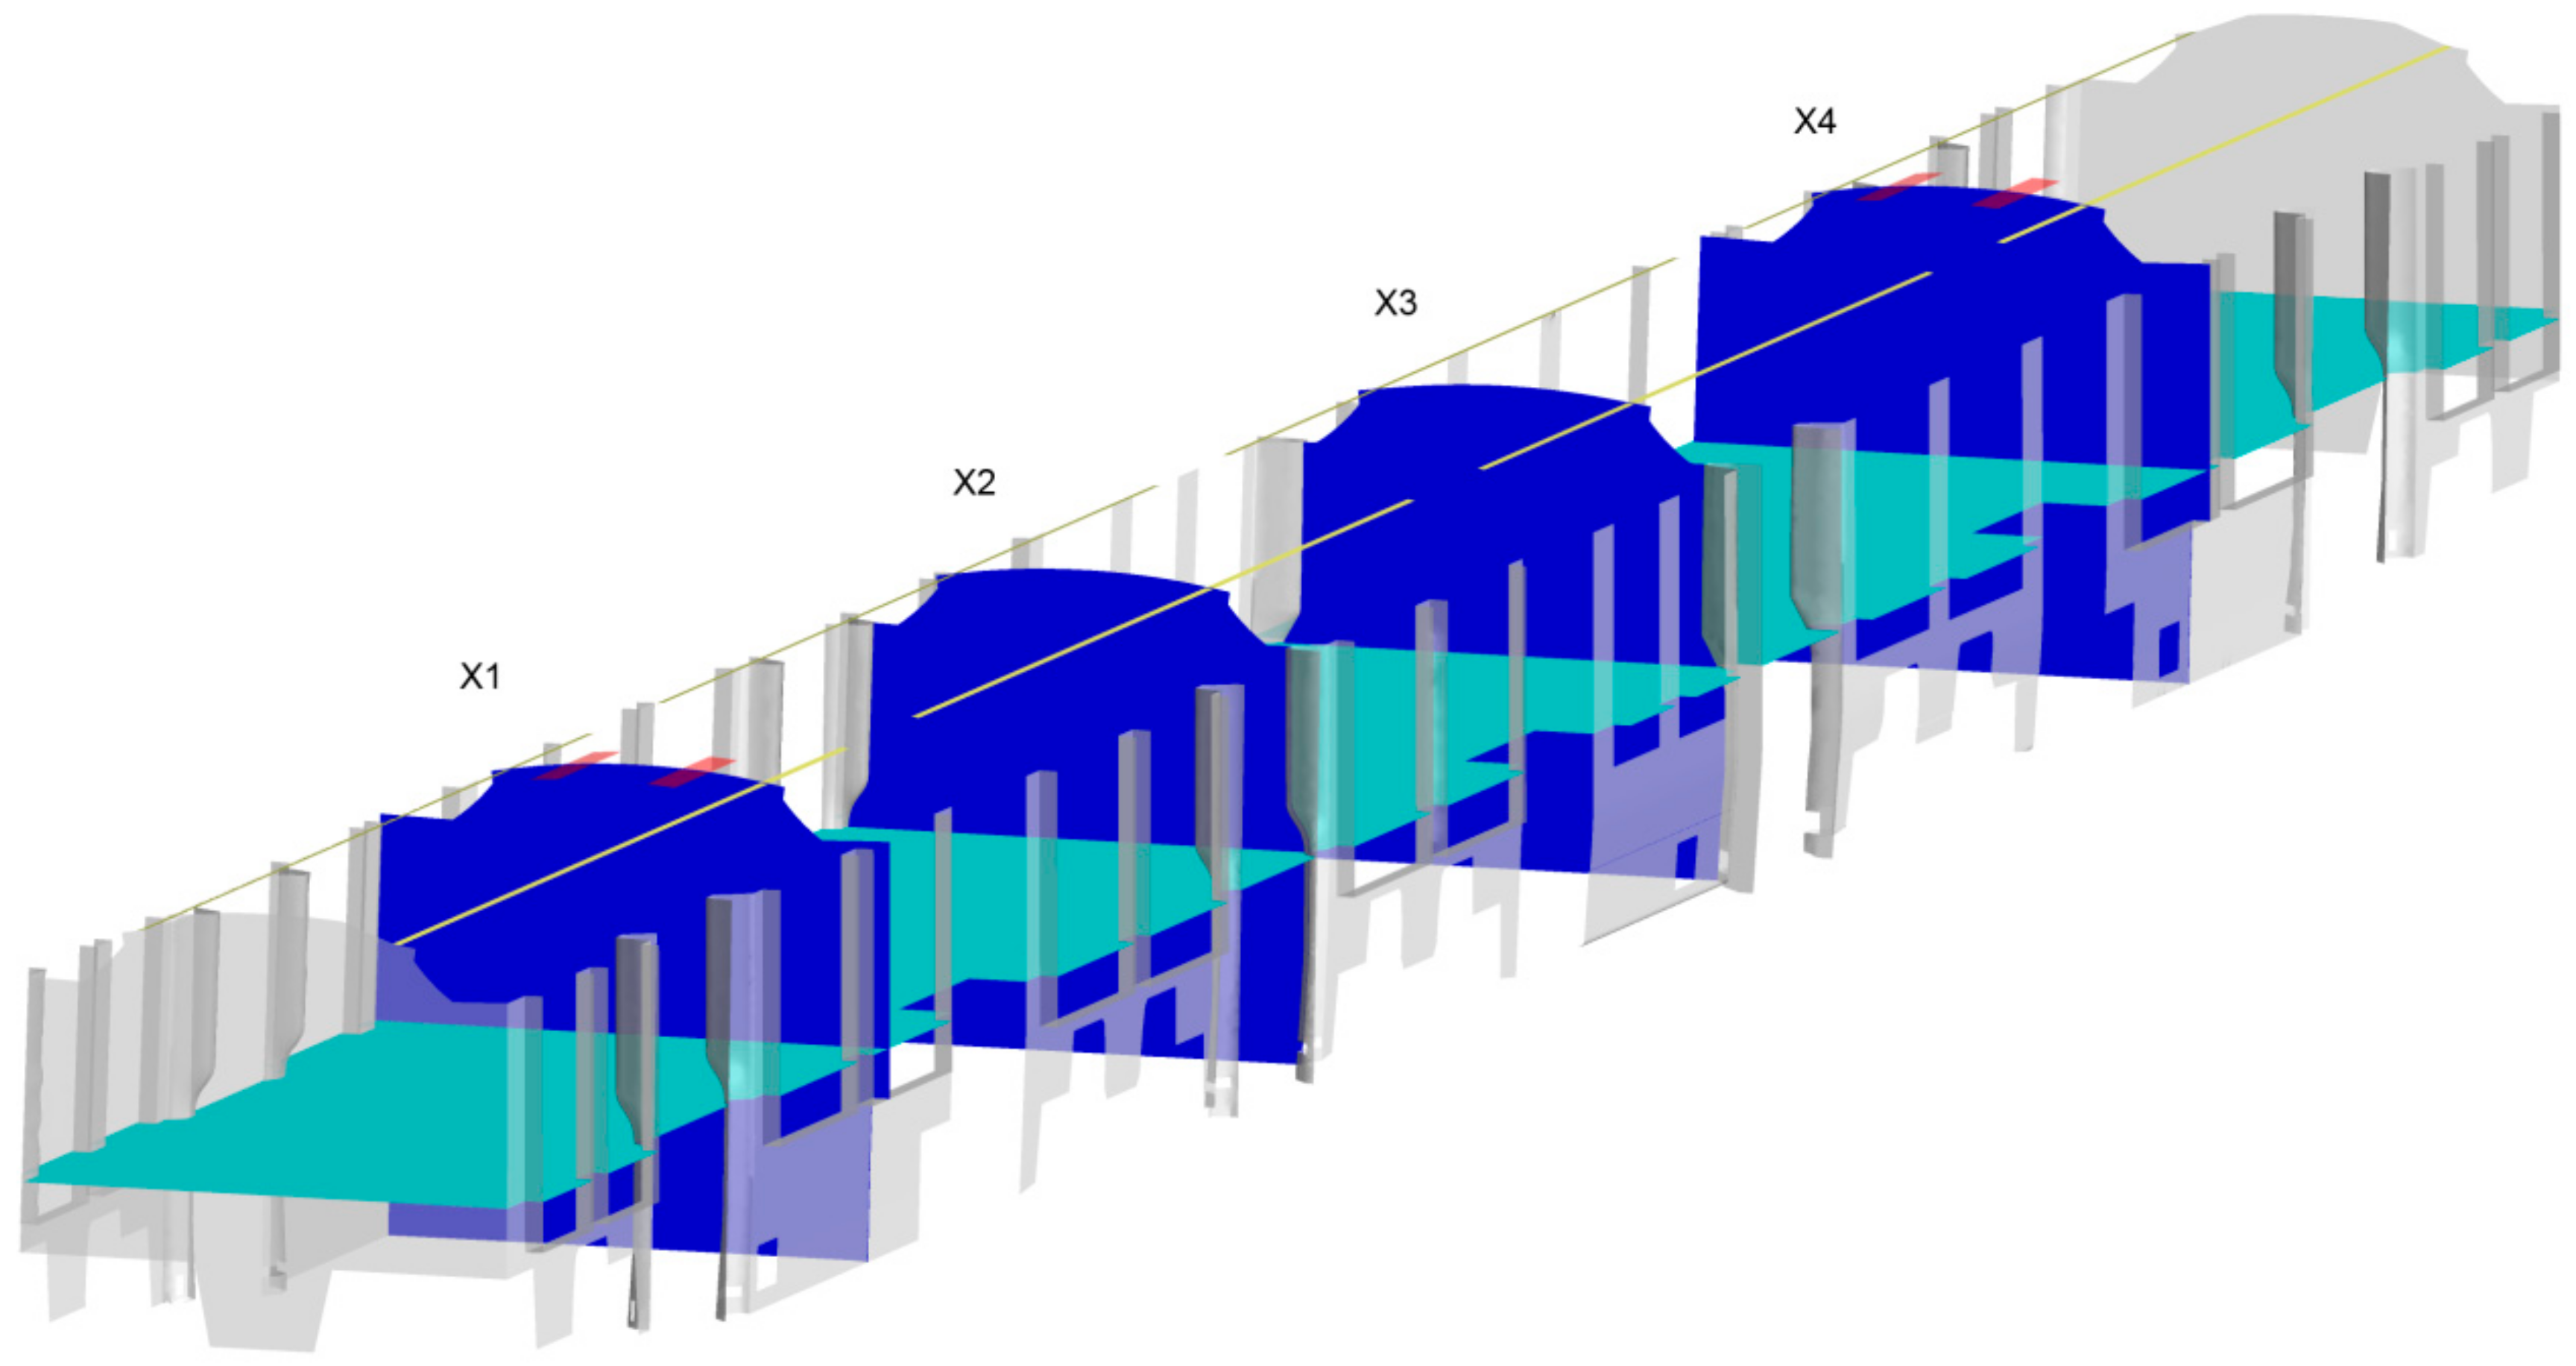
Results are presented in three different sections. Firstly, the air distribution within the tram volume is described briefly, with a focus on the main inlets and outlets of air and pointing out the singularities of the velocity fields in its proximities. Secondly, results are discussed in terms of the temperature fields in different representative planes in the tram (shown in
Figure 4).
The selected horizontal plane, representative for the occupancy plane, is at a height of +1.1 m. Four different vertical planes (X1, X2, X3, and X4) are selected, one in each car of the tram. While planes X1 and X4 are representative of the forced extraction ventilation located at the ceiling of cars C1 and C2, respectively, planes X2 and X3 are representative of the forced inlet ventilation and the natural exhaust ventilation located at doors of cars N and R, respectively. Finally, the results are also quantitatively analyzed in the tram volume. In order to avoid areas of local discomfort such as the proximities of the tram envelope, the luminaires, or the convectors, it is defined an interior comfort volume that does not consider these zones to evaluate the comfort parameters. In the present work, where the design of the HVAC system is defined in advance, these comfort parameters are useful to compare multiple scenarios with different working conditions, but these parameters could be also used to analyze the impact in air distribution and thermal comfort of different HVAC systems.
3.1. Description of Air Distribution in the Tram
The conditioned air is supplied by the longitudinal inlets located at the cars’ ceiling (and in the case of winter season, also by the convectors). Air is homogenously supplied by the longitudinal inlets except near the forced exhaust vents located at the ceiling, where the vents are closed in order to avoid a short circuit in the air distribution. The vents are also closed in the joints between cars. While most of the air is exhausted by the forced ventilation system located at the ceiling in cars C1 and C2, the rest is driven out of the tram by the natural openings located at each door and the forced exhaust ventilation systems located at the walls of cars C1 and C2.
In
Figure 5a, the velocity fields for case 1 (without passengers) in the vertical section containing the ceiling extractions in car C1 (plane X1) is shown. It is observed an ascendant air flow and the maximum velocities are reached in the proximities of the ceiling extractions. In
Figure 5b, the velocity fields for the same case in the vertical section containing the longitudinal supply inlets and the natural openings located at the doors in car N (plane X2) is shown. It is observed that air is driven from the supply inlets located at the ceiling to the doors’ natural openings located near the floor. A circular air flow pattern is reached and a relatively small amount of air is driven out of the tram by the natural exhaust ventilation located at the doors.
Similar air flow distribution is observed for cases with occupation, even though the air distribution is more complex.
Figure 6 shows the velocity fields for Case 3 (with passengers) in the same sections described in the previous figure.
In
Figure 6a, it is observed again that air is driven to the ceiling forced extractions, reaching maximum velocities values near them. In
Figure 6b, air is driven from the supply inlets located at the ceiling to the doors’ natural openings located near the floor. Again, the maximum velocities are reached in the proximities of inlets and outlets. Even though the conditioned air is not supplied near the ceiling extractions, as observed in
Figure 5a and
Figure 6a, air distribution and circulation inside the tram is adequate, with no death zones without air circulation.
3.2. Temperature Distribution
According to the European standard EN-14750-1:2006 [
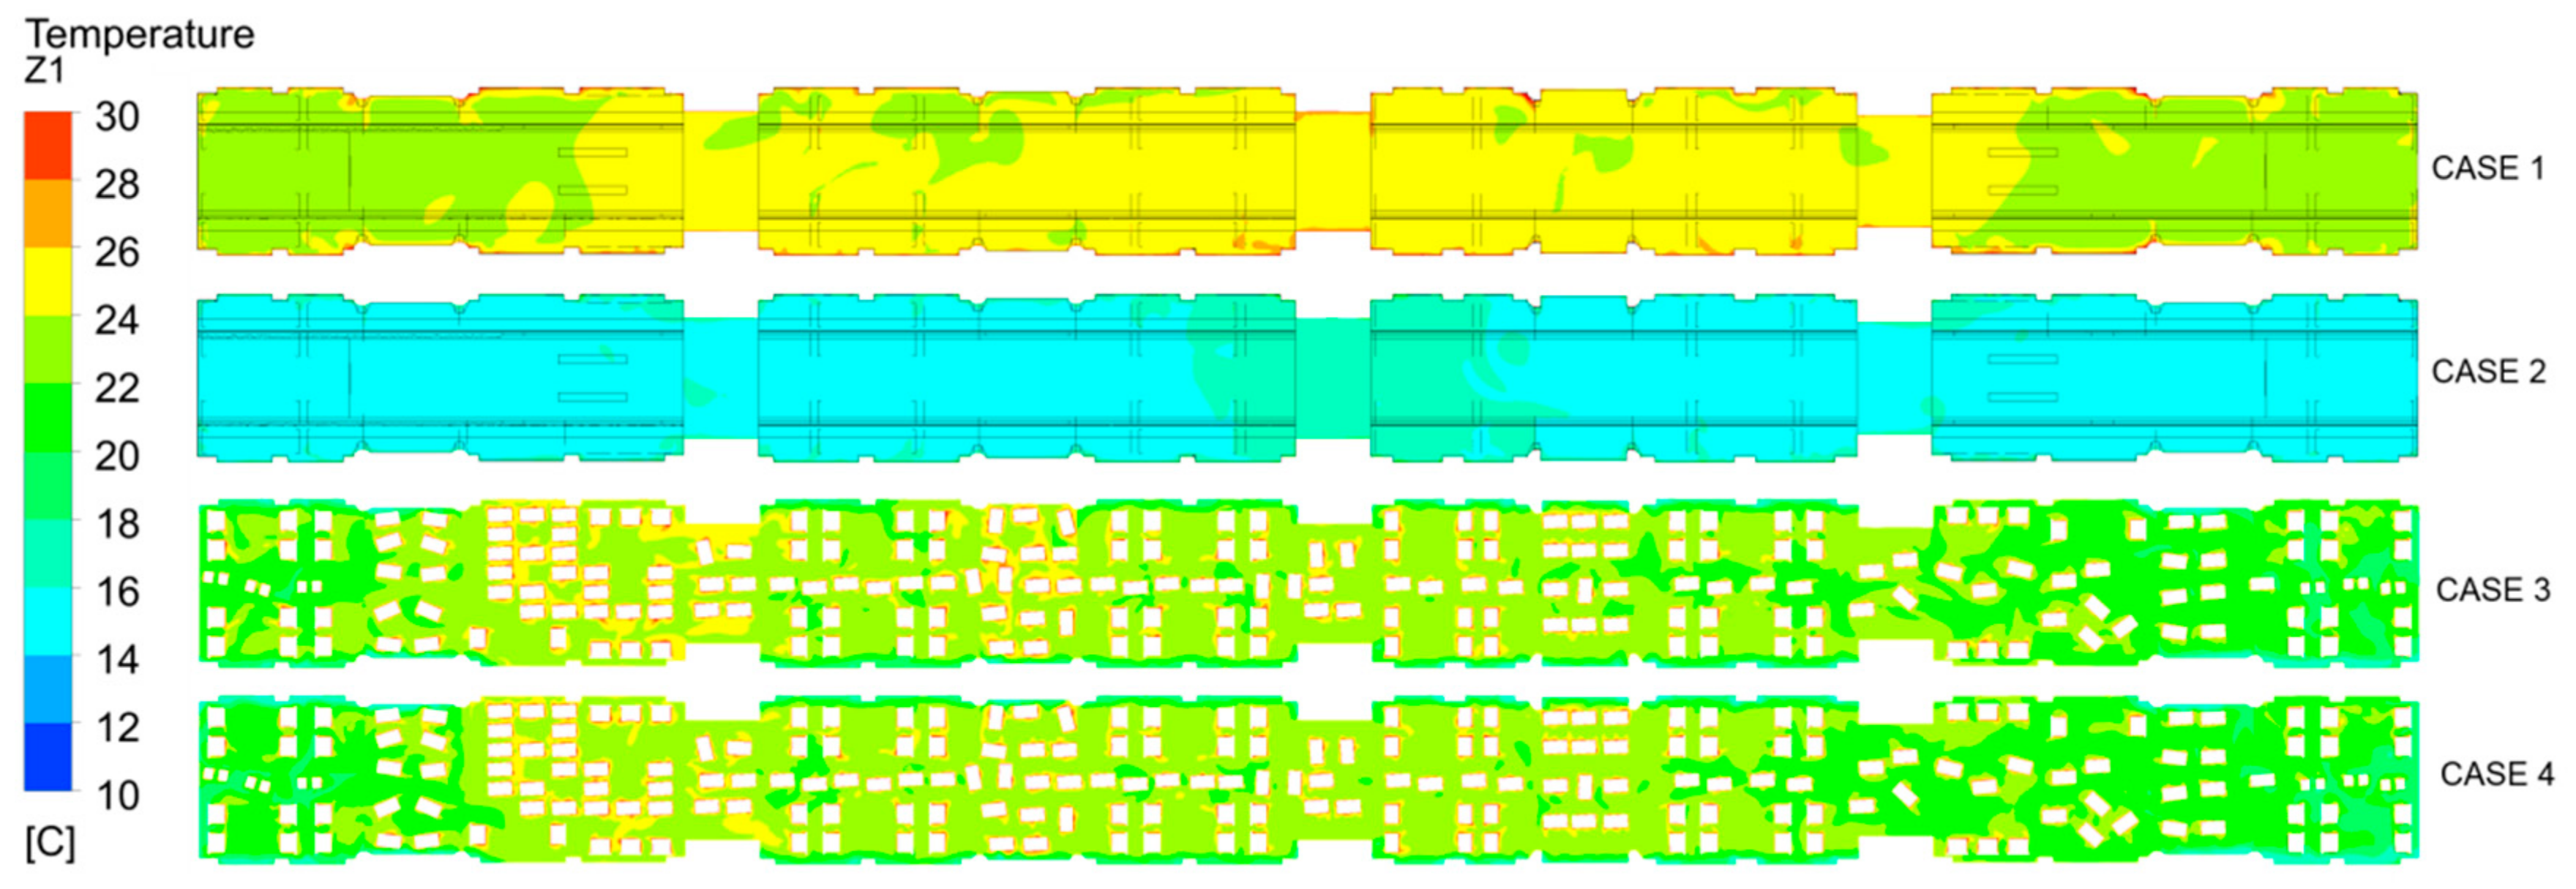
3], the difference of temperature at a horizontal plane of a height of +1.1 m must be lower than 8 °C for B category railway vehicles. The same condition must be satisfied at any vertical plane (X direction). In this work, the requirement is quantified in terms of the percentage area that is in the range T
avg ± 4 °C, where T
avg is the average temperature at the particular plane. With this definition, a percentage of 100% means that the whole plane satisfies the requirement. The temperature field in the cited horizontal plane is presented in
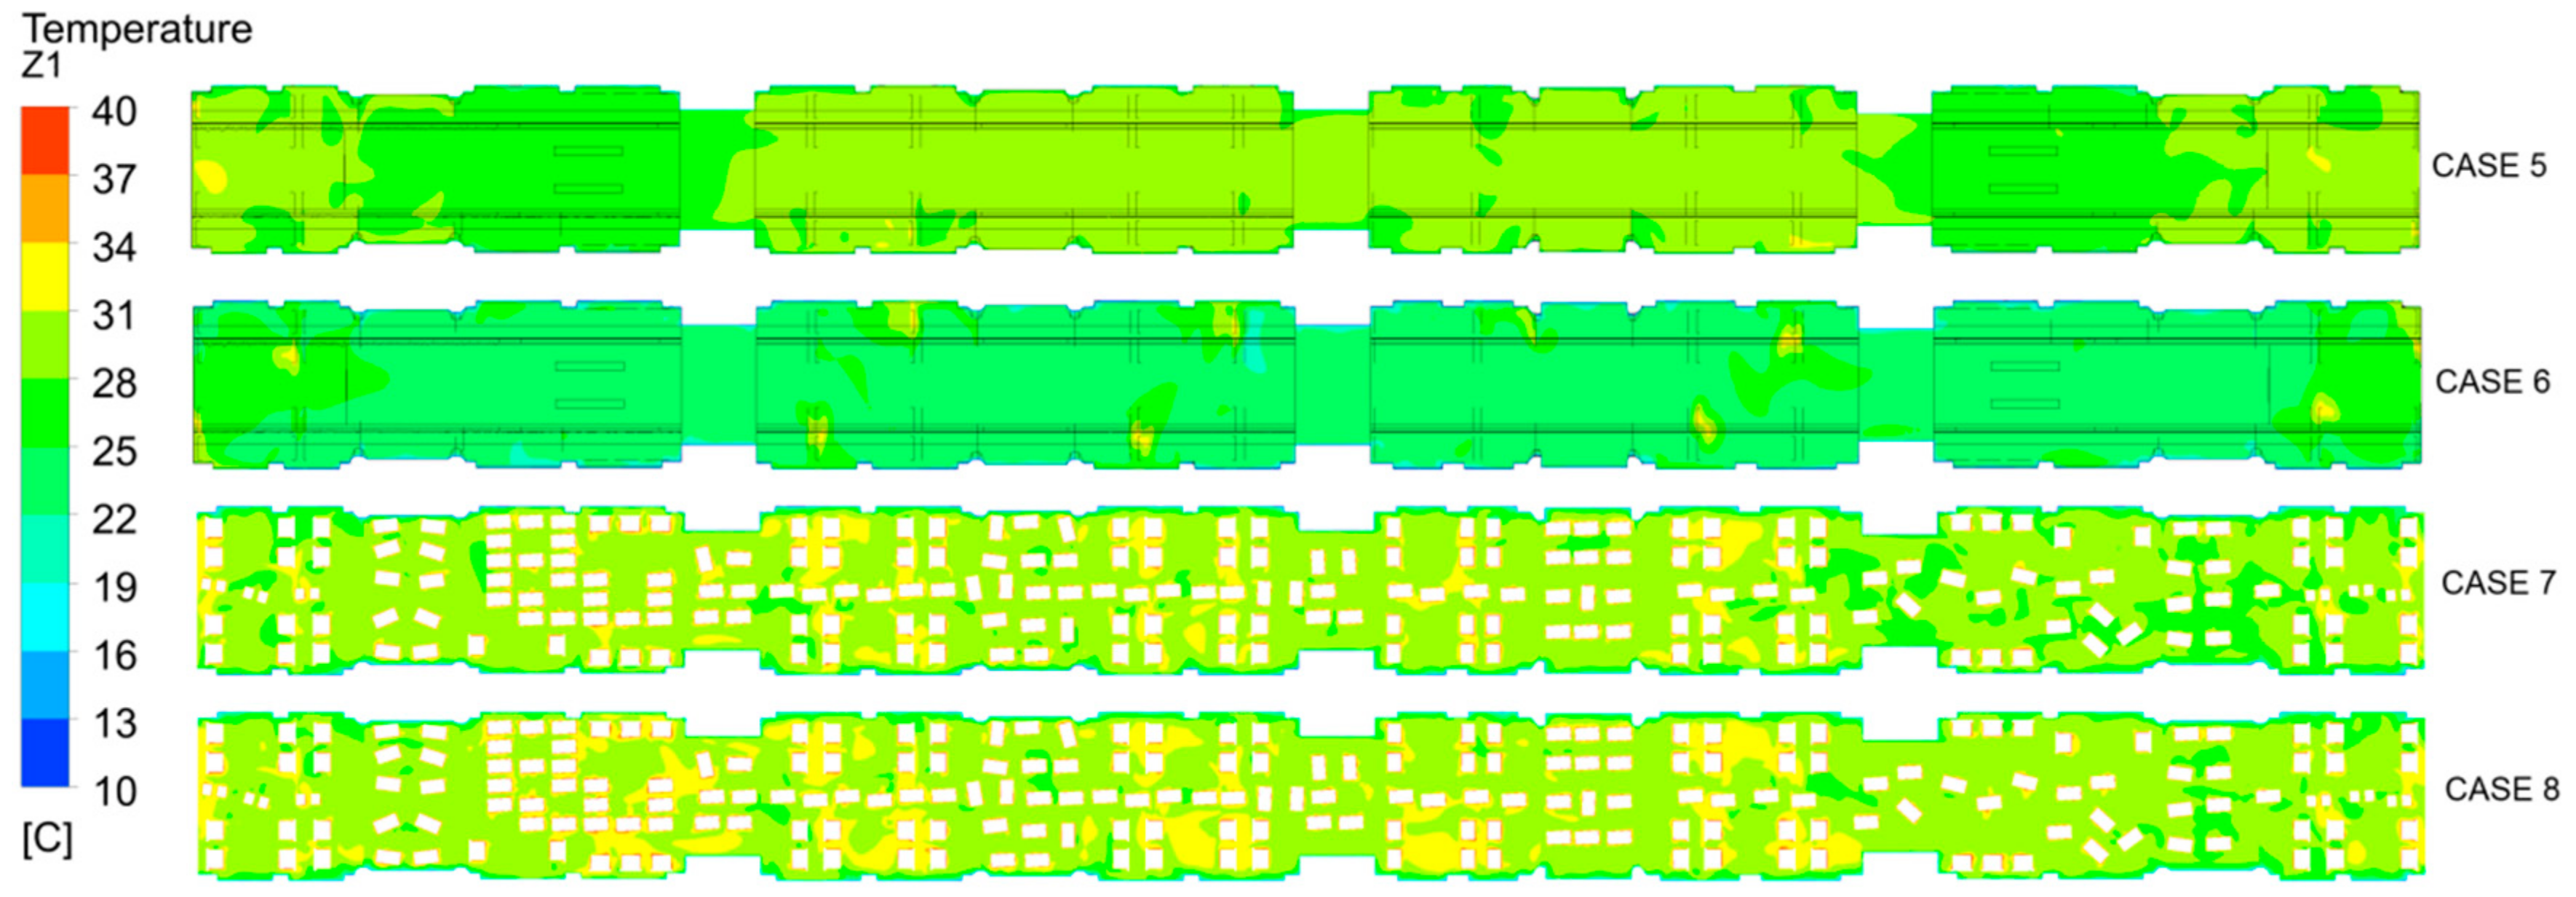
Figure 7 and
Figure 8 for the summer cases (Cases 1–4) and the winter cases (Cases 5–8) respectively.
The quantitative results at the horizontal plane, summarized in
Table 4, show a homogeneously-distributed temperature around the average temperature in all cases, especially for summer cases 1–4 (percentages above 98%) in comparison with winter cases 5–8 (percentages above 96%).
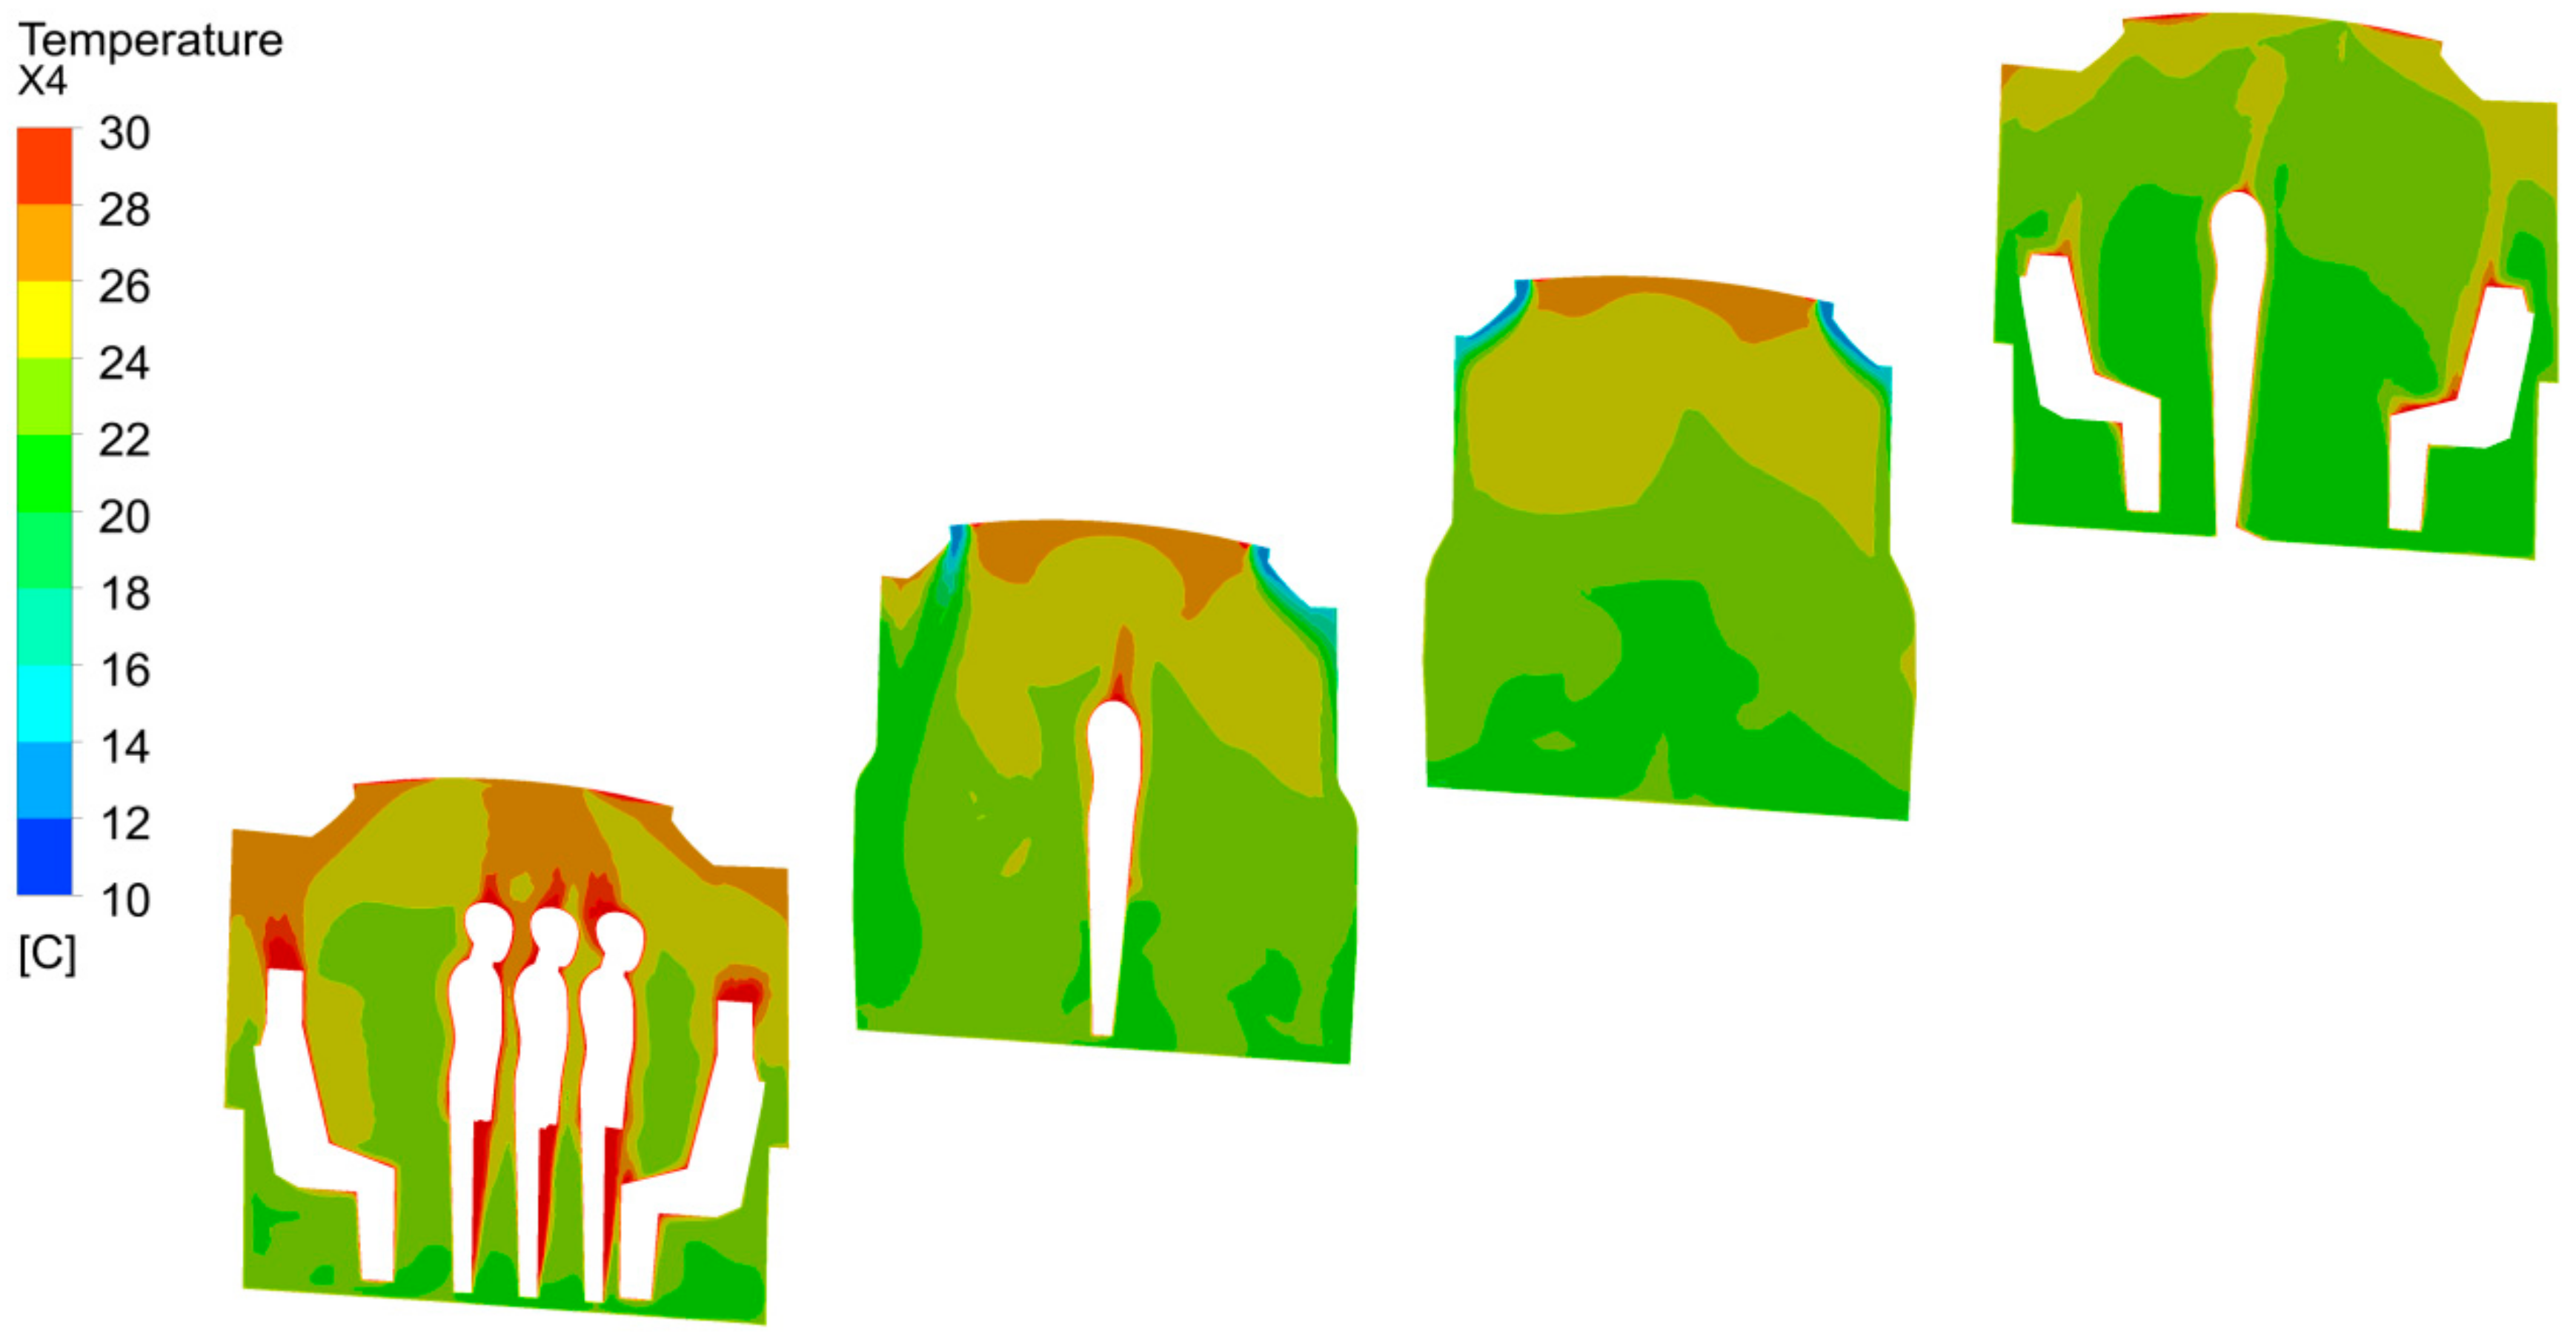
As an example,
Figure 9 and
Figure 10 show the temperature fields in the vertical planes X1, X2, X3, and X4 for Cases 3 and 7 (representative cases with passengers for summer and winter seasons, respectively).
In the representative summer case (
Figure 9), it is observed that maximum temperatures are reached near the passengers’ proximities and minimum temperatures are reached near the supply inlets. In the representative winter case (
Figure 10) the maximum temperatures are also reached near the passengers’ proximities and also in the convectors’ zone of influence, while the minimum temperatures are reached near the tram envelope (due to the high gradient of temperature with the exterior).
The quantitative results at the vertical planes for the eight cases are summarized in
Table 5.
Results show a homogeneously distributed temperature around the average temperature in all cases, especially for summer cases (1–4), with percentages above 98%. In winter cases (5–8), in which the temperature gradients are higher, the percentages in the range are lower (percentages above 83%). In these winter cases, the results are better for sections X1 and X4 (percentages above 95%) in comparison with planes X2 and X3. This is explained by the fact that sections X1 and X4 are located at the extreme cars in which the forced ceiling extractions cause a more homogeneous air distribution.
3.3. Temperature and Velocity within the Tram Volume
The previously-analyzed sections were selected in a first approach as representative of the whole tram thermal behavior. These sections included hot areas (such as the proximities of the lighting or the passengers) and other cold areas (such as the proximities of the ceiling air supply inlets or the tram envelope in winter cases) that are not strictly situated in the occupancy zones and can distort the results. Taking into account the whole volume of the tram, the volume of these zones is not negligible. In order to obtain a more realistic approach of the tram thermal behavior in the zone where the passengers are located, the comfort volume is defined as the space between heights +0.5 m and +1.7 m, excluding the convectors’ influence zone and also the proximities of the walls of the tram.
Temperature and velocity requirements are quantified in terms of the volume percentage that satisfies the given requirement in the defined comfort volume.
In the case of the temperature requirement, it is calculated the percentage volume in the range Tavg ± 4 °C, where Tavg is the average temperature at the volume.
In the case of the velocity requirement, it is quantified the percentage volume in which the velocity is lower than the maximum allowed (v
max), where v
max is defined according to EN-14750-1:2006 [
3], and depends on the railway vehicle category and also on the average temperature in the tram.
This maximum allowed velocity v
max is shown in
Table 6 for different average temperatures for B category trams:
Taking into account this definition, the results in the defined volume are summarized in
Table 7.
The quantitative results in the defined comfort volume show a good behavior in terms of the defined comfort parameters for temperature and velocity. In the case of air temperature, results show a homogeneously-distributed temperature around the average temperature in all cases, especially for summer cases 1–4 (percentages above 94%) in comparison with winter cases 5–8 (percentages above 89%). In the case of air velocity, results in the defined comfort volume are excellent. In winter cases 5–8, where the maximum allowed velocities are higher (due to the higher average temperatures in the tram) the percentages are 100% except for case 6 (98%). In summer cases 1–4, the percentages are above 96%.
4. Conclusions
A CFD analysis of air distribution in a railway vehicle equipped with a specific HVAC system has been presented for eight different scenarios representative of typical summer and winter Northern European climate conditions.
Firstly, a description of the CFD model focusing on the HVAC system characteristics is presented and the results are discussed in terms of air distribution. Results show that air distribution and circulation inside the tram is adequate, with no death zones without air circulation.
Temperature fields in different representative horizontal and vertical sections of the tram are also analyzed in terms of the area percentage that is in the range Tavg ± 4 °C, where Tavg is the average temperature at the particular plane. The quantitative results at the selected sections show a homogeneously distributed temperature around the average temperature in all cases, especially for summer cases 1–4 (percentages above 98%) in comparison with winter cases 5–8 (percentages above 83%). These worse results for winter conditions are explained by the fact that in these cases the difference of temperature between the hot areas (such as the convectors’ influence zone or the passengers’ proximities) and the cold areas (the proximities of the tram envelope, with very low exterior temperatures) is higher in comparison with the summer cases.
To obtain a more realistic approach representative of the whole tram volume (not depending on the selected sections) the temperature and velocity results are quantified in a comfort volume, defined as the space between heights +0.5 m and +1.7 m, excluding the convectors’ influence zone and also the proximities of the walls of the tram. This comfort volume represents the volume occupied by the passengers. The quantitative results in the defined comfort volume corroborate the previous temperature surface results. Again, better results are observed especially for summer cases 1–4 (percentages above 94%) in comparison with winter cases 5–8 (percentages above 89%). In the case of air velocity, the results for the defined comfort volume are excellent for both winter and summer climate conditions.
The main contribution of this work to the state of the art is the detailed CFD analysis of a representative railway vehicle for summer and winter conditions, considering a realistic occupancy level. As indicated in the introduction section, to the best of the knowledge of the authors there are no previous studies specifically related to air distribution in railway vehicles with passengers. The present work introduces this analysis and establishes a methodology and starting point for future studies. It is expected that HVAC systems designers and integrators will increasingly require CFD analysis of the final systems (railway vehicles and other means of public transport) in order to finely adjust the system configuration and provide more satisfactory comfort levels to final users. It is, therefore, necessary to establish an appropriate methodology for such CFD analysis. The design of the air distribution system in the railway coach will also require CFD analysis of the air ducts for ensuring better performance (lower pressure drop and better flow distribution).
Finally, solar radiation is not included in the model in the present work. Even though for winter weather conditions this assumption is conservative in terms of thermal comfort, further analysis must be carried out in future works that analyze the influence of solar radiation in the results, especially for summer weather conditions.


 ,
, 


